Article

CMT-Based Wire Arc Additive Manufacturing Using 316L Stainless Steel (2): Solidification Map of the Multilayer Deposit

Department of Mechanical Engineering, Hanyang University, Wangsimni-ro, 222, Seongdong-gu, Seoul 04763, Korea
*
Author to whom correspondence should be addressed.
Metals 2021, 11(11), 1725; https://doi.org/10.3390/met11111725
Submission received: 9 September 2021 / Revised: 15 October 2021 / Accepted: 27 October 2021 / Published: 28 October 2021

Abstract

:
This study aimed to suggest a solidification map based on the solidification parameters G and R of each layer in the multilayer deposition for the investigation of heat accumulation on the deposit. Through the solidification map, the appropriate solidification conditions of the microstructure were determined. In order to investigate the solidification parameters, the temperature profile of the deposit was experimentally acquired during deposition. A simulation model reflecting the characteristics of the deposition process was developed and verified. The solidification parameters from the simulation model and the microstructure from experiments were correlated. Based on the analysis, a solidification map of 316L SS processed with CMT-WAAM process was derived, which is suggested as a guide for controlling and predicting the morphology of the microstructure in the deposit.

1. Introduction

Wire arc additive manufacturing (WAAM) is a kind of additive manufacturing technology, which uses arc as a heat source and wire as a feedstock material. The WAAM is characterized by its high heat input, which makes it efficient when depositing large-scale products due to its high deposition rate. However, the high heat input is also a cause of distortion and high residual stress of WAAM, which deteriorates the geometrical shape and mechanical properties. Therefore, in the recent years, the cold metal transfer (CMT)-based WAAM (hereafter, CMT-WAAM) is getting attention for its lower heat input than other arc heat sources.
In the process of multilayer WAAM deposition, the heat repeatedly flows into the deposit, which causes heat accumulation in the deposit. Due to the heat accumulation, the deposit undergoes complicated thermal cycles during the deposition process. The thermal cycles affect the solidification process, thereby the corresponding microstructure is inconsistent along the deposit. The microstructure of the deposit is basically determined by the solidification parameters (temperature gradient (G), growth rate (R)). These two parameters are closely related to the morphology and size of the microstructure; specifically, G/R determines the morphology of the microstructure, and G × R determines the size of the microstructure [1,2,3].
As the G and R play a key role for manufacturing a deposit with preferable microstructure, many researchers have recently studied the solidification parameters in the WAAM process. Ou et al. [4,5] conducted gas metal arc-based WAAM experiments and simulations using H13 to research G/R trends according to changes in the deposition process parameters such as the arc power, travel speed, wire diameter, and wire feed rate. The authors demonstrated that G/R decreases with increasing arc power and travel speed, but changes in wire diameter and wire feed rate do not significantly affect G/R and that cellular or dendritic solidification morphology appears under all experimental conditions. Hejripour et al. [6] experimentally investigated and simulated gas metal arc-based WAAM using 2209 duplex stainless steel (SS) to examine the relationship between the cooling rate (G × R) and the microstructure of each layer of the deposit. The authors concluded that maintaining the cooling rate of each layer below 50 °C/s promoted the transformation from ferrite to austenite. Bermingham et al. [7] experimentally studied how changes in solidification parameters according to the deposition rate affected the microstructure in gas tungsten arc-based WAAM using a titanium alloy. The authors concluded that although G and R gradually increased as the travel speed increased from 50 to 100, 200, and 400 mm/min during the deposition of Ti-6Al-4V, the variation in G/R made little difference, as equiaxed and columnar dendrites formed in all four conditions. These researchers all investigated the relationship between G and R and the microstructure in metal additive manufacturing using WAAM process.
The difference in the microstructure between the layers of the deposit is closely related with the heat accumulation. Hence, the solidification parameters of each layer which are affected by the heat accumulation during the deposition process can be used to control and predict the mechanical properties of the deposit. However, the above mentioned studies have not yet reported on the difference in G and R for each layer as a form of solidification map. This solidification map shows the entire process of the deposit at a glance, thereby it leads to easy control of the WAAM process.
Therefore, this study aimed to suggest the solidification map based on the G and R of each layer during the multilayer deposition. Through the solidification map, the appropriate solidification conditions of the microstructure can be determined. Furthermore, the solidification condition of each layer for CMT-WAAM has been firstly reported. In order to investigate the solidification parameters, the temperature profile of the deposit was experimentally acquired using the CMT-WAAM process. The 316L SS, which is commonly used in AM, was chosen as feedstock material, owing to its good weldability and its extensive applicability [8,9,10]. To calculate the solidification parameter, a simulation model reflecting the characteristics of the deposition process was developed and verified by comparing the experimental and simulated temperature profiles. The solidification parameters from the simulation model and the microstructure from experiments were correlated. Based on the analysis, a solidification map of 316L SS processed with CMT-WAAM process was derived, which is suggested as a guide for predicting the morphology of the microstructure in the deposit.

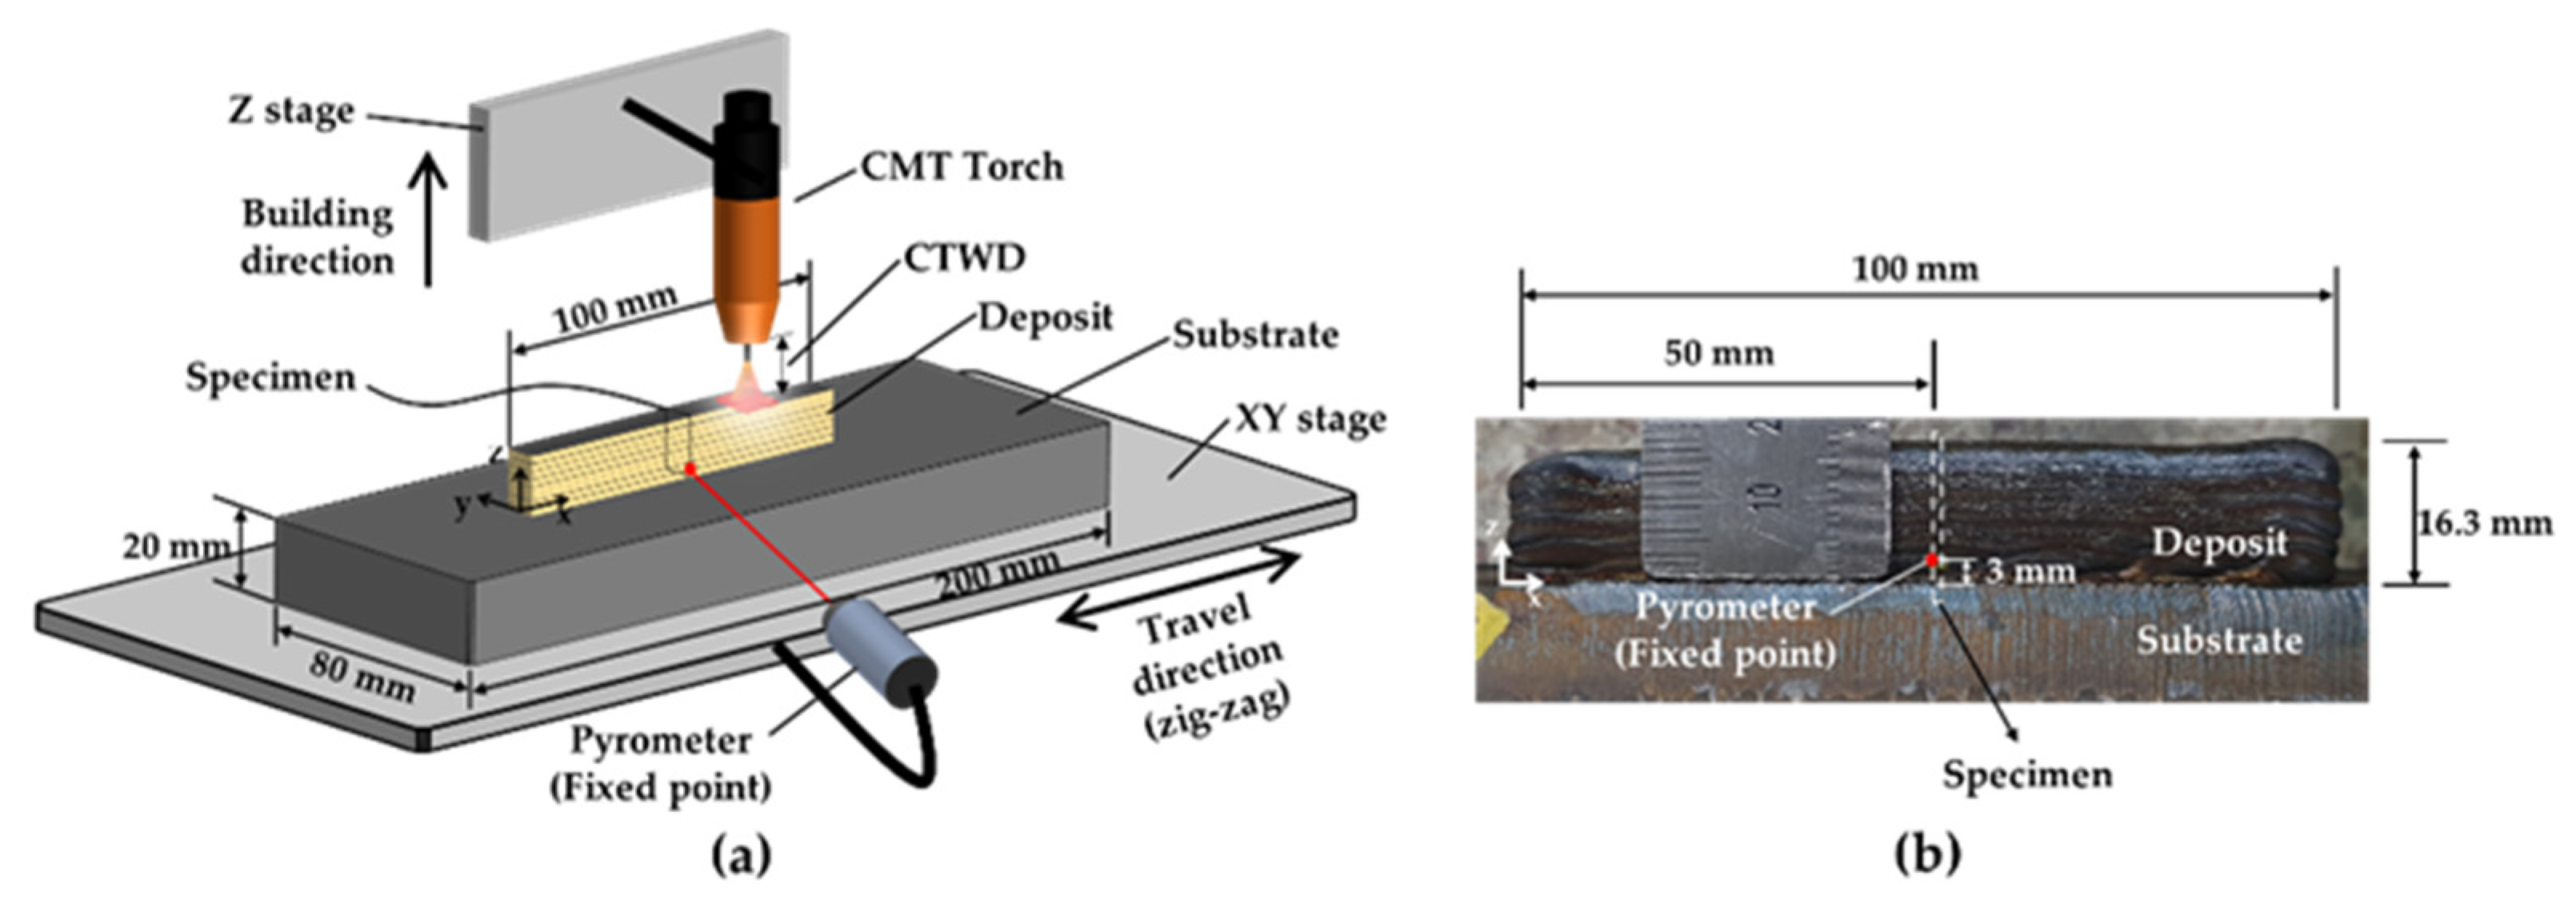
2. Experimental Setup

A schematic diagram of a CMT-WAAM process and the shape of the deposit are shown in Figure 1a,b, respectively. For deposition, a 316L SS substrate (POSCO, Pohang, Korea) with dimensions of 200 mm × 80 mm × 20 mm and M-316L (KISWEL, Seoul, Korea) wire with a diameter of 1.2 mm were used. The chemical composition of the substrate and the wire are shown in Table 1. FRONIUS TPS 4000 welder (FRONIUS, Wels, Austria) with a CMT mode was used as a heat source. In CMT mode, the TPS 4000 can apply a current range of 60–250 A, and the average current and voltage applied during the deposition are 120 A and 11.2 V, respectively. The optimized process conditions based on preliminary experiments are shown in Table 2.
The X-Y-Z three-axis automatic motion stage (Six Degrees Inc., Uiwang-si, Korea) was introduced to control the deposition path and for process automation. In this equipment, the X-Y stage and the Z stage are separated. As shown in Figure 1a, the substrate fixed on the X-Y stage moves in a zigzag pattern along the X axis, and the torch fixed on the Z stage moves in the +Z direction along the Z axis. Each layer is deposited 100 mm long in the travel direction. To maintain the contact tip to work distance (CTWD) of each layer, the position of the torch is raised by 1.6 mm before the deposition of the next layer. A total of 10 layers were deposited.
The pyrometer (OPTRIS, Portsmouth, NH, USA), which can measure the temperature in the range of 250–1800 °C, was used to measure the temperature profile during the deposition. The temperature profile was measured at a fixed point on the side of the deposit (XZ plane) at 50 mm in the +X direction and 3 mm in the +Z direction, as shown in Figure 1b. The pyrometer was fixed on the XY stage and moved with the deposit, so the measuring point of the pyrometer was not changed during the deposition.
The pyrometer requires the emissivity of an object to measure the temperature. The emissivity was specified through a preliminary experiment comparing the temperature profile measured using a K-type thermocouple and the pyrometer. The K-type thermocouple was attached to a 316L SS deposit, and the pyrometer was set to focus on the same point where the thermocouple was attached. Then, the temperature profile was measured while the deposit was heated using a gas torch and cooled with air. The temperature profile measured by the pyrometer and thermocouple were acquired using the NI-DAQ 9229 DAQ board (NI, Austin, TX, USA). Based on the temperature profile, the emissivity value suitable for 316L SS was derived. Finally, the emissivity of solid 316L SS was set to 0.96.
After the WAAM process, to observe the microstructure of each layer of deposit, the cross-sectional specimen was extracted from the center of the X-axis direction as shown in Figure 1b. The microstructure images of each layer were obtained using a BX51M (Olympus, Tokyo, Japan) optical microscope.

3. Numerical Modeling

A simulation model was developed to investigate the effect of the solidification parameters on the microstructures in the CMT-WAAM process using COMSOL Multiphysics 5.4 (COMSOL Inc., Burlington, MA, USA).
The solidification parameters are mainly influenced by the temperature variation caused by heat transfer, so a three-dimensional transient heat transfer analysis was performed to investigate the solidification parameters of the deposit. The three-dimensional heat transfer equation is expressed as Equation (1).
( ρ C p T ) t = x ( k T x ) + y ( k T y ) + z ( k T z ) + q
where ρ is the mass density, C P is the heat capacity, T is the unknown temperature, t is the time, k is the conductivity, and q is the heat input. ρ , C P , and k are temperature-dependent variables, and among them, ρ and k were taken from the existing literature [11,12]. Furthermore, the energy required for the phase change was considered by adding latent heat to C P in the phase change section. As shown in Equation (2), a conduction boundary condition was applied between the deposit and the substrate in the developed model, and radiation and convection were applied to the surface of the deposit and the substrate [6].
  k n T n = q h ( T T 0 ) σ ε ( T 4 T 0 4 )
where k n is the thermal conductivity normal to the surface of the substrate, q is the input heat flux, h is the convection heat transfer coefficient, σ is the Stefan-Boltzmann constant, and ε is the surface emissivity. The thermophysical properties of 316L SS used in the simulation, such as the density, specific heat, and thermal conductivity, were taken from the literature [13]. Finally, T 0 is the ambient temperature, which was set to room temperature (25 °C).
In the WAAM simulation, to reduce the computational load of the model, a half-model, which is symmetrical to the XZ plane, was considered. Because the mesh density directly affects the calculation accuracy and calculation time [14,15], a non-uniform mesh was applied to the entire domain to reduce the calculation time while preventing a reduction in accuracy. As a result of applying a hexahedral mesh of 0.2 mm in size to the deposit, eight nodes in the Z direction were included in one layer of the deposit. Empirical studies (converged mesh was used for the simulations) indicated that seven to eight nodes per layer could provide sufficient numerical accuracy. The mesh of the substrate was set to be coarser further from the deposit, and the final simulation model comprised approximately 126,000 elements. The material properties and finite element model used in the simulation were introduced in the previous study [16].
In addition, the domain activation method [6] was applied to simulate the shape of the deposit, which changes in real time. In this method, each layer was divided into four equally sized domains along the travel direction. The new domain was activated just before the heat source arrived at the specific domain. The initial temperature of the activated domain was equally set as the uppermost temperature of the underneath domain. Double ellipsoid model developed by Goldak et al. [17,18,19] was used as the heat source. For a zigzag pattern, the heat source was moved in the +X direction in odd layers and moved in the −X direction in even layers.

4. Results and Discussion

4.1. Comparison of Experimental and Simulated Temperature Profiles

Figure 2 shows the temperature distribution of the deposits during the WAAM process of multiple layers using simulation. The temperature distribution when the heat source passes through the center of the deposit in the 3rd, 6th, 9th, and 10th layer are shown in Figure 2a–d, respectively. The empty space in the edge of the Figure 2a–d is the inactivated domain, which was explained in Section 3. In the simulation model, each layer was also deposited in the same zigzag pattern as the actual deposition process. Since there is no inter-pass time, the total amount of time for deposition a single layer was 18.5 s including the time for the heat source (torch) to move the depositing layer and the time to move to the initial location of the next layer. As shown in Figure 2a–d, the region of the molten pool, which shows a higher temperature than the melting point (1400 °C) is indicated. Comparing the size of the molten pool of the 3rd, 6th, 9th, and 10th layer, the size of the molten pool is relatively small in the 3rd layer since it is adjacent to the substrate. As the layer increases, the distance between the substrate and the uppermost part of the layer increases. As the distance increases, the heat accumulation of the deposit increases due to the decreasing amount of the heat output from deposit to the substrate. Therefore, as shown in Figure 2b–d, the size of the molten pool increases as the layer increases.
Figure 3a schematically shows the temperature acquisition location in CMT-WAAM, and Figure 3b shows the temperature profile measured in the experiment and that of the simulation which was acquired at a fixed point in the second layer. As aforementioned, because the temperature was continuously measured only at the fixed point of the second layer, the temperature data were not acquired during the deposition of the first layer.
Figure 3b presents two temperature profiles, one calculated in the simulation model (dotted line) and one measured experimentally (solid line). In Figure 3b, the numbers refer to the layer being deposited as the temperature measured at the fixed point on the second layer, e.g., “3” and “4” refer to the temperature at the fixed point in the second layer as the third and fourth layers were deposited, respectively. The temperature was continuously measured at this fixed point in order to investigate the effect of the solidification parameters on the final solidification microstructure in multilayer deposition. During multilayer deposition, melting and solidification occur twice or more for each layer owing to the repeated heat input, and microstructures are formed in the final solidification process. Therefore, the final solidification time point of the microstructure was investigated from the acquired temperature profile, and the solidification parameters were derived at that point to analyze the relationship between the microstructure and the solidification parameters. These results will be described in Section 4.2.
In Figure 3b, the peak temperatures during the deposition of the second and third layers calculated in the simulation were larger than the experimental values, which was due to the emissivity set in the pyrometer. In the CMT-WAAM process, ~50% of the previous layer is re-melted during the deposition of the current layer. Thus, approximately 50% of the second layer is re-melted in the process of deposition the third layer. Therefore, melting and solidification both occur twice in the second layer. During this process, two mixed phases (solid and liquid) appear in the second layer. As shown in Figure 3a, the fixed point is located at half the height of the second layer, so the pyrometer also measures the temperature of the mixed phase for a very short moment. However, because the pyrometer used can only set the emissivity of the solid phase, the temperature of the liquid phase was not accurately measured. For this reason, an error occurred in the second and third layers of Figure 3b, and the average error rate between the two peaks was 12.5%.
This difficulty in calculating the solidification parameters by measuring the deposited temperature in real time during multilayer deposition has arisen not only in this experiment but also in other researchers’ studies for time and economic reasons. Therefore, an effective, reliable numerical model is useful for estimating the temporal and spatial changes of the solidification parameters. As shown in Figure 3b, the two temperature profiles are nearly identical except for the peak temperatures of the second and third layers, which have relatively large temperature errors because of the phase change. Indeed, excluding the second and third layers, the average error of the peak temperatures for each subsequent layer is 4.4%. The similarity between the simulation results and the thermal condition of the actual deposit indicates that the developed CMT-WAAM simulation model is suitable for calculating the solidification parameters.

4.2. Additive Manufacturing Guideline Using Solidification Map

Figure 4 shows the solidification map, which can explain the effect of G and R on the microstructure formation. The temperature gradient (G), which is the y-axis of the map, is the rate of temperature change (°C/mm) according to the distance at the solid-liquid interface, and the growth rate (R), which is the x-axis, is the speed at which the solid-liquid interface moves (mm/s). The solidification map is composed of a combination of G/R and G × R curves, where the G/R value affects the morphology of the microstructure, whereas G × R value affects the size of the microstructure [20,21]. As shown in Figure 4, a planar microstructure appears at high G/R values, and as this value decreases, the morphology transforms from cellular to cellular dendritic, columnar dendritic, and finally equiaxed dendritic. In addition, as G × R decreases, a coarse microstructure forms, whereas a fine microstructure forms as G × R increases. Mechanical properties such as the tensile strength and hardness of a deposit can be improved by forming a fine microstructure [22,23,24].
Figure 5 shows the G, R, and G × R for each layer of the deposits. G and G × R were calculated using a simulation model and R was derived inversely from G and G × R. G and G × R were calculated from the Y-Z cross-section of the X = +50 mm point of the deposit in Figure 1. Specifically, G and G × R were calculated at the location of the final melting point, in which the boundary solid and liquid phase of each layer and the time at which the final melting point were reached.
Figure 5a,b shows the behavior of G and R in CMT-WAAM, respectively. G means the magnitude of GX, GY, and GZ in the X, Y, and Z directions, respectively. In the deposit, heat transfer occurs mainly in the Z direction, which is also closely related to the heat accumulation phenomenon. As shown in Figure 5a, G tends to decrease with the increasing number of layers in the process. In particular, the decrease in layer 1 is significantly larger than the decrease in the layers 2–10. This is because the heat supplied by the arc heat source was rapidly transferred toward the substrate, so an insignificant amount of heat accumulates in layer 1. On the other hand, in layers 2–10, the same amount of heat input (about 1070 J/s) is repeatedly applied for each layer. However, the heat dissipation rate decreases in the −Z direction, intensifying the heat accumulation as the layer increases. As shown in Figure 5b, the decreasing rate of R tends to decrease with the increasing number of layers in the process. Figure 5c shows the trend in G × R in CMT-WAAM. In all layers of the deposit, as the number of layers increased, G × R decreased, and the difference between each interlayer G × R also decreased. This phenomenon is due to the heat accumulation according to the characteristics of the arc heat source and the amount of heat input.
The heat accumulation in the layers during the deposition, as explained in detail through Figure 5, is important to understand because it affects not only the morphology and size of microstructure with different solidification parameters for each layer, but also the anisotropy of the deposit owing to the epitaxial growth of the microstructure. The related explanation will be provided next two paragraph.
Figure 6 shows the microstructure of the deposit and the solidification map, which was derived from the simulation. Figure 6a shows macro cross-sectional image of the 316L SS deposit. Figure 6b–e are cross-sectional images of the microstructure in the deposit, which were observed at the middle point of the 1st, 5th, and 9th layer and the top point of the 10th layer. In the 1st, 5th, and 9th layer, the 316L SS was solidified in the ferrite–austenite (FA) mode, so the microstructure was observed to be a mixture of austenite, skeletal ferrite, and lathy ferrite [16] and only columnar dendrites were observed. In contrary, the equiaxed dendrite was observed in the top of the 10th layer. The secondary dendrite arm spacing (SDAS) was measured in the 1st, 5th, and 9th layer, and the measured values were 4.477 ± 0.146 μm, 8.296 ± 0.301 μm, 9.496 ± 0.389 μm, respectively. This result indicates that the G × R decreases as the layers increase, which is also confirmed in Figure 5c.
The reason for the shape of this graph in Figure 6f results from the different increments between G and R in increasing the layers of the deposit, as shown in Figure 5. In other words, the decreasing rate of R is less than that of G. According to the previous study, the boundary of the G/R in which the columnar dendrite develops is 10–102 °C∙s/mm2 [25,26], and the boundary of the equiaxed is at less than ~10 °C∙s/mm2 [27]. In this study, the G/R values in each layer ranged from 18 to 33 °C∙s/mm2, thereby distributed in the columnar dendritic region, as shown in Figure 6f. In contrary, the G/R value in the top of the 10th layer was about 2 °C∙s/mm2, thereby distributed in the equiaxed dendritic region. As reported in [28], at the surface of the molten pool, the G is lower and the R is higher compared to the inside of the molten pool. Hence, the equiaxed dendrite is formed at the top of each layer. However, during the deposition process, the equiaxed dendrite at the top of each layer is remelted as the next layer is deposited. Therefore, the columnar dendrite in the previous layer grows epitaxially to the next layer, resulting in the anisotropy of the deposit. This phenomenon is confirmed in the morphology of the microstructure from this study as shown in Figure 6a–e.

5. Conclusions

In this study, a solidification parameter guideline of each layer in the deposit was firstly investigated by constructing a 316L SS solidification map to investigate the effect of heat accumulation on the multilayer deposit using CMT-WAAM. The notable contributions of this study are as follows.
(1)
To investigate the effect of G and R on the microstructure in CMT-WAAM multilayer deposition, a mathematical model was developed to simulate the processes. Upon comparing the simulation results of the model with the experimentally measured temperatures, CMT-WAAM showed an error of 4.4%. Excluding some peaks, the simulated and experimental result were nearly identical. The developed model thus effectively simulated the thermal conditions of the multilayer processes in CMT-WAAM was suitable for calculating the solidification parameters and analyzing the heat input;
(2)
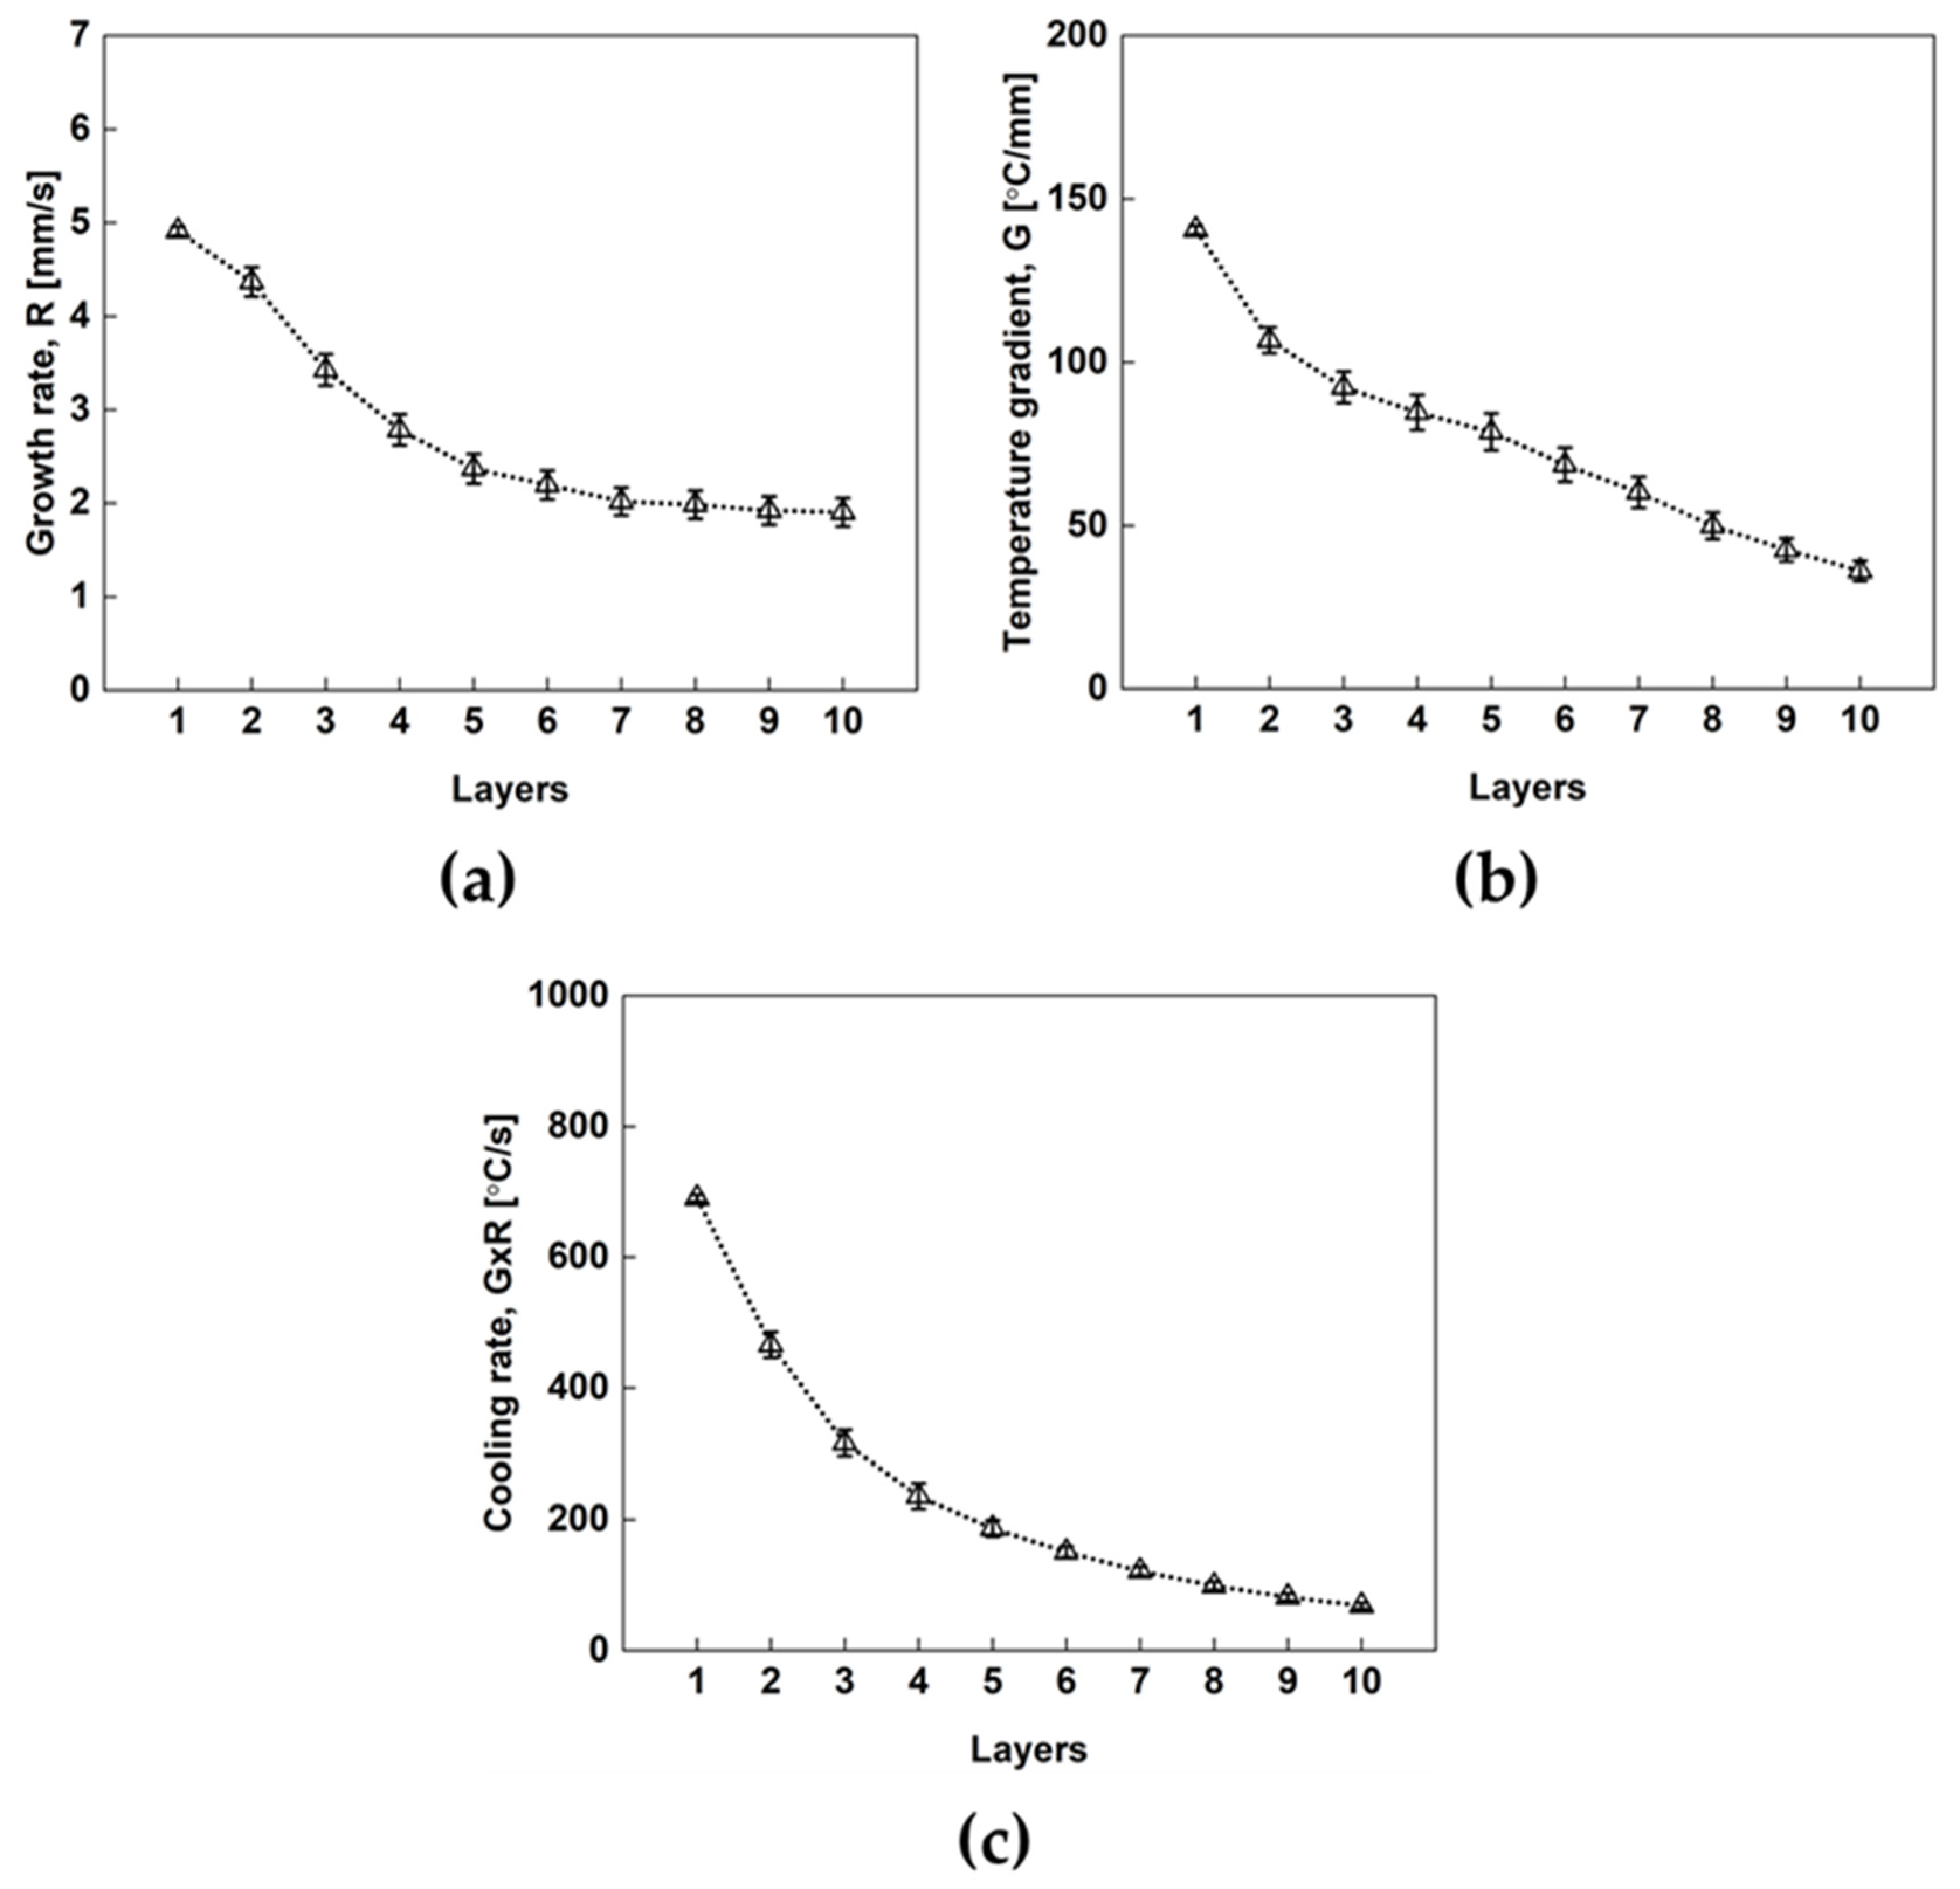
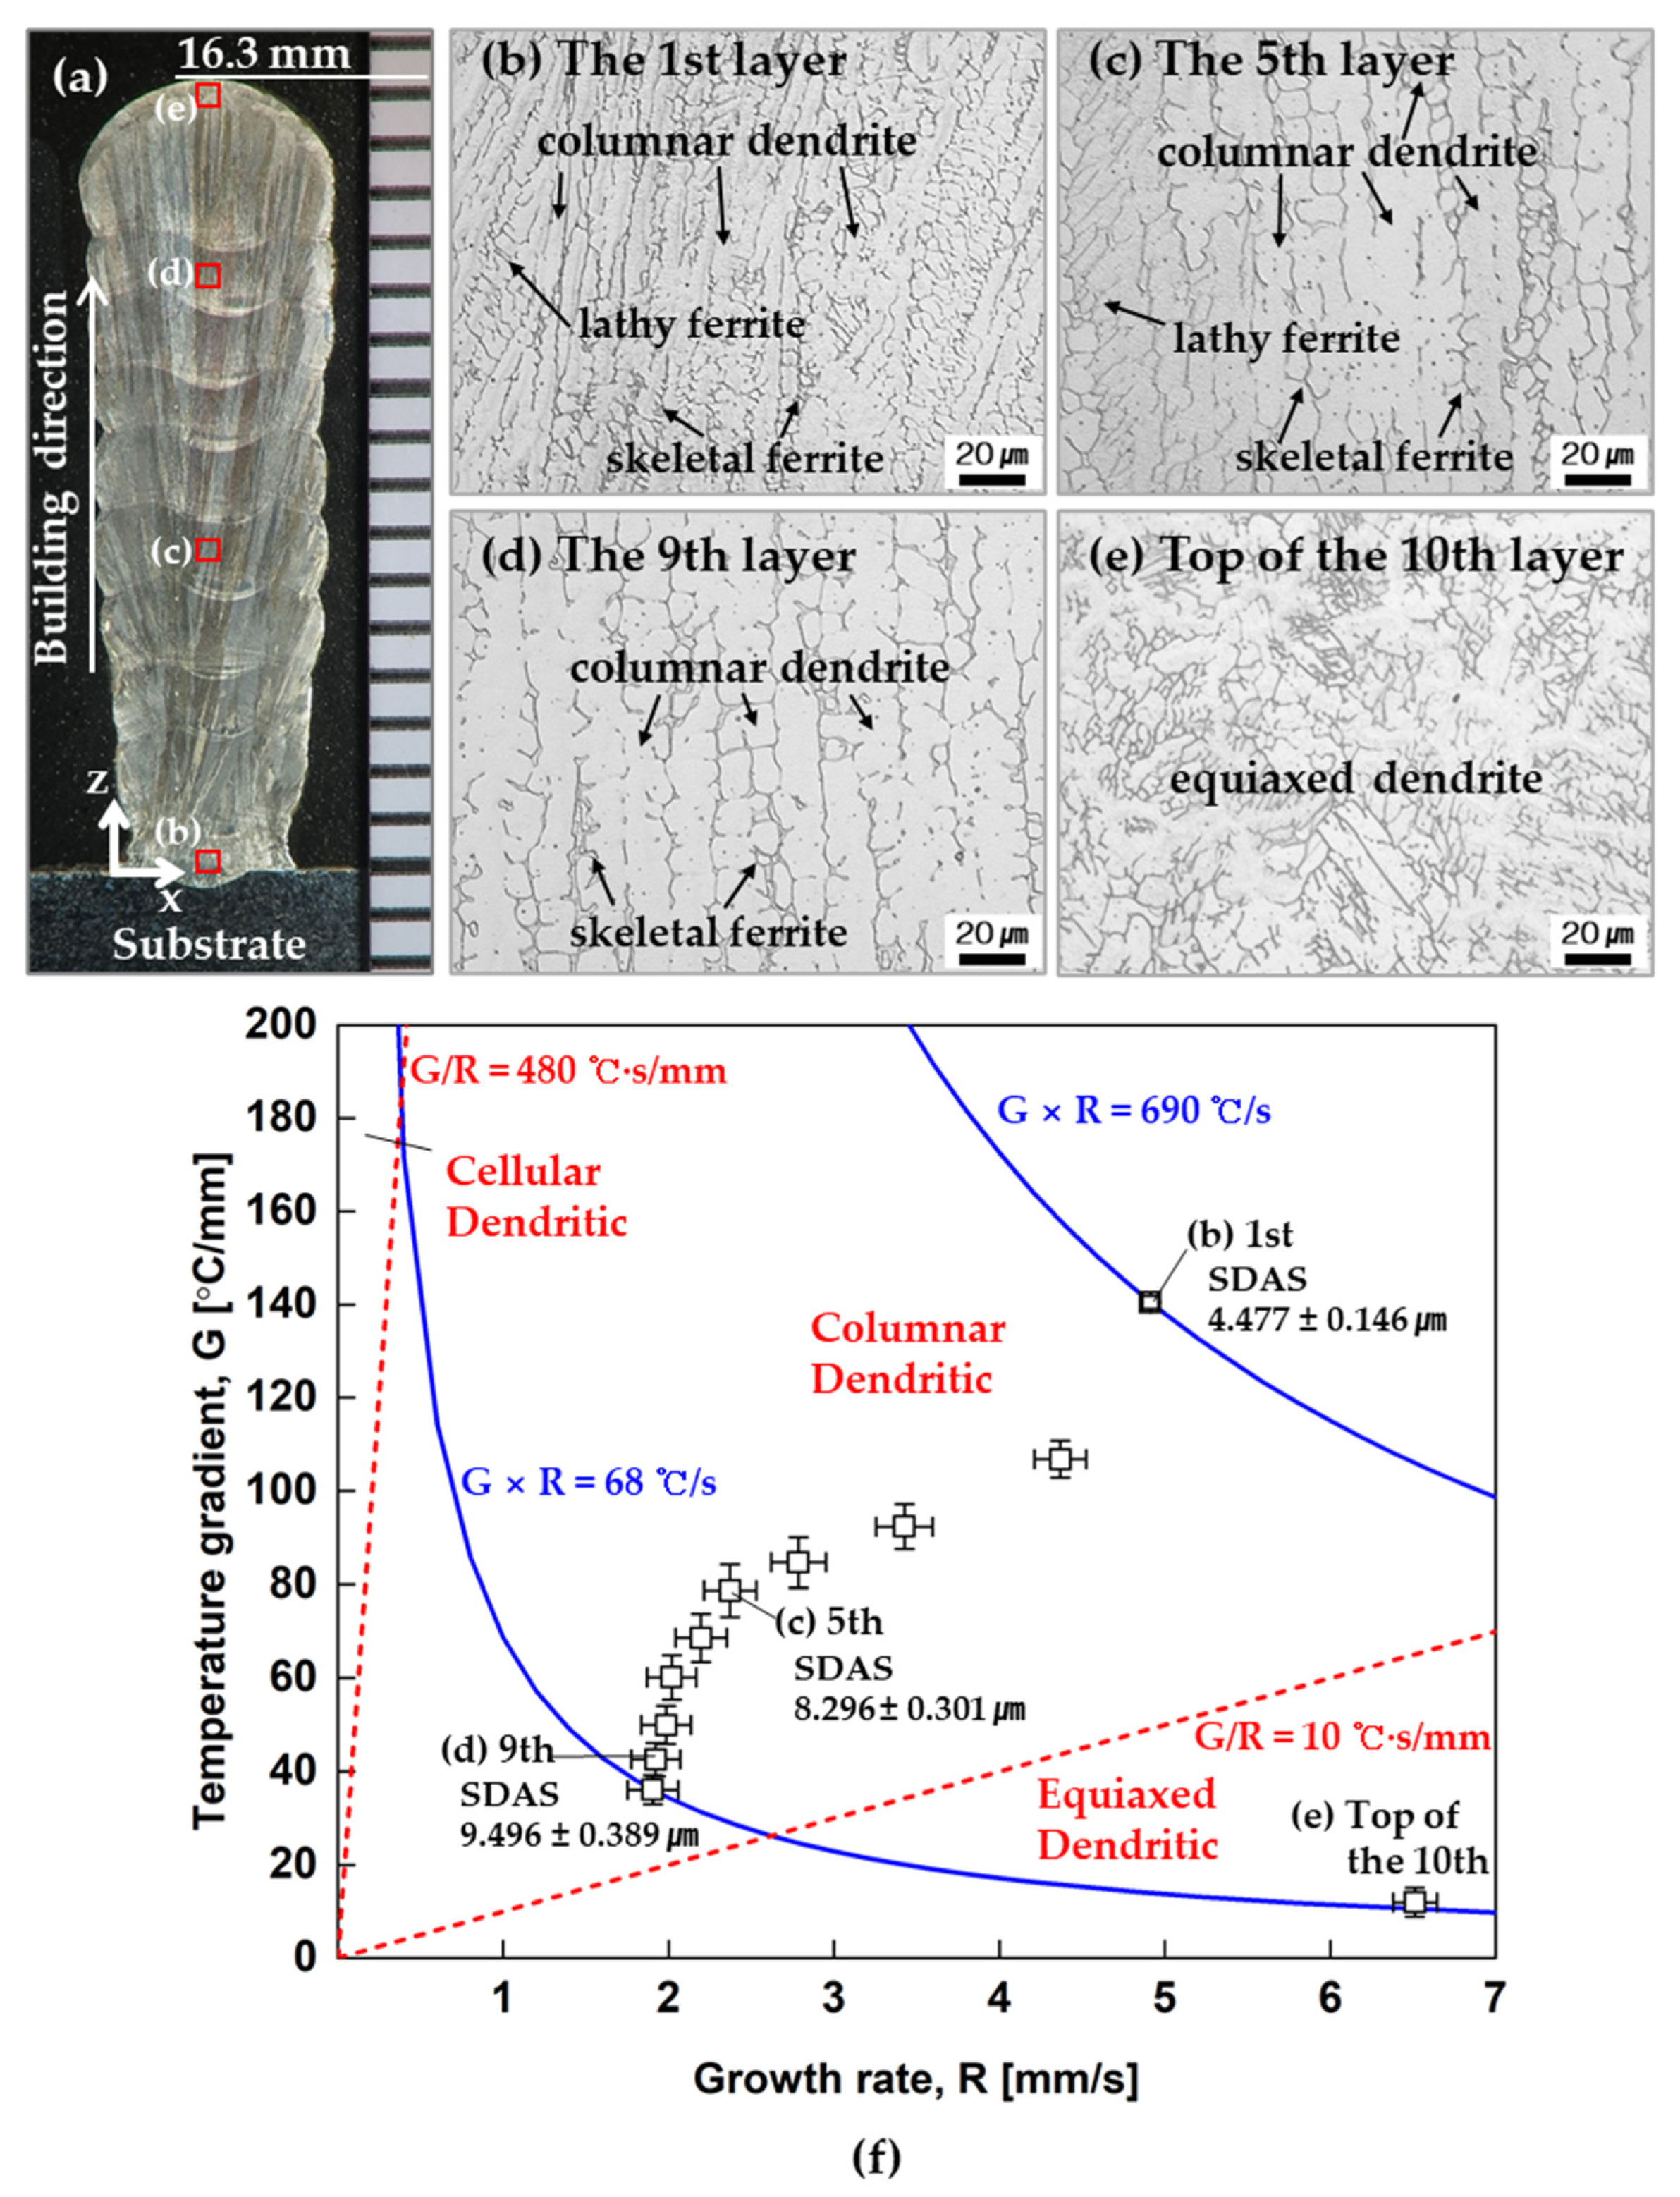
In the CMT-WAAM multilayer processes, a 316L SS solidification map, which consists of G and R of each layer of deposit was suggested to control and predict the microstructure. In the solidification map, which reflects the heat accumulation of deposit, G × R and G/R were ranged from 68 to 690 °C/s and 2 to 33 °Cs/mm2, respectively;
(3)
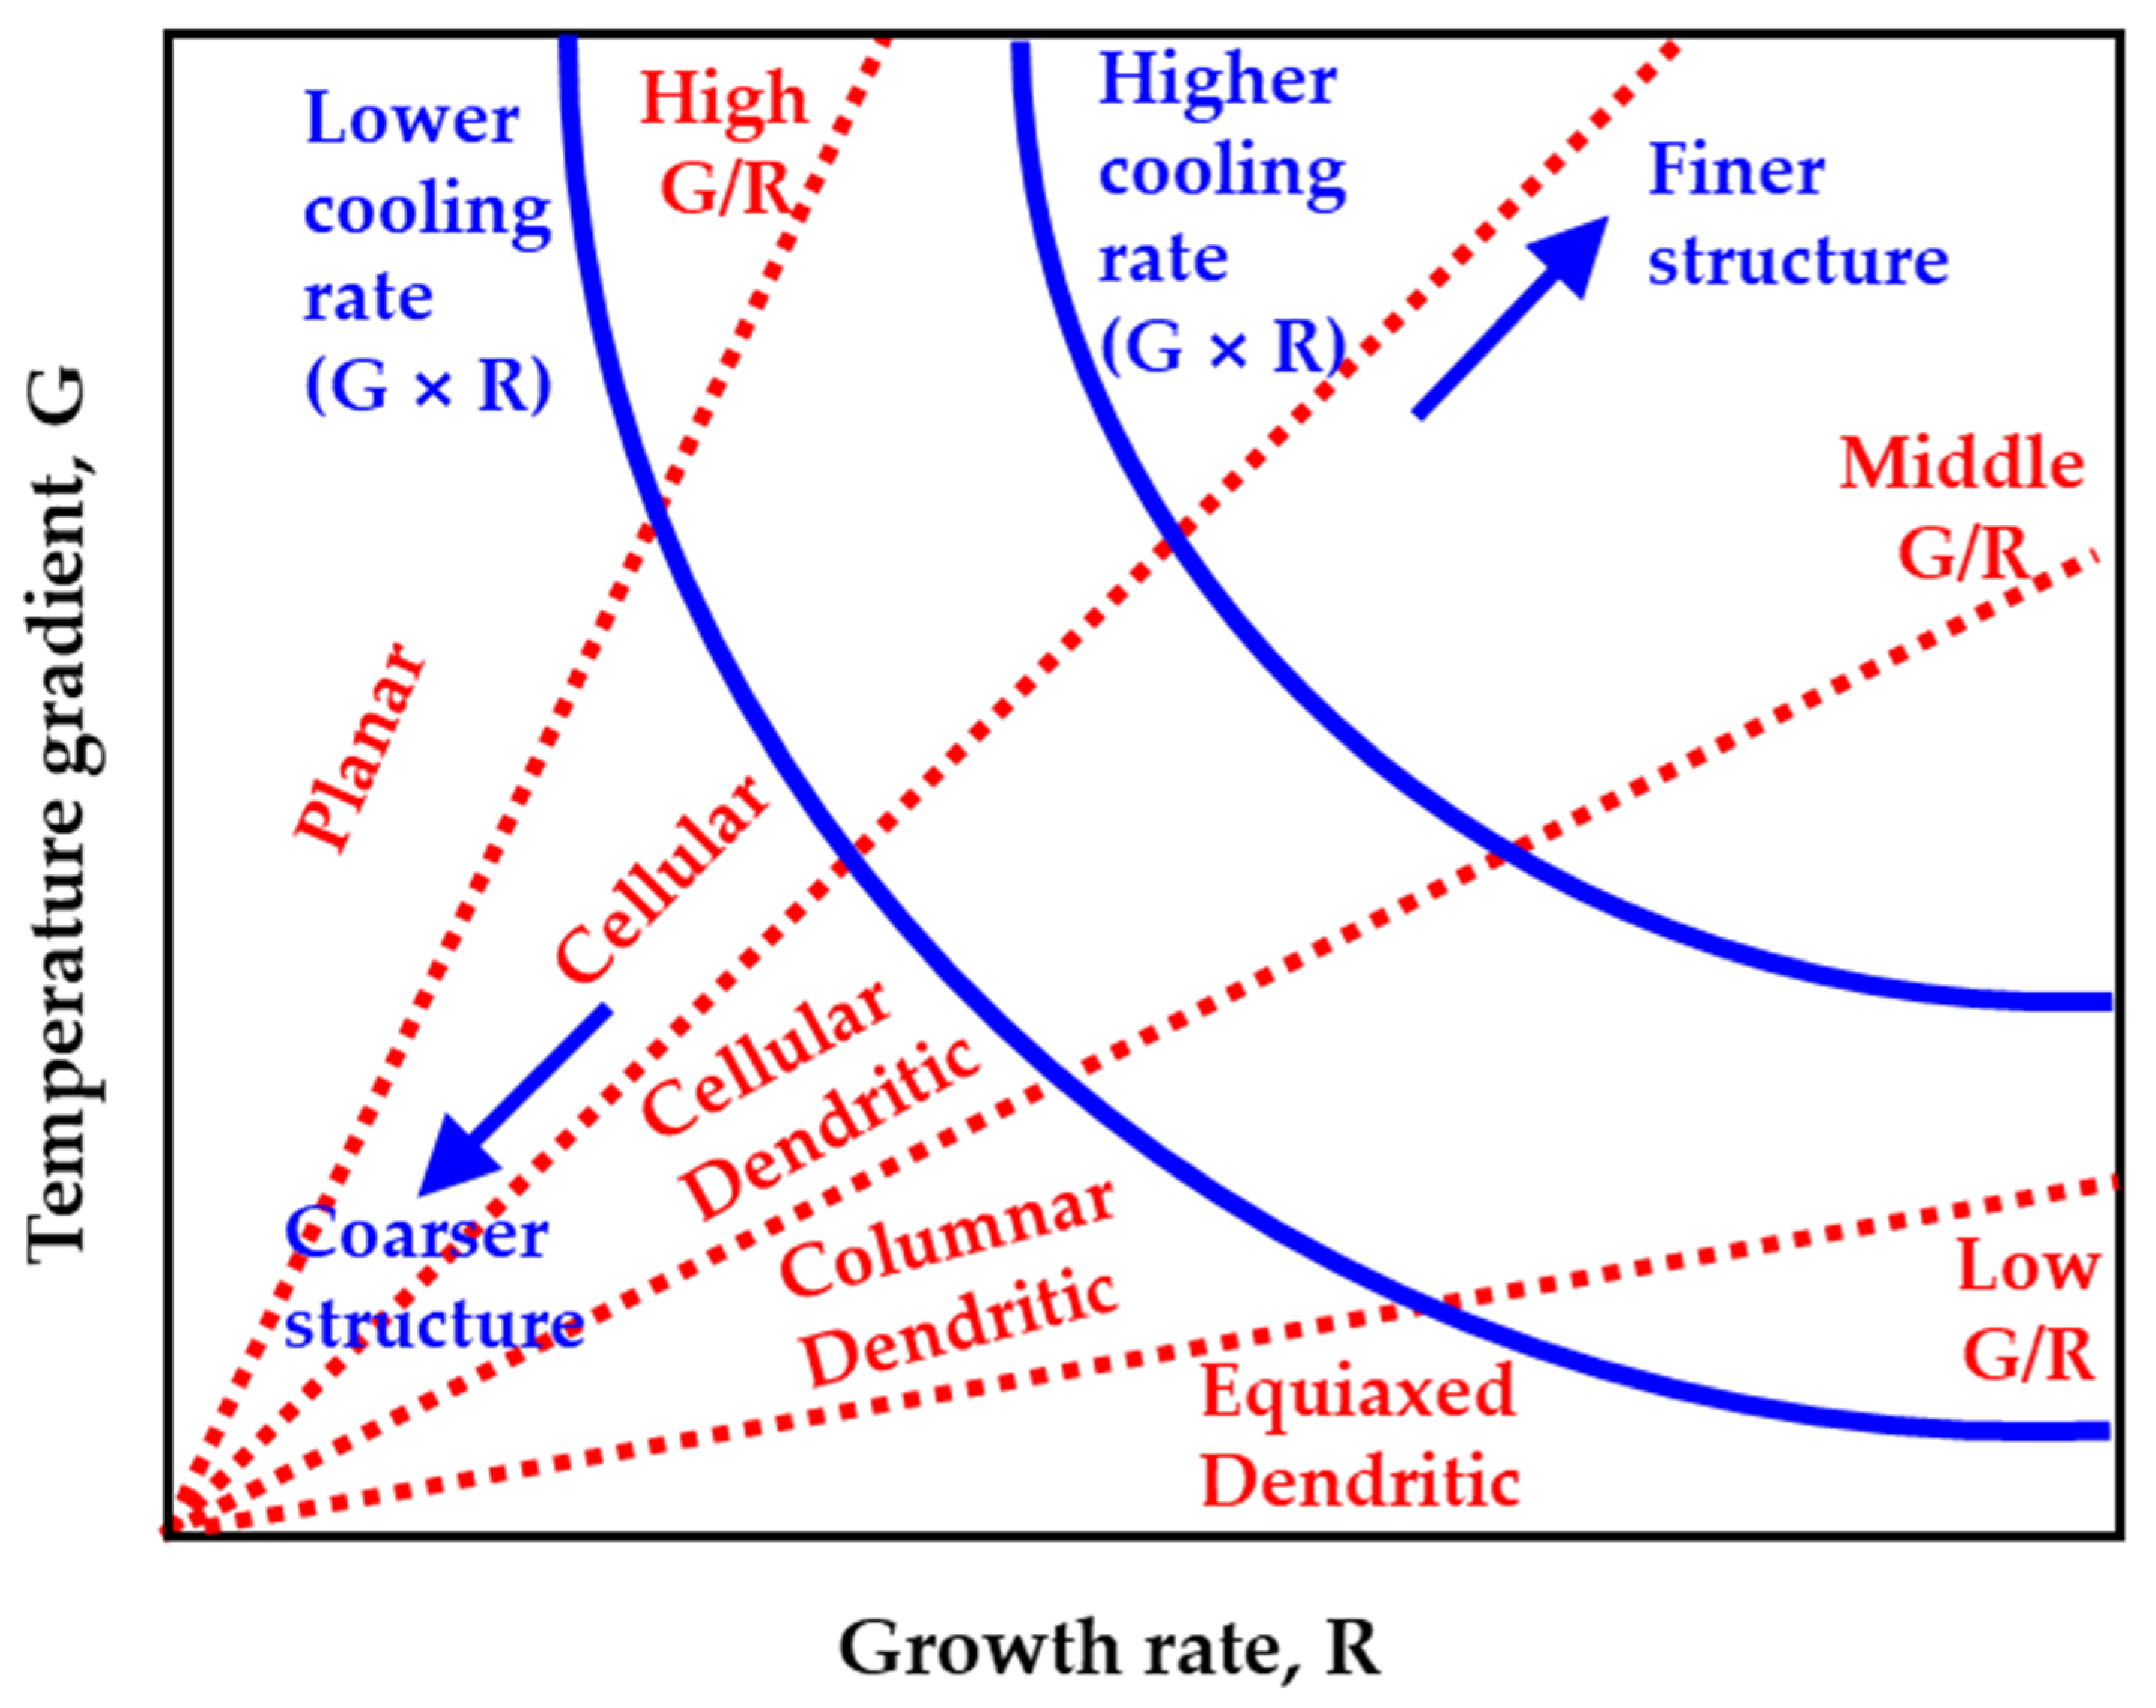
Through the solidification map, the effect of G and R on the microstructure of each layer was investigated. Although G/R showed variation in the solidification map, the morphology of the microstructure was not changed along with the height except for the top of the 10th layer. On the other hand, G × R decreases as the layer increases in the solidification map, but SDAS, which is affected by G × R, tends to increase;
(4)
By calculating G and R from the simulation model, a possible new method for predicting the microstructure shape without performing actual deposition was developed. This could provide the basis for controlling or predicting the microstructure and mechanical properties by selecting the CMT-WAAM process parameters in future research.

Author Contributions

Conceptualization, J.P.; software, J.P.; validation, J.P.; formal analysis, J.P.; investigation, J.P.; writing—original draft preparation, J.P.; writing—review and editing, S.H.L.; visualization, J.P.; supervision, S.H.L.; project administration, S.H.L. All authors have read and agreed to the published version of the manuscript.

Funding

This research was supported by the National Research Foundation of Korea (NRF) grant funded by the Korean government (MSIT) (No. 2020R1C1C1009519), the Korea Institute of Energy Technology Evaluation and Planning (KETEP) grant funded by the Korean government (MOTIE) (No. 20181510102360), and the Korea Evaluation Institute of Industrial Technology (KEIT) grant funded by the Korean government (MOTIE) (No. 20014796).

Data Availability Statement

Not applicable.

Conflicts of Interest

The authors declare no conflict of interest.

References

  1. Debroy, T.; Zhang, W.; Turner, J.; Babu, S.S. Building digital twins of 3D printing machines. Scr. Mater. 2017, 135, 119–124. [Google Scholar] [CrossRef]
  2. Wei, H.; Elmer, J.; DebRoy, T. Origin of grain orientation during solidification of an aluminum alloy. Acta Mater. 2016, 115, 123–131. [Google Scholar] [CrossRef] [Green Version]
  3. Lippold, J.C. Welding Metallurgy and Weldability; Wiley: Hoboken, NJ, USA, 2015. [Google Scholar]
  4. Ou, W.; Mukherjee, T.; Knapp, G.; Wei, Y.; DebRoy, T. Fusion zone geometries, cooling rates and solidification parameters during wire arc additive manufacturing. Int. J. Heat Mass Transf. 2018, 127, 1084–1094. [Google Scholar] [CrossRef]
  5. Ou, W.; Knapp, G.; Mukherjee, T.; Wei, Y.; DebRoy, T. An improved heat transfer and fluid flow model of wire-arc additive manufacturing. Int. J. Heat Mass Transf. 2020, 167, 120835. [Google Scholar] [CrossRef]
  6. Hejripour, F.; Binesh, F.; Hebel, M.; Aidun, D.K. Thermal modeling and characterization of wire arc additive manufactured duplex stainless steel. J. Mater. Process. Technol. 2019, 272, 58–71. [Google Scholar] [CrossRef]
  7. Bermingham, M.; StJohn, D.; Krynen, J.; Tedman-Jones, S.; Dargusch, M. Promoting the columnar to equiaxed transition and grain refinement of titanium alloys during additive manufacturing. Acta Mater. 2019, 168, 261–274. [Google Scholar] [CrossRef]
  8. Rahman Rashid, R.A.; Javed, M.A.; Barr, C.; Palanisamy, S.; Matthews, N.; Dargusch, M.S. Effect of in situ tempering on the mechanical, microstructural and corrosion properties of 316L stainless steel laser-cladded coating on mild steel. Int. J. Adv. Manuf. Technol. 2021, 117, 1–10. [Google Scholar]
  9. Chen, L.; Richter, B.; Zhang, X.; Ren, X.; Pfefferkorn, F.E. Modification of surface characteristics and electrochemical corrosion behavior of laser powder bed fused stainless-steel 316L after laser polishing. Addit. Manuf. 2020, 32, 101013. [Google Scholar] [CrossRef]
  10. Oh, W.J.; Lee, W.J.; Kim, M.S.; Jeon, J.B.; Shim, D.S. Repairing additive-manufactured 316L stainless steel using direct energy deposition. Opt. Laser Technol. 2019, 117, 6–17. [Google Scholar] [CrossRef]
  11. Setien, I.; Chiumenti, M.; van der Veen, S.; San Sebastian, M.; Garciandía, F.; Echeverría, A. Empirical methodology to determine inherent strains in additive manufacturing. Comput. Math. Appl. 2019, 78, 2282–2295. [Google Scholar] [CrossRef] [Green Version]
  12. Jayanath, S.; Achuthan, A. A computationally efficient hybrid model for simulating the additive manufacturing process of metals. Int. J. Mech. Sci. 2019, 160, 255–269. [Google Scholar] [CrossRef]
  13. Knapp, G.; Mukherjee, T.; Zuback, J.; Wei, H.; Palmer, T.; De, A.; DebRoy, T. Building blocks for a digital twin of additive manufacturing. Acta Mater. 2017, 135, 390–399. [Google Scholar] [CrossRef]
  14. Du, L.; Gu, D.; Dai, D.; Shi, Q.; Ma, C.; Xia, M. Relation of thermal behavior and microstructure evolution during multi-track laser melting deposition of Ni-based material. Opt. Laser Technol. 2018, 108, 207–217. [Google Scholar] [CrossRef]
  15. Wu, B.; Ding, D.; Pan, Z.; Cuiuri, D.; Li, H.; Han, J.; Fei, Z. Effects of heat accumulation on the arc characteristics and metal transfer behavior in Wire Arc Additive Manufacturing of Ti6Al4V. J. Mater. Process. Technol. 2017, 250, 304–312. [Google Scholar] [CrossRef]
  16. Lee, S.H. CMT-Based Wire Arc Additive Manufacturing Using 316L Stainless Steel: Effect of Heat Accumulation on the Multi-Layer Deposits. Metals 2020, 10, 278. [Google Scholar] [CrossRef] [Green Version]
  17. Goldak, J.; Chakravarti, A.; Bibby, M. A new finite element model for welding heat sources. Metall. Trans. B 1984, 15, 299–305. [Google Scholar] [CrossRef]
  18. Wu, Q.; Mukherjee, T.; Liu, C.; Lu, J.; DebRoy, T. Residual stresses and distortion in the patterned printing of titanium and nickel alloys. Addit. Manuf. 2019, 29, 100808. [Google Scholar] [CrossRef]
  19. Oyama, K.; Diplas, S.; M’hamdi, M.; Gunnæs, A.E.; Azar, A.S. Heat source management in wire-arc additive manufacturing process for Al-Mg and Al-Si alloys. Addit. Manuf. 2019, 26, 180–192. [Google Scholar] [CrossRef]
  20. Kou, S. Welding Metallurgy; Wiley: Hoboken, NJ, USA, 2003. [Google Scholar]
  21. Trivedi, R.; Kurz, W. Theory of Microstructural Development during Rapid Solidification in Science and Technology of the Undercooled Melt; Springer: Berlin/Heidelberg, Germany, 1986. [Google Scholar]
  22. Caballero, A.; Ding, J.; Ganguly, S.; Williams, S. Wire+ Arc Additive Manufacture of 17-4 PH stainless steel: Effect of different processing conditions on microstructure, hardness, and tensile strength. J. Mater. Process. Technol. 2019, 268, 54–62. [Google Scholar] [CrossRef]
  23. Buchanan, C.; Gardner, L. Metal 3D printing in construction: A review of methods, research, applications, opportunities and challenges. Eng. Struct. 2019, 180, 332–348. [Google Scholar] [CrossRef]
  24. Ngo, T.D.; Kashani, A.; Imbalzano, G.; Nguyen, K.T.; Hui, D. Additive manufacturing (3D printing): A review of materials, methods, applications and challenges. Compos. Part B Eng. 2018, 143, 172–196. [Google Scholar] [CrossRef]
  25. Park, J.; Kim, J.-Y.; Ji, I.; Lee, S.H. Numerical and Experimental Investigations of Laser Metal Deposition (LMD) Using STS 316L. Appl. Sci. 2020, 10, 4874. [Google Scholar] [CrossRef]
  26. Huang, Y.; Ansari, M.; Asgari, H.; Farshidianfar, M.H.; Sarker, D.; Khamesee, M.B.; Toyserkani, E. Rapid prediction of real-time thermal characteristics, solidification parameters and microstructure in laser directed energy deposition (powder-fed additive manufacturing). J. Mater. Process. Technol. 2019, 274, 116286. [Google Scholar] [CrossRef]
  27. Zhang, K.; Wang, S.; Liu, W.; Shang, X. Characterization of stainless steel parts by laser metal deposition shaping. Mater. Des. 2014, 55, 104–119. [Google Scholar] [CrossRef]
  28. Zhao, H.; Zhang, G.; Yin, Z.; Wu, L. A 3D dynamic analysis of thermal behavior during single-pass multi-layer weld-based rapid prototyping. J. Mater. Process. Technol. 2011, 211, 488–495. [Google Scholar] [CrossRef]
Figure 1. (a) Schematic diagram of the experimental setup and (b) shape of the deposit.
Metals 11 01725 g001
Figure 2. The temperature distribution of the deposit during the process of different layers in the simulation of the WAAM process; (a) 3rd layer; (b) 6th layer; (c) 9th layer; (d) 10th layer.
Metals 11 01725 g002
Figure 3. (a) Schematic diagram of the temperature measurement position in the CMT-WAAM process; (b) comparison of simulated and experimental temperature profiles of the deposit.
Metals 11 01725 g003
Figure 4. Solidification map; effect of temperature gradient and growth rate on the morphology and size of solidification microstructure [3].
Metals 11 01725 g004
Figure 5. (a) G, (b) R, and (c) G × R of each layer of deposits.
Metals 11 01725 g005
Figure 6. Solidification map of 316L SS for the CMT-WAAM process and optical microscopy images of the microstructure in the deposit manufactured by the CMT-WAAM process; (a) cross-section of deposit; (b) optical microscopy images of first layer; (c) fifth layer, (d) ninth layer, and (e) top of the tenth layer, (f) solidification map.
Metals 11 01725 g006
Table 1. Chemical compositions of the 316L SS wire and substrate.
316L SSElement (wt %)
CSiMnPSCuNiCrMoFe
Wire0.010.591.530.0270.0010.1711.5518.562.53Bal.
Substrate0.0160.501.250.0300.0010.2610.0916.632.05Bal.
Table 2. Process parameters for CMT-WAAM.
ParametersValue
Current (A)120
Voltage (V)11.2
Travel speed (mm/s)8.33
Wire feed rate (mm/min)3600
Shielding gas (100% Ar) flow rate (L/min)20
CTWD (mm)10
Inter-layer time (s)0
Pyrometer emissivity0.96
Publisher’s Note: MDPI stays neutral with regard to jurisdictional claims in published maps and institutional affiliations.

