Article

Influence of Nb on the Structure and High Temperature Performance of Billet for High-Rise Structural Steel

1
College of Metallurgy and Energy, North China University of Science and Technology, Tangshan 063210, China
2
Hebei Engineering Research Center of High Quality Steel Continuous Casting, Tangshan 063000, China
3
School of Materials Science and Engineering, Hebei University of Science and Technology, Shijiazhuang 050018, China
*
Author to whom correspondence should be addressed.
Metals 2021, 11(11), 1721; https://doi.org/10.3390/met11111721
Submission received: 4 October 2021 / Revised: 24 October 2021 / Accepted: 25 October 2021 / Published: 28 October 2021

Abstract

:
Reasonable control of the niobium (Nb) content in steel slabs is of great significance for improving the surface quality of the slabs. In this study, a Gleeble-3500 thermal simulation testing machine was used to test the high-temperature mechanical properties of steel slabs with four different Nb contents (A: 0.006%, B: 0.031%, C: 0.050%, D: 0.065%) and to analyze the effect of Nb on the high-temperature performance of the steel slabs. Optical microscopy and transmission electron microscopy (TEM) were used to study the microstructure of the casting slabs with different Nb contents and the precipitation in the samples after heat treatment at different temperatures. The results of the study show that the microstructure of the cast slab is mainly composed of ferrite and pearlite. The distribution of each of the two structures was found to become more uniform and a significant improvement in yield strength was observed with increasing Nb content. After heat treatment, the precipitates in the high-rise structural steel were mainly square and star shaped Nb(C,N) precipitates. Increasing the Nb content was found to increase the amount of precipitates in steel. Beyond a threshold, increasing the Nb content did not increase the amount of precipitates. However, the size of the precipitates increased.

1. Introduction

High-rise structural steel is a type of low-alloy high-strength steel, which is the most produced and consumed type of steel in China [1,2,3,4,5]. It has good comprehensive mechanical properties, low-temperature performance, welding performance, and plasticity. It is widely used in the construction of large ships, medium and low-pressure vessels, bridges, and buildings. As high-rise structural steel requires both higher strength and better welding performance simultaneously, under the premise that the C content cannot be increased, a certain amount of Nb is usually added to the steel to improve the strength of the steel [6,7,8,9,10,11,12,13,14].
Nb in steel can form fine and dispersed Nb-containing precipitates with elements such as N and C at precipitation temperatures between 800 and 1100 °C. In the cooling process of continuous casting billets and rolling materials, these precipitates can play a role of precipitation strengthening and improving the strength of high-rise structural steel on one hand, and on the other hand, they can pin the austenite grains in the welding heat-affected zone in the subsequent welding of steel to prevent the coarsening of the structure or affecting the welding performance. Considering the effects of the Nb element mentioned above, the higher the grade of high-rise structural steel is, the higher the Nb content in the steel [15,16,17,18,19,20,21].
However, for the continuous casting of thick slabs of high-rise structural steel, the surface temperature of most wide side parts of the cast slab is maintained at 1000–1100 °C for a long time, while the temperature of the corners of the cast slab is maintained at 800–900 °C, due to the two-dimensional heat dissipation, which corresponds exactly to the precipitation temperature of Nb-containing carbonitrides. The continuous high temperature and the temperature difference on the surface of the cast slab greatly increase the probability of large-size Nb-containing carbonitrides precipitating in the corners of the cast slab, and their enrichment and precipitation at the grain boundaries will greatly increase the probability of cracks in the corners of the cast slab. Studies have shown [22,23,24] that the precipitation of Nb-containing carbonitrides will reduce the high-temperature plasticity of steel, and as the Nb content in the steel increases, the plastic grooves in the reduction of area curve are deepened and widened, which further increases the crack sensitivity of the cast slab. A large number of practical production results also shows [25,26,27] that the probability of a corner crack of a high-Nb content steel continuous casting billet is much higher than that of ordinary steel grades, and increasing the Nb content blindly also brings huge hidden dangers to on-site production.
Therefore, this research intends to start from the laboratory smelting of steels with different Nb contents through to systematically observing and analyzing the microstructure, high-temperature mechanical properties, and Nb-containing precipitate characteristics of high-rise structural steel under different Nb content as-cast conditions, in order to determine the best Nb content range in high-grade high-rise structural steel, providing a basis for the smelting process of high-rise structural steel and improving product quality.

2. Materials and Methods

2.1. Microstructure Sample Preparation

The samples were marked as A–D in the increasing order of Nb content. The compositions of these samples are listed in Table 1. The samples for microstructure observation were cut at the center of the high-rise structural steel, 5 mm away from the surface. The specific preparation plan for the samples was as follows:
(1)
The samples were polished using #120 and #2000 sandpaper. The sample surfaces were kept level during the polishing process. Finally, a polishing machine was used to polish the samples until the surfaces of the samples were bright and scratch-free.
(2)
After polishing, the remaining polishing agent was immediately rinsed off the surfaces of the samples with clean water, and the surfaces of the samples were rinsed with alcohol and quickly dried with a hair dryer.
(3)
Finally, a 4% nitric acid alcohol solution was used to corrode each sample for 1–3 s. After the corrosion was completed, the residual nitric acid alcohol solution was immediately rinsed away with clean water, and then the sample surfaces were rinsed with alcohol. A metallurgical microscope was used to observe the microstructures of the samples.

2.2. High Temperature Performance Sample Preparation

The test material was taken from a cast billet smelted from high-rise structural steel. The cast billet was cut into a sample of size 14 mm × 14 mm × 135 mm using a sawing machine and a wire cutting machine in the direction perpendicular to the drawing direction. The chemical compositions of the main test ingots are shown in Table 1. According to the requirements of the Gleeble-3500 thermal simulation tester (Dynamic Systems Inc., Poestenkill, NY, USA), the long sample was processed into a standard tensile sample of the size shown in Figure 1. The size of the test sample was 10 mm × 120 mm, and the two ends of the sample were processed into ordinary M10 threads in the range of 10 mm, which were used to fix the sample during the test.
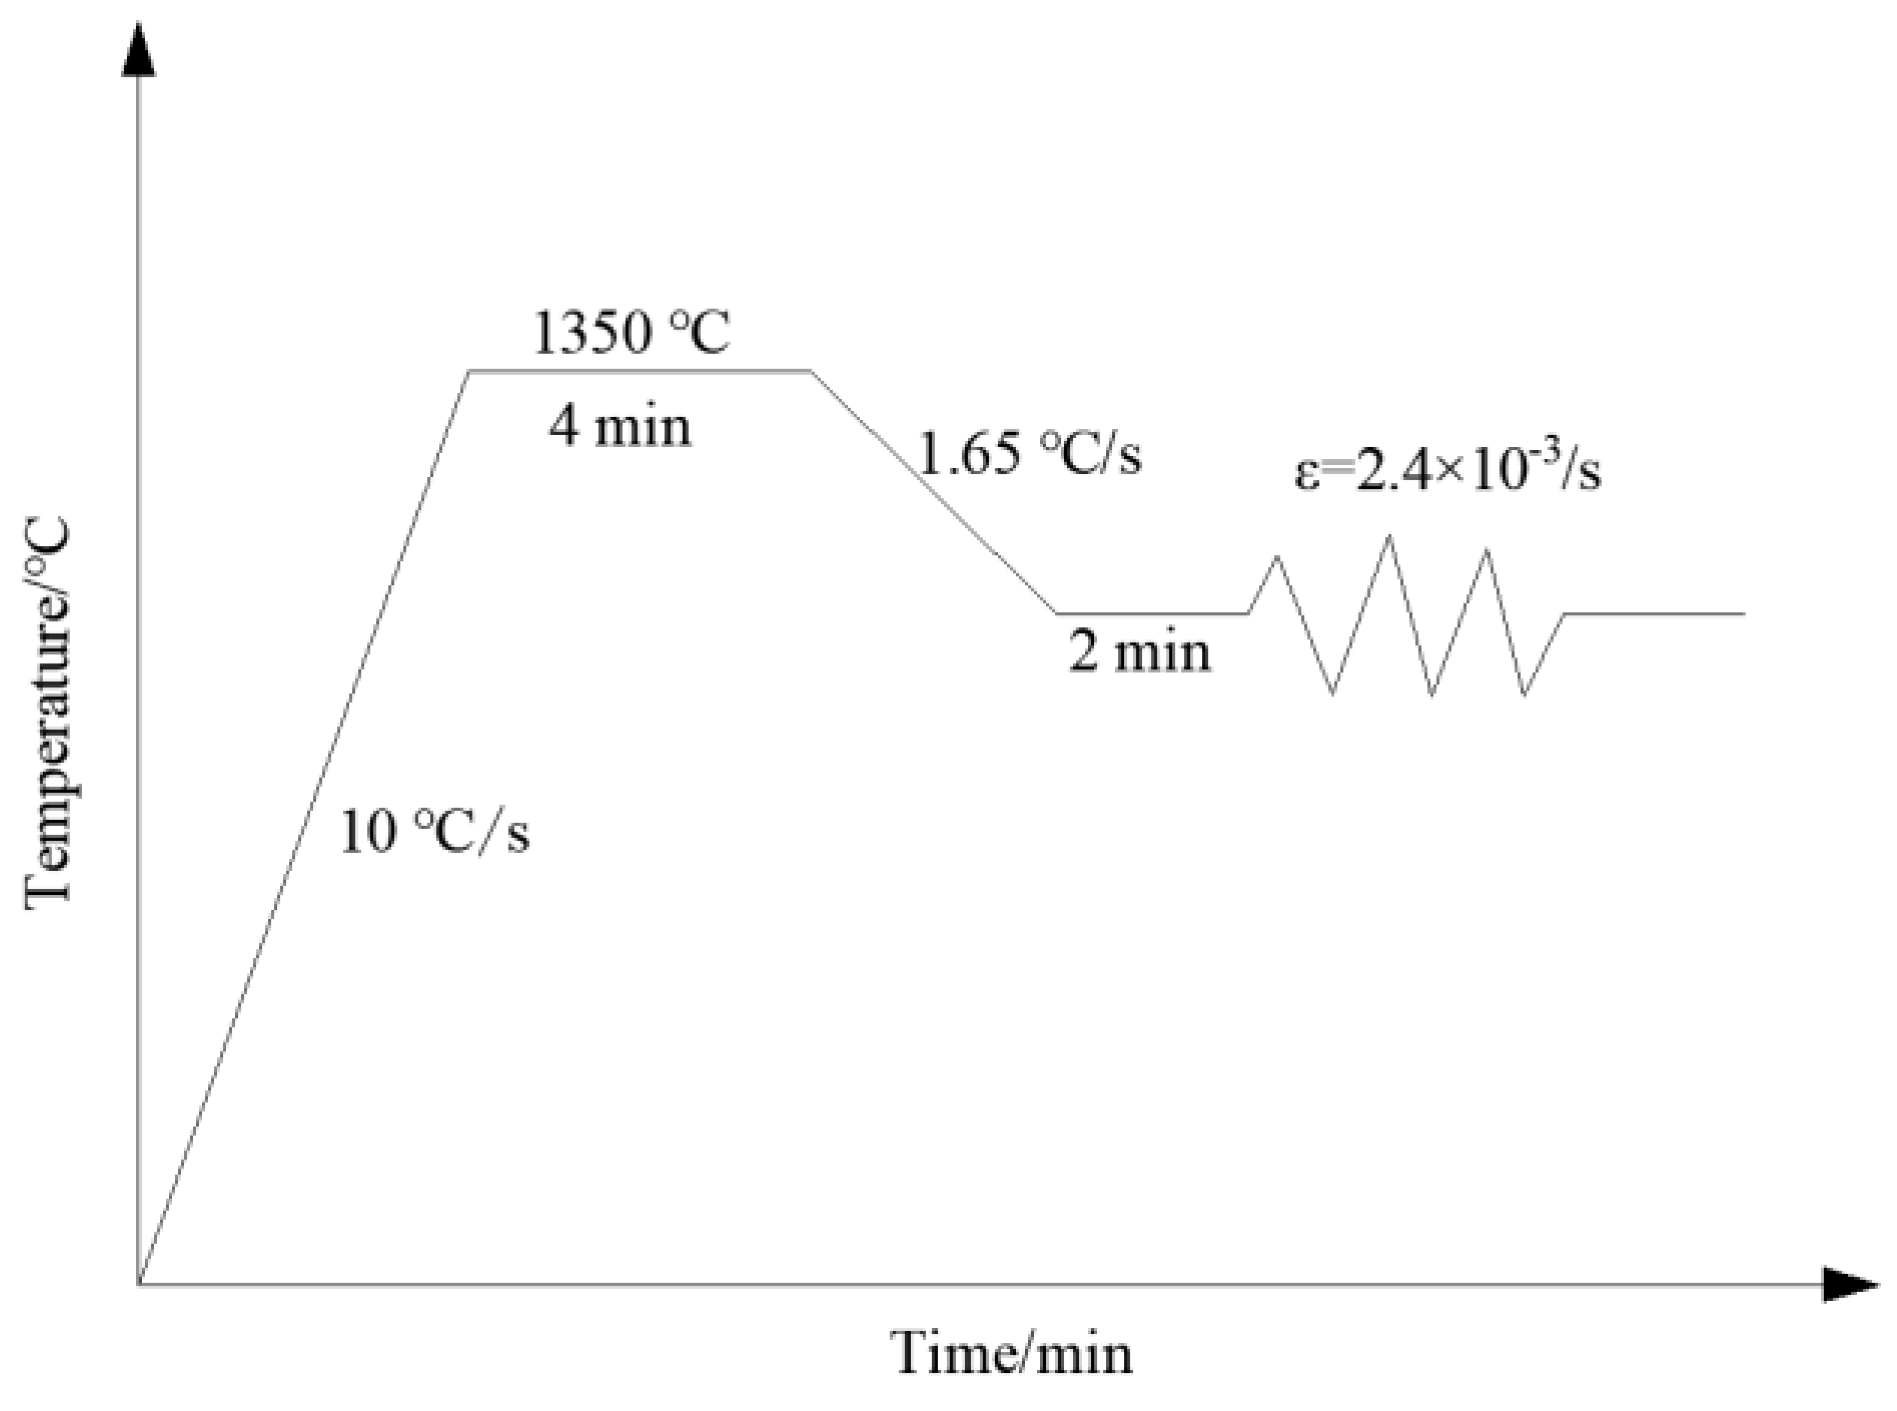
Based on the actual temperature of the slab during continuous casting, the temperature range of this high temperature tensile test was set at 750–1300 °C. At the beginning of the test, the sample was held in the Gleeble-3500 (Dynamic Systems Inc., Poestenkill, NY, USA), and argon gas was introduced into the vacuum chamber at a flow rate of 1 L·min−1. The temperature of the sample was increased to 1350 °C at a rate of 10 °C∙s−1 through a large current and held for 4 min. The temperature was then reduced to the test temperature at a temperature ramp down rate of 1.65 °C∙s−1. The sample was held at the test temperature for 2 min, after which the sample was subject to stretching. The sample was stretched at a deformation rate of 2.4 × 10⁻³ s−1 until the sample broke, the heat treatment scheme is shown in Figure 2. After the test specimen was broken, spray water was used to cool the fracture immediately to maintain the original appearance of the fracture, which is convenient for further observations.

2.3. Precipitate Sample Preparation

During the high-temperature tensile experiment, a length of 50 mm in the middle of the tensile specimen was chosen as the effective experimental range. To maximize the accuracy of the experiment, the high-rise structural steel with different Nb contents smelted in the laboratory was made by wire cutting to obtain sizes of 10 mm × 10 mm × 5 mm. The microstructure and precipitation of Nb(C,N) were observed for the samples in the mm range.
A muffle furnace was used to process the samples. The muffle furnace was heated to 1200 °C, and then the cut samples were quickly placed in the muffle furnace for 1 min. Finally, the samples were removed and air-cooled. The same method was used to heat the samples at 1100 °C.
Before observation by transmission electron microscopy, the carbon film had be extracted first as follows. First, the surface of the sample was smoothed and polished. In the second step, the sample surface was corroded by 4% nitric acid alcohol. Then, a carbon sprayer was used to spray a layer of about 200 nm thick carbon film on the surface of the sample. In the third step, the side with the carbon film was divided into a rectangular grid of 1.5 mm × 1.5 mm, and then soaked in a 7% nitric acid alcohol solution until the carbon film was peeled off the surface of the sample. Finally, the peeled carbon film was dropped into the alcohol aqueous solution. After rinsing in a copper mesh, the sample was picked up with a copper net, dried, and then observed and analyzed under a field emission transmission electron microscope (FEI Tecnai G2 F20) (FEI, Hillsboro, OR, USA).

3. Results and Discussion

3.1. Microstructure Analysis

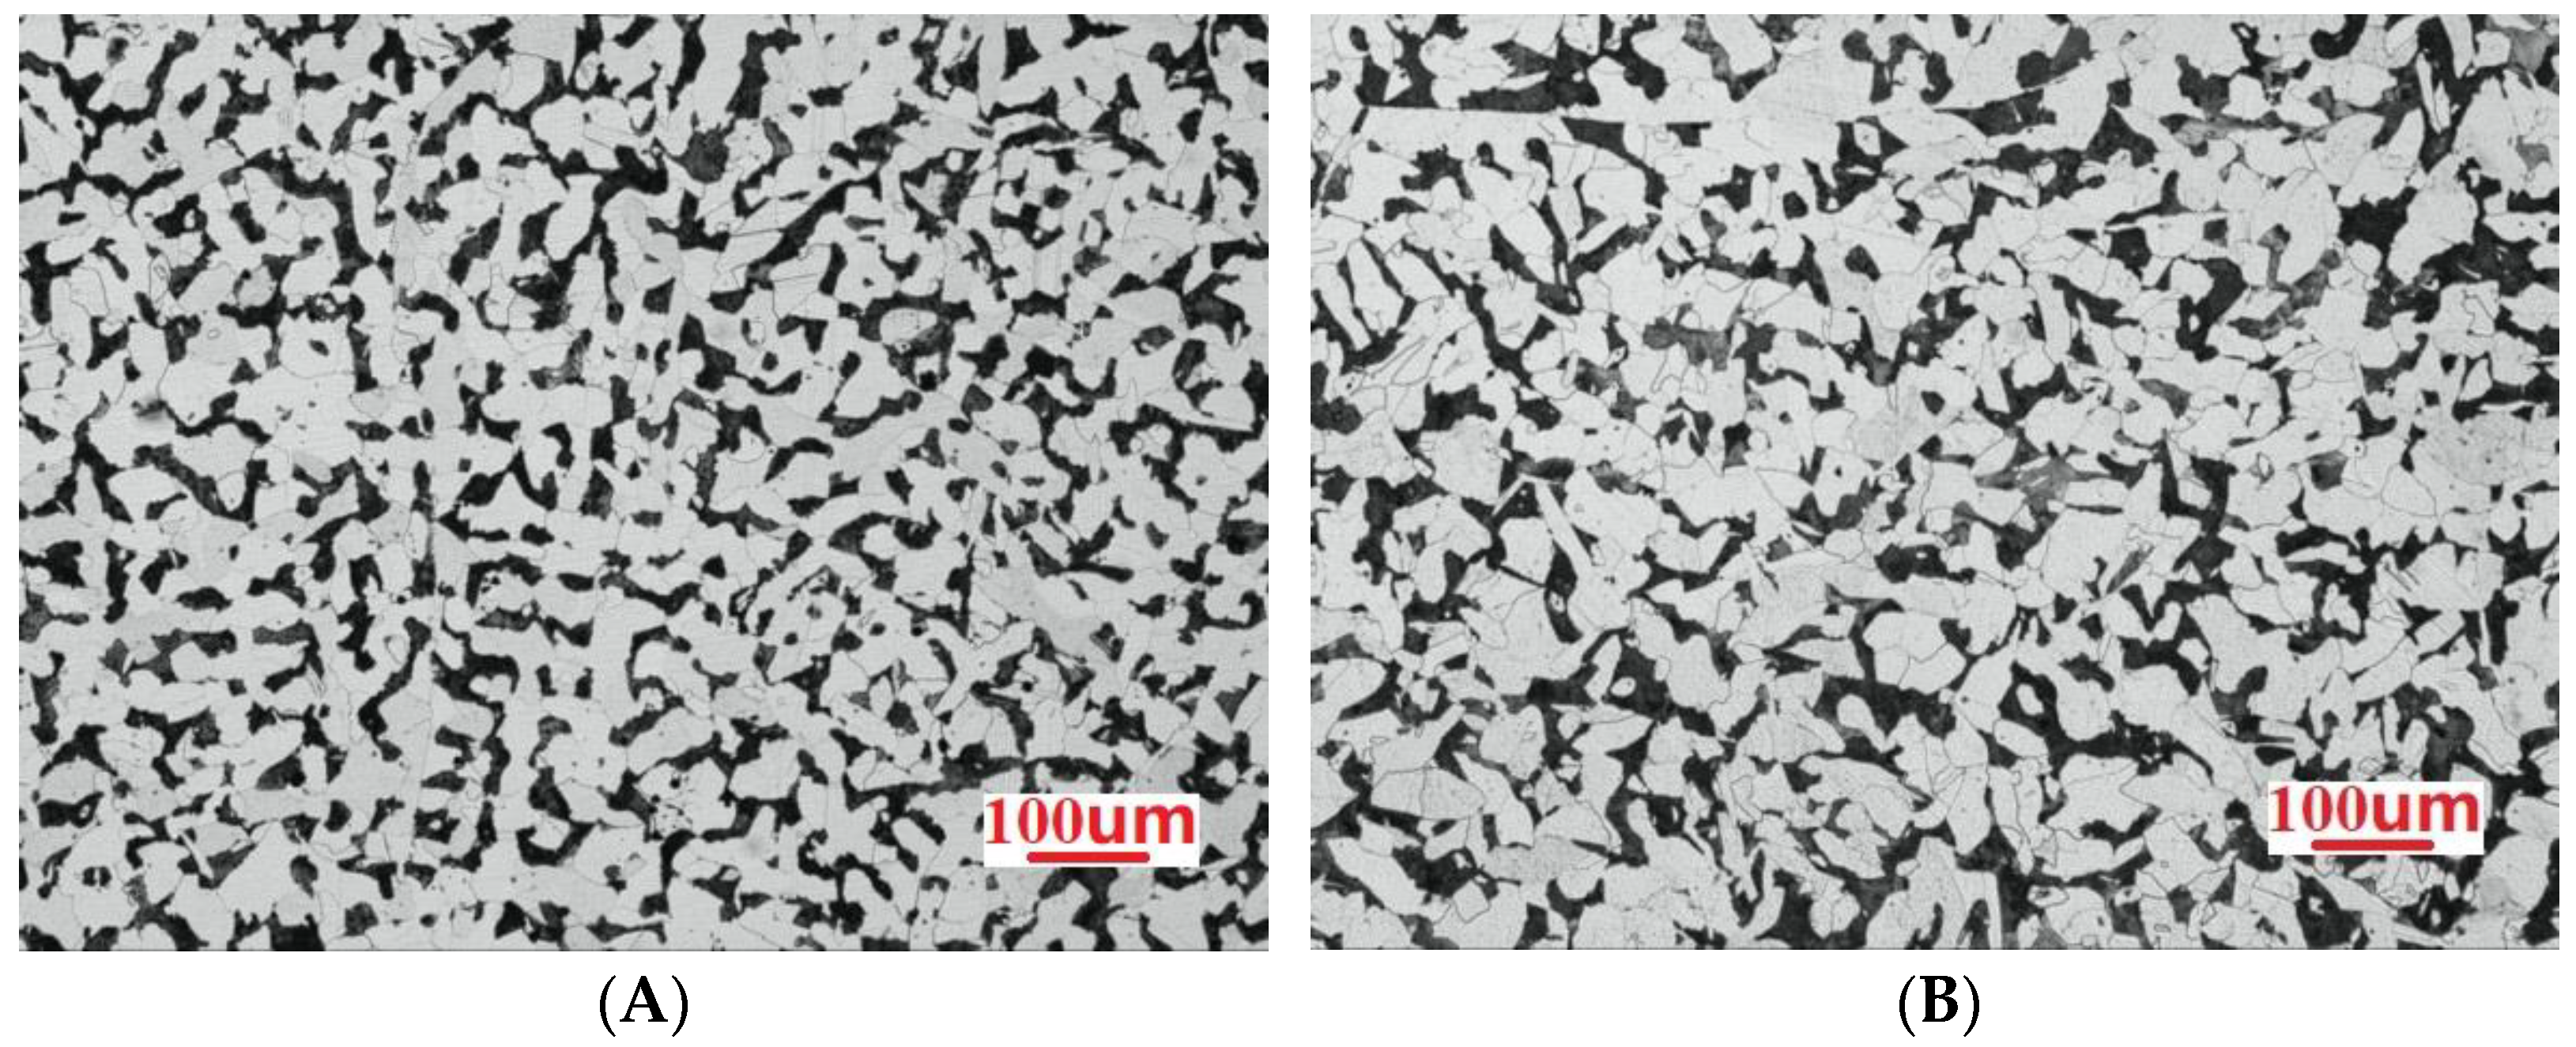
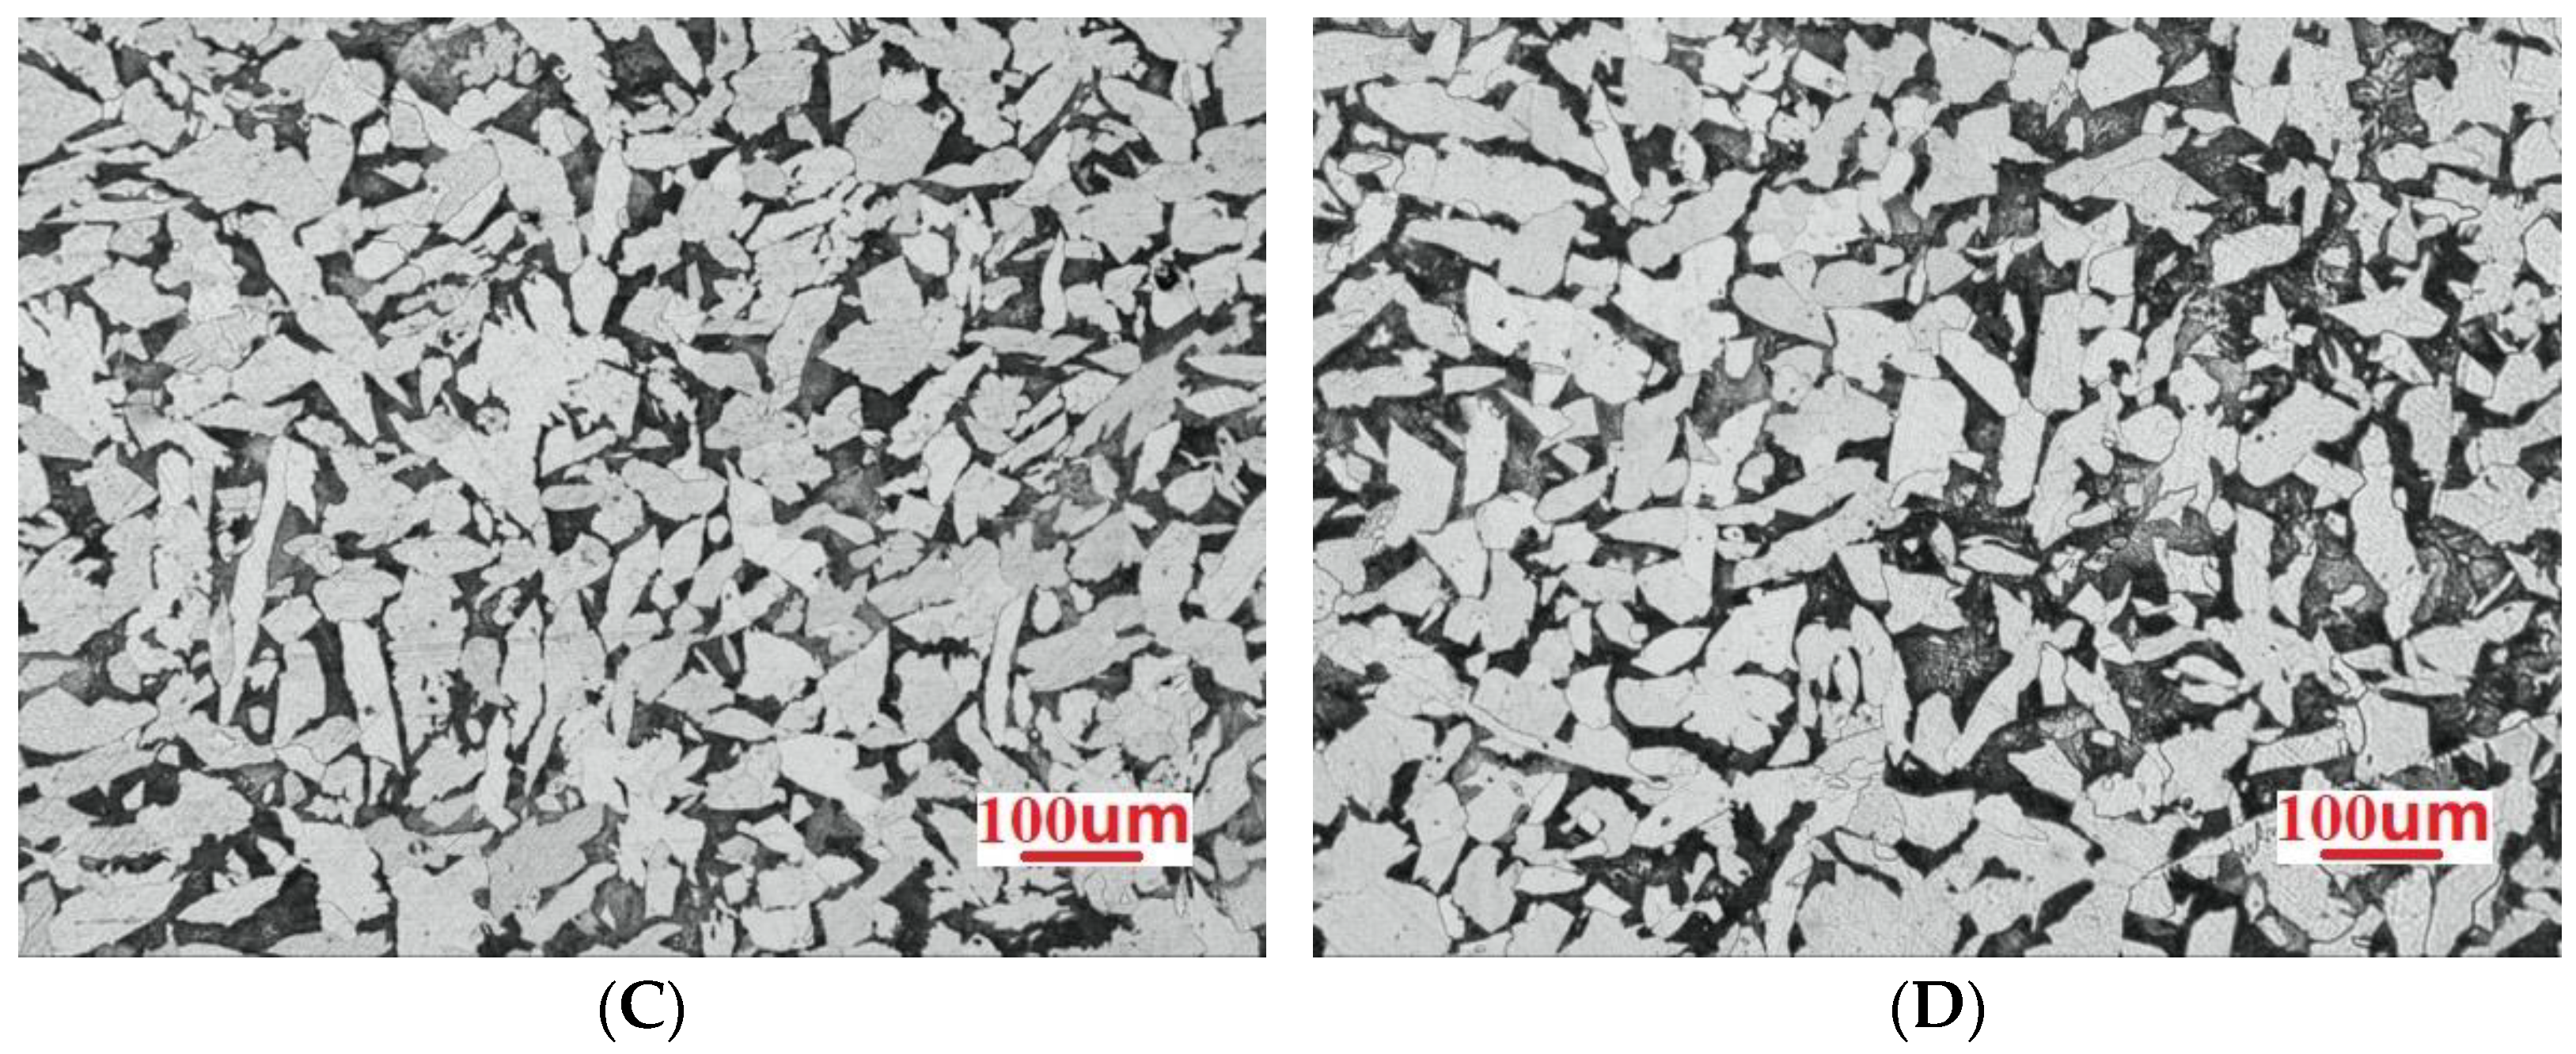
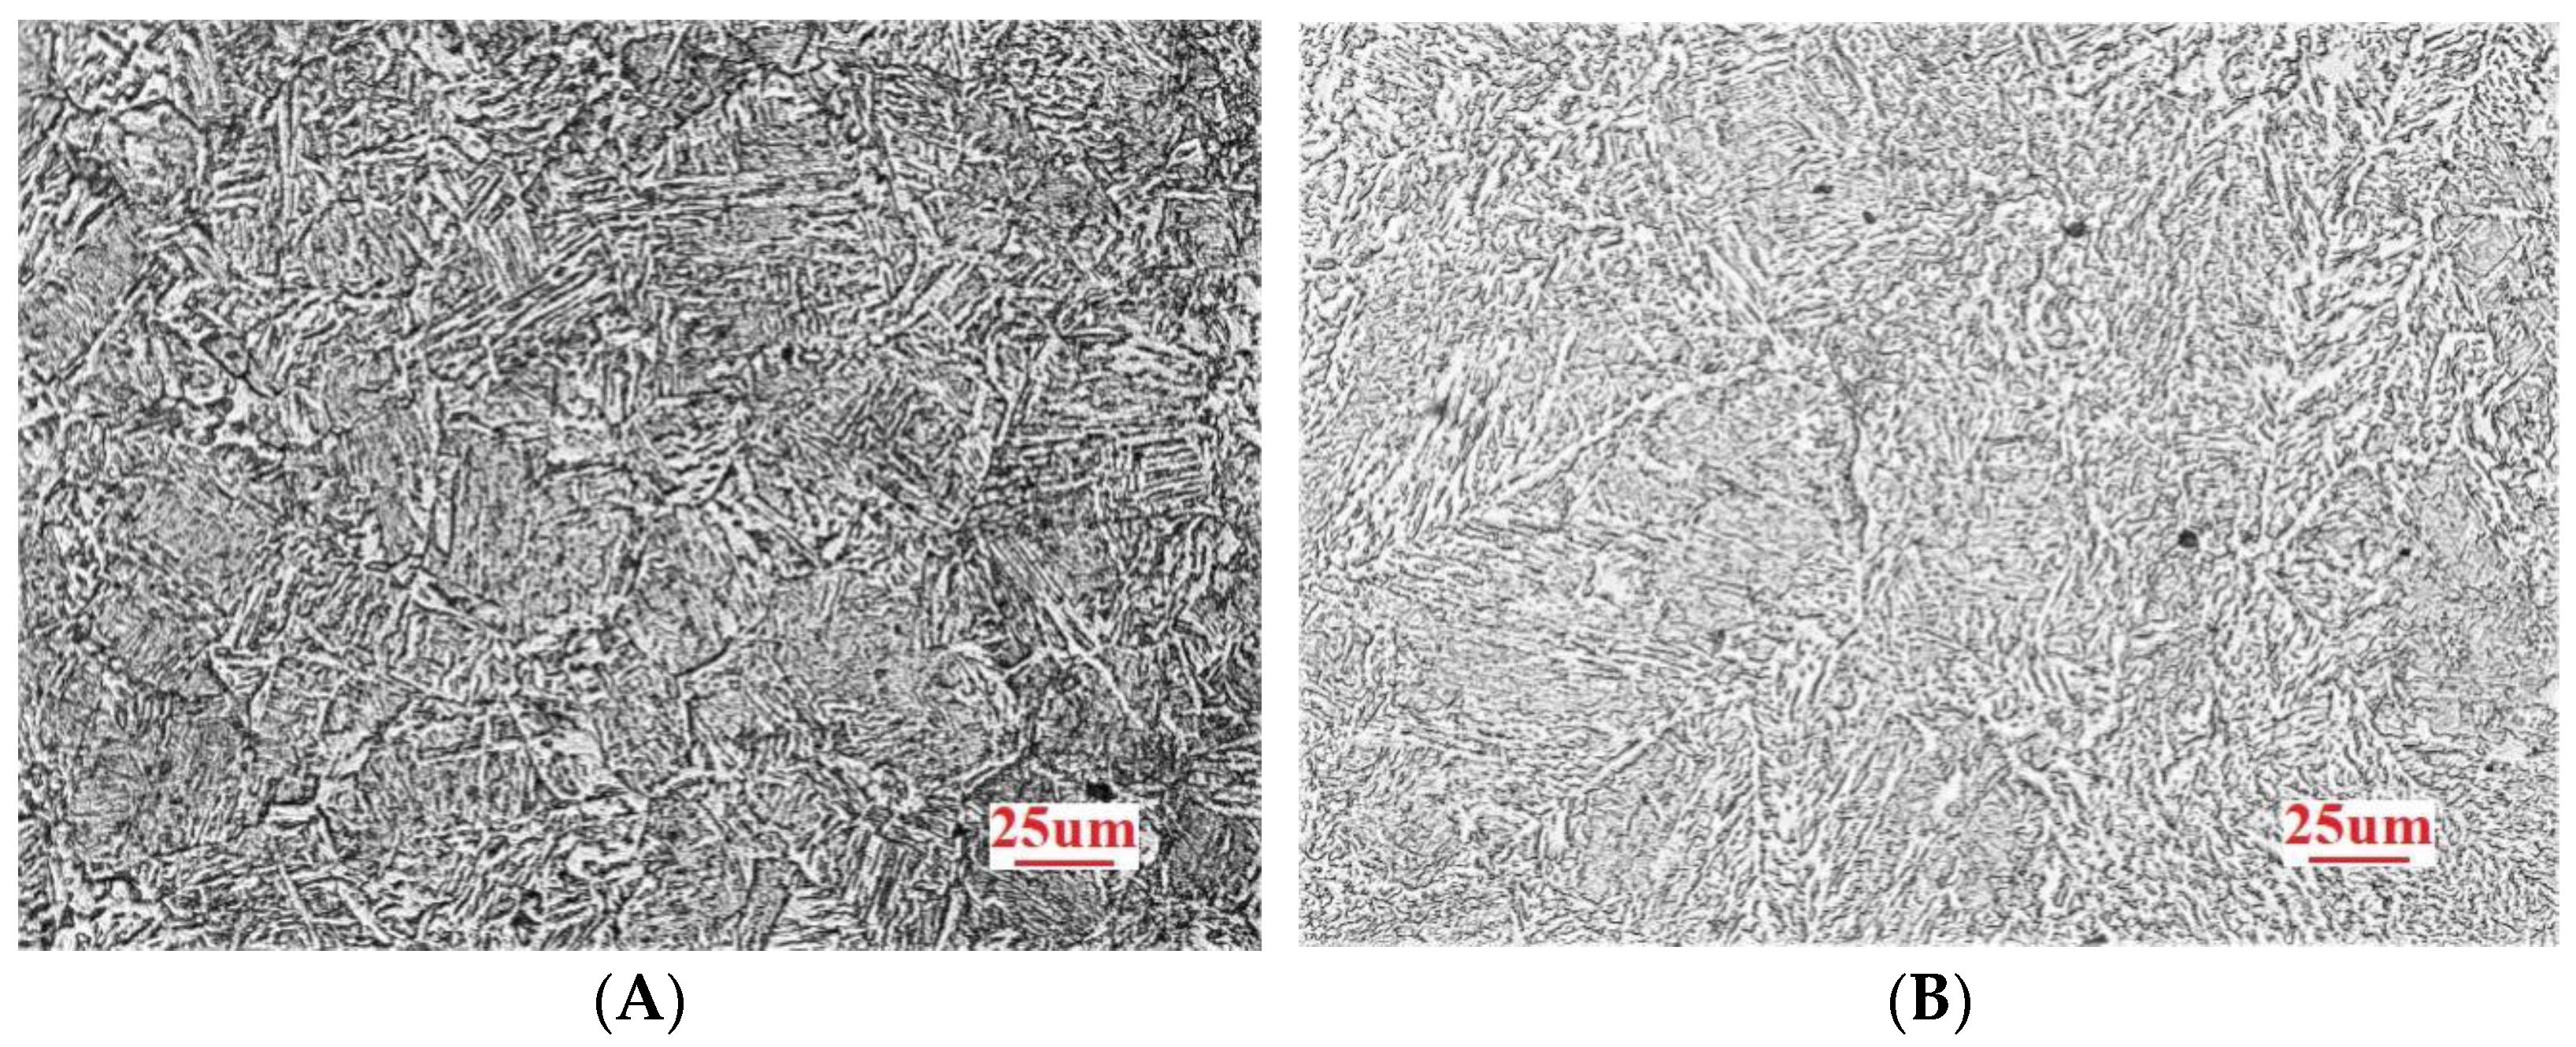
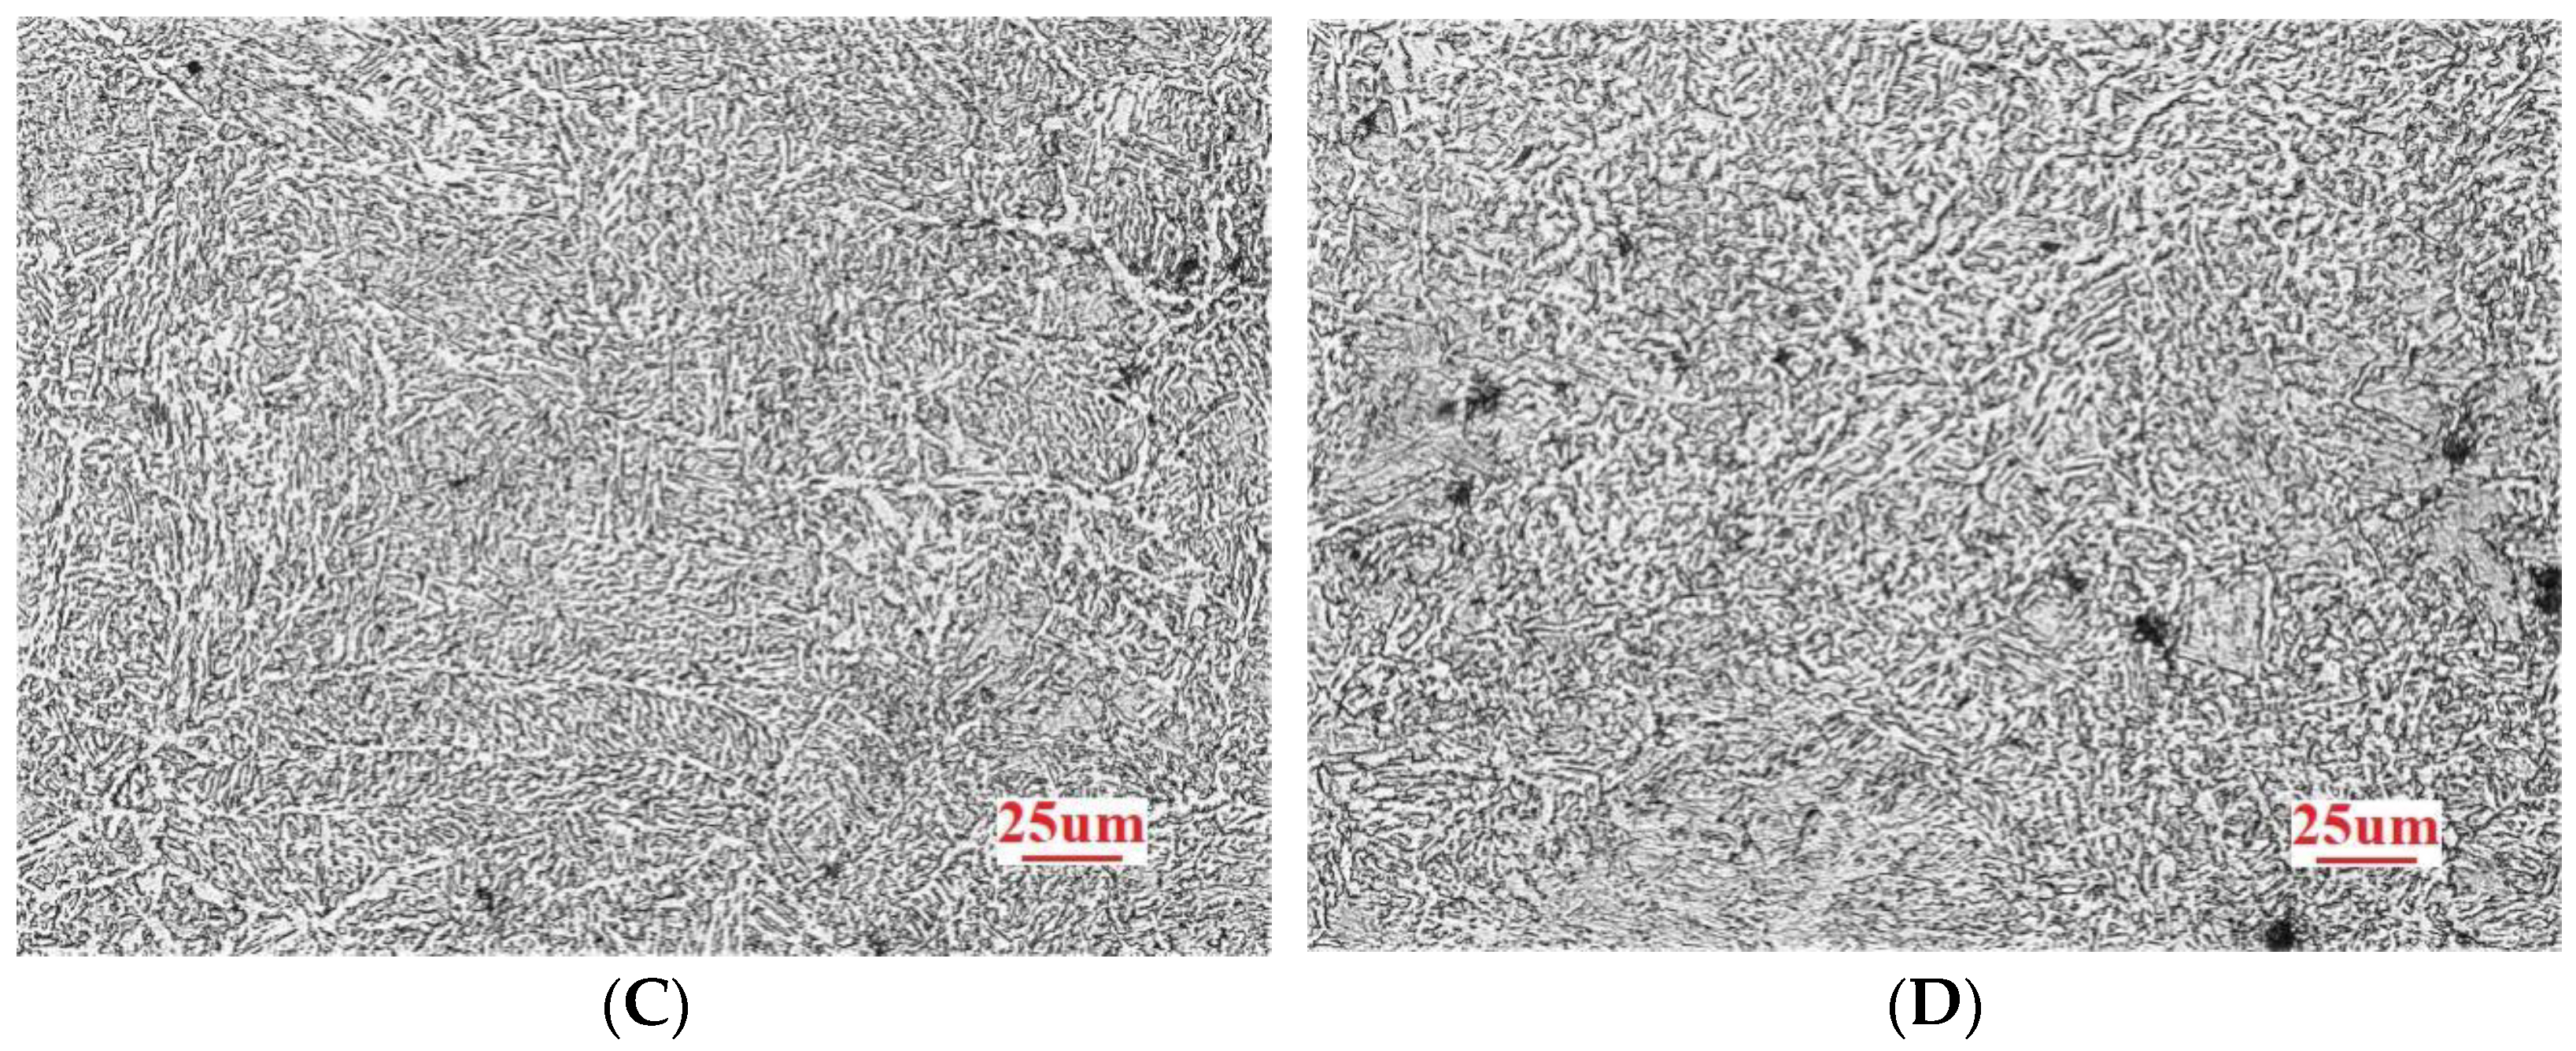
Figure 3 shows the microstructures of samples A–D. In the figure, the white and black structures are ferrite and pearlite, respectively. At room-temperature, the size of ferrite in the microstructure of sample A was larger than that of samples B–D. It had a polygonal shape, and a considerable part of the ferrite pieces were connected. This negatively affected the performance of the steel to a certain extent and the subsequent rolling. The distribution of ferrite and pearlite in the room-temperature microstructures of samples B–D was more uniform. In these samples, each microstructure existed independently, and there were some ferrites with sizes of less than 10 μm. These features are important for improving the overall performance of the cast slab.
Grain refinement increases the number of grains per unit volume and the grain boundary area. When deformation occurs due to greater stress, the deformation is evenly distributed in more grains, reducing the concentration of stress. The increase in the grain boundary area increases the energy required for crack formation, thereby reducing the occurrence of cracks. When the formed cracks extend to the grain boundaries, the cracks are forced to change directions owing to the different orientations of the grains on both sides of the grain boundaries and terminate the expansion, which greatly increases the energy required for the crack propagation. Therefore, grain refinement of the cast slab can significantly improve the strength and toughness of the steel.
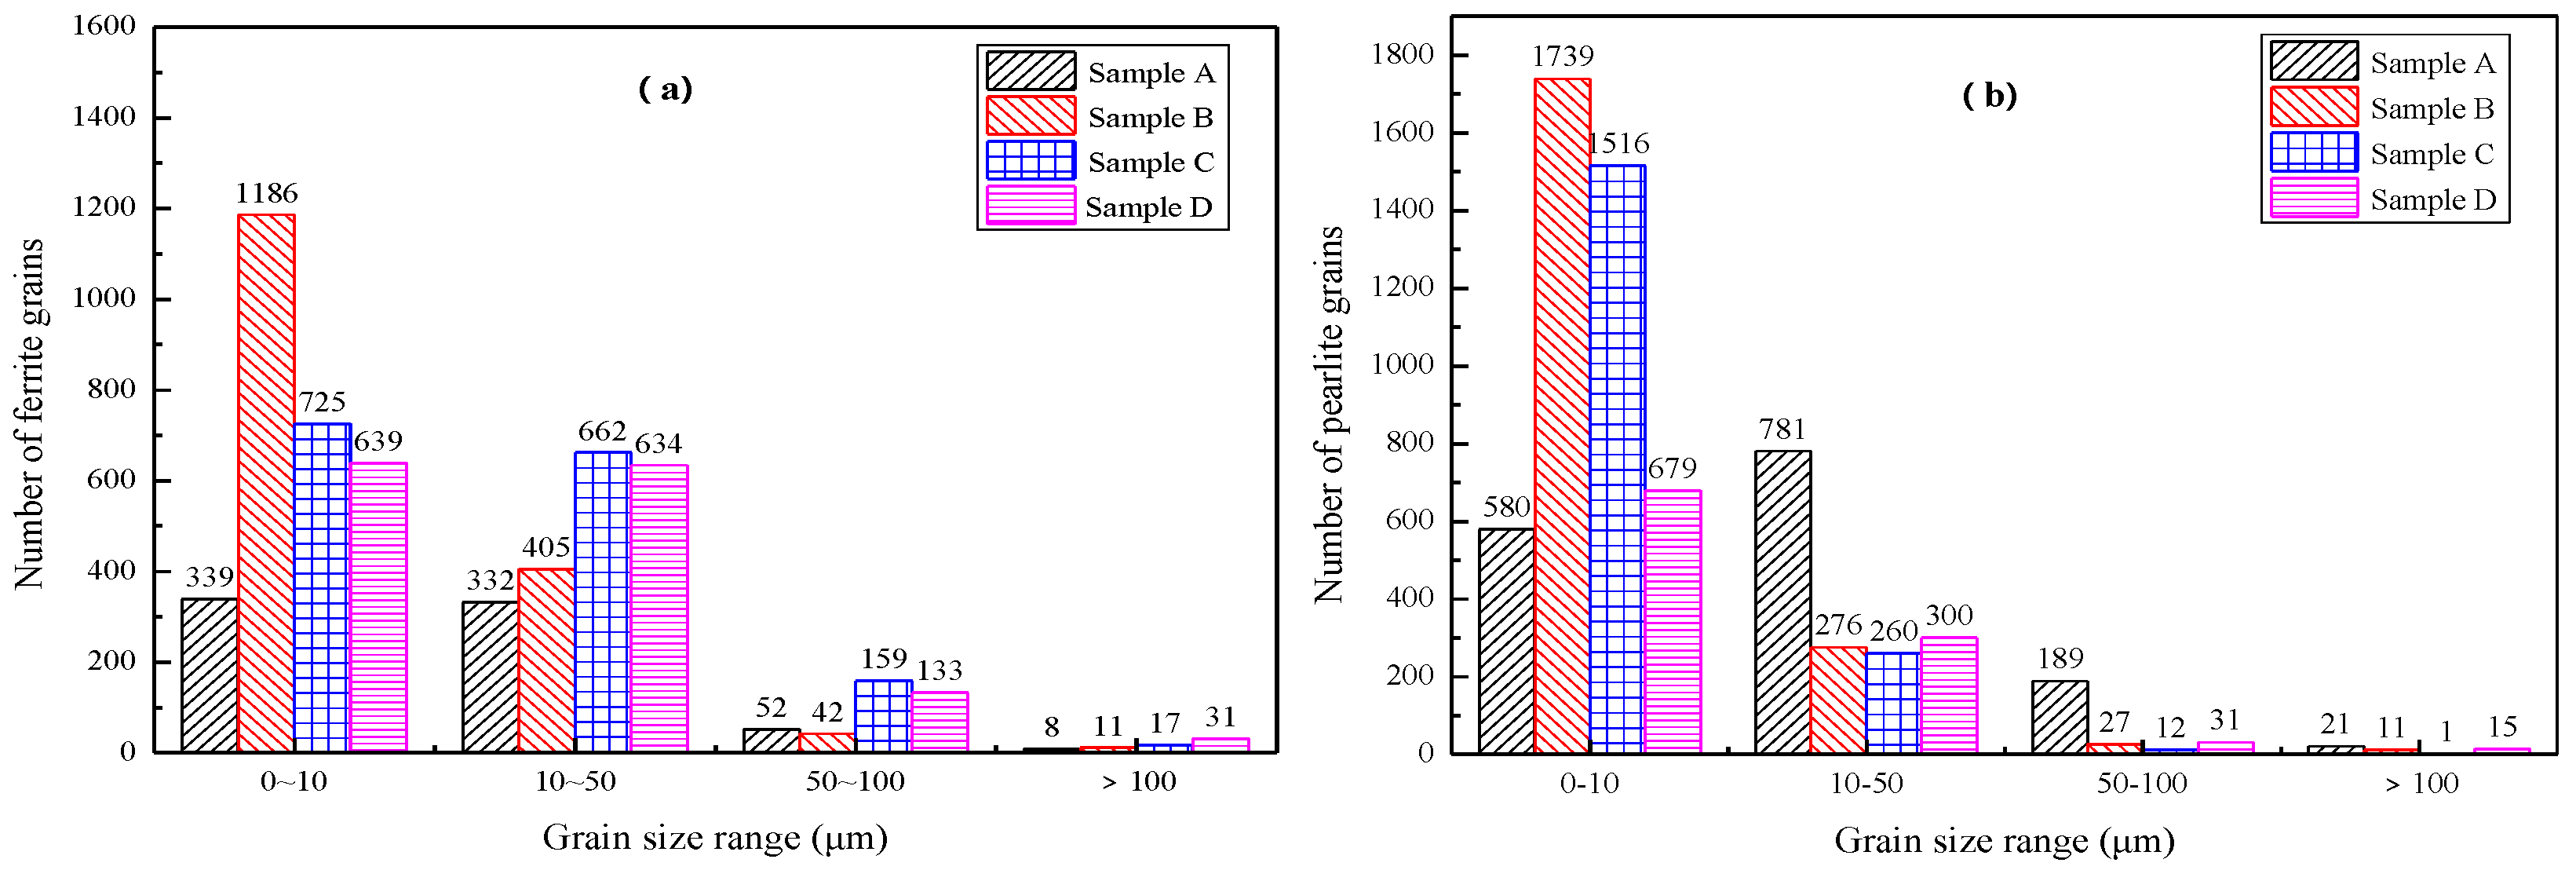
Image Pro Plus software was used to process the microstructure of high-rise structural steel with a 50-fold field of view. The number and size of ferrite and pearlite grains were counted by using the average method in the ranges from 0 to 10 μm and 10 to 50 μm, respectively. The particles of sizes 50 μm–100 μm and >100 μm were counted, and the results are shown in Figure 4a,b. It can be seen from Figure 4 that the grain sizes of ferrite and pearlite in each sample were mainly concentrated in the range of 0–50 μm, and the grains larger than 50 μm accounted for a relatively small proportion. The proportions of ferrite and pearlite in samples A, C, and D in the ranges of 0–10 μm and 10 μm–50 μm were not much different. In sample B, which had a large proportion of ferrite and pearlite in the 0–10 μm particle size range, the ratio of crystal grains to pearlite was 72.14% and 84.71%.
Using Image Pro Plus software (v6.0, Bethesda, MD, USA), the average sizes of ferrite and pearlite grains in the sample were obtained, as shown in Table 2. From Table 2, it can be directly observed that the average size of ferrite and pearlite grains were smallest in sample B and were 17.36 μm and 16.28 μm, respectively.
The main reasons for this phenomenon are as follows: (1) During the cooling process, after the molten steel was completely solidified, the precipitated phases in the matrix were pinned to the austenite grain boundaries, inhibiting the normal growth of the grains and achieving the grain refinement effect. The smaller the austenite grain size, the greater the number of grain boundaries per unit area. This provides more nucleation sites for ferrite, which prevents the natural growth of ferrite, thereby refining the grains. (2) When austenite-ferrite transformation occurs, the Nb(C,N) precipitation at the interface between the ferrite phase and the austenite parent phase can slow down the movement of the ferrite/austenite interface, extend the time of eutectoid transformation, and inhibit the growth of ferrite. The solute drag effect [25,26] and the pinning effect [27] of the precipitated phase provide favorable conditions for refining the microstructure of steel. The Nb content in samples B–D was higher, making the structure smaller and more uniform than that in sample A. When the Nb content exceeds a certain limit, its grain refinement effect will be weakened, and cannot continue to play the role of grain refinement.
Film-like pro-eutectoid ferrite was found in the microstructure of high-rise structural steel. Pro-eutectoid ferrite is austenite with a lower than eutectoid composition. When slowly cooling from a high temperature, ferrite precipitation occurs before the eutectoid transformation. The boundary precipitates first (the transition temperature is approximately 770–680 °C). Because the strength of ferrite is only approximately 1/4 of the strength of austenite, the film-like pro-eutectoid ferrite produced along the austenite grain boundary produces a strain concentration [28,29,30]. The ferrite on the grain boundary can withstand stress up to a limit. However, microvoids are produced in the grain boundary ferrite after the stress exceeds a limit. As the stress continues to exist, the holes aggregate and grow, causing grain boundary slippage, resulting in transverse cracks extending along the grain boundary [31,32]. Therefore, in the actual production process, the process should be optimized to avoid the formation of pro-eutectoid ferrite as much as possible.

3.2. High Temperature Performance Analysis of Test Steel

3.2.1. High Temperature Strength Curve Analysis

The high-temperature strength of a continuous casting slab is an important index for measuring the high-temperature mechanical properties of the casting slab, and it is usually expressed in terms of the tensile strength and the yield strength. The tensile strength of a continuous casting slab refers to the maximum stress at which the slab can resist uniform plastic deformation and is a criterion for measuring whether the slab has cracks. The yield strength is the strength when the slab begins to undergo plastic deformation, and it is a measure of the plastic deformation of the slab.
(1)
Tensile strength curve
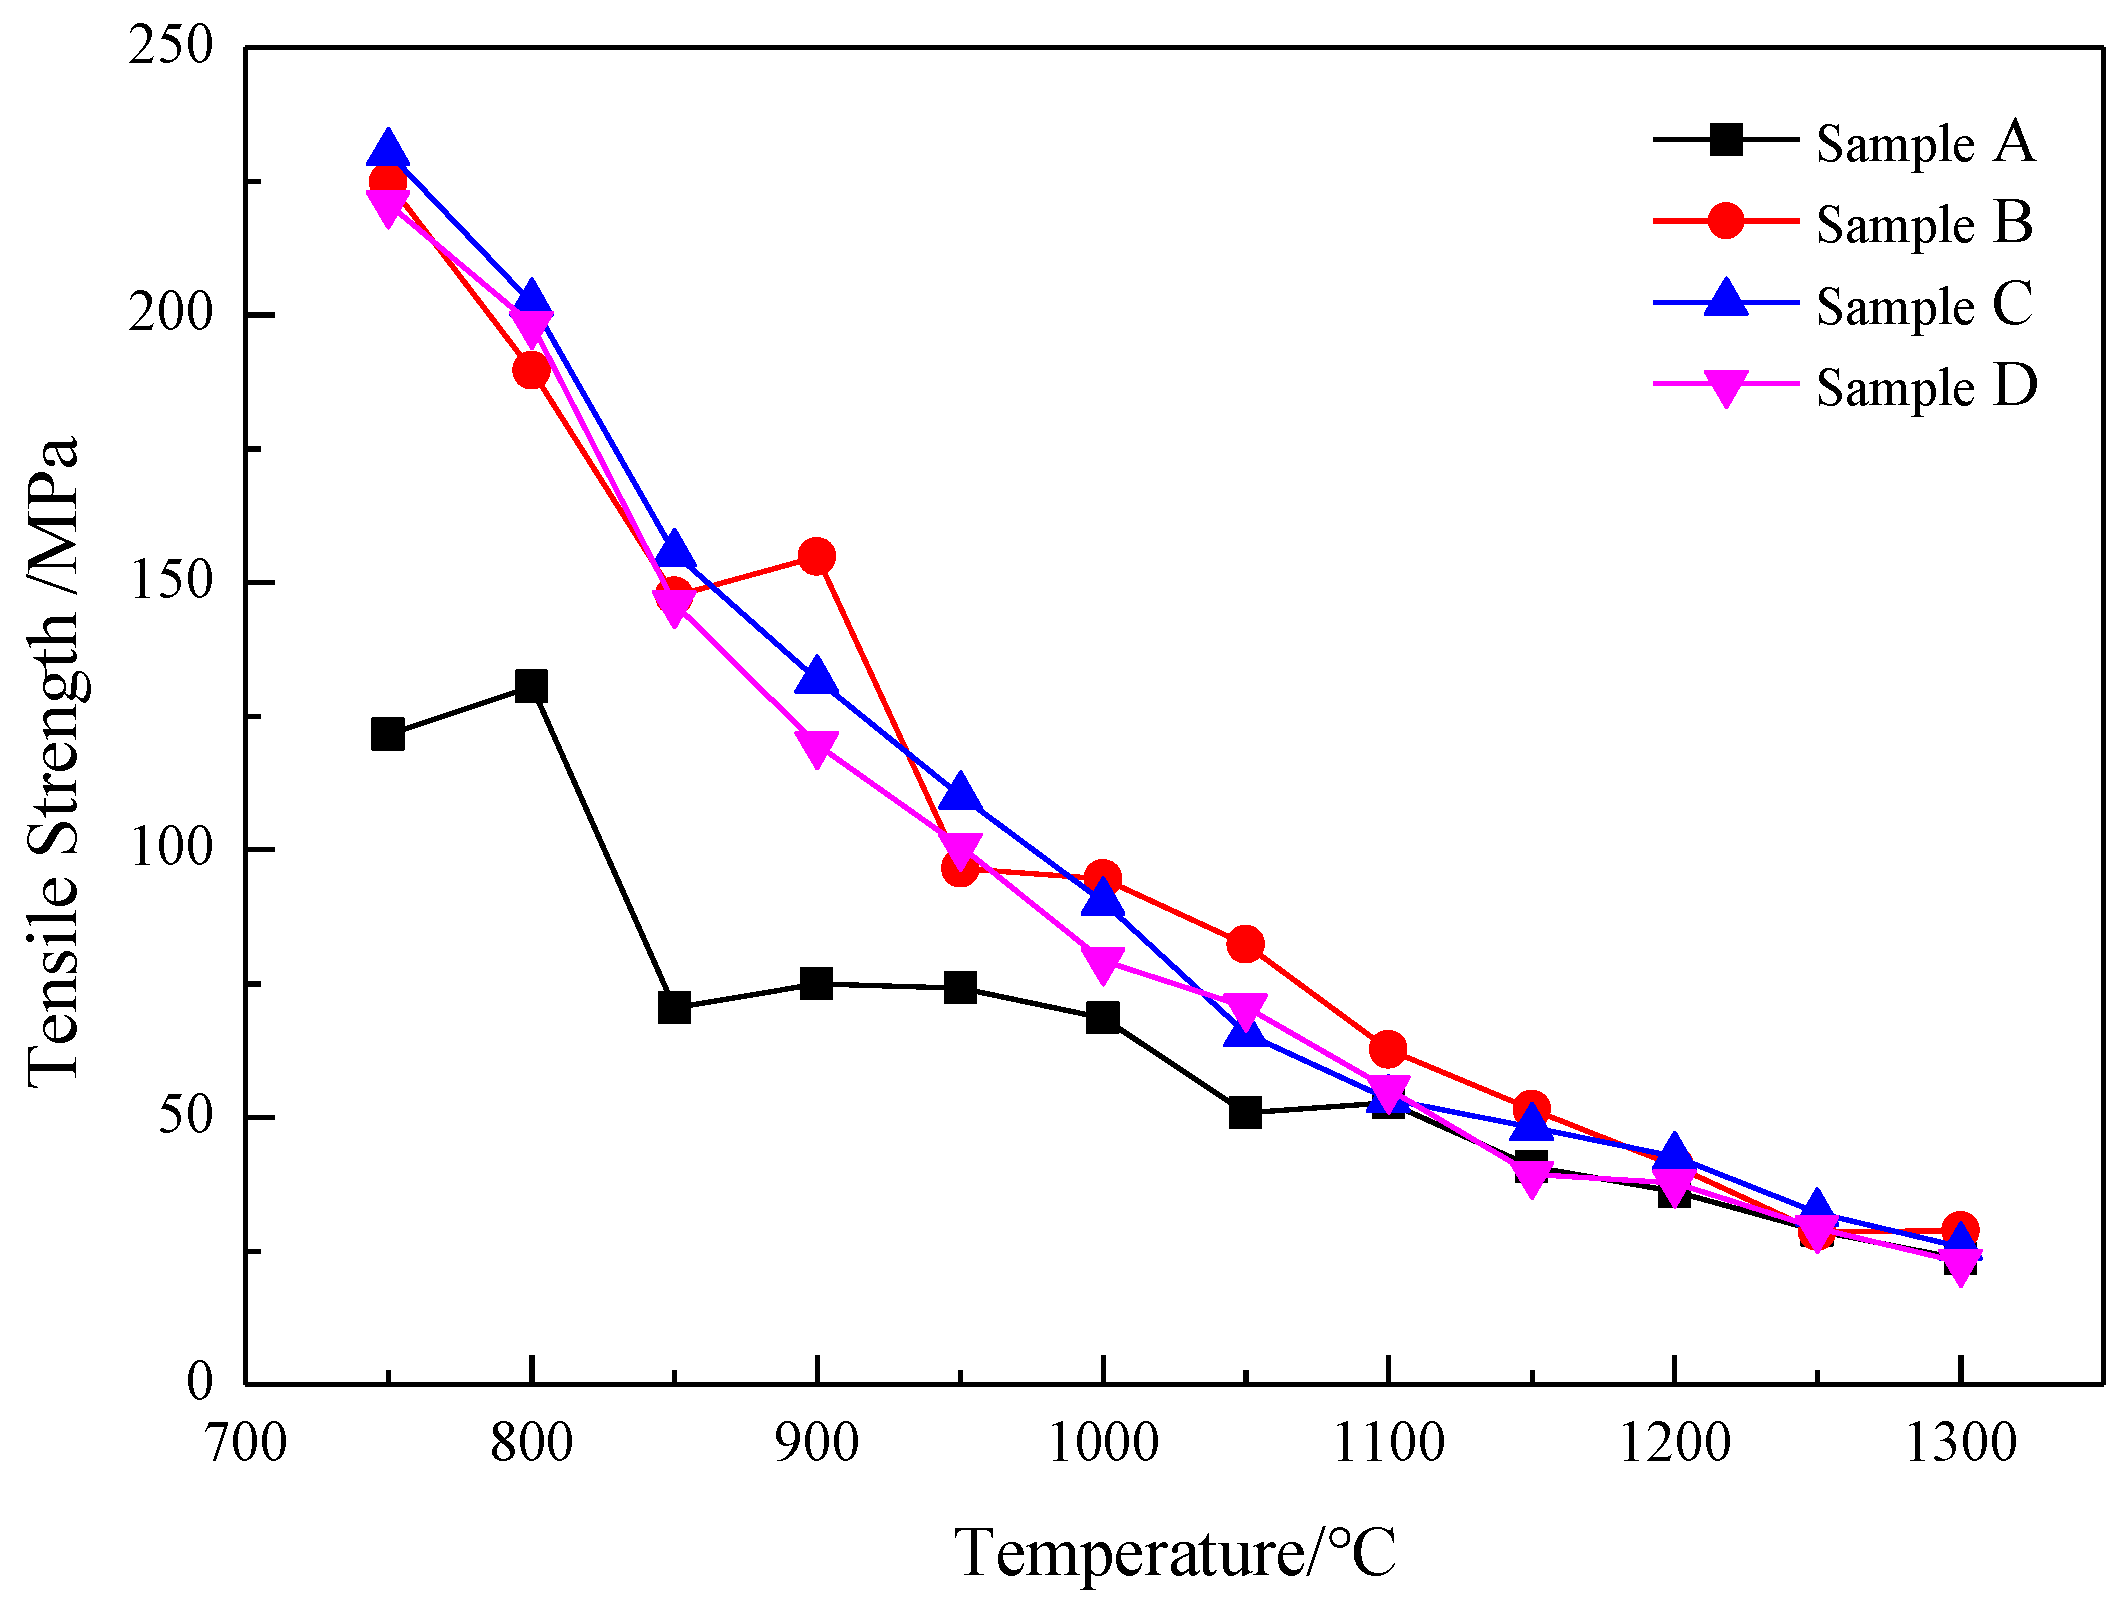
Figure 5 shows the tensile strength curve of high-rise structural steel with different Nb contents. The high-temperature tensile strength curves of samples A and B have obvious low-strength areas, and the overall trend is downward. The high-temperature tensile strength curves of samples C and D are relatively smooth, and the overall trend is downward. The following is a detailed analysis of the high-temperature tensile strength curves of samples A–D.
The two curves of samples A and B have obvious low-strength areas in the temperature range of 900–800 °C. At 850 °C, the tensile strength of the two samples reached the minimum value, which is 70.46 MPa and 147.38 MPa, respectively. At 1300 °C–900 °C, the tensile strength of samples A and B decreased with the increase in temperature and reached a minimum of 23.40 MPa and 28.63 MPa, respectively, at 1300 °C. As sample B had a higher Nb content than sample A, the grains of sample B were smaller, and it had a greater ability to resist deformation. The two tensile strength curves of specimens C and D decrease as the temperature increases. The tensile strength of specimens C and D reached the maximum value of 230.29 MPa and 220.72 MPa, respectively, at 750 °C, and the minimum value of 25.76 MPa and 22.77 MPa, at 1300 °C. Although the Nb content of sample D was higher than that of sample C, the high-temperature tensile strength of sample D was overall slightly lower than that of sample C. This shows that with an increase in the Nb content, the tensile strength of the cast slab may not necessarily increase. The main reason is that the Nb-containing precipitates are mainly Nb(C,N). Under the condition that the total amount of C and N in the steel does not change much, a single increase of Nb content has little effect on increasing the number of precipitates.
(2)
Yield strength curve
The yield strength curve is an important characteristic curve that characterizes the high-temperature properties of a slab. The factors that affect the high-temperature yield strength of the slab include the microstructure of the slab, the precipitated phase, and the nature of the metal. Owing to the compositional characteristics of the four samples, the Nb content is a key factor. The increase in Nb content refines the microstructure of the sample, and the fine grains increase the number of grain boundaries per unit area. However, when dislocation movement occurs, more resistance needs to be overcome, thereby reducing internal dislocations in the grains, which ultimately increases the yield strength of the steel.
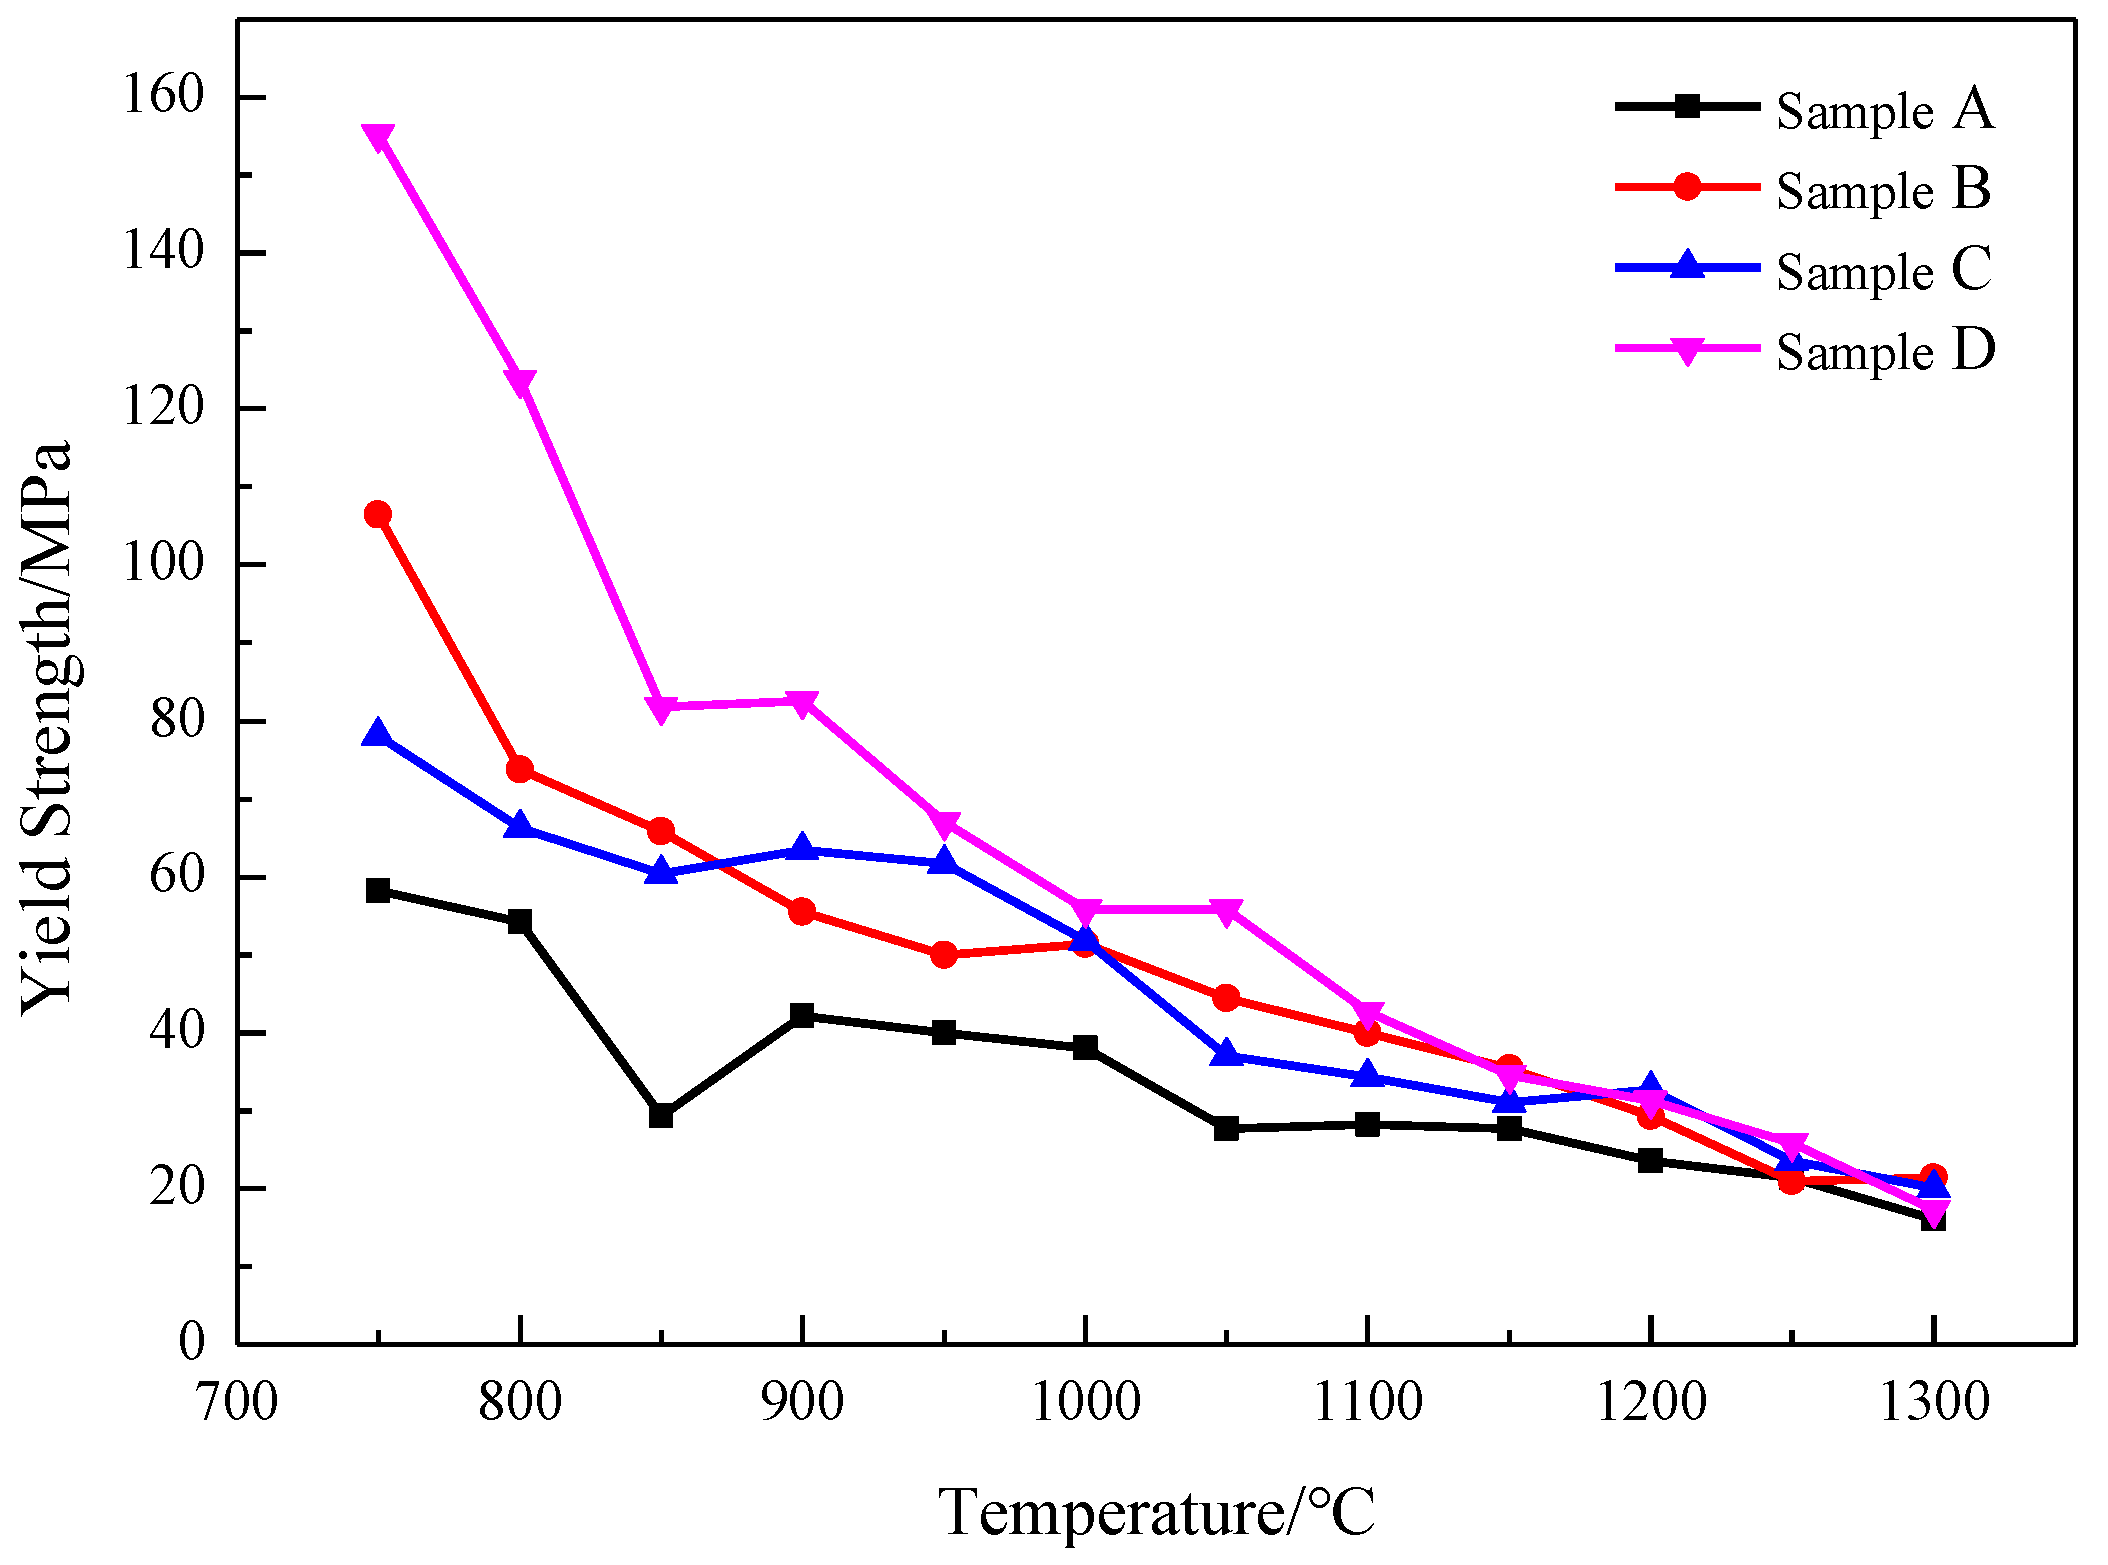
Figure 6 shows the relationship between the yield strength of the four samples and temperature. With an increase in the test temperature, the yield strength of the samples showed a downward trend. The yield strength curves of samples B–D are located above A as a whole, indicating that the three samples had better resistance to plastic deformation at the test temperature. At 750 °C, the yield strength of the four samples A–D reached their maximum values of 58.19 MPa, 106.41 MPa, 78.14 MPa, and 155.28 MPa. The minimum yield strength values of the samples were 16.10 MPa, 21 MPa, 20.07 MPa, and 17.26 MPa, respectively.
It can be seen from the yield strength curve in Figure 6 that the increase in Nb content significantly improved the yield strength of the test steel, which was more obvious between 900 °C and 750 °C. The increase in Nb content provided more precipitation phase-forming elements for the steel matrix. Among the factors influencing yield strength, the strengthening effect of the precipitated phase was an important internal factor. The size of the precipitated phase in sample D was larger, and the total number was slightly reduced, which increased the distance between adjacent particles. According to the dislocation theory, the movement of the dislocation must bypass Nb(C,N) and other non-deformable dislocations, which increases the line tension and slows down the speed of the dislocation movement, thereby increasing the yield strength of the sample.
With the increase of temperature, the yield strength of different samples was gradually consistent, which is mainly because the main precipitation temperature of Nb-containing precipitates was 800–1100 °C, and its contribution to strength was more manifested when the temperature was relatively low. As the temperature increased, the Nb-containing precipitates gradually dissolved in the steel, making its precipitation strengthening effect disappear.
In summary, the addition of Nb makes the microstructure of the sample more uniform and finer, greatly improves the high-temperature tensile strength and yield strength of high-rise structural steel, and improves the resistance of high-rise structural steel to deformation at high temperatures. These properties are important for the forward movement of the slab during the continuous casting process.

3.2.2. High Temperature Thermoplastic

In the continuous casting process, the thermal plasticity of the billet is an important criterion for adjusting the process parameters. Therefore, the high-temperature thermal plasticity of microalloyed steel was extensively researched.
High-temperature thermoplasticity indicates the toughness requirements of cast slabs during continuous casting. The better the thermoplasticity, the less likely the cast slab will crack. The area reduction of the curve at different test temperatures is typically used to characterize the high-temperature thermoplastic curve of the cast slab. The larger the reduction in area, the better the thermoplasticity of the cast slab and the lower the crack sensitivity. Research by Suzuki et al. [33] showed that when the reduction in area was greater than 60%, the slab showed better high-temperature plasticity, and the slab was not easy to crack. When the reduction of area was less than 60%, the plasticity of the slab was poor, and cracks were easily produced under stress. Therefore, the high-temperature thermoplastic curve is regarded as an important basis for evaluating the susceptibility of the casting slab to cracking.
Figure 7 shows the high-temperature thermoplasticity curve of high-rise structural steel with different Nb contents. In the temperature range from 1300 °C to 900 °C, the area reduction in almost all the samples was approximately greater than 70%. Only sample D had an area reduction of 60.22% at 1300 °C. However, sample D exhibited good high temperature plasticity in the temperature range of 900 °C to 800 °C. There was an obvious V-shaped plastic trough in the high temperature thermoplastic curves of the four samples, indicating that the increase in Nb content did not significantly broaden the temperature range of the third brittle zone of high-rise structural steel. At 850 °C, the reduction in area of samples A–D reached a minimum value of 55.85%, 58.34%, 62.91%, and 61.09%, respectively. At this temperature, the high-temperature plasticity of the steel was poor, and cracks were easily generated under the action of stress. The reduction in the area of sample A at different test temperatures was generally lower than that of the other samples, and the reduction in the area of sample B was higher at each test temperature. In addition, the high-temperature plasticity of the sample did not continue to improve with an increase in Nb content. Nb will not continue to improve the plasticity of the steel when the Nb content is greater than or equal to 0.05%.
It can be seen from Figure 7 that when the temperature is lower than 800 °C, that is, in the temperature range where the Nb-containing precipitates have a strengthening effect, if the Nb content is less than 0.031%, the Nb-containing precipitates can improve the strength of the steel while having little effect on its thermoplasticity. However, when the Nb content continues increasing, it has a greater impact on the reduction of area of the steel, resulting in a decrease in the plasticity of the steel. This is most likely caused by the increase in the Nb content that leads to the precipitated particles’ sizes becoming larger. Determining the specific reasons requires further analysis.

3.2.3. High Temperature Plastic Modulus Curve Analysis

The plastic modulus can accurately reflect the ability of materials to resist plastic deformation. When the slab undergoes uniform plastic deformation, the greater the plastic modulus, the easier it is to cause stress concentration. When the stress exceeds the strength limit of the slab, the slab fractures and cracks will occur. Therefore, the smaller the plastic modulus, the stronger is the ability of the cast slab to resist uniform plastic deformation.
Figure 8 shows the relationship between the plastic modulus of the sample and the temperature. As shown in the figure, in the temperature range from 1300 °C to 750 °C, the plastic modulus curves of the four samples are relatively close, and the plastic modulus decreases with the increase in temperature, and only a small range of fluctuations exist in some temperature ranges. At each test temperature, the overall plastic modulus values of the four samples are not significantly different, and the high-temperature plastic modulus of each sample is small, all less than 500 MPa (the maximum value is 494.4 MPa of sample B). This indicates that the increase in the Nb content has little effect on the high-temperature plastic modulus of the high-rise structural steel sample and did not deteriorate the resistance of the sample to plastic deformation.

3.3. Analysis of Typical Fracture and Precipitate Morphology

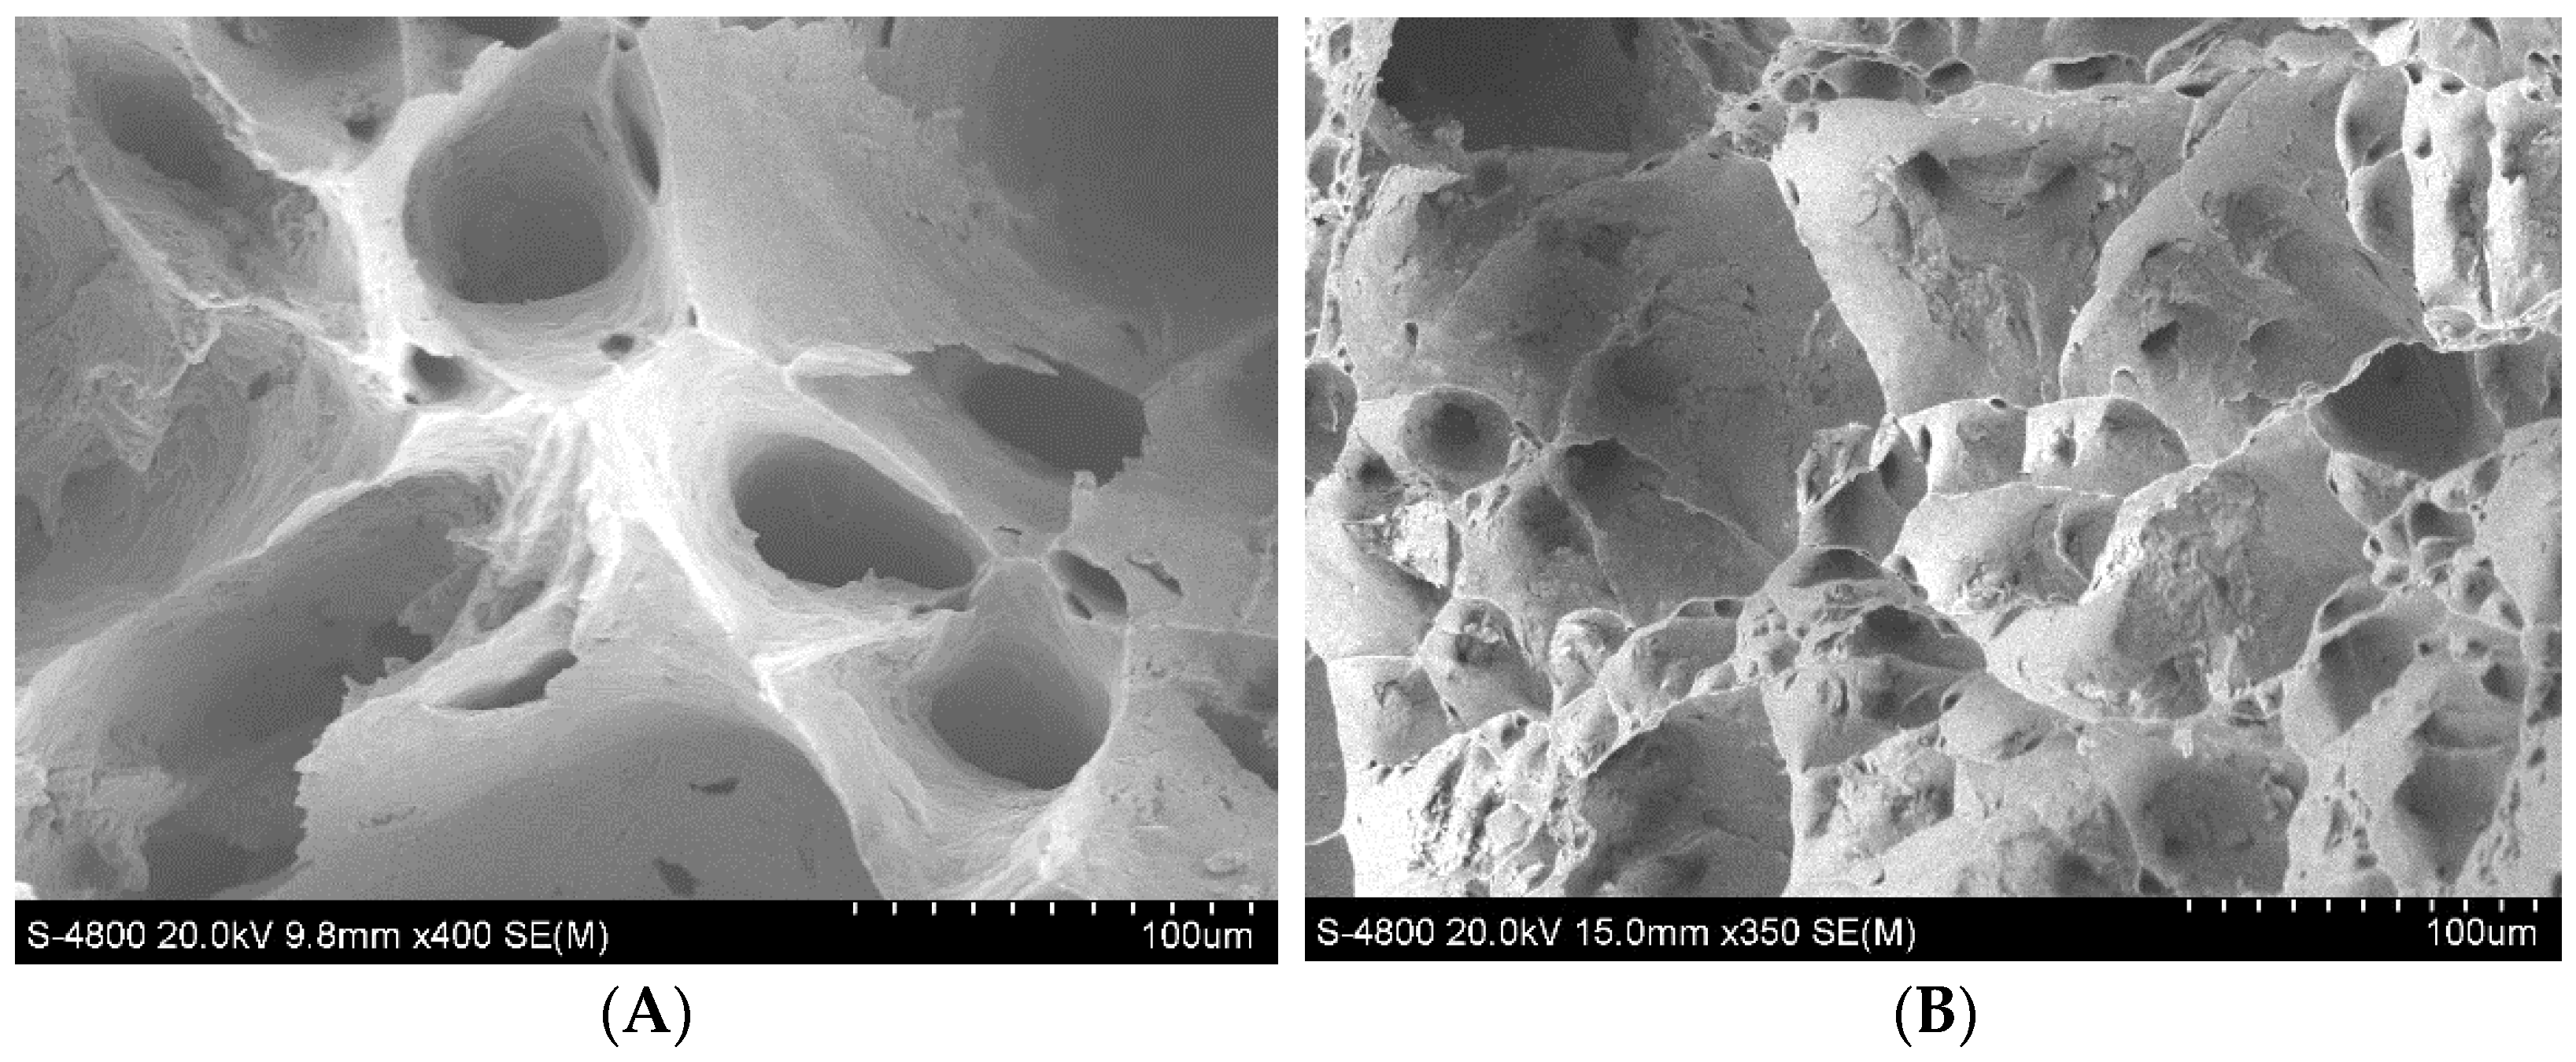
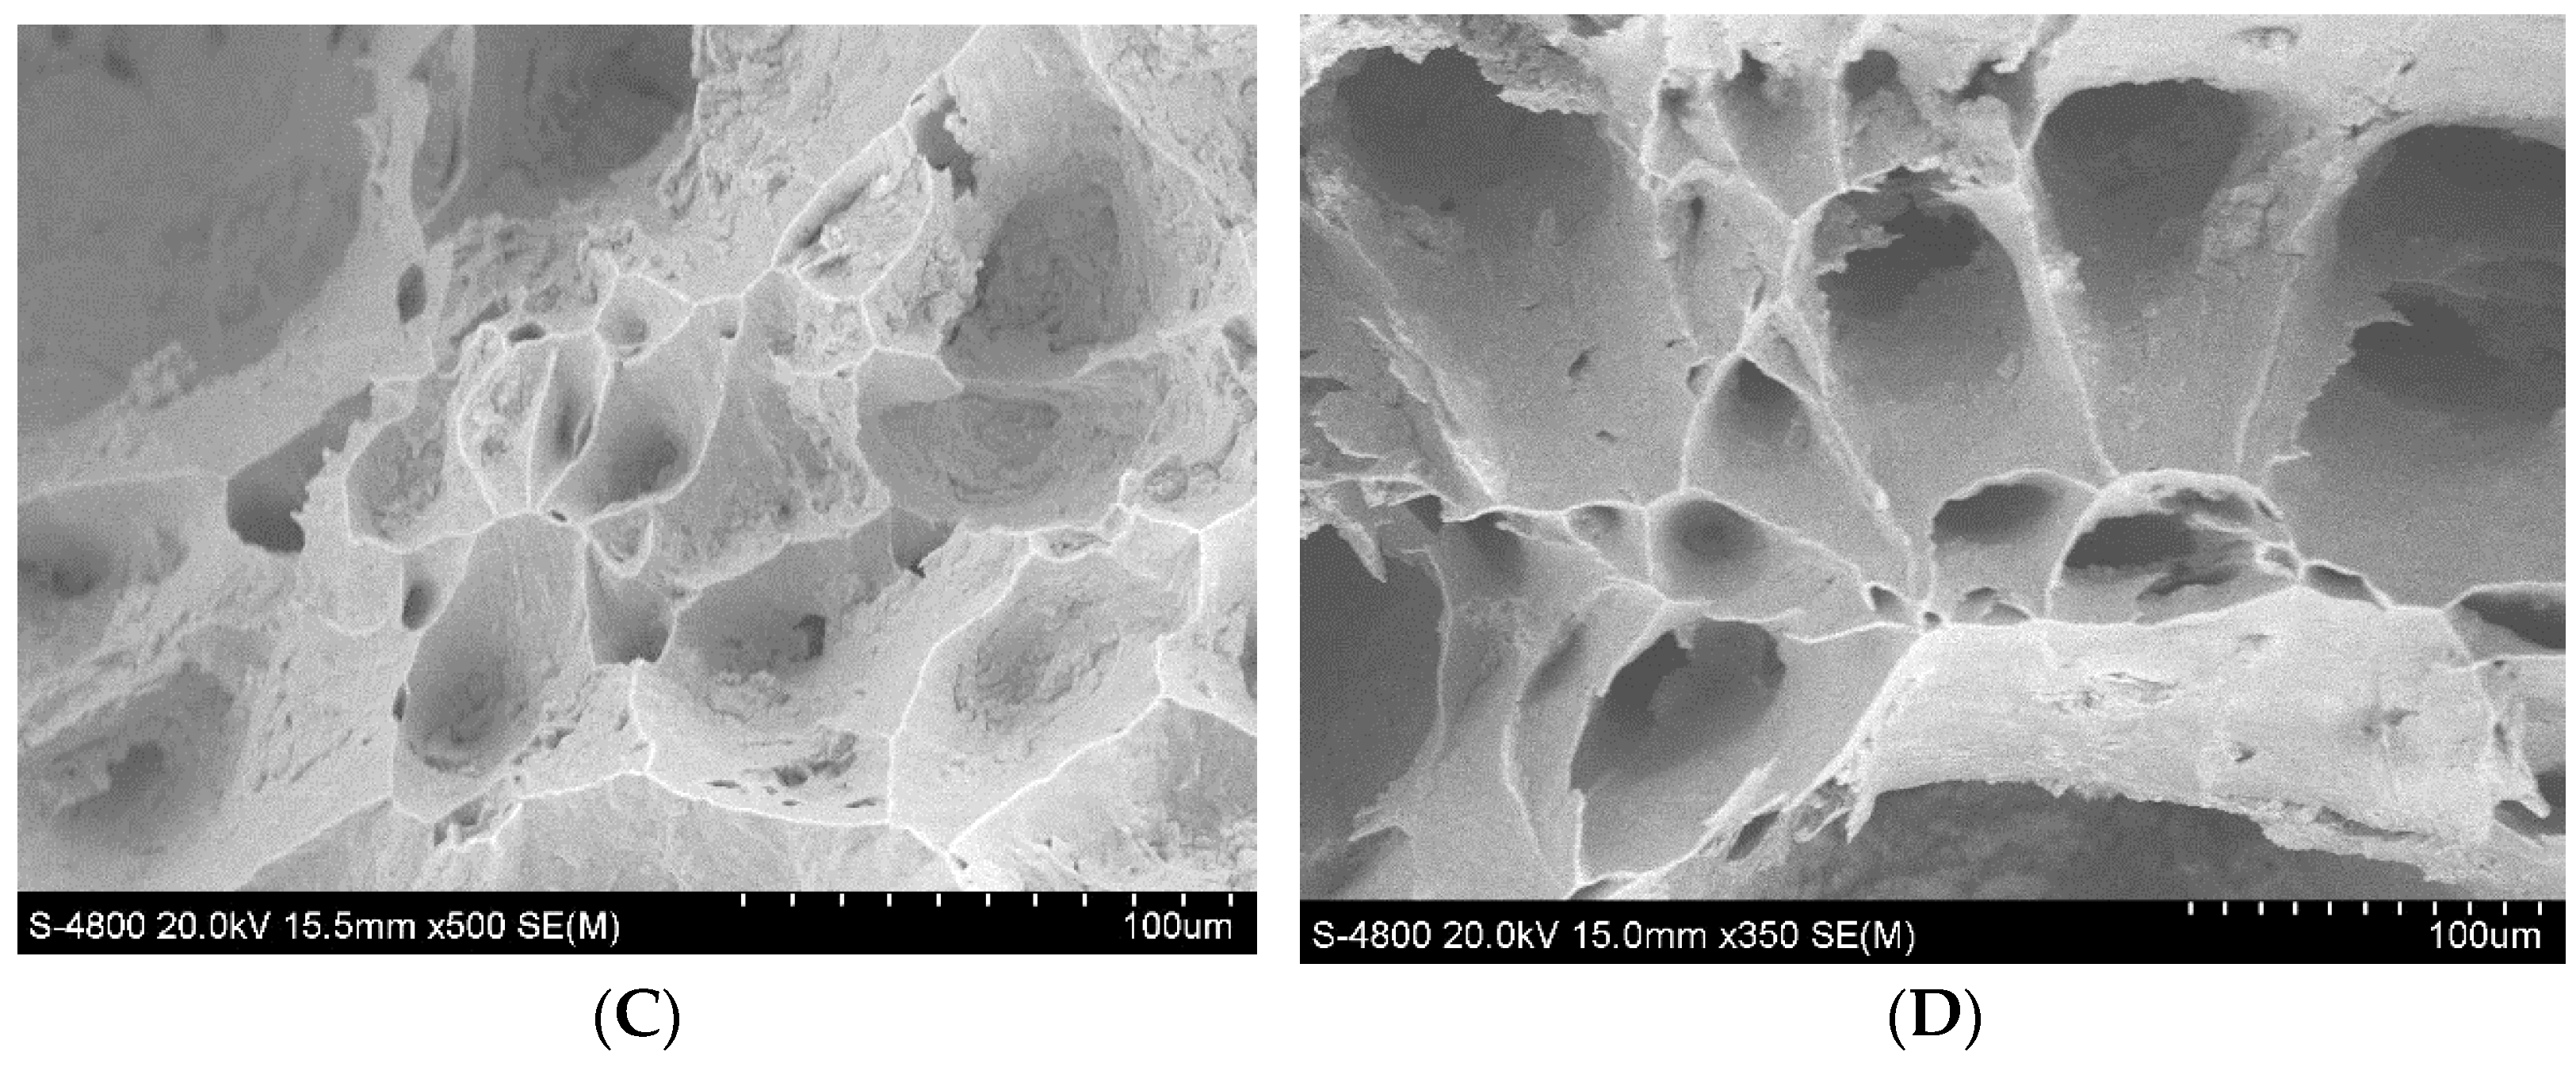
The fracture morphology of the tensile specimens is of great significance in the analysis of the fracture mechanism. Based on the high-temperature thermoplasticity and tensile strength curves of high-rise structural steel with different Nb contents, the fracture of the tensile sample at 850 °C and 1200 °C was selected, and the sample was observed using a Hitachi S-4800 field emission scanning electron microscope. Figure 9 shows the micromorphology of the fracture surface of the tensile specimen at 850 °C.
As shown in Figure 9, the four samples had dimples of different sizes at the tensile fracture at 850 °C. Granular precipitates did not appear deep in the dimples, and river patterns were present in the fractures. It can be concluded that the main fracture mode in the samples was a ductile fracture. Different types of Nb-containing precipitates were observed at the fracture surface.
The addition of Nb refines the crystal grains of high-rise structural steel and significantly improves its ability to resist stress. At 850 °C, the fracture morphologies of the four samples were also different. The dimples at the fractures of samples B–D were more numerous and smaller than those of sample A.
Figure 10 shows the microstructure near the fracture at 850 °C. Since the sample was first heated to 1350 °C during the experiment, and then the temperature test was tested under the condition that Nb carbonitrides secondary precipitation precipitated and became the core of the new phase, the original as-cast structure was greatly refined through phase transformation. The microstructure at the fracture surface was mainly composed of martensite and bainite, with a small amount of ferrite. Among them, martensite and bainite were transformed from austenite during the cooling process. In the figure, reticulated ferrites can be observed. As the C content of high-rise structural steel was approximately 0.173%, the eutectoid ferrite was formed first.
Pro-eutectoid ferrite appeared at 850 °C. This temperature was located at the plastic trough of the third brittle temperature range. When the tensile specimen is under stress, the stress tends to concentrate at the pro-eutectoid ferrite because of the low strength of ferrite at high temperatures. When the stress exceeds the strength limit of the pro-eutectoid ferrite, microvoids are generated. As the stress continues to increase, the microvoids will continue to aggregate and grow to form cracks, and finally fracture, which can also indirectly reflect the cause of brittleness in this temperature zone.

4. Analysis of Typical Precipitates

At present, many scholars conduct research mainly by means of thermodynamic kinetic calculations and solid solution-precipitation behavior of precipitated phases in steel [19,20,21]. During the cooling process of the cast slab, the solid solution and precipitation behavior of the precipitated phase is a reversible equilibrium process, and the change in temperature causes this reaction to reverse. Therefore, the thermodynamic calculation of precipitation of the precipitated phase is of great significance for the analysis of the precipitation behavior of the precipitated phase. The mainstream research method for observing the precipitation behavior of precipitated phases utilizes transmission electron microscopy observation, which can clarify the precipitation position, particle size, and overall morphology of the precipitated phases. The larger the number of precipitated phases, the greater the damage to the plasticity. The grain-shaped particles distributed in the grain boundary damage the plasticity of the steel more significantly than the uniformly distributed particles.

4.1. Thermodynamic Calculation of Nb Precipitation

Nb mainly exists in the form of Nb(C,N) in high-rise structural steel. During the controlled rolling process, the austenite grain boundary is pinned to refine the austenite grains and improve the strength and toughness of the steel. Therefore, understanding the precipitation behavior of Nb-containing precipitates in steel is key to achieving the overall performance of Nb-strengthened steel.
The phase line temperature of the solid and liquid states is mainly affected by the chemical composition of the steel, and it is a very important parameter in numerical simulations. Table 1 lists the main chemical compositions of the test steel. Equations (1) and (2) were used to calculate the solid (TS) and liquid (TL) phase line temperatures of the test steel, which were found to be 1455 °C and 1515 °C, respectively.
T S = 1538 175 ω ( C ) 280 ω ( P ) 575 ω ( S ) 40 ω ( Ti ) 20 ω ( Si ) 30 ω ( Mn ) 4.75 ω ( Ni ) 7.5 ω ( Al ) 6.5 ω ( Cr )
T L = 1535 65 ω ( C ) 30 ω ( P ) 20 ω ( Ti ) 8 ω ( Si ) 5 ω ( Mn ) 7 ω ( Cu ) 2.5 ω ( Ni ) 2.7 ω ( Al ) 2 ω ( V ) 1.7 ω ( Mo ) 1.5 ω ( Cr ) 1.7 ω ( Co ) ω ( W ) 90 ω ( N ) 5 ω ( Ce ) 6.5 ω ( Nb )
The equation of solid solubility product of NbC and NbN is as follows [34]:
lg Nb C γ = 2.206 6746 / T
lg [ Nb ] [ N ] γ = 2.394 9076 / T
lg Nb C α = 5.137 11013 / T
lg Nb N α = 4.383 10249 / T
where [Nb], [C], and [N] are the mass fractions of Nb, C, and N in austenite and ferrite, respectively. The mass fractions of Nb, C, and N in the samples are listed in Table 3, where T is the temperature (°C).
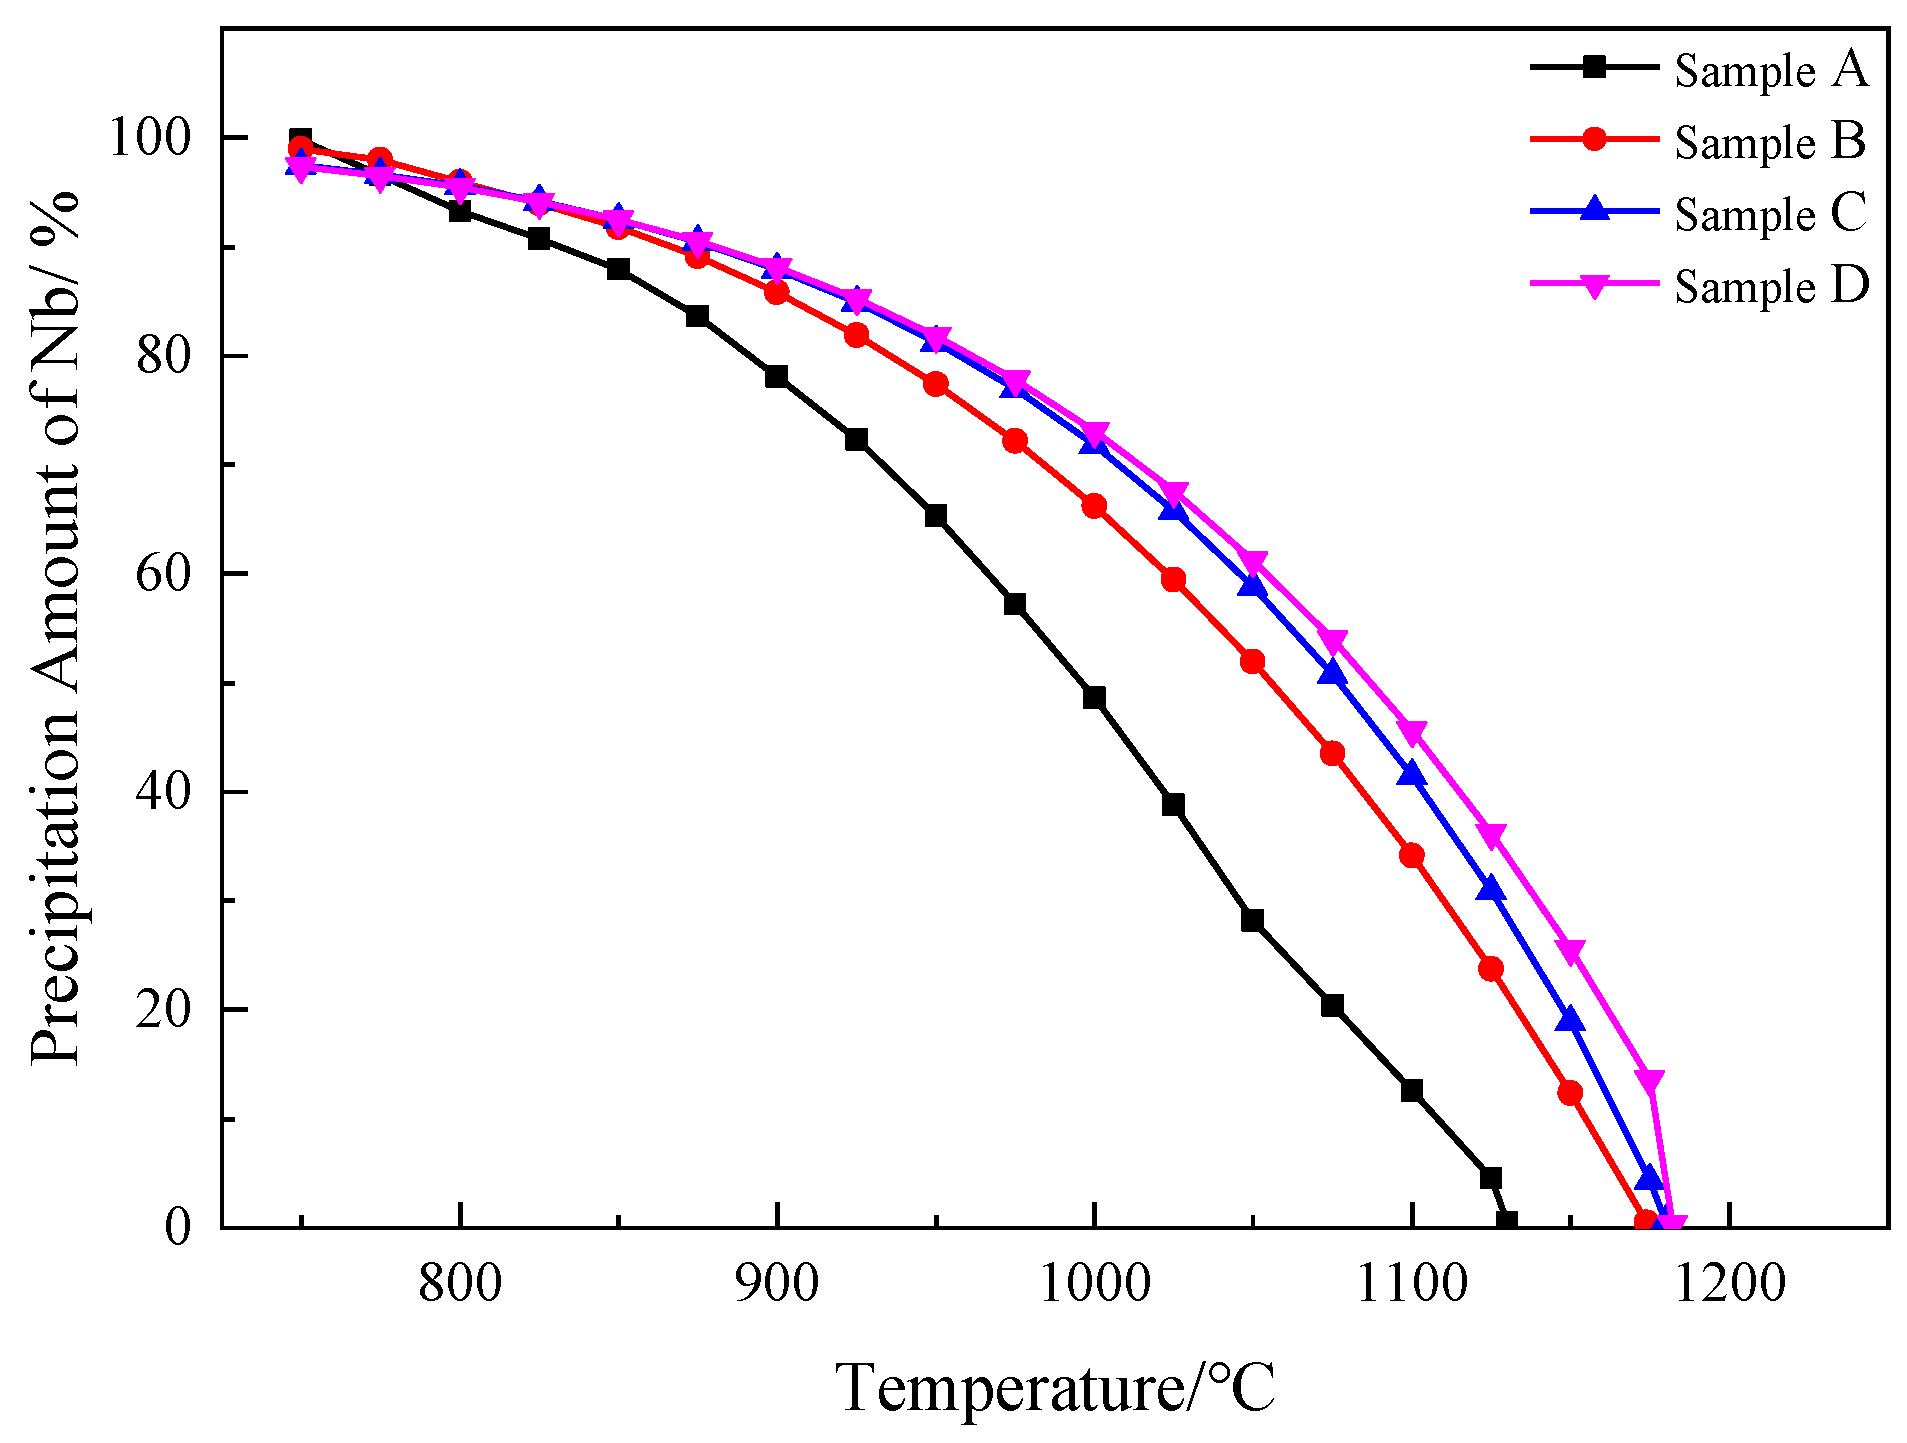
The calculated value of the solid solubility of the Nb compound was processed, and the relationship between the precipitation amount of Nb and the temperature was obtained, as shown in Figure 11. In the figure, the overall trend of the precipitation amount of the Nb compound with temperature in the four samples is roughly the same, and the amount of Nb compound precipitation gradually increases with the decrease in temperature.
Although the Nb content in the four samples is different, at 750 °C, the precipitation amounts of Nb compound in samples A–D are 99.78%, 98.97%, 97.47%, and 97.34%, respectively. Almost all of the Nb content is precipitated. The increase in the Nb content increases the initial precipitation temperature of the compound. At the same temperature, the increase in the Nb content promotes the precipitation of the Nb compound.
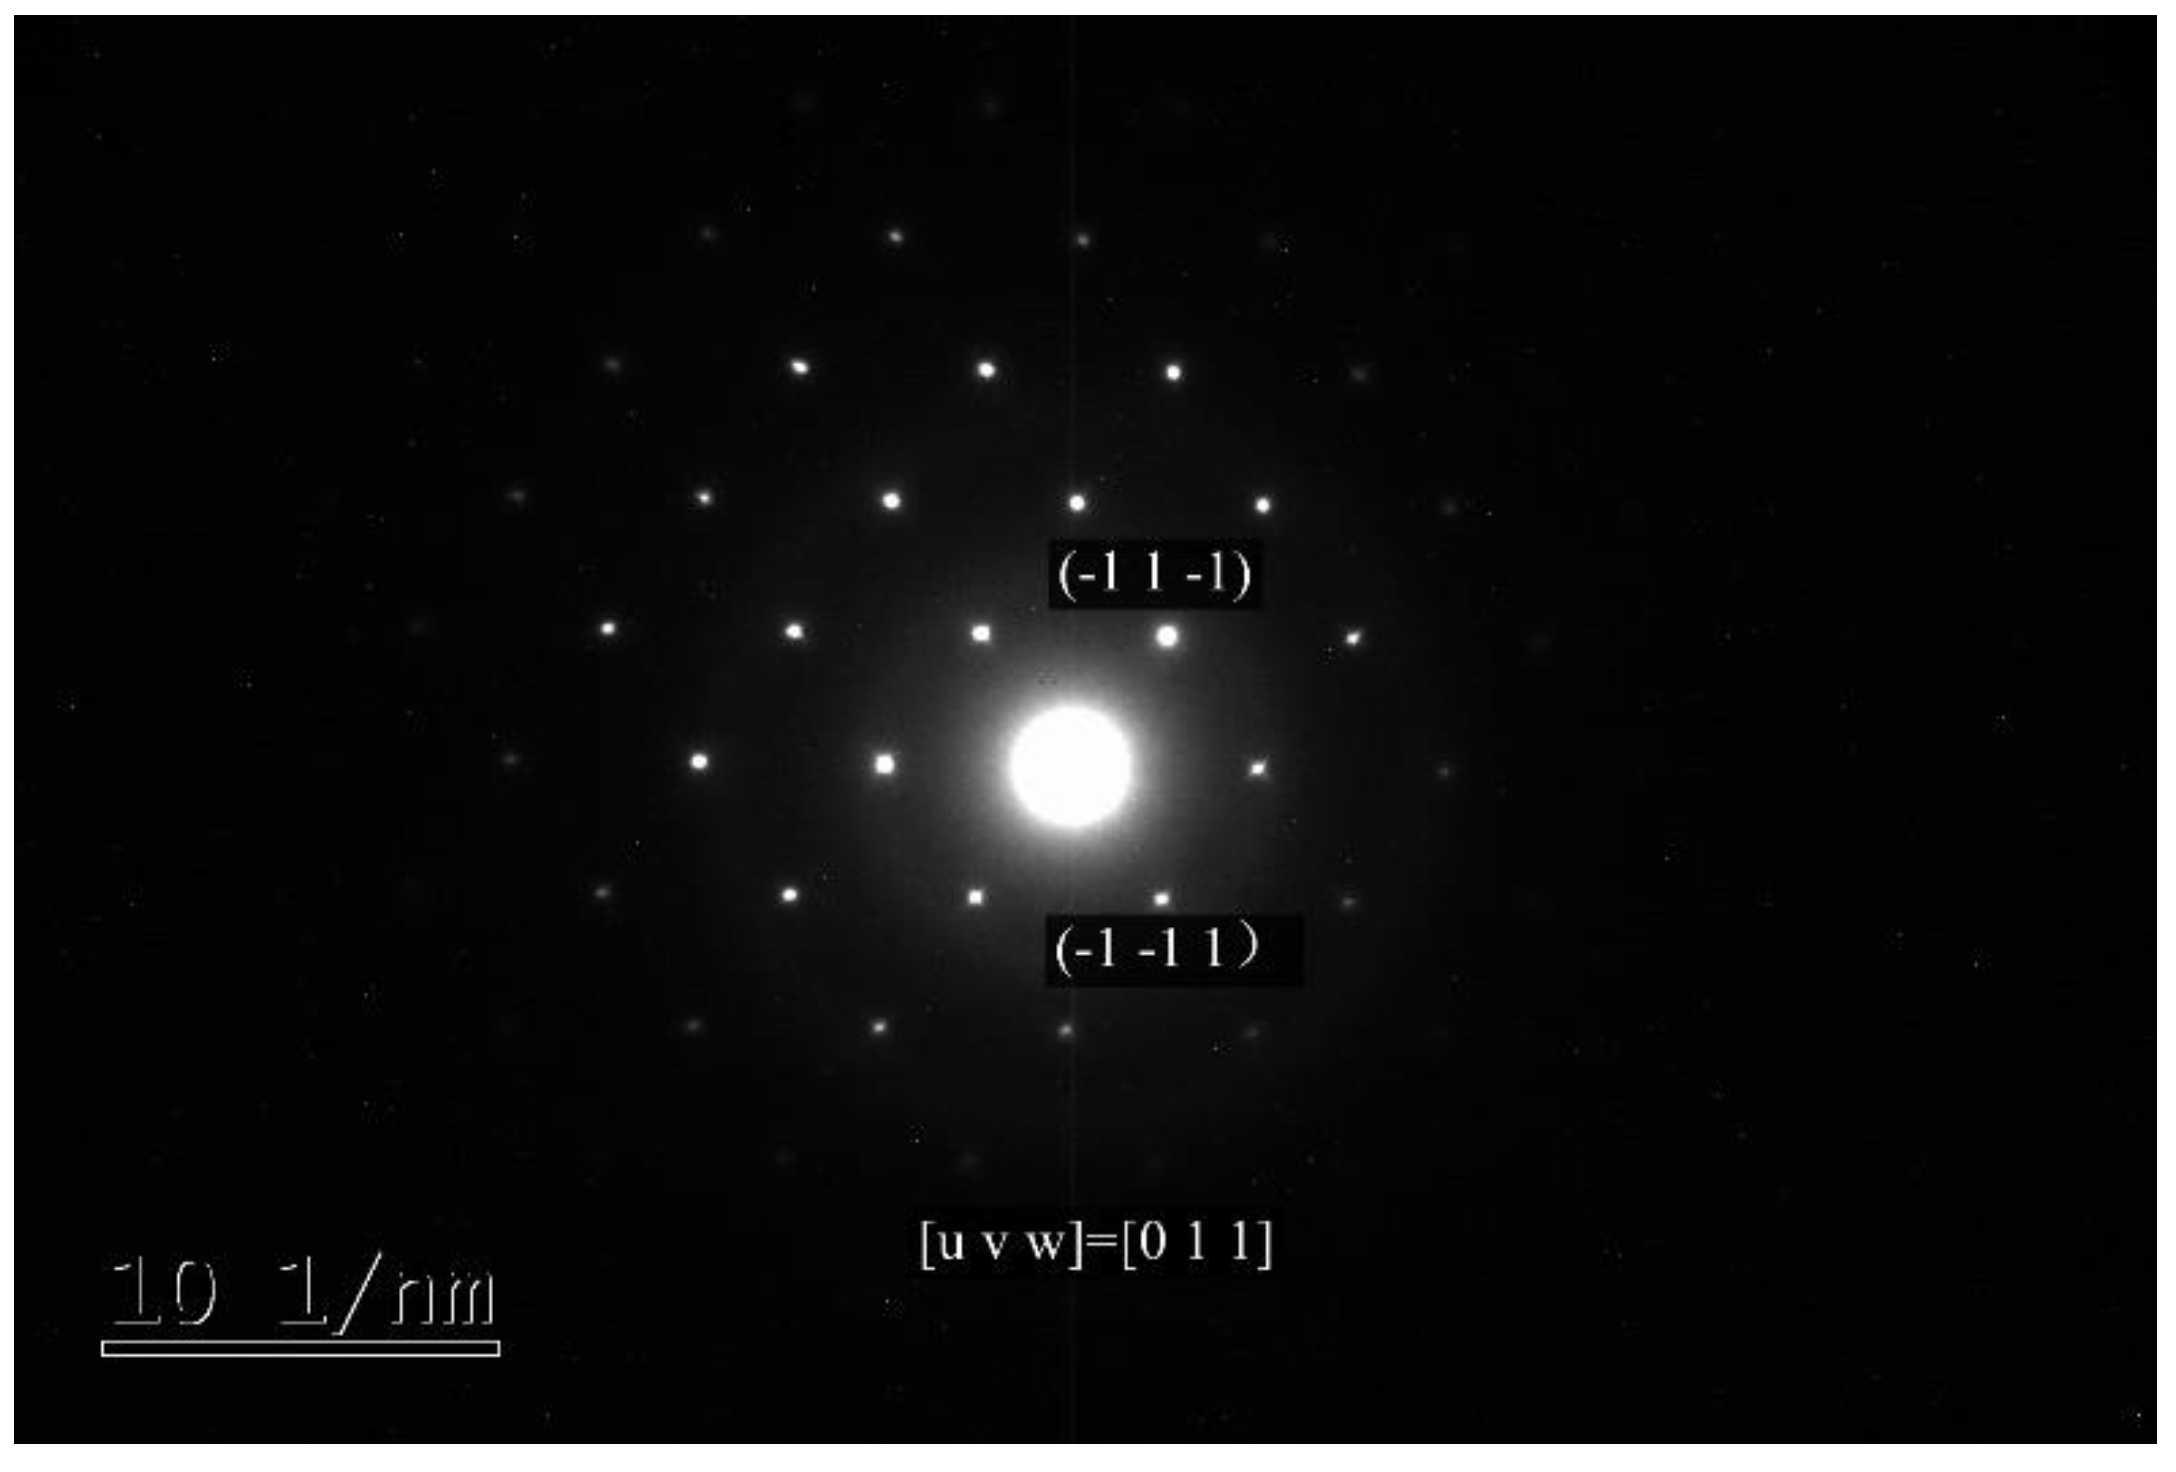
As shown in Figure 12, a typical single crystal precipitate of Nb(C,N) with a ribbon axis of [0 1 1] can be obtained [35,36,37,38]. It can be seen that Nb(C,N) has a face-centered cubic structure, which is consistent with the crystal form of NaCl. Therefore, multiple precipitates are infinitely miscible with each other. As the amount of precipitated phase increases, the size of the precipitated phase also increases.

4.2. Analysis of Precipitated Phase Precipitates

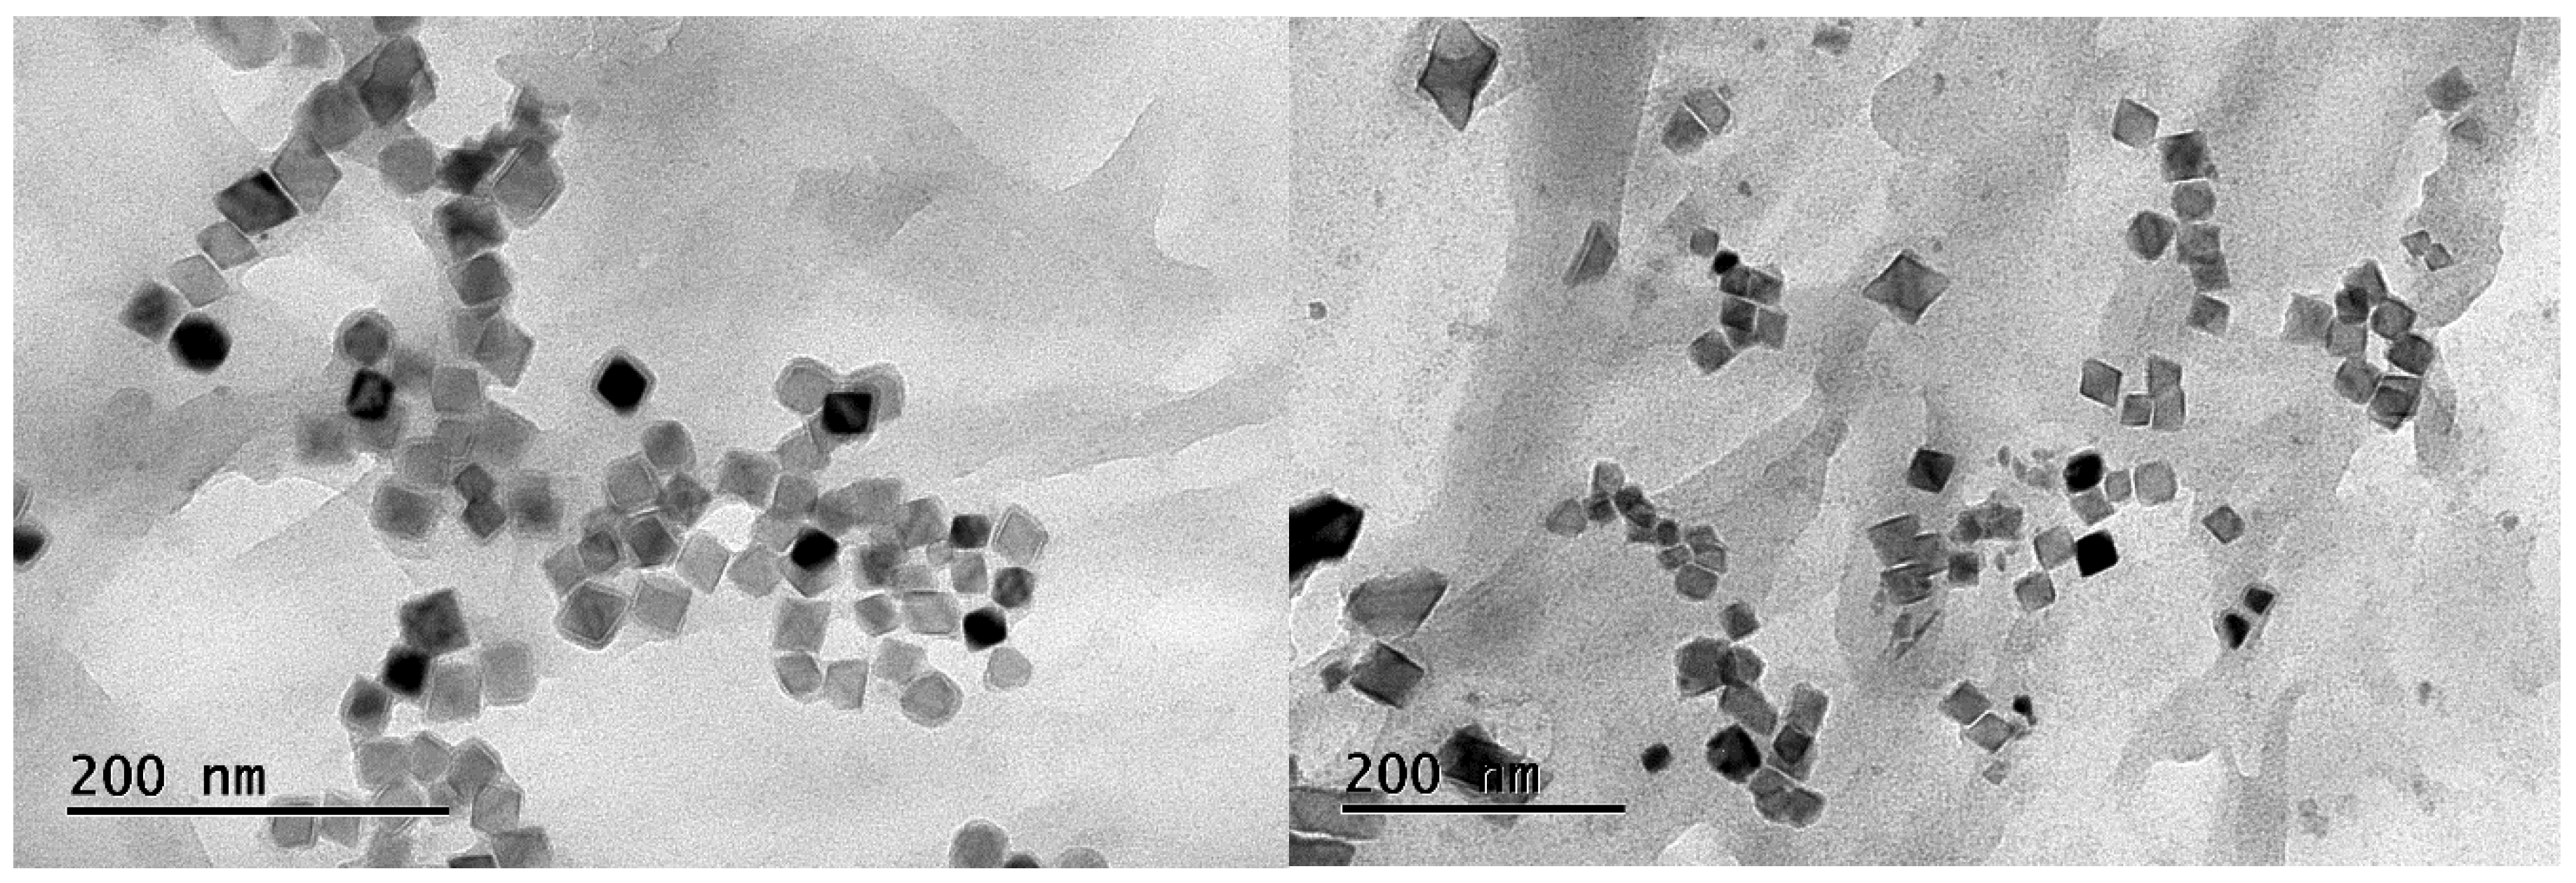
Figure 13 shows the typical morphology of the Nb-containing precipitates. Most of the precipitated phases in the samples were square and star-shaped.
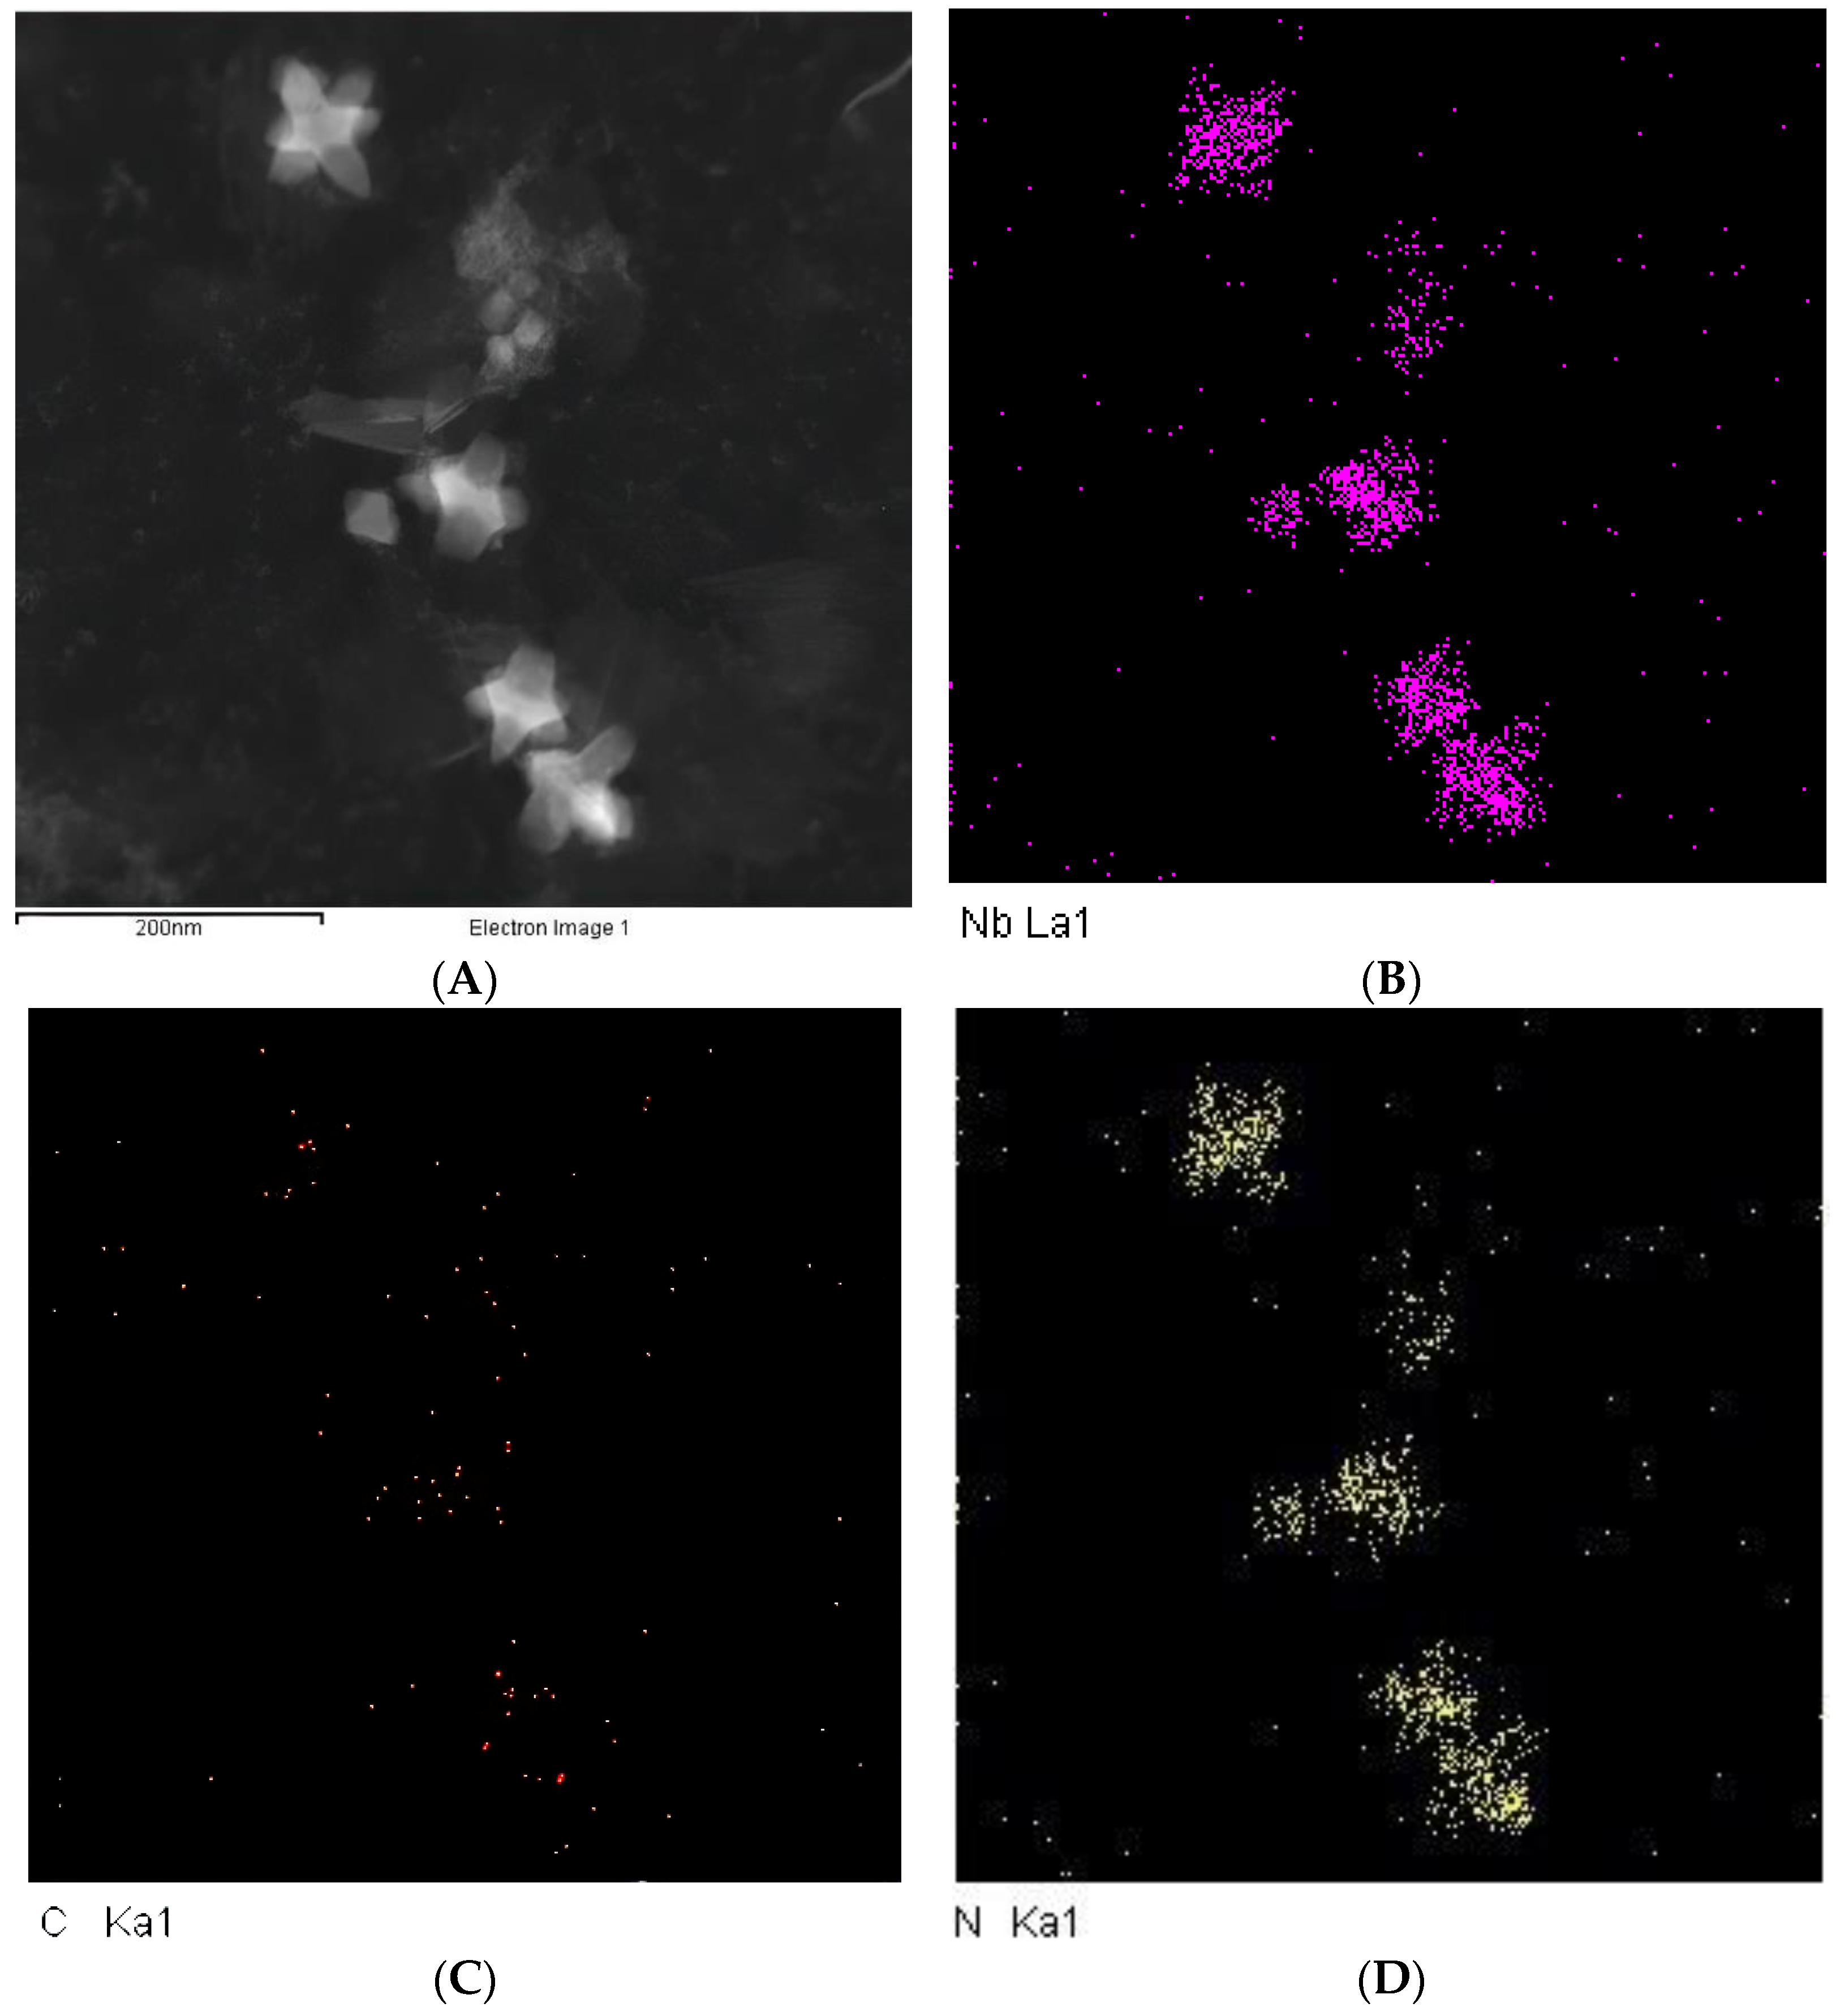
The components of the square and star-shaped precipitates were analyzed by transmission electron microscopy (TEM), and the results are shown in Figure 14. Both types of precipitated phases are Nb carbonitrides. During the heat treatment at 1200 °C and 1100 °C and the subsequent cooling process, the Nb(C,N) precipitated in the sample matrix continuously precipitated and grew, and finally formed Nb(C,N), which made the morphology of the Nb precipitated phase appear different. Thus, the precipitates appeared in the shape of a regular square or star.

4.3. Size Distribution of Nb-Containing Two-Phase Particles in the Samples

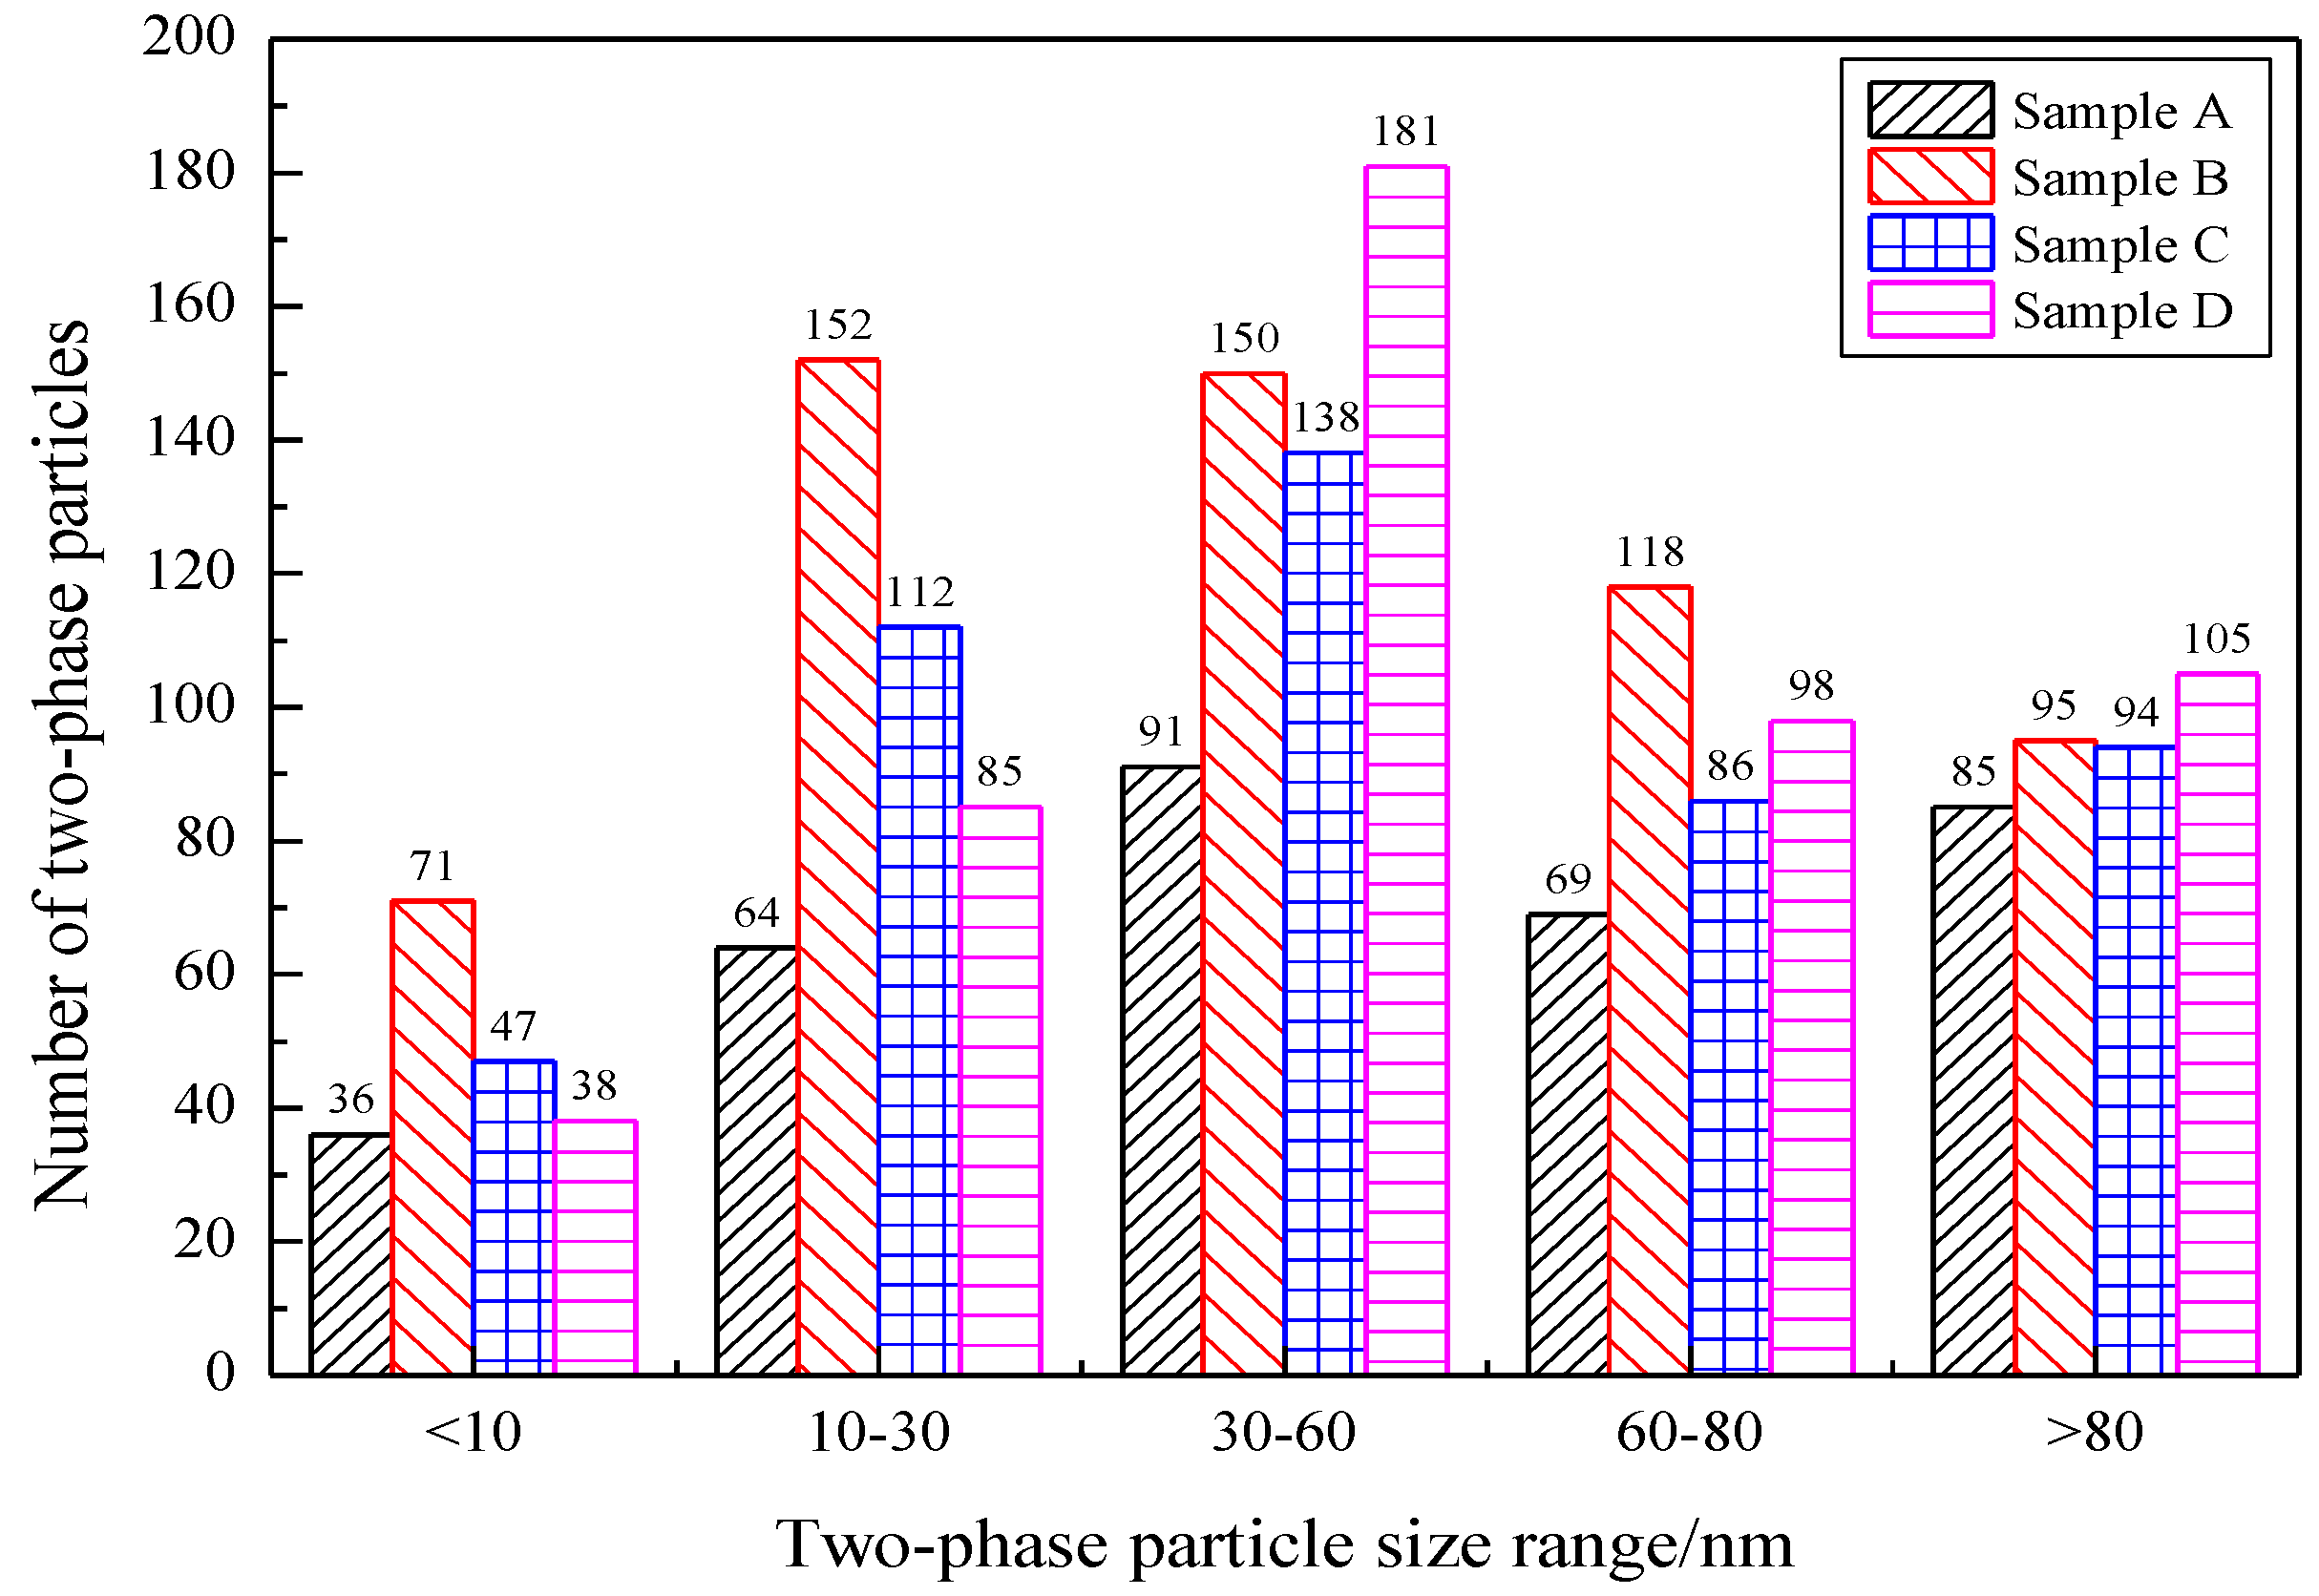
The number of two-phase particles in the micro-morphology of the two-phase particles was counted. Figure 15 shows the size distribution of precipitates in the sample, and Table 4 shows the statistics of large-sized precipitates in the sample. The results show that the total numbers of two-phase particles in samples A–D was 345, 506, 471, and 489 respectively. The number of two-phase particles precipitated in samples B–D was significantly higher than that in sample A. Since there was little difference in the content of other elements in the sample, it hardly affected the precipitation of the two-phase particles, so the change in the precipitation of Nb(C,N) could reflect the overall change in the precipitation of the two-phase particles in the sample.
The statistical results of the size of the precipitated two-phase particles show that the size of the two-phase particles was mainly concentrated in 10 nm–80 nm, and the large-size (>80 nm) two-phase particles in samples A–D only accounted for the total number of precipitated phases, namely 24.64%, 16.21%, 19.14%, and 25.67%, which provides favorable conditions for the two-phase particles to give full play to their second-phase strengthening. In sample B, the proportion of small-sized (<80 nm) two-phase particles was larger, and the distribution in the matrix was more dispersed and uniform, which is more effective in improving the overall performance of high-tech steel. Combining the test results of high temperature mechanical properties of high-built steels with different Nb contents, the high temperature strength and high temperature thermoplasticity of sample B were better than other samples, reflecting that the strengthening effect of the two-phase particles in sample B is better than other samples.

5. Conclusions

The high-temperature mechanical properties and precipitation of different Nb contents of high-rise structural steel were systematically studied using a Gleeble-3500 thermal simulation experimental machine, an optical microscope, and a transmission electron microscope, and the following conclusions were obtained:
(1)
Among the high-rise structural steel samples containing different amounts of Nb, the microstructures were observed to be the smallest, the distribution of the microstructures was observed to be more uniform, and the best high-temperature strength performance was obtained when the Nb content was 0.031%. In this case, the average size of ferrite was observed to be 17.36 μm. When the Nb content was further increased to 0.05%, the microstructure of the steel began to become coarse.
(2)
The high plastic temperature range of high-rise structural steel is from 1300 °C to 900 °C. At 850 °C, the reduction in the area of the four samples A–D reaches its minimum values, which were 55.85%, 58.34%, 62.91%, and 61.09%, respectively. At 850 ℃, the formation of pro-eutectoid ferrite and the precipitation of precipitates were the main reasons for the fracture of the sample.
(3)
From thermodynamic calculations, we found that almost all of the Nb compounds precipitated in the four samples at 750 °C. The increase in Nb content was found to increase the onset temperature of the Nb compounds. After heat treatment at 1100 °C and 1200 °C, the precipitated phases were mainly square and star-shaped Nb(C,N) composites.

Author Contributions

J.Z. conducted the research and results analysis under the supervision of L.Z., L.S. and P.X. contributed to design of the experiments and morphology analysis during the research activities, and B.W. contributed to image processing and data calculation. All authors have read and agreed to the published version of the manuscript.

Funding

This work was supported by the National Natural Science Foundation of China (Grant Numbers 51804125, 51904107, and 52004093), and Fundamental scientific research business expenses of colleges and universities in Hebei Province (Grant number: JQN2021017), Science and Technology Research Project of Hebei Province Colleges and Universities (Grant number: BJ2019041).

Data Availability Statement

Not applicable.

Conflicts of Interest

The authors declare no conflict of interest.

References

  1. Zhang, C.; Jia, B.; Wang, J. Influence of artificial cooling methods on post-fire mechanical properties of Q355 structural steel. Constr. Build. Mater. 2020, 252, 119092. [Google Scholar] [CrossRef]
  2. Outinen, J.; Mkelinen, P. Mechanical properties of structural steel at elevated temperatures and after cooling down. Fire Mater. 2004, 28, 237–251. [Google Scholar] [CrossRef]
  3. Ullah, S.H.; Ravi, K. Influence of stress concentration and cooling methods on post-fire mechanical behavior of ASTM A36 steels. Constr. Build. Mater. 2018, 186, 920–945. [Google Scholar]
  4. Sajid, H.U.; Kiran, R. Post-fire mechanical behavior of ASTM A572 steels subjected to high stress triaxialities. Eng. Struct. 2019, 191, 323–342. [Google Scholar] [CrossRef]
  5. DeArdo, A.J. Niobium in modern steels. Int. Mater. Rev. 2003, 48, 371–402. [Google Scholar] [CrossRef]
  6. Pradhan, N.; Banerjee, N.; Reddy, B.B.; Sahay, S.K.; Viswanathen, C.S.; Bhor, P.K.; Basu, D.S.; Mazumdar, S. Control of transverse cracking in special quality slabs. Ironmak. Steelmak. 2001, 28, 305–311. [Google Scholar] [CrossRef]
  7. Abushosha, R.; Ayyad, S.; Mintz, B. Influence of cooling rate on hot ductility of C-Mn-Al and C-Mn-Nb-Al steels. Mater. Sci. Technol. 1998, 14, 346–351. [Google Scholar] [CrossRef]
  8. Banks, K.; Koursaris, A.; Verdoorn, F.F.; Tuling, A. Precipitation and hot ductility of low C-V and low C-V-Nb microalloyed steels during thin slab casting. Mater. Sci. Technol. 2001, 17, 1596–1604. [Google Scholar] [CrossRef]
  9. Mintz, B.; Abushosha, R. The influence of vanadium on hot ductility of steel. Ironmak. Steelmak. 1993, 20, 445–452. [Google Scholar]
  10. Abushosha, R.; Comineli, O.; Mintz, B. Influence of Ti on hot ductility of C-Mn-Al steels. Mater. Sci. Technol. 1999, 15, 278–286. [Google Scholar] [CrossRef]
  11. Comineli, O.; Abushosha, R.; Mintz, B. Influence of Ti and Nb on the hot ductility of C-Mn-Nb-Al. Mater. Sci. Technol. 1999, 15, 1058–1068. [Google Scholar] [CrossRef]
  12. Spradbery, C.; Mintz, B. Influence of undercooling thermal cycle on hot ductility of C-Mn-Al-Ti and C-Mn-Nb-Al-Ti steels. Ironmak. Steelmak. 2005, 32, 319–324. [Google Scholar] [CrossRef]
  13. Abushosha, R.; Vipond, R.; Mintz, B. The influence of Ti on hot ductility of as cast steels. Mater. Sci. Technol. 1991, 7, 613–621. [Google Scholar] [CrossRef]
  14. Mintz, B.; Abushosha, R.; Crowther, D.N. The influence of small additions of Cu and Ni on the hot ductility of steels. Mater. Sci. Technol. 1995, 11, 474–481. [Google Scholar] [CrossRef]
  15. Yasumoto, K.; Maehara, Y.; Ura, S. Effect of Sulphur on Hot Ductility of Low-carbon Steel Austenite. Mater. Sci. Technol. 1985, 1, 111–116. [Google Scholar] [CrossRef]
  16. Ma, F.; Wen, G.; Tang, P.; Yu, X.; Li, J.; Xu, G.; Mei, F. Causes of corner transversal cracks of micro-alloyed steel in the vertical-bending continuous slab casters. Ironmak. Steelmak. 2010, 37, 73–79. [Google Scholar] [CrossRef]
  17. Maehara, Y.; Ohmori, Y. The precipitation of AlN and NbC and the hot ductility of low carbon steel. Mater. Sci. Eng. 1984, 62, 109–119. [Google Scholar] [CrossRef]
  18. Miao, C.L.; Shang, C.J.; Zhang, G.D.; Subramanian, S.V. Recrystallization and strain accumulation behaviors of high Nb-bearing line pipe steel in plate and strip rolling. Mater. Sci. Eng. A 2010, 527, 4985–4992. [Google Scholar] [CrossRef]
  19. Gong, P.; Palmiere, E.J.; Rainforth, W.M. Dissolution and precipitation behaviour in steels microalloyed with niobium during thermomechanical processing. Acta Mater. 2015, 97, 392–403. [Google Scholar] [CrossRef]
  20. Campos, S.S.; Kestenbach, H.J.; Morales, E.V. On strengthening mechanisms in commercial Nb-Ti hot strip steels. Metall. Mater. Trans. A 2001, 32, 1245–1248. [Google Scholar] [CrossRef]
  21. Sharma, R.C.; Lakshmanan, V.K.; Kirkaldy, J.S. Solubility of niobium carbide and niobium carbonitride in alloyed austenite and ferrite. Metall. Trans. A 1984, 15, 545–553. [Google Scholar] [CrossRef]
  22. Hong, S.G.; Jun, H.J.; Kang, K.B.; Park, C.G. Evolution of precipitates in the Nb–Ti–V microalloyed HSLA steels during reheating. Scr. Mater. 2003, 48, 1201–1206. [Google Scholar] [CrossRef]
  23. Suzuki, H.G.; Nishimura, S.; Yamaguchi, S. Characteristics of hot ductility in steels subjected to the melting and solidification. Trans. Iron Steel Inst. Jpn. 1982, 22, 48–56. [Google Scholar] [CrossRef]
  24. Mintz, B.; Abushosha, R. Effectiveness of hot tensile test in simulating straightening in continuous casting. Met. Sci. J. 2013, 8, 171–178. [Google Scholar] [CrossRef]
  25. Li, X.L.; Wu, P.; Yang, R.J.; Zhao, S.T.; Zhang, S.P.; Chen, S.; Cao, X.Z.; Wang, X.M. Nb segregation at prior austenite grain boundaries and defects in high strength low alloy steel during cooling. Mater. Des. 2017, 115, 165–169. [Google Scholar] [CrossRef]
  26. Yu, Q.B.; Wang, Z.D.; Liu, X.H.; Wang, G.D. Effect of microcontent Nb in solution on the strength of low carbon steels. Mater. Sci. Eng. A 2004, 379, 384–390. [Google Scholar] [CrossRef]
  27. Wu, H.; Ju, B.; Tang, D.; Hu, R.; Guo, A.; Kang, Q.; Wang, D. Effect of Nb addition on the microstructure and mechanical properties of an 1800MPa ultrahigh strength steel. Mater. Sci. Eng. A 2015, 622, 61–66. [Google Scholar] [CrossRef]
  28. Mabuchi, H.; Uemori, R.; Fujioka, M. The role of Mn depletion in intragranular ferrite transformation in the heat affected zone of welded joints with large heat input in structural steels. ISIJ Int. 1996, 36, 1406–1412. [Google Scholar] [CrossRef]
  29. Shim, J.H.; Byun, J.S.; Cho, Y.W.; Oh, Y.J.; Shim, J.D.; Lee, D.N. Hot deformation and acicular ferrite microstructure in C-Mn steel containing Ti2O3 inclusions. ISIJ Int. 2000, 40, 819–823. [Google Scholar] [CrossRef] [Green Version]
  30. Chen, C.Y.; Yen, H.W.; Kao, F.H.; Li, W.C.; Huang, C.Y.; Yang, J.R.; Wang, S.H. Precipitation hardening of high-strength low-alloy steels by nanometer-sized carbides. Mater. Sci. Eng. A 2009, 499, 162–166. [Google Scholar] [CrossRef]
  31. Gregg, J.M.; Bhadeshiah, K.D.H. Solid-state nucleation of acicular ferrite on minerals added to molten steel. Acta Mater. 1997, 45, 739–748. [Google Scholar] [CrossRef]
  32. Kurebayashi, Y. Influence of carbo-nitride precipitates on austenite grain coarsening behavior during carburizing. Denki-Seiko 1996, 67, 26–33. [Google Scholar] [CrossRef]
  33. Suzuki, H.G.; Nishimura, S.; Yamaguchi, S. Characteristics of embrittlement in steels above 600 °C. Tetsu-Hagane 1979, 65, 2038–2046. [Google Scholar] [CrossRef] [Green Version]
  34. Balasubramanian, K.; Kirkaldy, J.S. Thermodynamics of Fe-Ti-C and Fe-Nb-C austenites and nonstoichiometric titanium and niobium carbides. Adv. Phase Transit. 1988, 51, 37–51. [Google Scholar]
  35. Sun, C.; Fang, Y.; Wang, Y.; Liu, W.; Pan, H. Effect of coiling temperature on precipitation of second phase in ultra-low carbon T-3 CA steel. Iron Steel 2019, 54, 83–87. [Google Scholar]
  36. Sun, Y.H.; Dong, J.J.; Jin, J.N.; Fu, S.P.; Zhu, X.Z. Precipitation behavior of the second phase particles at secondary cooling temperature fluctuations zone with temperature fluctuations. Chin. J. Eng. 2016, 38, 90–95. [Google Scholar]
  37. Chen, J.; Shuai, T.; Liu, Z.; Wang, G. Influence of molybdenum content on transformation behavior of high performance bridge steel during continuous cooling. Mater. Des. 2013, 49, 465–470. [Google Scholar] [CrossRef]
  38. Zhou, X.; Liu, C.; Yu, L.; Liu, Y.; Li, H. Phase transformation behavior and microstructural control of high-cr martensitic/ferritic heat-resistant steels for power and nuclear plants: A review. J. Mater. Sci. Technol. 2015, 31, 235–242. [Google Scholar] [CrossRef]
Figure 1. Size of the sample used in the high-temperature tensile test (mm).
Metals 11 01721 g001
Figure 2. Schematic diagram of the simulated heat treatment scheme for the steel investigated.
Metals 11 01721 g002
Figure 3. Microstructure of samples (AD).
Metals 11 01721 g003aMetals 11 01721 g003b
Figure 4. Particle size distribution in the microstructure of various high-rise structural steel samples. (a) Ferrite particle size distribution, (b) pearlite particle size distribution.
Metals 11 01721 g004
Figure 5. Tensile strength curve of high-rise structural steel with different Nb content.
Metals 11 01721 g005
Figure 6. Yield strength curve of high-rise structural steel with different Nb contents.
Metals 11 01721 g006
Figure 7. High-temperature thermoplastic curves of high-rise structural steel with different Nb contents.
Metals 11 01721 g007
Figure 8. The relationship between the plastic modulus of high-rise structural steel with different Nb contents and temperatures.
Metals 11 01721 g008
Figure 9. Electron microscopy images of the morphology of the fracture surface of the tensile speci-mens of the samples (AD) at 850 °C.
Metals 11 01721 g009aMetals 11 01721 g009b
Figure 10. The microstructure of the fracture surface of the tensile specimen of the samples (AD) at 850 °C.
Metals 11 01721 g010aMetals 11 01721 g010b
Figure 11. The relationship between the precipitation of Nb and the temperature.
Metals 11 01721 g011
Figure 12. Electron diffraction pattern of Nb precipitate.
Metals 11 01721 g012
Figure 13. Typical morphology of Nb-containing precipitates.
Metals 11 01721 g013
Figure 14. Analysis of the precipitated phase composition using transmission electron microscopy. (A) Typical Nb(C,N) morphology; (B) Distribution of Nb in the typical precipitates; (C) Distribution of C in the typical precipitates; (D) Distribution of N in the typical precipitates.
Metals 11 01721 g014
Figure 15. The size distribution of the precipitated phases in the sample.
Metals 11 01721 g015
Table 1. Chemical composition of high-rise structural steel with different Nb contents (wt%).
CSiMnPSNbTi
A0.1730.2061.5670.0140.0090.0060.029
B0.1750.2021.5550.0140.0080.0310.026
C0.1750.2101.5460.0140.0080.0500.027
D0.1730.2081.5570.0140.0080.0650.026
Table 2. Average grain size of ferrite and pearlite (μm).
ClassificationABCD
Ferrite25.6917.3620.7322.63
Pearlite23.9616.2819.1221.17
Table 3. The mass fraction of Nb, C, and N in the sample (wt%).
GroupNbCN
A0.0060.1730.0060
B0.0310.1750.0055
C0.0500.1750.0056
D0.0650.1730.0058
Table 4. Statistics of large-size precipitates in the sample.
ClassificationABCD
Number of two-phase particles345506471489
Particle size > 80 nm accounted for (%)24.6416.2119.1425.67
Publisher’s Note: MDPI stays neutral with regard to jurisdictional claims in published maps and institutional affiliations.