Abstract
Powder mixed electrical discharge machining (PM-EDM) is a technological advancement in electrical discharge machining (EDM) processes where fine powder is added to dielectric to improve the machining rate and surface quality. In this paper, machining of Nimonic-90 was carried out using fabricated PM-EDM, setup by adding silicon powder to kerosene oil. The influence of four input process parameters viz. powder concentration (PC), discharge current (IP), spark on duration (SON), and spark off duration (SOFF) has been investigated on surface roughness and recast layer thickness. L9 Taguchi orthogonal and grey relational analysis have been employed for experimental design and multi-response optimization, respectively. With the addition of silicon powder to kerosene oil, a significant decrease in surface roughness and recast layer thickness was noticed, as compared to pure kerosene. Spark on duration was the most significant parameter for both surface roughness and the recast layer thickness. The minimum surface roughness (3.107 µm) and the thinnest recast layer (14.926 μm) were obtained at optimum process parameters i.e., PC = 12 g/L, IP = 3 A, SON = 35 μs, and SOFF = 49 μs using grey relational analysis.
1. Introduction
Nimonic-90 is a nickel-cobalt-chromium based superalloy used at high temperature applications in aerospace, defense, marine, nuclear, and power plant industries. Nimonic-90 superalloy is used for the manufacturing of components including exhaust re-heaters, ring sections, jet engines, turbine blades, and hot working tools. This is due to its excellent mechanical properties, namely its good corrosion resistance and high creep, rupture strength, and chemical resistance. However, the conventional machining of Nimonic-90 reported certain difficulties such as built-up-edge formation, localization of shear stress, premature notching of tools, and burr formation due to its low thermal conductivity and high melting point [1,2,3,4]. Thus, advanced machining processes, namely laser beam, abrasive water jet, electron beam, and electrical discharge machining (EDM), were employed to overcome such difficulties faced by conventional machining. Among these non-conventional machining processes, EDM offers reasonable attention on the machining of Nimonic-90, regardless of material hardness and complex profiles with higher automation [5,6]. In the EDM process, material is removed by electrical spark due to melting and evaporation when both electrodes are immersed in dielectric. However, due to low the machining rate and surface quality, EDM has been limited to industrial-related applications [7,8,9,10]. Thus, powder mixed EDM (PM-EDM), as a hybrid machining process, was developed to machine difficult-to-cut materials. In the PM-EDM process, fine powder is mixed in dielectric to enhance the machining rate of the EDM process and the surface quality of the machined specimen. Powder, when added to dielectric, gets invigorated, and acts in a zigzag motion, lowering the dielectric strength and increasing the inter-electrode gap. Due to this, powder particles arrange in a chain form, causing a short circuit, and leading to early explosion. Thus, multiple sparks are generated under the discharge zone, forming a shallow crater with uniform erosion with an enhanced material removal rate and better surface finish. The application of the PM-EDM process is mainly in the mold and dies industry; however, at present, it is also used in the automobile and aerospace industry for finishing of the manufactured parts [11,12,13,14,15,16].
Powder added to dielectric was introduced by Jeswani [17] during the EDM machining of mild steel by suspending graphite powder in EDM oil. With powder added in EDM oil, significant improvements in the material removal rate (MRR) and tool wear rate (TWR) were revealed. Some researchers have focused on the machining of nickel-based superalloy using powder mixed EDM. For example, Tan and Yeo [18], on machining AISI 420-MOD with a SiC powder mixed EDM process, revealed a decrease in recast layer thickness (RLT), with an increase in powder concentration and a decrease in pulse on time. Rathi and Mane [19] added three different powders in dielectric when machining Inconel-718 using the EDM process. Higher MRR was noticed with graphite powder at 18 A current and an 85% duty cycle. However, the lowest TWR was observed at 12 A current at a 90% duty cycle with silicon powder mixed in dielectric. Prakash et al. [20] observed a smaller surface crack length and a thinner recast layer at 4 g/L silicon powder when ED machining of Titanium Alloy. Kumar et al. [21] machined Inconel-825 with Al2O3 powder in dielectric during EDM. Improvement in MRR and SR over 40% was noticed with the addition of powder as compared to without powder in dielectric. Sugunakar and Kumar [22] machined RENE80 through the PM-EDM process, and a thinner recast layer was observed with aluminium powder at 9 g/L concentration. Tripathy and Tripathy [23], when machining H-11 die steel with the PM-EDM process, observed a decrease in RLT and SR, and an increase in hardness, and MRR increased in powder concentration. Patel and Thesiya [24] machined Inconel-718 with a rotary tool and the PMEDM process, and observed improvement in MRR. Ramesh and Jenarthanan [25] observed an improvement of 22.1% and 29.1% in surface roughness when machining AISI P20 steel and Nimonic-75 with the PM-EDM process, using aluminum powder admix in dielectric. Moreover, the lowest TWR and a higher MRR were noticed when machining with a brass electrode. Rouniyar and Shandilya [26] machined Inconel with graphite powder admix in dielectric and used Taguchi coupled with gray relational analysis to obtain optimum process parameters for MRR and SR. Sahu and Mandal [27] used graphite and alumina powder mixed in EDM oil to machine Nimonic-263 using EDM process. A lower RLT, surface crack density, and residual stress was observed with graphite powder mixed in EDM oil. Farooq et al. [28], during EDM of Ti-6Al-4V with Si powder admix in dielectric, revealed smaller crack and craters on machined surface. Moreover, the effect of powder concentration on RLT and SR was 61.82% and 37.03%, respectively.
After a detailed scrutiny of the literature available, most of the researchers have machined different nickel-based superalloys such as different grades of Inconel, Nimonic-75, Titanium Alloy, and RENE80 nickel alloy using powder mixed EDM process. Research works available were mainly focused on improving the output responses, namely MRR, TWR, and SR, while other important responses such as recast layer thickness, overcut, and microhardness have not gained much attention using the PM-EDM process. A handful of work related to the powder mixed electrical discharge machining of Nimonic-90 has been reported. After a consideration of anterior arguments, in this research work, Nimonic-90 is machined using silicon powder mixed in kerosene with a PM-EDM setup. This paper aims to investigate the influence of process parameters viz. powder concentration (PC), discharge current (IP), spark on duration (SON), and spark off duration (SOFF) on the surface roughness (SR) and recast layer thickness (RLT). Grey relational analysis (GRA) was used to multi-response optimization to determine minimum RLT and SR.
2. Materials and Methods
2.1. Materials and Experimental Details
In the present study, workpiece material was Nimonic-90 superalloy of 20 × 20 × 10 mm3 size. Electrolytic copper as a tool was selected and machined to a diameter of 10 mm. Table 1 illustrates the specification of the PM-EDM setup and the properties of Nimonic-90, while Table 2 depicts the elemental composition of Nimonic-90. Silicon powder (200 mesh size) was added to kerosene oil in a small, fabricated tank of 15 L to avoid the wastage of kerosene oil. Experiment of machining on Nimonic-90 was performed on a fabricated PM-EDM setup. Schematic diagram and pictorial view of fabricated PM-EDM setup is shown in Figure 1 and Figure 2, respectively. Fabricated PM-EDM setup consisted of a small tank with a stirrer attached, with a conventional Die sinking EDM Machine (EMS 5030, Pune, India), available at MNNIT Allahabad. A small pump attached with a nozzle hose was used for the circulation of powder-mixed dielectric in the machining gap to flush away the molten debris particles. Stirrer was provided for the uniform mixing of powder particles in dielectric so that powder did not settle at the bottom of tank while machining.

Table 1.
Specification of PM-EDM Setup and properties of Nimonic-90.
Table 2.
Elemental composition of Nimonic-90.
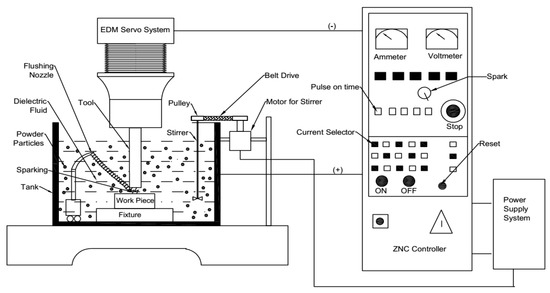
Figure 1.
Schematic Diagram of Powder Mixed EDM Setup.
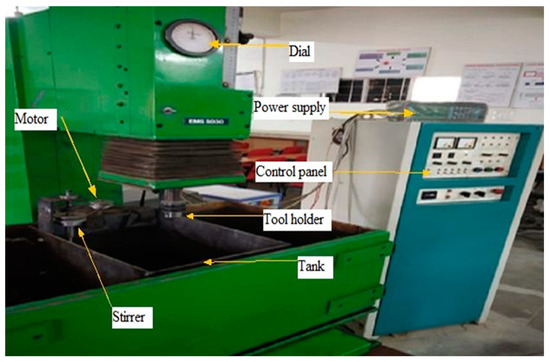
Figure 2.
Pictorial View of Powder Mixed EDM Setup.
Machining of Nimonic-90 was performed for 5 min during each experiment. L9 Taguchi orthogonal array was used as experimental design. Four input process parameters, namely powder concentration, discharge current, spark on duration, and spark off duration were varied while performing experiments. Based on the 4 process parameters (p) selected and varied over 3 levels (L), the number of experiments to be performed was computed as [29,30]:
Minimum experiments [(L − 1) × p] + 1 = [(3 − 1) × 4] + 1 = 9 = L9 orthogonal array.
A total of nine experiments were performed on the machining of Nimonic-90. Selection of range of process parameters was in accordance with a literature survey, pilot tests, and machine setup specifications. Table 3 illustrates the experimental machining condition.
Table 3.
Experimental Machining Conditions.
SR and RLT are considered output responses for this present study. Repetitions are multiple experimental runs with the same factor settings (levels). Repetitions are necessary to estimate experimental error and provide the conditions required to test the hypothesis or hypotheses formulated. According to a literature survey, at least two repetitions for each reading are necessary [31,32]. Thus, two repetitions were considered in this experimentation in order to obtain more reliable data, and the average was considered for analysis purpose. Surface roughness profilometer (Model SJ-410, Prayagraj, India) was used to measure SR at three separate locations of the machined surface, and the average was considered for study. For RLT, machined surface was cut in a transverse section using WEDM and then the cut section was polished using different grades of emery paper and etched with Nistal reagent. Then, an image of the recast layer at different magnifications was taken from a scanning electron microscope (SEM, Kanpur, India), Model JSM-6010LA. For measurement of RLT, SEM image was imported in ImageJ (V8, NIH, Prayagraj, India), software and Equation (1) was used for calculation [33,34].
where, RLT = Recast layer thickness, RLA = Recast layer area, RLL = Recast layer length
RLT = RLA/RLL
2.2. Optimization Using Grey Relational Analysis
Grey relational analysis (GRA) is a grey theory-based, decision-making technique developed by Deng for determining the combination of optimal process parameters by converting the multi- responses into a single grey relational grade (GRG) [35,36]. According to GRA, two kinds of data exist, namely ‘no information’ and ‘all information’. Black represents ‘no information’, while white represents having ‘all information’. There exists some information between black and white for experiments known as a grey system. GRG represents the relation between the reference sequence and the comparability sequence. A higher value of GRG represents the stronger relation between the reference sequence and the comparability sequence [37,38,39,40]. The following steps from the GRA flowcharts are calculated as follows.
Normalization
Experimental results are normalized within a range of between 0 and 1, then the grey relational grade is computed using the following formulas. For smaller the better as for response SR and RLT, and normalized value is calculated using Equation (2) [23,41].
where, Bi*(m) is normalized value, and Bi(m) represents original experimental data, i is the number of experimental items, and m is the number of parameters, * represents normalization.
Moreover, Bi*(m) ϵ [0, 1].
Deviation
Deviation is calculated by using Equation (3) [41,42]
where, ∆oi(m), Bo*(m), and Bi*(m) refer to the deviation, reference, and normalized sequences, respectively.
Bo*(m) = max {Bi*(m)}
Grey Relational Coefficient (GRC)
Using Equation (4), GRC is computed [41,43]
where, ∆min = smallest deviation = minimum value of ∆oi
∆max = largest deviation = maximum value of ∆oi
ξ = distinguishing coefficient [0–1]. ξ = 0.5 is generally used to allocate equal weights to every parameter [41].
Distinguishing coefficient (ξ) variation can be analyzed depending on the uncertainty in the data. If ξ value is lower, the distinguishability between the data sequences is higher, and, if ξ is higher, the distinguishability is lower. Distinguishing coefficient is a very siginificant parameter of the model. Despite its ability to influence the grey relational ordering, the scholars usually presume ξ = 0.5, even though the logic behind this supposition is not recognized [44,45].
The value of GRC lies between 0 and 1, i.e., 0 ≤ GRC ≤ 1.
Grey Relational Grade (GRG)
GRG is the average of the summation of all GRCs of ith experiment, and ‘n’ represents the number of response parameters and is computed using Equation (5) [23,43]. GRG value varies between 0 and 1.
3. Results and Discussions
Table 4 shows the measured values of SR and RLT for the L9 Taguchi experimental layout. To analyze the effect of process parameters on the experimental results, MINITAB V17 software was used.
Table 4.
L9 Taguchi Orthogonal Design with Output Responses.
3.1. Parametric Effect on Surface Roughness
Analysis of variance (ANOVA) for SR is illustrated in Table 5. SON has a higher significance among process parameters trailed by PC and IP, while SOFF has no significant on SR. SON has the highest contribution (49.64%) on SR, which can be observed in Table 5. The regression coefficient of the model is determined using ANOVA.
Table 5.
ANOVA for SR.
Equation (6) depicts the regression model for predicting the SR at 95% CI.
SR = 5.367 − 0.5517 PC + 0.3513 IP + 0.08776 SON
Figure 3 illustrates the main effect plot describing the influence of process parameters on SR. From Figure 3, upon increasing PC, a decrease in SR was noticed. Lower SR (3.216 µm) was noticed at PC = 12 g/L. Lower SR at a higher PC was due to the formation of a small shallow crater due to multiple sparking with uniform discharges across tools and workpieces owing to a less impulsive force. An increase in SR was revealed in Figure 3, after increasing both IP and SON. This was due to the higher spark energy available for melting material from workpiece surfaces, as spark energy is proportional to IP and SON. High spark energy results in an increase in plasma channel pressure, generating impulsive force and creating irregular surfaces [8,20,25]. A decrease in SR was noticed after increasing SOFF in Figure 3. With an increase in SOFF, uniform erosion takes from the workpiece. Moreover, more time is available for flushing the molten debris particles from the machined workpiece surface, lowering SR [34,46,47]. The minimum SR (3.216 μm) was obtained at PC = 12 g/L, IP = 5 A, SON = 35 μs, SOFF = 49 μs corresponding to experiment no. 8.
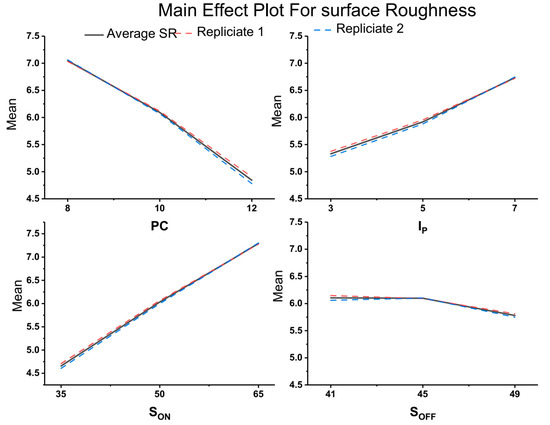
Figure 3.
Main Effect Plots for Surface Roughness.
3.2. Parametric Effect on Recast Layer Thickness
RLT of machined sample was measured at 1000 × on SEM image using ImageJ software. Figure 4 depicts a recast layer for nine different experimental results. Table 6 shows the ANOVA for RLT. SON was observed as the most significant process parameters trailed by IP and PC, while SOFF had no significance on RLT. SON had the highest contribution (64.98%) among the process parameters on RLT, which can be noticed in Table 6 and in the main effect plot of RLT, illustrated in Figure 5 The regression coefficient of the model is determined using ANOVA.
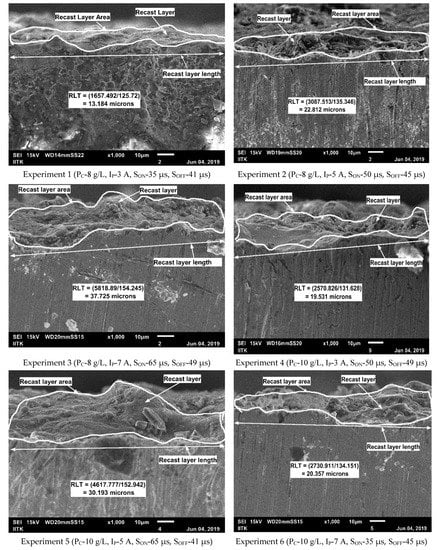
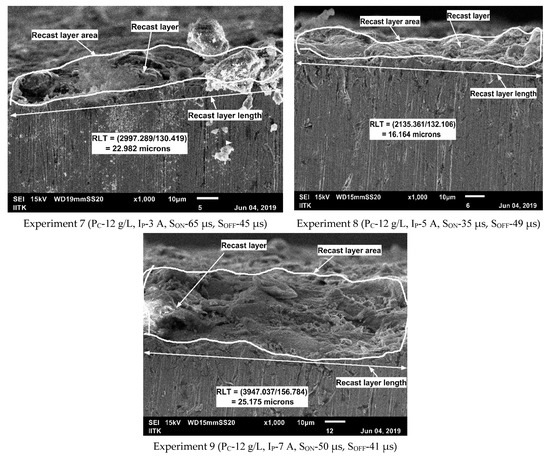
Figure 4.
Recast Layer for L9 different experimental runs.
Table 6.
ANOVA for RLT.
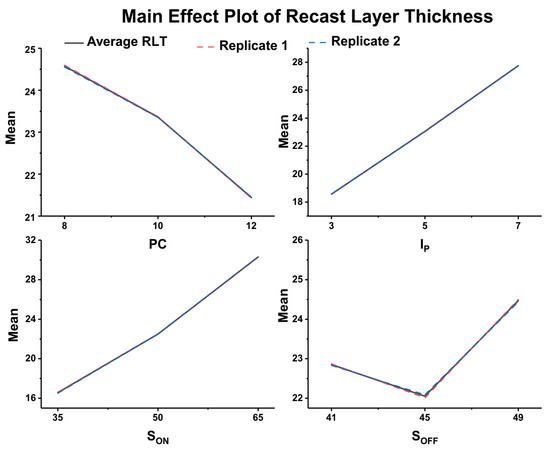
Figure 5.
Main Effect Plots for Recast Layer Thickness.
Equation (7) depicts the regression model for predicting the RLT at 95% CI in terms of significant process parameters.
RLT = −3.41 − 0.783 PC + 2.297 IP + 0.4577 SON
Figure 5 illustrates the main effect plot describing the effect of process parameters on RLT. Figure 5 depicts a decreasing trend for RLT after increasing the PC from 8 to 12 g/L. This is mainly attributed to the phenomenon that the spark gap is increased with the increase in PC. With an increase in the spark gap, the intensity of discharge energy in the sparking zone is lowered, and the powder added to dielectric removes the dissipated heat away from the spark gap, resulting in the formation of a shallow crater with thinner RLT [18,48]. With an increase in IP from three to seven A, and SON from 35 to 65 µs, a rise in RLT was noticed in Figure 5. The increase in RLT was due to the higher dispersive energy available to melt more material for the given IP and SON. Because of the low thermal conductivity of Nimonic-90, a smaller amount of heat transferred from the workpiece surface, resulting in less flushing of debris particles. Thus, thicker RLT was observed at higher IP and SON. From Figure 5, a decrease in RLT was discerned with an increase in SON from 41 to 45 µs. However, after increasing SOFF from 45 to 49 µs, an increment in RLT was noticed. Firstly, the decrease in RLT was due to the effective flushing of the given SOFF, which removes the resolidified material from workpiece surface. Moreover, the further increase in RLT was noticed with an increase in SOFF. At a higher SOFF, the time for flushing is greater, however the resolidified molten material sticks to the machined surface due to higher spark energy forming thicker RLT [20,34,49]. A lower recast layer thickness (13.184 μm) was obtained at PC = 8 g/L, IP = 3 A, SON = 35 μs, and SOFF = 41 μs, corresponding to experiment no. 1.
3.3. Optimization Using Grey Relational Analysis
Experimental results for each response parameters, i.e., SR and RLT, were normalized using Equation (2). Then, the deviation of each response parameters was obtained using Equation (3). Thus, the value of Δmin and Δmax obtained were 0 and 1, respectively, from Table 7, which can be used for determining the GRC. GRC for SR and RLT were calculated using Equation (4), considering the value of ξ as 0.5 [44,45]. To estimate the GRG, GRC for SR and RLT were used, and calculated using Equation (5). Equal weightage was allocated for all the responses for calculating the GRG because, in this experimental analysis, equal importance is assumed for all the response variables. Table 7 illustrates the values of GRC for SR and RLT along with GRG and rank for each experimental run.
Table 7.
Estimation of Normalized, Deviated, GRC (ξ = 0.5), GRG, and Rank.
The highest value of GRG was obtained for experimental run no. 8, as observed from Table 7 and Figure 6. Thus, the eighth experimental run gave the best multi-performance responses among the nine experimental runs performed. It was then followed by first and fourth experimental runs, which ranked as 2nd and 3rd, respectively. The response for the average GRG of the three levels of process parameters for this experimental work were calculated and are tabulated in Table 8. Figure 7 depicts the main effect plot for GRG, where the dashed line represents the value corresponding to total mean of GRG.
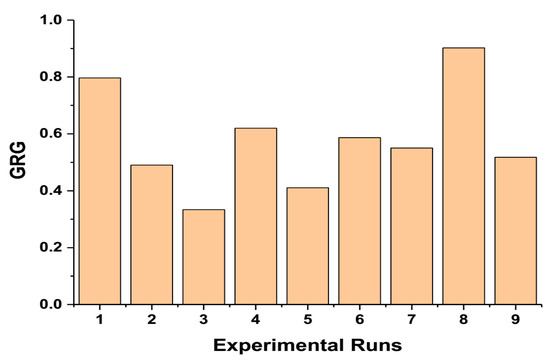
Figure 6.
GRG vs. Experimental runs.
Table 8.
Response of GRG.
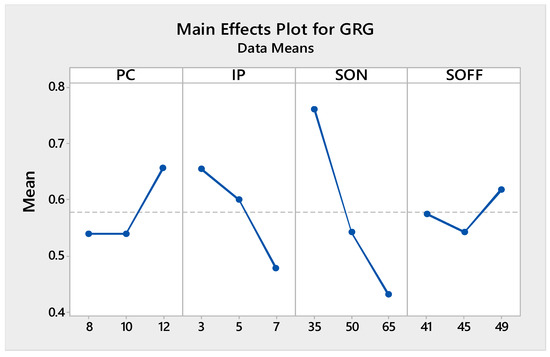
Figure 7.
Main Effect Plots for GRG.
The GRG of each process parameters are arranged according to each level, and the average corresponding to each level is noted in response to GRG in Table 8. Here, four process parameters were varied over three levels. As for L9 OA, a total of nine experiments were performed and, for each level, are varied for three experimental runs, thus an average of three experiments were considered [49]. The response of GRG was calculated as follows:
For powder concentration, PC were arranged in increasing order, due to which, the experiment number and GRG were automatically changed. As the experiments were varied over three levels, i.e., PC = 8 g/L, 10 g/L, and 12 g/L, and as each level was varied for three experimental runs, the average GRG of corresponding level was considered. Thus, for calculation of GRG for level 1, level 2, level 3 for PC in response table as:
(GRG) of level 1 = (Exp. No. 1 + Exp. No. 2 + Exp. No. 3)/3
= (0.7965 + 0.4903 + 0.3333)/3 = 0.5400
(GRG) of level 2 = (Exp. No. 4 + Exp. No. 5 + Exp. No. 6)/3
= (0.6200 + 0.4105 + 0.5868)/3 = 0.5391
(GRG) of level 3 = (Exp. No. 7 + Exp. No. 8 + Exp. No. 9)/3
= (0.5505 + 0.9023 + 0.5175)/3 = 0.6568
For discharge current, IP were arranged in increasing order, due to which the experiment number and GRG were automatically changed. As the experiments were varied over three levels, i.e., IP = 3 A, 5 A, and 7 A, and as each level is varied for three experimental runs, the average GRG of the corresponding level was considered. Thus, for the calculation of GRG for level 1, level 2, level 3 for IP in response table as:
(GRG) of level 1 = (Exp. No. 1 + Exp. No. 4 + Exp. No. 7)/3
= (0.7965 + 0.6200 + 0.5505)/3 = 0.6557
(GRG) of level 2 = (Exp. No. 2 + Exp. No. 5 + Exp. No. 8)/3
= (0.4903 + 0.4105 + 0.9023)/3 = 0.6010
(GRG) of level 3 = (Exp. No. 3 + Exp. No. 6 + Exp. No. 9)/3
= (0.3333 + 0.5868 + 0.5175)/3 = 0.4792
For spark-on-duration, SON were arranged in increasing order, due to which the experiment number and GRG were automatically changed. As the experiments were varied over three levels, i.e., SON = 35 μs, 50 μs, and 65 μs, and as each level are varied for three experimental runs, the average GRG of the corresponding level was considered. Thus, for calculation of GRG for level 1, level 2, level 3 for SON in response table as:
(GRG) of level 1 = (Exp. No. 1 + Exp. No. 6 + Exp. No. 8)/3
= (0.7965 + 0.5868 + 0.9023)/3 = 0.7619
(GRG) of level 2 = (Exp. No. 2 + Exp. No. 4 + Exp. No. 9)/3
= (0.4903 + 0.6200 + 0.5175)/3 = 0.5426
(GRG) of level 3 = (Exp. No. 3 + Exp. No. 6 + Exp. No. 9)/3
= (0.3333 + 0.4105 + 0.5505)/3 = 0.4314
For spark-off-duration, SOFF were arranged in increasing order, due to which the experiment number and GRG were automatically changed. As the experiments were varied over three levels, i.e., SOFF = 41 μs, 45 μs, and 49 μs, and as each level are varied for three experimental runs, the average GRG of the corresponding level was considered. Thus, for calculation of GRG for level 1, level 2, level 3 for SOFF in response table as:
(GRG) of level 1 = (Exp. No. 1 + Exp. No. 5 + Exp. No. 9)/3
= (0.7965 + 0.4105 + 0.5175)/3 = 0.5748
(GRG) of level 2 = (Exp. No. 2 + Exp. No. 6 + Exp. No. 7)/3
= (0.4903 + 0.5868 + 0.5505)/3 = 0.5425
(GRG) of level 3 = (Exp. No. 3 + Exp. No. 4 + Exp. No. 8)/3
= (0.3333 + 0.6200 + 0.9023)/3 = 0.6185
Total mean of GRG (ηm) is calculated using Equation (8)
where, L = number of levels and p = number of process parameters
As observed from Table 8 and Figure 7, the maximum GRG was corresponding to level 3 of powder concentration, level 1 of discharge current, level 1 of spark on duration, and level 3 of spark off duration. Hence, it is the optimal setting and optimum process parameters for minimum SR, and RLT was at PC = 12 g/L, IP = 3 A, SON = 35 μs and SOFF = 49 μs.
3.4. Confirmation Test
After identifying the optimal level of process parameters, improvement in responses was carried out for prediction and validation at an optimum set of process parameters. The experimental results obtained at the optimum process parameters were compared with the predicted results. The predicted GRG (η) is computed using Equation (9) at the optimum level of process parameters [30,41,43].
where, ηm is total mean of GRG, ηi = maximum of average GRG at optimum level of process parameter, p = number of process parameters affecting responses = 4
Table 9 depicts the validation of response at the initial and optimum level of process parameters from the confirmatory experiments for the responses. Initial process parameters in GRA are the value of GRG near to the mean line of main effect plot of GRG. As observed from the Table 9, SR was decreased to 3.107 µm from 6.220 µm, and RLT was reduced to 14.926 µm from 20.119 µm. Moreover, after validation, the actual results were found to be congruent with the predicted results, with an improvement in GRG of 0.3960. For SR and RLT, the absolute error computed between experimental and optimized was less 5% and within the range of the given confidence interval.
| η = ηm + [(ηi)PC − ηm] + [(ηi)IP − ηm] + [(ηi)SON − ηm] + [(ηi)SOFF − ηm] |
| η = 0.5786 + (0.6568 − 0.5786) + (0.6557 − 0.5786) +(0.7619 − 0.5786) + (0.6185 − 0.5786) |
| = 0.9569 |
Table 9.
Confirmation Test.
4. Conclusions
In this present work, ED machining of Nimonic-90 superalloy is performed by mixing the silicon powder in kerosene oil. L9 Taguchi orthogonal design array was used for experimental layout. The influence of process parameters on SR and RLT has been studied and a significant parameter is revealed using ANOVA. The following research conclusions can be drawn from the present work:
- For SR, SON was the most significant process parameter, followed by PC and IP, while the effect of SOFF was the least significant. A decrease in SR was observed with an increase in PC and SOFF, and a decrease in IP and SON;
- For RLT, SON was the most significant process parameter, followed by IP and PC. However, SOFF had a negligible effect. A decrease in RLT was noticed with an increase in PC and a decrease in IP and SON. A decrease in RLT was noticed with an increase in SOFF up to the optimum level and with further RLT increases;
- The minimum surface roughness (3.107 µm) and the thinnest recast layer (14.926 μm) was obtained at optimum process parameters i.e., PC = 12 g/L, IP = 3 A, SON = 35 μs and SOFF = 49 μs;
- Confirmatory results at optimum process parameters revealed a decrease in SR and RLT by 50.04% and 25.81%, respectively, with respect to the initial machining condition.
Author Contributions
A.A. and P.S. wrote the paper, A.K.R. and H.B. designed the experiment and analyzed the data, A.K.R. performed the experiments and revision. All authors have read and agreed to the published version of the manuscript.
Funding
The author(s) received no financial support for the research of this article.
Institutional Review Board Statement
Not applicable.
Informed Consent Statement
Not Applicable.
Data Availability Statement
Data sharing is not applicable to this article.
Acknowledgments
The authors are thankful to Department of Advanced Center Material Science IIT Kanpur for providing SEM facility, Machine Tool and Advanced Machine Lab MNNIT Allahabad for providing EDM and Surface roughness profilometer for accomplishing this work.
Conflicts of Interest
The authors declare no conflict of interest.
References
- Kumar, V.; Jangra, K.K.; Kumar, V. An experimental study on trim cutting operation using metal powder mixed dielectric in WEDM of Nimonic-90. Int. J. Ind. Eng. Comput. 2016, 7, 135–146. [Google Scholar] [CrossRef]
- Kumar, V.; Jangra, K.K.; Kumar, V.; Sharma, N. GA-based optimisation using RSM in WEDM of Nimonic-90: A nickel-based super alloy. Int. J. Ind. Syst. Eng. 2018, 28, 53–69. [Google Scholar] [CrossRef]
- Pandey, A.K.; Gautam, G.D. Grey relational analysis-based genetic algorithm optimization of electrical discharge drilling of Nimonic-90 superalloy. J. Braz. Soc. Mech. Sci. Eng. 2018, 40, 117. [Google Scholar] [CrossRef]
- Kaya, E.; Akyüz, B. Effects of cutting parameters on machinability characteristics of Ni-based superalloys: A review. Open Eng. 2017, 7, 330–342. [Google Scholar] [CrossRef]
- Thakur, A.; Gangopadhyay, S. State-of-the-art in surface integrity in machining of nickel-based super alloys. Int. J. Mach. Tools Manuf. 2016, 100, 25–54. [Google Scholar] [CrossRef]
- Bisaria, H.; Shandilya, P. Experimental investigation on wire electric discharge machining (WEDM) of Nimonic C-263 superalloy. Mater. Manuf. Process. 2019, 34, 83–92. [Google Scholar] [CrossRef]
- Rouniyar, A.K.; Shandilya, P. Fabrication and experimental investigation of magnetic field assisted powder mixed electrical discharge machining on machining of aluminum 6061 alloy. Proc. Inst. Mech. Eng. Part B J. Eng. Manuf. 2019, 233, 2283–2291. [Google Scholar] [CrossRef]
- Batish, A.; Bhattacharya, A.; Singla, V.K.; Singh, G. Study of material transfer mechanism in die steels using powder mixed electric discharge machining. Mater. Manuf. Process. 2012, 27, 449–456. [Google Scholar] [CrossRef]
- Beranoagirre, A.; Urbikain, G.; Calleja, A.; de Lacalle, L.N.L. Hole making by electrical discharge machining (EDM) of γ-TiAl intermetallic alloys. Metals 2018, 8, 543. [Google Scholar] [CrossRef] [Green Version]
- Rouniyar, A.K.; Shandilya, P. Optimization of process parameters in magnetic field assisted powder mixed EDM of aluminium 6061 alloy. Proc. Inst. Mech. Eng. Part C J. Mech. Eng. Sci. 2020, 235, 2998–3014. [Google Scholar] [CrossRef]
- Kansal, H.K.; Singh, S.; Kumar, P. Parametric optimization of powder mixed electrical discharge machining by response surface methodology. J. Mater. Process. Technol. 2005, 169, 427–436. [Google Scholar] [CrossRef]
- Ekmekci, B.; Yaşar, H.; Ekmekci, N. A discharge separation model for powder mixed electrical discharge machining. J. Manuf. Sci. Eng. Trans. ASME 2016, 138, 1–9. [Google Scholar] [CrossRef]
- Zhu, Z.; Guo, D.; Xu, J.; Lin, J.; Lei, J.; Xu, B.; Wu, X.; Wang, X. Processing characteristics of micro electrical discharge machining for surface modification of TiNi shape memory alloys using a TiC powder dielectric. Micromachines 2020, 11, 1018. [Google Scholar] [CrossRef]
- Abdudeen, A.; Qudeiri, J.E.A.; Kareem, A.; Ahammed, T.; Ziout, A. Recent advances and perceptive insights into powder-mixed dielectric fluid of EDM. Micromachines 2020, 11, 754. [Google Scholar] [CrossRef]
- Rouniyar, A.K.; Shandilya, P. Semi-empirical modeling and optimization of process parameters on overcut during MFAPM-EDM of Al6061 alloy. Proc. Inst. Mech. Eng. Part E J. Process Mech. Eng. 2021, 09544089211015890. [Google Scholar] [CrossRef]
- Rouniyar, A.K.; Shandilya, P. Study of surface crack density and microhardness of Aluminium 6061 alloy machined by EDM with mixed powder and assisted magnetic field. J. Micromanufacturing 2021, 251659842110164. [Google Scholar] [CrossRef]
- Jeswani, M.L. Effect of the Addition of Graphite Powder to Kerosene Used as the Dielectric Fluid in Electrical Discharge Machining. Wear 1981, 70, 133–139. [Google Scholar] [CrossRef]
- Tan, P.C.; Yeo, S.H. Investigation of recast layers generated by a powder-mixed dielectric micro electrical discharge machining processg. Proc. Inst. Mech. Eng. Part B J. Eng. Manuf. 2011, 225, 1051–1062. [Google Scholar] [CrossRef]
- Rathi, M.G.; Mane, D.V. Study on effect of powder mixed dielectric in EDM of Inconel 718. Int. J. Sci. Res. Publ. 2014, 4, 1–7. [Google Scholar]
- Prakash, C.; Kansal, H.K.; Pabla, B.S.; Puri, S. Experimental investigations in powder mixed electric discharge machining of Ti–35Nb–7Ta–5Zrβ-titanium alloy. Mater. Manuf. Process. 2017, 32, 274–285. [Google Scholar] [CrossRef]
- Kumar, A.; Mandal, A.; Dixit, A.R.; Das, A.K. Performance evaluation of Al2O3 nano powder mixed dielectric for electric discharge machining of Inconel 825. Mater. Manuf. Process. 2018, 33, 986–995. [Google Scholar] [CrossRef]
- Sugunakar, A.; Kumar, A.; Markandeya, R. Effect of Powder Mixed Dielectric fluid on Surface Integrity by Electrical Discharge Machining of RENE 80. IOSR J. Mech. Civ. Eng. 2017, 14, 43–50. [Google Scholar] [CrossRef]
- Tripathy, S.; Tripathy, D.K. Grey relational analysis and its application on surface properties during EDM and powder mixed EDM. J. Eng. Sci. Technol. 2017, 12, 2374–2392. [Google Scholar]
- Patel, S.; Thesiya, D.; Rajurkar, A. Aluminium powder mixed rotary electric discharge machining (PMEDM) on Inconel 718. Aust. J. Mech. Eng. 2018, 16, 21–30. [Google Scholar] [CrossRef]
- Ramesh, S.; Jenarthanan, M.P. Investigating the performance of powder mixed electric discharge machining of Nimonic 75 by using different tool materials. World J. Eng. 2018, 15, 205–215. [Google Scholar] [CrossRef]
- Rouniyar, A.K.; Shandilya, P. Multi-Objective Optimization using Taguchi and Grey Relational Analysis on Machining of Ti-6Al-4V Alloy by Powder Mixed EDM Process. Mater. Today Proc. 2018, 5, 23779–23788. [Google Scholar] [CrossRef]
- Sahu, D.R.; Mandal, A. Critical analysis of surface integrity parameters and dimensional accuracy in powder-mixed EDM. Mater. Manuf. Process. 2020, 35, 430–441. [Google Scholar] [CrossRef]
- Farooq, M.U.; Mughal, M.P.; Ahmed, N.; Mufti, N.A.; Al-Ahmari, A.M.; He, Y. On the investigation of surface integrity of Ti6Al4V ELI using si-mixed electric discharge machining. Materials 2020, 13, 1549. [Google Scholar] [CrossRef] [PubMed] [Green Version]
- Senthilkumar, N.; Tamizharasan, T.; Anandakrishnan, V. Experimental investigation and performance analysis of cemented carbide inserts of different geometries using Taguchi based grey relational analysis. Meas. J. Int. Meas. Confed. 2014, 58, 520–536. [Google Scholar] [CrossRef]
- Meena, V.K.; Azad, M.S. Grey relational analysis of micro-EDM machining of Ti-6Al-4V alloy. Mater. Manuf. Process. 2012, 27, 973–977. [Google Scholar] [CrossRef]
- Bhattacharya, A.; Batish, A.; Singh, G. Optimization of powder mixed electric discharge machining using dummy treated experimental design with analytic hierarchy process. Proc. Inst. Mech. Eng. Part B J. Eng. Manuf. 2012, 226, 103–116. [Google Scholar] [CrossRef]
- Bains, P.S.; Sidhu, S.S.; Payal, H.S.; Kaur, S. Magnetic Field Influence on Surface Modifications in Powder Mixed EDM. Silicon 2019, 11, 415–423. [Google Scholar] [CrossRef]
- Bisaria, H.; Shandilya, P. The machining characteristics and surface integrity of Ni-rich NiTi shape memory alloy using wire electric discharge machining. Proc. Inst. Mech. Eng. Part C J. Mech. Eng. Sci. 2019, 233, 1068–1078. [Google Scholar] [CrossRef]
- Rouniyar, A.K.; Shandilya, P. Experimental Investigation on Recast Layer and Surface Roughness on Aluminum 6061 Alloy During Magnetic Field Assisted Powder Mixed Electrical Discharge Machining. J. Mater. Eng. Perform. 2020, 29, 7981–7992. [Google Scholar] [CrossRef]
- Singh, S.; Yeh, M.F. Optimization of abrasive powder mixed EDM of aluminum matrix composites with multiple responses using gray relational analysis. J. Mater. Eng. Perform. 2012, 21, 481–491. [Google Scholar] [CrossRef]
- Majumder, H.; Paul, T.R.; Dey, V.; Dutta, P.; Saha, A. Use of PCA-grey analysis and RSM to model cutting time and surface finish of Inconel 800 during wire electro discharge cutting. Meas. J. Int. Meas. Confed. 2017, 107, 19–30. [Google Scholar] [CrossRef]
- Montgomery, D.C. Montgomery Design and Analysis of Experiments, 8th ed.; Arizona State University; John Wiley & Sons, Inc.: Hoboken, NJ, USA, 2013; Volume 2009, ISBN 9781118146927. [Google Scholar]
- Abidi, M.H.; Al-Ahmari, A.M.; Siddiquee, A.N.; Mian, S.H.; Mohammed, M.K.; Rasheed, M.S. An investigation of the micro-electrical discharge machining of nickel-titanium shape memory alloy using grey relations coupled with principal component analysis. Metals 2017, 7, 486. [Google Scholar] [CrossRef] [Green Version]
- Deng, J.; Yan, Q.; Lu, J.; Xiong, Q.; Pan, J. Optimisation of Lapping Process Parameters for Single-Crystal 4H–SiC Using Orthogonal Experiments and Grey Relational Analysis. Micromachines 2021, 12, 910. [Google Scholar] [CrossRef]
- Suresh Kumar, S.; Uthayakumar, M.; Thirumalai Kumaran, S.; Parameswaran, P.; Mohandas, E.; Kempulraj, G.; Ramesh Babu, B.S.; Natarajan, S.A. Parametric optimization of wire electrical discharge machining on aluminium based composites through grey relational analysis. J. Manuf. Process. 2015, 20, 33–39. [Google Scholar] [CrossRef]
- Sylajakumari, P.A.; Ramakrishnasamy, R.; Palaniappan, G. Taguchi grey relational analysis for multi-response optimization of wear in co-continuous composite. Materials 2018, 11, 1743. [Google Scholar] [CrossRef] [PubMed] [Green Version]
- Manikandan, N.; Raju, R.; Palanisamy, D.; Binoj, J.S. Optimisation of spark erosion machining process parameters using hybrid grey relational analysis and artificial neural network model. Int. J. Mach. Mach. Mater. 2020, 22, 1–23. [Google Scholar] [CrossRef]
- Kalyon, A.; Günay, M.; Özyürek, D. Application of grey relational analysis based on Taguchi method for optimizing machining parameters in hard turning of high chrome cast iron. Adv. Manuf. 2018, 6, 419–429. [Google Scholar] [CrossRef]
- Abhang, L.B.; Hameedullah, M. Determination of optimum parameters for multi-performance characteristics in turning by using grey relational analysis. Int. J. Adv. Manuf. Technol. 2012, 63, 13–24. [Google Scholar] [CrossRef] [Green Version]
- Javed, S.A.; Mahmoudi, A.; Khan, A.M.; Javed, S.; Liu, S. A Critical Review: Shape Optimization of Welded Plate Heat Exchangers based on Grey Correlation Theory. Appl. Therm. Eng. 2018, 144, 593–599. [Google Scholar] [CrossRef]
- Shard, A.; Shikha, D.; Gupta, V.; Garg, M.P. Effect of B4C abrasive mixed into dielectric fluid on electrical discharge machining. J. Braz. Soc. Mech. Sci. Eng. 2018, 40, 554. [Google Scholar] [CrossRef]
- Sahu, S.K.; Datta, S. Experimental studies on graphite powder-mixed electro-discharge machining of Inconel 718 super alloys: Comparison with conventional electro-discharge machining. Proc. Inst. Mech. Eng. Part E J. Process Mech. Eng. 2019, 233, 384–402. [Google Scholar] [CrossRef]
- Wu, K.L.; Yan, B.H.; Huang, F.Y.; Chen, S.C. Improvement of surface finish on SKD steel using electro-discharge machining with aluminum and surfactant added dielectric. Int. J. Mach. Tools Manuf. 2005, 45, 1195–1201. [Google Scholar] [CrossRef]
- Pawade, R.S.; Joshi, S.S. Multi-objective optimization of surface roughness and cutting forces in high-speed turning of Inconel 718 using Taguchi grey relational analysis (TGRA). Int. J. Adv. Manuf. Technol. 2011, 56, 47–62. [Google Scholar] [CrossRef]
Publisher’s Note: MDPI stays neutral with regard to jurisdictional claims in published maps and institutional affiliations. |
© 2021 by the authors. Licensee MDPI, Basel, Switzerland. This article is an open access article distributed under the terms and conditions of the Creative Commons Attribution (CC BY) license (https://creativecommons.org/licenses/by/4.0/).