Article

The Influence of Temperature on the Microstructure and Properties of Nb-V-Ti-Mo Complex Microalloyed High-Strength Fire-Resistant Steel

1
Department of Structural Steels, Central Iron and Steel Research Institute, Beijing 100081, China
2
Collaborative Innovation Center of Steel Technology, University of Science and Technology Beijing, Beijing 100083, China
3
School of Aeronautical Manufacturing Engineering, Nanchang Hangkong University, Nanchang 330063, China
*
Authors to whom correspondence should be addressed.
Metals 2021, 11(11), 1670; https://doi.org/10.3390/met11111670
Submission received: 7 September 2021 / Revised: 7 October 2021 / Accepted: 11 October 2021 / Published: 20 October 2021
(This article belongs to the Special Issue Advances in High-Strength Low-Alloy Steels)

Abstract

:
Nb-V-Ti-Mo complex microalloyed high-strength fire-resistant steel was obtained through two-stage hot rolling and laminar cooling. The results showed that the microstructure of the steel included bainite ferrite and martensite-austenite constituent (i.e., MA) islands. The experimental steel displayed high strength at room temperature, with a yield strength (YS) of 617 MPa and tensile strength of 813 MPa (elongation = 18.5%). As the temperature increased to 700 °C, the high-temperature yield strength gradually decreased. Electron backscatter diffraction (EBSD) was used to analyze the experimental steels at different temperatures. The grain sizes did not grow significantly. A small number of nanoprecipitates with an average diameter of 29.2 nm were distributed in the matrix of the as-rolled specimen. Upon increasing the temperature, the number of fine nanoprecipitates gradually increased, resulting in a gradual decrease in their average diameter, reaching a minimum of 19.4 nm at 600 °C. The Orowan equation explained well the precipitation strengthening effect of the nanoprecipitates that formed at a high temperature. At both room temperature and 300 °C, the Ashby work hardening theoretical curves were consistent with the experimental true stress-strain curves. Dynamic recovery and recrystallization occurred at 600 °C, which caused the experimental true stress-strain curve to deviate from the calculated curve.

1. Introduction

In recent years, due to rapid socioeconomic development, many large landmark buildings with multiple floors have been constructed [1,2,3,4]. Compared with conventional mild steel, high-strength low-alloy steel (HSLA) can greatly reduce construction costs (material costs, transportation costs, energy consumption, and carbon emissions) because of its high strength (yield and tensile strength), low weight, green properties, and good safety, and can also reduce materials’ usage (including steel, welding materials, and coatings) [5,6]. However, high-rise buildings are prone to fires and other disasters because of their many floors, complex functions, and many pipe shafts; because of this, high-rise buildings have a “chimney effect” that makes fires difficult to control. Due to improved living standards and an increase in population density, buildings have become taller, and decoration is increasingly high-grade, which uses many combustible materials. This increases the fire load density (equivalent combustible mass per unit area), which increases the risk of fire; thus, it has become imperative to study the fire resistance of structural steel [7]. The yield strength of conventional mild steel at 600 °C is less than 1/2 its room-temperature value, causing it to lose its bearing capacity; thus, fire-resistant steel must meet the criterion: YS (600 °C) ≥ 2/3 YS (room-temperature design yield strength) [3,8].
To develop high-strength fire-resistant steels, researchers have conducted extensive experimental work, and existing studies have concluded that the microstructure composition helps fire-resistant steels maintain their high-temperature properties. As the microstructure develops from ferrite/pearlite to ferrite/bainite and full bainite, the strength of steel increases. The main microstructure of several fire-resistant steels studied by Lee [9] was polygonal ferrite + pearlite with bainite, and the high-temperature strength of steel increased as the amount of bainite increased. Sha [10,11,12] concluded that fire-resistant steels with ferrite + a small amount of bainite in their microstructure displayed better high-temperature properties. Bainite improved the high-temperature strength of high-strength fire-resistant steels, and the yield strength of fire-resistant steels at 600 °C was enhanced upon increasing the volume fraction of bainite in the microstructure. Mo was the most effective element for improving the high-temperature properties [13], but it is a rare and expensive metal that increases the cost of fire-resistant steel. Therefore, the carbonitrides, forming elements such as Nb, V, and Ti, and accelerated cooling techniques have been used to replace the role of Mo to obtain sufficient volume fractions of bainite in the microstructure and carbide nanoprecipitates at elevated temperatures [14,15,16,17,18,19]. Compared to complex repeated heat treatments after rolling, it is cheaper while maintaining performance [20,21]. Interphase precipitation strengthening has been applied to fire-resistant steels as a cost-effective method to increase strength, interphase precipitation occurs during rolling, and the precipitates tend to coarsen and grow when tempered at 600 °C, which reduces the high-temperature strength [19,22]. In microalloyed high-strength fire-resistant steels, atom diffusion, grains coarsening, and the recovery and annihilation of dislocations decrease the strength at elevated temperatures [23]; therefore, carbide nanoprecipitates formed during tempering contribute to precipitation strengthening, which increases the high-temperature yield strength [24,25].
The mechanical properties of previous fire-resistant steels have mainly been studied at room temperature and 600 °C [14,15,16,17,18,19,23,24,25,26], while their mechanical properties and precipitation behavior at other temperatures have rarely been reported. In this study, the evolution of microstructures, mechanical properties, and precipitation behavior of experimental steels at different temperatures was investigated. Moreover, the influence of nanoprecipitates on the yield strength at different temperatures was discussed in detail. The results of our study might provide an achievable design idea for high-strength fire-resistant steel.

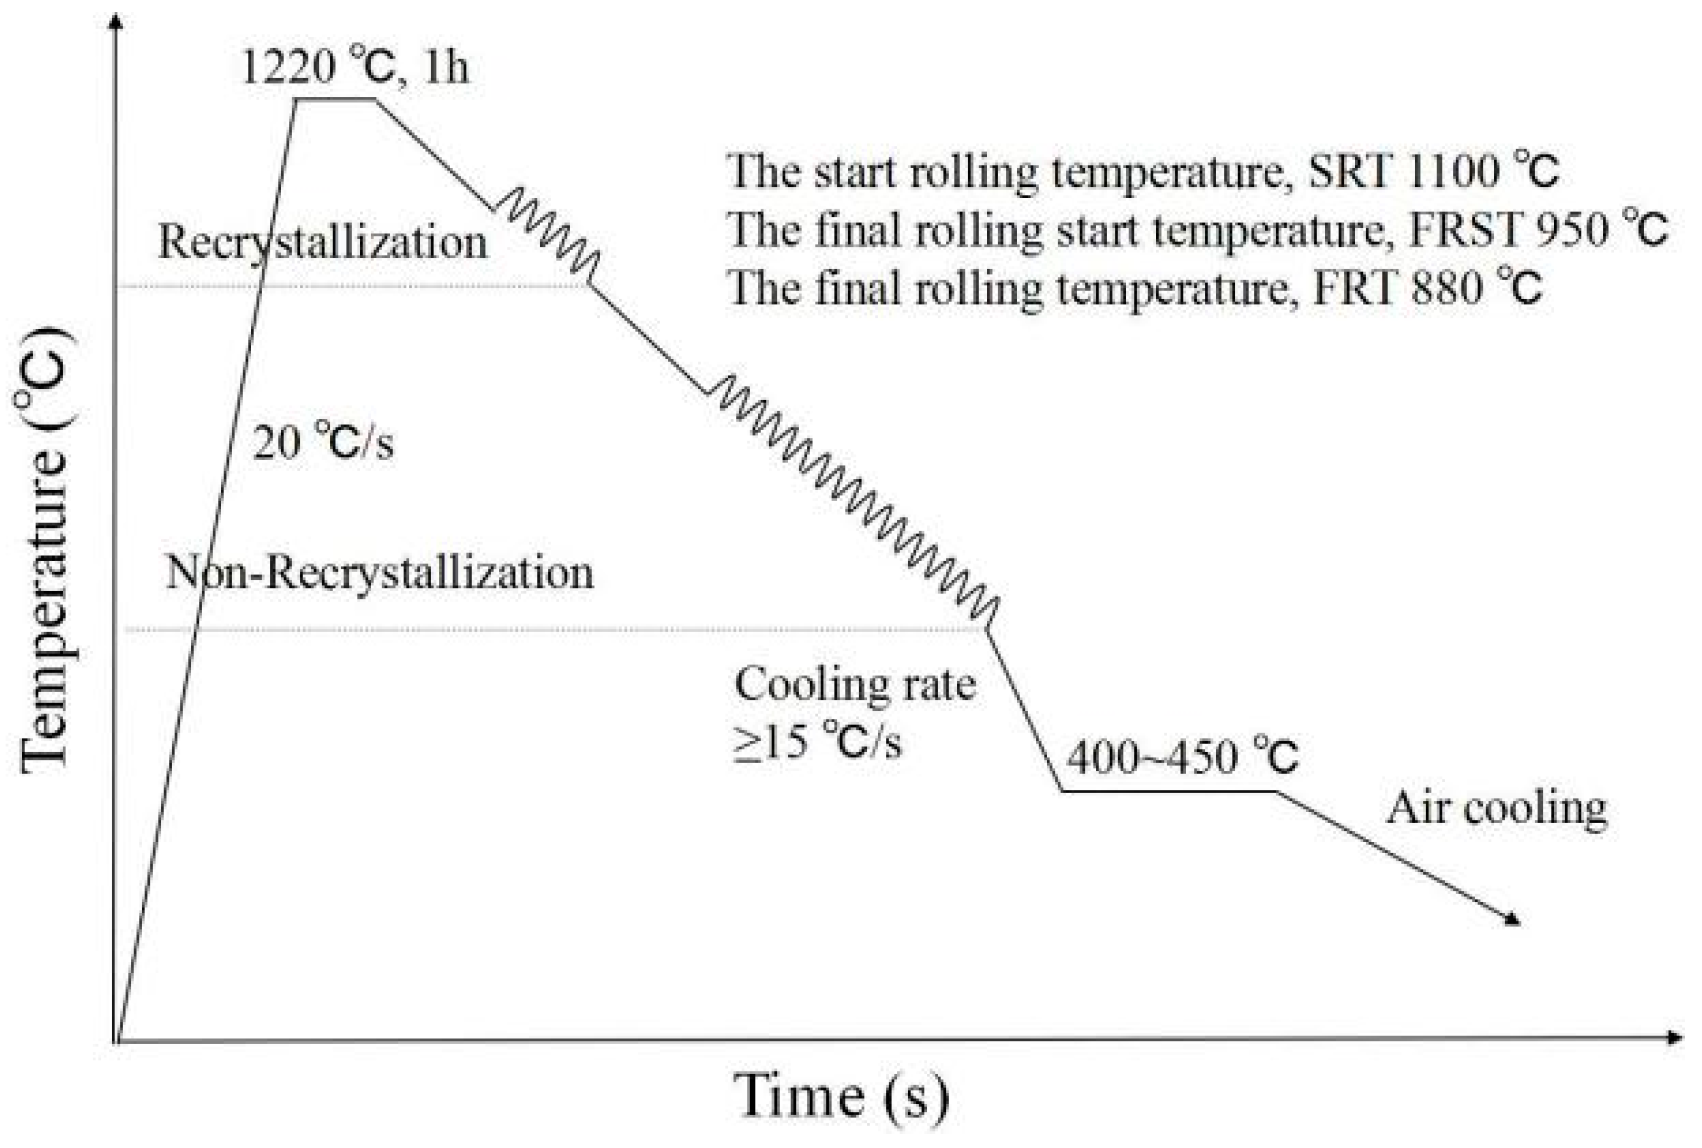
2. Experimental Materials and Methods

A 50 kg vacuum positive-pressure induction melting furnace was used to smelt the experimental steel, followed by its casting into a steel billet. Table 1 shows the chemical composition of the experimental steel. Low carbon content was used to improve the weldability [27], and the combined addition of Cu, Ni, and Cr was used to obtain excellent weather resistance [28,29,30]. The steel billet was forged into a 60 mm-thick ingot, which was rolled by a Φ430 high-precision hot rolling test machine.
The steel ingot was reheated to 1220 °C for 1 h to dissolve microalloying elements and then rolled into an 11 mm-thick plate via two-stage rolling. The first stage of rolling was austenitic recrystallization rolling. The steel plate was rolled to 36 mm at 1100 °C (the start rolling temperature, SRT). The second stage of rolling was austenite nonrecrystallization. The steel plate was rolled to 11 mm. The final rolling temperature (FRT) was controlled at 880 °C. The austenite grains were flattened during the austenite nonrecrystallization rolling, and there were a large number of dislocations within the flattened austenite grains. Compared to traditional processing methods, it is more effective while maintaining performance [31,32]. After rolling, the steel plate was cooled rapidly (laminar cooling speed ≥ 15 °C/s), and the self-tempering temperature was controlled at 400–450 °C, followed by air cooling to room temperature. The specific rolling process is plotted in Figure 1.
The 8 mm diameter and 40 mm gauge length rod-shaped tensile specimens were cut from the steel plate along the transverse direction. The tensile tests were conducted at different temperatures, starting from room temperature to 700 °C, and the operation method complied with the Chinese standards GB/T 228.1-2010 and GB/T 228.2-2015. The strain rate was 0.00025 s−1. The tensile specimens were heated to the set temperature for holding 15 min before the tensile tests. The tensile tests were conducted on a GNT300 microcomputer-controlled electronic universal testing machine (NCS Testing Technology Co., Ltd., Beijing, China) equipped with an electric furnace. The scanned specimens were cut from the edge of the tensile specimens (undeformed area) and then etched in 4% nitric acid/ethanol solution after water-grinding and polishing.
Microstructure examinations were performed using a scanning electron microscope (SEM, FEI Quanta 650, FEI Co., Hillsboro, OR, USA) equipped with an electron backscatter diffraction detector (EBSD, Oxford Nordlys F+, Oxford, UK) at different temperatures. The grain boundaries and interface density of the specimens were collected and analyzed by EBSD. The specimens were electrolytically polished by a 10% perchloric acid/ethanol solution at 12 V for 15 s. The scanning step size was 0.2 μm, and the area was 100 μm (rolling direction) × 80 μm (thickness direction). EBSD information was postprocessed to acquire the relevant data by HKL CHANNEL 5 software (Oxford Instruments Co., Oxford, UK) The nanoprecipitates in the specimens were observed at different temperatures using carbon film replication technology. The polished specimens were deeply corroded in 4% nitric acid/ethanol solution until the surface was black. A 10 μm-thick carbon film was sprayed on the specimen’s surface, scribed into 2 × 2 mm squares with a razor blade, and soaked in 4% nitric acid/ethanol solution to shed carbon film. Then, it was salvaged with a larger copper mesh, cleaned in ethanol, and then put into distilled water to force the curled carbon film to unfold into squares due to the surface tension of water. It was then salvaged with a 200-purpose copper sheet with a diameter of 3 mm and dried with filter paper to observe the precipitation phases attached to the carbon film using transmission electron microscopy (TEM, FEI Tecnai G20, Hillsboro, OR, USA).
The mass fraction of carbonitrides and the nanoprecipitates’ particle diameter distribution of specimens obtained at different temperatures was quantitatively analyzed by physical and chemical phase analyses. The experimental steels were dissolved in an “AA solution” (10% (V/V) acetylacetone methanol + 10 g/L lithium chloride solution). The adequate carbonitride residue was extracted by an electrochemical method, followed by the separation of microalloyed carbonitrides (M(C, N)) and cementite (M3C). Physical phase analysis of M(C, N) and M3C was conducted and confirmed by X-ray diffraction. Inductively coupled plasma-atomic emission spectroscopy (ICP-AES) was used to quantitatively analyze the mass fraction of the components of M(C, N) and M3C, and small-angle X-ray scattering (SAXS) was used to measure the nanoprecipitates’ particle diameter distribution of M(C, N). In our study, the experimental current was 45 mA. The operation method complied with the international standard ISO 13,762 and the Chinese standard GB/T 13221.

3. Results

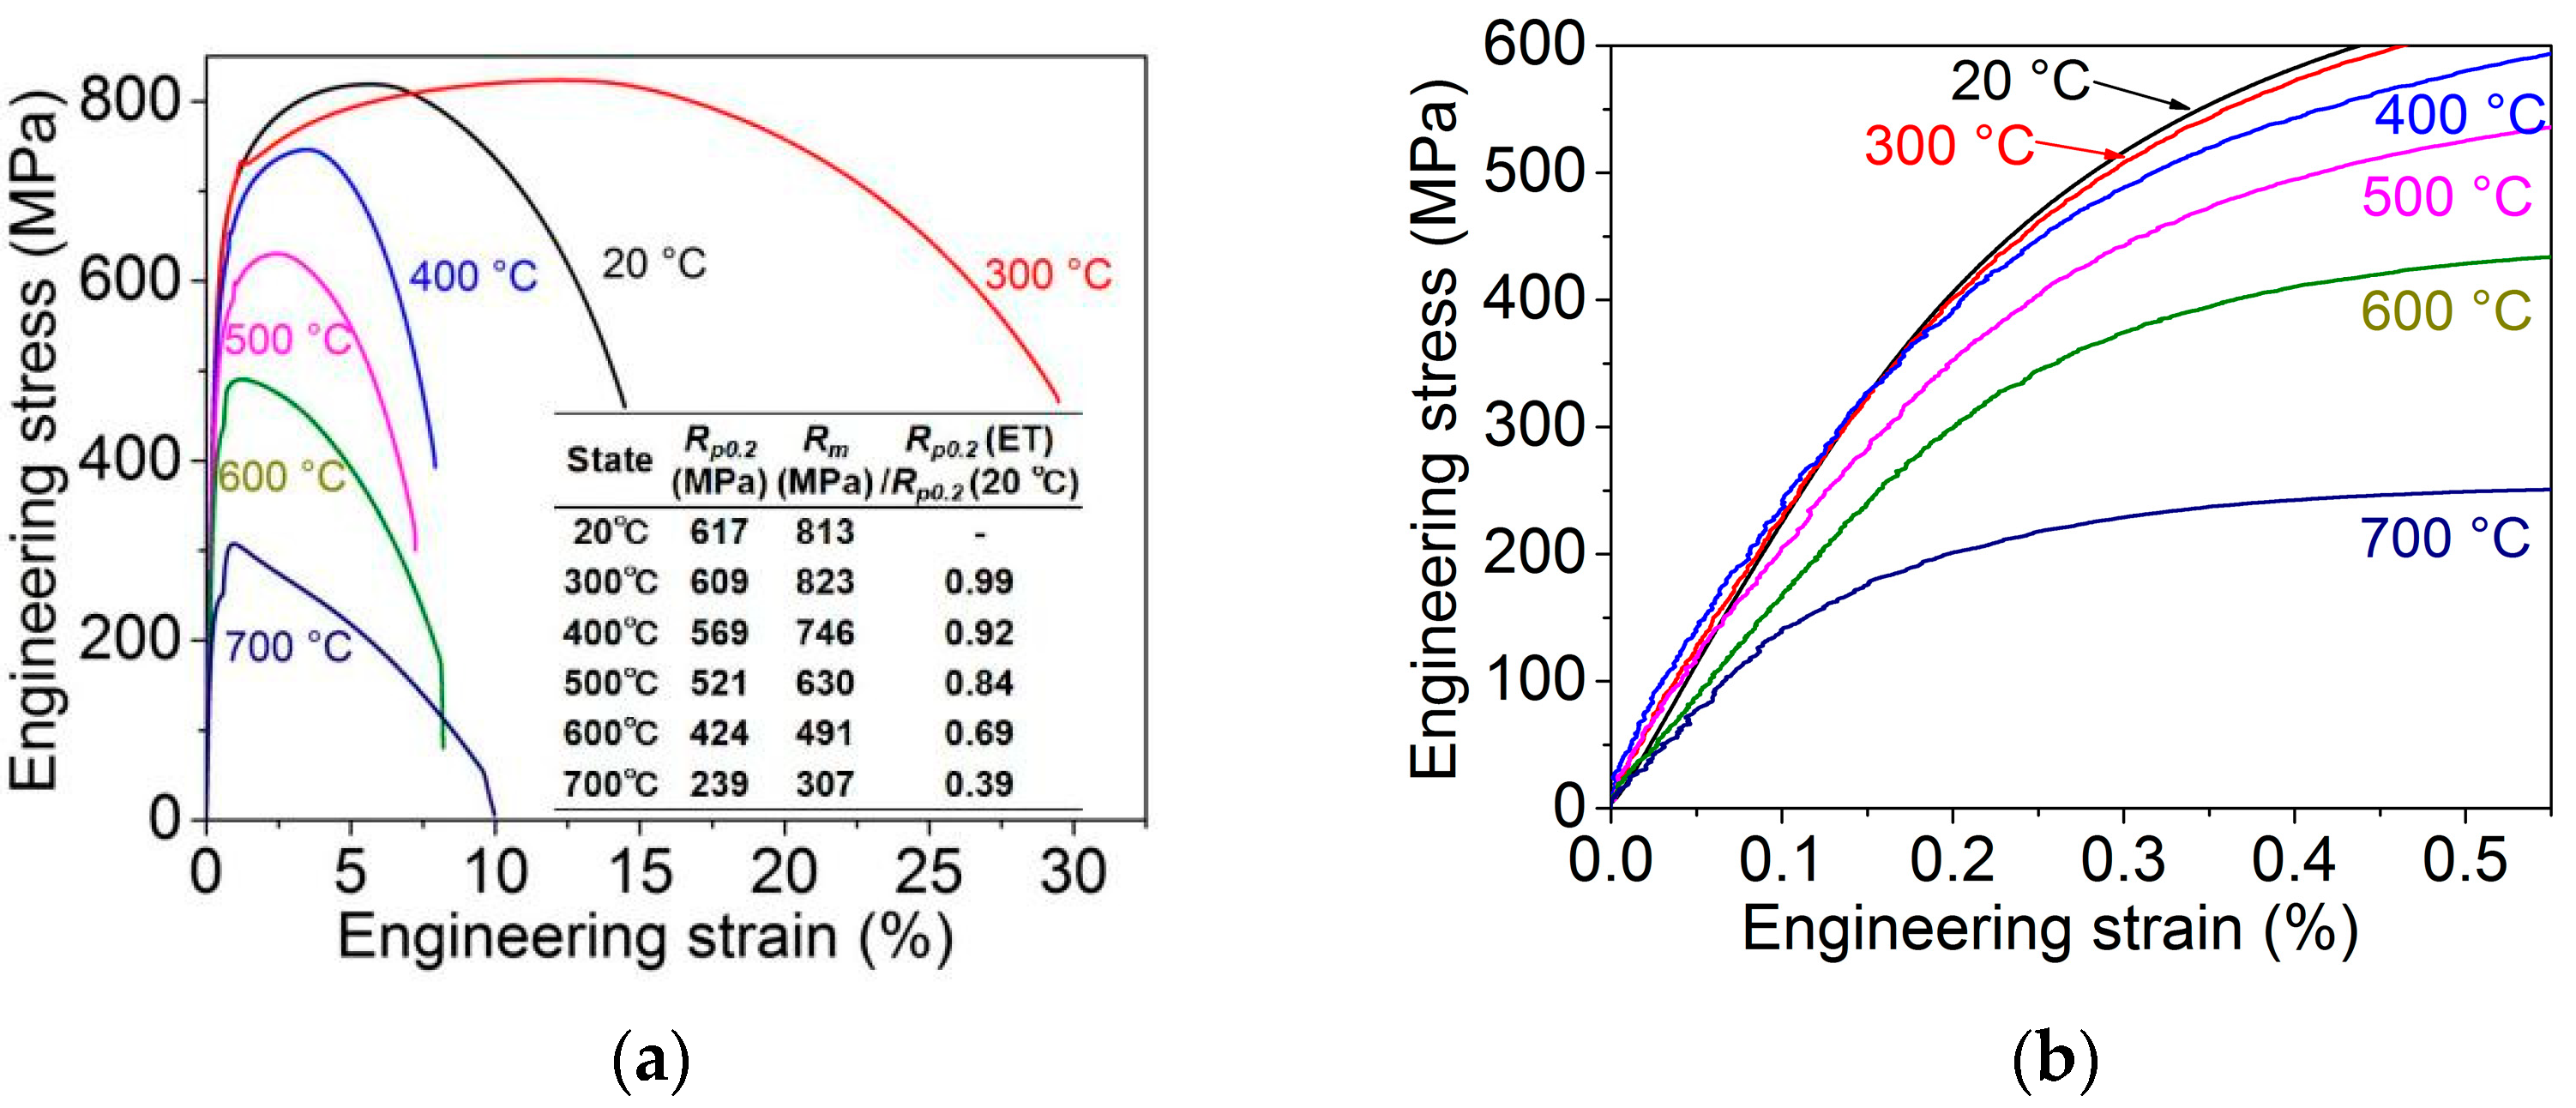
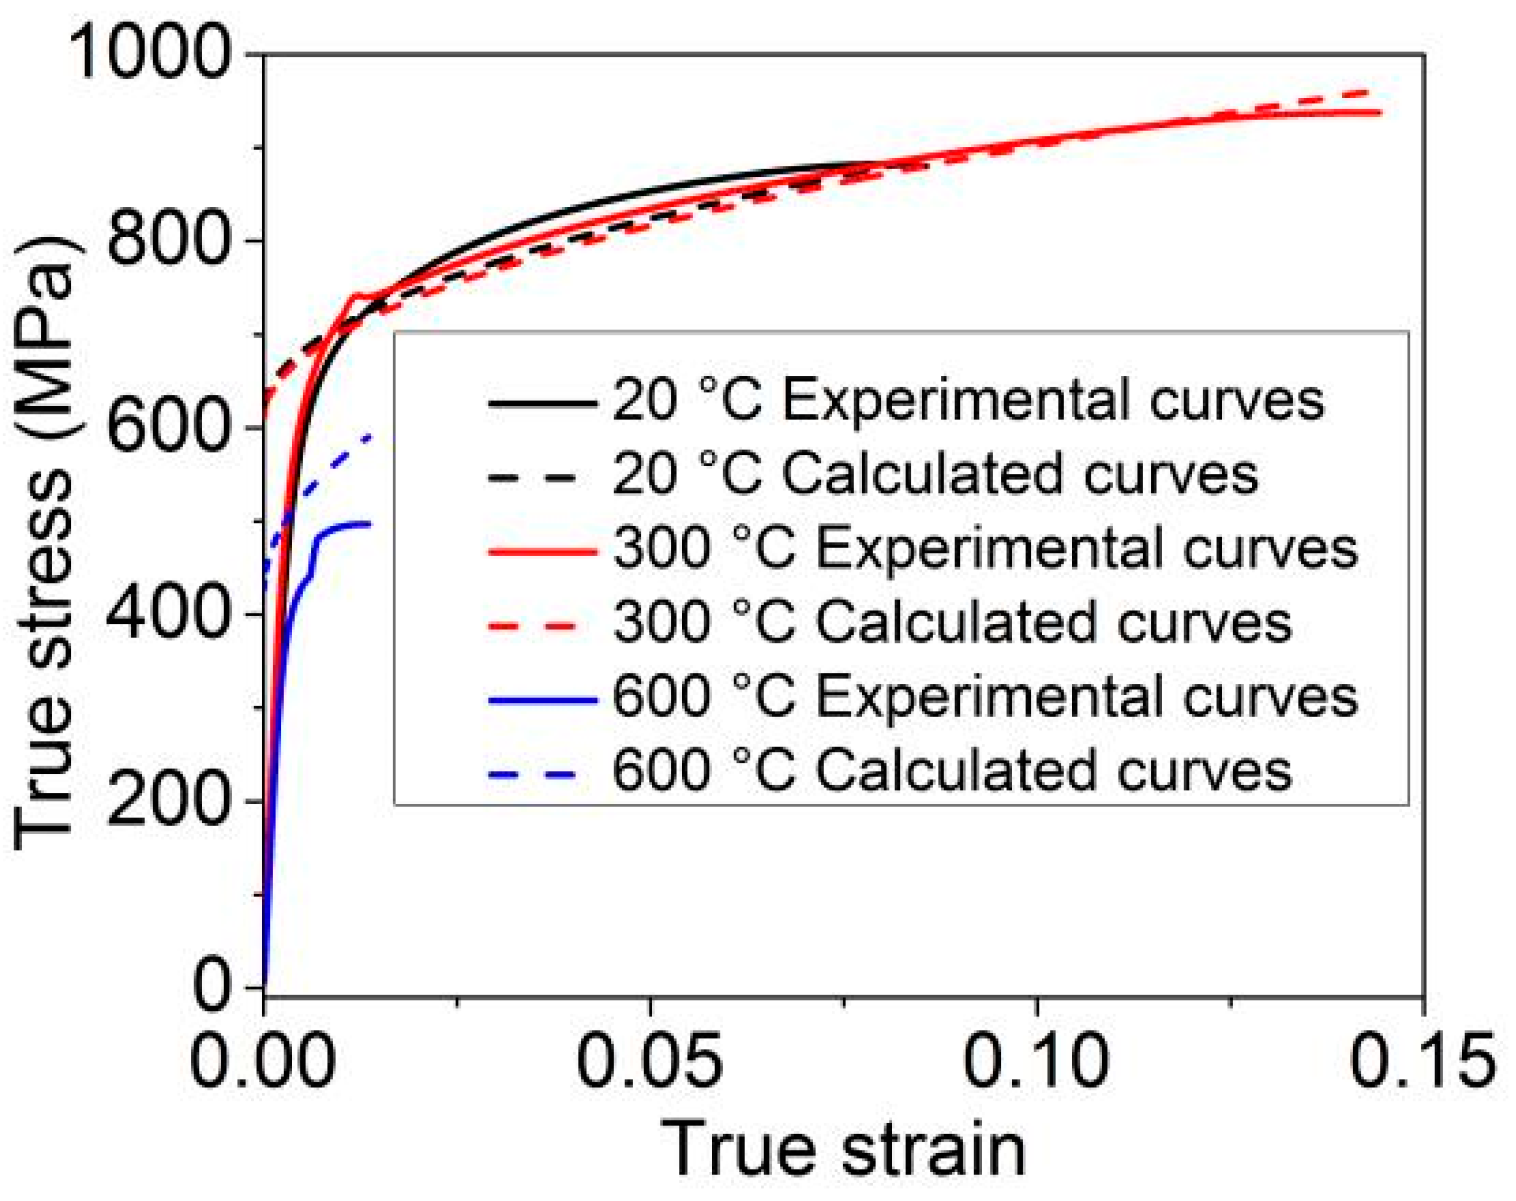
3.1. Tensile Properties at Different Temperatures

Figure 2a,b show the engineering stress-strain curves and enlarged views at different temperatures, as well as their corresponding yield strengths and tensile strengths. After hot rolling, the experimental steel exhibits a yield strength and tensile strength of 617 MPa and 813 MPa at room temperature (elongation = 18.5%), respectively. The yield strength decreases from 617 MPa at room temperature to 239 MPa at 700 °C. The abnormal inflection points in the curves are caused by an abrupt change in electrical information due to the removal of the extensometer (the gauge length of the extensometer is 25 mm). The trends of the tensile strength and yield strength are similar, but the tensile strength at 300 °C (823 MPa) is greater than that at room temperature (813 MPa) due to the deformation aging of interstitial atoms such as C and N.
In general, the yield strength of HSLA steels is related to the shear modulus of elasticity G. A reduction in the shear modulus at different temperatures is mainly due to a reduction in Young’s modulus of elasticity, which can be calculated by Equation (1) [33]:
G = E 2 ( 1 + υ )
where E is Young’s modulus of elasticity, and υ is Poisson’s ratio, with a general value of 0.291 [34]. The Young’s modulus E of experimental steel can be obtained by fitting the data during the elastic deformation stage from the experimental engineering stress-strain curves of steel [22]. The Young’s modulus E at different temperatures is plotted in Figure 3, which decreases from 209.09 GPa at room temperature to 136.74 GPa at 700 °C. As Young’s elastic modulus of metallic materials mainly depends on their interatomic bonding forces, which are sensitive to temperature [33], E decreases significantly upon increasing the temperature.
According to empirical Equations (2) and (3), the general equations for calculating Young’s modulus E are [30]:
E(MPa) = 230,660−76.655T (20–583 °C)
E(MPa) = 385,350−257.41T (583−911 °C)
The empirical equations for shear elastic modulus G are (4) and (5):
G(MPa) = 89,334−29.688T (20−583 °C)
G(MPa) = 149,245−99.694T (583−911 °C)
The calculated results are shown in Figure 3, which shows that the measured values are consistent with the calculated values; however, the measured values are all higher than the calculated values.

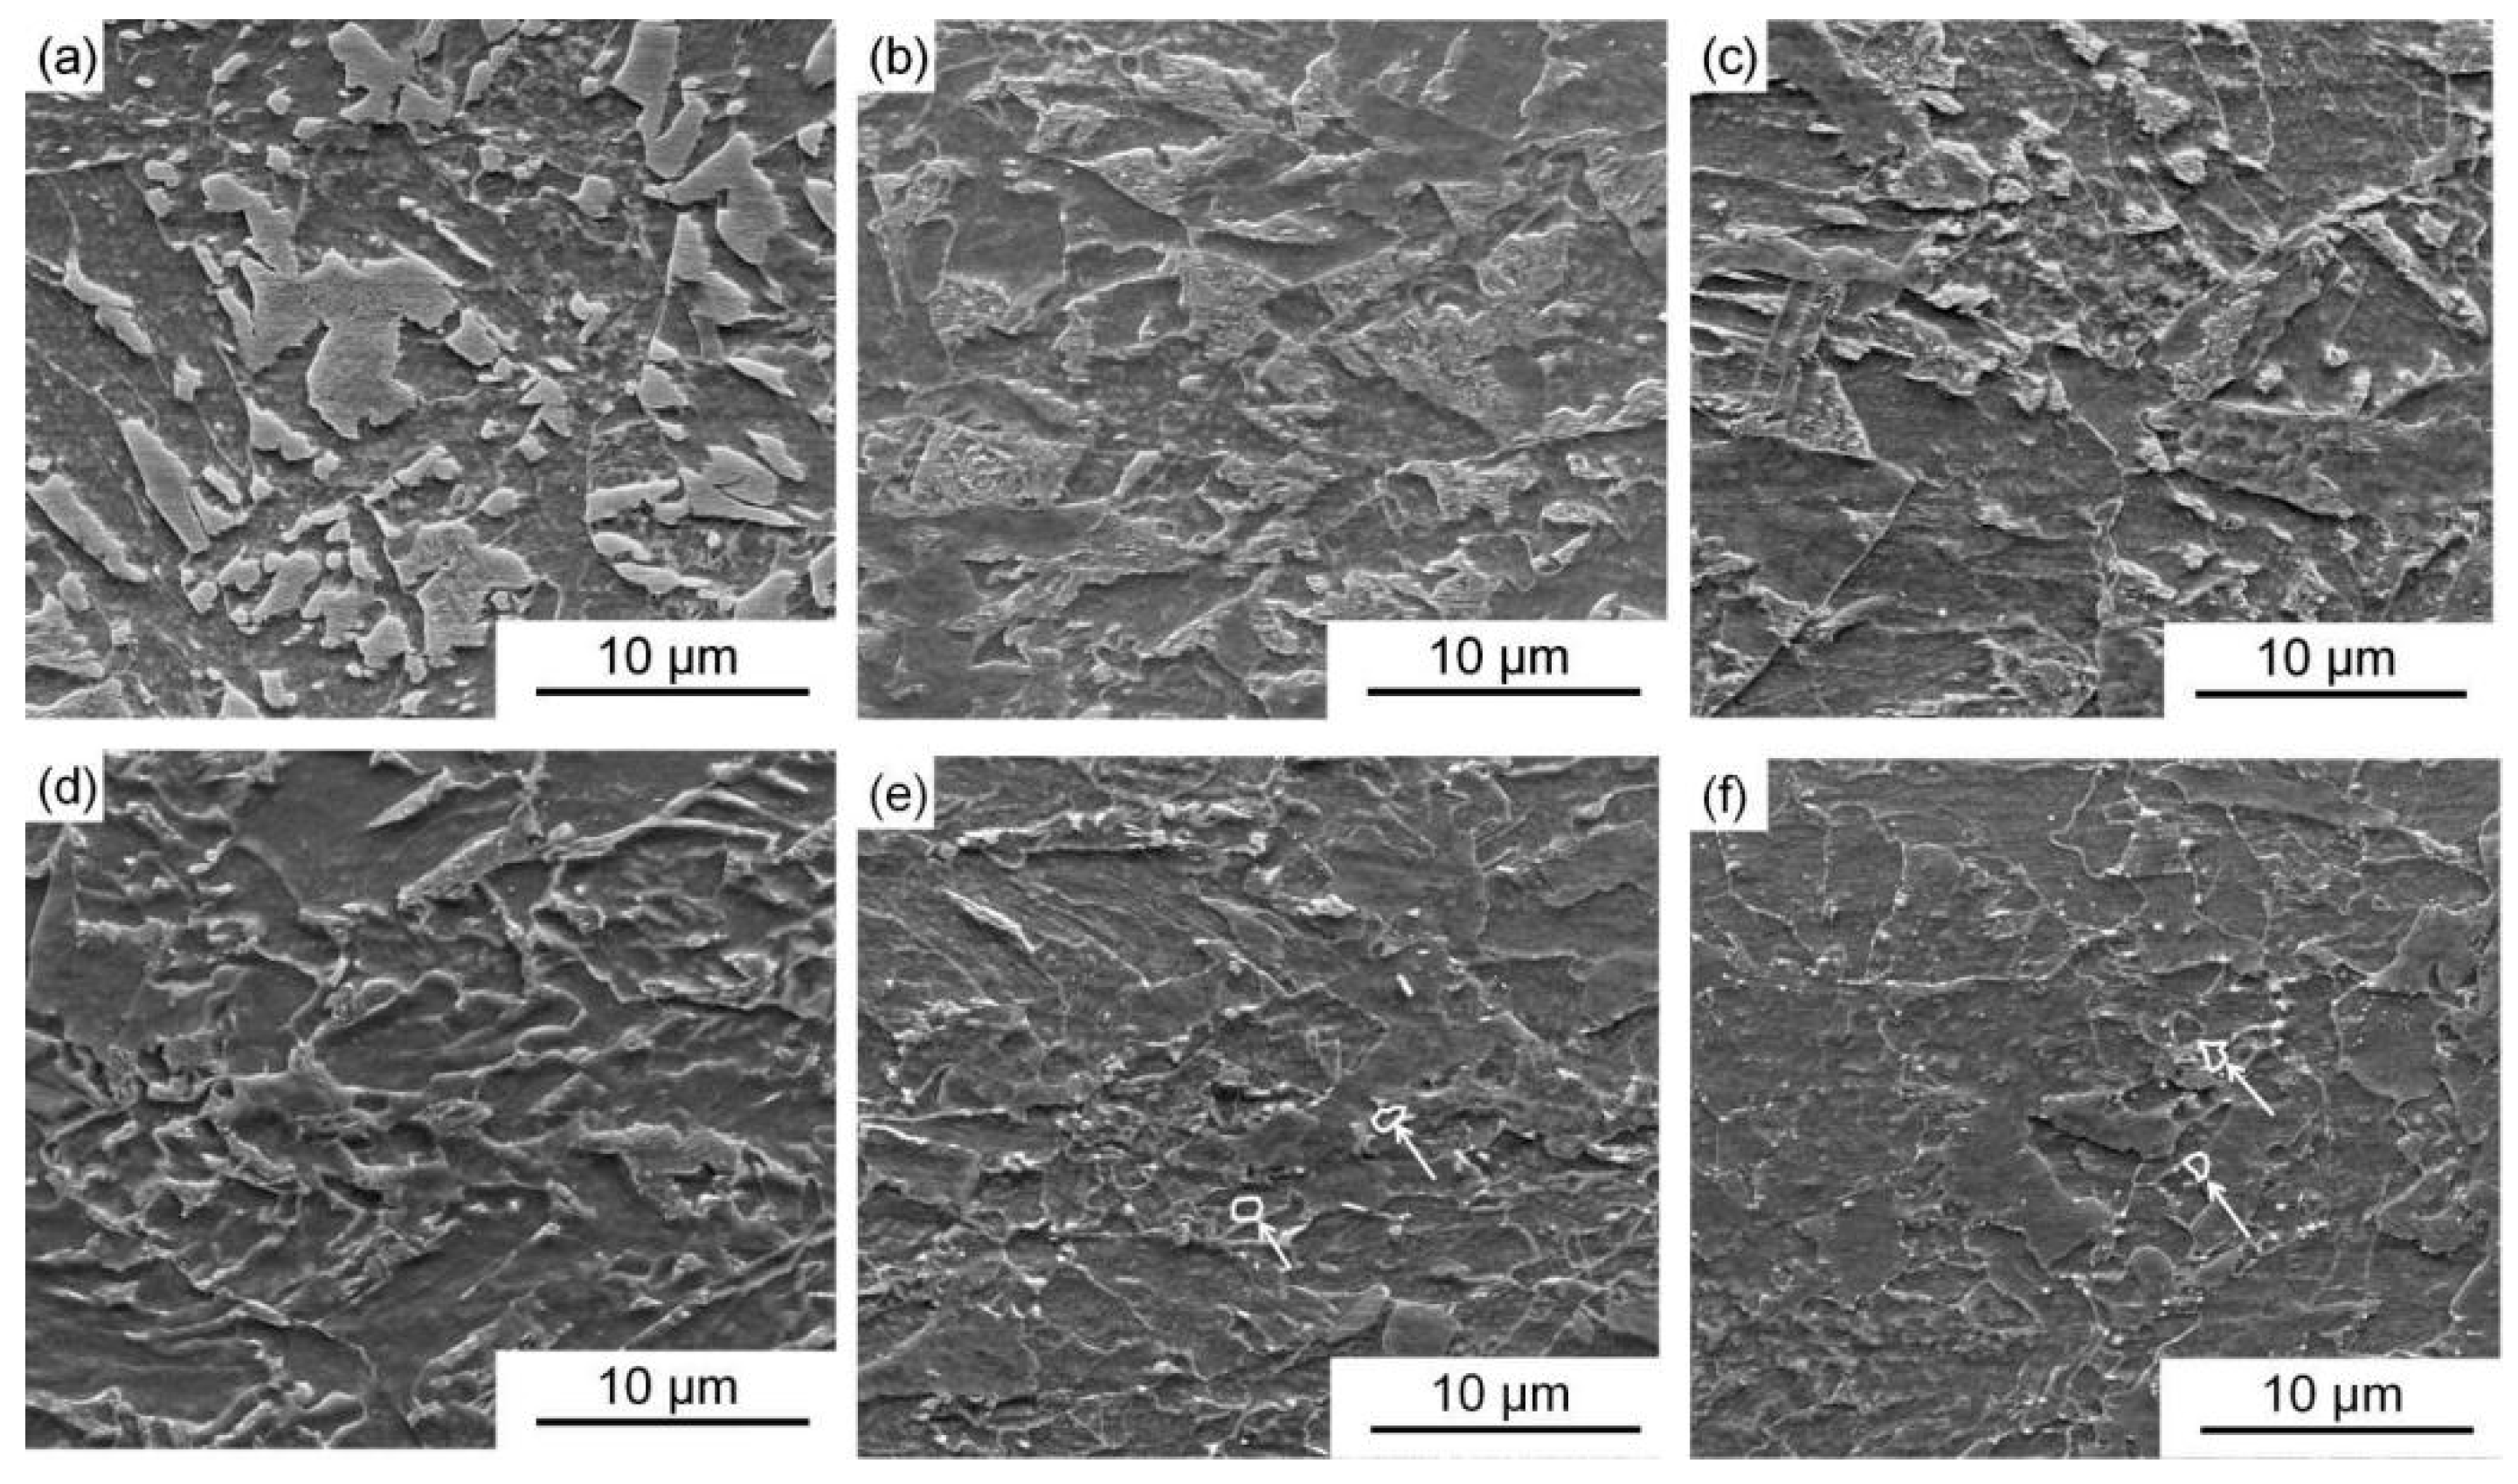
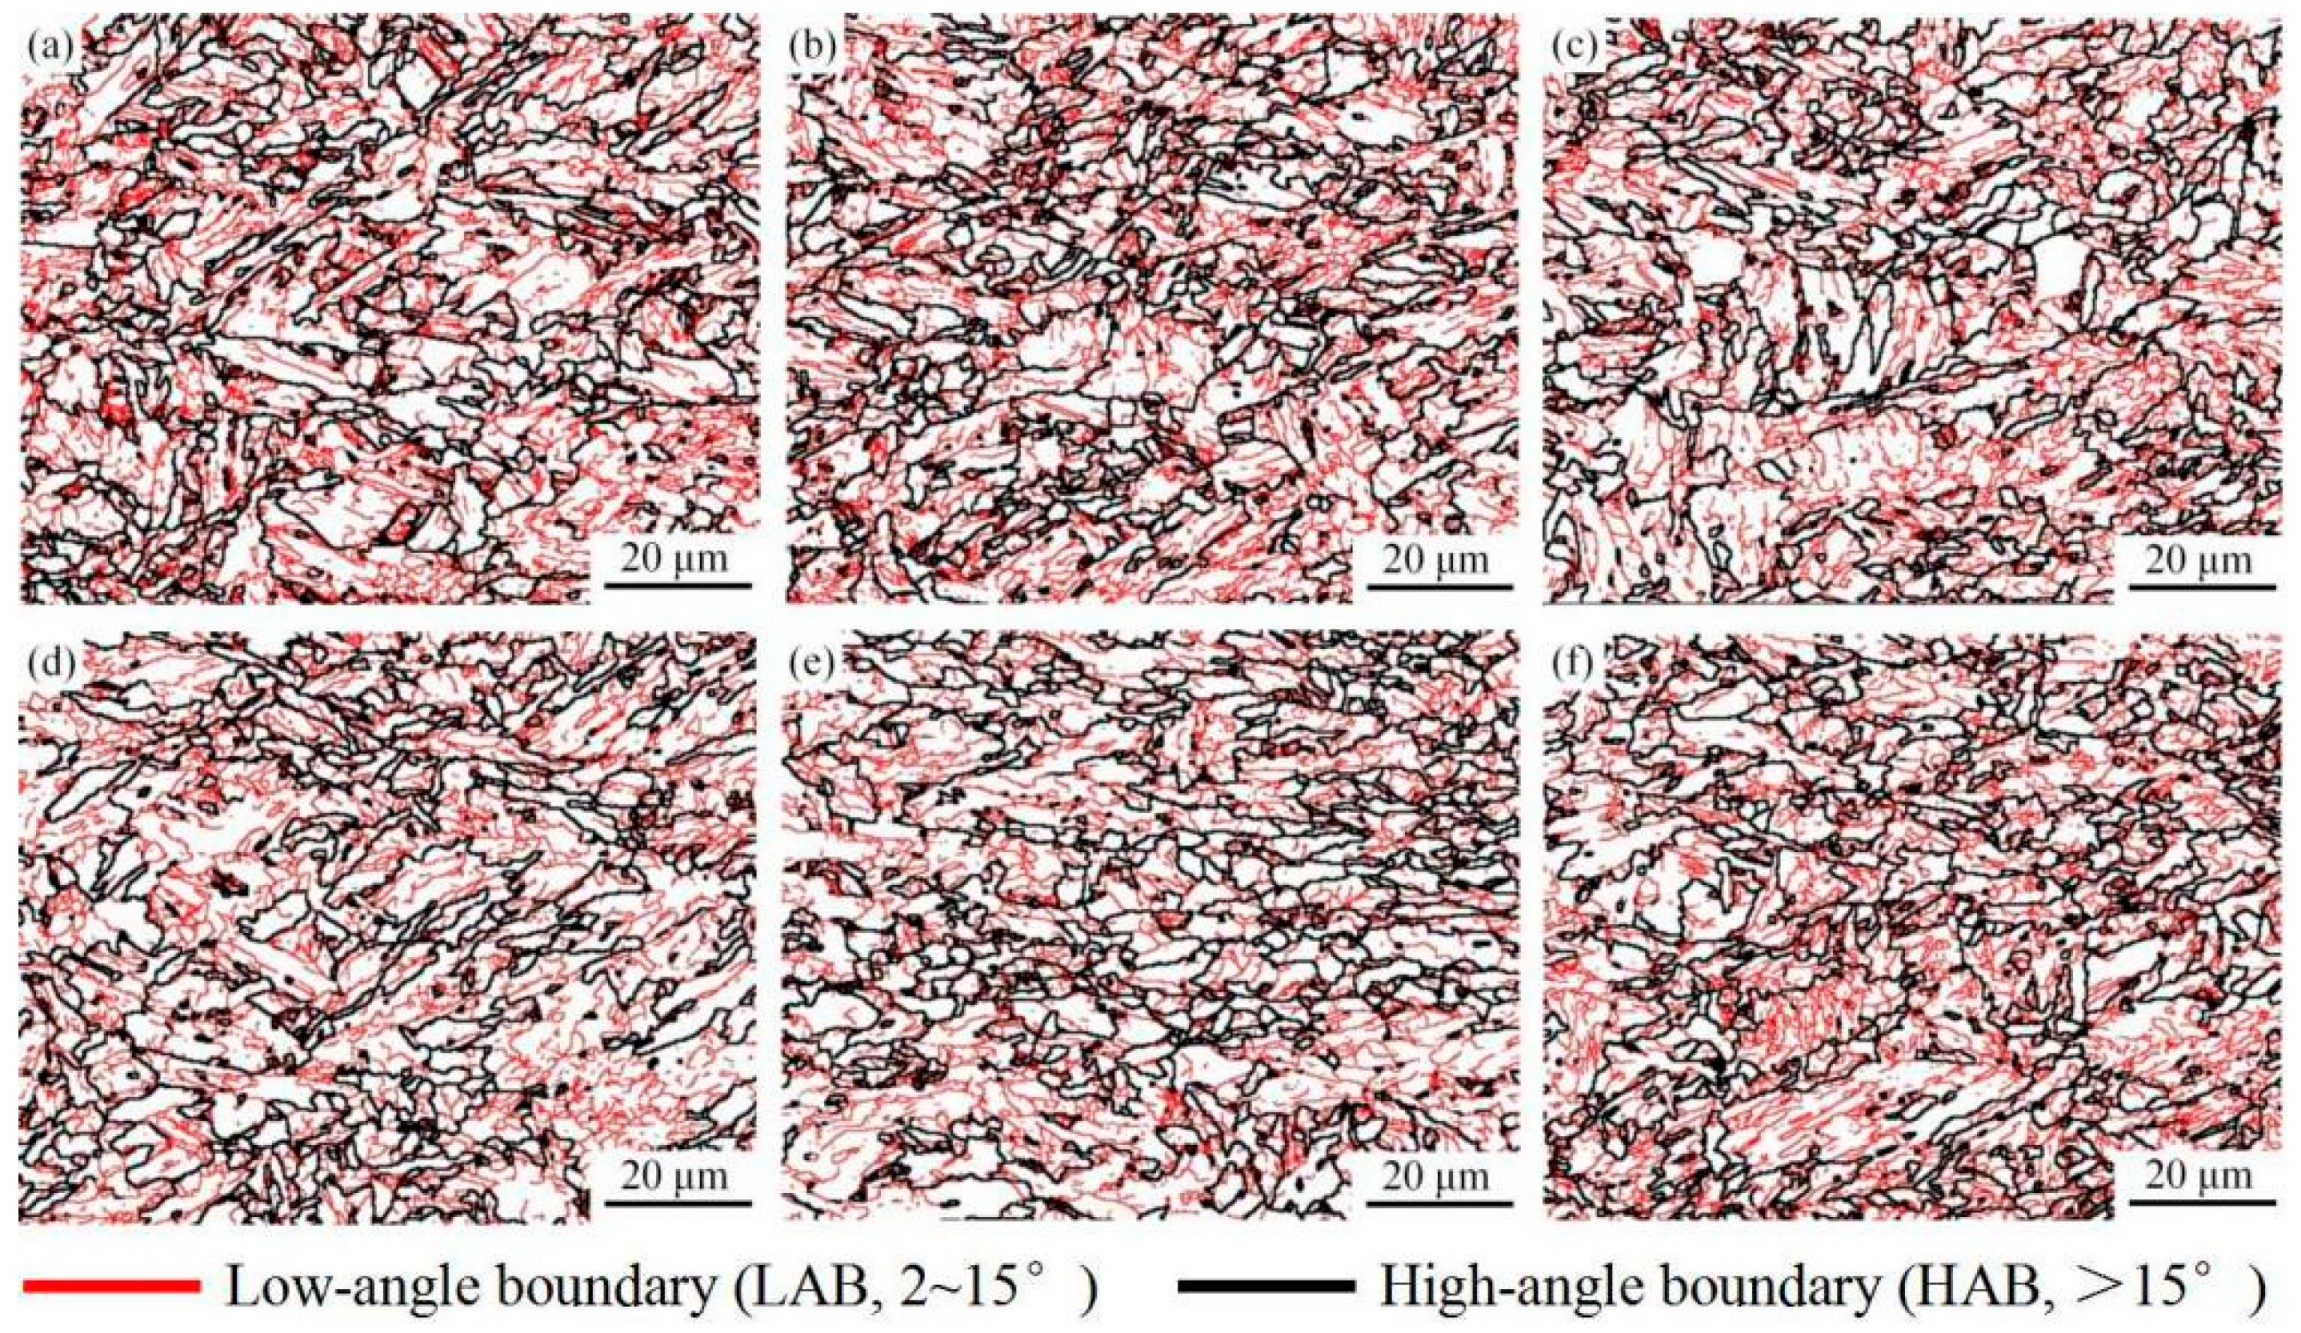
3.2. Microstructures

Figure 4 presents the SEM images of the microstructures of the as-rolled steel and high-temperature tensile specimens at different temperatures. It can be seen that a multi-phase microstructure consisting of bainite ferrite and MA islands is obtained in the as-rolled specimen. There are both block polygonal MA islands with a size of about 10 μm, as well as small ellipsoid and spherically-shaped MA islands with a diameter of only 1–2 μm. After high-temperature tensile tests at 300 and 400 °C, the MA islands in the ferrite matrix undergo tempering decomposition. The MA islands decompose further at 500 °C, and the bainite ferrite microstructure of the matrix begin to recover. The MA island constituents are completely decomposed, leaving only a small number of fine carbide particles, and a few tiny recrystallized grains (denoted by the arrow) appear at the grain boundaries at 600 and 700 °C.
To illustrate the grain sizes of ferrite at different temperatures, EBSD analysis was carried out on the experimental steel after high-temperature tensile tests. The grain boundary distribution is shown in Figure 5. In the figure, the low-angle boundary (LAB) with a 2–15° misorientation is highlighted by a thin red line, and the high-angle boundary (HAB) with a misorientation of >15° is represented by a thick black line.
The HKL CHANNEL 5 software was used to analyze the grain size distribution of bainite ferrite at different temperatures, as shown in Figure 6a–f, and to count the average grain size of the matrix. The grain size of the matrix is not uniform and ranges from a few microns to over 30 microns. The majority of grains are smaller than 10 μm. The average grain diameters of the matrix at different temperatures are 12.5, 12.7, 13.6, 13.1, 13.3, and 13.0 μm, respectively. The interface density for different temperatures can be calculated as:
ρGB = LGB/A
where LGB is the total interface length and A is the scanning area. As shown in Figure 6g, the high-angle boundary density is unchanged at different temperatures. As the experimental temperature increases, the low-angle interface density decreases under 600 °C; however, the low-angle interface density increases again at 700 °C. Nanoprecipitates not only hinder dislocation glide but also facilitate dislocation multiplication [35]. Recovery and recrystallization decrease the dislocation density at elevated temperatures, but many nanoprecipitates promote dislocation multiplication, which increase the low-angle interface density at 700 °C.

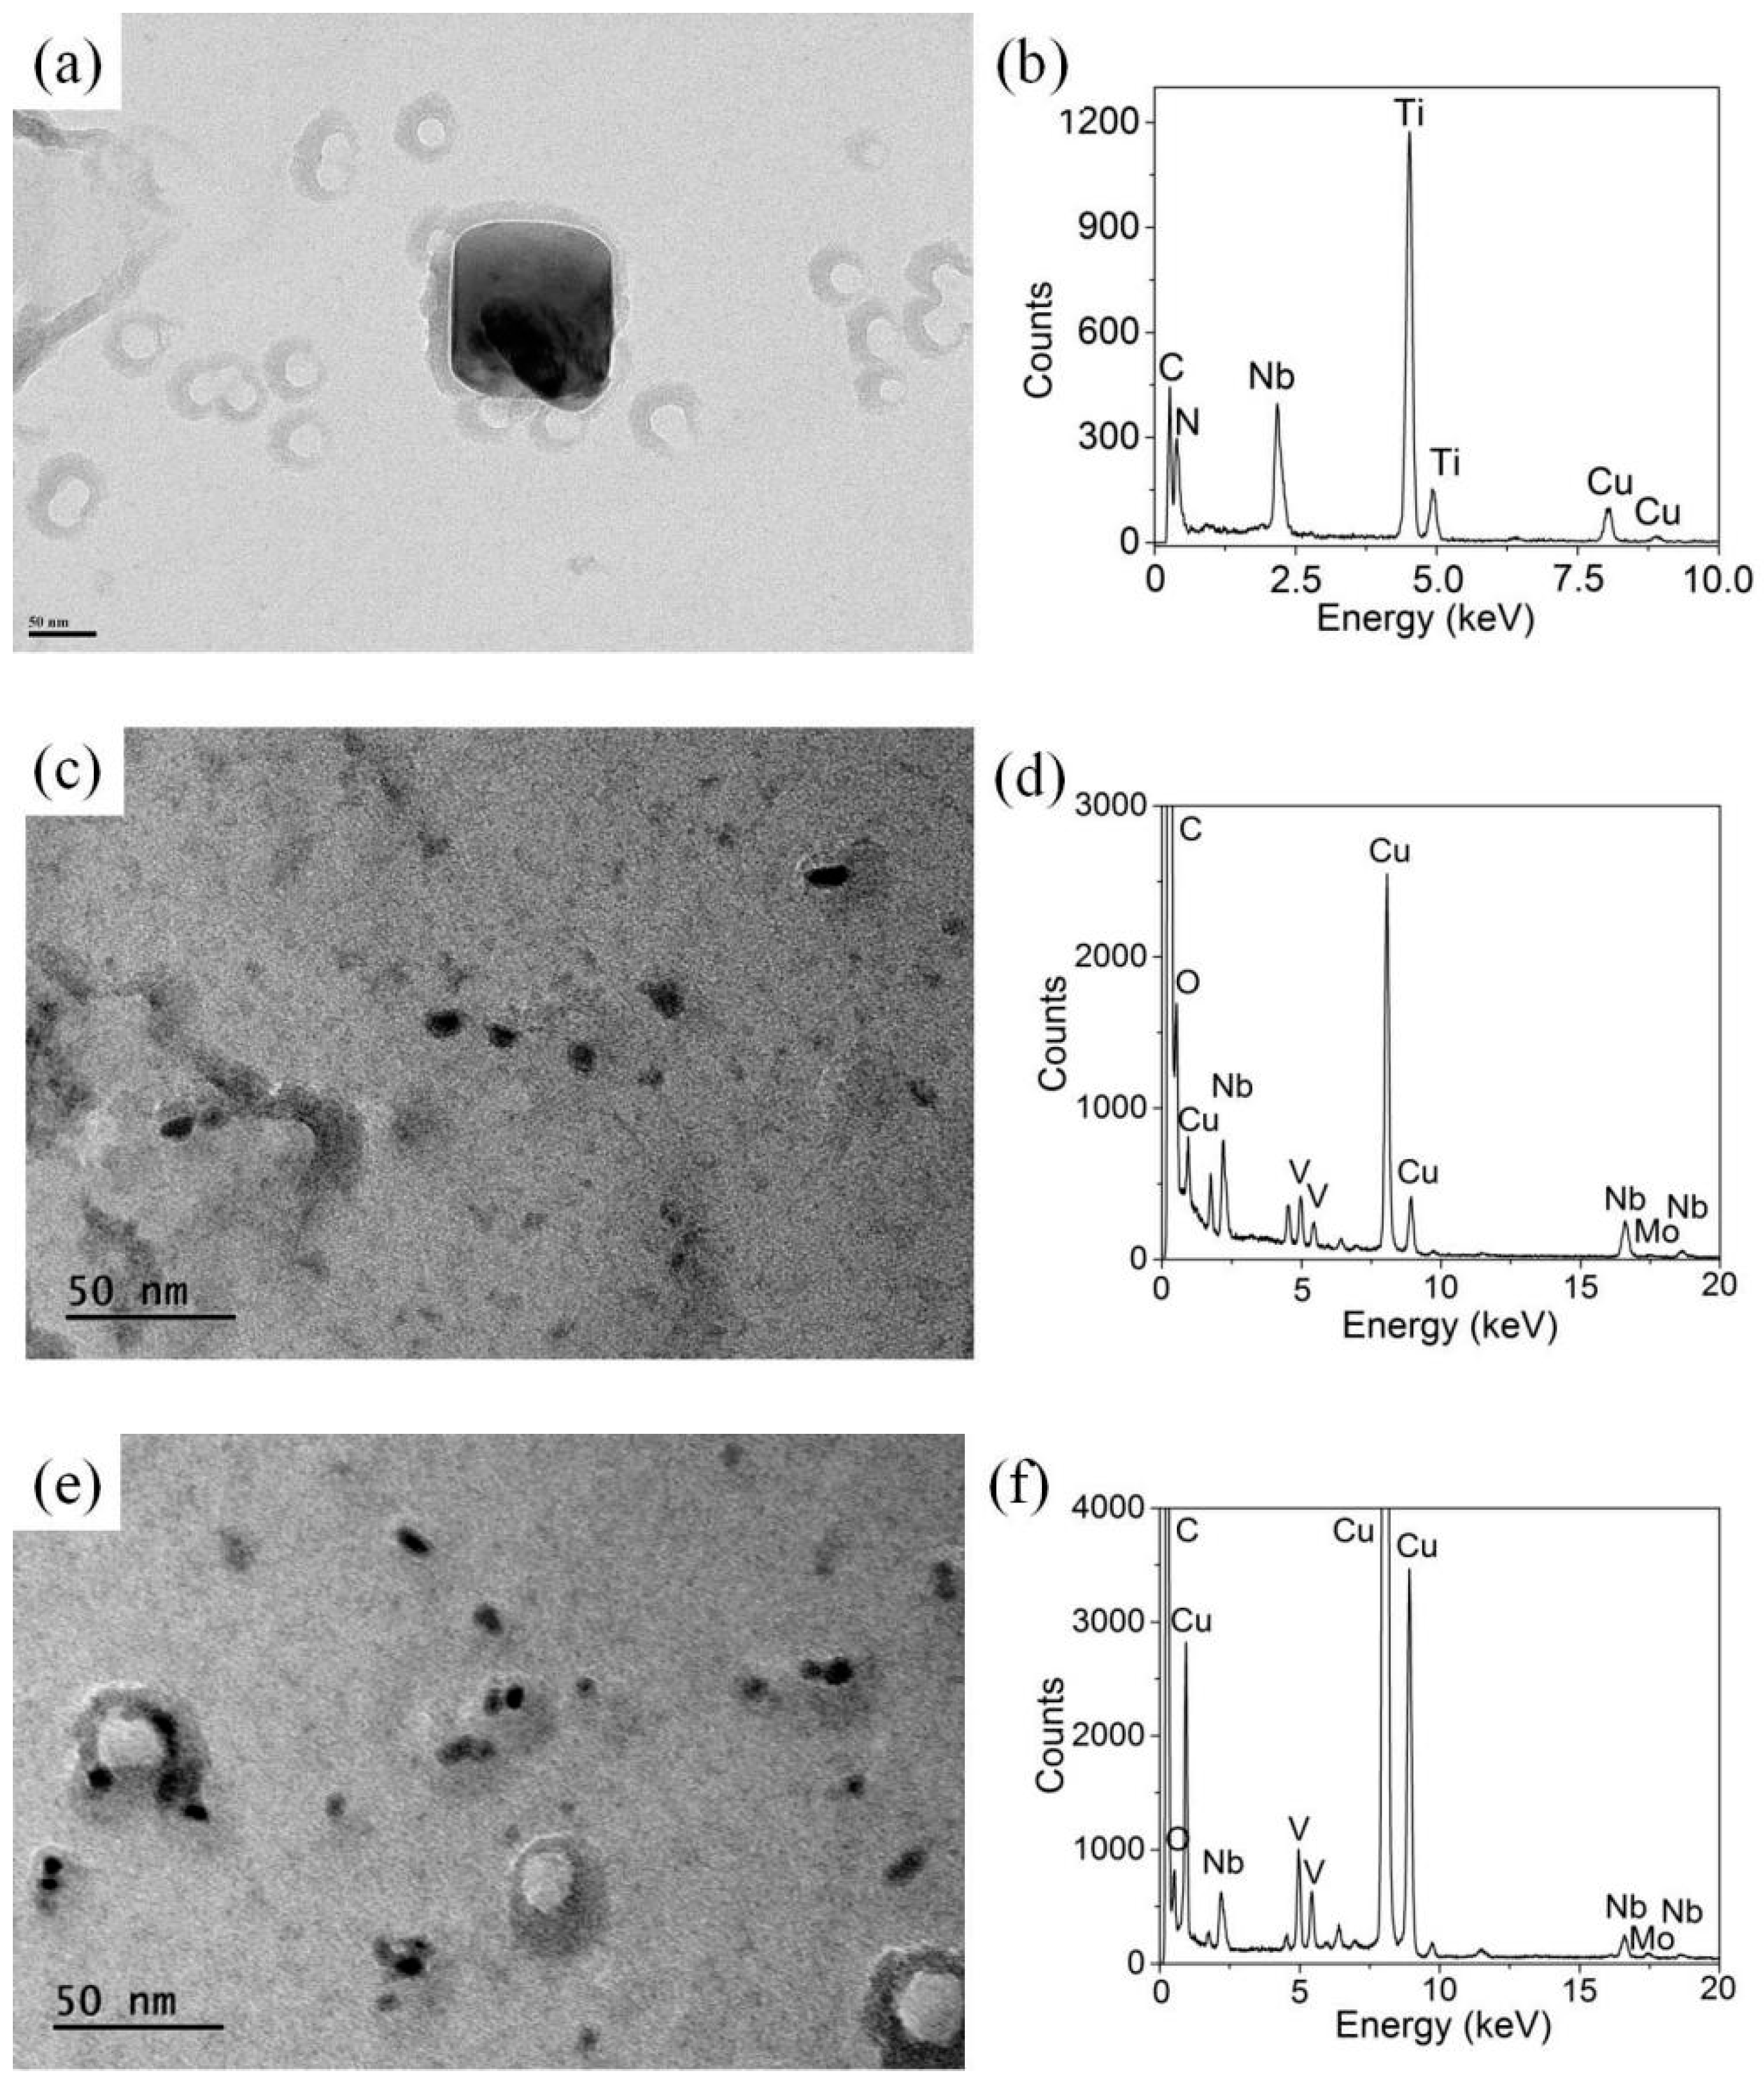
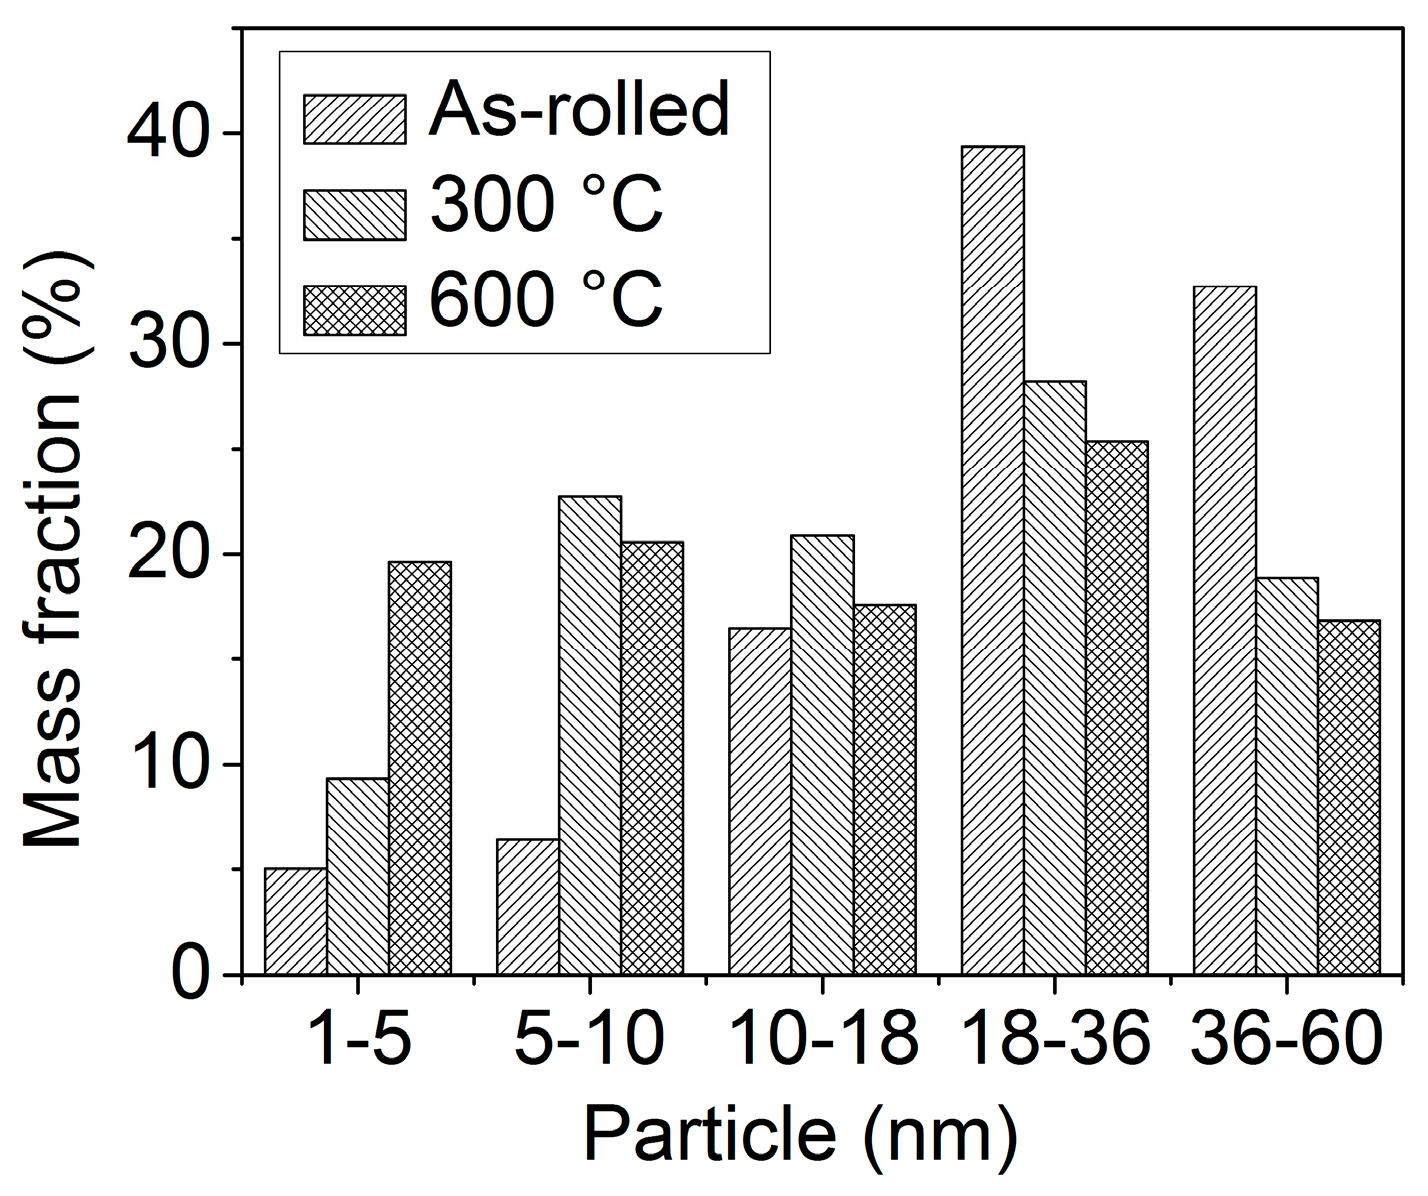
3.3. Nanoprecipitation

Figure 7 shows TEM images of the morphology of the precipitates at different temperatures. There are some precipitates with sizes of tens of nanometers in the as-rolled state in Figure 7a. Energy-dispersive spectroscopy (EDS) analysis in Figure 7b shows that they are (Ti, Nb)N. TiN is mainly formed in the liquid-phase region or high-temperature δ-austenite region, so most of the Ti atoms and N atoms are precipitated. A part of the Ti in TiN is replaced by precipitated Nb during rolling. The appearance of the Cu peak is due to the use of a Cu mesh as the carrier mesh. There are also a few elliptical and round nanoprecipitates in the as-rolled state, as shown in Figure 7c. The EDS analysis (Figure 7d) shows that they are mainly (Nb, V, Mo)C nanoprecipitates. Generally, the diameter of secondary-phase precipitated particles in steel materials is larger than the critical transformation diameter, so the strengthening mechanism mainly involves the Orowan mechanism, that is, the bypass mechanism. When the diameter of the precipitated particles is ≥60 nm, the strengthening effect is very weak, so the strengthening effect of (Ti, Nb)N particles is not obvious, In contrast, the fine (Nb, V, Mo)C particles display a strong strengthening effect. Upon increasing the temperature, many fine (Nb, V, Mo)C nanoprecipitates appear at 600 °C (Figure 7e), which are significantly smaller than the average size of nanoprecipitates in the as-rolled specimen.
Table 2 lists the phase analysis results of carbonitrides at different temperatures. The mass fractions of the M(C, N) phases are 0.050% and 0.043% in the as-rolled specimen and in the specimen tempered at 300 °C for 15 min, respectively. As the temperature increases, the mass fraction of the carbonitrides after holding at 600 °C for 15 min increases to 0.119%. The mass fraction of precipitates is 2.38 times higher at 600 °C compared with that of the as-rolled specimen. The mass fractions of C, Nb, V, and Mo increase with temperature, whereas those of N and Ti do not change with temperature, for the reasons discussed above; therefore, the composition of the carbonitrides is (Nb, V, Mo)C precipitation, which has a strong precipitation strengthening effect. They are mostly precipitated during tempering.
Table 3 indicates the phase analysis results of the M3C at different temperatures. The mass fraction of the M3C precipitates is lowest in the as-rolled specimen due to a higher cooling rate and a lower laminar cooling temperature. At 300 °C and 600 °C, the MA islands decompose, and the released C atoms increase the mass fraction of M3C to 0.147% and 0.633%, respectively.
A chemical method can be performed to separate the carbonitrides in the alloy from the cementite but not vice versa; therefore, the diameter distribution of (Nb, V, Mo)C-phase particles at different temperatures was conducted by small-angle X-ray scattering. Figure 8 presents the diameter distribution plot of (Nb, V, Mo)C precipitates at different temperatures. The proportion of (Nb, V, Mo)C nanoprecipitates with a diameter of less than 10 nm after tempering is evidently more than that in the as-rolled specimen. The average diameter of (Nb, V, Mo)C nanoprecipitates is 29.2 nm in the as-rolled specimen, 21.6 nm at 300 °C for 15 min, and 19.4 nm at 600 °C for 15 min. These results also illustrate that the nanoprecipitates formed during rolling have excellent coarsening resistance. There is a certain amount of Mo in the nanoprecipitates, which can decrease the interfacial energy of the nanoprecipitates/matrix and also postpone the diffusivity of Nb atoms [25].

4. Discussion

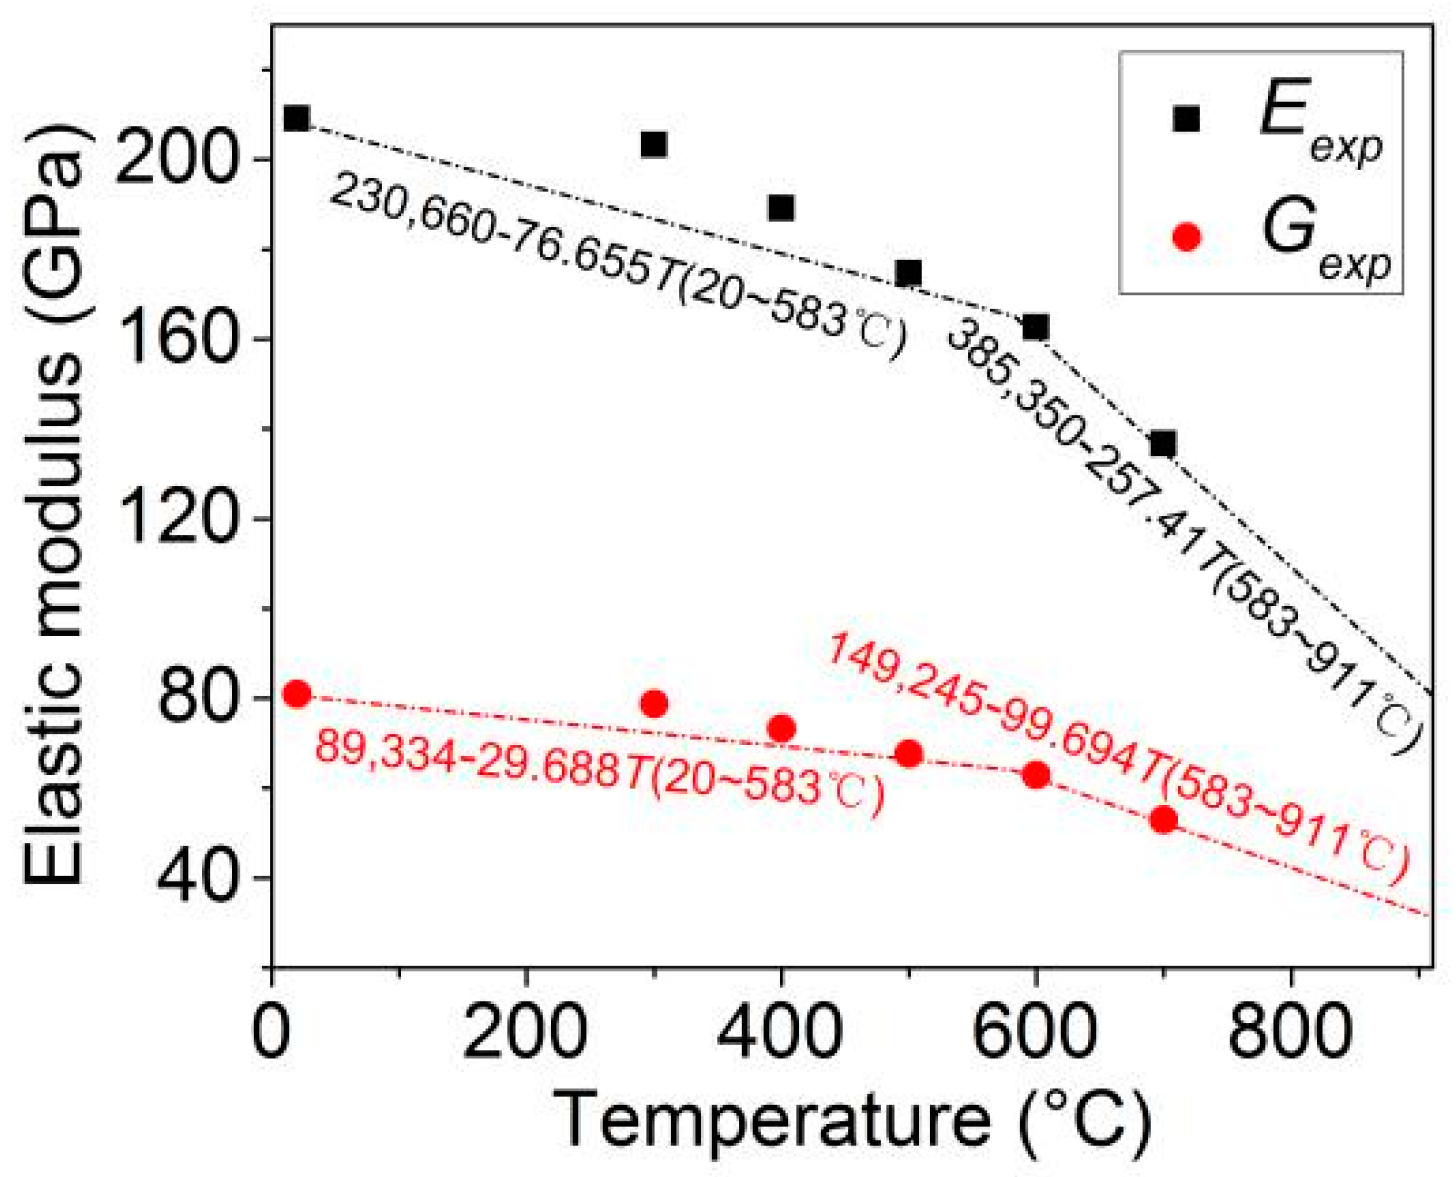
4.1. Tensile Properties at Different Temperatures

As shown in Figure 2, the temperature has a great effect on the strength of microalloyed high-strength fire-resistant steel. In this part, the strengthening mechanisms of the nanoprecipitates at different temperatures are discussed quantitatively. The yield strength (YS) of steels is determined as a summation of the intrinsic friction stress (YS0), solid solution strengthening (YSs), grain boundary strengthening (YSg), dislocation strengthening (YSd), and precipitation strengthening (YSp) in the following equation.
YS = YS0 + YSs + YSg + YSd + YSp
Based on Equation (7), the increment in precipitation strengthening is calculated by subtracting the other strengthening increments from the tensile test-obtained yield strength. YS0 is the positive lattice friction resistance of iron, which is linearly correlated to its shear elastic modulus (G) [34]. At room temperature, the shear elastic modulus G is 8.10 × 10⁴ MPa and YS0 is 57.0 MPa [34]. The interstitial solid-solution elements will reduce the shear elastic modulus at elevated temperatures. Therefore, G is 7.87 × 10⁴ MPa at 300 °C and 6.30 × 10⁴ MPa at 600 °C, according to the discount ratio of G, and YS0 is 55.4 MPa at 300 °C and 44.3 MPa at 600 °C.
Solid solution strengthening can be calculated using the following equation [34]. It is affected by the mass fraction of the alloy solidly dissolved in a solid solution.
YSs = 4570 WC + 4570 WN + 32 WMn + 84 WSi + 67.6 WP + 11 WMo + 38 WCu + 80 WTi + 3 WV − 30WCr
In the equation, WX indicates the mass fraction of the alloy solidly dissolved in the experimental steel; WC, WMn, WMo, and WCr are the mass fractions of solid solution C, Mn, Mo, and Cr after deducting the C, Mn, Mo, and Cr precipitated in carbonitrides and alloying cementite, respectively [17]. Si and P elements are ferrite-forming elements that usually dissolve in the ferrite matrix. Almost all of the N and Ti elements react to form TiN particles in the liquid-phase zone, which removes most N and Ti elements in the solid solution. Furthermore, considering the discount ratio of G at elevated temperatures, YSs values are 246.2 MPa in the as-rolled specimen, 230.8 MPa at 300 °C for holding 15 min, and 45.0 MPa at 600 °C for holding 15 min.
Grain boundary strengthening is affected by the effective grain size of the ferrite matrix and is expressed using the Hall-Petch equation:
YSg = kyd−1/2
In a previous report, a ky value of 17.4 MPa·mm1/2 was reported in the mild steel [34]. Thus, the value of YSg is 153.8 MPa in the as-rolled specimen. Considering the discount ratio of G at elevated temperatures, YSg values are 168.6 MPa at 300 °C for holding 15 min and 135.1 MPa at 600 °C for holding 15 min.
In this study, laminar cooling was conducted at a ≥15 °C/s cooling rate to acquire a large number of high-density dislocations in the bainite. Dislocation strengthening YSd can be expressed as [34]:
YSd = 2αGbρ1/2
In the equation, α is a constant and its value is 0.38 for a body-centered cubic system; b is the Burgers vector and its value is 0.248 nm; ρ is the dislocation density, which is analyzed using XRD and comprehensively estimates the dislocation density based on peak broadening followed by the Williamson-Hall equation and the low-angle boundary density [36,37]. The dislocation densities values are 5.27 × 107 mm−2 in the as-rolled specimen, 5.15 × 107 mm−2 at 300 °C for holding 15 min, and 3.99 × 107 mm−2 at 600 °C for holding 15 min; therefore, the dislocation strengthening increments YSd are 110.8, 106.5, and 75.0 MPa, respectively.
Table 4 lists the various strengthening contribution values at different temperatures. The as-rolled specimen and the 300 °C specimen exhibit significant contributions from solid solution strengthening and dislocation strengthening. These values are significantly lower, and the precipitation strengthening contribution is significantly higher in the 600 °C specimen.
It is well known that precipitation strengthening in HSLA steel occurs via the bypass-type mechanism for nanoprecipitates, which play a significant strengthening effect. In this study, the common Orowan equation and the Ashby-Orowan equation were considered. In the former equation, the precipitation strengthening can be expressed using the following equation [38]:
σ Orowan = 0.8 M G b L MC
LMC is the average distance between nanoprecipitates and can be expressed using Equation (12), assuming that the nanoprecipitates are uniformly distributed.
L MC = 2 3 ( π f 2 ) × r M C
rMC is the average radius in Figure 8, whose values are 14.6, 10.8, and 9.7 nm, respectively, and f is the volume fraction of the nanoprecipitates in Table 2. In addition, the common Orowan equation has been revised to consider the interactions between two kinds of dislocation lines near nanoprecipitates in the Ashby-Orowan equation. The strengthening increment in the Ashby-Orowan equation can be expressed using the following equation [38]:
σ Ashby - Orowan = 0.8 M G b 2 π L MC 1 υ × ln ( x 2 b )
x = 2 2 3 × r M C
In the equation, G is the shear modulus, whose value changes with temperature, as shown in Figure 3. υ and M are the Poisson’s ratio and Taylor factor, respectively, which have values of 0.291 and 2.75 for a body-centered cubic system [34]; b is 0.248 nm [34]; rMC is the average radius, as shown in Figure 8. According to the above two bypass-type mechanisms, the increment in precipitation strengthening was calculated and is shown in Figure 9.
Figure 9 plots the calculated precipitation strengthening increment for the common Orowan equation and the Ashby-Orowan equation. In the as-rolled state and 300 °C, the calculated strengthening increment is consistent with the experimental value (i.e., the yield strength subtracts other strengthening contributions); however, there is a large deviation in the 600 °C specimen. The Orowan equation can more reasonably explain the precipitation strengthening increment of the nanoprecipitates at elevated temperatures. Compared with the Orowan equation, the Ashby-Orowan equation considers the interactions between dislocation lines on both sides of secondary-phase particles. Dislocation loops can only be formed when the radius of curvature reaches dMC/2, so the calculated strengthening effect is lower; however, the thermal movement of dislocations increases, and the critical shear stress τ decreases, which makes it easy to form dislocation loops at 600 °C; therefore, the Orowan mechanism is closer to the true value at 600 °C [34,39].

4.2. Work Hardening Behavior

In general, the HSLA steel will neck during a uniaxial tensile test when the following plastic deformation condition is satisfied [40,41]:
σ > d σ d ε
σ = σT (1 + εT)
ε = ln (1 + εT)
σ is the true stress and ε is the true strain. / is the work hardening rate. σT is engineering stress and εT is engineering strain in Figure 2. Assuming a constant volume during uniform deformation, the engineering stress-strain curves in Figure 2 can be transformed into true stress-strain curves. The work hardening rate curves at different temperatures were acquired by differentiating the true stress with respect to the true strain. The acquired work hardening rate curves are plotted in Figure 10, along with the true stress-strain curves. The results show that the work hardening rate significantly decreases with the temperature, and the necking is more likely to occur. The critical stress for necking is not significantly different below 400 °C; however, the critical stress is significantly reduced above 500 °C due to dynamic recovery and recrystallization at this moment.
To better explain the work hardening behavior at different temperatures, the Ashby work hardening mechanism was applied to the results of this study. The Ashby work hardening mechanism explains work hardening by dislocation strengthening and can be expressed as [42,43]:
σ Y S = M α G b ρ
where YS is the yield strength and ρ is the density. In this study, both nanoprecipitates and effective grain boundaries can be used as positions for the generation of the dislocation. It is generally assumed that the total density of the dislocation consists of ρp and ρg, and Equation (19) can be written as [44]:
σ Y S = M α G b ρ p + ρ g
σ Y S = M α G b 8 M f b d ε + 1 4 b d g ε
where M is 2.75 [34], d is smaller than 30 nm, f is shown in Table 2, and dg is about 13 μm; thus, the value of ρp would be much larger than that of ρg, so the value of ρg is usually negligible in this calculation. Therefore, the work hardening equation can be written as:
σ Y S = M α G b 8 M f d ε
According to Equation (21), the Ashby work hardening curves are plotted in Figure 11. The calculated stress-strain curves are consistent with the tensile test curves obtained at room temperature and 300 °C, but they show a greater deviation from the experimental curves at 600 °C. This is mainly due to the occurrence of dynamic recovery and recrystallization at 600 °C, where dislocations undergo cross-slip, leading to the annihilation of dislocations and a significant reduction in dislocation density, resulting in lower measured values.

4.3. Comparison with Mild Steels

For HSLA fire-resistant steel, the decrease in the yield strength at different temperatures is an important basis for evaluating fire resistance. The strictest requirement is that the yield strength at 600 °C should be higher than two-thirds of the specified yield strength at room temperature. Figure 12a shows the strength retention rate (YS (experimental temperature, ET)/YS (room temperature, RT)) of different steels at different temperatures. The retention rate of the fire-resistant steel in our study remains higher than 0.67 at 600 °C, while the retention rate of other mild steels at 600 °C is far lower than the standard requirement. Figure 12b presents the retention rate of Young’s modulus of elasticity E of different steels at different temperatures. As the temperature increases, the retention rate of E also decreases, which is consistent with the yield strength trends. The E retention rate of mild steel is significantly lower than the E retention rate of this study at 600 °C.

5. Conclusions

In this study, the microstructure of Nb-V-Ti-Mo complex microalloyed high-strength fire-resistant steel was shown to consist of bainitic ferrite + MA islands. The evolution of the microstructure at different temperatures, as well as the influence of temperature on the mechanical properties and nanoprecipitates, was studied. The following conclusions were drawn.
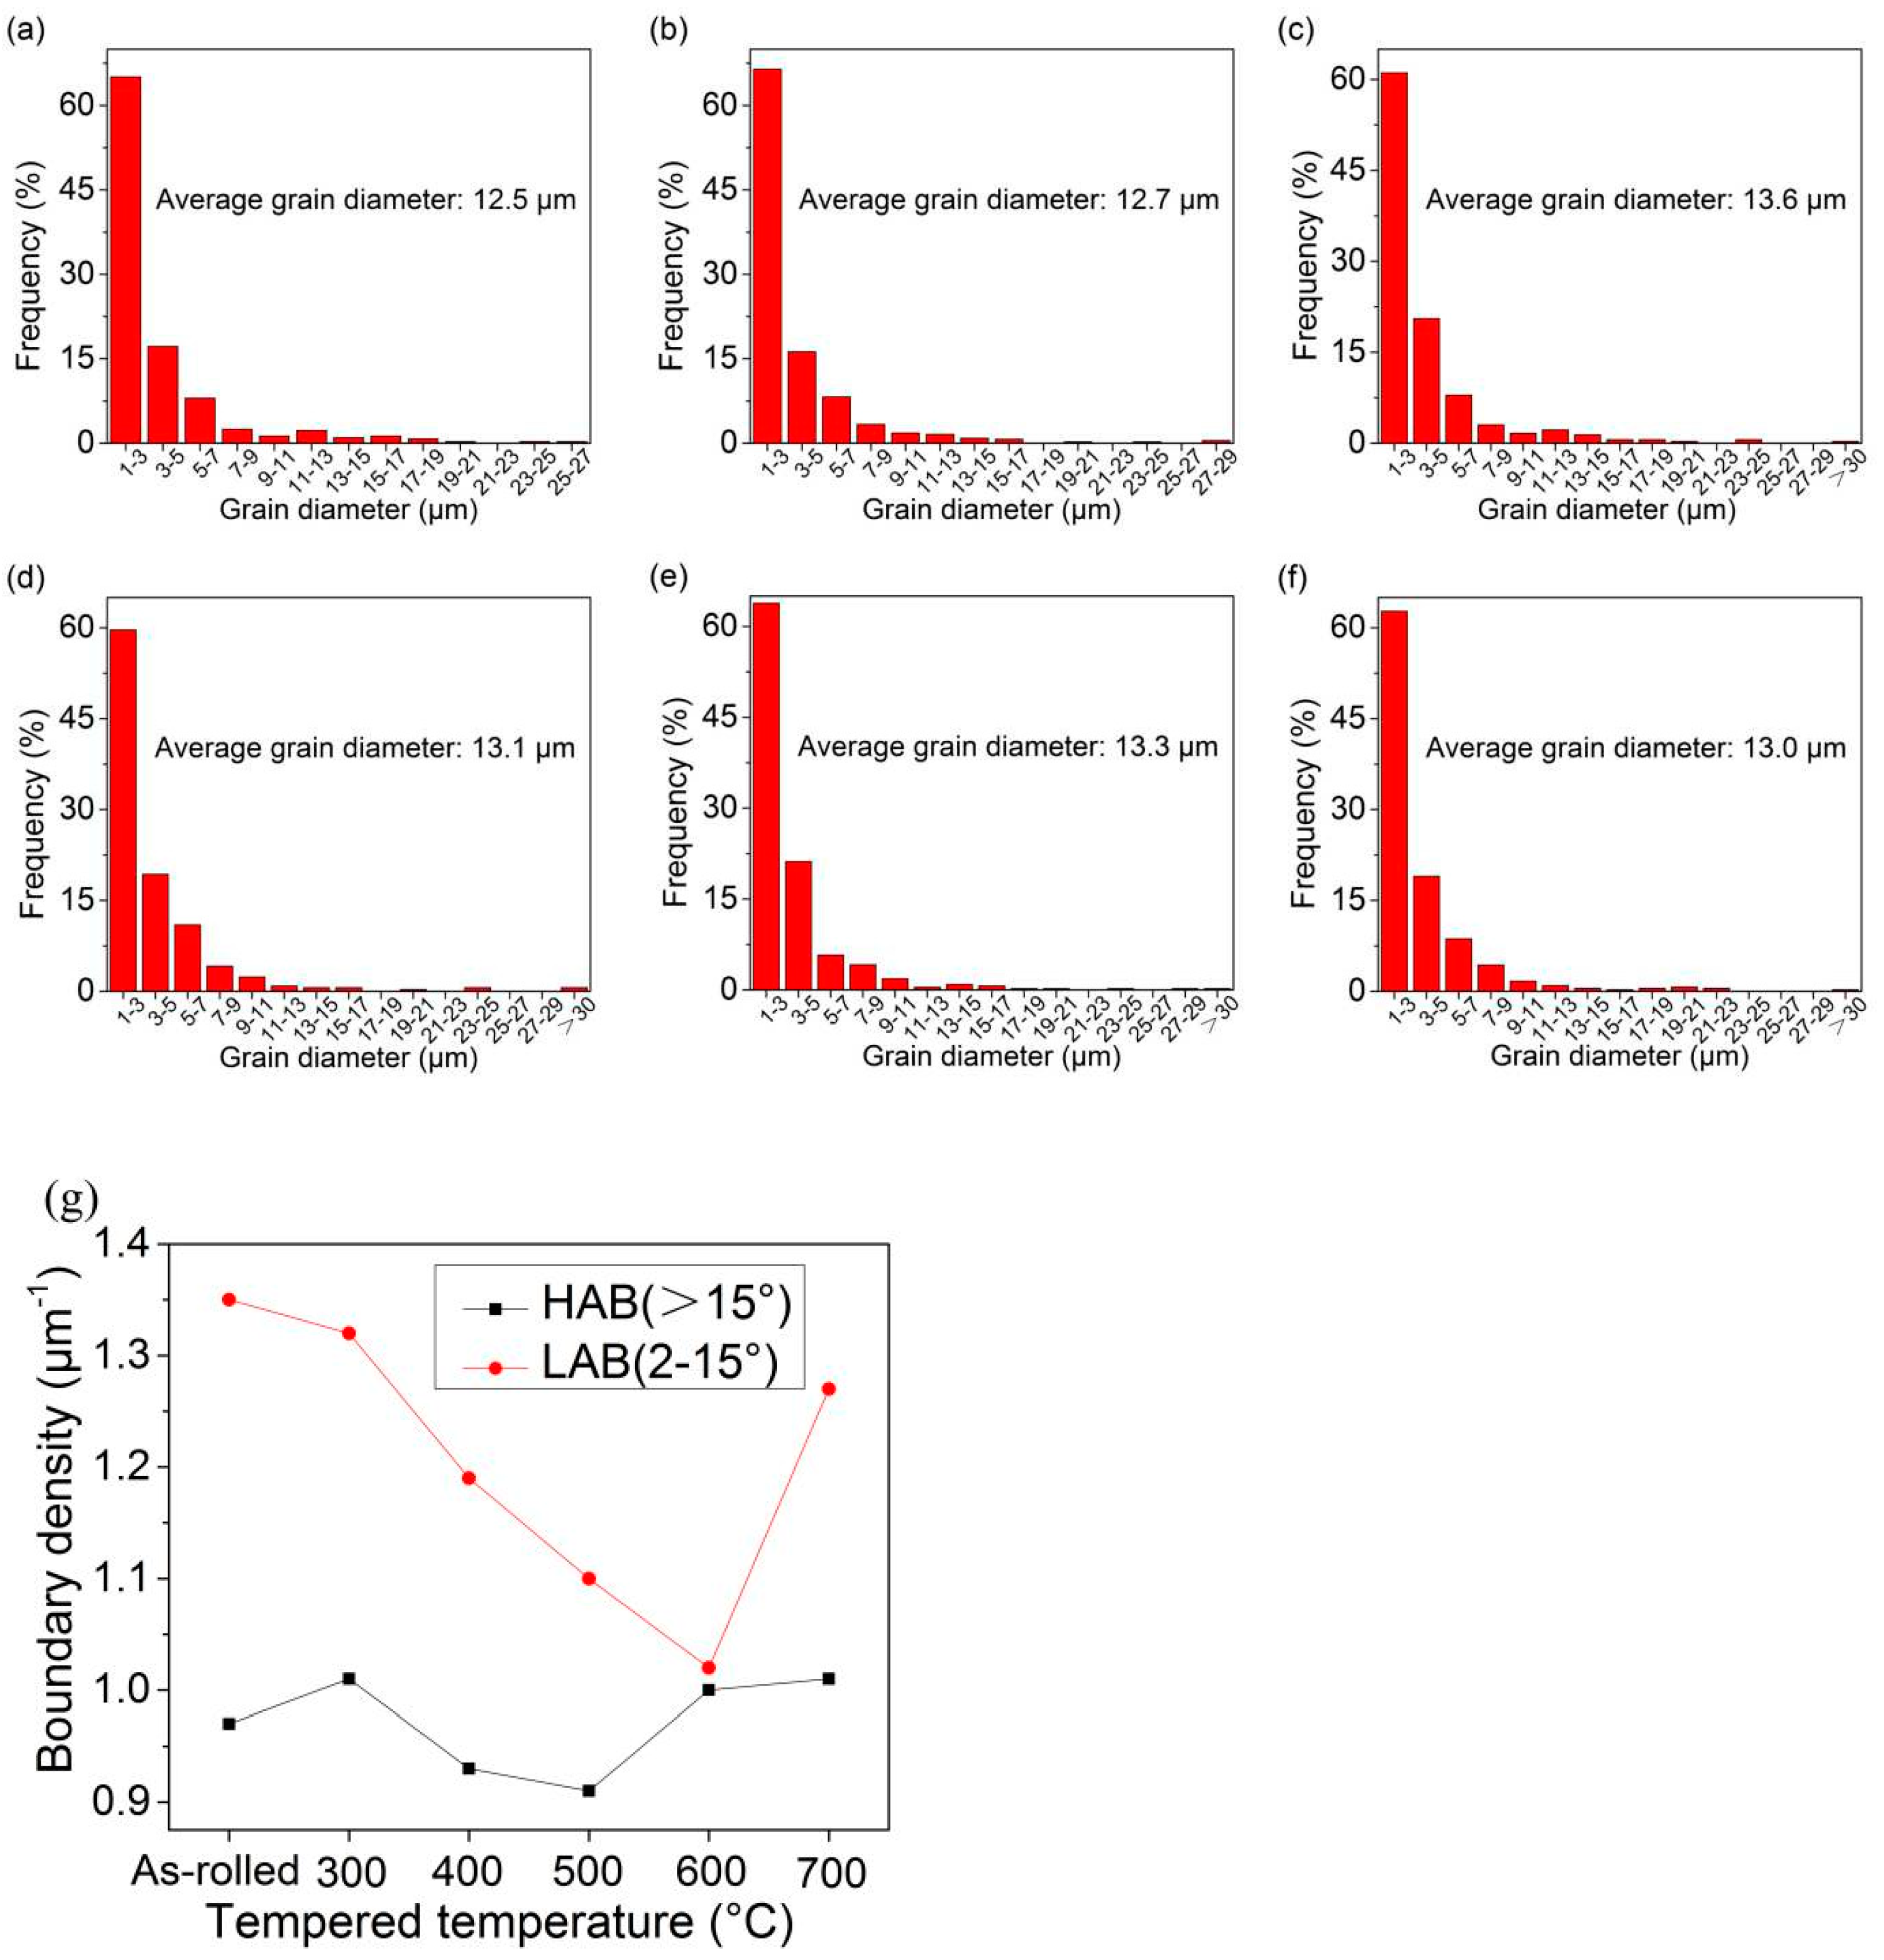
  • The yield strength of experimental steel is 617 MPa and the tensile strength is 813 MPa. As the experimental temperature increases, the high-temperature yield strength gradually decreases to 239 MPa at 700 °C. The effective grain size does not increase significantly at different temperatures and slightly fluctuates within the range of 12.5–13.6 μm. The matrix micromorphology does not change significantly, and recrystallized grains begin to appear at the grain boundaries at 600 °C.
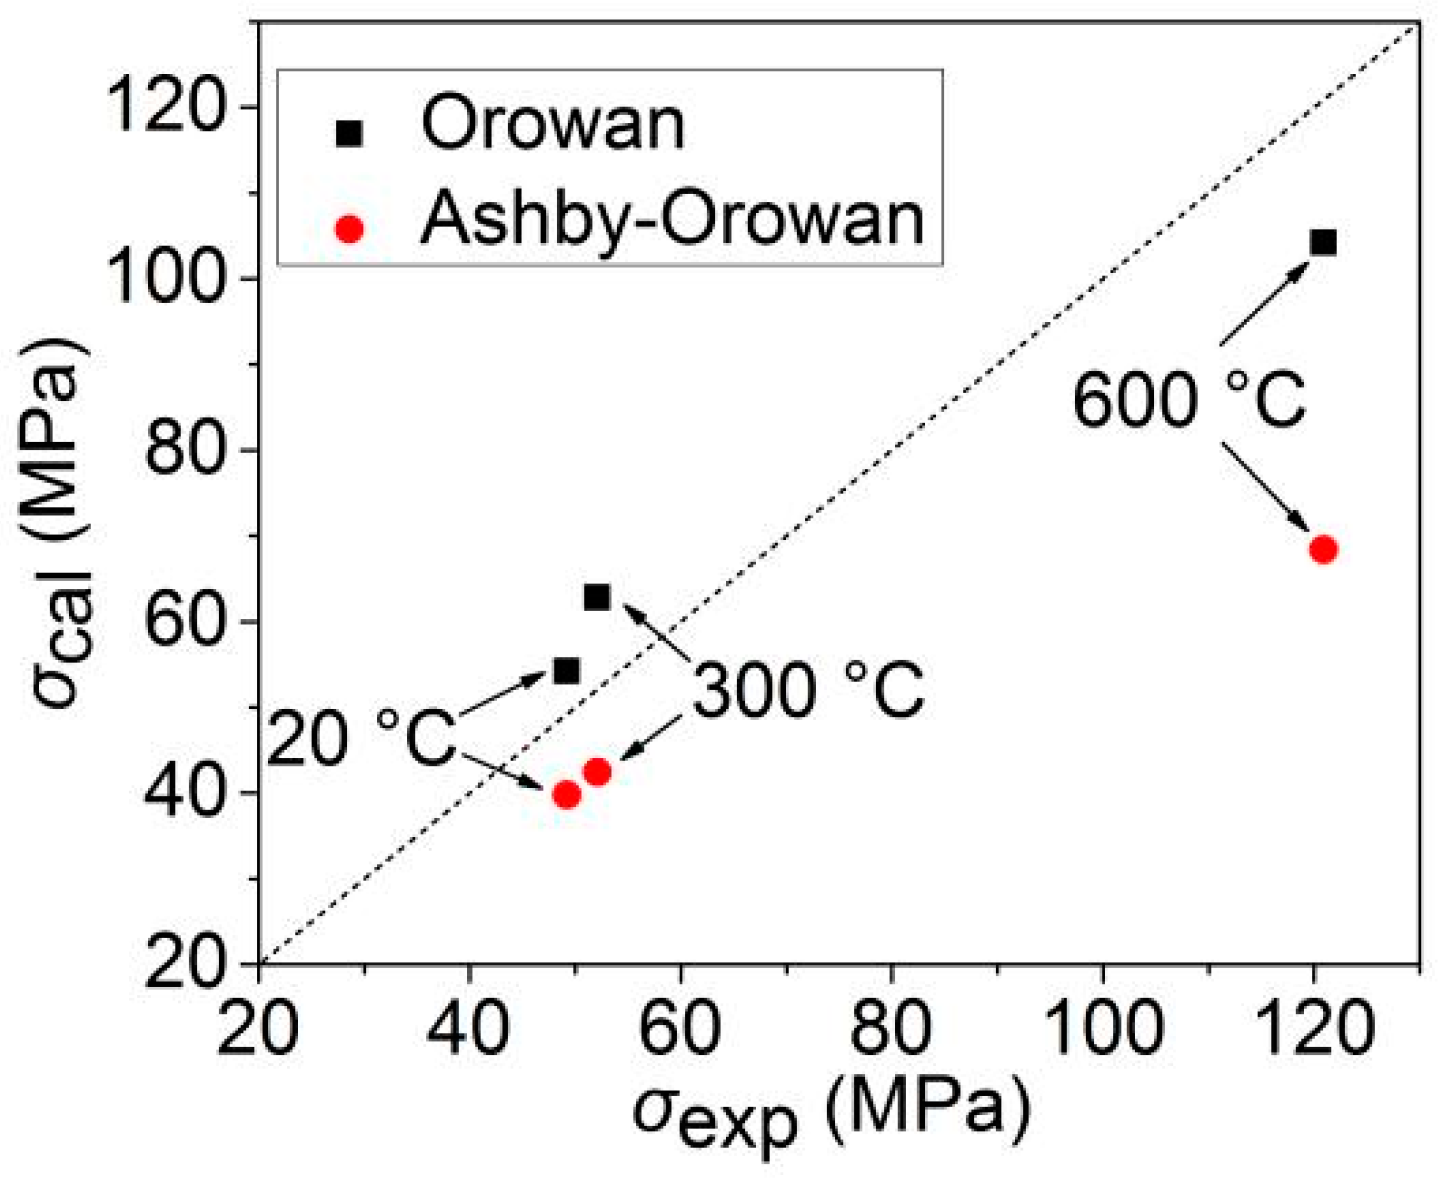
  • A small number of nanoprecipitates are distributed in the as-rolled specimen, with an average diameter of 29.2 nm. Upon increasing the temperature, the number of fine nanoprecipitates gradually increases, especially those less than 10 nm, which gradually decreases the average diameter, reaching 19.4 nm at 600 °C. The calculated precipitation strengthening value is consistent with the experimental precipitation strengthening value, and the Orowan equation explains well the precipitation strengthening effect of nanoprecipitates formed at elevated temperatures.
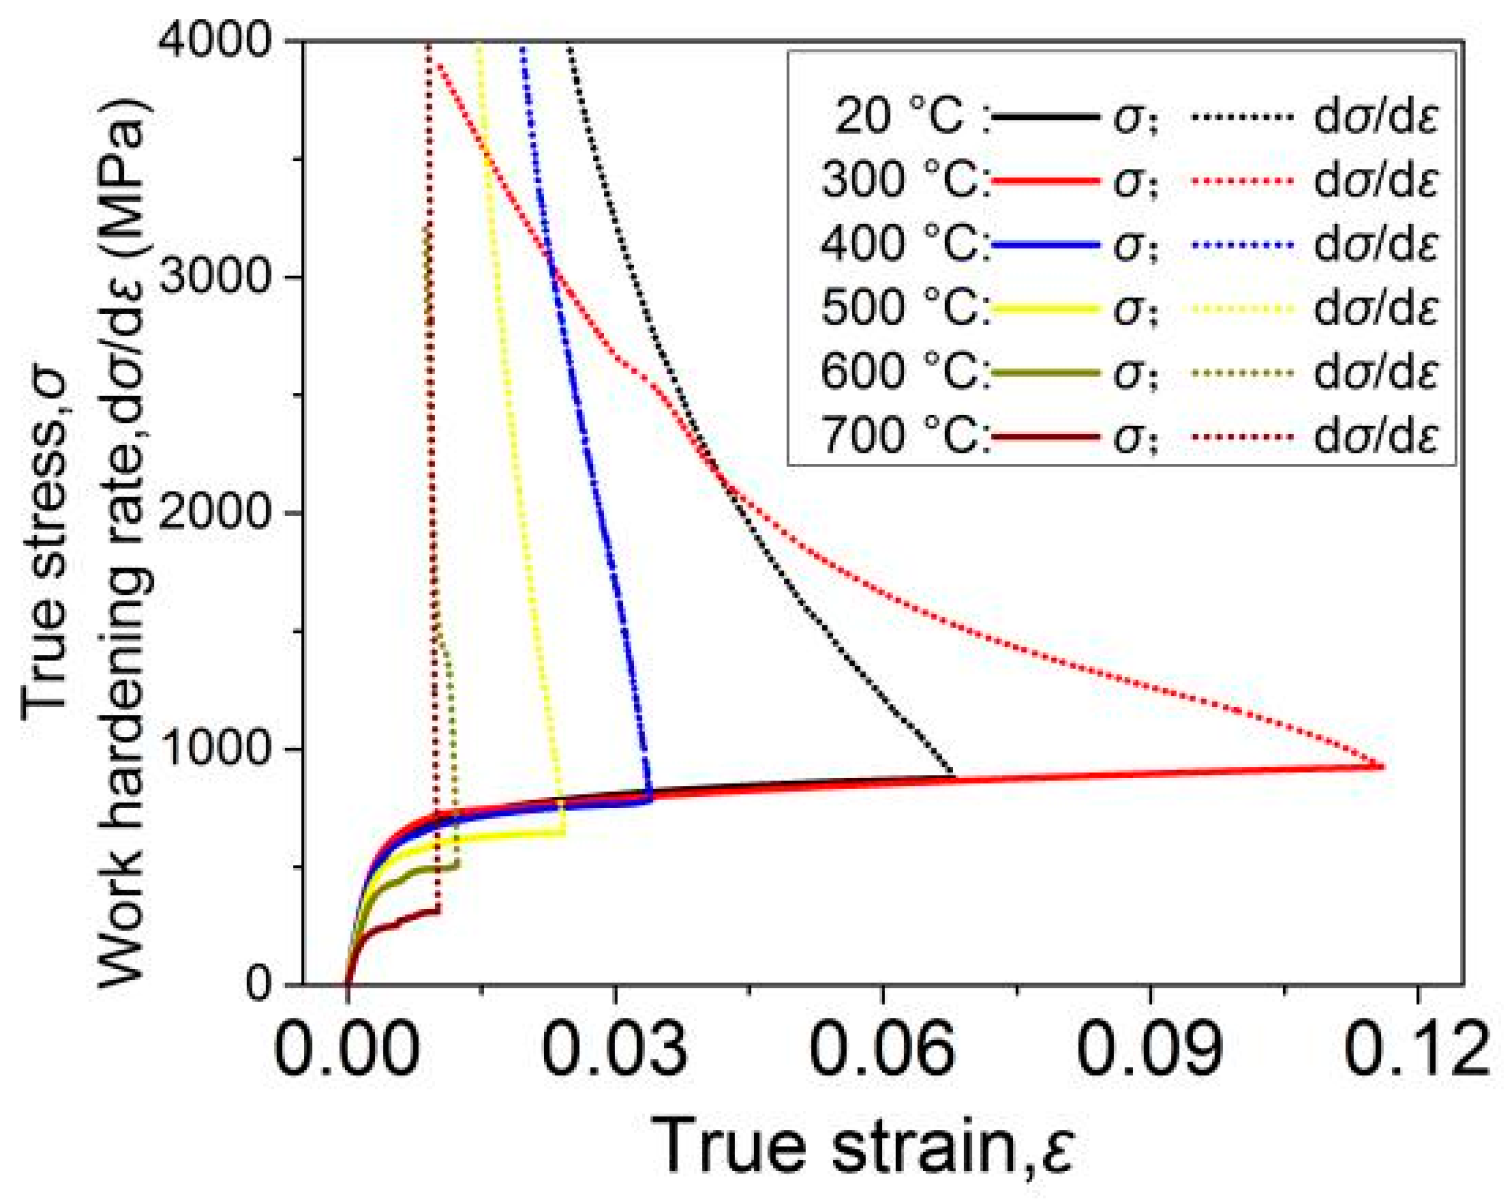
  • The work hardening rate decreases significantly with the temperature, and necking is more likely to occur. At room temperature and 300 °C, the Ashby work hardening theoretical curves are consistent with the experimental true stress-strain curves.

Author Contributions

Conceptualization, Z.L. and Q.Y.; formal analysis, X.W.; investigation, R.C. and G.D.; resources, Z.Y. and J.S.; writing—original draft preparation, X.W.; writing—review and editing, X.W. and S.Z.; supervision, Q.L. and C.S. All authors have read and agreed to the published version of the manuscript.

Funding

This research was funded by the Nation Key R&D Program of China (Grant No. 2017YFB0304700, No. 2017YFB0304702).

Data Availability Statement

Data presented in this article are available at request from the corresponding author.

Conflicts of Interest

The authors declare no conflict of interest.

References

  1. Zhang, Z.Y.; Yong, Q.L.; Sun, X.J.; Li, Z.D.; Kang, J.Y.; Wang, G.D. Microstructure and mechanical properties of precipitation strengthened fire resistant steel containing high Nb and low Mo. J. Iron Steel Res. Int. 2015, 22, 337–343. [Google Scholar] [CrossRef]
  2. Sim, J.H.; Kim, T.Y.; Kim, J.Y.; Kim, C.W.; Chung, J.H.; Moon, J.; Lee, C.H.; Hong, H.U. On the strengthening effects affecting tensile and low cycle fatigue properties of low-alloyed seismic/fire-resistant structural steels. Met. Mater. Int. 2020. [Google Scholar] [CrossRef]
  3. Chijiiwa, R.; Tamehiro, H.; Yoshida, Y.; Funato, K.; Uemori, R.; Hoeii, Y. Development and practical application of fire-resistant steel for buildings. Nippon Steel Tech. Rep. 1993, 58, 47–55. [Google Scholar]
  4. Fujino, H.; Hitomi, K.; Hashimoto, J.; Umezawa, S. Fire-resistant steel for building structures. Kawasaki Steel Tech. Rep. 1993, 29, 89–93. [Google Scholar]
  5. Bjorhovde, R. Performance and design issues for high strength steel in structures. Adv. Struct. Eng. 2010, 13, 403–411. [Google Scholar] [CrossRef]
  6. Li, G.Q.; Song, L.X. Mechanical properties of TMCP Q690 high strength structural steel at elevated temperatures. Fire Saf. J. 2020, 116, 103190. [Google Scholar] [CrossRef]
  7. Bennetts, I.D.; Moinuddin, K.A.M.; Goh, C.C.; Thomas, I.R. Testing and factors relevant to the evaluation of the structural adequacy of steel members within fire-resistant elevator shafts. Fire Saf. J. 2005, 40, 698–727. [Google Scholar] [CrossRef]
  8. Assefpour-Dezfuly, M.; Hugass, B.A.; Brownrigg, A. Fire resistant high strength low alloy steels. Mater. Sci. Technol. 1990, 6, 1210–1214. [Google Scholar] [CrossRef]
  9. Lee, W.B.; Hong, S.G.; Park, C.G.; Park, S.H. Carbide precipitation and high-temperature strength of hot-rolled high-strength, low-alloy steels containing Nb and Mo. Metall. Mater. Trans. A 2002, 33, 1689–1698. [Google Scholar] [CrossRef] [Green Version]
  10. Sha, W.; Kelly, F.S.; Guo, Z.X. Microstructure and properties of Nippon fire-resistant steels. J. Mater. Eng. Perform. 1999, 8, 606–612. [Google Scholar] [CrossRef]
  11. Sha, W.; Kirby, B.R.; Kelly, F.S. The behavior of structural steels at elevated temperatures and the design of fire resistant steels. Mater. Trans. 2001, 42, 1913–1927. [Google Scholar] [CrossRef] [Green Version]
  12. Sha, W.; Kelly, F.S.; Browne, P.; Blackmore, S.P.O.; Long, A.E. Development of structural steels with fire resistant microstructures. Mater. Sci. Technol. 2002, 18, 319–325. [Google Scholar] [CrossRef]
  13. Wan, R.C.; Sun, F.; Zhang, L.T.; Shan, A.D. Effects of Mo on high-temperature strength of fire-resistant steel. Mater. Des. 2012, 35, 335–341. [Google Scholar] [CrossRef]
  14. Dere, E.G.; Sharma, H.; Petrov, R.H.; Sietsma, J.; Offerman, S.E. Effect of niobium and grain boundary density on the fire resistance of Fe–C–Mn steel. Scr. Mater. 2013, 68, 651–654. [Google Scholar] [CrossRef]
  15. Zhang, Z.Y.; Sun, X.J.; Wang, Z.Q.; Li, Z.D.; Yong, Q.L.; Wang, G.D. Carbide precipitation in austenite of Nb-Mo-bearing low-carbon steel during stress relaxation. Mater. Lett. 2015, 159, 249–252. [Google Scholar] [CrossRef]
  16. Wan, R.C.; Sun, F.; Zhang, L.T.; Shan, A.D. Development and study of high-strength low-Mo fire-resistant steel. Mater. Des. 2012, 36, 227–232. [Google Scholar] [CrossRef]
  17. Wang, X.; Li, Z.D.; Zhou, S.T.; Wang, W.T.; Yong, Q.L.; Yang, Z.M.; Shen, J.C.; Shang, C.J.; Liu, Q.Y. Precipitation behavior of Ti-Nb-V-Mo quaternary microalloyed high strength fire-resistant steel and its influence on mechanical properties. Mater. Sci. Eng. A 2021, 807, 140865. [Google Scholar] [CrossRef]
  18. Gross, C.T.; Isheim, D.; Vaynman, S.; Fine, M.E.; Chung, Y.W. Design and development of lightly alloyed ferritic fire-resistant structural steels. Metall. Mater. Trans. A 2019, 50, 209–219. [Google Scholar] [CrossRef]
  19. Cong, J.H.; Li, J.W.; Fan, J.J.; Liu, P.C.; Misra, R.D.K.; Shang, C.J.; Wang, X.M. The impact of interphase precipitation on the mechanical behavior of fire-resistant steels at an elevated temperature. Materials 2020, 13, 4294. [Google Scholar] [CrossRef]
  20. Ghosh, S.; Mula, S.; Mondal, D.K. Development of ultrahigh strength cast-grade microalloyed steel by simple innovative heat treatment techniques for industrial applications. Mater. Sci. Eng. A 2017, 700, 667–680. [Google Scholar] [CrossRef]
  21. Jarvenpaa, A.; Ghosh, S.; Khosravifard, A.; Jaskari, M.; Hamada, A. A new processing route to develop the nano-grained structure of a TRIP-aided austenitic stainless-steel using double reversion fast-heating annealing. Mater. Sci. Eng. A 2021, 808, 140917. [Google Scholar] [CrossRef]
  22. Xie, Z.J.; Song, Z.D.; Chen, K.; Jiang, M.H.; Tao, Y.; Wang, X.M.; Shang, C.J. Study of Nanometer-Sized Precipitation and Properties of Fire Resistant Hot-Rolled Steel. Metals 2019, 9, 1230. [Google Scholar] [CrossRef] [Green Version]
  23. Zhang, Z.Y. Effect of Mo on the Nanometer-Sized Precipitates, Microstructure and Properties of High Nb Low Carbon Steel. Ph.D. Dissertation, Northeastern University, Shenyang, China, 2015. [Google Scholar]
  24. Zhang, Z.Y.; Li, Z.D.; Yong, Q.L.; Sun, X.J.; Wang, Z.Q.; Wang, G.D. Precipitation behavior of carbide during heating process in Nb and Nb-Mo micro-alloyed steels. Acta Metall. Sin. 2015, 51, 315–324. [Google Scholar]
  25. Zhang, Z.Y.; Sun, X.J.; Yong, Q.L.; Li, Z.D.; Wang, Z.Q.; Wang, G.D. Precipitation behavior of nanometer-sized carbides in Nb-Mo microalloyed high strengh steel and its strengthening mechanism. Acta Metall. Sin. 2016, 52, 410–418. [Google Scholar]
  26. Jo, H.H.; Shin, C.S.; Moon, J.O.; Jae, J.H.; Ha, H.Y.; Park, S.J.; Lee, T.H.; Lee, B.H.; Chung, J.H.; Speer, J.G.; et al. Mechanisms for improving tensile properties at elevated temperature in fire-resistant steel with Mo and Nb. Mater. Des. 2020, 194, 108882. [Google Scholar] [CrossRef]
  27. Ferreira, D.; Alves, A.; Neto, R.; Martins, T.; Brandi, S. A new approach to simulate HSLA steel multipass welding through distributed point heat sources model. Metals 2018, 8, 951. [Google Scholar] [CrossRef] [Green Version]
  28. Wang, S.T.; Yang, S.W.; Gao, K.W.; He, X.L. Corrosion resistance of low alloying weather steels in environment containing chloride ion. Trans. Mater. Heat Treat. 2008, 4, 170–175. [Google Scholar]
  29. Jia, J.H.; Cheng, X.Q.; Yang, X.J.; Li, X.G.; Li, W. A study for corrosion behavior of a new-type weathering steel used in harsh marine environment. Constr. Build. Mater. 2020, 259, 119760. [Google Scholar] [CrossRef]
  30. Zhang, T.Y.; Xu, X.X.; Li, Y.; Lv, X.W. The function of Cr on the rust formed on weathering steel performed in a simulated tropical marine atmosphere environment. Constr. Build. Mater. 2021, 277, 122298. [Google Scholar] [CrossRef]
  31. Ghosh, S.; Komi, J.; Mula, S. Flow stress characteristics and design of innovative 3-steps multiphase control thermomechanical processing to produce ultrafine-grained bulk steels. Mater. Des. 2020, 186, 108297. [Google Scholar] [CrossRef]
  32. Ghosh, S.; Mula, S.; Malakar, A.; Somani, M.; Komi, J. High cycle fatigue performance, crack growth, and failure mechanisms of an ultrafine-grained Nb+Ti stabilized, low-C microalloyed steel processed by multiphase controlled rolling and forging. Mater. Sci. Eng. A 2021, 825, 141883. [Google Scholar] [CrossRef]
  33. Wang, W.Y.; Liu, B.; Kodur, V. Effect of Temperature on Strength and Elastic Modulus of High-Strength Steel. J. Mater. Civil. Eng. 2013, 25, 174–782. [Google Scholar] [CrossRef]
  34. Yong, Q.L. Secondary Phase in Steels; Metallurgical Industry Press: Beijing, China, 2006. [Google Scholar]
  35. Yang, H.Y.; Li, K.Q.; Bu, Y.Q.; Wu, J.M.; Fang, Y.T.; Meng, L.; Liu, J.B.; Wang, H.T. Nanoprecipitates induced dislocation pinning and multiplication strategy for designing high strength, plasticity and conductivity Cu alloys. Scr. Mater. 2021, 195, 113741. [Google Scholar] [CrossRef]
  36. Ghosh, S.; Bibhanshu, N.; Suwas, S.; Chatterjee, K. Surface mechanical attrition treatment of additively manufactured 316L stainless steel yields gradient nanostructure with superior strength and ductility. Mater. Sci. Eng. A 2021, 820, 141540. [Google Scholar] [CrossRef]
  37. Kim, Y.W.; Song, S.W.; Seo, S.J.; Hong, S.G.; Lee, C.S. Development of Ti and Mo micro-alloyed hot-rolled high strength sheet steel by controlling thermomechanical controlled processing schedule. Mater. Sci. Eng. A 2013, 565, 430–438. [Google Scholar] [CrossRef]
  38. Cohen, M. Dislocation in Metals; AIME: New York, NY, USA, 1954; Volume 69. [Google Scholar]
  39. Argon, A.S. Physical of Strength and Plasticity; MIT Press: Cambridge, MA, USA, 1969; Volume 113. [Google Scholar]
  40. Dieter, G.E. Mechanical Metallurgy; McGraw-Hill Book Company: London, UK, 1988; Volume 289. [Google Scholar]
  41. Kamikawa, N.; Abe, Y.; Miyamoto, G.; Funakawa, Y.; Furuhara, T. Tensile behavior of Ti,Mo-added low carbon steels with interphase precipitation. ISIJ Int. 2014, 54, 212–221. [Google Scholar] [CrossRef] [Green Version]
  42. Ashby, M.F. Work hardening of dispersion hardened crystals. Philos. Mag. 1966, 14, 1157. [Google Scholar] [CrossRef]
  43. Ashby, M.F. The deformation of plastically non-homogeneous materials. Philos. Mag. 1970, 21, 399. [Google Scholar] [CrossRef]
  44. Ohmori, A.; Torizuka, S.; Nagai, K. Strain-hardening due to dispersed cementite for low carbon ultrafine-grained steels. ISIJ Int. 2004, 44, 1063. [Google Scholar] [CrossRef] [Green Version]
Figure 1. The rolling process flow chart.
Metals 11 01670 g001
Figure 2. The engineering stress-strain curves of experimental steel at different temperatures: (a) the whole engineering stress-strain curves; (b) the enlarged engineering stress-strain curves.
Metals 11 01670 g002
Figure 3. The experimentally measured Young’s elastic modulus Eexp and shear elastic modulus Gexp at different temperatures (the dotted line is the calculated value).
Metals 11 01670 g003
Figure 4. The SEM microstructures’ morphology of experimental steel at different temperatures: (a) the as-rolled state; (b) holding at 300 °C for 15 min; (c) holding at 400 °C for 15 min; (d) holding at 500 °C for 15 min; (e) holding at 600 °C for 15 min; (f) holding at 700 °C for 15 min.
Metals 11 01670 g004
Figure 5. The EBSD images of grain boundary distribution map at different temperatures: (a) the as-rolled state; (b) holding at 300 °C for 15 min; (c) holding at 400 °C for 15 min; (d) holding at 500 °C for 15 min; (e) holding at 600 °C for 15 min; (f) holding at 700 °C for 15 min.
Metals 11 01670 g005
Figure 6. The grain size distribution and interface density of the experimental steels at different temperatures: (a) the as-rolled state; (b) holding at 300 °C for 15 min; (c) holding at 400 °C for 15 min; (d) holding at 500 °C for 15 min; (e) holding at 600 °C for 15 min; (f) holding at 700 °C for 15 min; (g) the interface density.
Metals 11 01670 g006
Figure 7. TEM images of the nanoprecipitates at different temperatures: (a) (Ti, Nb)N; (c) (Nb, V, Mo)C in the as-rolled state; (e) (Nb, V, Mo)C holding at 600 °C for 15 min; (b,d,f) the EDS of the precipitates in (a,c,e).
Metals 11 01670 g007
Figure 8. The diameter distribution plot of (Nb, V, Mo)C nanoprecipitates.
Metals 11 01670 g008
Figure 9. Comparison between the experimentally determined precipitation strengthening (the dotted line) and the calculated precipitation strengthening based on the Orowan equation and the Ashby-Orowan equation.
Metals 11 01670 g009
Figure 10. True stress-true strain curves and work-hardening rate curves at different temperatures.
Metals 11 01670 g010
Figure 11. Calculated stress-strain curves based on Ashby work hardening theory and experimental curves.
Metals 11 01670 g011
Figure 12. (a) YS(ET)/YS(RT) and (b) E(ET)/E(RT) at different temperatures.
Metals 11 01670 g012
Table 1. Chemical composition of experimental steel (wt%).
CSiMn + C r + Ni + CuPSMoTiNbVN
0.0560.32≤2.50.0070.0040.210.0140.0930.030.0035
Table 2. The phase analysis results of M(C, N) at different temperatures.
StateMass Fraction in Alloy of Elements in M(C, N) Phase (%)M(C, N) Phase Composition
NbTiVMoNC *Σ
As-rolled0.0210.0110.00220.00800.00300.00440.050(Nb0.388Ti0.395V0.074Mo0.143) (C0.632N0.368)
300 °C0.0180.0130.00110.00500.00250.00410.043(Nb0.362Ti0.512V0.037Mo0.088) (C0.655N0.345)
600 °C0.0550.0130.00740.0270.00320.0130.119(Nb0.459Ti0.211V0.112Mo0.218) (C0.823N0.177)
*—The calculated value.
Table 3. The phase analysis results of M3C at different temperatures.
StateMass Fraction in Alloy of Elements in M3C Phase(%)M3C Phase Composition
FeCrMnMoC *Σ
As-rolled0.0840.00890.00390.0030.00710.107(Fe0.846Cr0.096Mn0.040Mo0.017)3C
300 °C0.1280.00500.00400.0020.0100.147(Fe0.931Cr0.039Mn0.030Mo0.005)3C
600 °C0.5370.0340.00960.0100.0420.633(Fe0.912Cr0.062Mn0.016Mo0.010)3C
*—The calculated value.
Table 4. The various strengthening contribution values of experimental steel.
Experimental temperature (°C)YS (MPa)YS0 (MPa)YSs (MPa)YSg (MPa)YSd (MPa)YSp (MPa)
As-rolled61757.0246.2153.8110.849.2
300 °C60955.4230.8164.2106.552.1
600 °C42444.345138.875.0120.9
Publisher’s Note: MDPI stays neutral with regard to jurisdictional claims in published maps and institutional affiliations.

