Article

Experimental and Numerical Investigations on Charging Carbon Composite Briquettes in a Blast Furnace

State Key Laboratory of Advanced Metallurgy, University of Science and Technology Beijing, Beijing 100083, China
*
Author to whom correspondence should be addressed.
Metals 2021, 11(11), 1669; https://doi.org/10.3390/met11111669
Submission received: 18 August 2021 / Revised: 12 October 2021 / Accepted: 14 October 2021 / Published: 20 October 2021

Abstract

:
In the present research, charging carbon composite briquettes (CCB) in a blast furnace (BF) was investigated. The CCB used contained 29.70 wt.% Fe3O4, 39.70 wt.%, FeO, 1.57 wt.% iron, 8.73 wt.% gangue, and 20.30 wt.% carbon. Its reaction kinetics in BF was examined by nonisothermal tests and modeled. Thereafter, the influence of replacing 10% ore with CCB on BF performance was studied by numerical simulations. Results showed that the CCB reaction behavior in BF could be modeled using the previously proposed model under ags = 1900 m2·m−3. Numerical simulations on a BF with a production of 6250 t hot metal per day (tHM/day) showed that replacing 10% ore with CCB efficiently improved the BF operation for coke saving. In the CCB charging operation, the CCB reached a full iron-oxide reduction above the cohesive zone (CZ) and a carbon conversion of 85%. By charging CCB, the thermal state in the BF upper part was significantly changed while it was not influenced in the BF lower part; the ore reduction was retarded before the temperature reached 1073 K and was prompted after and the local gas utilization tends to increase above the CZ. By the CCB reduction above the CZ, BF top gas temperature was decreased by 8 K, the BF top gas utilization was increased by 1.3%, the BF productivity was decreased by 17 tHM/day, the coke rate was decreased by 52.2 kg/tHM, and ore rate was decreased by 101 kg/tHM. Considering the energy consumption of sintering and coking, charging the CCB could have a significant energy-saving and CO2-emission-reducing effect for BF iron making.

1. Introduction

The development of the economy and society is increasing the demand and production of iron and steel. In 2019, crude steel production in China reached 996.3 million tons, representing 53.3% of global crude steel production [1,2]. The blast furnace ironmaking-basic oxygen furnace steelmaking (BF-BOF) route is the main route for the production, producing approximately 70% of the total crude steel [3]. Nowadays, the iron and steel industry is facing pressures of energy-saving and CO2 emission reduction [4,5]. As the BF sector (including coking and sintering) is responsible for approximately 80% of the total energy consumption and generating most CO2 emissions in the BF-BOF route [6], low-carbon technologies in BF ironmaking have attracted increasing attention from scholars worldwide [7,8].
Charging carbon composite briquettes (CCB) is considered to be a promising technology to improve BF efficiency [9,10]. The CCB refers to carbonaceous materials mixed with iron-bearing materials into agglomerates. Using CCB as a partial charge in BF offers the following benefits of (1) less coking and sintering [11,12,13], (2) utilization of low-grade iron ores or carbon materials [14,15,16], (3) the process is completed faster than that with pellets or sinter [17,18], and (4) energy consumption tends to decrease [19]. Several methods of preparation of CCB for BF have been proposed, including hot briquetting using the thermal plasticity of coal [20], and cold briquetting using cement as a binder [21,22], cold briquetting using coking tar as a binder [23]. The authors of the current study previously proposed to prepare CCB using cold briquetting followed by heat treatment [24,25]. By this method, various noncoking coals and iron-rich metallurgical dust could be used as raw materials, which could significantly reduce the CCB cost. The behavior of a single CCB prepared using this method under simulated BF conditions and in actual BF have been elucidated and the results showed that the CCB reaction in BF includes five stages: reduction by BF gas, partial self-reduction with reduction by BF gas, full self-reduction partial self-reduction with gasification by BF gas and gasification by BF gas [25]. However, to improve BF efficiency, it is more important to understand the influence of charging CCB on BF performance.
The BF ironmaking is a complex process with high temperature, high pressure, and hazardous environment, so conditions of lab-scale experiments could not fully simulate the actual BF in-furnace state and thus results may be unreliable. Nowadays, novel processes involved in BF ironmaking are usually investigated by numerical simulations. Using numerical simulations, investigators can gain very detailed information to examine the feasibility, understand the mechanisms, and optimize operation conditions towards the envisaged BF processes [26,27,28,29]. Simulations on BF operations with CCB charging have been conducted by Chu et al. [30] and Yu et al. [31]. However, in their studies, the reaction model of CCB was significantly simplified and could not reflect the real behavior in BF, which may lead to some misunderstanding in interpreting the influence of CCB charging on BF performance.
In this research, the reaction behavior of CCB under BF conditions was experimentally studied and modeled. Thereafter, BF operation with replacing 10% ore by CCB was investigated by numerical simulations.

2. Experimental

2.1. CCB Sample

The CCB sample used in the present research was the same as that in reference [25]. It was prepared by cold briquetting followed by heat treatment. The raw materials for preparing the CCB sample were hematite fines, quartz fines, and coal fines. The quartz fines were employed as an additive. The hematite fines and the quartz fines were the chemical reagents. The coal fines were provided by the BF PCI (pulverized coal injection) sector. The hematite fines, quartz fines, and coal fines were thoroughly mixed under a mass ratio of hematite:quartz:coal = 67:3:30. After the addition of 10.0% distilled water, 2.0% organic binder, the briquettes were made by pressing these moistened fines using a die under a pressure of 15 MPa. The briquettes were dried in the air followed by drying at 423 K and were then hardened by heat treatment. The heat treatment was carried out under an N2 atmosphere. The thermal route was the following. The furnace was heated from room temperature to 1073 K at a rate of 5 K/min. After holding for 10 min, the furnace was cooled naturally. The prepared CCB is cylindrical with diameter and height of 14 mm. Its mass is 4.7 g. Its mineralogical composition is listed in Table 1.

2.2. Non-Isothermal Reaction Tests

The experimental setup is detailed elsewhere [25]. The following is an outline. The setup mainly consists of a gas supply system, and a temperature-controlled furnace with an accuracy of ±2 K, and a computer for data acquisition. The furnace was heated using super-canthal (MoSi2) elements, producing a 50-mm hot zone in the reaction tube (Diameter: 55 mm). The sample holder was made of a heat-resistant alloy (Fe-Cr-Al) wire. In each test, the furnace was heated up to 1073 K and stabilized for 30 min under N2 atmosphere. A single CCB was loaded at a time. After being preheated for 5 min in the upper part of the tube, the sample was lowered into the constant- temperature zone. The furnace was then heated up under a predetermined heating rate and the gas flow was switched from N2 to a CO-CO2-N2 mixture (CO:CO2:N2 = 4:1:5 (volume)). The mass loss of CCB was recorded via a computer. In the test, the total gas flow rate was maintained at 3000 cm3·min−1 (standard temperature and pressure). The test was completed after the temperature reached 1373 K. Pre-experimental results showed that, after heat hardening, volatiles and organic binder could be completely removed from the CCB, so its mass loss fraction at time t (fm) was calculated by Equation (1).
f m = ( m m b ) / ( m C , 0 + m O , 0 )
where, m is the mass of CCB at time t, (g); mb is the initial mass of CCB, (g); mC,0 and mO,0 are the initial mass of carbon and iron-oxide oxygen in CCB, (g), and they are determined according to Table 1 and the initial mass of CCB.

3. Model Development

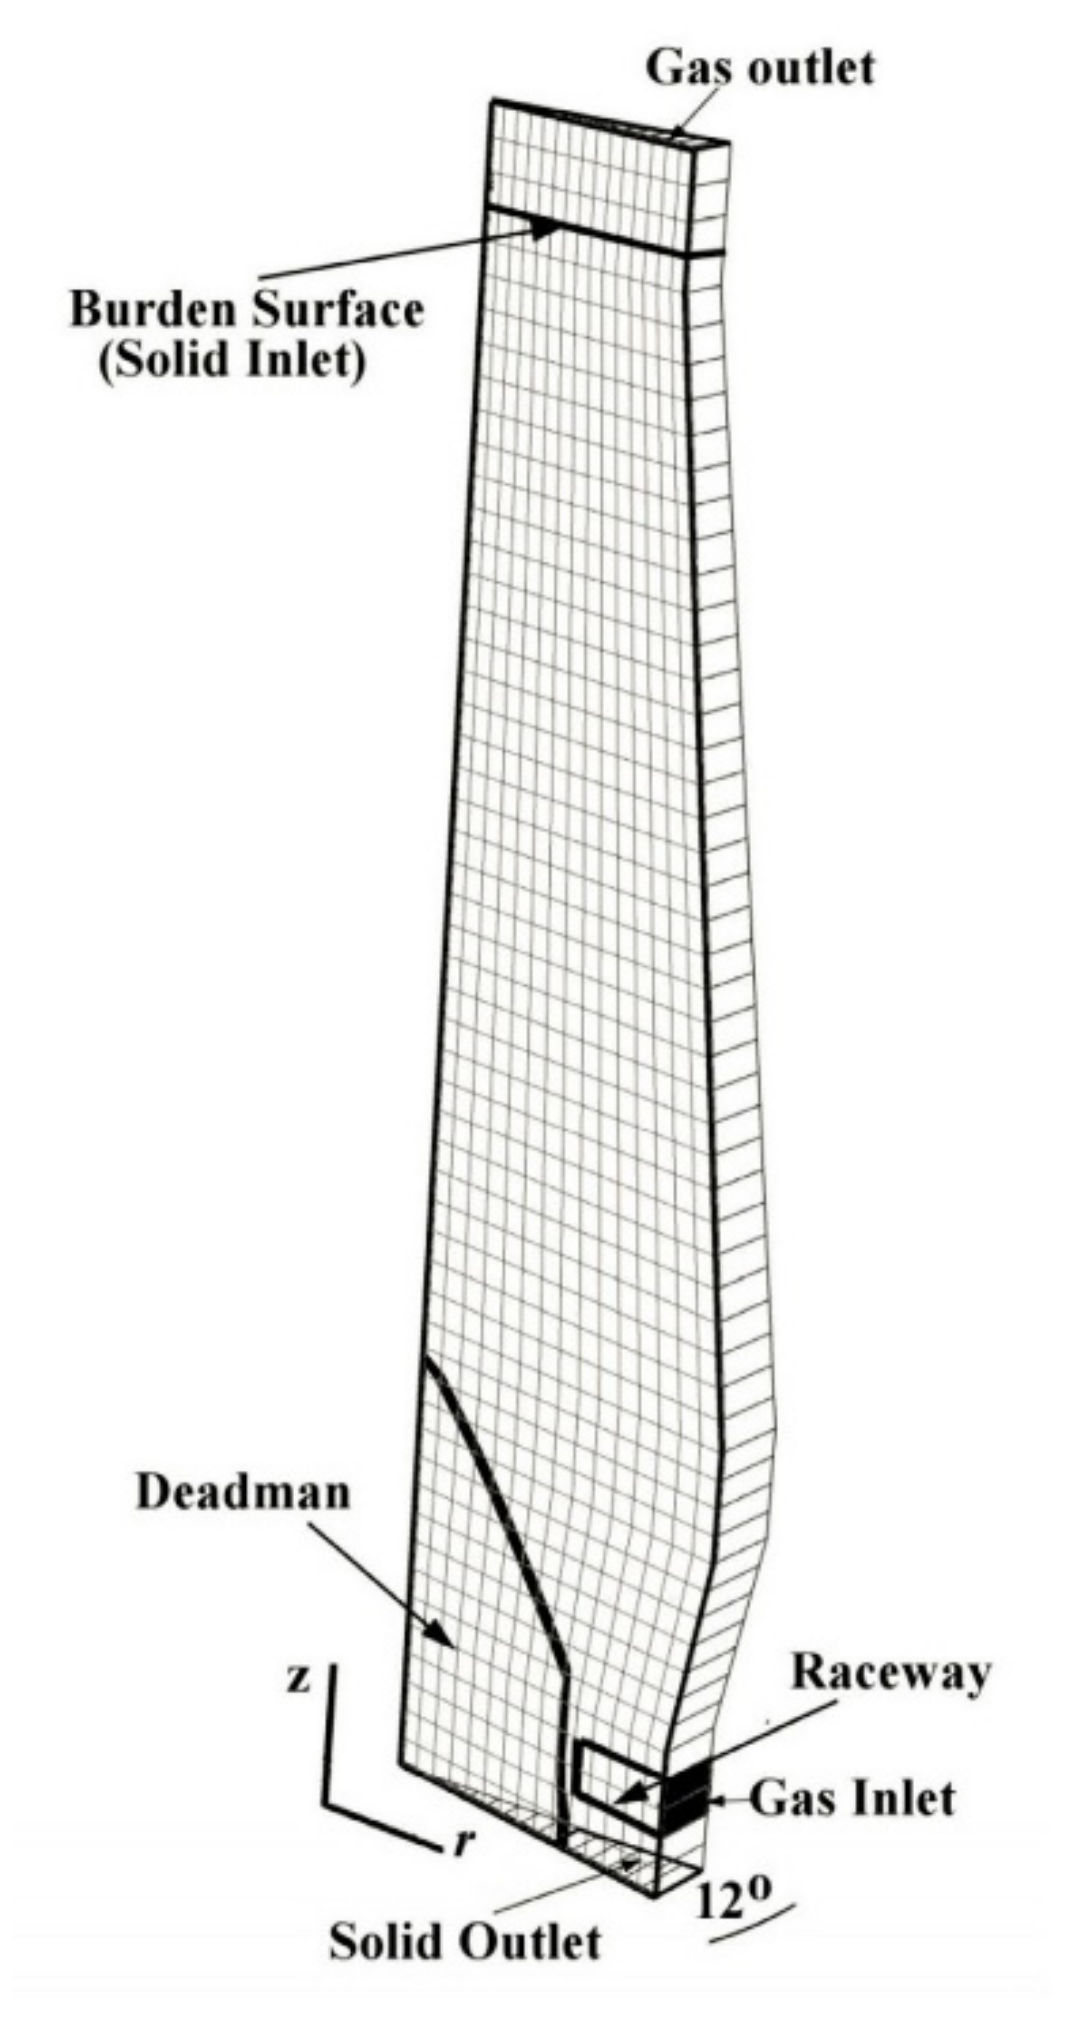
3.1. Description of BF Operation with CCB Charging

Size of the BF for numerical simulations is given by Tang et al. [32], and its normal operation data is given in Table 2. In the present investigation, two cases (case A and case B) were simulated and compared. Case A was the BF operation under normal conditions and considered as the base case. Case B was with CCB charging. In case B, 10% (mass) ore was replaced with CCB. In CCB charging of case B, the CCB is assumed to be fully mixed with the ore (sinter, pellet, and lump ore).

3.2. BF Model

The present model is based on a total BF model developed by current authors [32]. The validity of the total BF model was confirmed by the comparison of the simulation results with the averaged industrial data. In the present model, the reaction kinetics of CCB is modeled and is incorporated into the total BF model. The model is two-dimensional, axisymmetric, and steady. In the model, the gas-phase behavior and solid-phase behavior in BF are represented by the conservation of mass, momentum, energy, and species. The computation grid is shown in Figure 1. It is a two-dimensional structure grid, including 780 cells. The computational zone is based on 12 degrees in the circumferential direction. The positions of cohesive zone (CZ), deadman, raceway (RW) are predefined. The porosity of CZ, dripping zone (DZ), and deadman are fixed at 0.15, 0.30, and 0.15, respectively. The Equations involved in the model are listed in Table 3. Equations (1)–(3) in Table 3 are CO gaseous reduction of ore, Equations (4) and (5) in Table 3 are coke solution-loss reaction and combustion. Equations (6)–(9) are CCB Equations. Equations (10)–(12) in Table 3 are the melting of the ore. Equations (12)–(15) in Table 3 are the melting of CCB. the melting CCB is assumed to be similar to that of the ore. Rates of Equations (6)–(9) and (16) in Table 3 are given in the following sections, Reaction heats of all Equations and rates of Equations (1)–(5), (10)–(15) in Table 3 are given elsewhere [32].
Behaviors of other phases (molten iron, molten slag, and PC fines) are treated using simplified methods. The PC particles are gasified in the raceway zone reaching a burnout rate of more than 90% within 20 ms. Therefore, the combustion products of the blast and the PC through Equation (5) form the inlet condition for the gas phase in the model. The liquid phase includes the molten iron and the molten slag. Droplets of the molten iron and the molten slag are generated in the cohesive zone with an initial temperature equivalent to the local solid temperature. After generation, they flow down through the dripping zone, acquiring heated by the gas phase and the coke bed and reaching the final tapping temperature in the hearth. On their flowing path, these droplets undergo coalescing, splitting, or flying a short distance with the strong bosh gas, so it is difficult to give precise mathematical descriptions upon the gas-liquid and solid-liquid heat exchanges. In the BF bosh, heat is mainly generated by the combustion of oxygen with coke and PC in the raceway and the gas phase has the highest temperature. As the gas flows upward, the heat is transferred from the gas to the coke bed, and to the liquid droplets; simultaneously, the heat is also transferred from the coke bed to the liquid droplets. This analysis shows that the required heat for the liquid phase could be simplified as an energy source of the gas phase. The temperature of the hearth is considered to be 1753 K, therefore, the overall heat loss rate (Ql) from the gas-solid system to the liquid phase is Equation (2), Assuming that the heat loss rate is uniformly distributed in the DZ, an enthalpy source Equation (3) is added to energy Equation of the gas phase in the DZ.
Q l = i C Z ( M Fe ( R 10 + R 13 ) + M FeO ( R 11 + R 14 ) + M Gangue ( R 12 + R 15 ) ) C p l V cell ( 1753 T S )
E gl = Q l / i DZ V cell
Molten FeO in the slag droplets is reduced fast in the DZ through Equation (9). In the view of the mass balance of molten FeO in CZ and DZ, the rate of Equation (16) in Table 3 is described using Equation (4), in which, Equation (16) is assumed to uniformly proceed in the DZ.
R 16 = i C Z ( ( R 7 + R 14 ) V cell ) / i D Z V cell
The above method of treating the behavior of the liquid phase was demonstrated to be helpful for the model to reach a high convergence of the model.
The gas flow is considered to be the flow through the porous bed. The gas phase consists of CO, CO2, O2, and N2, and is considered to be an ideal gas. The general governing Equation of the gas phase is Equation (5), in which, the superficial gas velocity is adopted. Terms to represent ϕ, Γϕ and Sϕ in Equation (5) are listed in Table 4.
div ( ρ g U g ϕ ) = div ( Γ ϕ grad ϕ ) + S ϕ
A non-slip wall condition for the gas velocity and an impermeable condition for the gas species are defined on the BF wall. The heat loss of gas phase on the BF wall is calculated by 5.0 (Tg-353) [33]. The PC particles are assumed to be gasified completely in the raceway. Therefore, the combustion products of the blast with the PC through Equation (5) in Table 3 form the inlet conditions for the gas phase. At the gas outlet, a fully-developed gas flow is assumed.
The solid flow is treated as a viscous flow. The CCB is treated as one component of the solid phase. As a consequence, the solid phase consists of coke, ore, and CCB. Each component has its physical properties. Above the CZ, the overall physical properties of the solid phase are calculated by averaging the physical properties of the components based on their volume fractions. Regarding the chemical species, even the same species in CCB and in ore/coke are treated separately because it undergoes different reaction schemes. The general governing Equation of the solid phase is Equation (6), in which, the solid bulk density and the solid physical velocity are adopted. Terms to represent φ, Γφ, and Sφ in Equation (6) are listed in Table 5. In actual BF, the iron-bearing burden is transformed to molten iron and slag, and the coke is completely consumed by combustion, carbon-solution loss reaction, carburization, and other equations. However, the present BF model is developed based on the gas-solid two-phase flow. Therefore, the present BF model needs a solid outlet. For ensuring a stable solid flow, the consumption of coke is not included in Table 5.
div ( ρ s V S φ ) = div ( Γ φ grad φ ) + S φ
A fluid-slip boundary is applied for the solid velocity on the BF wall. Heat loss of the solid phase on the BF wall is not considered. Inlet conditions of the solid phase are established according to BF operation conditions. At the solid outlet, the solid phase reaches a fully-developed flow. As, in actual BF operation, coke is completely consumed in BF, the enthalpy loss owing to the solid flow at the solid outlet is compensated by adding a source (Eadd) on the gas enthalpy Equation in RW, which is expressed by Equation (7).
E add = ( m C , coke T s , out C p s ) / i RW V cell

3.3. CCB Model

The CCB model developed by Tang et al. [34] was used in this research. The following is a brief introduction of the CCB model. The shape of CCB is nearly spherical, so the model is one-dimensional in a radial direction. The model is developed based on mass conservation of gas species, mass conservation of solid species, and mass transfer between CCB and environment. The gas species include CO, CO2, and N2, and the solid species are the components in the CCB. The Equations in the CCB model are listed in Table 6. Equations (1)–(3) in Table 6 are the gaseous reductions of iron particles, and Equation (4) in Table 6 is the carbon solution-loss reaction of carbon particles.
The mass conservation of the gas species in the CCB gives Equations (8) and (9).
( α P co 2 ) t = 1 r 2 r ( r 2 D CO 2 N 2 , eff P co 2 r ) + R T ( R 1 + R 2 + R 3 R 4 )
( α P co ) t = 1 r 2 r ( r 2 D CO N 2 , eff P co r ) + R T ( 2 R 4 R 1 R 2 R 3 )
where, α = 0.5 , D eff , CO N 2 = D CO N 2 α 2 / 3   , and D eff , CO 2 N 2 = D CO 2 N 2 α 2 / 3   .
For Equations (8) and (9), the boundary conditions are Equations (10)–(12).
r = 0 : P CO r = 0 , P CO 2 r = 0
r = d / 2 : D eff , CO N 2 P CO r = ( D CO N 2 ( 2.0 + 0.6 Re 1 / 2 Sc CO N 2 1 / 3 ) / d ) ( P CO P CO , e )
r = d / 2 :   D eff ,   CO 2 N 2 P CO 2 r = ( D CO 2 N 2 ( 2.0 + 0.6 Re 1 / 2 Sc CO 2 N 2 1 / 3 ) / d ) ( P CO 2 P CO 2 , e )
where, Re = u g , e ρ g , e d / μ g , e   , Sc CO N 2 = μ g , e / ( ρ g , e D CO N 2 )   , and Sc CO 2 N 2 = μ g , e / ( ρ g , e D CO 2 N 2 )   .
For Equations (8)–(9), the initial conditions are provided by Equation (13).
  t = 0 ,   r ( 0 , d / 2 ) : P CO = P CO , e   ,   P CO 2 = P CO 2 , e
The mass conservation of the solid species in the CCB gives Equation (14).
ρ j / t = S j
where j = Fe2O3, Fe3O4, FeO, Fe, and C; S Fe 2 O 3 = 0.003 M Fe 2 O 3 ( r 1 ) , S Fe 3 O 4 = 0.001 M Fe 3 O 4 ( 2 r 1 r 2 ) , S FeO = 0.001 M FeO ( 3 r 2 r 3 ) , S Fe = 0.001 M Fe R 3 , and S C = 0.001 M C r 4 .
The initial condition for Equation (14) is provided by Equation (15).
t = 0 , r ( 0 , d / 2 ) : ρ j = ρ j , 0  

3.4. Solution Strategy

The simulations were performed using the following strategy. Firstly, the rates of the CCB Equations (6)–(9) in Table 3 were initialized. The BF model Equations (5) and (6) were solved numerically solved using PHOENICS [35] and an in-house developed code. After the BF model reached a primary convergence, the Lagrangian method was used to adjust these reaction rates in all cells. These adjustments continued until the BF model reached the final convergence.
The Lagrangian method to adjust the rates of Equations (6)–(9) in Table 3 is illustrated in Figure 2 and detailed elsewhere [34]. For a given cell, the solid-phase streamline through the cell is determined after the BF model reaches a primary convergence Figure 2a. The CCB reaction behavior along the streamline is calculated using the above CCB model. The descending time of the CCB to reach the cell center is calculated by 0 s ( 1 / V s ) d s , where, s is the distance from the cell center to the burden surface, (m). The boundary conditions of the CCB model are determined by the corresponding BF variables along the streamline. Thus, the radial distributions of r1, r2, r3, and r4 of Equations (1)–(4) Table 6 in CCB reaching the cell center are obtained. It is considered that the CCB reaching the cell center is representative of all briquettes in the cell Figure 2b. Therefore, the rates of Equations (6)–(9) in Table 3 in the cell are Equation (16).
R j = 0.001 α CCB N CCB 4 π 0 d / 2 r i r 2 d r
where, i = 1, 2, 3, and 4 of the Equations in Table 5 for j = 6, 7, 8, and 9 of the Equations in Table 3, respectively; α CCB is the volume fraction of CCB in the solid burden, (-); and N CCB is the number density of CCB, (1/m3).
In addition to the examination of the convergence of gas and solid flow fields, the mass balance of the removable element O and of the element Fe are examined and the convergence criteria are Equations (17) and (18).
m O M O ( R 1 + R 2 + R 3 + R 6 + R 7 + R 8 ) V cell / m O < 0 . 01
m Fe M Fe ( R 10 + R 11 + R 13 + R 14 + R 16 ) V Cell / m Fe < 0 . 01
where, mO is the mass supply rate of the element O in the solid phase at the solid inlet, and mFe is the mass supply rate of element Fe in the solid phase at the solid inlet.
Detailed gas and solid inlet conditions of cases A and B are shown in Table 7. The results of case A are kept as reference values for case B. In case B, the coke supply rate is determined by trial and error, and the convergence criteria for the mass balance of element C in the coke is Equation (19).
m C , coke M C ( R 4 + R 5 + R 9 + R 16 ) V cell m Fe [ % C ] / ( 1 . 0 [ % C ] ) m C , other / m C , coke < 0 . 01
where, m C , coke and m Fe are the mass supply rates of element C in the coke, and element Fe in the solid burden, respectively; [%C] is the carbon content in molten iron; and m C , other is the rate of carbon consumed by other Equations (e.g., silica and manganese oxide reductions), which is determined by case A.

4. Results and Discussion

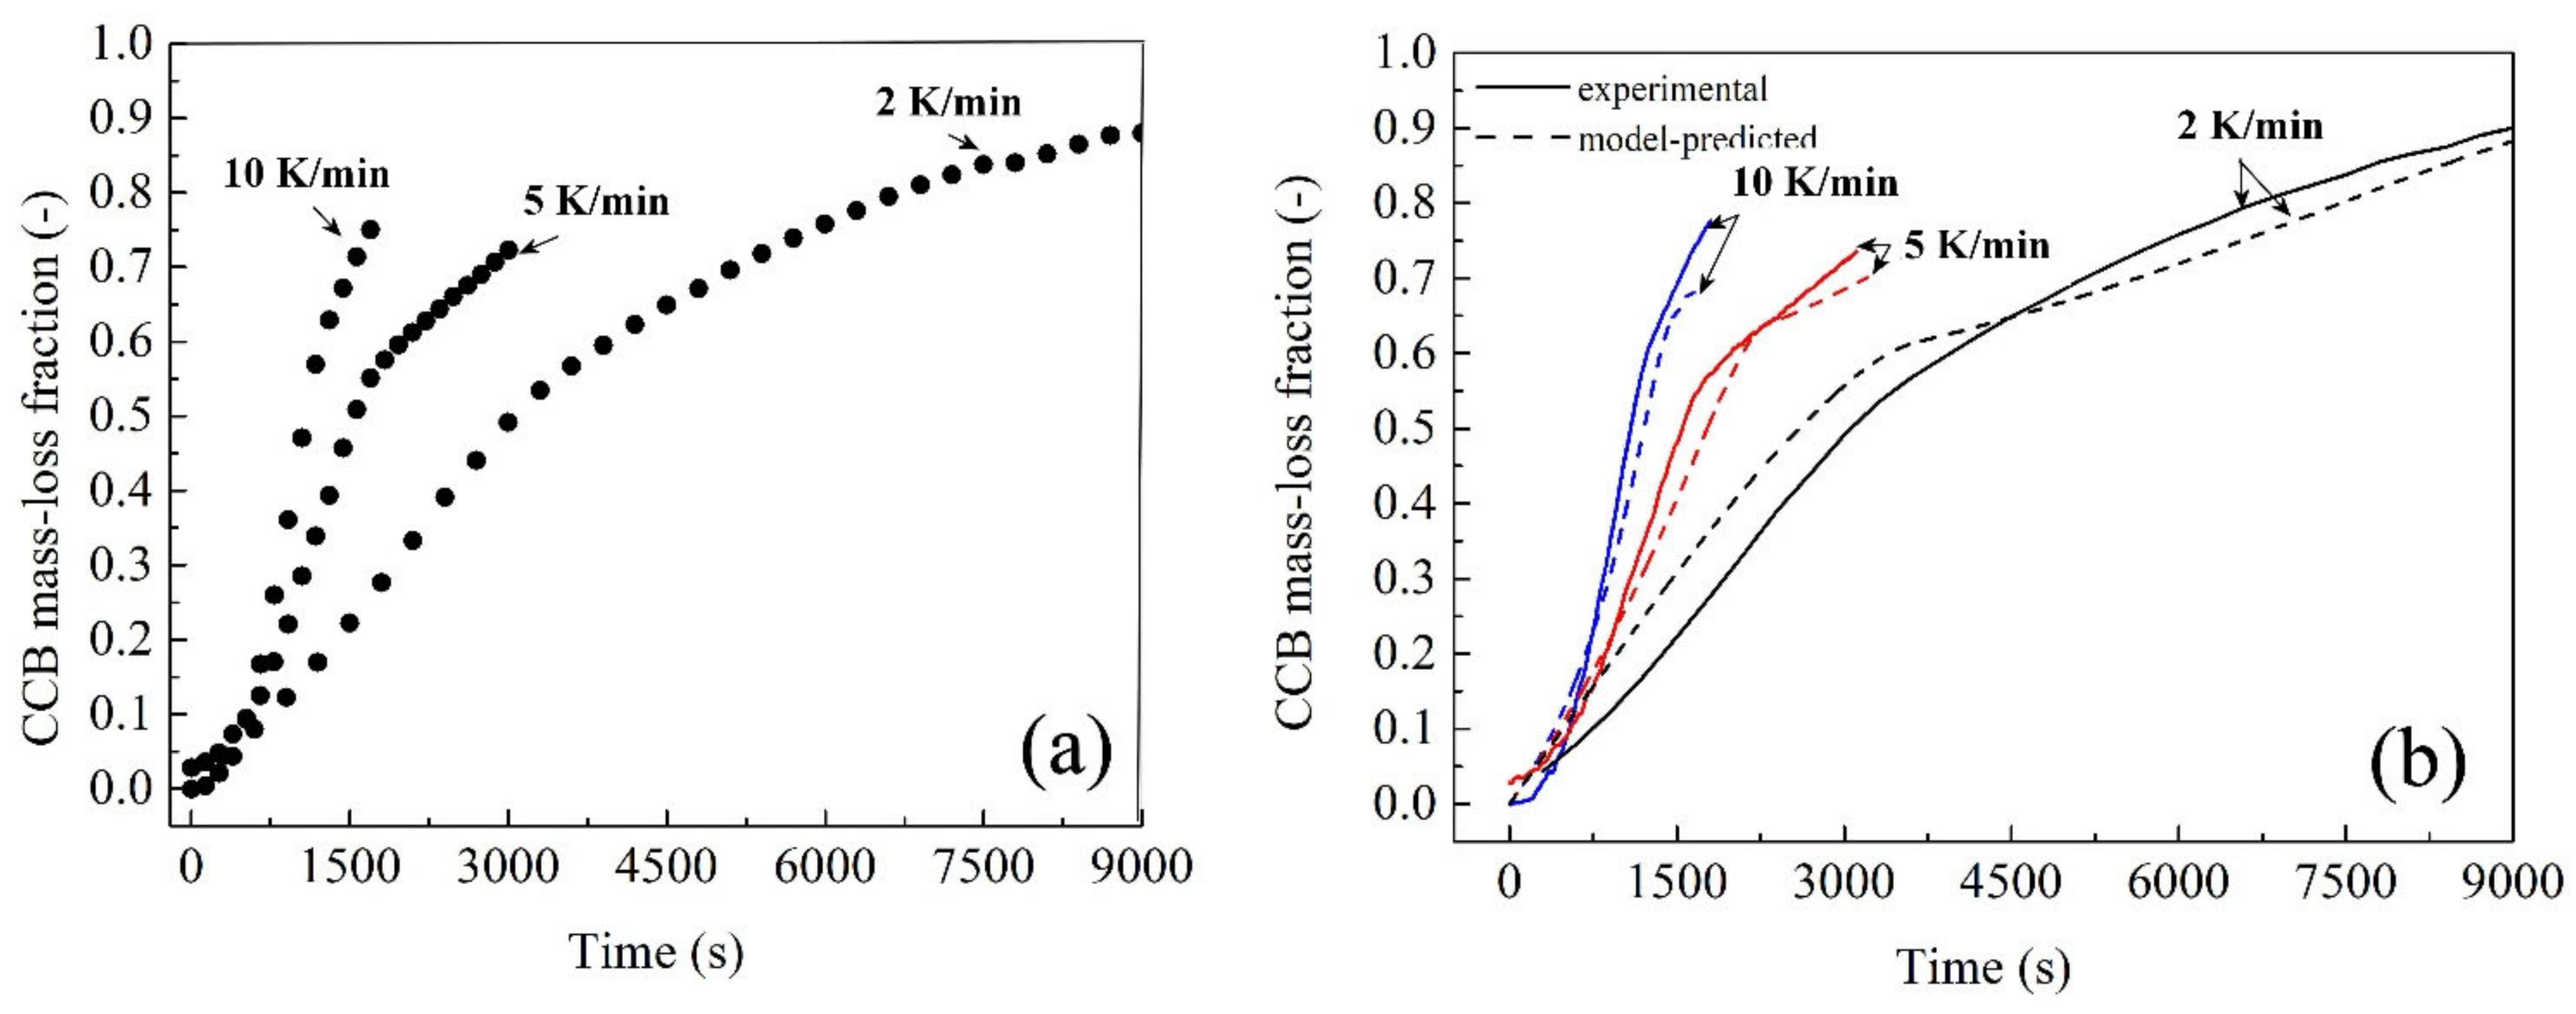
4.1. Determination of Parameter in CCB Model

In this case, ags in the reaction rates of Equations (1)–(3) in Table 6 was difficult to determine owing to the sintering of iron-oxide particles [25]. Different from CCB reduction in some direct reduction processes (e.g., rotary hearth furnace), CCB in BF undergoes slow heating. During the heating, its self-reduction and Equations with BF gas proceed. Under the BF environment, changes in CCB volume and porosity become obvious with the increase of temperature [34,36]. Therefore, compared to the isothermal tests, the nonisothermal tests under simulated BF environment are more suitable to determine the CCB model parameters. The value of ags was determined by trial and error. The experimental data points for fitting are shown in Figure 3a. They were selected at time intervals of 300 s on the curve of 2 K·min−1, 120 s on the curve of 5 K·min−1, and 60 s on the curve of 10 K·min−1. Five values of ags (1000 m2·m−3, 1300 m2·m−3, 1600 m2·m−3, 1900 m2·m−3, and 2200 m2·m−3) were examined. the fitness of each value was evaluated by MSE, which is expressed by Equation (20).
M S E = ( i N P ( v sim v exp ) 2 ) / N P
where, vsim is model-predicted value, vexp is experimental value, and NP is the total number of data points in Figure 3a.
The fitting results showed that, under ags = 1000 m2·m−3, MSE = 0.064; under ags = 1300 m2·m−3, MSE = 0.058; under ags = 1600 m2·m−3, MSE = 0.055; under ags = 1900 m2·m−3, MSE = 0.054, and under ags = 2200 m2·m−3, MSE = 0.055. Thus, it was considered that ags = 1900 m2·m−3 was optimal. Measured mass-loss curves and optimal model-predicted ones are plotted in Figure 3b. It could be seen in Figure 3b that the model predictions agree well with the experimental measurements.

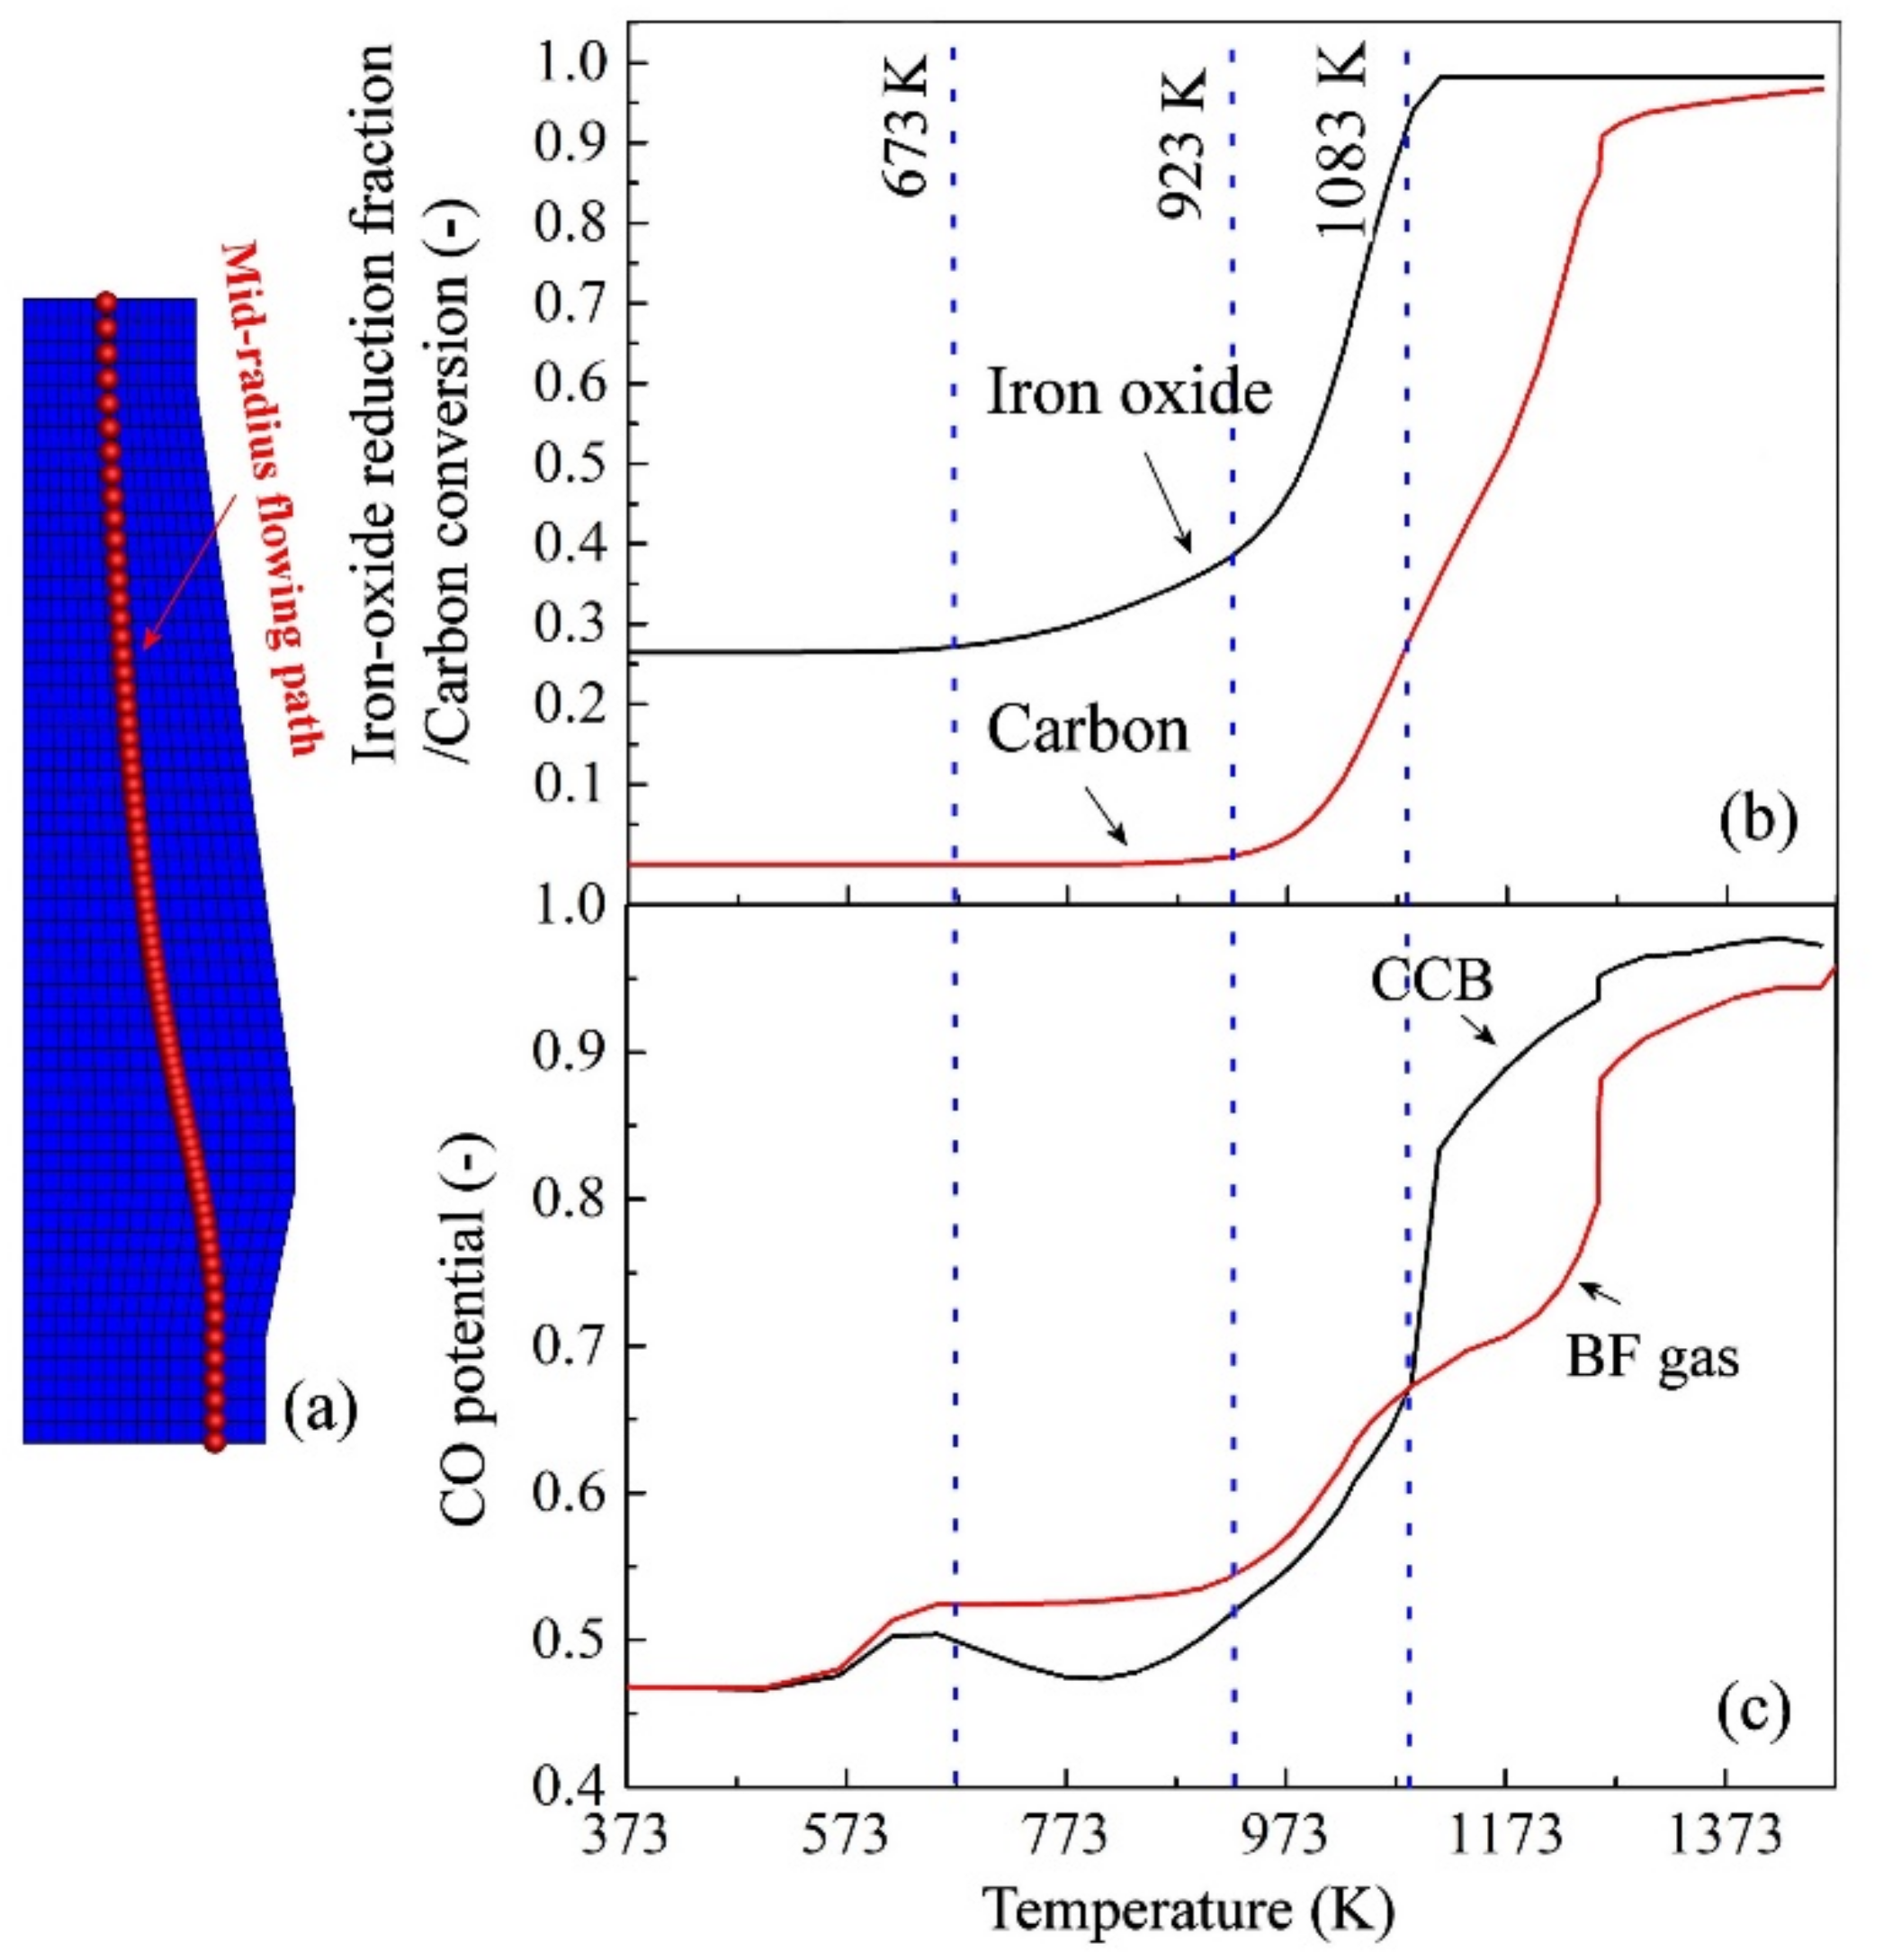
4.2. CCB Behavior in BF

The simulation results of CCB behavior in case B are shown in Figure 4. Figure 4a shows that the CCB iron oxide starts reduction at approximately 673 K, and it reaches a full reduction at approximately 1123 K, reflecting that the CCB reducibility is high. Figure 4b shows that the CCB carbon starts gasification at approximately 923 K. Above the CZ, its overall conversion is 85%, indicating that 15% of the CCB carbon would enter the BF lower part. In the present investigation, the influence of the ungasified CCB carbon in the BF lower part was not considered as its behavior has not been distinctly disclosed so far [37].
Figure 5 shows the behavior of a single CCB along a solid flowing path in the BF. The path is near the BF mid-radius Figure 5a. From Figure 5b, it can be seen that, in the temperature range from 923 K to 1123 K, self-reduction occurs in the CCB. However, the CO potential ( P CO / ( P CO + P CO 2 ) ) in CCB becomes higher than that in BF gas after the temperature reaches 1083 K.

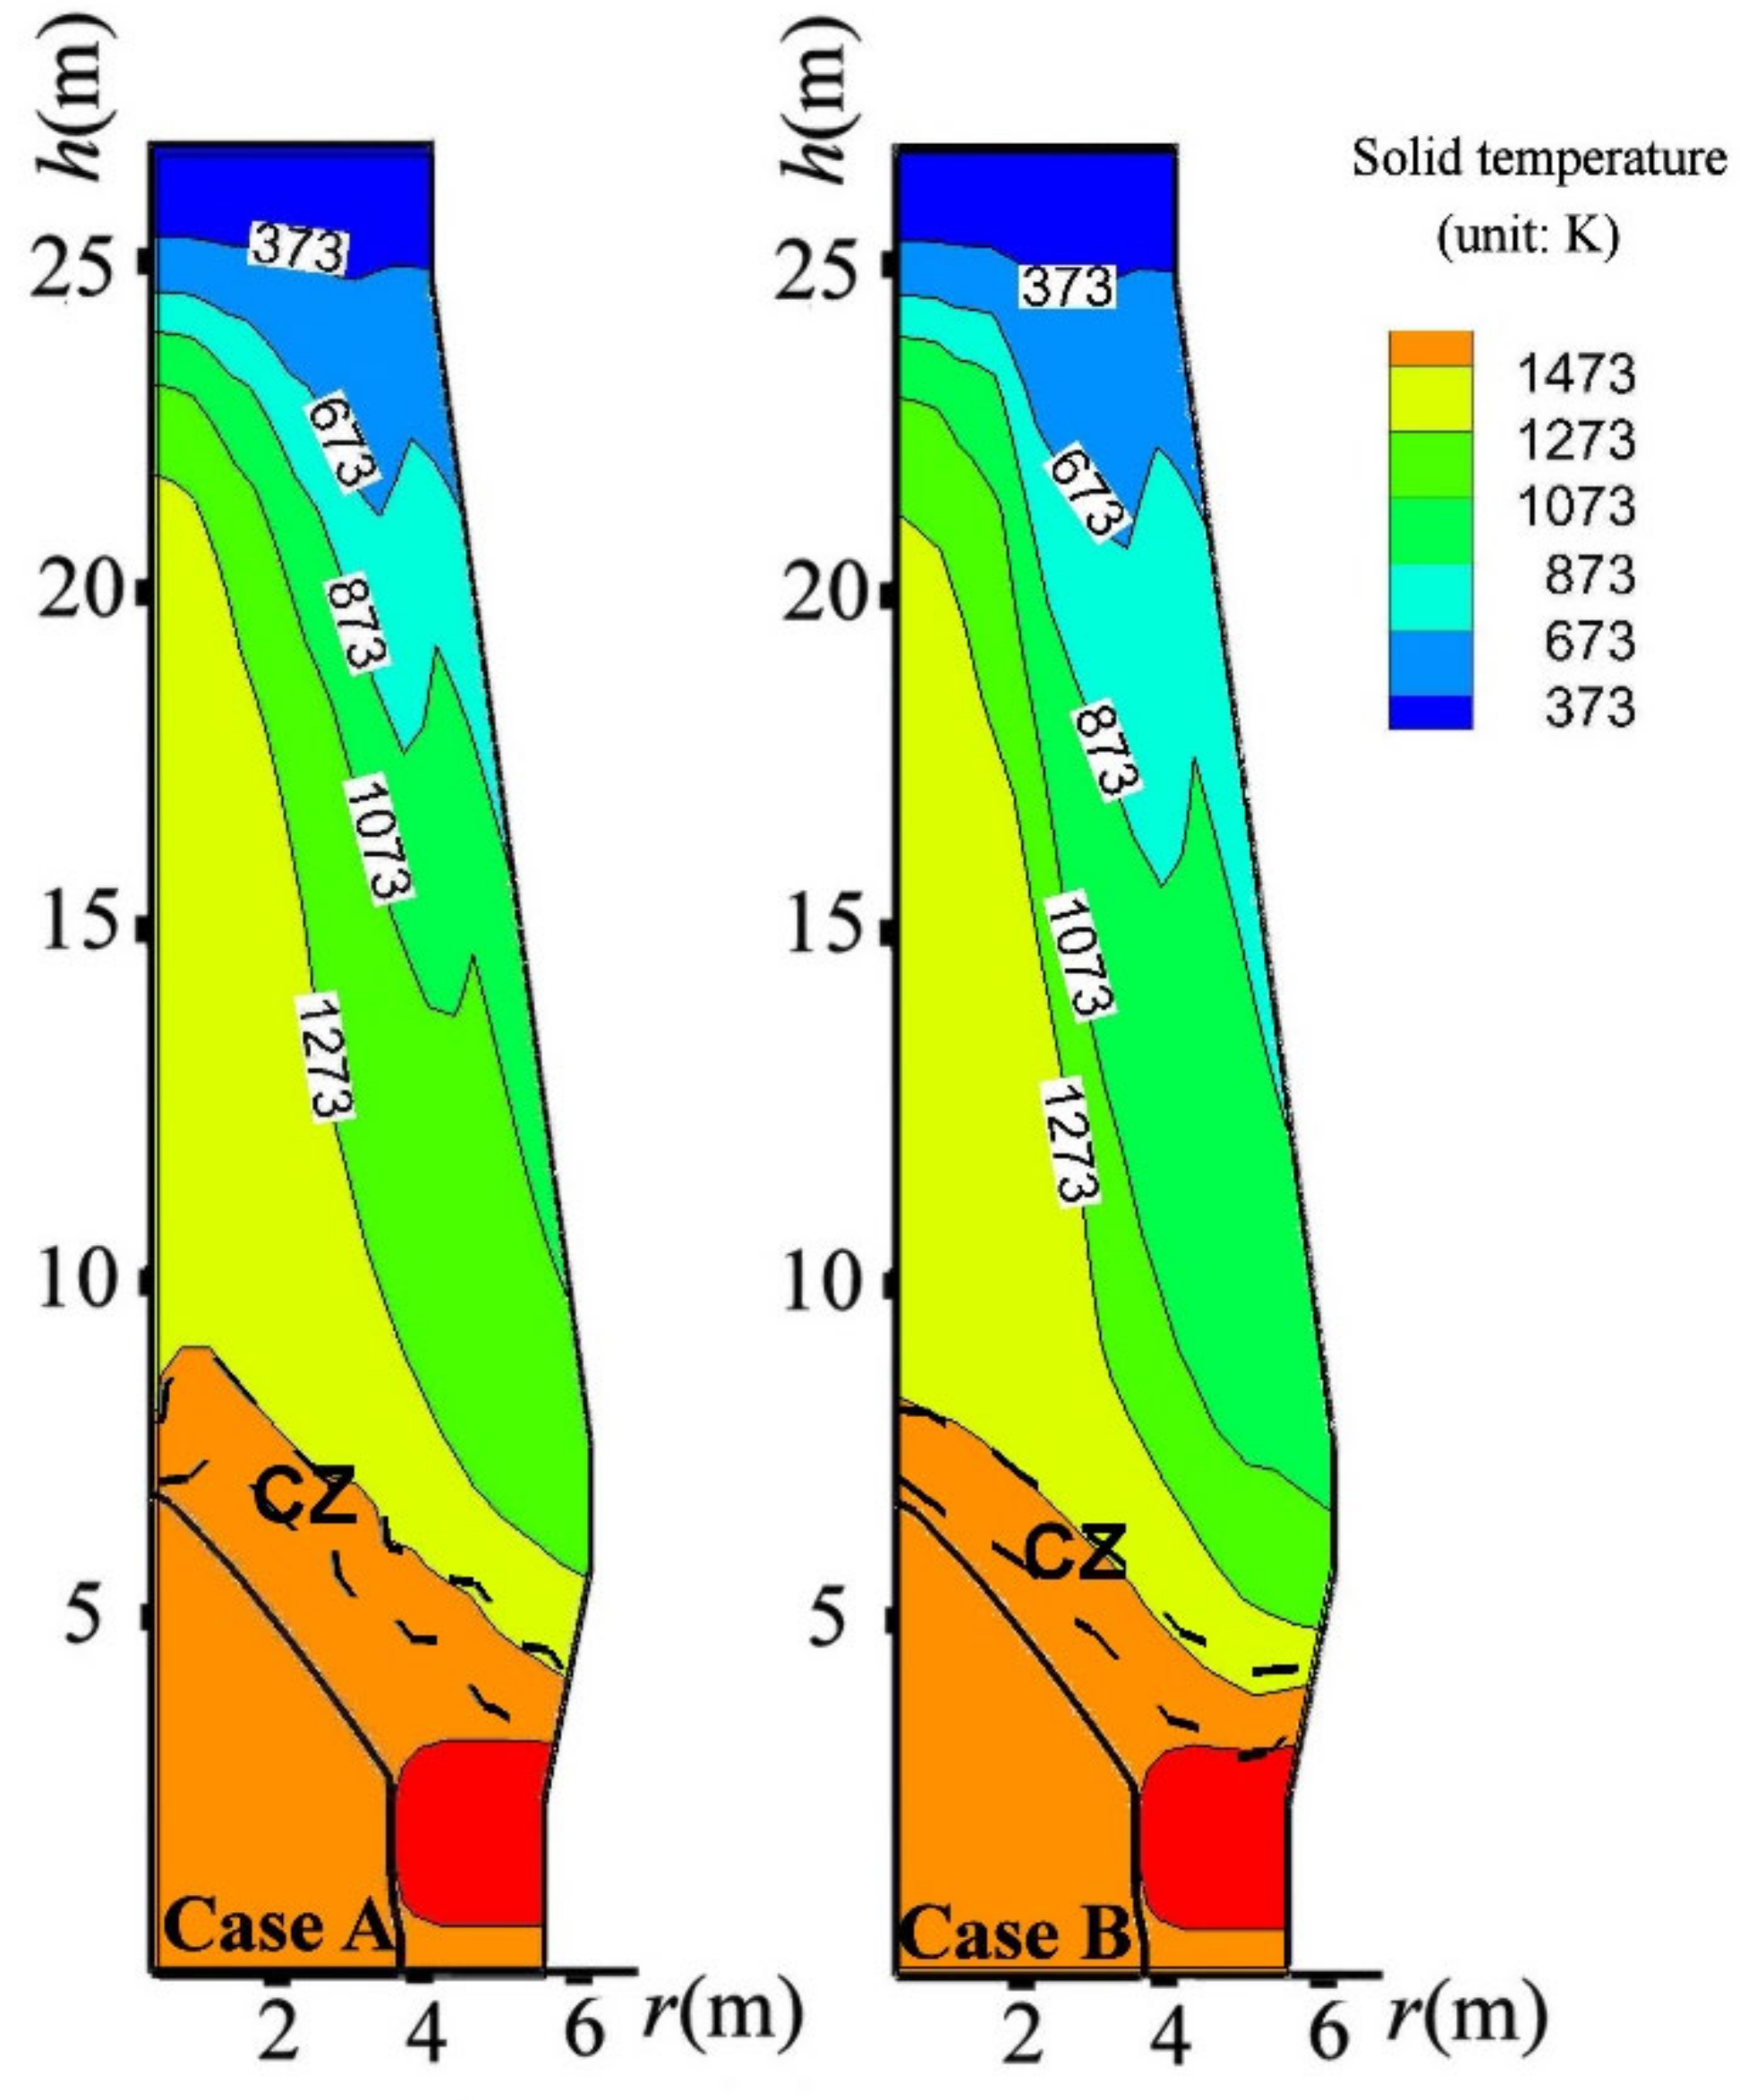
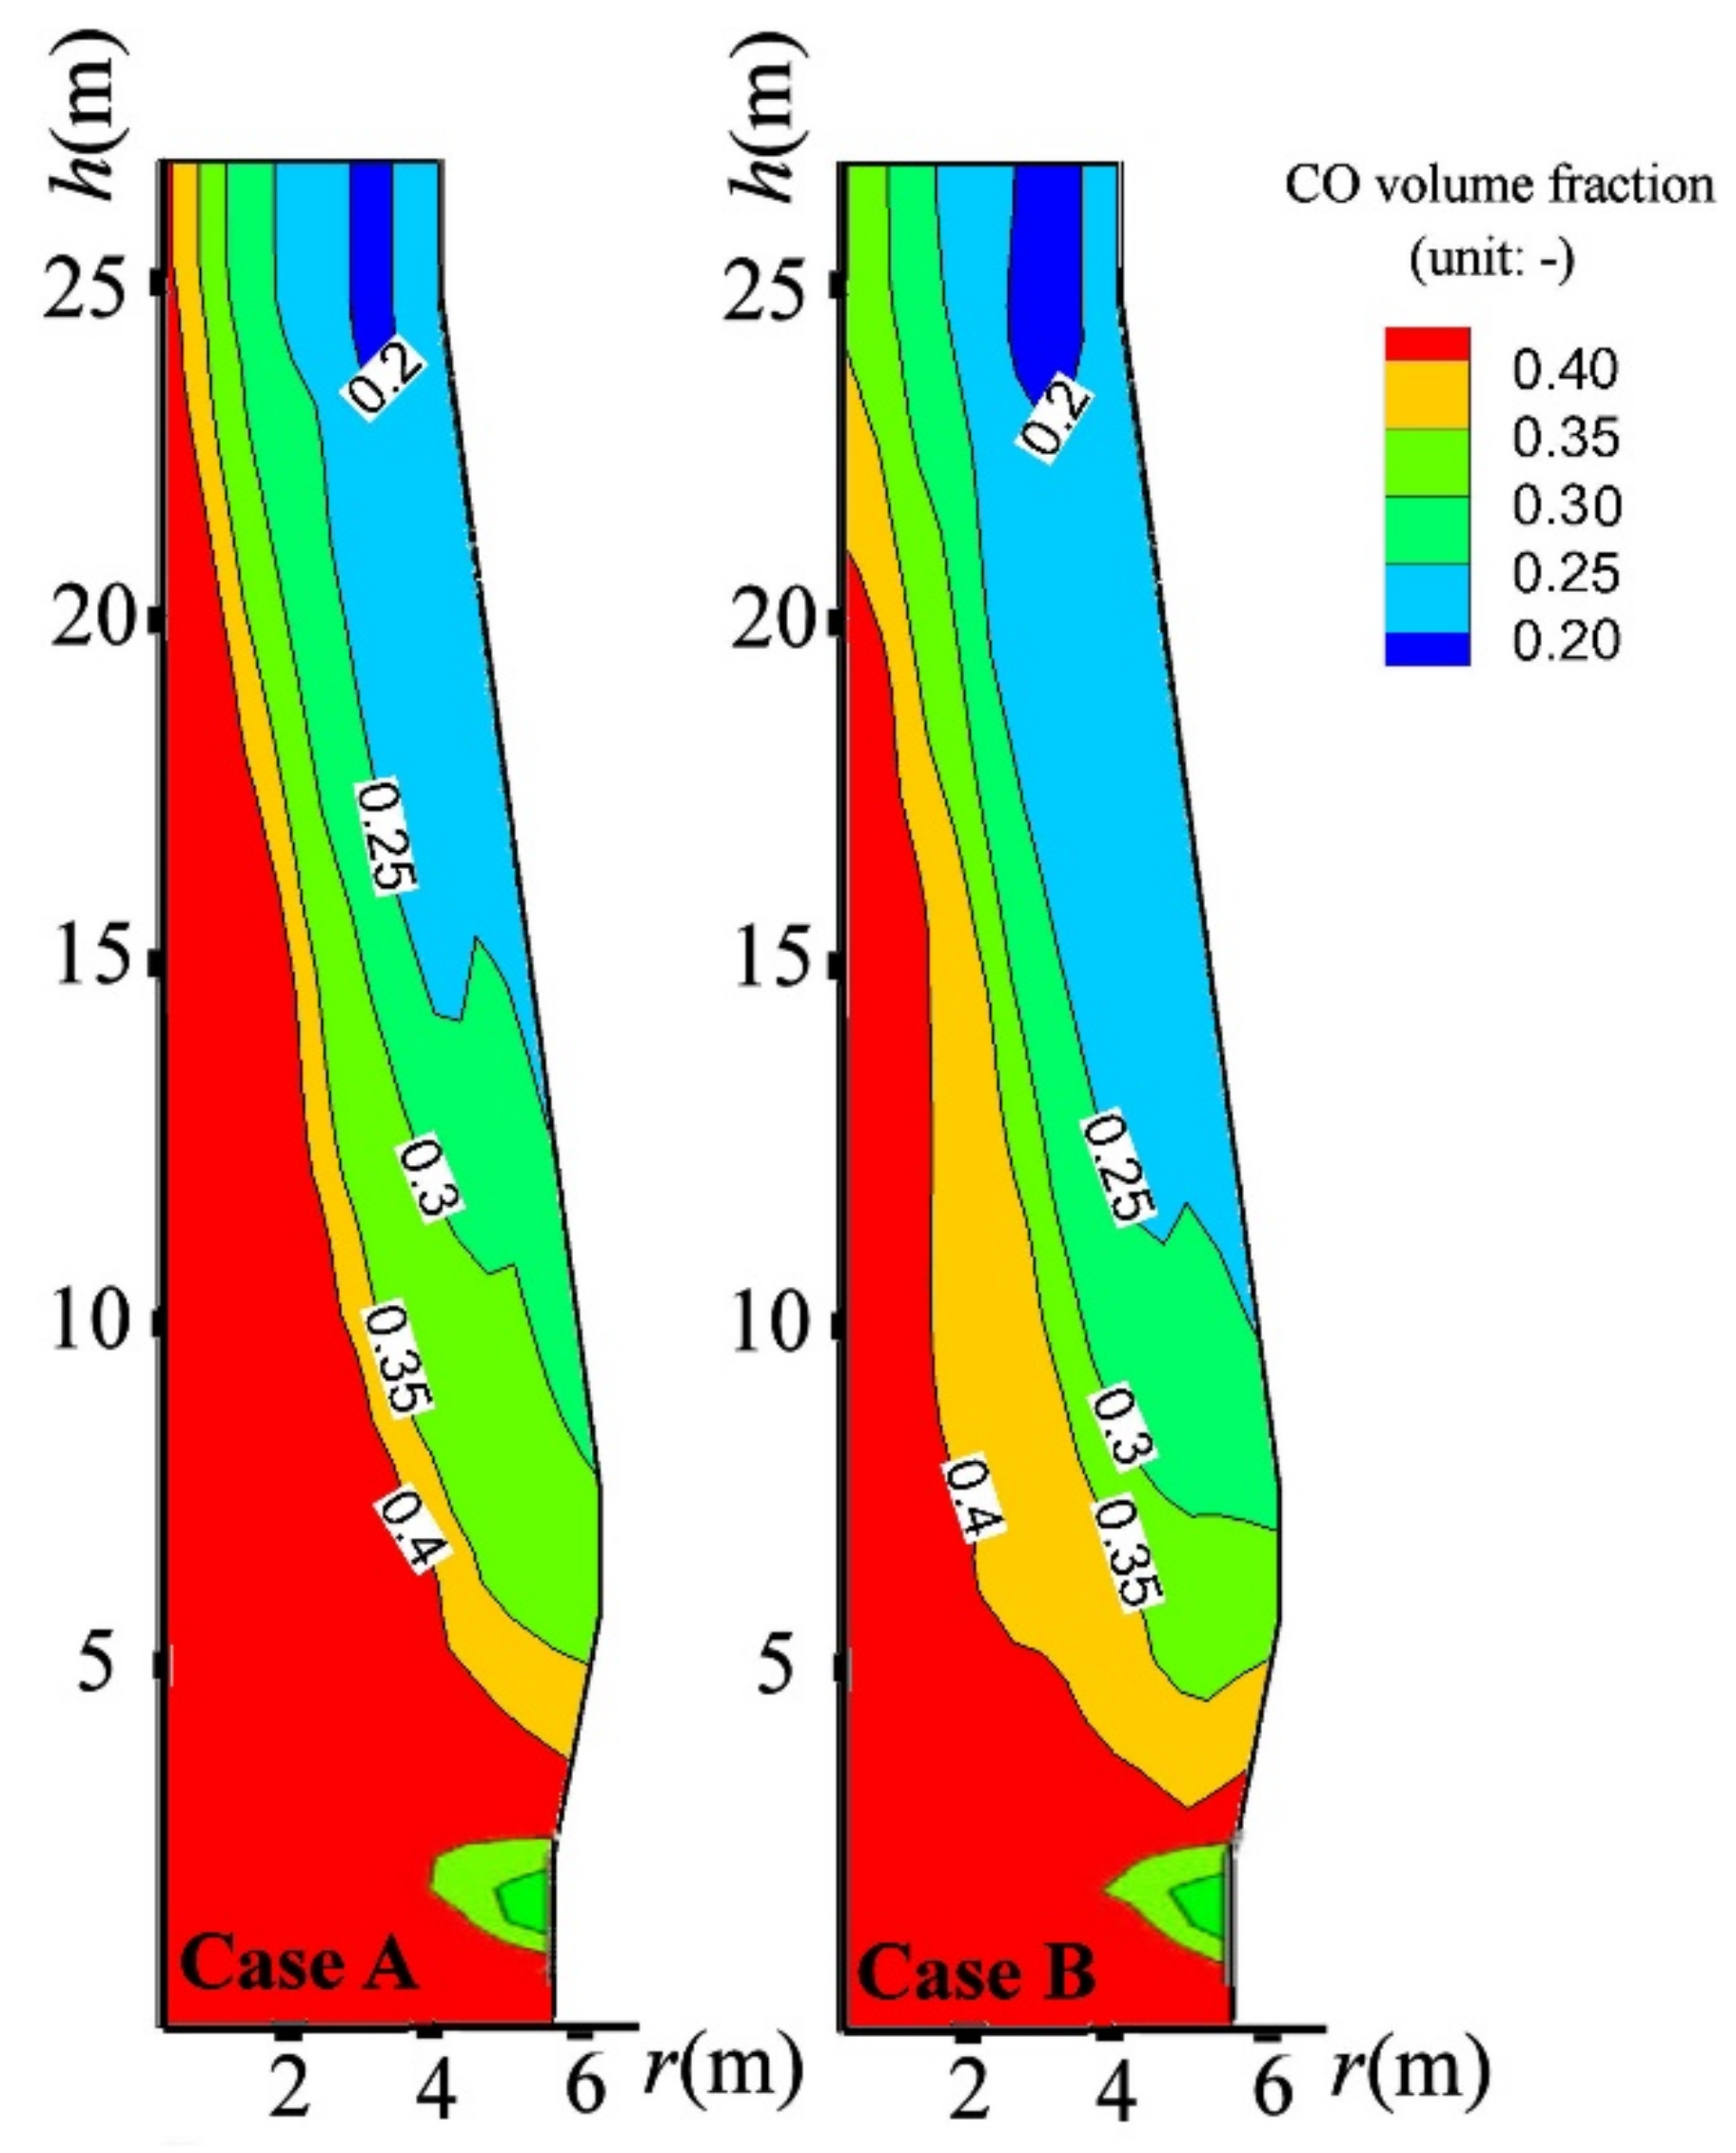
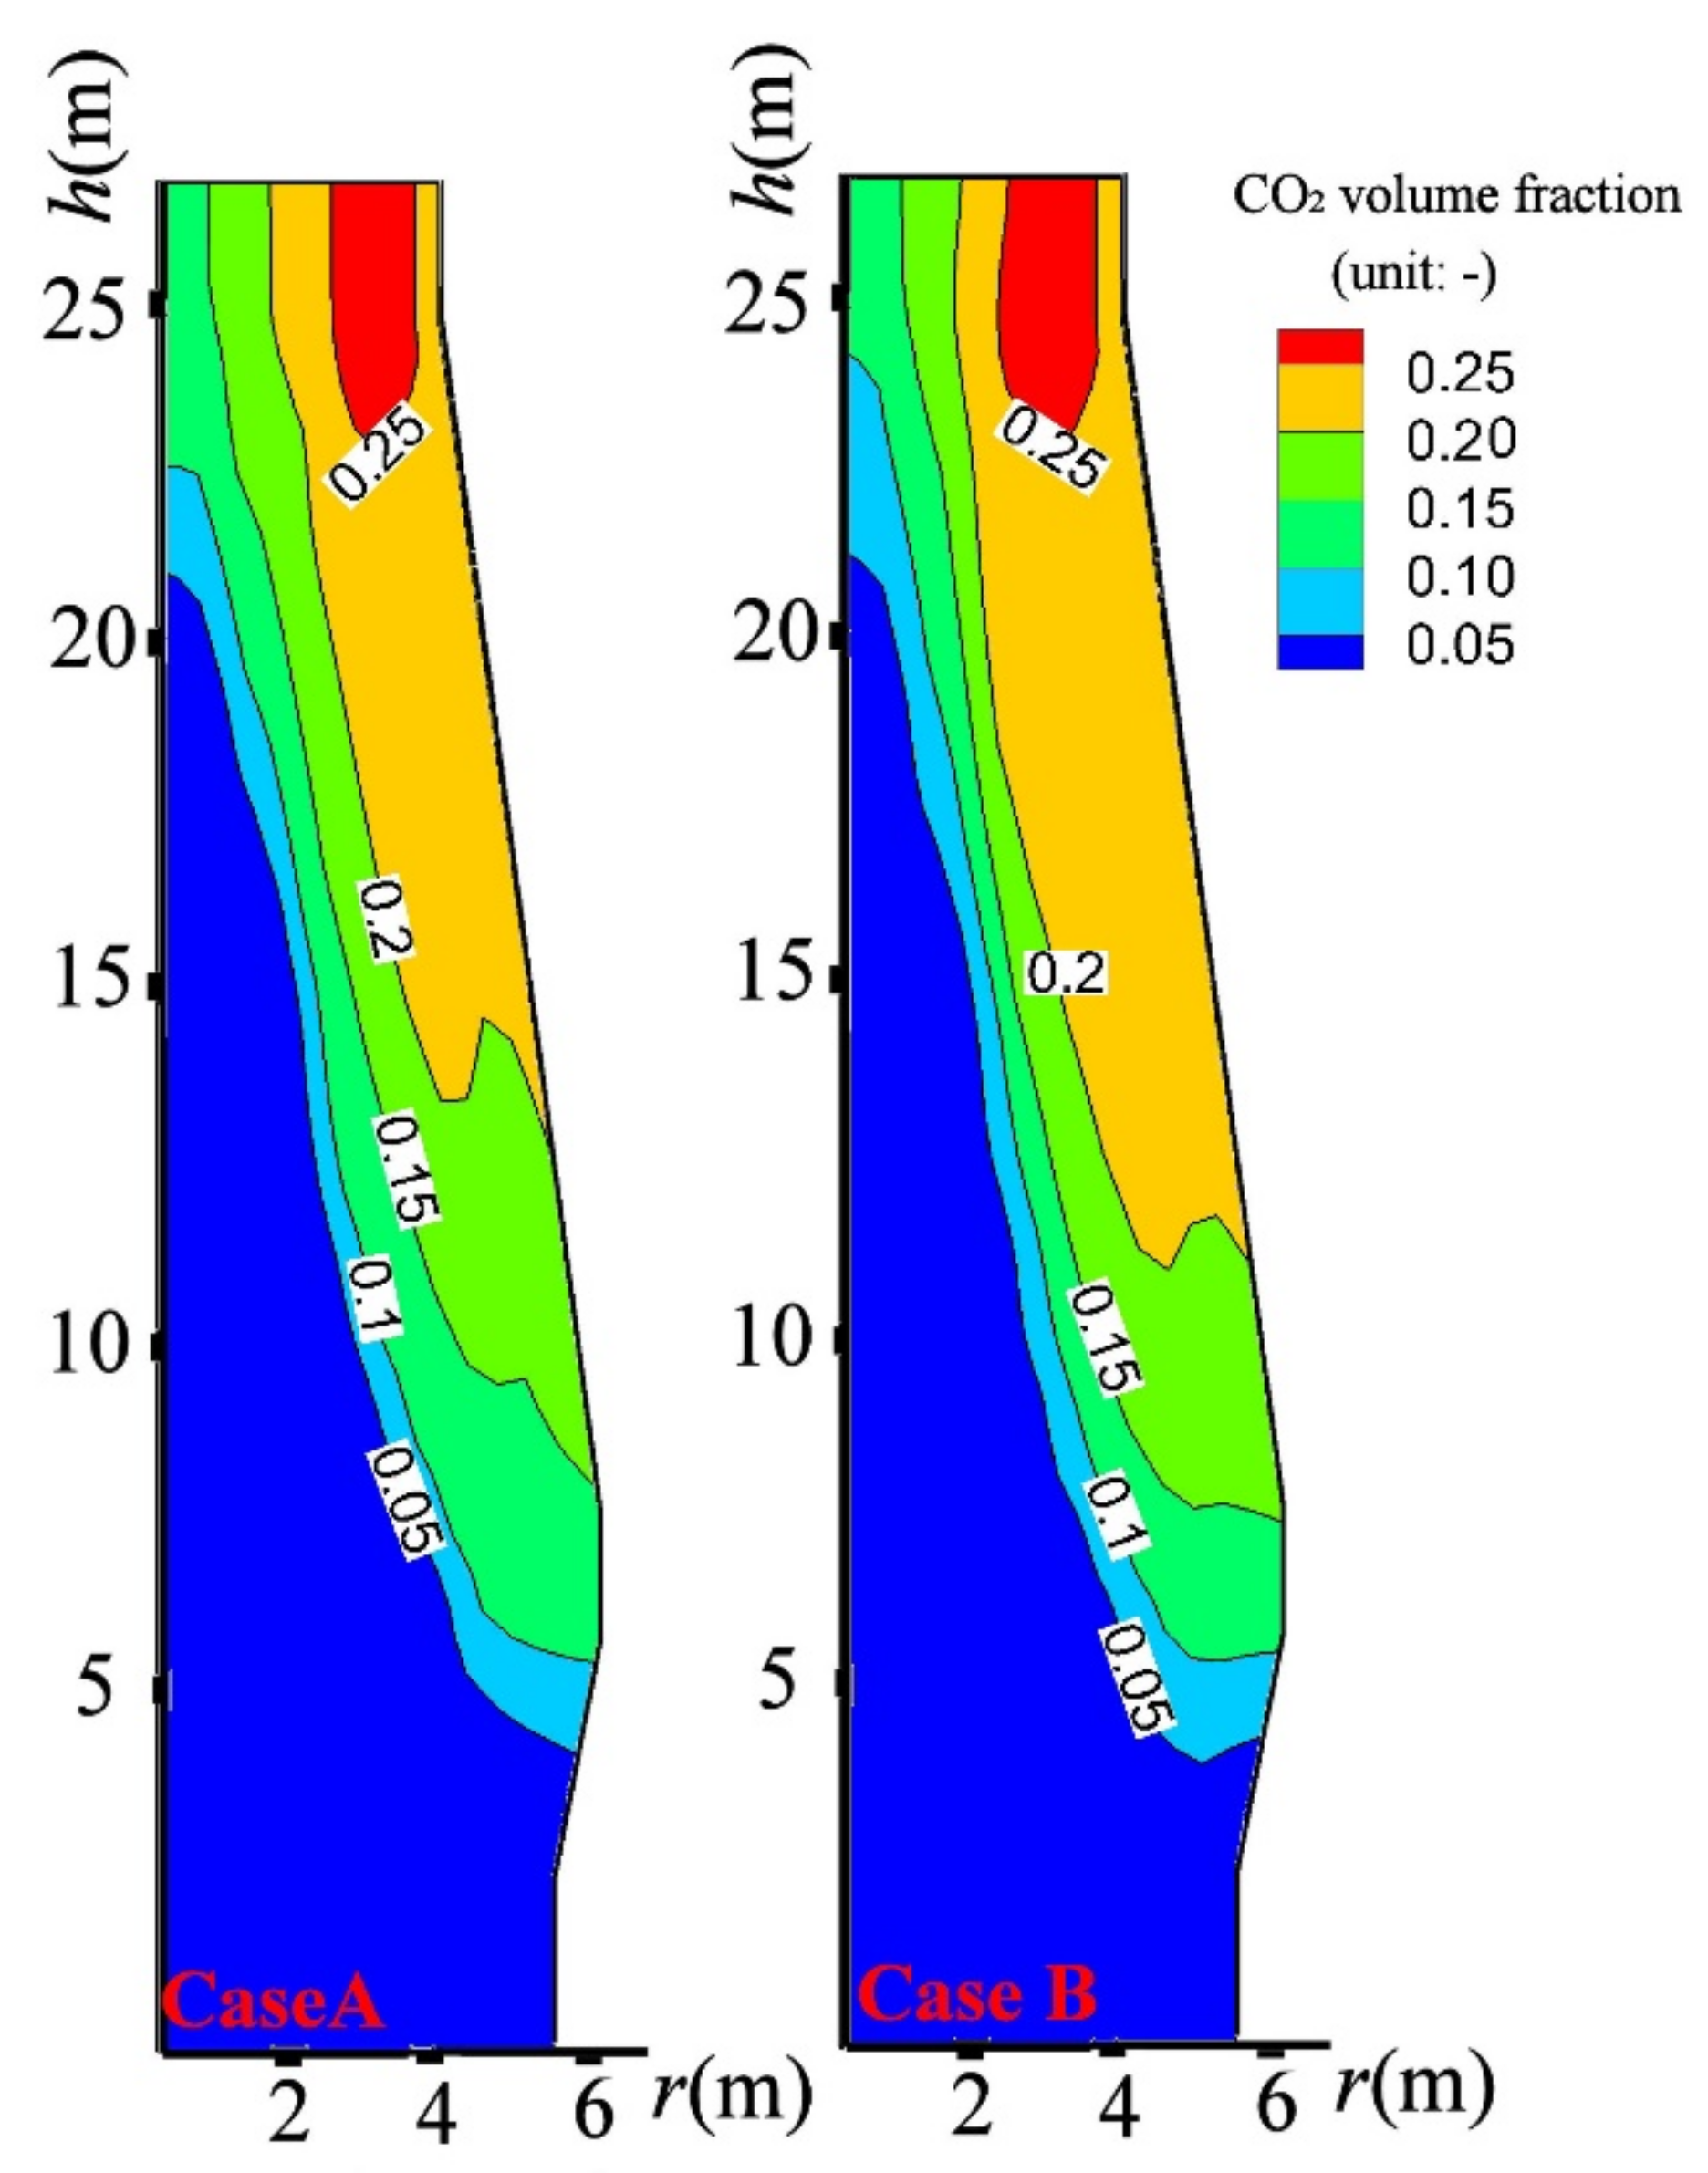
4.3. Influence on BF in-Furnace State

The influence of CCB charging on the BF thermal state is shown in Figure 6 and Figure 7. In Figure 6, compared to case A, lines 873 K and 1073 K move downward in case B. These tendencies are also displayed in Figure 7. In CCB charging operation, the CCB self-reduction is a strongly endothermic reaction and needs more heat than the ore gaseous reduction or the coke gasification. The CCB self-reduction occurs in the temperature range from 923 K to 1123 K Figure 5a, so the gas-solid heat transfer is enhanced there, and the gas-solid heat transfer is weakened above, resulting in a considerable change of thermal state in the BF upper part. After 1273 K, the CCB Equations are finished, so the influence on the BF thermal state becomes negligible. It is observed that, in Figure 6, locations of line 1273 K in both cases are nearly the same, and the heights of CZ in both cases don’t show a significant difference. Furthermore, in Figure 7, gas temperature profiles in both cases exhibit similar patterns in the BF lower part.
The influence of charging CCB on gas and solid reaction behaviors is shown in Figure 8, Figure 9, Figure 10 and Figure 11. By charging CCB, the ore reduction is retarded in the BF upper part (e.g., in Figure 8, in comparison to case A, the distance between lines 0.1 and 0.2 in case B increases). This is mainly attributed to the delay of solid temperature increase. However, after the solid temperature reaches 1073 K, the ore reduction is prompted (e.g., in Figure 8, comparing cases A and B, lines of 0.2 and 0.9 are closer in case B, and, in the mid radius zone, the distance between line 0.9 and CZ decreases in case B). This is attributed to the increase of CO potential in BF gas by CCB (Figure 5a). As a result, charging CCB has a positive effect on the overall ore reduction above CZ. Before the temperature reaches 1073 K, the CCB reduces the CO potential in BF gas (Figure 5b), leading to a decrease of CO volume fraction. After the temperature reaches 1073 K, the ore reduction is intensified by CCB, thus, CO volume fraction above CZ tends to decrease by charging CCB (e.g., in Figure 9, compared to case A, lines of 0.25 and 0.40 move downward in case B), and CO2 volume fraction above CZ tends to increase (Figure 10). Accordingly, local gas utilization ( P CO 2 / ( P CO + P CO 2 ) ) increases above CZ (e.g., in Figure 11, compared to case A, lines of 0.4 and 0.5 in case B move downward).

4.4. Coke-Saving Analysis

Table 8 lists some operation indices for cases A and B. By replacing 10% ore with CCB, the BF top gas temperature is decreased by 8 K, the BF top gas utilization is increased by 1.3%, BF productivity is decreased by 17 tHM/day, and the coke rate is decreased by 52.2 kg/tHM (this decrease is only with the consideration of gasification of CCB carbon above CZ).
The BF ironmaking process includes sintering, coking, and ironmaking. Replacing 10% ore with CCB, the CCB rate is 179 kg/tHM and the ore rate is decreased to 1579 kg/tHM, Therefore, in the CCB charging operation, 101 kg sinter and 52.2 kg could be saved to produce one-ton hot metal. Considering the energy consumption of sintering and coking, the CCB charging operation could have a significant energy-saving and CO2-emission-reducing effect for BF ironmaking.
Distributions of coke consumption in cases A and B are listed in Table 9. From Table 9, it is known that in the total coke-rate reduction by charging CCB, 14.3 kg/tHM is from the carbon solution loss reaction of coke, 38.4 kg/tHM from the direct reduction of molten FeO. These findings indicate that charging CCB can suppress the coke solution-loss reaction and significantly reduce the coke consumption in the direct reduction of molten FeO.

5. Conclusions

In this study, the CCB for BF application was prepared using cold briquetting followed by heat treatment. The CCB contained 29.70 wt.% Fe3O4, 39.70 wt.% FeO, 1.57 wt.% Fe, 8.73 wt.% gangue, and 20.30 wt.% carbon. its reduction kinetics in BF conditions were examined by nonisothermal tests and modeled. The BF operation with replacing 10% ore with CCB was investigated by numerical simulations. Some conclusions were obtained.
  • The CCB reaction behavior in BF could be modeled using the previously proposed model by the current authors. Under ags = 1900 m2·m−3, the agreement between experimental measurements and model predictions was satisfying.
  • In the CCB charging operation, the CCB reached a full iron-oxide reduction and a carbon conversion of 85% above CZ.
  • By charging CCB, the thermal state in the BF upper part was significantly changed; however, the BF thermal state in the BF lower part was inconsiderably influenced.
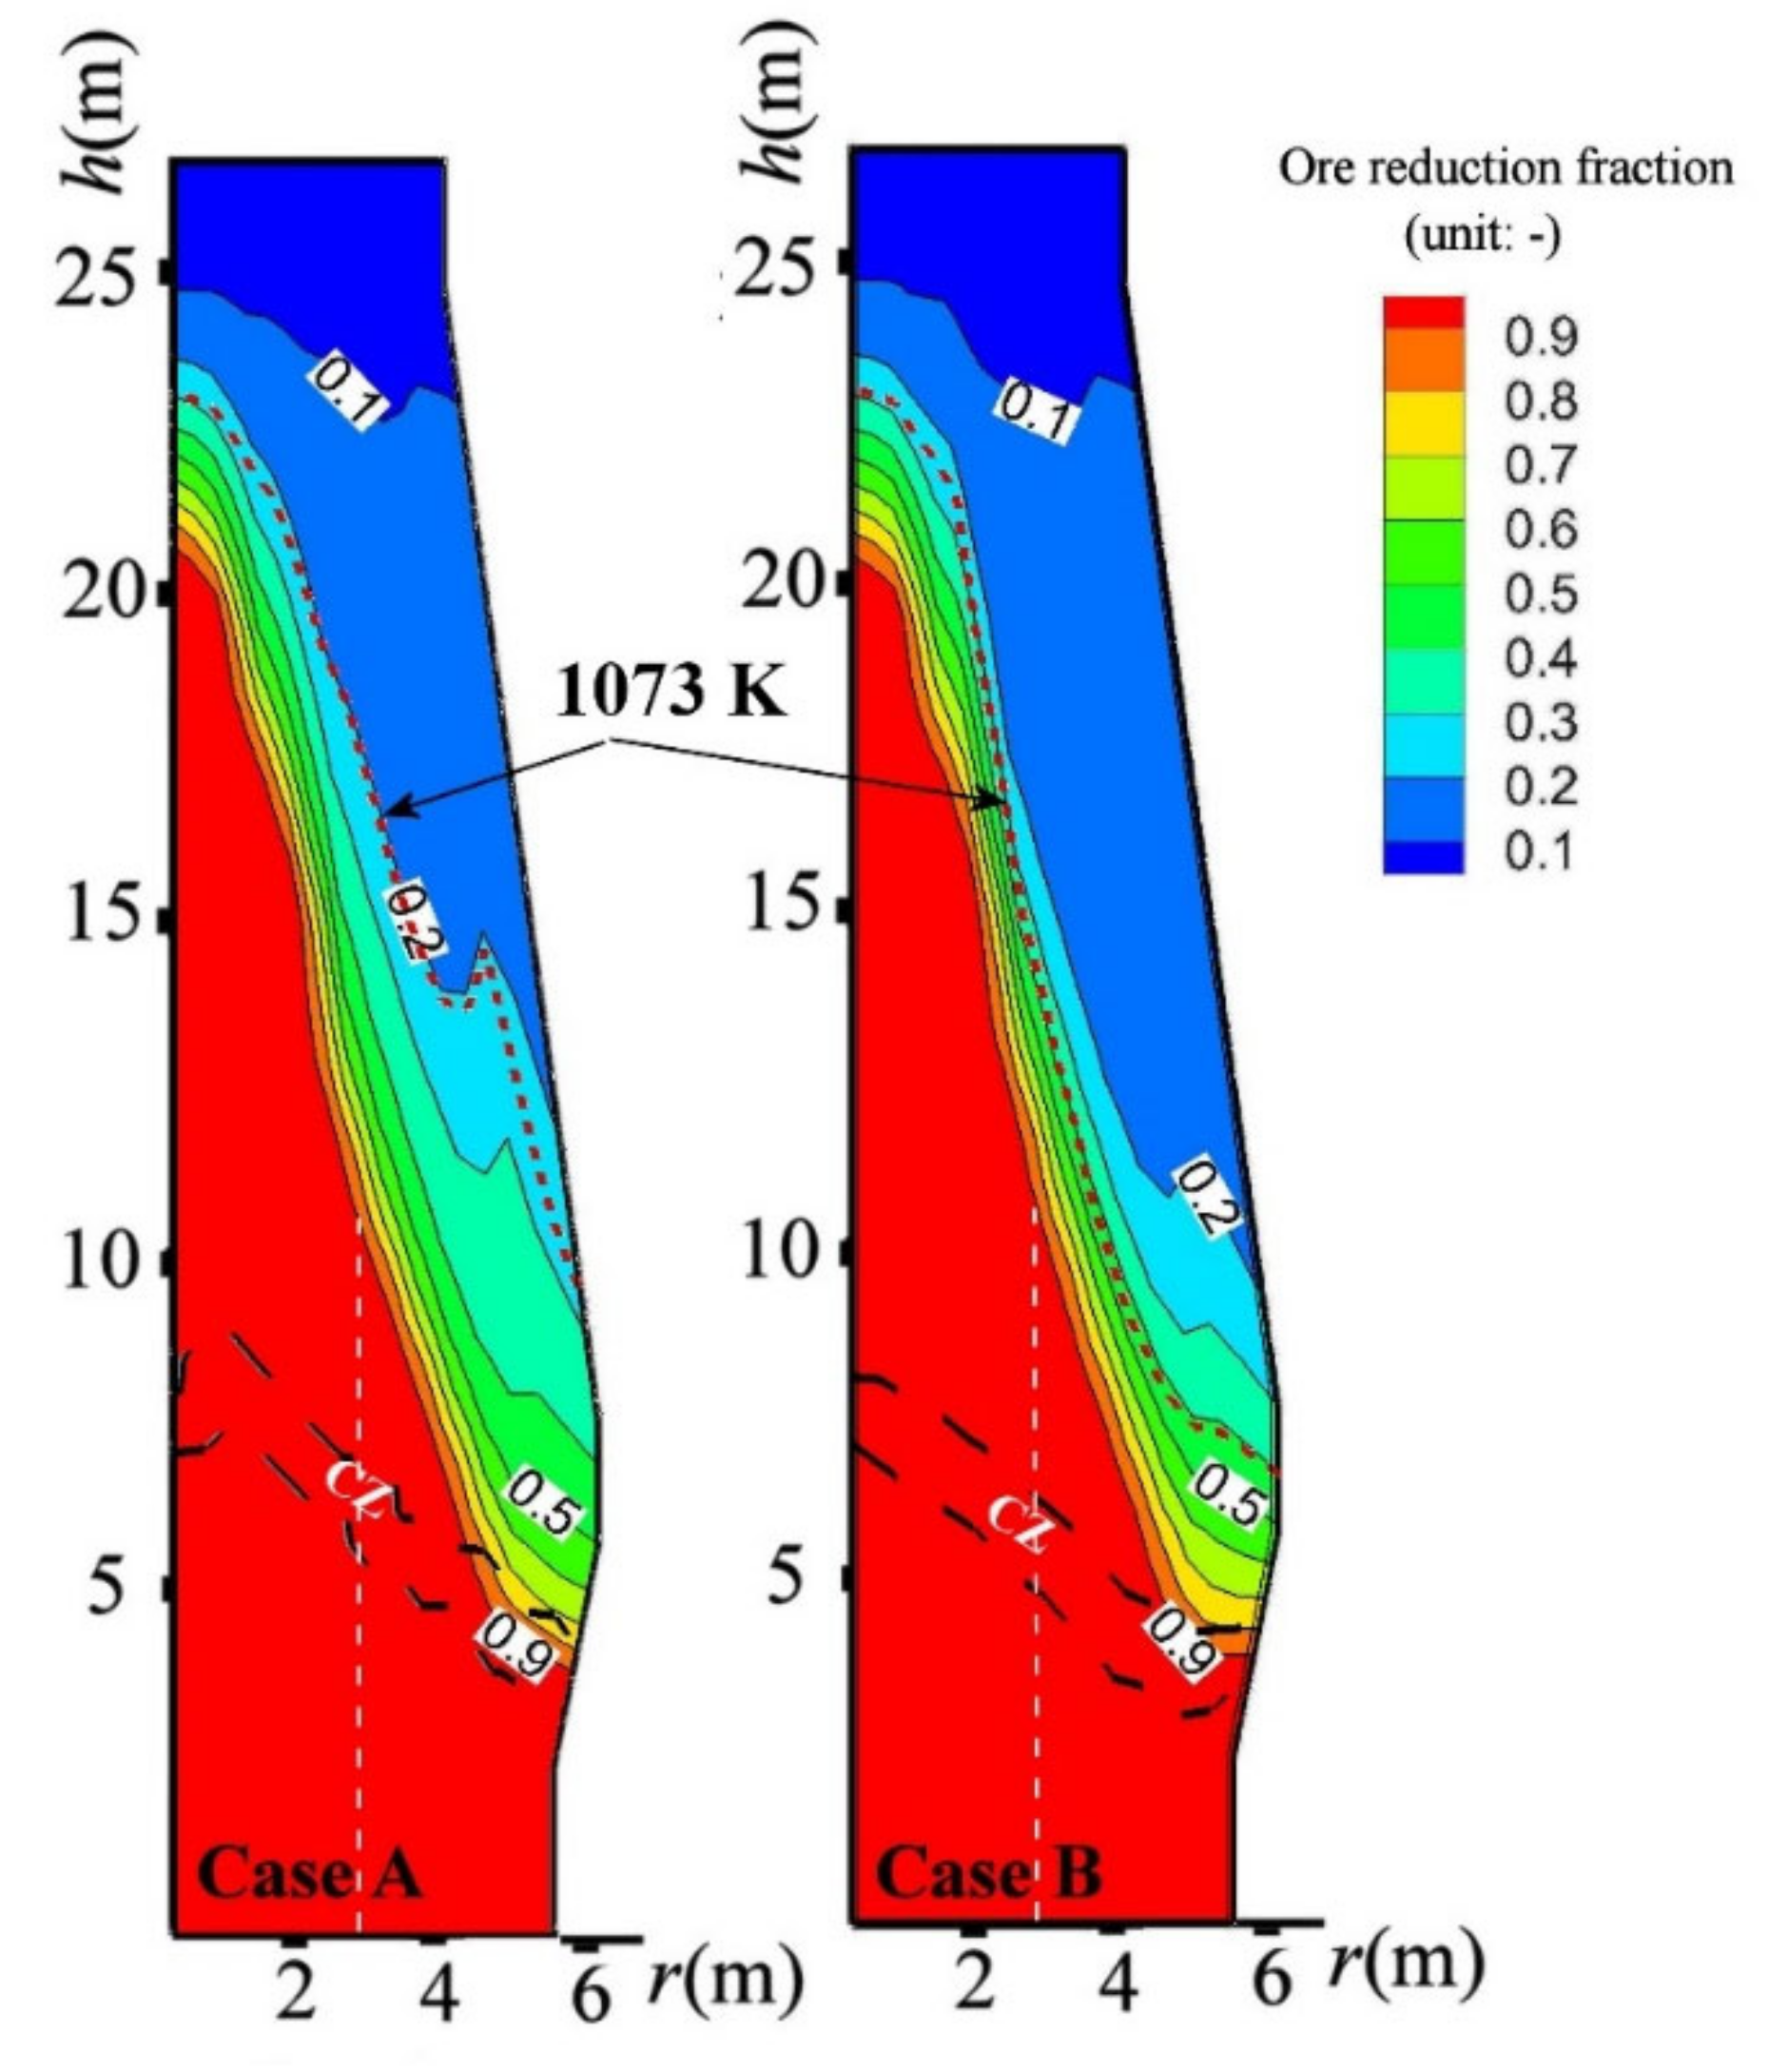
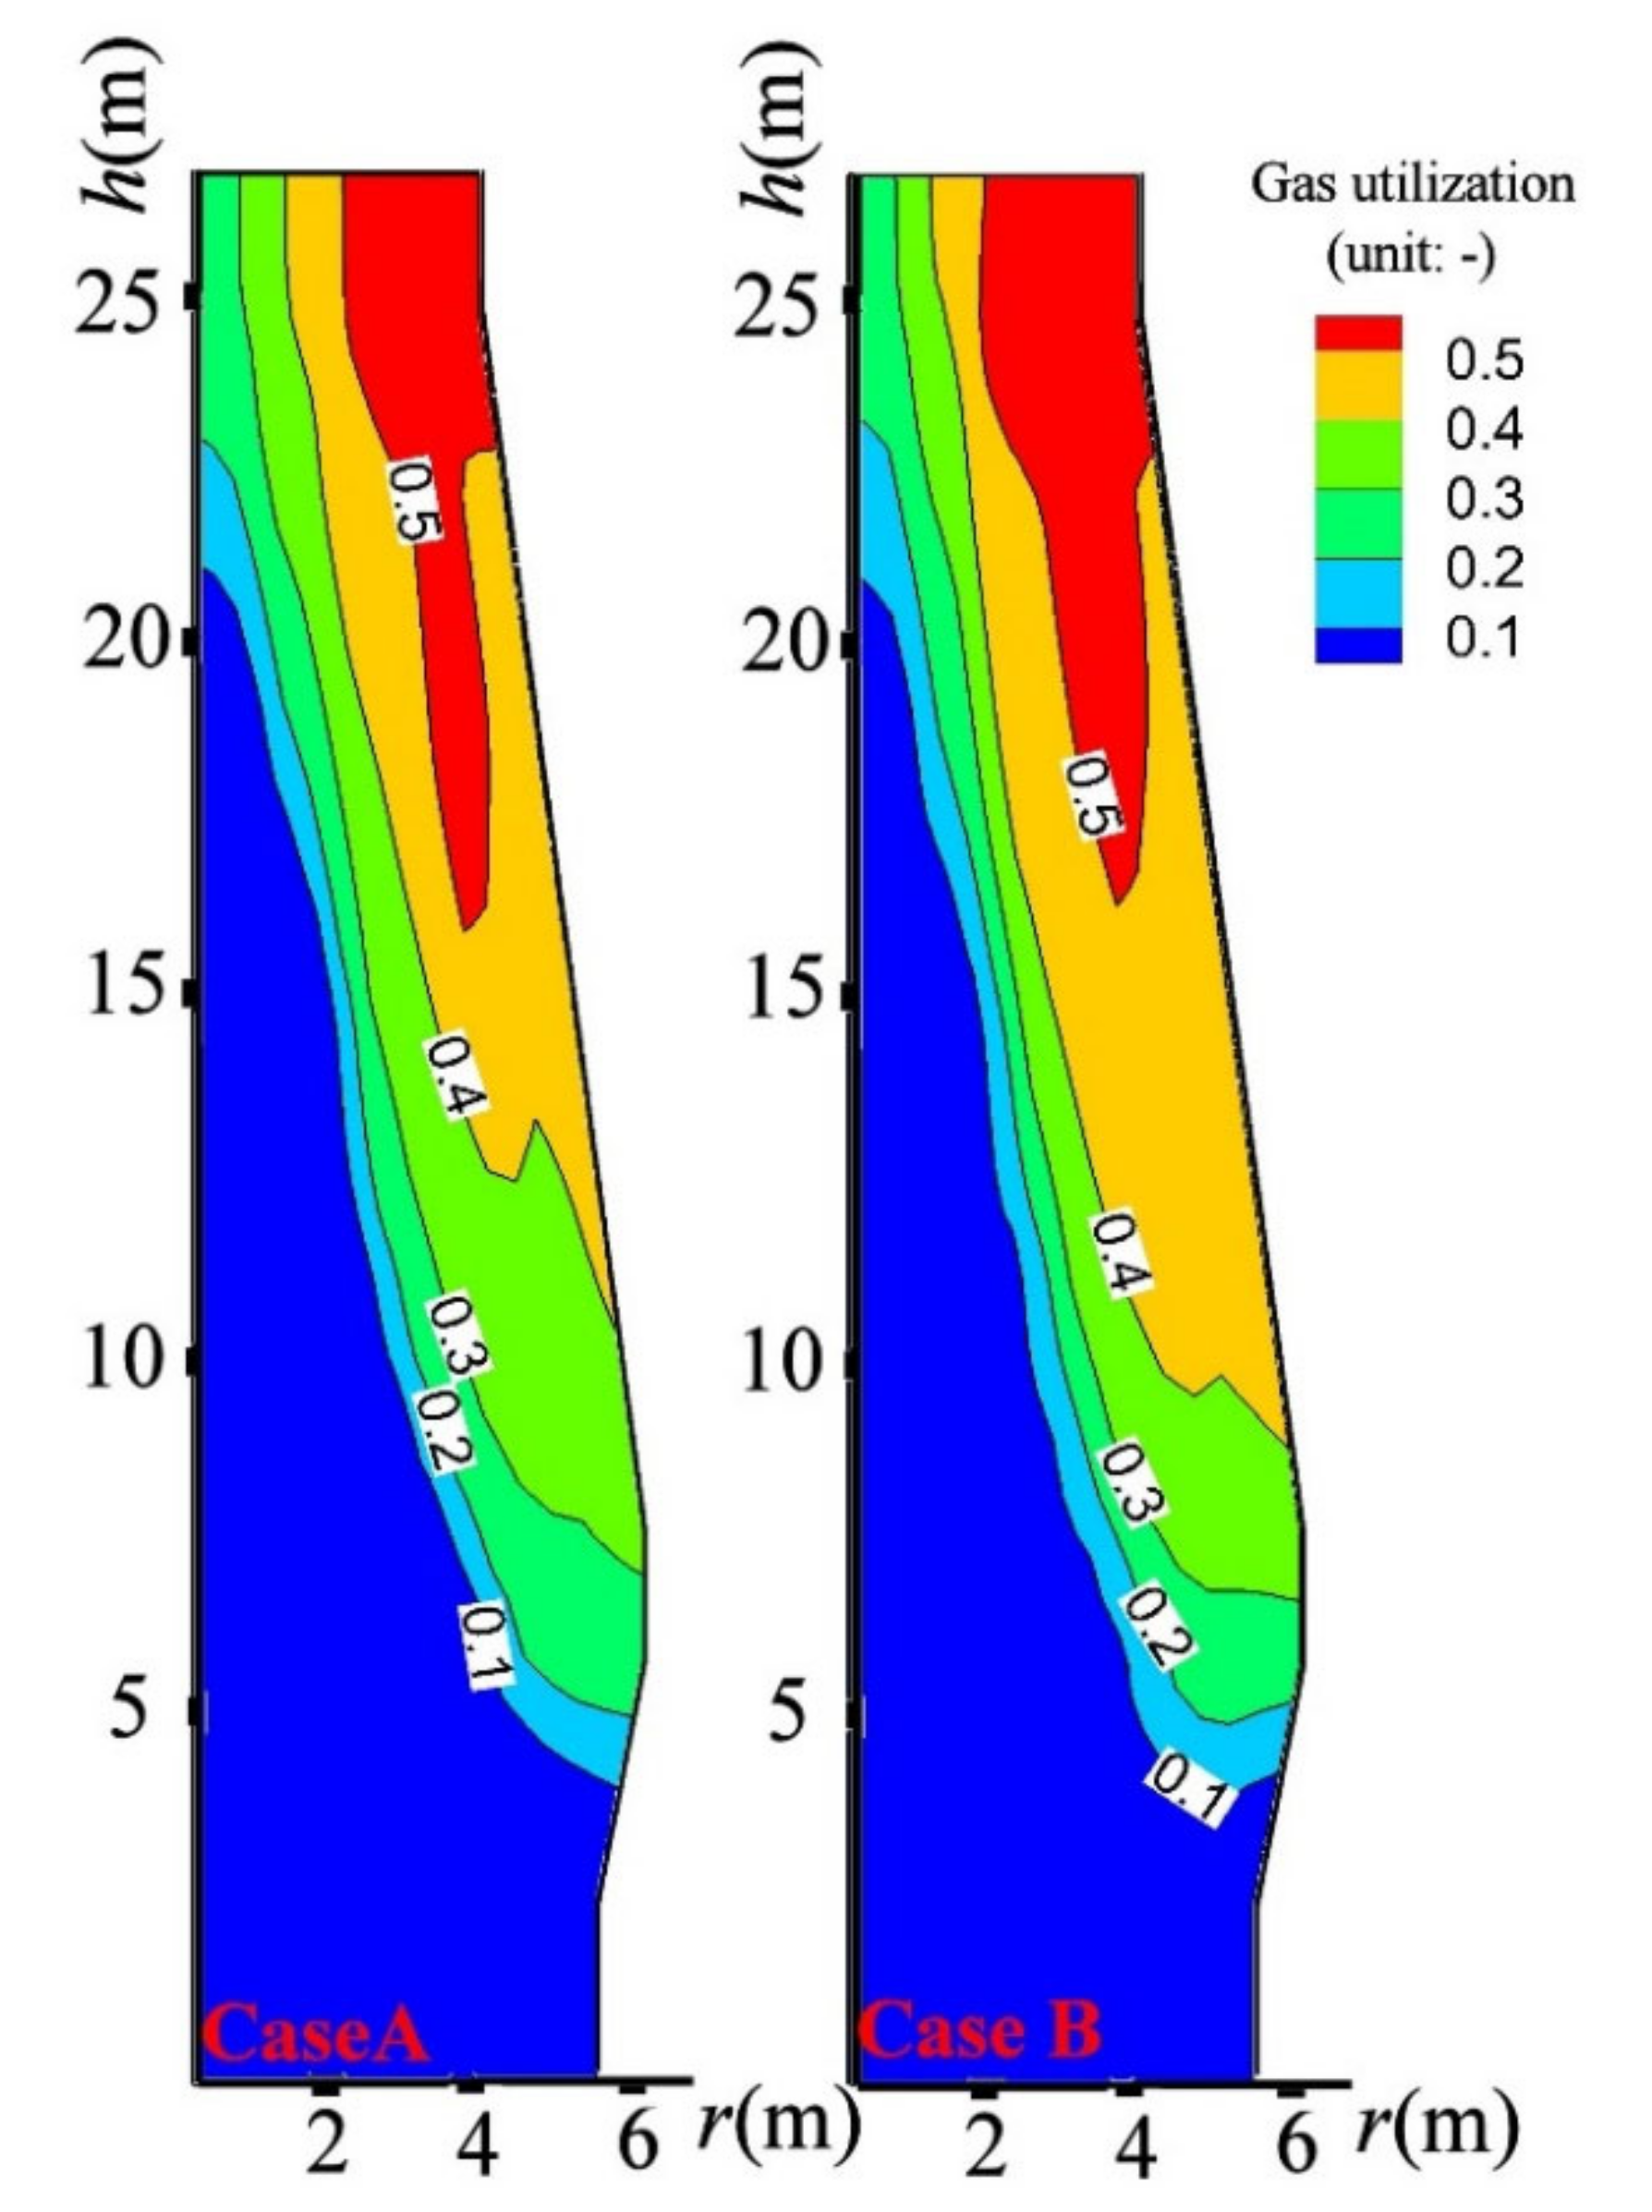
  • By charging CCB, the ore reduction was retarded before the temperature reached 1073 K and was prompted after; and the local gas utilization tended to increase above the CZ.
  • By the CCB reduction above the CZ, the BF top gas temperature was decreased by 8 K, the BF top gas utilization was increased by 1.3%, the BF productivity was decreased by 17 tHM/day, 101 kg sinter and 52.8 kg could be saved to produce one-ton hot metal. Considering the energy consumption of sintering and coking, charging the CCB could have a significant energy-saving and CO2-emission-reducing effect for BF iron making.

Author Contributions

Conceptualization, H.T.; methodology, H.T.; software, H.T.; validation, Q.W. and Z.L.; formal analysis, Q.W. and Z.L.; investigation, Q.W.; writing—original draft preparation, Q.W.; writing—review and editing, H.T.; visualization, Z.L.; supervision, Z.G. All authors have read and agreed to the published version of the manuscript.

Funding

This research was funded by the National Natural Science Foundation of China, grant number U1960205.

Institutional Review Board Statement

Not applicable.

Informed Consent Statement

Not applicable.

Data Availability Statement

Not applicable.

Acknowledgments

The authors thank the National Natural Science Foundation of China and the State Key Laboratory of Advanced Metallurgy USTB for the financial support for this work.

Conflicts of Interest

The authors declare no conflict of interest.

Nomenclature

agsspecific surface of iron-oxide particles in CCB, (m2·m−3)
Cpheat capacity, (J·kg−1·K−1)
ddiameter of CCB, (m)
D, Deffgas diffusivity, effective gas diffusivity, (m2·s−1)
Eenthalpy source, (J·m−3·s−1))
fireduction fraction or carbon conversion of reaction i in Table 5, (-)
Htotal enthalpy (J·kg−1)
ΔHireaction heat of reaction i in Table 2, (J·kmol−1)
kireaction rate constant of reaction i in Table 5, (m·s−1, kg·s−1atm−1)
Kiequilibrium constant of reaction i in Table 5, (-)
mmass supply/consumption rate of the given element, (kg·s−1)
Mmolar weight, (kg·kmol−1)
Ppressure, (pa)
PrPrandtl number, (-)
Rgas constant, (8.314 J·mol−1·K−1)
ReReynolds number, (-)
Richemical reaction rate of reaction i in Table 2, (kmol·m−3⋅s−1)
rradial direction, (m)
richemical reaction rate of reaction i in Table 5, (mol·m−3⋅s−1)
Ssource, units vary
ScSchmidt number (-)
Ttemperature, (K)
ttime, (s)
Vcellcell volume, (m3)
ymass fraction, (-)
Greek letter
αCCB porosity, (-)
ϕ , φ general dependent variable
Γ general difusion coeffcient
ρdensity, (kg·m−3)
λ thermal conductivity, (W·m−1·K−1)
µfluid viscosity, (kg·m−1·s−1)
Vector
U g superficial gas velocity, (m·s−1)
V s solid physical velocity, (m·s−1)
F gs gas flow resistance, (N·m−3)
Subscript
0initial
CCB CCB variable
cokecoke variable
oreore variable
ggas variable
lliquid variable
ssolid variable
eenvironment variable
species or element namevariable of assigned species or element

References

  1. Wang, Y.; Zuo, H.; Zhao, J. Recent progress and development of ironmaking in China as of 2019: An overview. Ironmak. Steelmak. 2020, 47, 640–649. [Google Scholar] [CrossRef]
  2. Wang, Z.; Zhang, J.; Liu, Z.; Wang, G.; Yang, T. Status, technological progress, and development directions of the ironmaking industry in China. Ironmak. Steelmak. 2019, 46, 937–941. [Google Scholar] [CrossRef]
  3. Naito, M.a.K.; Takeda, K.; Matsui, Y. Ironmaking technology for the last 100 years: Deployment to advanced technologies from introduction of technological know-how, and Evolution to Next-generation Process. ISIJ Int. 2015, 55, 7–35. [Google Scholar] [CrossRef] [Green Version]
  4. An, R.; Yu, B.; Ru, L.; Wei, Y.M. Potential of energy savings and CO2 emission reduction in China’s iron and steel industry. Appl. Energy 2018, 226, 862–880. [Google Scholar] [CrossRef]
  5. Tan, X.; Li, H.; Guo, J.; Gu, B.; Zeng, Y. Energy-saving and emission-reduction technology selection and CO2 emission reduction potential of China’s iron and steel industry under energy substitution policy. J. Clean. Prod. 2019, 222, 823–834. [Google Scholar] [CrossRef]
  6. Ariyama, T.; Murai, R.; Ishii, J.; Sato, M. reduction of CO2 emissions from integrated steel works and its subjects for a future study. ISIJ Int. 2005, 45, 1371–1378. [Google Scholar] [CrossRef] [Green Version]
  7. Chowdhury, S.; Chakraborti, N.; Sen, P.K. Energy optimization studies for integrated steel plant employing diverse steel-making route: Models and evolutionary algorithm-based approach. Miner. Process. Extr. Metall. Rev. 2020, 42, 1–12. [Google Scholar] [CrossRef]
  8. Liu, Z.J.; Zhang, J.L.; Yang, T.J. Low Carbon Operation of Super-Large Blast Furnaces in China. ISIJ Int. 2015, 55, 1146–1156. [Google Scholar] [CrossRef] [Green Version]
  9. Ahmed, H. New trends in the application of carbon-bearing materials in blast furnace iron-making. Minerals 2018, 8, 561. [Google Scholar] [CrossRef] [Green Version]
  10. Sharma, T. Composite pre-reduced pellet (CPR)—A new way for fines utilisation. Miner. Process. Extr. Metall. Rev. 1993, 12, 115–124. [Google Scholar] [CrossRef]
  11. Ahmed, H.M.; Viswanathan, N.; Bjorkman, B. Composite pellets—A potential raw material for iron-making. Steel Res. Int. 2014, 85, 293–306. [Google Scholar] [CrossRef]
  12. Kasai, A.; Toyota, H.; Nozawa, K.; Kitayama, S. Reduction of reducing agent rate in blast furnace operation by carbon composite iron ore hot briquette. ISIJ Int. 2011, 51, 1333–1335. [Google Scholar] [CrossRef] [Green Version]
  13. Yokoyama, H.; Higuchi, K.; Ito, T.; Oshio, A. Decrease in carbon consumption of a commercial blast furnace by using carbon composite iron ore. Tetsu Hagane 2012, 100, 601–609. [Google Scholar] [CrossRef] [Green Version]
  14. Andersson, A.; Gullberg, A.; Kullerstedt, A.; Wedholm, A.; Wikstrm, J.; Ahmed, H.; Kvist, L.S. Recycling of blast furnace sludge to the blast furnace via cold-bonded briquettes: Evaluation of feasibility and influence on operation. ISIJ Int. 2019, 59, 1786–1795. [Google Scholar] [CrossRef]
  15. Nikai, I.; Garbers-Craig, A.M. Use of iron ore fines in cold-bonded self-reducing composite pellets. Miner. Process. Extr. Metall. Rev. 2016, 37, 42–48. [Google Scholar] [CrossRef] [Green Version]
  16. Ueda, S.; Yanagiya, K.; Watanabe, K.; Murakami, T.; Inoue, R.; Ariyama, T. Reaction model and reduction behavior of carbon iron ore composite in blast furnace. ISIJ Int. 2009, 49, 827–836. [Google Scholar]
  17. Mourao, M.B.; Cyro, T. Self-reducing pellets for ironmaking: Reaction rate and processing. Miner. Process. Extr. Metall. Rev. 2003, 24, 183–202. [Google Scholar] [CrossRef]
  18. Watanabe, K.; Ueda, S.; Inoue, R.; Ariyama, T. Enhancement of reactivity of carbon iron ore composite using redox reaction of iron oxide powder. ISIJ Int. 2010, 50, 524–530. [Google Scholar] [CrossRef] [Green Version]
  19. Kasai, A.; Matsui, Y. Lowering of thermal reserve zone temperature in blast furnace by adjoining carbonaceous material and iron ore. ISIJ Int. 2004, 44, 2073–2078. [Google Scholar] [CrossRef]
  20. Kawanari, M.; Matsumoto, A.; Ashida, R.; Miura, K. Enhancement of reduction rate of iron ore by utilizing iron ore/carbon composite consisting of fine iron ore particles and highly thermoplastic carbon material. ISIJ Int. 2011, 51, 1227–1233. [Google Scholar]
  21. Kemppainen, A.; Iljana, M.; Heikkinen, E.P.; Paananen, T.; Mattila, O.; Fabritius, T. Reduction behavior of cold-bonded briquettes under simulated blast furnace conditions. ISIJ Int. 2014, 54, 1539–1545. [Google Scholar] [CrossRef] [Green Version]
  22. Singh, M.; Björkman, B. Testing of cement-bonded briquettes under laboratory and blast furnace conditions Part 1—Effect of processing parameters. Ironmak. Steelmak. 2017, 34, 41–53. [Google Scholar] [CrossRef]
  23. Mochizuki, Y.; Nishio, M.; Tsubouchi, N.; Akiyama, T. Reduction behavior and crushing strength of carbon-containing pellet prepared from COG tar. Fuel Process. Technol. 2016, 142, 287–295. [Google Scholar] [CrossRef]
  24. Tang, H.; Liu, S.; Tao, R. Preparation of High-Carbon Metallic Briquette for Blast Furnace Application. ISIJ Int. 2019, 59, 12–20. [Google Scholar] [CrossRef] [Green Version]
  25. Tang, H.; Sun, Y.; Rong, T. Experimental and numerical investigation of reaction behavior of carbon composite briquette in blast furnace. Metals 2020, 10, 49. [Google Scholar] [CrossRef] [Green Version]
  26. Kuang, S.; Li, Z.; Yu, A. Review on modeling and simulation of blast furnace. Steel Res. Int. 2018, 89, 1700071. [Google Scholar] [CrossRef]
  27. Okosun, T.; Silaen, A.K.; Zhou, C.Q. Review on computational modeling and visualization of the ironmaking blast furnace at purdue university northwest. Steel Res. Int. 2019, 90, 1900046. [Google Scholar] [CrossRef]
  28. Sahai, Y. Computer/mathematical modeling in materials processing operations. Miner. Process. Extr. Metall. Rev. 1992, 9, 1–26. [Google Scholar] [CrossRef]
  29. Ueda, S.; Natsui, S.; Nogami, H.; Yagi, J.I.; Ariyama, T. Recent progress and future perspective on mathematical modeling of blast furnace. ISIJ Int. 2010, 50, 914–923. [Google Scholar] [CrossRef] [Green Version]
  30. Chu, M.; Nogami, H.; Yagi, J.I. Numerical analysis on charging carbon composite agglomerates into blast furnace. ISIJ Int. 2004, 44, 510–517. [Google Scholar] [CrossRef]
  31. Yu, X.; Shen, Y. Computational fluid dynamics study of the flow and thermochemical behaviors of a carbon composite briquette in an ironmaking blast furnace. Energy Fuels 2019, 33, 11603–11616. [Google Scholar] [CrossRef]
  32. Tankg, H.; Rong, T.; Fan, K. Numerical investigation of applying high-carbon metallic briquette in blast furnace ironmaking. ISIJ Int. 2019, 59, 810–819. [Google Scholar] [CrossRef] [Green Version]
  33. Kuang, S.B.; Li, Z.Y.; Yan, D.L.; Qi, Y.H.; Yu, A.B. Numerical study of hot charge operation in ironmaking blast furnace. Miner. Eng. 2014, 63, 45–56. [Google Scholar] [CrossRef]
  34. Tang, H.; Sun, Y.; Rong, T.; Guo, Z. Reaction model and reaction behavior of carbon composite briquette in blast furnace. Powder Technol. 2021, 377, 832–842. [Google Scholar] [CrossRef]
  35. Cham. PHOENICS User Document; CHAM Ltd.: London, UK, 2000. [Google Scholar]
  36. Tanaka, Y.; Ueno, T.; Okumura, K.; Hayashi, S. Reaction behavior of coal rich composite iron ore hot briquettes under load at high temperatures until 1400 °C. ISIJ Int. 2011, 51, 1240–1246. [Google Scholar] [CrossRef]
  37. Gavel, D.J. A review on nut coke utilization in the ironmaking blast furnaces. Mater. Sci. Technol. 2017, 33, 381–387. [Google Scholar] [CrossRef]
Figure 1. Mesh placement for numerical simulation.
Metals 11 01669 g001
Figure 2. Illustration of Lagrangian method in model: (a) solid-flow stream line in BF (blast furnace), and (b) illustration of CCB in solid burden.
Metals 11 01669 g002
Figure 3. Determination of CCB model parameter of ags: (a) experimental data points for fitting, and (b) comparison between model prediction curve and experimental curve under different heating rates.
Metals 11 01669 g003
Figure 4. Reaction behavior of CCB in case B: (a). profile of CCB iron-oxide reduction fraction, (b). profile of CCB carbon conversion.
Metals 11 01669 g004
Figure 5. Reaction behavior of a single CCB: (a) illustration of the mid-radius solid flowing path, (b) changes of iron-oxide reduction fraction and carbon conversion in CCB along the path, and (c) changes of CO potential in CCB along the path.
Metals 11 01669 g005
Figure 6. Profiles of solid temperature in cases A and B.
Metals 11 01669 g006
Figure 7. Profiles of gas temperature in cases A and B.
Metals 11 01669 g007
Figure 8. Profiles of ore reduction fraction in cases A and B.
Metals 11 01669 g008
Figure 9. Profiles of CO volume fraction in cases A and B.
Metals 11 01669 g009
Figure 10. Profiles of CO2 volume fraction in cases A and B.
Metals 11 01669 g010
Figure 11. Profiles of local gas utilization in cases A and B.
Metals 11 01669 g011
Table 1. Mineralogical composition of CCB: (wt %).
CarbonFe3O4FeOMetallic IronGangue
20.3029.7039.701.578.73
Table 2. BF operation data.
VariableValue
Productivity (tHM·day−1)6250
Blast temperature (K)1523
Blast rate (Nm3·min−1)4800
Oxygen enrichment (mol%)4.0
Top absolute pressure (Pa)2.8 × 10⁵
PC injection rate (kg·tHM−1)180
Ore rate (kg·tHM−1)1680
Coke rate (kg·tHM−1)335
Batch weight of ore (ton)76
Batch weight of coke (ton)15
Solid inlet temperature (K)300
Ore particle propertyComposition: TFe: 55.8 wt.%, FeO: 6.8 wt.%, CaO: 4.60, SiO2: 4.97 wt.%, Al2O3: 2.19 wt.%, TiO2: 2.0 wt.% Porosity: 0.35; Bulk density: 1750 kg/m3; Average particle size: 20 mm.
Coke particle propertyComposition: Fixed Carbon: 90 wt.%, and Ash: 10 wt.%; Porosity: 0.50; Bulk density: 500 kg/m3; Average particle size: 40 mm.
PC propertyComposition: C: 80.0 wt.%, H: 4.0 wt.%, O: 3.5 wt.%, N: 2.0 wt.%, and S: 0.32 wt.%; H2O: 4.0 wt.%, and Ash: 7.0 wt.%.
Liquid phase (molten iron and slag) property[%C]: 4.0 wt.%, Temperature: 1753 K, Average heat capacity: 1000 J/kg, and Slag rate: approximately 400 kg/tHM
tHM: ton hot metal, PC: pulverized coal.
Table 3. Equations involved in BF model.
ReactionReaction Rate
(kmol·m−3s−1)
Explanation
13Fe2O3 (ore, s) + CO(g) = 2Fe3O4(ore, s) + CO2(g)R1stepwise reduction of ore (sinter, pellet and lump ore) by CO
2Fe3O4 (ore, s) + CO(g)=3 FeO(ore, s) + CO2(g)R2
3FeO (ore, s) + CO(g) = Fe(ore, s) + CO2(g)R3
4C (coke) + CO2 (g) = 2CO (g)R4coke solution-loss reaction
5C (coke) + 1/2O2 (g) = CO (g)R5coke combustion
63Fe2O3 (CCB, s) + CO (g) = 2Fe3O4 (CCB, s) + CO2 (g)R6CCB reactions
7Fe3O4(CCB, s) + CO(g) = 3FeO(CCB, s) + CO2(g)R7
8FeO (CCB, s) + CO (g) = Fe (CCB, s) + CO2 (g)R8
9C (CCB) + CO2 (g) = 2CO (g)R9
10Fe (ore,s) = Fe (l)R10melting reactions of ore
11FeO (ore,s) = FeO (l)R11
12Gangue (ore,s) = Slag (l)R12
13Fe (CCB,s) = Fe (l)R13melting reactions of CCB
14FeO (CCB,s) = FeO (l)R14
15Gangue (CCB,s) = Slag (l)R15
16FeO (l) + C (s) = Fe (l) + CO (g)R16direct reduction of molten FeO
Table 4. Dependent variables and sources in Equation (5).
Equation ϕ S ϕ
Mass1 M O i = 1 3 R i + M O i = 6 8 R i + M C ( R 4 + R 9 ) + M C R 5 + M CO R 16
Momentum U g P g F gs
Energy H g 0.5 i = 1 9 R i , ( Δ H i ) E gs E gl + E add
Species y O 2 M O 2 0.5 R 5
y CO M CO R 1 R 2 R 3 + 2 R 4 + R 5 R 6 R 7 R 8 + 2 R 9 + R 16
y CO 2 M CO 2 R 1 + R 2 + R 3 R 4 + R 6 + R 7 + R 8 R 9
y N 2 0
Table 5. Dependent variables and sources in Equation (6).
Equation φ Γ φ S φ
Continuity10 ( M O i = 1 3 R i + M O i = 6 8 R i ) ( M C R 9 ) M Fe ( R 10 + R 13 ) M FeO ( R 11 + R 14 ) M gangue ( R 12 + R 15 )
Momentum V s μ s , eff P s
Energy H s λ s , eff / C p s 0.5 i = 1 9 ( R i , ( Δ H i ) ) + i = 10 16 ( R i , ( Δ H i ) ) + E gs
Species y Coke , C 00
y ore , Fe 2 O 3 0 M Fe 2 O 3 3 R 1
y ore , Fe 3 O 4 0 M Fe 3 O 4 2 R 1 R 2
y ore , FeO   0 M FeO R 2 R 3 R 11
y ore , Fe 0 M Fe R 3 R 10
y CCB , C 0 M C R 9
y   CCB , Fe 2 O 3 0 M Fe 3 O 4 3 R 6
y CCB , Fe 3 O 4 0 M Fe 2 O 3 2 R 6 R 7
y CCB , FeO 0 M FeO ( R 7 R 8 R 14 )
y CCB , Fe 0 M Fe ( R 8 R 13 )
y CCB , gangue 0 M gangue ( R 15 )
Table 6. Equations in CCB model.
NoReactionReaction Rate/(mol·m−3·s−1)
13Fe2O3(fine, s) + CO(g) = 2Fe3O4(fine, s) + CO2(g) r i = ( P CO P CO 2 / K i ) / ( 8.314 T ) ( K i / ( k i ( 1 + K i ) ) ( 1 f i ) 2 / 3 ) a gs , (i = 1,2,3),
k 1 = exp ( 1.445 6038 / T ) , K 1 = exp ( 7 . 255 + 3720 / T )
k 2 = 1.70 exp ( 2 . 515 4811 / T ) , K 2 = exp ( 5 . 289 4711 / T )
k 3 = exp ( 0.805 7385 / T ) , K 3 = exp ( 2.946 + 2744.63 / T )
2Fe3O4(fine, s) + CO(g) = 3FeO(fine, s) + CO2(g)
3FeO(fine, s) + CO(g) = Fe(fine, s) + CO2(g)
4C(fine,s) + CO2(g) = 2CO(g) r 4 = ρ C , 0 k 4 1 f 4 2 / 3 ( P CO 2 / 1 . 01 × 10 5 ) / M C ,   k 4 = 1400 exp ( 138000 / R T )
Table 7. Gas and solid inlet conditions of cases A and B (1/30 BF volume).
ConditionVariableCase ACase B
Solid inlet conditionsOre supply rate (kg/s)4.053.64
CCB supply rate (kg/s)00.41
Coke supply rate (kg/s)0.81-
Solid temperature (K)300
Gas inlet
conditions
Gas supply rate (kg/s)3.88
Gas composition (mass fraction, -)CO: 20, O2:13, N2:67
Gas temperature (K)2350
Table 8. Simulation results of some BF indices.
IndexCase ACase B
Productivity (tHM·day−1)62506233
Top gas temperature (K)463455
Top gas utilization (%)51.352.6
Fuel rate (kg·tHM−1)PC: 180 Coke:335, CCB carbon: 0PC: 180.5, Coke:282.8,
CCB carbon gasified above CZ: 30


above
CZ:30.0
PC:180.5, and
CCB carbon gasified above CZ:30.0
Table 9. Distributions of coke consumption in cases A and B (kg/tHM).
ItemCase ACase B
Combustion175.0175.5
Carbon solution loss in upper BF56.842.5
Direct reduction of molten FeO in lower BF49.210.8
Carburization of molten iron45.045.0
Other reactions9.09.0
Total335.0282.8
Publisher’s Note: MDPI stays neutral with regard to jurisdictional claims in published maps and institutional affiliations.

