Article

Continuous Cooling Transformation of Under-Cooled Austenite of SXQ500/550DZ35 Hydropower Steel

1
School of Metallurgical and Ecological Engineering, University of Science and Technology Beijing, Beijing 100083, China
2
Nanyang Hanye Special Iron and Steel Co., Ltd., Nanyang 474500, China
*
Author to whom correspondence should be addressed.
Metals 2021, 11(10), 1562; https://doi.org/10.3390/met11101562
Submission received: 27 August 2021 / Revised: 25 September 2021 / Accepted: 25 September 2021 / Published: 29 September 2021

Abstract

:
The expansion curves of the continuous cooling transformation of undercooled austenite of SXQ500/550DZ35 hydropower steel at different heating temperatures and cooling rates were measured by use of a DIL805A dilatometer. Combined with metallography and Vickers hardness measurement, the continuous cooling transformation diagrams (CCT) of the studied steel under two different states were determined. The results show that in the first group of tests, after the hot-rolled specimens were austenitized at 920 °C, when the cooling rate was below 1 °C·s−1, the microstructure was composed of ferrite (F), pearlite (P) and bainite (B). With the cooling rates between 1 °C·s−1 and 5 °C·s−1, the microstructure was mainly bainite, and martensite (M) formed as the cooling rate reached 5 °C·s−1. When the cooling rate was up to 10 °C·s−1, the microstructure was completely martensite and the hardness value increased significantly. In the second group of tests, after the hot-rolled specimens were quenched at 920 °C and then heated at an intercritical temperature of 830 °C, in comparison with the first group of tests, and except for additional undissolved ferrites in each cooling rate range, the other microstructure types were basically the same. Due to the existence of undissolved ferrite, the microstructures of the specimens heated at intercritical temperatures were much finer, and the toughness values at low temperatures were better.

1. Introduction

SXQ500/550DZ35 hydropower steel plate is a kind of low-carbon, low-alloy, high-strength steel with quenched and tempered processes, which is usually designed to be used for the seat ring of hydropower equipment. The microstructure of this steel plate is designed to be low bainite, which requires high strength, good weldability, and high low-temperature toughness. Therefore, a suitable heat treatment process to produce high strength and toughness with ultra-thickness steel plates is needed [1,2]. At present, the traditional heat treatment process for ultra-thickness steel plate is still the quenching and tempering processes, which can obtain the required strength, but the obtained low temperature toughness is usually not high enough and cannot meet the user’s requirements [3,4,5,6].
In recent years, some researcher suggested a new type of heat treatment process with intercritical quenching and tempering [7,8,9,10,11]. The intercritical heat treatment process comprises hypoeutectoid steel with an equilibrium or non-equilibrium original microstructure being heated to intercritical temperature zone and held for some time, then quenched or isothermal hardened or normalized. The intercritical heat treatment process requires a definite original microstructure of steels, which is provided by a preparatory heat treatment process, such as a complete quenching or quenching and tempering process [12,13,14,15]. It was shown that the microstructure resulting from the intercritical process can be effectively refined with a few ferrite grains formed, resulting in a good match between the strength and toughness of steels, which is beneficial to industrial production. Therefore, this work intends to design the combination of a low-carbon bainite microstructure and intercritical annealing, which will adopt a ductile phase and refined microstructure to enhance the strength and toughness of steels.
A continuous cooling transformation diagram of the undercooled austenite of steels (CCT) can quite intuitively show the microstructure type, transformation time and transformed phase amount, which not only provides a theoretical basis for the suitable heat treatment process of steels, but also plays an important role in studies about the development of new grades of steels and new heat treatment processes.
Research and development of ultra-thickness steel plates SXQ500/550DZ35 have not yet been completed and few studies about phase transformation thermodynamics and kinetics have been reported so far. Therefore, this work will study the CCT diagrams of single-phase, under-cooled austenite and the intercritical zone, deciding the microstructure and properties of the experimental steels with different cooling rates, then providing suitable technology parameters for intercritical annealing of SXQ500/550DZ35 steels.

2. Materials and Methods

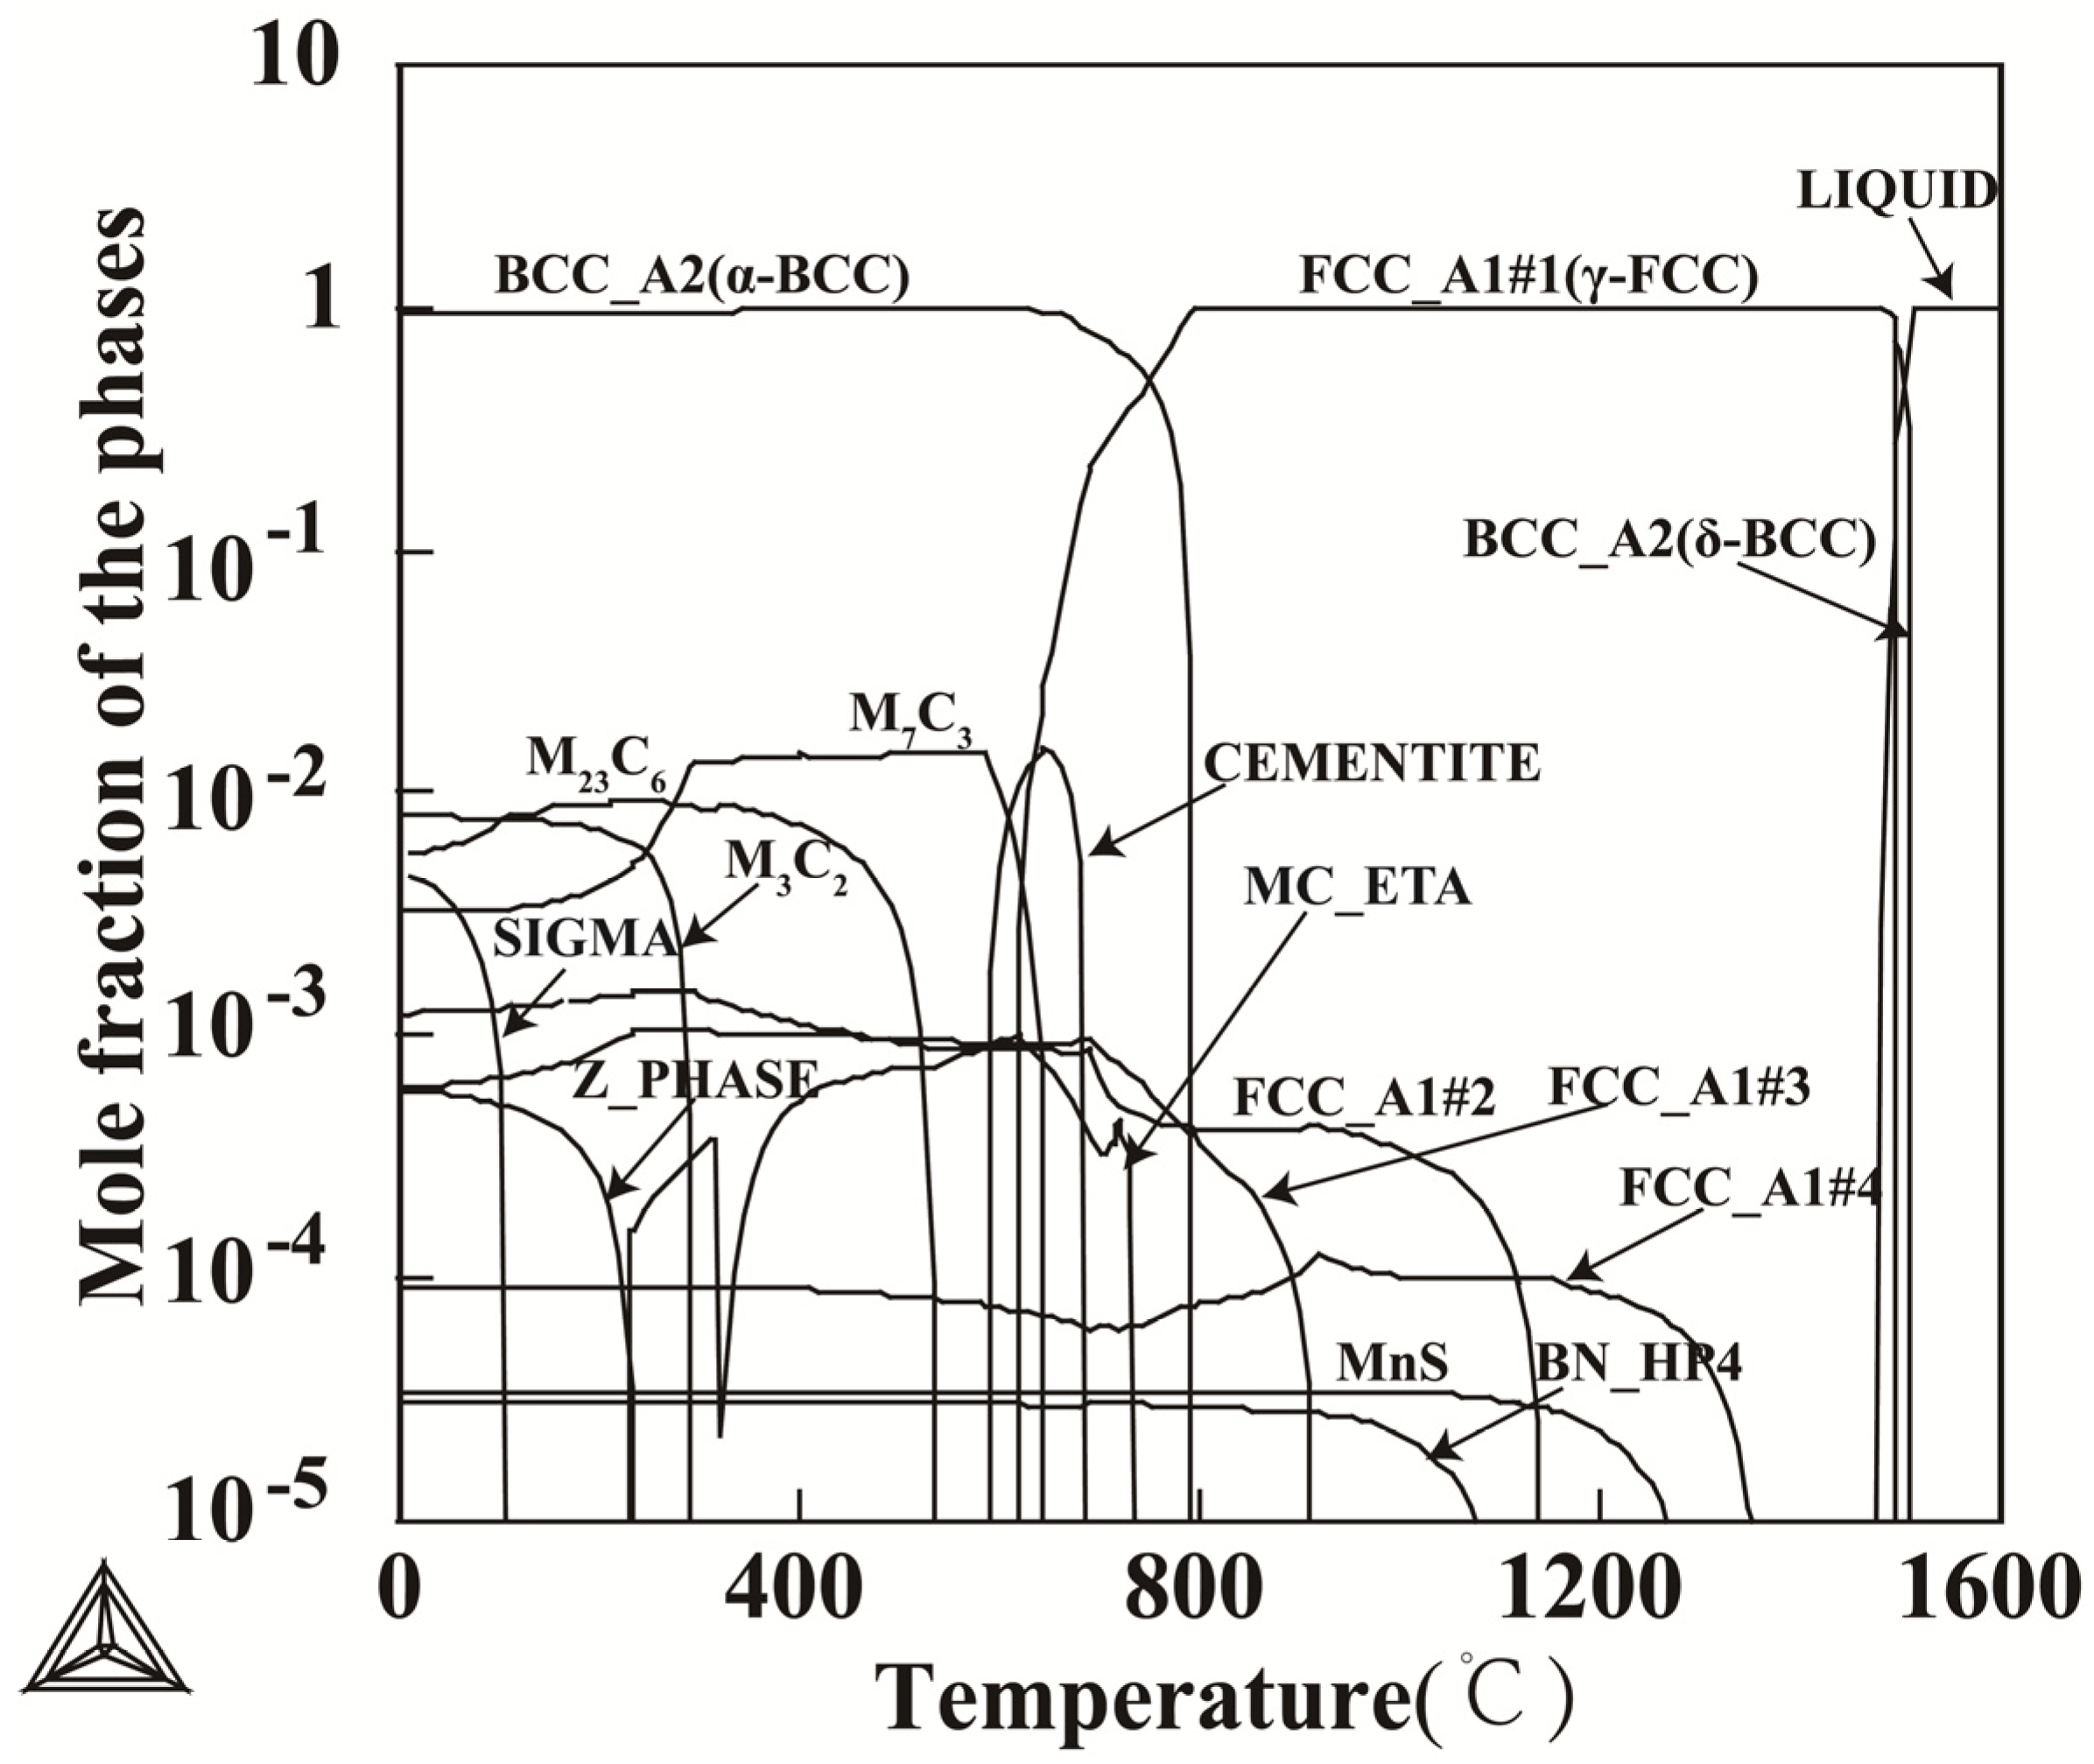
2.1. Experimental Material

The materials were obtained from a steel company that produced SXQ500/550DZ35 hot-rolled ultra-thickness steel plates, whose composition is shown in Table 1. The steel plate thickness is 260~300 mm.

2.2. Experimental Method

The experimental equipment was thermal dilatometer DIL805A.
The specific experimental procedures were as follows:
(1) Determination of austenization temperature.
Based on Thermo-Calc thermodynamic calculation software (2017b, Thermo-Calc Software, Stockholm, Sweden), the precipitate type, precipitation temperature and precipitate maximum amount at equilibrium for the experimental steel are determined and the solid solution rule of microalloying elements Nb, Ti, V in austenite are thermodynamically calculated [16]. Simultaneously, the grain sizes at different austenitizing temperatures are observed, and then the suitable austenitizing temperature are determined. The heat treatment process in this work is as in Figure 1.
(2) Determination of critical points.
Hot rolled specimens were heated to 400 °C at a rate of 10 °C·s−1, and then to 920 °C with a rate of 0.055 °C·s−1. After being held for 22 min, the specimens were cooled to room temperature with a rate of 0.055 °C·s−1, and the critical transition points Ac1 and Ac3 were measured during the heating process; the specific procedure is shown in Figure 2 [17,18].
According to the YB/T5127-1993 ‘measurement method for critical points of steels (thermal expansion method)’ [19], the thermal expansion method is used to measure the static critical points of steels. The specific method is that tangent method is used to take the separation point between the extension line of the linear part of the thermal expansion curve and the curve part as the critical point.
(3) The first group of specimens was heated to 920 °C with a rate of 10 °C·s−1 in thermal dilatometer DIL805A and after being held for 22 min, the specimens were cooled to room temperature with rates of 0.05, 0.1, 0.6, 1, 2, 3, 5, 10, 35, 50 °C·s−1, respectively, as shown in Figure 3a. The second group of specimens was heated to 920 °C and after being held for 22 min, the specimens were quenched; then, they were again heated to intercritical temperature 830 °C and after being held for 22 min, they were cooled to room temperature with rates of 0.05, 0.1, 0.6, 1, 2, 3, 5, 10, 35, 50 °C·s−1, respectively, as shown in Figure 3b.
(4) The specimens size required for this test was φ4 mm × 10 mm. After experiment on a thermal dilatometer, cut radially on the dilatometer, the two groups of specimens that had undergone different heat treatment processes were made to be metallographic specimens. After being ground, polished and etched 5 s with 4% nital, the microstructures of the specimens were observed with an optical microscope and scanning electron microscopy, and the hardness values of the microstructures for the specimens were measured with 430SH Vickers hardness tester (load was 0.5 kg).

3. Experimental Results and Discussion

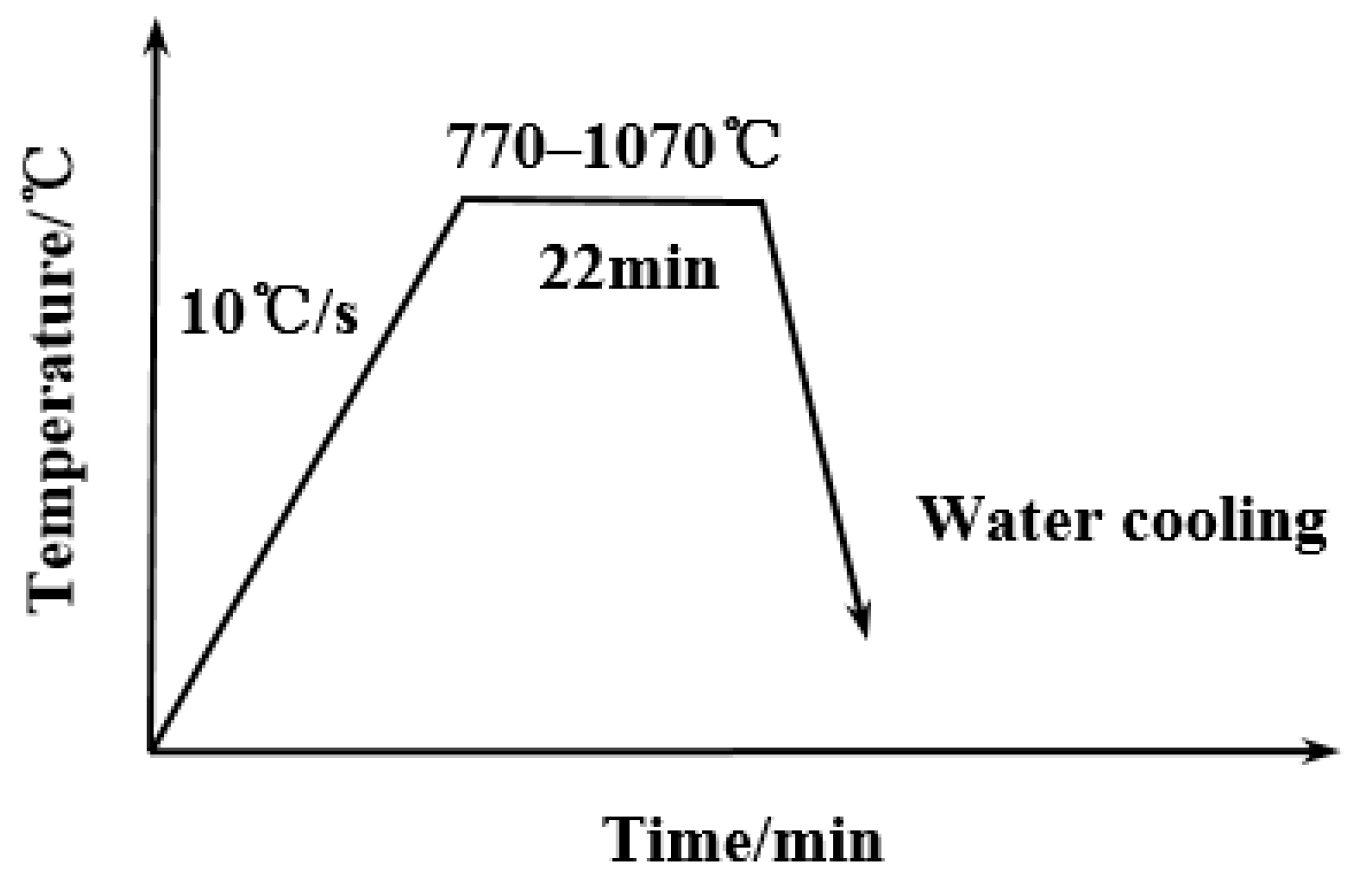
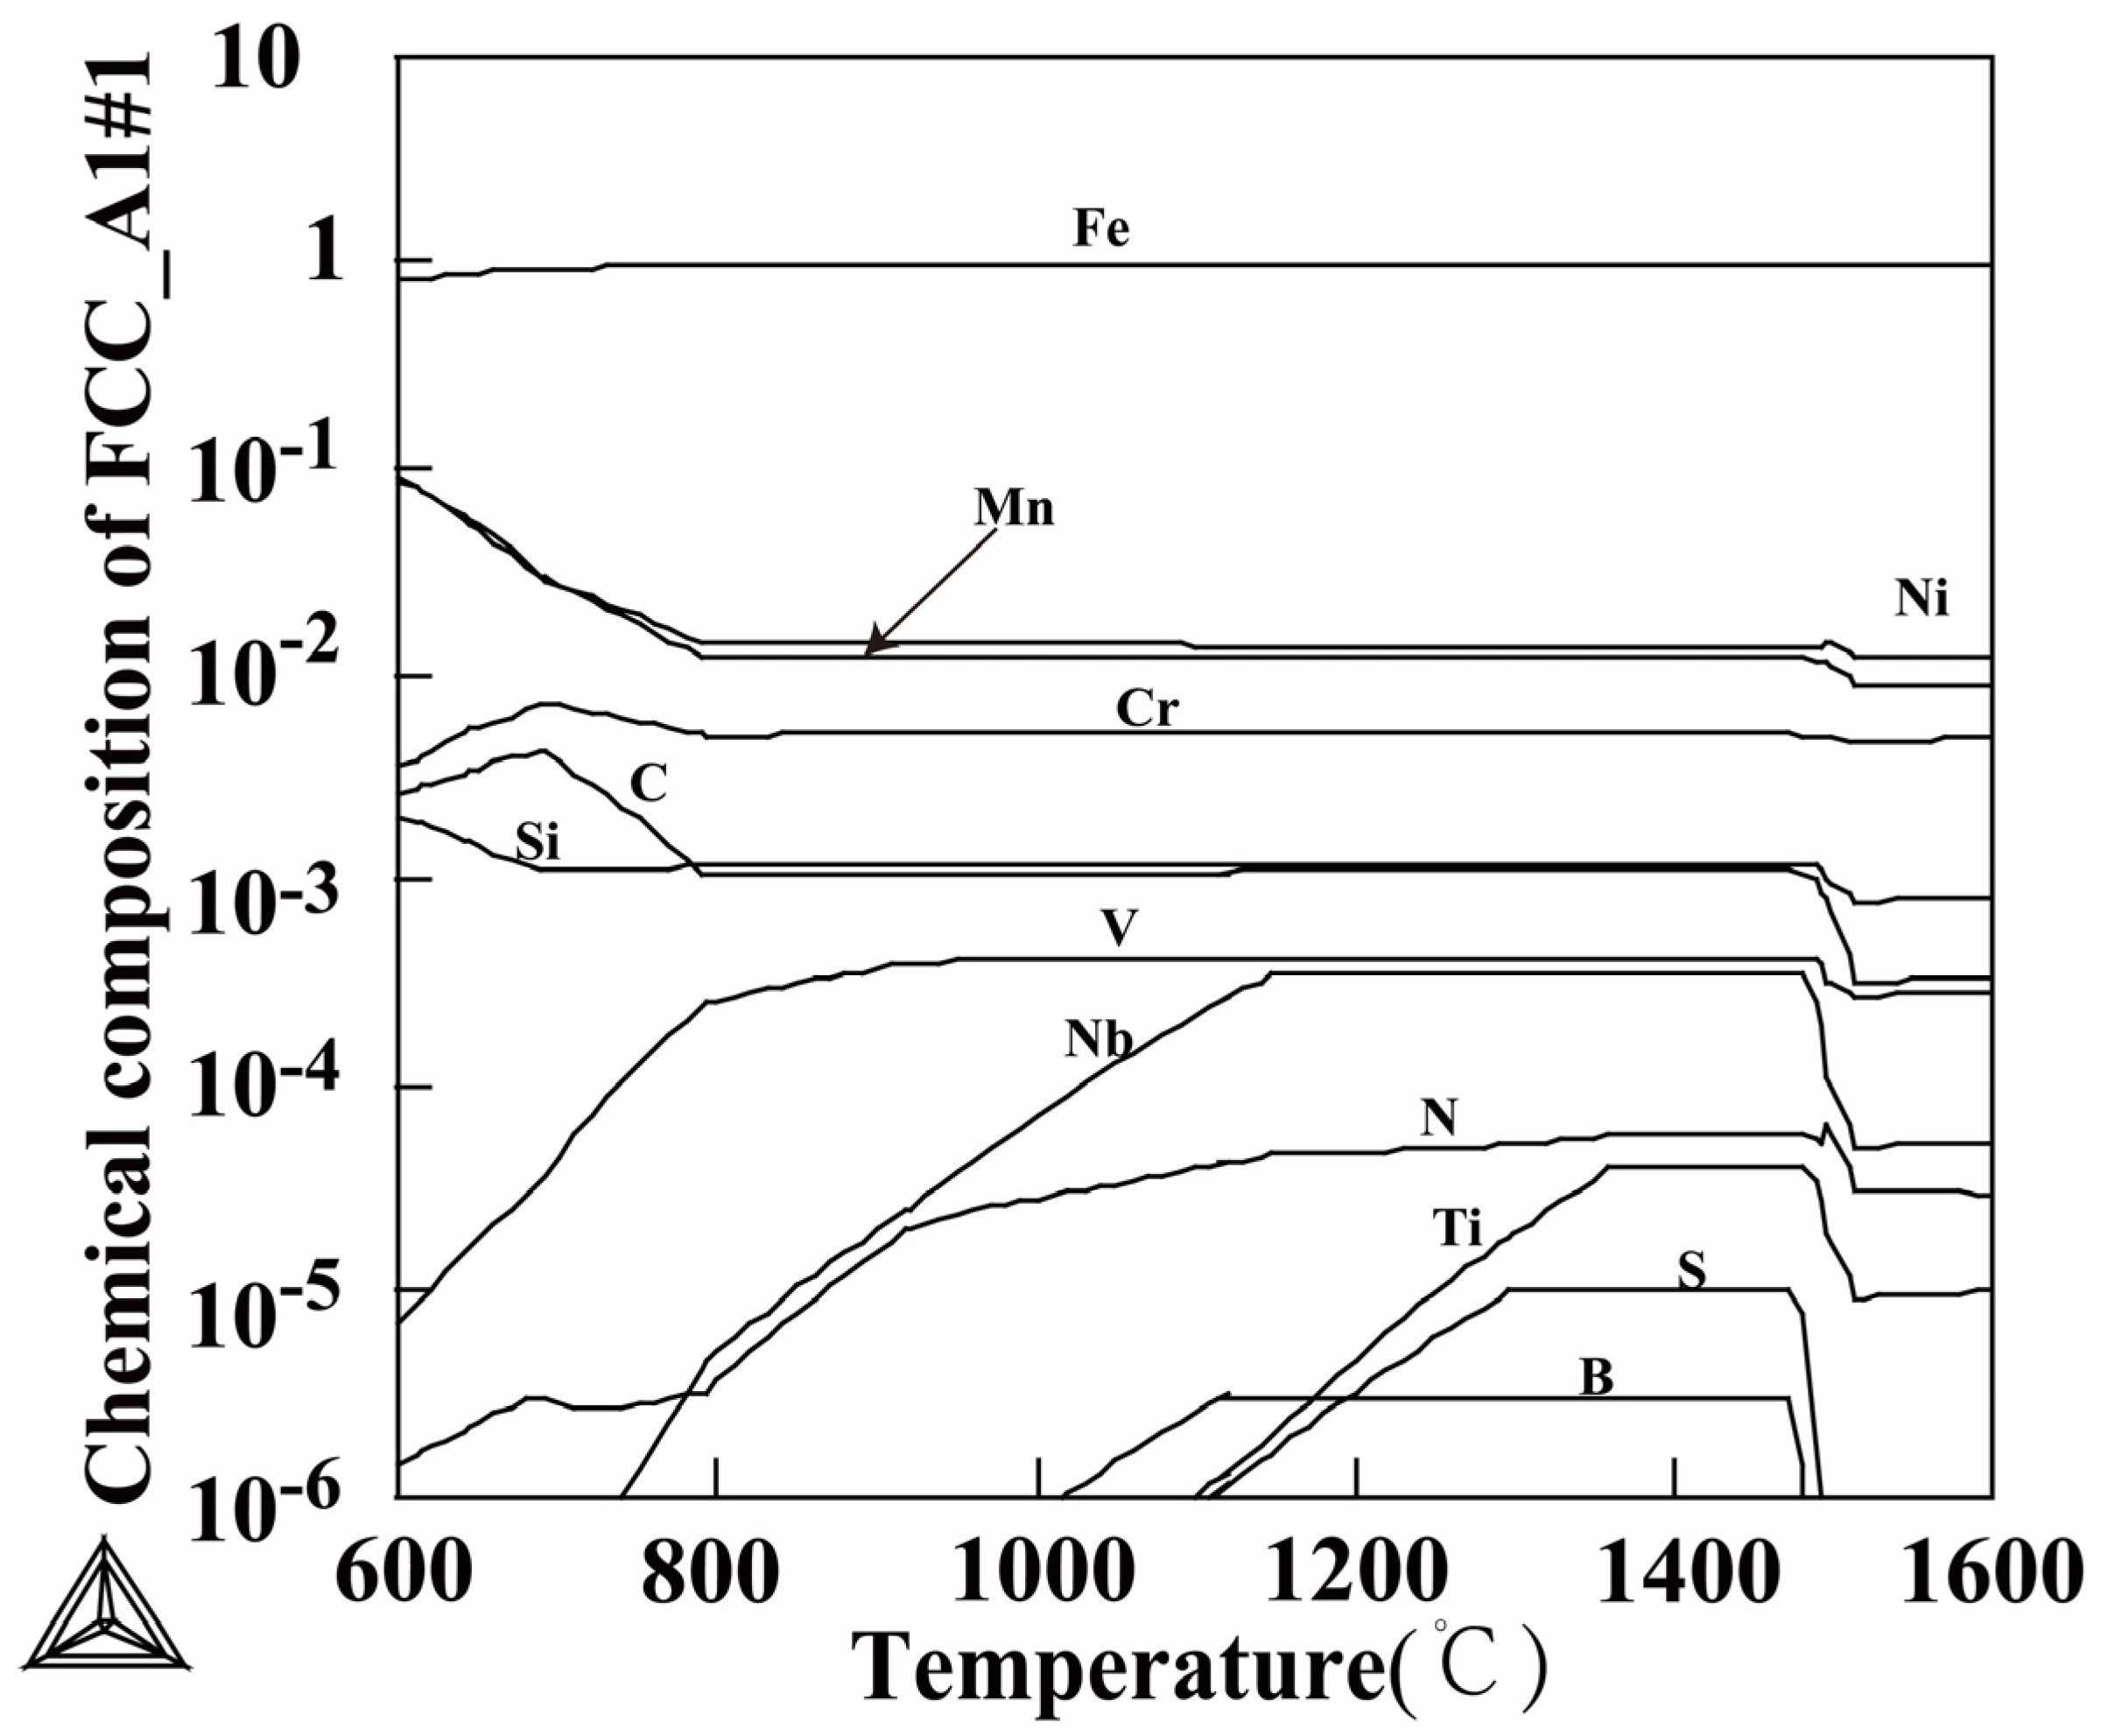
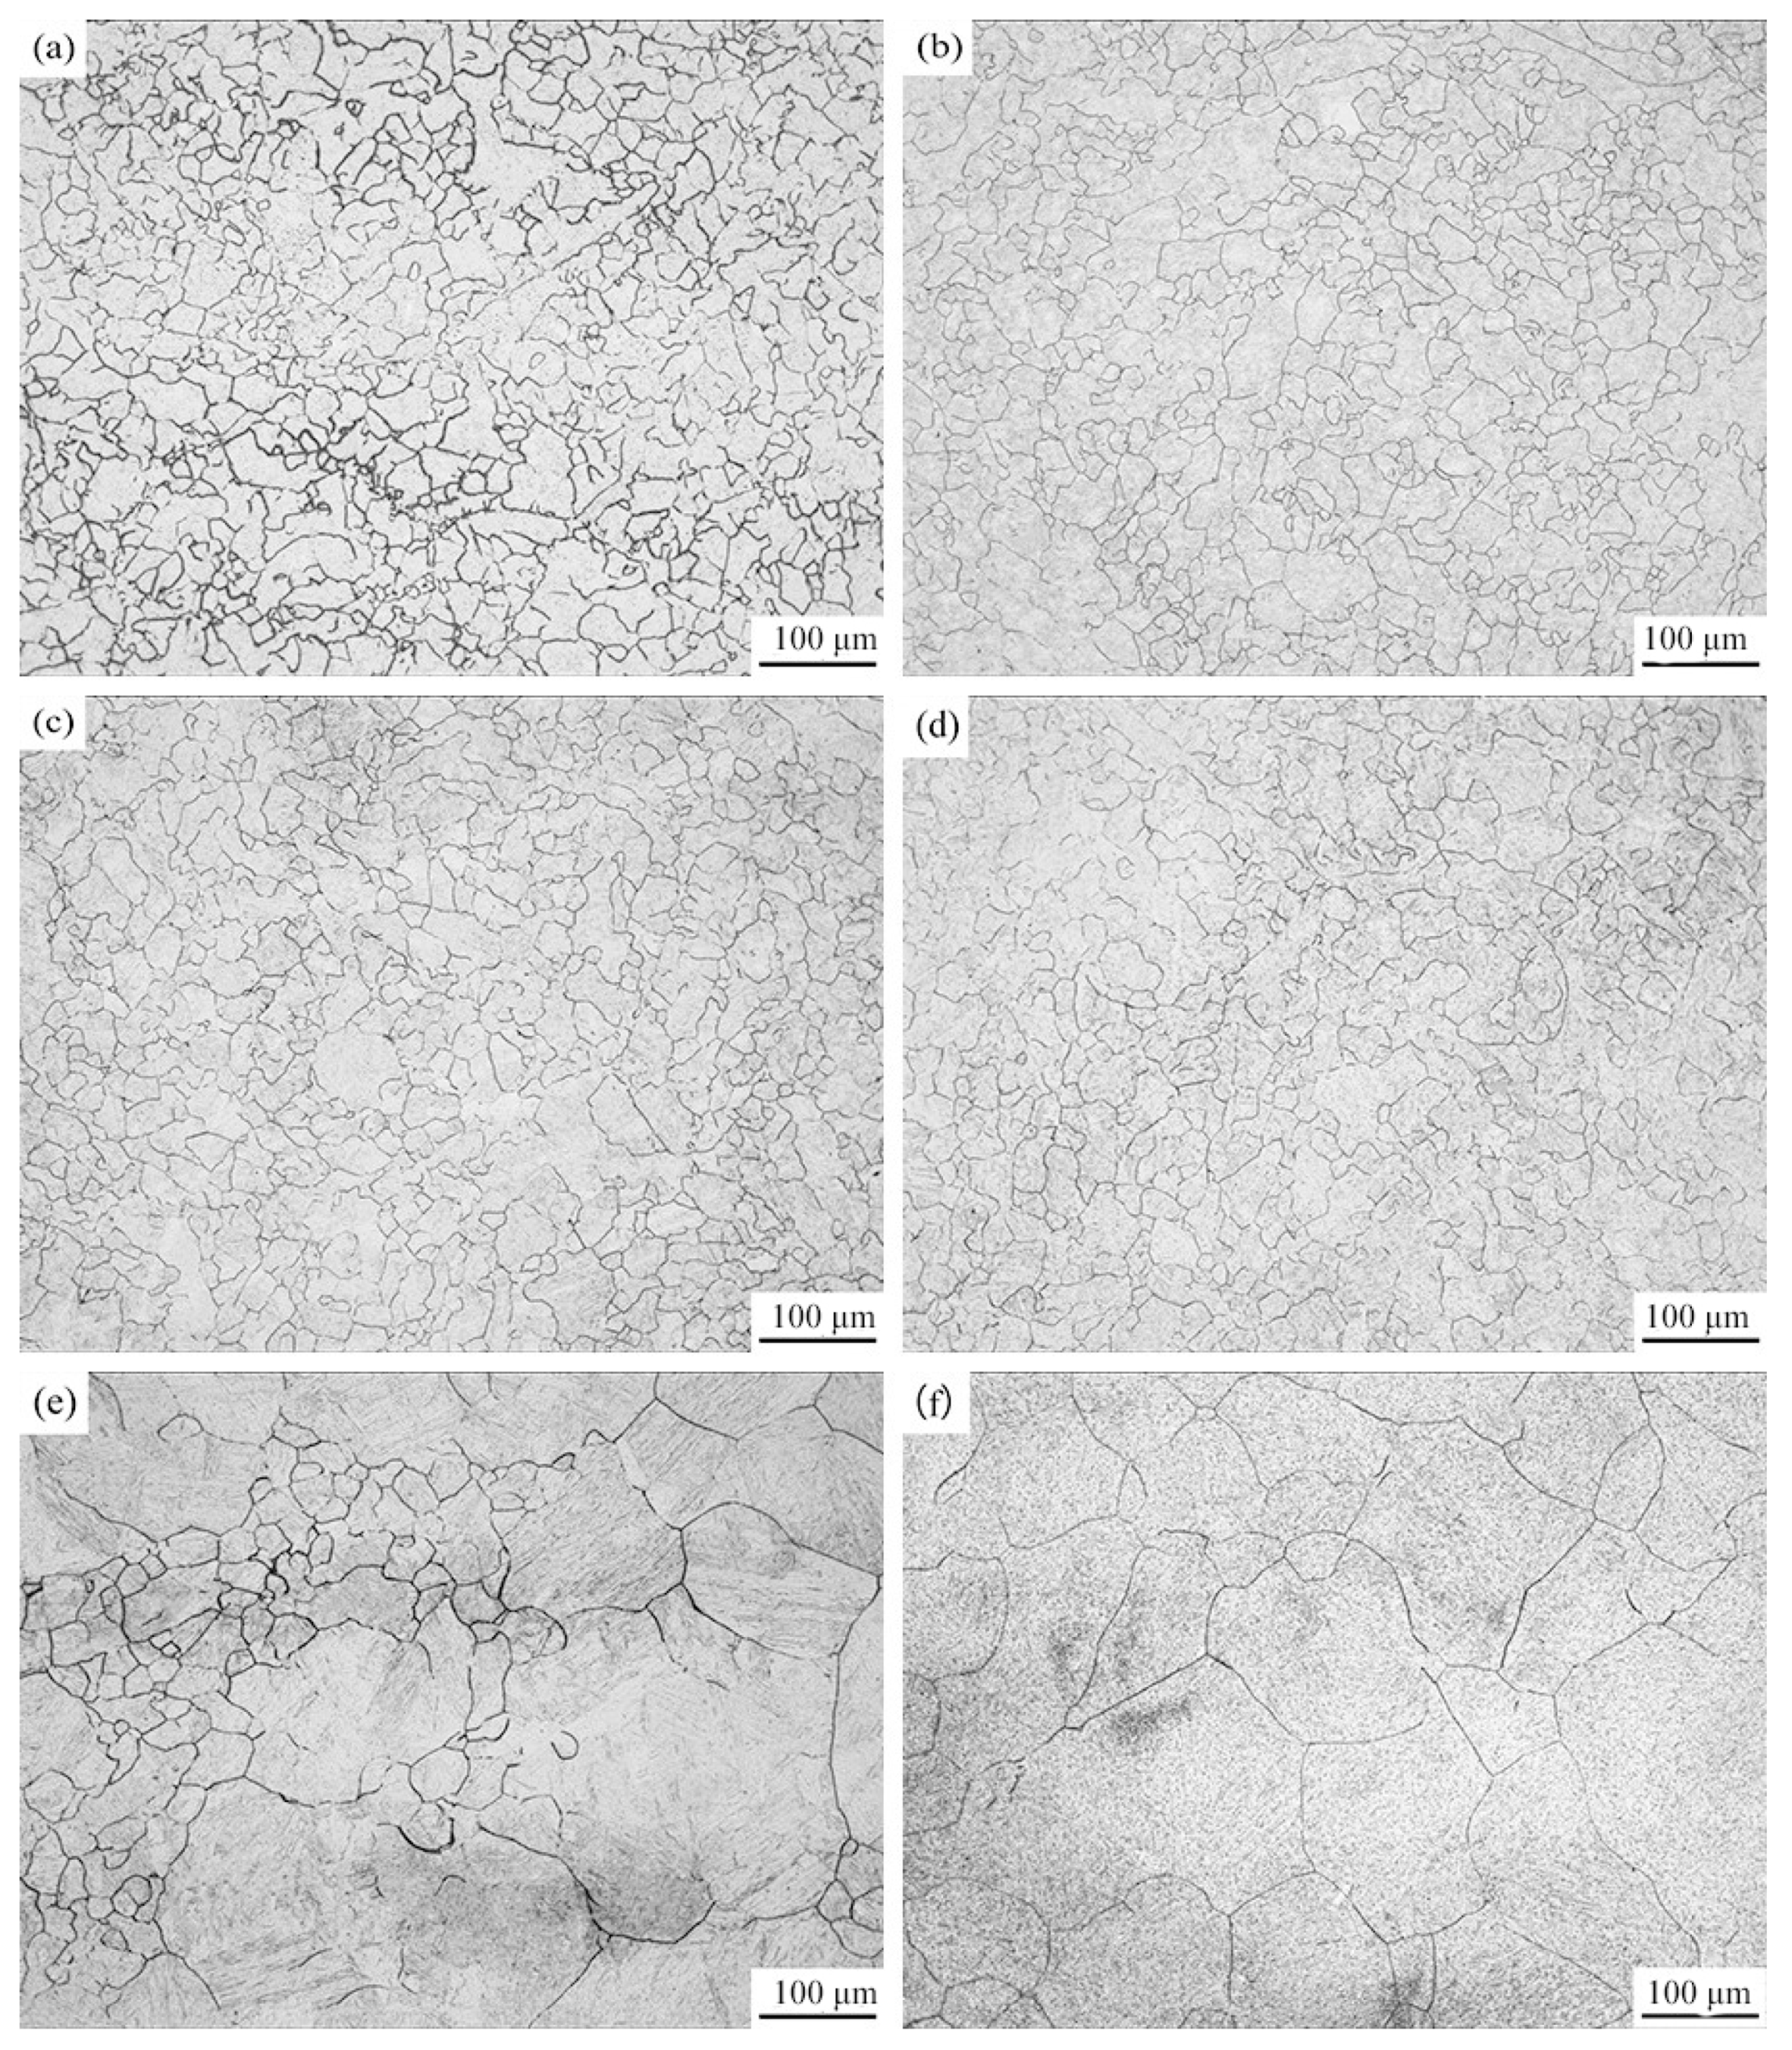
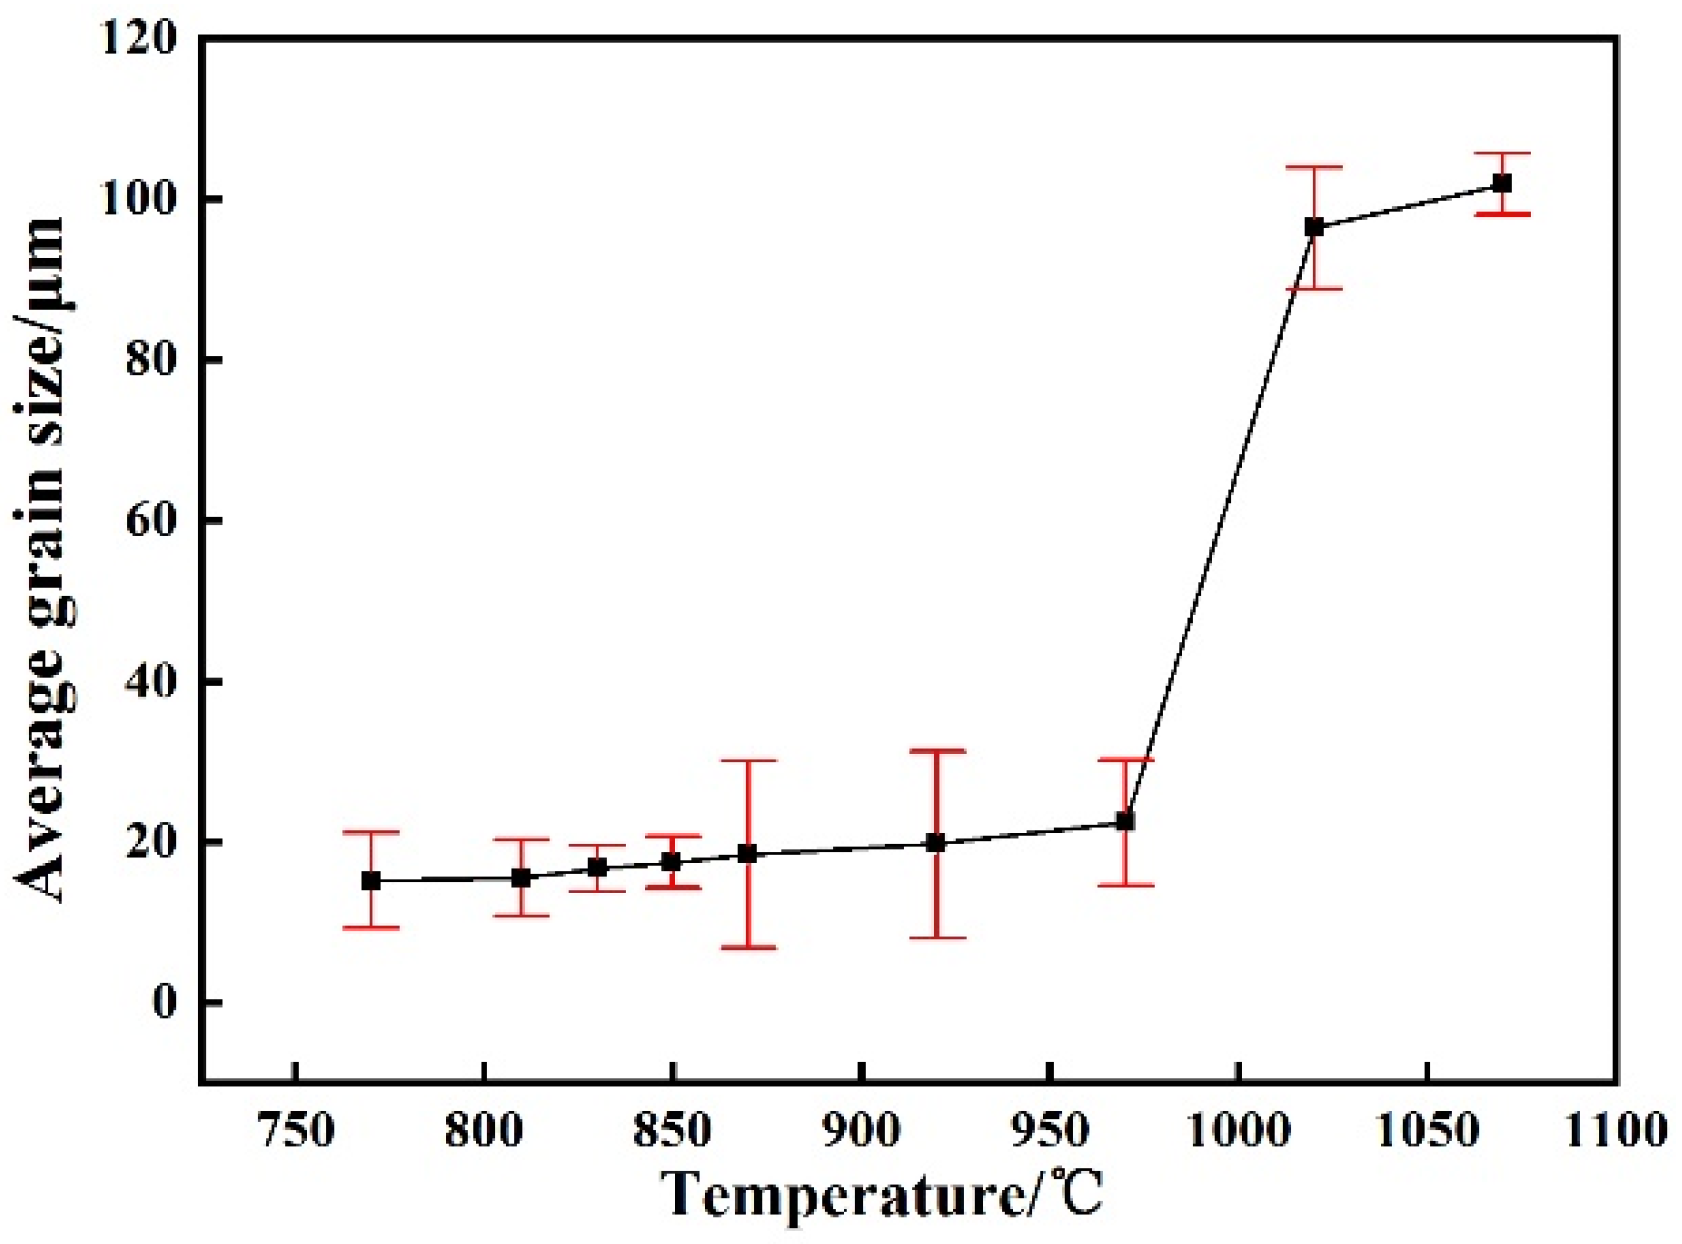
3.1. Determination of Austenitization Temperature

The calculation results are shown in Figure 4 by use of Thermo-Calc thermodynamic software [16], from which it can be concluded that the critical points Ae1 and Ae3 are 705 °C and 834 °C, respectively, for the studied steel. In the temperature range from 800 °C to 1400 °C, the solid solubility values of the microalloying elements V, Nb and Ti in austenite changed with the temperature, as seen in Figure 5.
The austenite (A) grain morphologies of the hot-rolled specimens are shown in Figure 6 when heated at different temperatures. It is shown that with increasing temperature, the austenite size increases continuously. According to statistics, the relationship curve between the average grain diameter and heating temperature is shown in Figure 7. It is shown that the austenite grains start to grow quickly at 970 °C, and the coarsening temperature of the austenite grains of the experimental steel is 1020 °C. With consideration of the complete solution of microalloying elements and austenite grain size, 920 °C was selected to be the austenizing temperature for the measurement of the CCT diagram for single-phase austenite. After intercritical annealing, the average grain diameter decreases from 19.67 μm to 9~11 μm. The grain is refined obviously after intercritical annealing. The grain size growth curve shows that the grain grows rapidly at 840 °C. Therefore, 830 °C was selected to be the heating temperature for the measurement of CCT for the intercritical annealing.

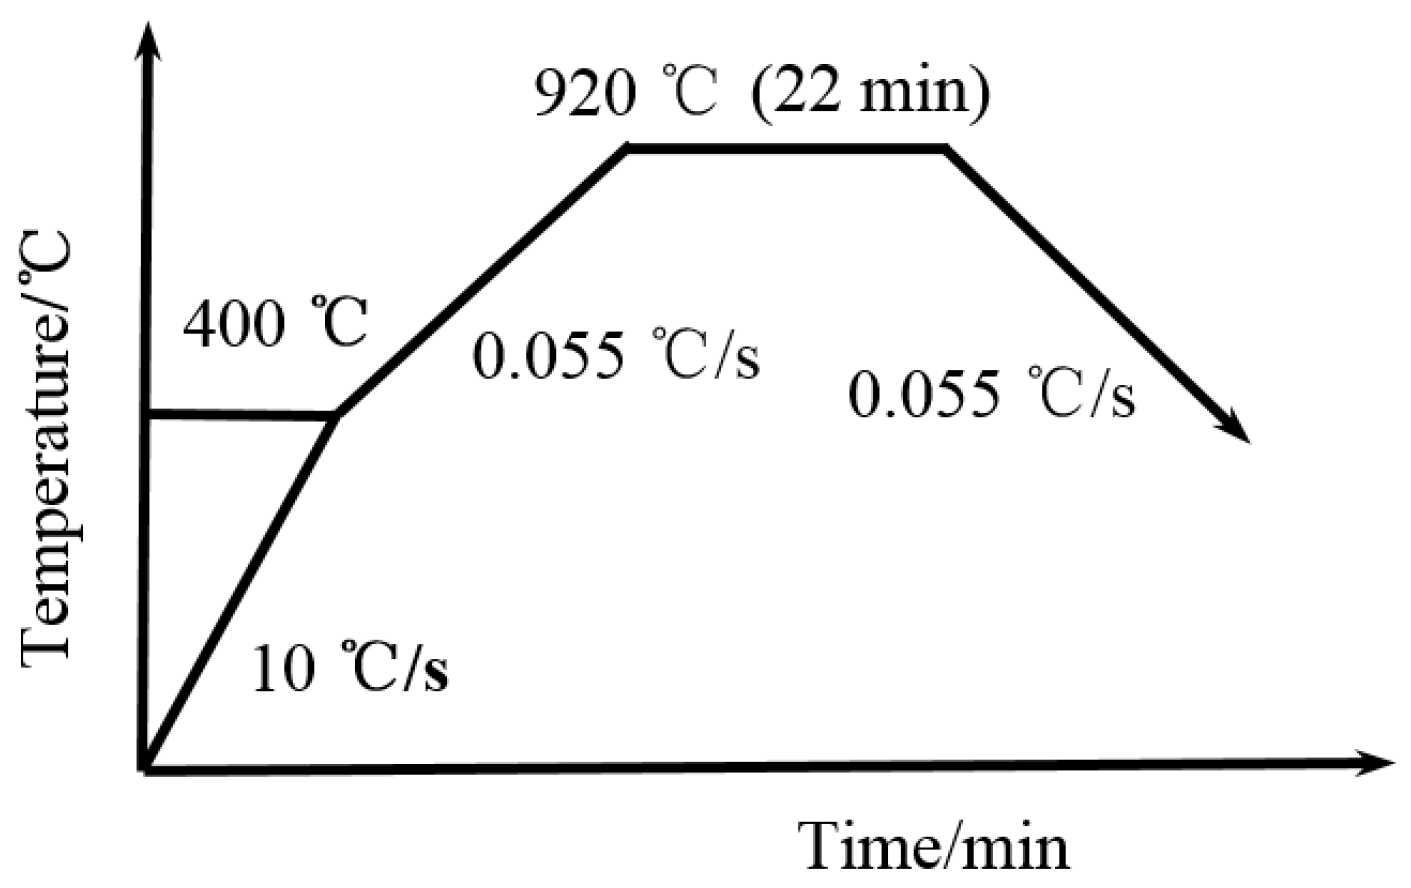
3.2. Determination of Critical Points

The critical points Ac1 = 744 °C, Ac3 = 847 °C of the experimental steel were obtained through experiments. The thermodynamic calculation results of the equilibrium critical points were Ae1 = 705 °C, Ae3 = 834 °C. The difference between the thermodynamic calculation results and the experimental values of the critical points is not large, which shows that the thermodynamic results are believable and can be taken as reference.

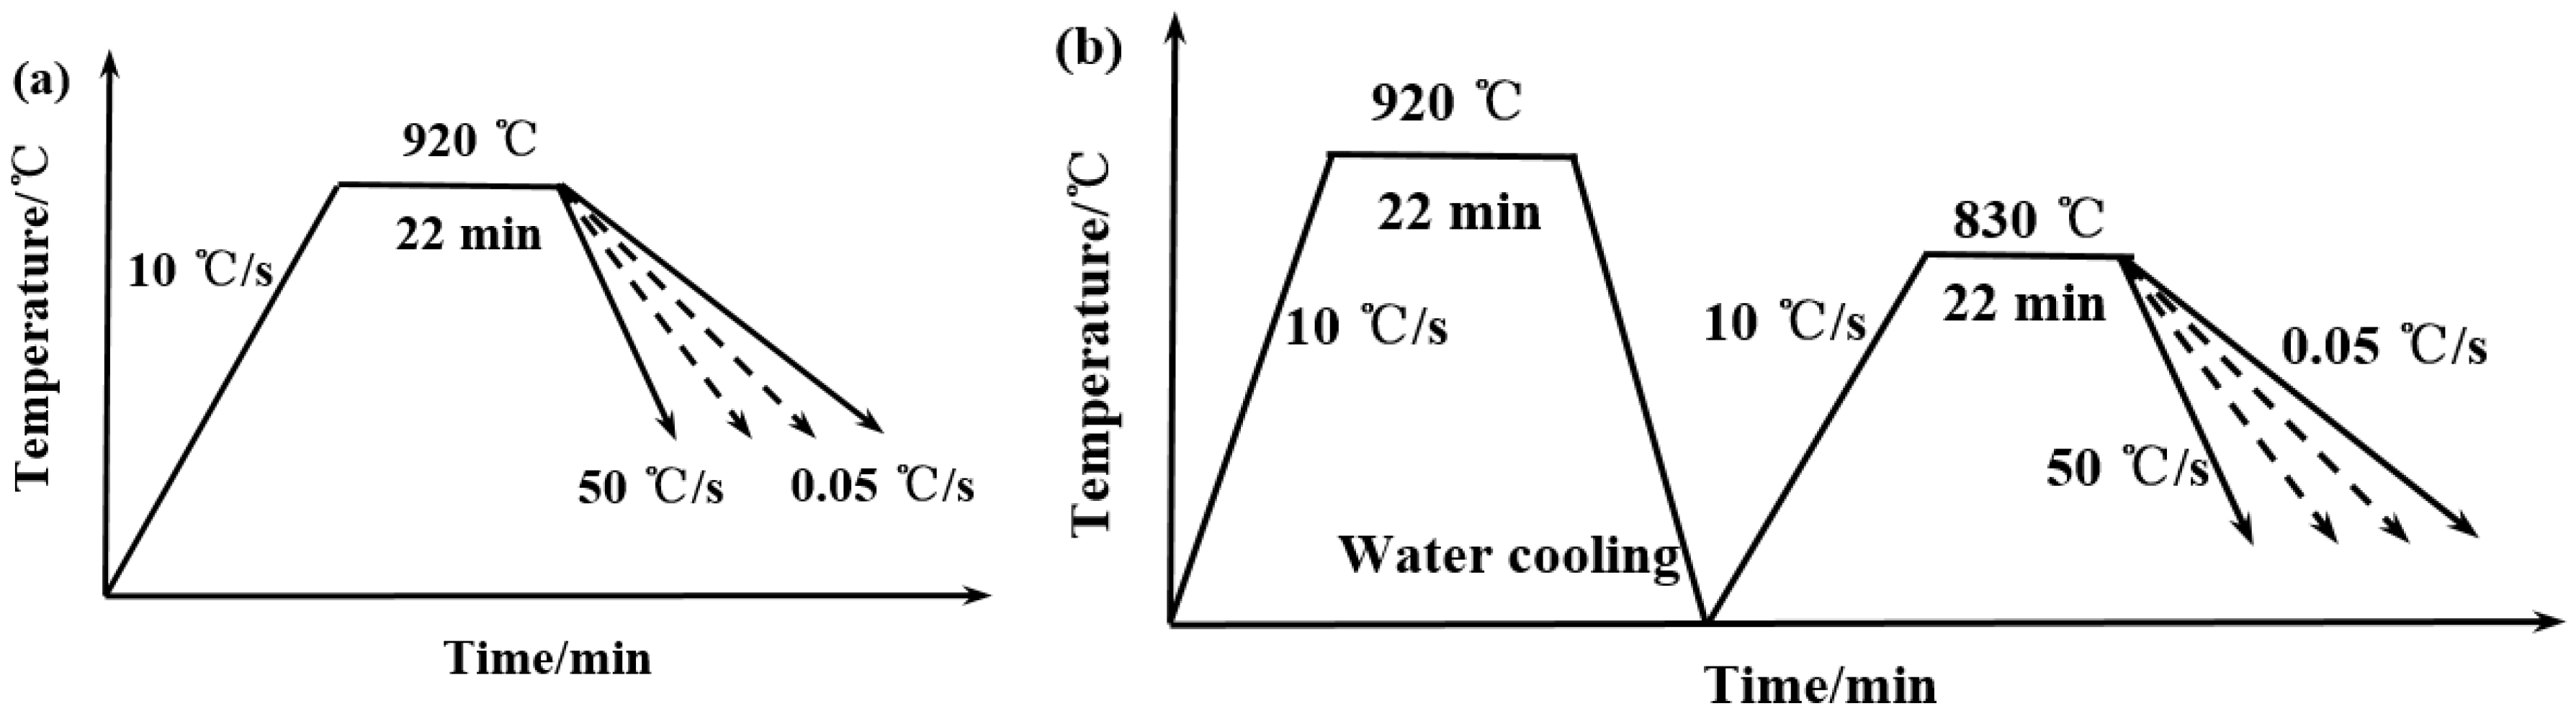
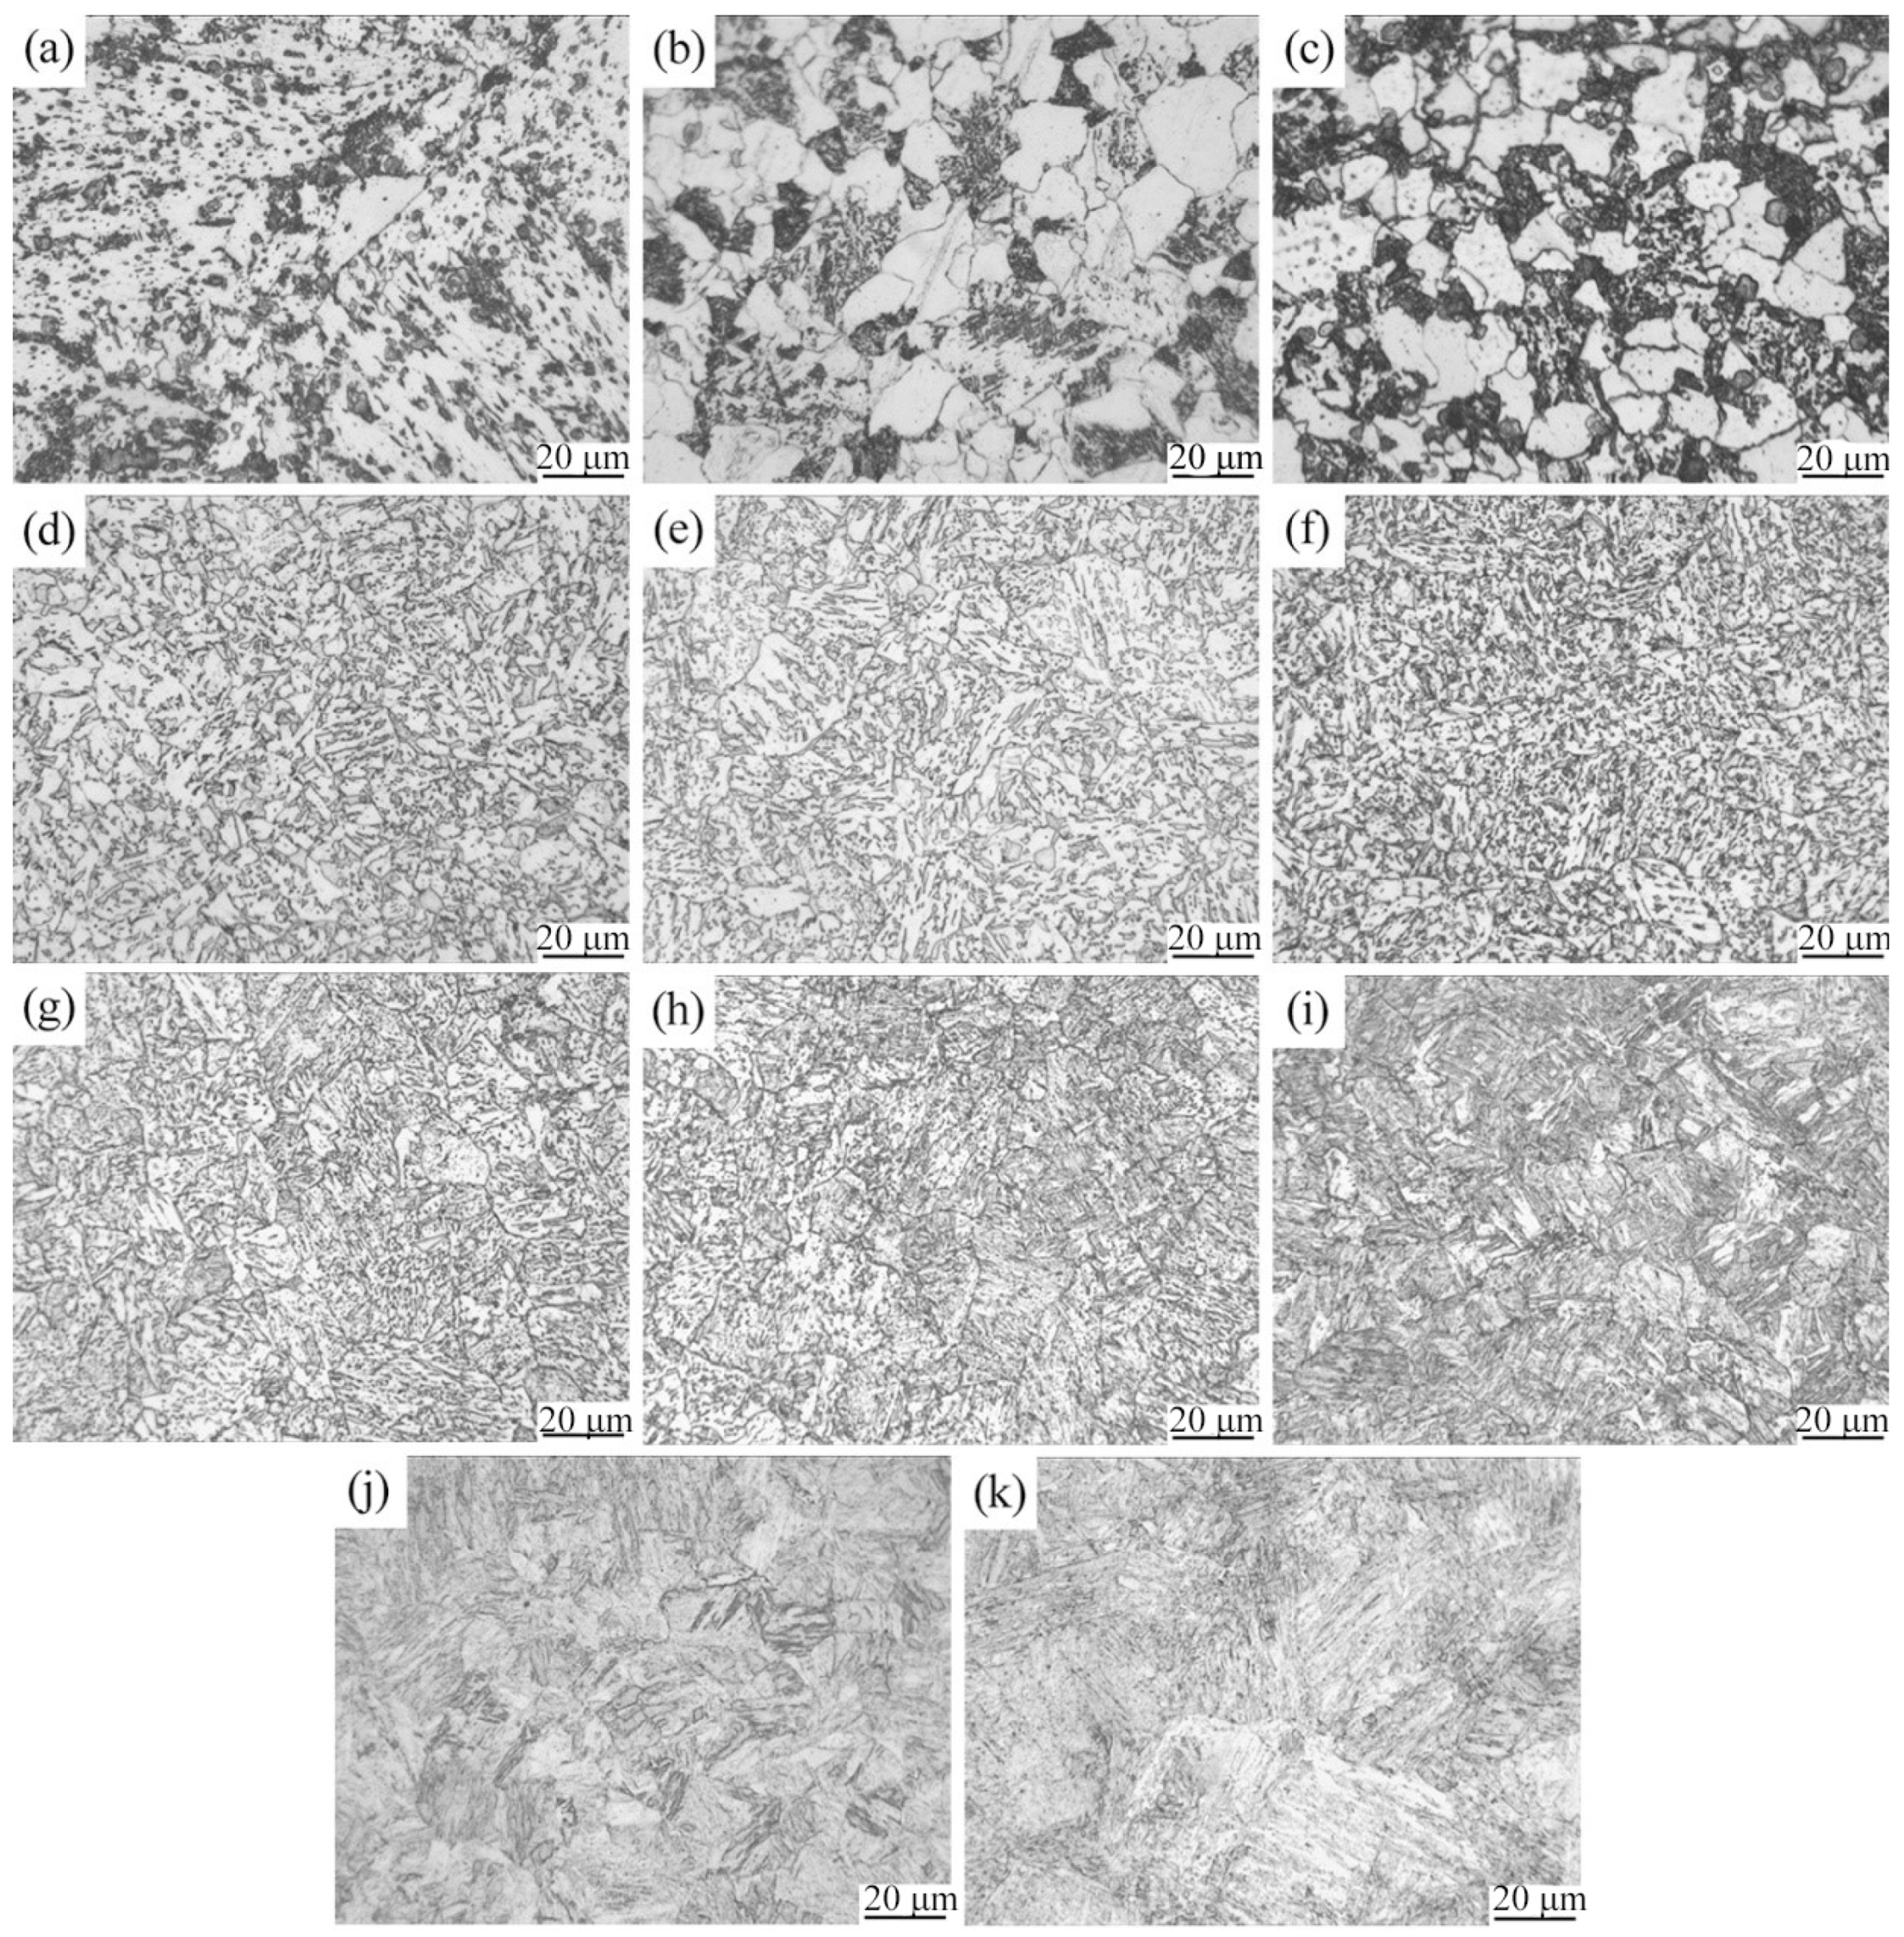
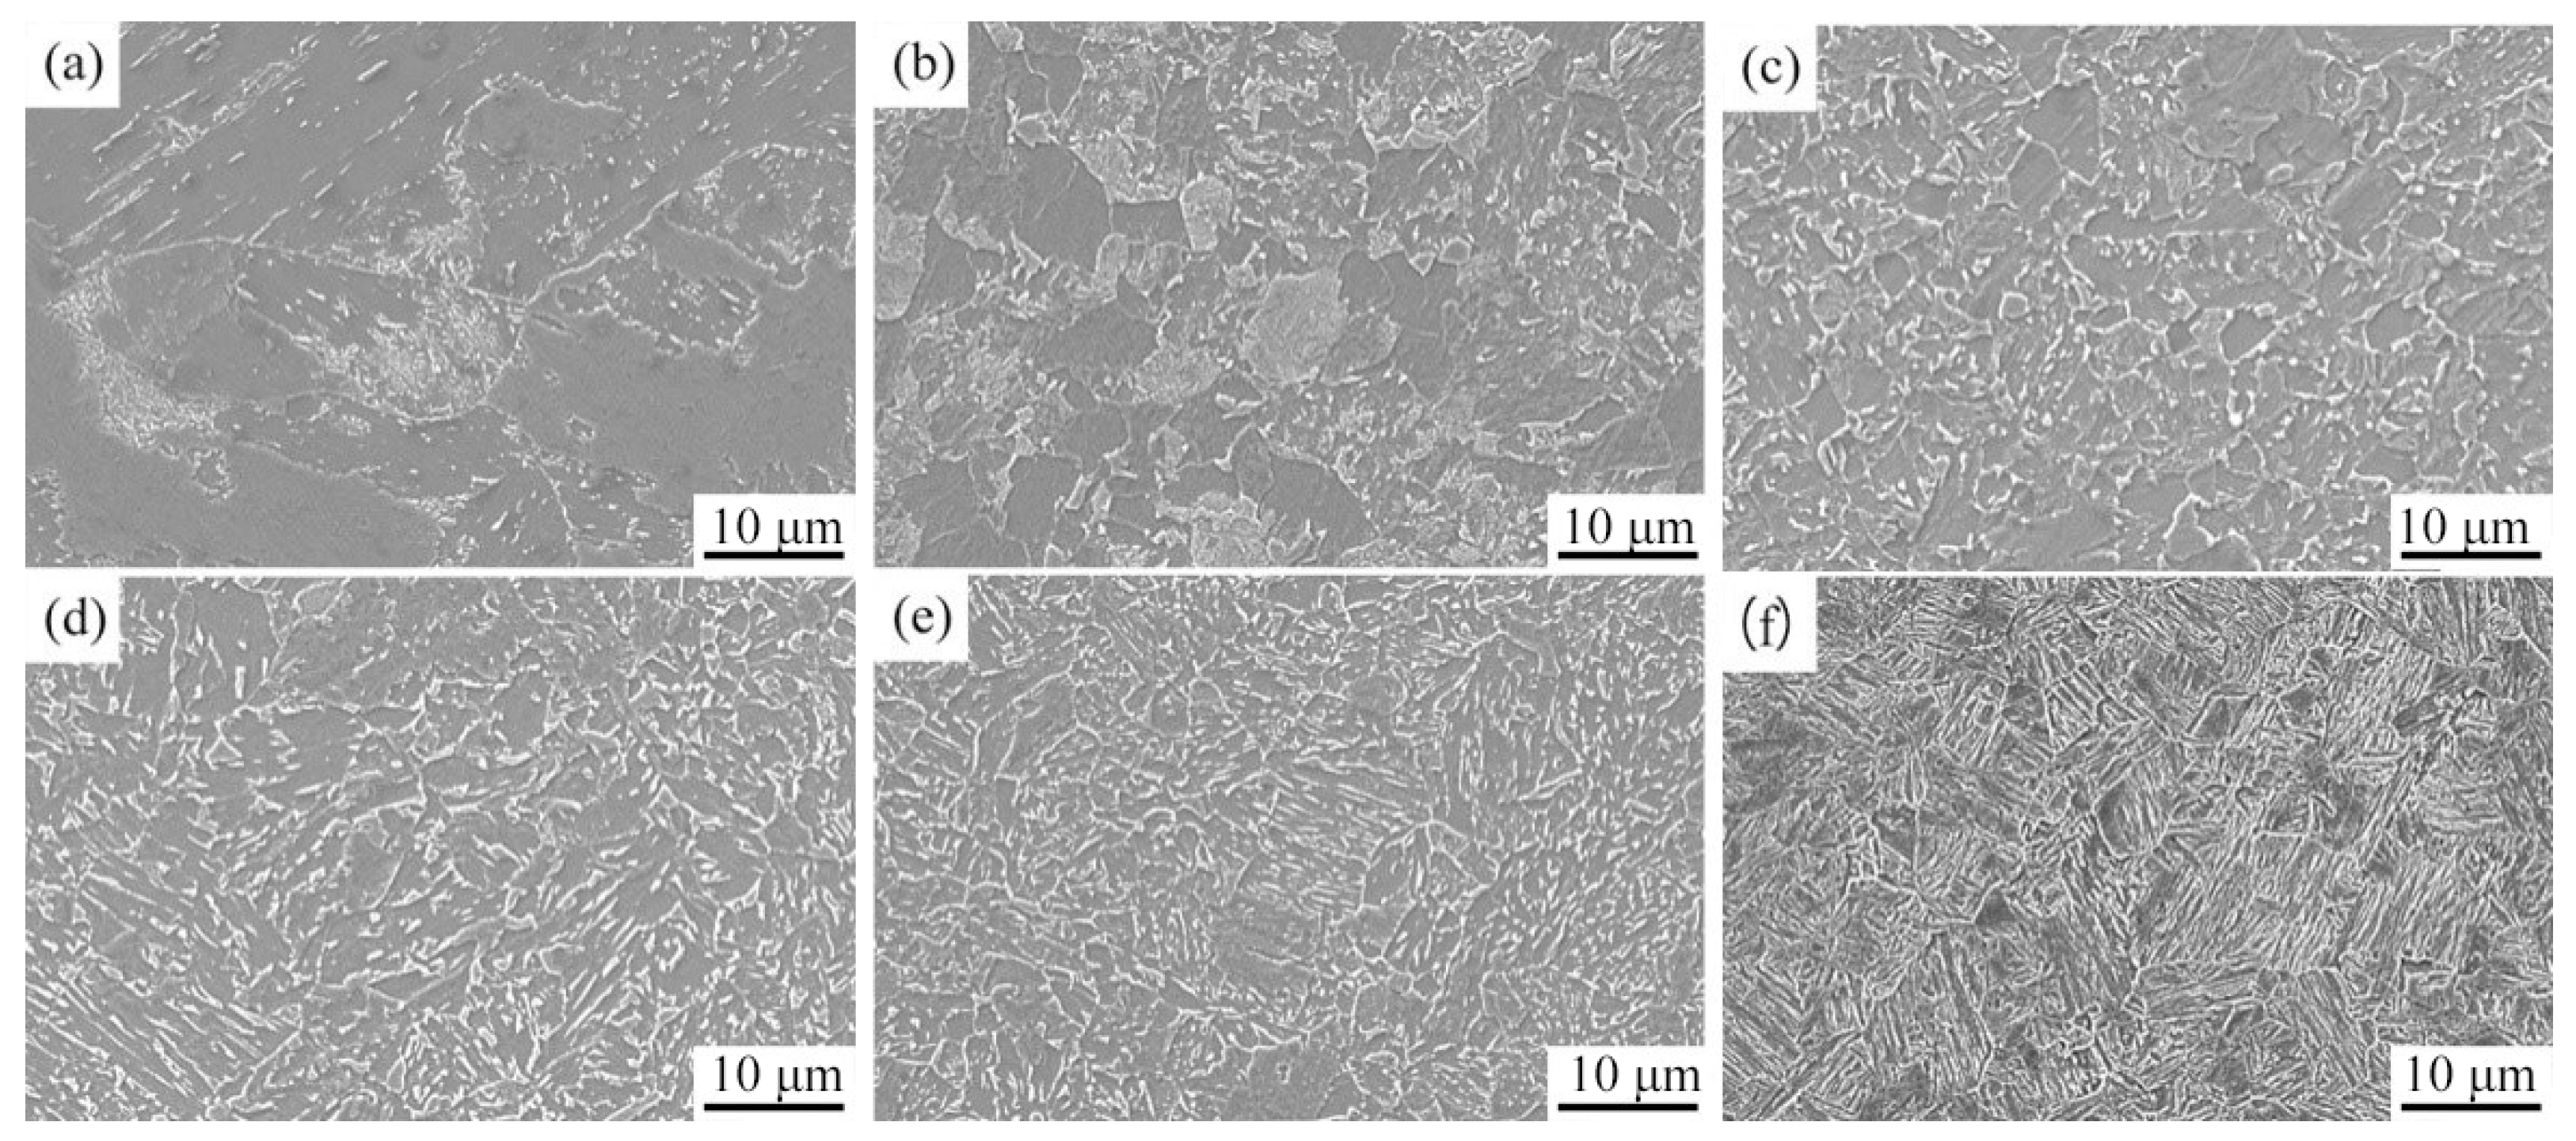
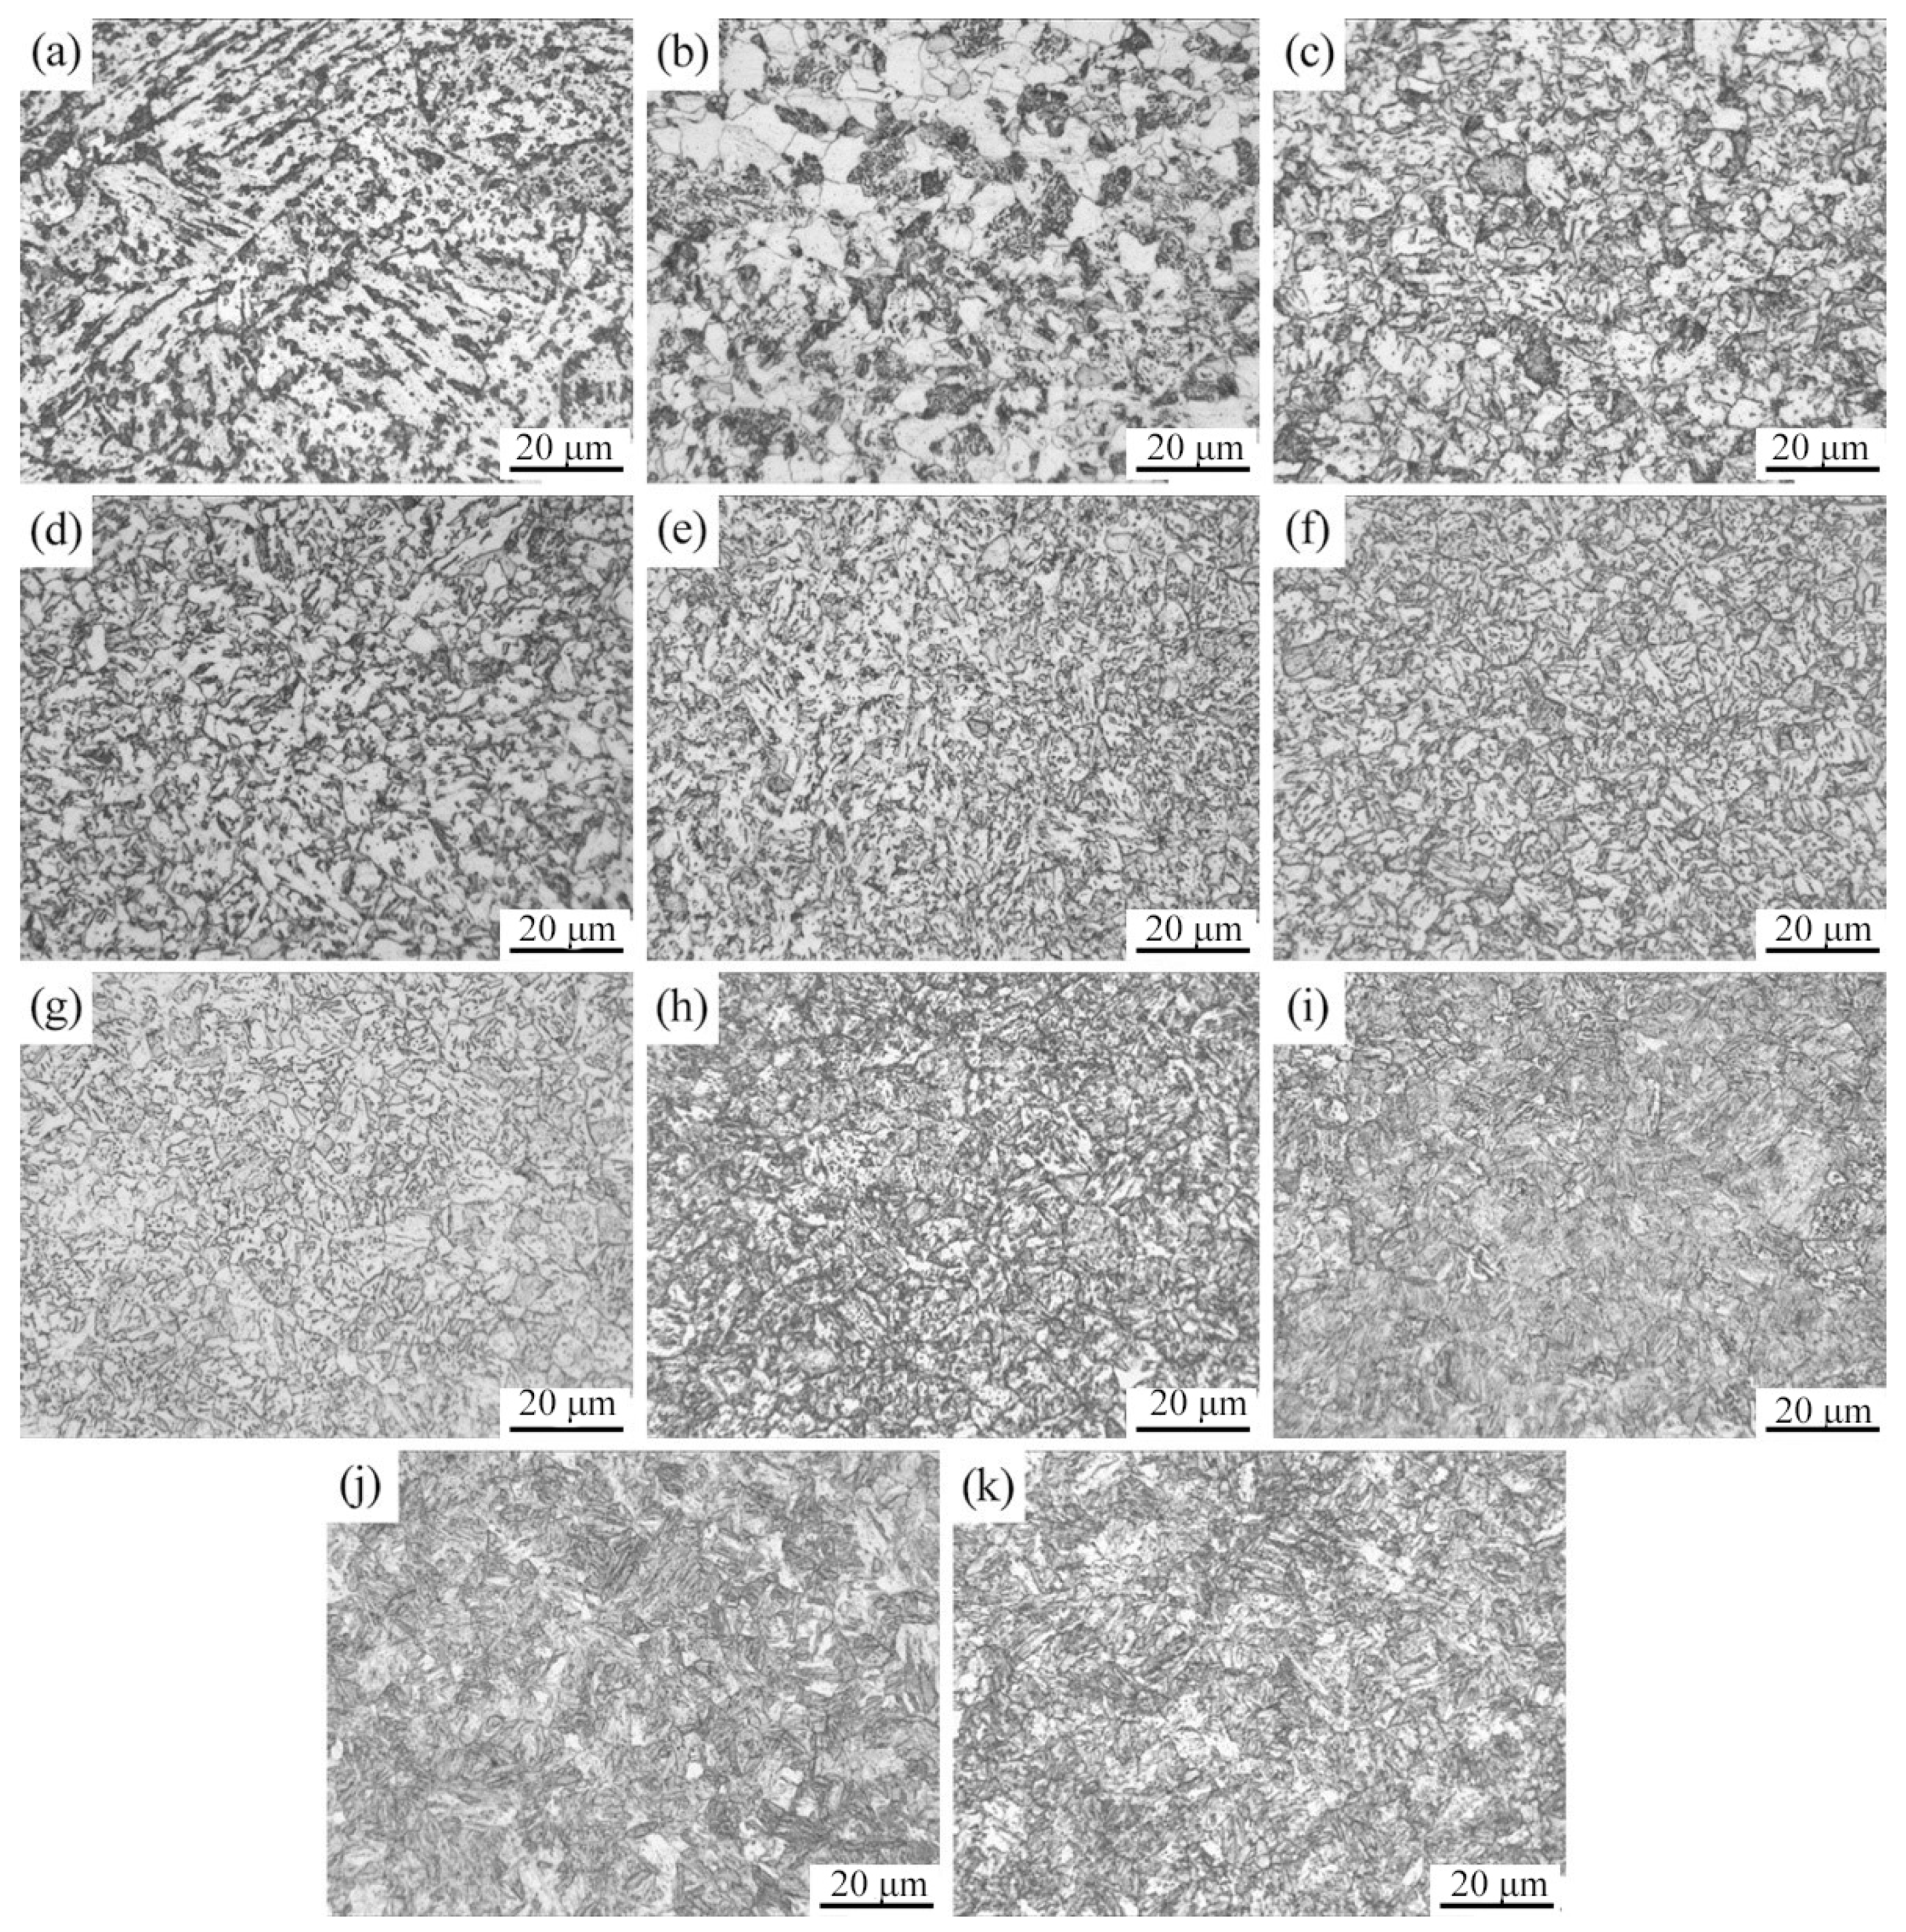
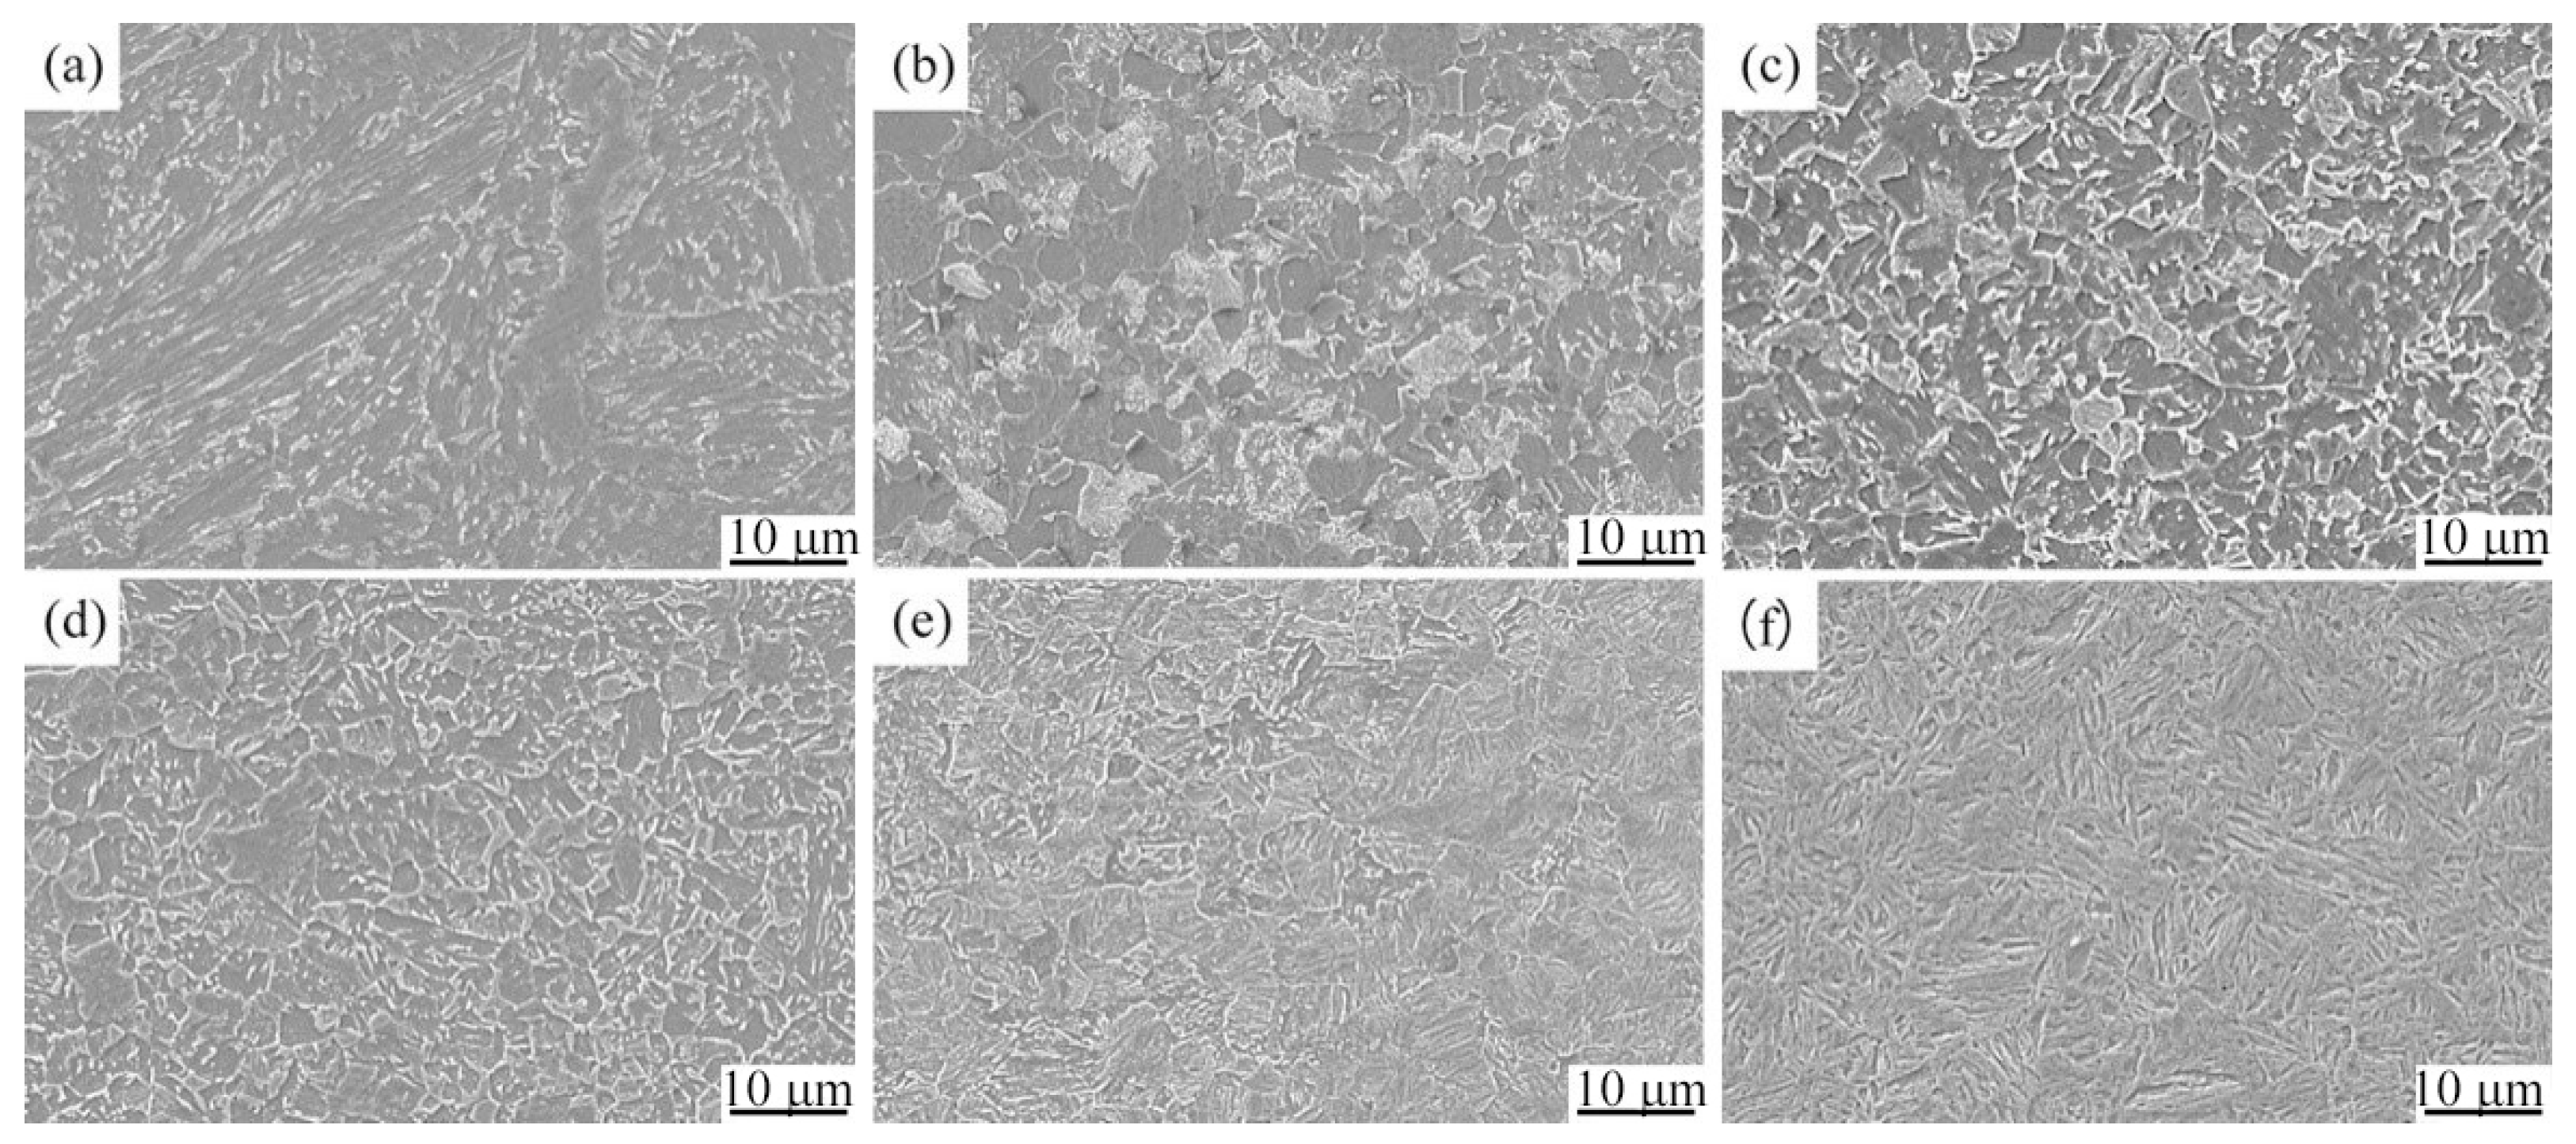
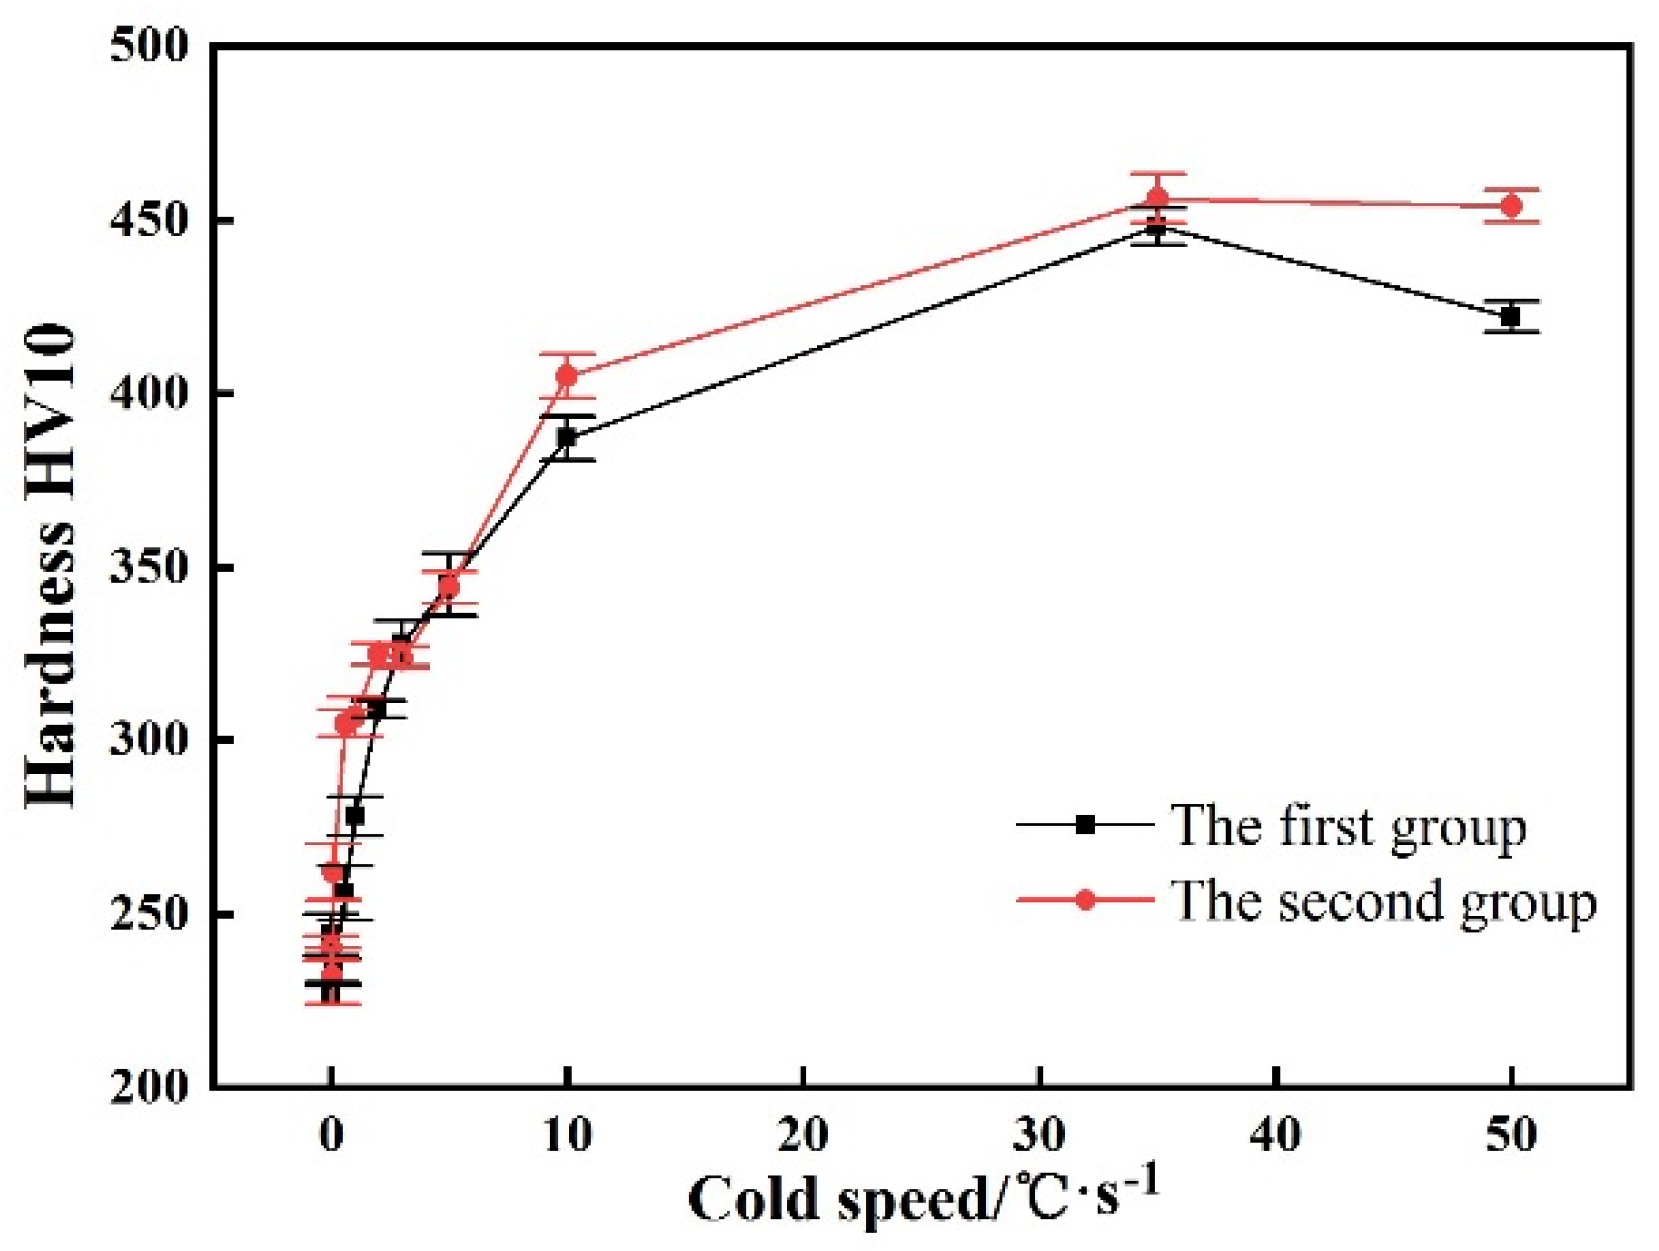
3.3. Microstructure and Hardness of the Experimental Steel at Different Cooling Rates

In order to better decide the transformed products of under-cooled austenite of the experimental steel, it is necessary that the microstructures at different cooling rates of the experimental steel are observed and the microhardness measured.
For the first group of specimens, for the rolled specimens heated to 920 °C for austenitization, the microstructures at different cooling rates are shown in Figure 8 and Figure 9. With a cooling rate of 0.1 °C·s−1 or below, since the carbon and iron atoms had enough time to diffuse in undercooled austenite and through the interface of γ/α, ferrite and pearlite microstructure formed. With decreasing temperature, under-cooled austenite transformed to bainite with semi-diffusion mechanism, which included few granular bainite (GB) of lumpy ferrite and islands with carbon-rich austenite, in the medium temperature range. The average hardness for these specimens was relatively low [20,21,22,23]. With the cooling rate increasing to 0.6 °C·s−1, the granular bainite amount increased gradually in the medium temperature range, and the average hardness values of these specimens increased. With a cooling rate of 1 °C·s−1, lath bainite (LB) formed, in which ferrite and carbide crisscrossed in a lath bundle and were distributed approximately parallel to each other at long intervals. With the cooling rate ranging from 2 °C·s−1 to 5 °C·s1, more lath bainite formed, and some martensite formed at a cooling rate of 5 °C·s−1. With increasing the cooling rate to 10 °C·s−1, the lath bainite disappeared in the microstructure and martensite took the most part; the hardness value apparently increased. When the cooling rate reached 35 °C·s−1 after austenitization of the specimen, the carbon and iron atoms had insufficient time to diffuse, due to the large cooling rate; thus, martensite transformation occurred with shear and no composition diffusion mechanism in the specimens. Since the carbon content was low in the experimental steel and the Ms point was relatively high for this steel, the lath martensite formed with the slipping mechanism had high density dislocation [24].
For the second group of specimens, after the specimens were heated to 920 °C and held for 22 min, the specimens were quenched, and then reheated to the intercritical temperature of 830 °C, held for 22 min, and cooled to room temperature with different cooling rates; the microstructures are shown in Figure 10, Figure 11 and Figure 12. It is shown that there occurred ferrite, pearlite, bainite and martensite transformations with different cooling rates. Compared to the first group of specimens, there always existed undissolved ferrite in each cooling rate range for this group of specimens. When the cooling rate reached 1 °C·s−1 or above, no more eutectoid ferrite formed, and the ferrite in the microstructure was undissolved [25,26].
The statistical results are shown in Table 2 of the microstructure types and hardness values for two groups of specimens. It is shown that two states of the specimens underwent ferrite, pearlite, bainite and martensite transformations during the continuous cooling process. The observation results of the microstructures show, for the two types of specimens with the same cooling rate, that the microstructure of the specimen with intercritical annealing is much finer and more homogeneous since undissolved ferrite was dispersively distributed with a needle-like or granular phase, which was able to hinder the grain boundary movement and grain growth of austenite, thereby effectively refining the austenite grains. The undissolved ferrite with low hardness and good ductility can prevent stress concentration and crack propagation, and therefore, it can enhance the low temperature toughness of steels. The hardness change trends of the two types of the specimens were compared, as seen in Figure 12. With increasing the cooling rate, the hardness values gradually increased and with the same cooling rate, the specimen with intercritical annealing had relatively larger hardness value. Generally, there exists a positive relationship between hardness and strength. After intercritical annealing, the interlacing microstructure of bainite and ferrite in steel was similar to that of “fiber reinforced composites” [27]. Bainite on grain boundary plays an important role in strengthening the grain boundary and improving its properties. The interface of ferrite and bainite phase is highly common; there is no formation of brittle carbides on the interface, and it is not easy to produce local stress concentration. The soft ferrite phase can reduce the yield ratio, but also prevents crack propagation and further improves the impact toughness. A large number of ferrite/bainite grain boundaries can effectively prevent crack propagation in steel. With increasing the cooling rate, the carbon atoms’ diffusion was not full; therefore, the solid solution strengthening of carbon atoms became stronger.
Therefore, it is inferred that the low temperature toughness and strength of the specimen with intercritical annealing is further enhanced.

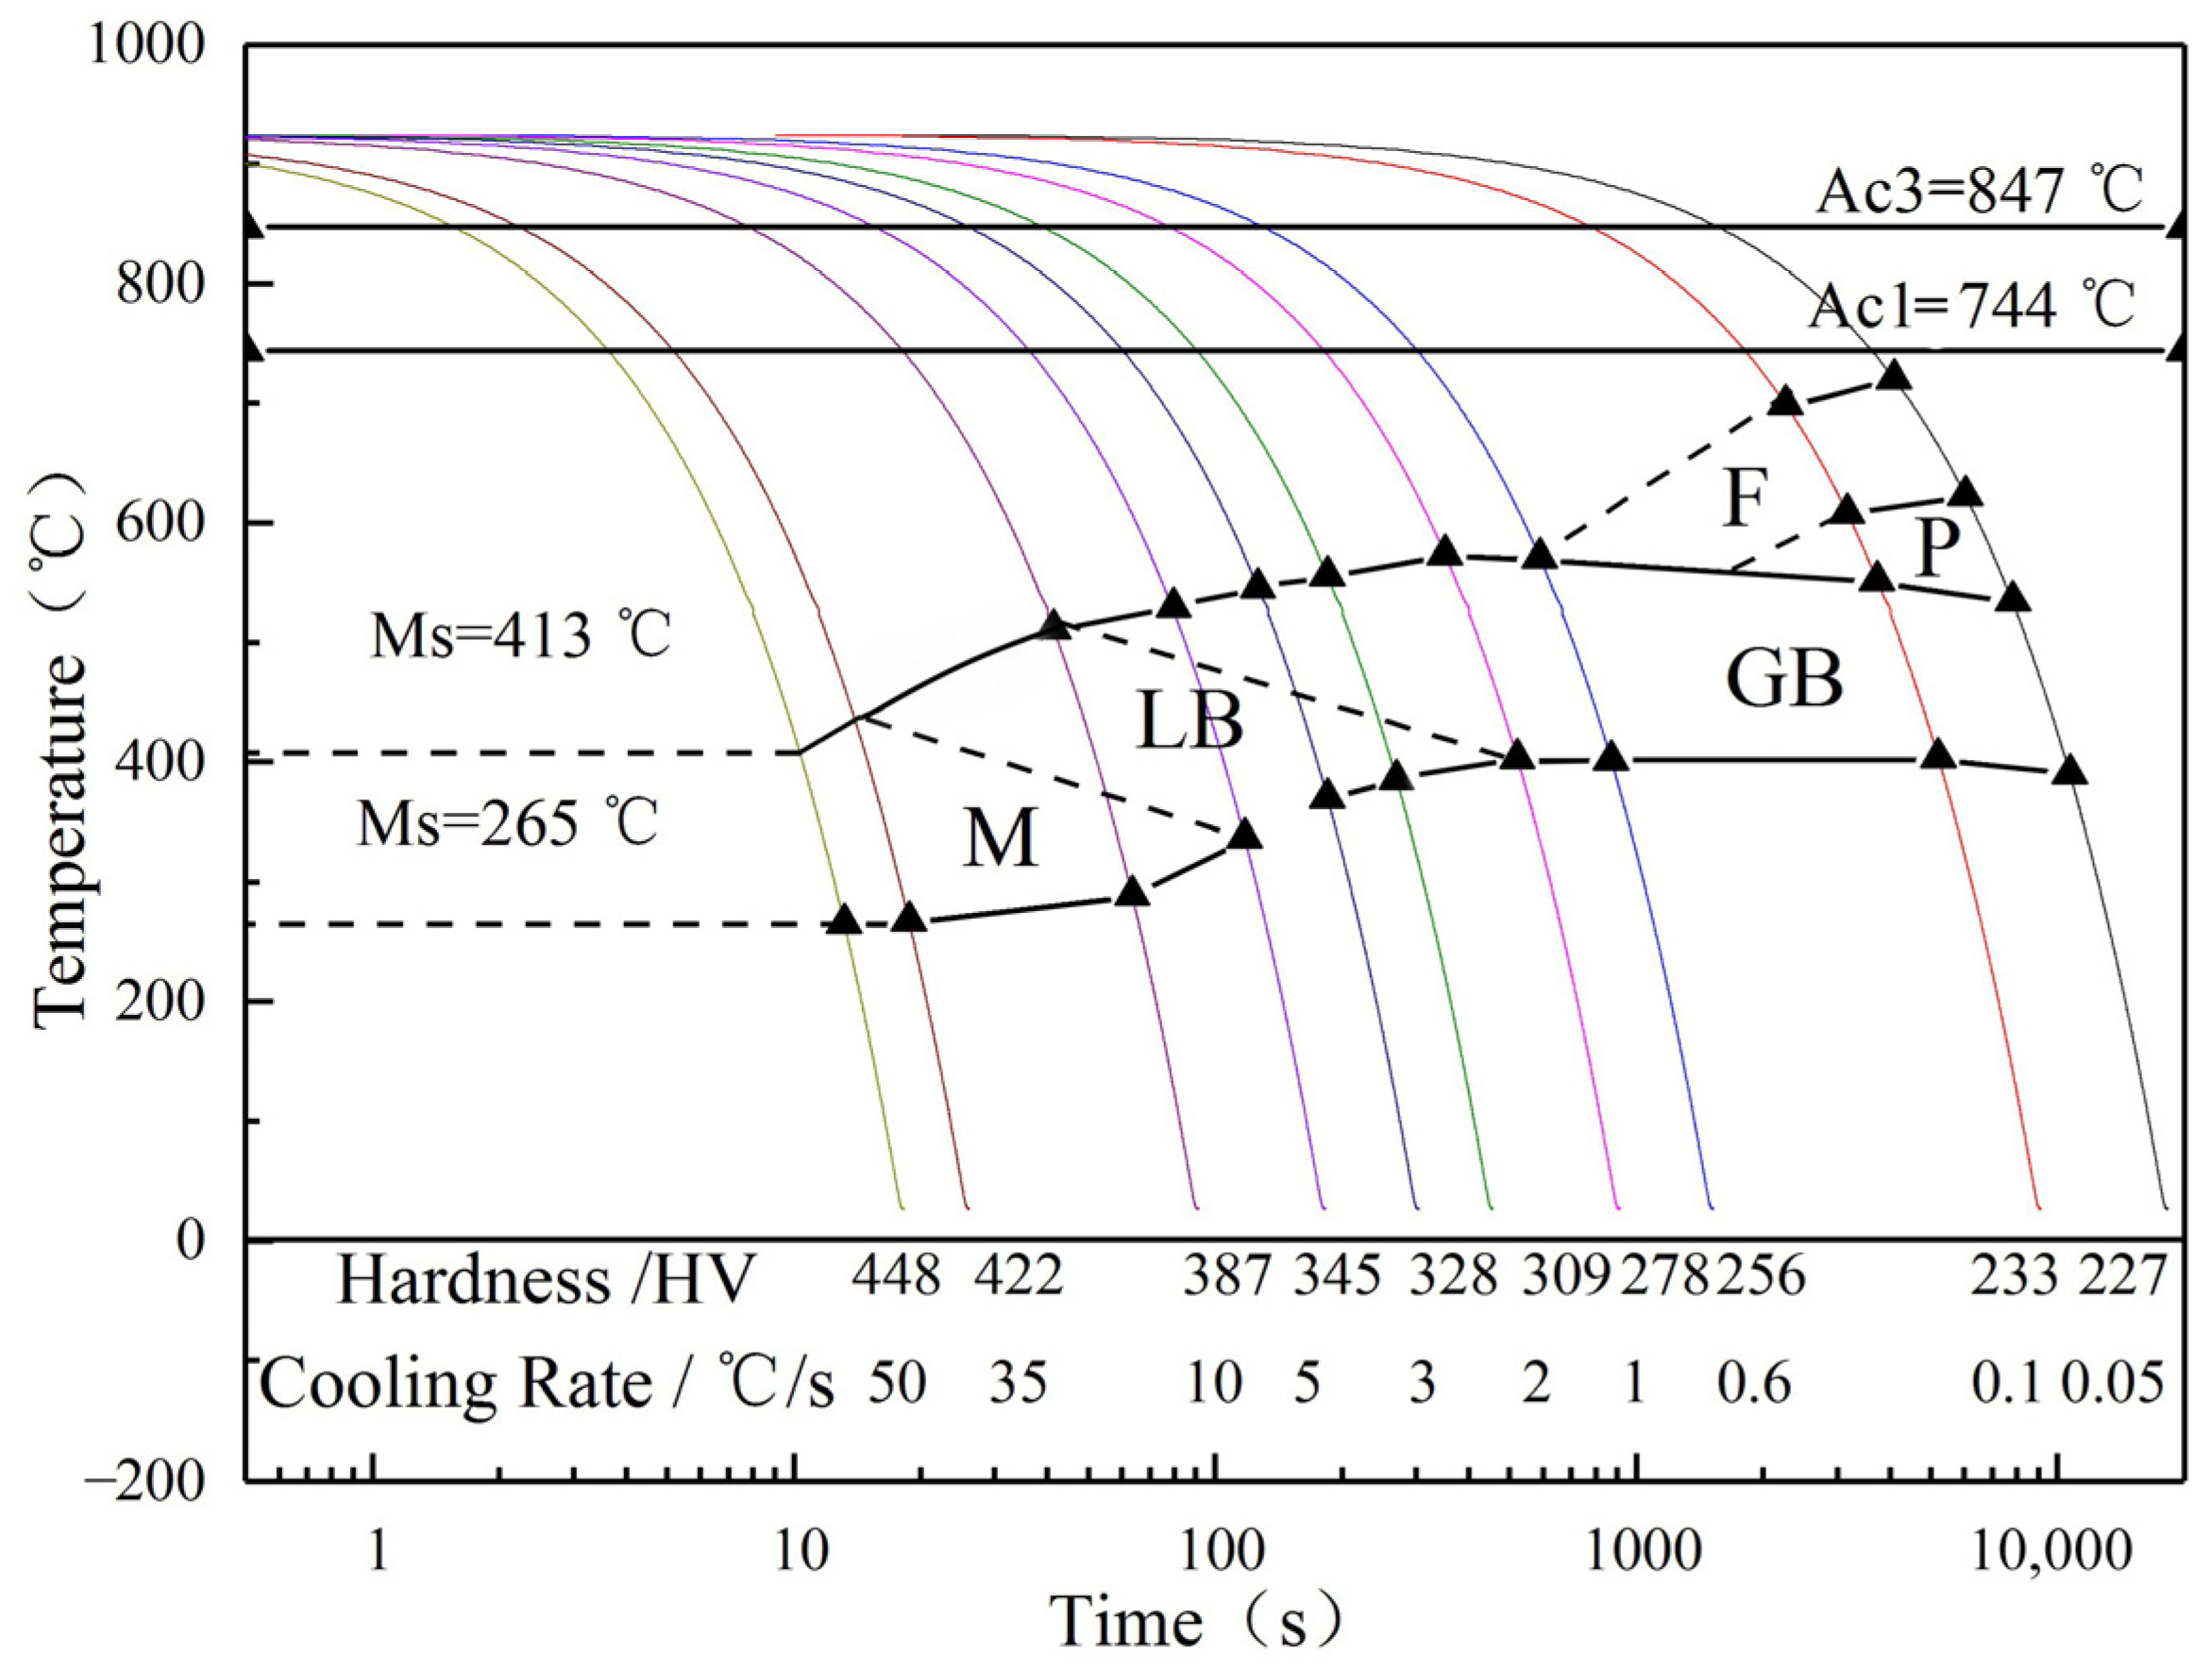
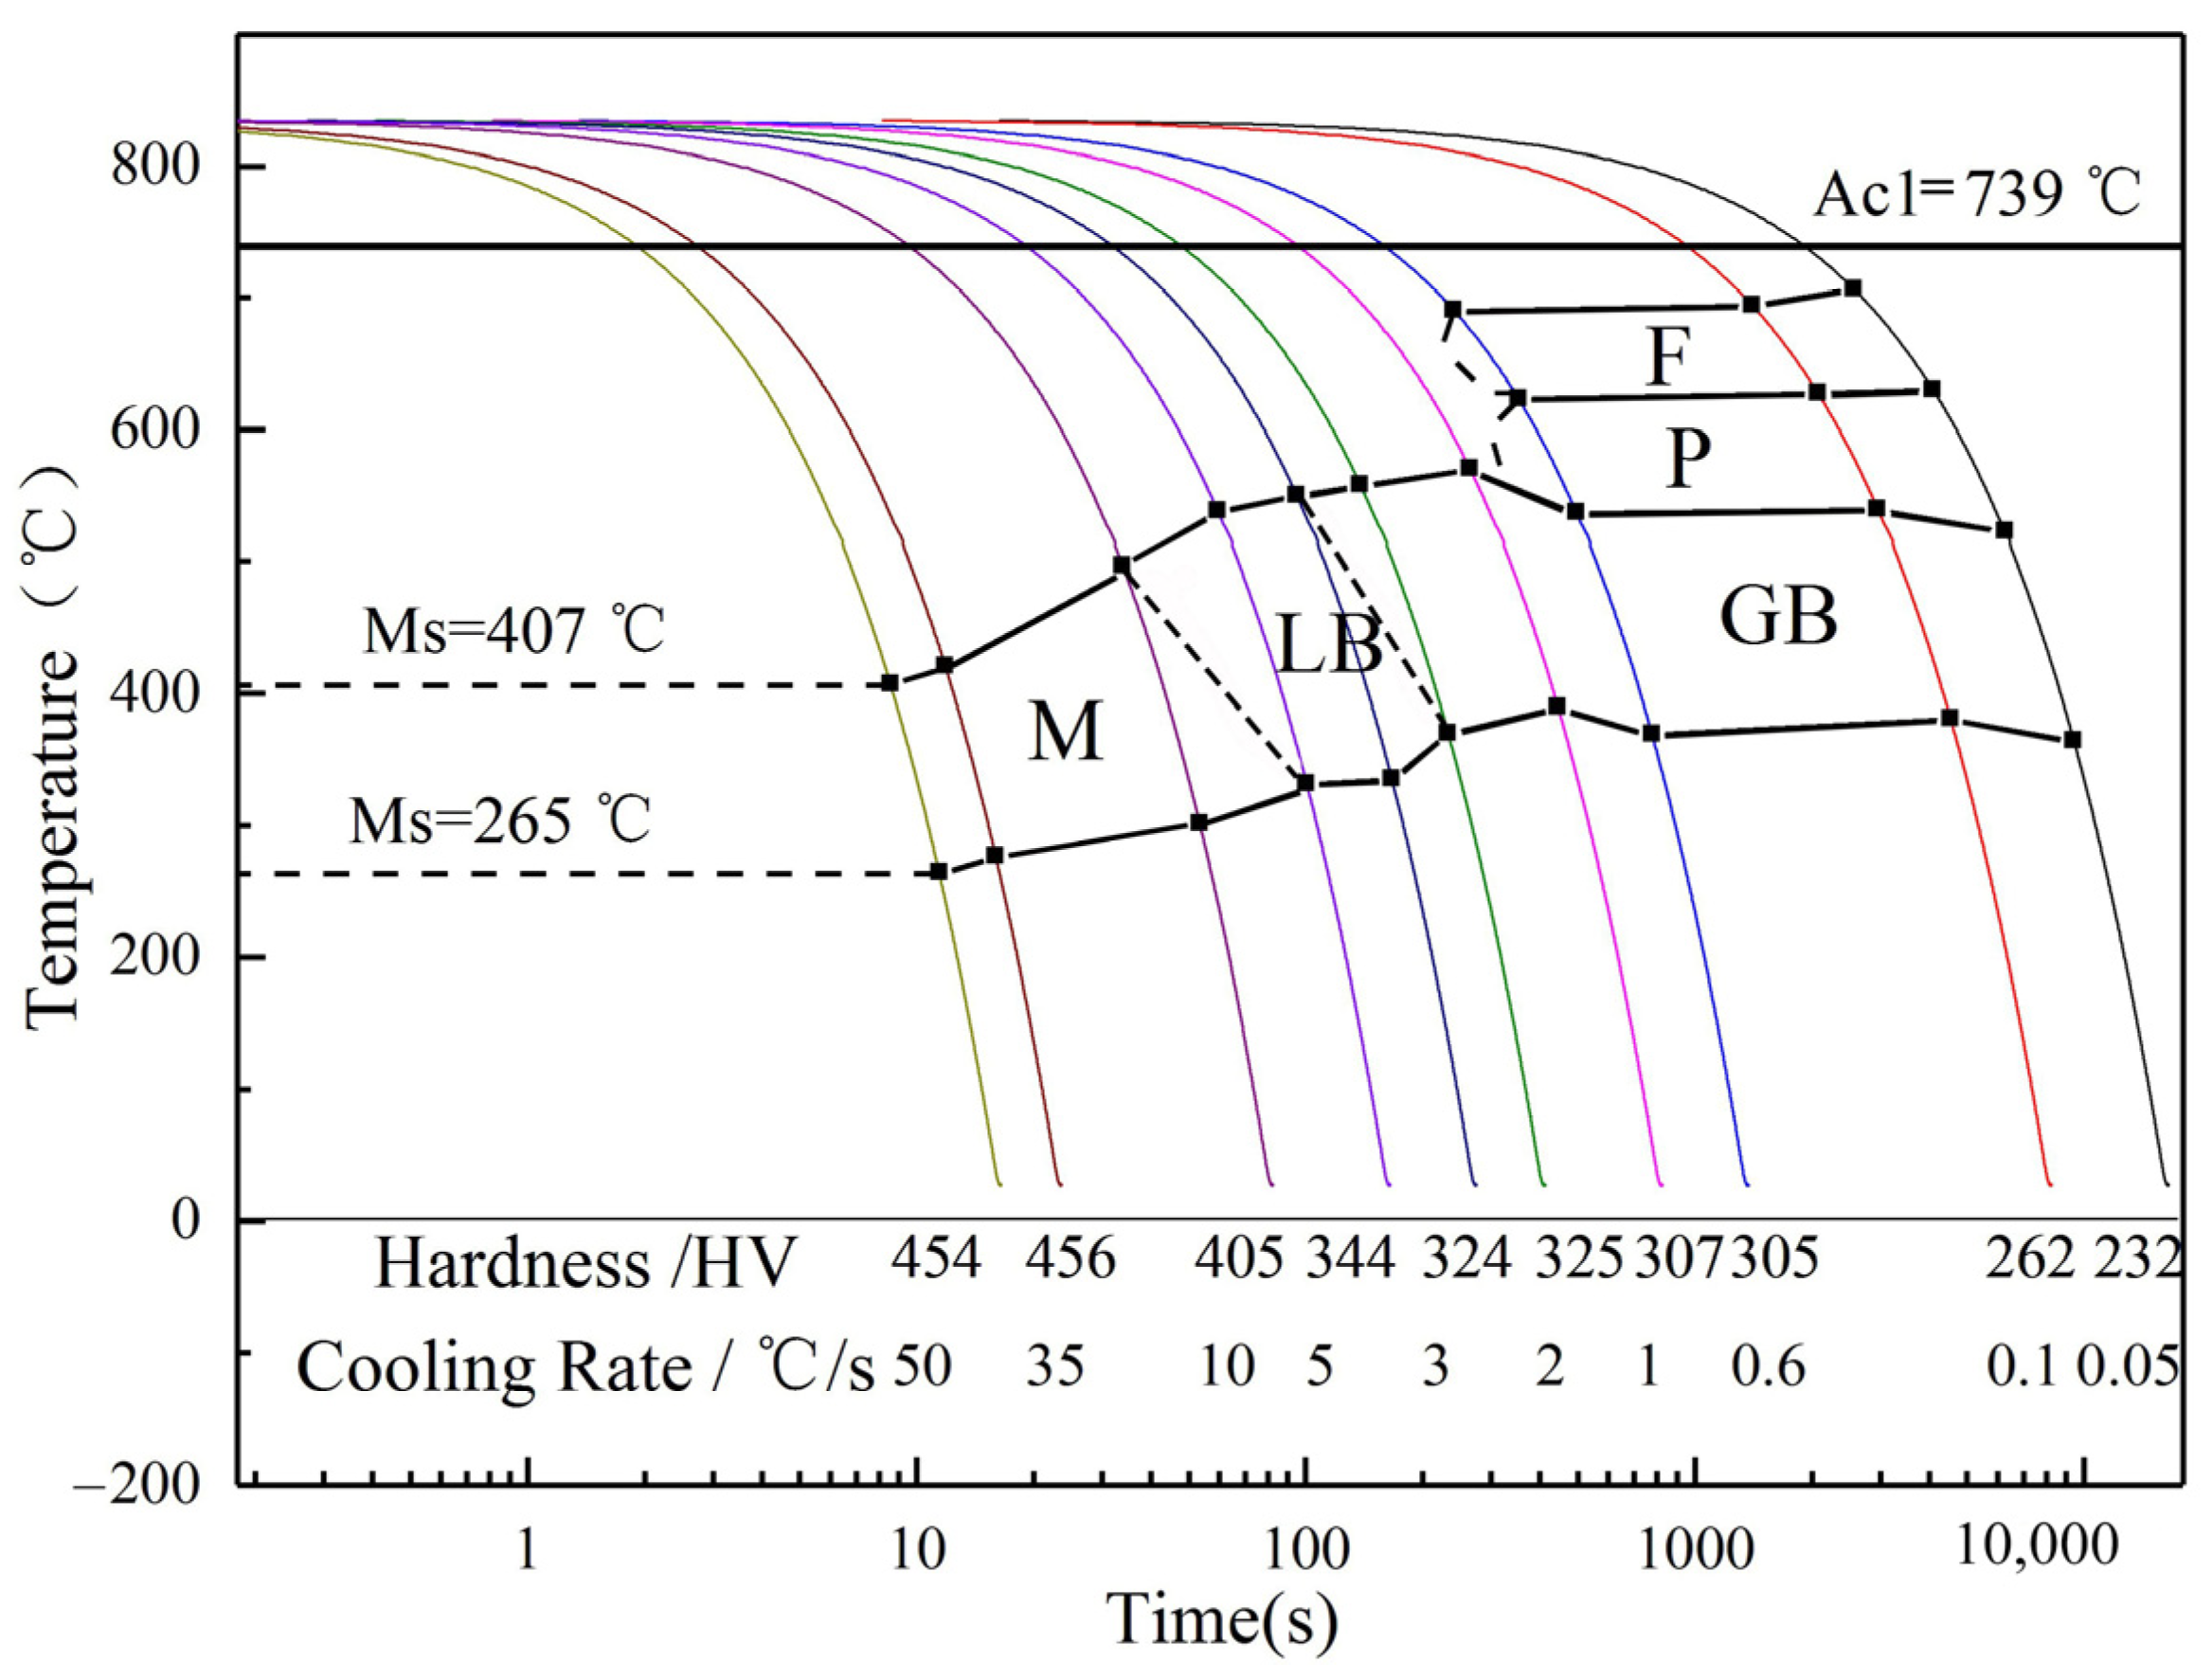
3.4. Drawing of CCT Curve of the Experimental Steel

Based on the thermal expansion curve, the tangent method was adopted to the characteristic temperatures of under-cooled austenite at different cooling rates as shown in Table 3 and Table 4. The characteristic temperatures were added to the corresponding cooling rate curve for different specimens, connecting the transition start points and final points with the same nature, marking out points Ac1, Ac3 and Ms. The CCT diagram of the experimental steel can be obtained by indicating the microstructure name in the corresponding phase transition zone, as shown in Figure 13 and Figure 14. At the end of each cooling rate curve, the corresponding hardness value and cooling rate are marked.
SXQ500/550D hydropower steel is a low-carbon, bainite, ultra-thickness plate. The study about the CCT curve of single-phase austenite showed that when the cooling rate is controlled in the range of 1 °C·s−1~5 °C·s−1, the bainite microstructure can be obtained. Based on the study about the CCT curve of the intercritical process, it is shown that after the specimen was quenched at 920 °C and underwent the intercritical process at 830 °C, the microstructure of bainite and undissolved ferrite could be obtained, which were well matched in strength and toughness, with the cooling rate controlled at 1 °C·s−1~5 °C·s−1.
Since undissolved ferrites distribute dispersively in an acicular or granular state, they can prevent stress concentration and crack propagation. Therefore, at the same cooling rate, the microstructure of the specimen, being quenched at 920 °C and undergoing the intercritical process at 830 °C, was much refined, and the strength and toughness were further enhanced.

4. Conclusions

Through the above experiments and analysis, the following conclusions are drawn:
(1) The average size of austenite grain increases with the increase in heating temperature. The grain coarsening temperature is 1020 °C, and it has a tendency to grow rapidly at 970 °C. The main reason for grain coarsening is that the carbon and nitrogen compounds of Nb and Ti begin to dissolve at 1020 °C, leading to a significant reduction in the number of particles in the second phase, weakening of the pinning effect, and even failure. Some grain boundaries break through the shackles and move and grow preferentially. When the temperature reaches 1070 °C, the grain size still grows but tends to homogenize, and the mixed crystal effect disappears.
(2) The critical transition temperatures Ac1 and Ac3 of the experimental steel are 744 °C and 847 °C, respectively.
(3) The CCT diagrams of the specimens in two states show that there are four transition zones: ferrite, pearlite, bainite and martensite. The CCT diagrams of single-phase under-cooled austenite shows that with the cooling rate below 1 °C·s−1, the microstructure consisted of ferrite, pearlite and bainite; with the cooling rate controlled at 2~5 °C·s−1, the microstructure was mainly composed of bainite; with the cooling rate at 5 °C·s−1, martensite started to occur in the microstructure; with the cooling rate at 10 °C·s−1, martensite was the main phase in the microstructure, with the hardness value apparently increased; with the cooling rate at 35 °C·s−1, the microstructure comprised martensite and little-retained austenite. For the CCT diagrams of the specimen with intercritical process, except for the undissolved ferrite phase in each cooling rate zone, the other microstructure types were the same.
(4) Since undissolved ferrites distribute dispersively in an acicular or granular state, they can prevent stress concentration and crack propagation; therefore, the microstructure of the specimen, being quenched at 920 °C and undergoing the intercritical process at 830 °C with the same cooling rate, was much refined, and the strength and toughness were further enhanced.
(5) For the achievement of the bainite + ferrite dual-phase microstructure with well-matched strength and toughness, the cooling rate should be controlled at 1 °C·s−1~5 °C·s−1.

Author Contributions

F.W. conceived the work. Z.T. and Y.Z. performed the experiments and analyzed the data. R.G. and Z.L. wrote the manuscript with help from all the other authors. Y.L. supervised the whole project. All authors have read and agreed to the published version of the manuscript.

Funding

This research was funded by National Natural Science Foundation of China (grant No. 51974017).

Institutional Review Board Statement

Not applicable.

Informed Consent Statement

Not applicable.

Data Availability Statement

The data presented in this study are available on request from the corresponding author. The data are not publicly available due to involving trade secrets.

Conflicts of Interest

The authors declare no conflict of interest.

References

  1. Zhang, X.Y. Study on Microstructure Control and Low Temperature Toughness of 700 MPa Marine Steel. Ph.D. Thesis, Liaoning University of Science and Technology, Anshan, China, 2020. [Google Scholar]
  2. Sun, M.Y. Study on Multiphase Microstructure Control and Mechanical Behavior of Marine Engineering Steel for Low Temperature. Ph.D. Thesis, Beijing University of Science and Technology, Beijing, China, 2020. [Google Scholar]
  3. Ding, W.; Tang, D.; Jiang, H.T. Annealing process and microstructure evolution of 780 MPa grade TRIP steel for hot-dip galvanizing. J. Univ. Sci. Technol. Beijing 2010, 32, 753–758. [Google Scholar]
  4. Zhang, M. Study on Quenching and Tempering Treatment in Dual-Phase Zone of Q345 Structural Steel. Ph.D. Thesis, Shandong University, Jinan, China, 2019. [Google Scholar]
  5. Zhang, Y.; Wang, F.M.; Tang, Z.L.; Wang, L. Austenite grain growth behavior of SXQ500/550D steel and its influencing factors. Met. Heat Treat. 2019, 44, 110–118. [Google Scholar]
  6. Li, M.B.; Hu, P. Effect of TMCP process on microstructure and properties of Si-Mn bainitic steel. J. Eng. Sci. 2016, 38, 1115–1122. [Google Scholar]
  7. Huang, J.; Poole, W.J.; Militzer, M. Austenite formation during intercritical annealing. Metall. Mater. Trans. A 2004, 35, 3363–3375. [Google Scholar] [CrossRef]
  8. Lee, S.; De Cooman, B.C. Effect of the Intercritical Annealing Temperature on the Mechanical Properties of 10 Pct Mn Multi-Phase Steel. Metall. Mater. Trans. A 2014, 45, 5009–5016. [Google Scholar] [CrossRef] [Green Version]
  9. Lee, S.; Cooman, B. Annealing Temperature Dependence of the Tensile Behavior of 10 pct Mn Multi-Phase TWIP-TRIP Steel. Metall. Mater. Trans. A 2014, 45, 6039–6052. [Google Scholar] [CrossRef] [Green Version]
  10. Wei, R.; Enomoto, M.; Hadian, R. Growth of austenite from as-quenched martensite during intercritical annealing in an Fe-0.1C-3Mn-1.5Si alloy. Acta Mater. 2013, 61, 697–707. [Google Scholar] [CrossRef]
  11. Mohanty, R.R.; Girina, O.A.; Fonstein, N.M. Effect of Heating Rate on the Austenite Formation in Low-Carbon High-Strength Steels Annealed in the Intercritical Region. Metall. Mater. Trans. A 2011, 42, 3680–3690. [Google Scholar] [CrossRef]
  12. Ding, R.; Tang, D.; Chen, Y.L.; Zhao, A.M.; Jiang, Y.H. Effect of annealing temperature on microstructure and mechanical properties of annealed martensitic TRIP steel. J. Univ. Sci. Technol. Beijing 2014, 36, 1476–1482. [Google Scholar]
  13. Yang, D.Z.; Sun, X.W.; Lei, T.C. Effect of intercritical quenching on microstructure and tensile properties of steels 15 and 15Mn2Nb. J. Mater. Sci. 1983, 18, 2727–2731. [Google Scholar] [CrossRef]
  14. Feng, L.L.; Hu, F.; Qiao, W.W. Study on Microstructure and Properties of Low Carbon Bainitic Steel 07MnCrMoVR for Hydropower Station. Iron Steel Res. 2020, 32, 1124–1131. [Google Scholar]
  15. Zhu, J.Q.; Tan, Z.L.; Zhang, M. Effect of Vanadium and Chromium on Tempering Microstructure and Properties of Bainitic Wheel Steel. Rare Met. 2020, 44, 957–966. [Google Scholar]
  16. Andersson, J.O. Thermo-Calc and DICTRA, computational tools for materials science. Calphad 2002, 26, 273–312. [Google Scholar] [CrossRef]
  17. Guidelines for preparation, execution and evaluation of dilatometric transformation tests on iron alloys. In Stahl-Eisen-Prüfblatt (SEP), 2nd ed.; Stahldaten: Wuppertal, Germany, 1681.
  18. ASTM A1033-10, Standard Practice for Quantitative Measurement and Reporting of Hypoeutectoid Carbon and Low-Alloy Steel Phase Transformations; Committee A01 on Steel, Stainless Steel and Related Alloys; ASTM International: West Conshohocken, PA, USA, 2010.
  19. YB/T 5127-2018, Steel-Determination of Critical Point-Dilatometric Method. CN-YB, 2018. Available online: https://www.chinesestandard.net/PDF/English.aspx/YBT5127-2018 (accessed on 25 August 2021).
  20. Huang, J.B.; He, I.; Huo, J. Continuous cooling phase transformation structure of 30NiCrMoV12 high speed rail axle steel. J. Mater. Heat Treat. 2021, 42, 132–139. [Google Scholar]
  21. Jang, J.; Ju, J.; Lee, B.; Kwon, D.; Kim, W.S. Effects of microstructural change on fracture characteristics in coarse-grained heat-affected zones of QLT-processed 9% Ni steel. Mater. Sci. Eng. A Struct. Mater. Prop. Microstruct. Process. 2003, 340, 68. [Google Scholar] [CrossRef]
  22. Wu, S.J.; Sun, G.J.; Ma, Q.S.; Shen, Q.Y.; Xu, L. Influence of QLT treatment on microstructure and mechanical properties of a high nickel steel. J. Mater. Process. Technol. 2013, 213, 120–128. [Google Scholar] [CrossRef]
  23. Liang, J.T.; Zhao, Z.Z.; Liu, K. Microstructure and properties of 1300 MPa Nb micro-alloyed DH steel. J. Eng. Sci. 2021, 43, 392–399. [Google Scholar]
  24. Yu, W.T.; Li, J.; Shi, C.B.; Zhu, Q.T.; Song, H.D.; Shi, C.M. As-cast microstructure and carbides of high carbon martensitic stainless steel 8Cr13MoV steel. J. Eng. Sci. 2016, 38, 1264–1269. [Google Scholar]
  25. Sugimoto, K.; Tanino, H. Influence of Cooling Process Routes after Intercritical Annealing on Impact Toughness of Duplex Type Medium Mn Steel. Metals 2021, 11, 1143. [Google Scholar] [CrossRef]
  26. Gonzalez-Pocino, A.; Asensio-Lozano, J.; Alvarez-Antolin, F.; García-Diez, A. Evaluation of Hardness, Sliding Wear and Strength of a Hypoeutectic White Iron with 25% Cr after Heat Treatments. Metals 2021, 11, 947. [Google Scholar] [CrossRef]
  27. Marshall, D.B.; Oliver, W.C. Measurement of Interfacial Mechanical Properties in Fiber-Reinforced Ceramic Composites. J. Am. Ceram. Soc. 2010, 70, 542–548. [Google Scholar] [CrossRef]
Figure 1. Heat treatment process.
Metals 11 01562 g001
Figure 2. Heating process diagram.
Metals 11 01562 g002
Figure 3. Process diagram (a) first group test; (b) second group test.
Metals 11 01562 g003
Figure 4. Equilibrium precipitates in SXQ500/550DZ35 steel.
Metals 11 01562 g004
Figure 5. The composition of austenitic phase elements in the experimental steel.
Metals 11 01562 g005
Figure 6. Austenite grain morphology of the hot-rolled specimens at different heating temperatures (a) 850 °C; (b) 870 °C; (c) 920 °C; (d) 970 °C; (e) 1020 °C; (f) 1070 °C.
Metals 11 01562 g006
Figure 7. Austenite grain growth curve of the rolled specimens.
Metals 11 01562 g007
Figure 8. Metallographic microstructure of the rolled specimens at different cooling rates (a) original microstructure; (b) 0.05 °C·s−1; (c) 0.1 °C·s−1; (d) 0.6 °C·s−1; (e) 1 °C·s−1; (f) 2 °C·s−1; (g) 3 °C·s−1; (h) 5 °C·s−1; (i) 10 °C·s−1; (j) 35 °C·s−1; (k) 50 °C·s−1.
Metals 11 01562 g008
Figure 9. SEM morphology of the rolled specimens at different cooling rates (a) original microstructure; (b) 0.05 °C·s−1; (c) 0.1 °C·s−1; (d) 2 °C·s−1; (e) 10 °C·s−1; (f) 50 °C·s−1.
Metals 11 01562 g009
Figure 10. Microstructures of the quenched specimens at different cooling rates (a) original microstructure; (b) 0.05 °C·s−1; (c) 0.1 °C·s−1; (d) 0.6 °C·s−1; (e) 1 °C·s−1; (f) 2 °C·s−1; (g) 3 °C·s−1; (h) 5 °C·s−1; (i) 10 °C·s−1; (j) 35 °C·s−1; (k) 50 °C·s−1.
Metals 11 01562 g010
Figure 11. SEM morphology of the quenched specimens at different cooling rates (a) original microstructure; (b) 0.05 °C·s−1; (c) 0.1 °C·s−1; (d) 2 °C·s−1; (e) 10 °C·s−1; (f) 50 °C·s−1.
Metals 11 01562 g011
Figure 12. Hardness of the rolled and quenched specimens at different cooling rates.
Metals 11 01562 g012
Figure 13. CCT curve of single-phase region.
Metals 11 01562 g013
Figure 14. CCT curve in intercritical heat treatment process.
Metals 11 01562 g014
Table 1. The chemical composition of the tested steel (wt%).
CSiMnPSVTiAlsO
0.110.121.180.0090.0010.0420.0040.0190.0015
CrMoNbNiCuBNAs-
0.5060.3860.0351.3800.0200.00130.00580.017-
Table 2. Microstructure types and hardness values of the specimens under different cooling rates.
Cold Speed/°C·s−1First GroupHardnessSecond GroupHardness
aoriginal microstructureF + GB + P244GB + LB240
b0.05F + P + GB227F + P + GB232
c0.1GB + F + P233GB + F + P262
d0.6GB + F + LBless256GB + F305
e1GB + LB278GB + F307
f2GB + LB309GB + LB + F325
g3GB + LB328GB + LB + F324
h5LB + Mless345LB + Mless + F344
i10M + LBless387M + LBless + F405
j35M + A’448M + A’ + F456
k50M + A’422M + A’ + F454
Table 3. The phase transition points of the specimens after austenitizing at 920 °C.
Cold Speed/°C·s−1Fs/°CFf/°CPs/°CPf/°CBs/°CBf/°CMs/°CMf/°C
0.05721-623-535390--
0.1699-608-552404--
0.6----571402--
1----574403--
2----556386--
3----546370--
5----530--337
10----512--289
35------435267
50------413265
Note: Fs, Ps, Bs, Ms: start temperature; Ff, Pf, Bf, Mf: finish temperature.
Table 4. The phase transition points of the different specimens heated at 830 °C.
Cold Speed/°C·s−1Fs/°CFf/°CPs/°CPf/°CBs/°CBf/°CMs/°CMf/°C
0.05707-631-524365--
0.1695-628-540382--
0.6691-624-538370--
1----571390--
2----559371--
3----551336--
5----539332--
10----497--302
35------421277
50------407265
Publisher’s Note: MDPI stays neutral with regard to jurisdictional claims in published maps and institutional affiliations.

