Article

Comparison of Properties and Bead Geometry in MIG and CMT Single Layer Samples for WAAM Applications

Faculty of Computing, Engineering and Built Environment, Ulster University, Londonderry BT48 7JL, UK
*
Author to whom correspondence should be addressed.
Metals 2021, 11(10), 1530; https://doi.org/10.3390/met11101530
Submission received: 2 September 2021 / Revised: 18 September 2021 / Accepted: 20 September 2021 / Published: 26 September 2021
(This article belongs to the Topic Additive Manufacturing)

Abstract

:
The process of Wire Arc Additive Manufacturing (WAAM) utilizes arc welding technology to fabricate metallic components by depositing material in a selective layered fashion. Several welding processes exist that can achieve this layered deposition strategy. Gas Metal Arc Welding (GMAW) derived processes are commonly favored for their high deposition rates (1–4 kg/h) and minimal torch reorientation required during deposition. A range of GMAW processes are available; all of which have different material transfer modes and thermal energy input ranges and the resultant metallic structures formed from these processes can vary in their mechanical properties and morphology. This work will investigate single-layer deposition and vary the process parameters and process mode to observe responses in mechanical properties, bead geometry and deposition rate. The process modes selected for this study were GMAW derived process of Metal Inert Gas (MIG) and Cold Metal Transfer (CMT). Characterization of parameter sets revealed relationships between torch travel speeds, wire feed speeds and the specimen properties and proportions. Differences were observed in the cross-sectional bead geometry and deposition rates when comparing MIG and CMT samples though the influence of process mode on mechanical properties was less significant compared to process parameter selection.

1. Introduction

The use of WAAM for metals is attracting attention from researchers and the industry for its potential productivity associated with its highly efficient material utilization, energy consumption and high deposition rates when compared to powder-fed additive manufacturing techniques [1]. GMAW based WAAM has the potential to obtain the highest material deposition rates (1–4 kg/h) whilst maintaining geometric accuracy of approx. 2 mm minimum feature size and minimal presence of defects. The process may also require post-deposition machining in order to create functional surfaces [2,3,4,5]. A variety of GMAW derived processes are available from welding equipment manufacturers, providing a range of techniques to control thermal energy inputs and minimize undesirable process defects such as, spatter and loss of melt pool stability during deposition. Williams et al. summarized that for engineering applications WAAM methods must offer competitive mechanical properties to conventional manufacturing processes, high deposition rates and high material utilization regarding buy-to-fly ratios [5]. To achieve higher productivity and reduce the time required for post-deposition machining, the deposition envelopes (volume of material needed + volume of material in overbuild condition) must be as close as possible to the final product geometry required for machined components. Willliams et al. found that this deposition envelope can be as close as 0.5 mm for steel components fabricated using CMT [5].
Observing the influence of process parameters on the process outputs can assist in characterizing the mechanical properties and accuracy of components fabricated using WAAM. Yilmaz et al. outlined four key control parameters that have the largest influence on the quality of components fabricated from Wire Feed Metal Additive Manufacturing (AM) processes [6]:
  • Current
  • Wire feed speed (Wfs)
  • Travel speed (Ts)
  • Layer height
Geometry and property control of WAAM fabricated structures has also been documented by Rodrigues et al. to have a large dependence on changes to the heat input and travel speeds. Changes to these factors can influence both the cross-sectional bead geometry, as well as affecting the cooling rates, with slower travel speeds increasing the heat input, cooling times and mass of material being deposited [7]. In overbuild conditions where excess material must be removed, it is necessary to generate enough surplus material to ensure that the final part dimensions can be met. This requires a combination of minimal surface waviness and a consistent, effective wall thickness [8]. In these overbuild conditions, changes to the as-deposited geometry from alterations to travel speeds can, therefore, greatly influence the deposition envelope and the amount of post-processing waste generated from machining. Yildiz et al. also demonstrated the capacity for travel speeds and wire feed speeds to not only influence bead geometry but properties of High Strength Low Alloy (HSLA) steel deposits via changes to the calculated heat input as a function of travel speed, current and voltage. In their work, it was found that the heat input and hardness values measured upward from the substrate surface of samples were inversely proportional to each other in single-layer bead-on-plate depositions due to changes to the volume fraction of microstructural compositions [9]. Changes to the heat input in WAAM can impact the microstructure of components and consequently their properties, as well as the formation of defects, such as distortion. Liberini et al. concluded that the ability for parameter changes to limit the presence of defects within WAAM fabricated components was hampered by the cyclic heating and cooling that structures experience during deposition leading to inconsistent microstructures resulting unpredictable properties [10]. However, a multitude of studies have investigated the use of post deposition heat treatment or modified GMAW process modes as a means of creating the desired properties of components using WAAM [1,11,12]. Brandl et al. demonstrated the capacity for parts to be generated with comparable ultimate tensile strength to that of wrought material in the as-deposited state indicating the capability of WAAM to compete with conventional manufacturing methods [13]. Balancing the desired properties and control of bead geometry must also be considered as changes to process parameters can influence heat inputs and therefore result in changes to the surface waviness of and deposition bead shape and size [14].
The cross-section profiles of components fabricated via WAAM are comprised of the bead geometry of sequentially deposited individual layers. Features such as, bead width and bead height, govern the dimensions of the as-deposited net shape. Single-layer deposition beads can therefore be considered unit cells of WAAM structures, with the desired component geometry contained within an overbuilt bead of material, illustrated by Figure 1.
Single-layer deposition also has a multitude of use cases for other AM scenarios such as grid stiffening structures, cladding and hard-facing operations [15,16,17]. Analysis of single-layer deposition can give insight into the mechanical properties of structures fabricated using WAAM and can assist in the selection of processes and parameters employed for geometry and property control.
Welding processes that offer both the high deposition rates of GMAW and management of the thermal energy inputs will allow for more desirable and accurate WAAM deposition conditions whilst maintaining competitive methods for the fabrication of metal structures [6,18]. Two GMAW formats were reviewed in this study to obtain a comparison between conventional GMAW and modified processes, which have a greater degree of control over their deposition conditions:
  • GMAW-MIG—commonly known as “MIG” welding, which uses a metal filler wire as a consumable electrode and continuously feeds from a welding torch which provides a local shielding gas supply to the weld and surrounding component. Material transfer in this process mode can occur in multiple formats; short-circuiting, spray transfer and globular transfer [18].
  • GMAW-Cold Metal Transfer (CMT)—a GMAW derived process that utilizes controlled short circuit transfer and reciprocating wire feeding to minimize heat inputs and assist in molten droplet transfer from filler material to melt pool [18].
This difference in process characteristics can produce distinct responses from the deposited materials. When further process modifications such as arc pulsing are applied visible responses from materials can be seen such as grain refinement and defect mitigation, in the as-deposited state of Aluminum alloy [19,20,21].
In the case of steels, for a given alloy composition, the cooling rate is the primary factor that dictates the formation of its microstructures. For welded steels the cooling rate is typically measured as the time between 800–500 °C (Dt8/5) as this is the range where a weld and its Heat-Affected-Zone form most of the microstructural characteristics. Bhadeshia and Honeycombe stated that the peak temperature and the Dt8/5 time both increase with increasing heat input for a weld. Heat input can be calculated as an estimated value to assist in the analysis of post-deposition microstructures and mechanical properties. In steel weld metal a mixture of microstructures can manifest in the solidified material, typically these are comprised of allotriomorphic ferrite, widmanstatten ferrite, acicular ferrite and bainite with degenerate pearlite and martensite [22]. These microstructures form as solid-state transformations from the cooling of austenite. Each of these morphologies can present differing properties and form over a range of temperatures upon cooling, beginning from approximately 800 °C [23]. The calculated heat input and cooling rate can be used as reference values and can be compared against hardness values to characterize the formation of the microstructures in the weld metal. Yildiz et al. found that for WAAM-fabricated ER120S-G steel the formation of martensite and bainite was more prominent in samples produced at low heat inputs (339 J/mm) with the highest proportion of martensite found in single-layer samples producing average hardness values of 400–450 Hv. Hardness values then decreased with increasing volume fractions of bainite and ferrite content to 340–370 Hv at higher heat inputs (500–620 J/mm) [9].
Values obtained from the existing literature, which used steel welding wires, formed the basis for the selection of parameter ranges in this work [9,10,15,24,25]. It was found that in WAAM fabrication of steel components, the ranges of parameters had been used, but specific characterization and comparison of the process modes and processing parameters and their influence on component properties and geometry was limited. This work will seek to characterize process modes of MIG and CMT through a range of processing parameters and review responses from these changes in specimen hardness, geometry, geometric consistency, and deposition rates, as well as review the influence of the process modes on these response variables. Process reliability will be established by comparing the standard error of repeated runs through each parameter set for hardness and geometry measurements.

2. Materials and Methods

Test specimens were fabricated using a Fronius TPS400i power (Fronius International, Wels, Austria) source using the onboard MIG/MAG standard and CMT process cycles in 2-step mode and a shielding gas mixture of 93% Ar, 5% CO2, 2% O2. The motion was provided from a KUKA KR16HW robotic arm (KUKA, Augsburg, Germany), and toolpath generation was carried out using point-to-point programming on the KUKA teaching pendant. The feedstock material used was 1.2 mm diameter ER70S-6 mild steel welding wire and deposited onto EN3B bright mild steel substrates with dimensions 100 × 25 × 10 mm (L × W × D) (chemical compositions are listed in Table 1). Substrates were prepared using 80 grit sandpaper to remove surface contaminants and cleaned using acetone. Deposition beads that were 90mm long were fabricated for each sample (see Figure 2) to allow for overbuilt material at the ends of the toolpath. Each parameter set was repeated 3 times to allow for calculations of error and variance in the results obtained. A 10 mm section was cut from the center of each sample to capture measurements from the steady-state region of the deposition bead.
The weights of samples were recorded before and after deposition to track each process’s deposition mass across the range of parameter sets. Travel speed and wire feed speed settings from the literature were also varied across a range of TS/WFS ratios in a preliminary testing criterion, which maintained the lowest machine setting of WFS at 1.5 m/min and increased the TS until deposition beads became too unstable for continuous deposition. This then identified the ranges within which this work could be undertaken for single-layer deposition. The parameter sets used in this study were repeated in MIG and CMT settings to obtain a comparison of the process modes and are outlined in Table 2. Heat Inputs (HI) and cooling times were then calculated based on the machine parameters combined with the respective process efficiency values obtained from the literature [26].

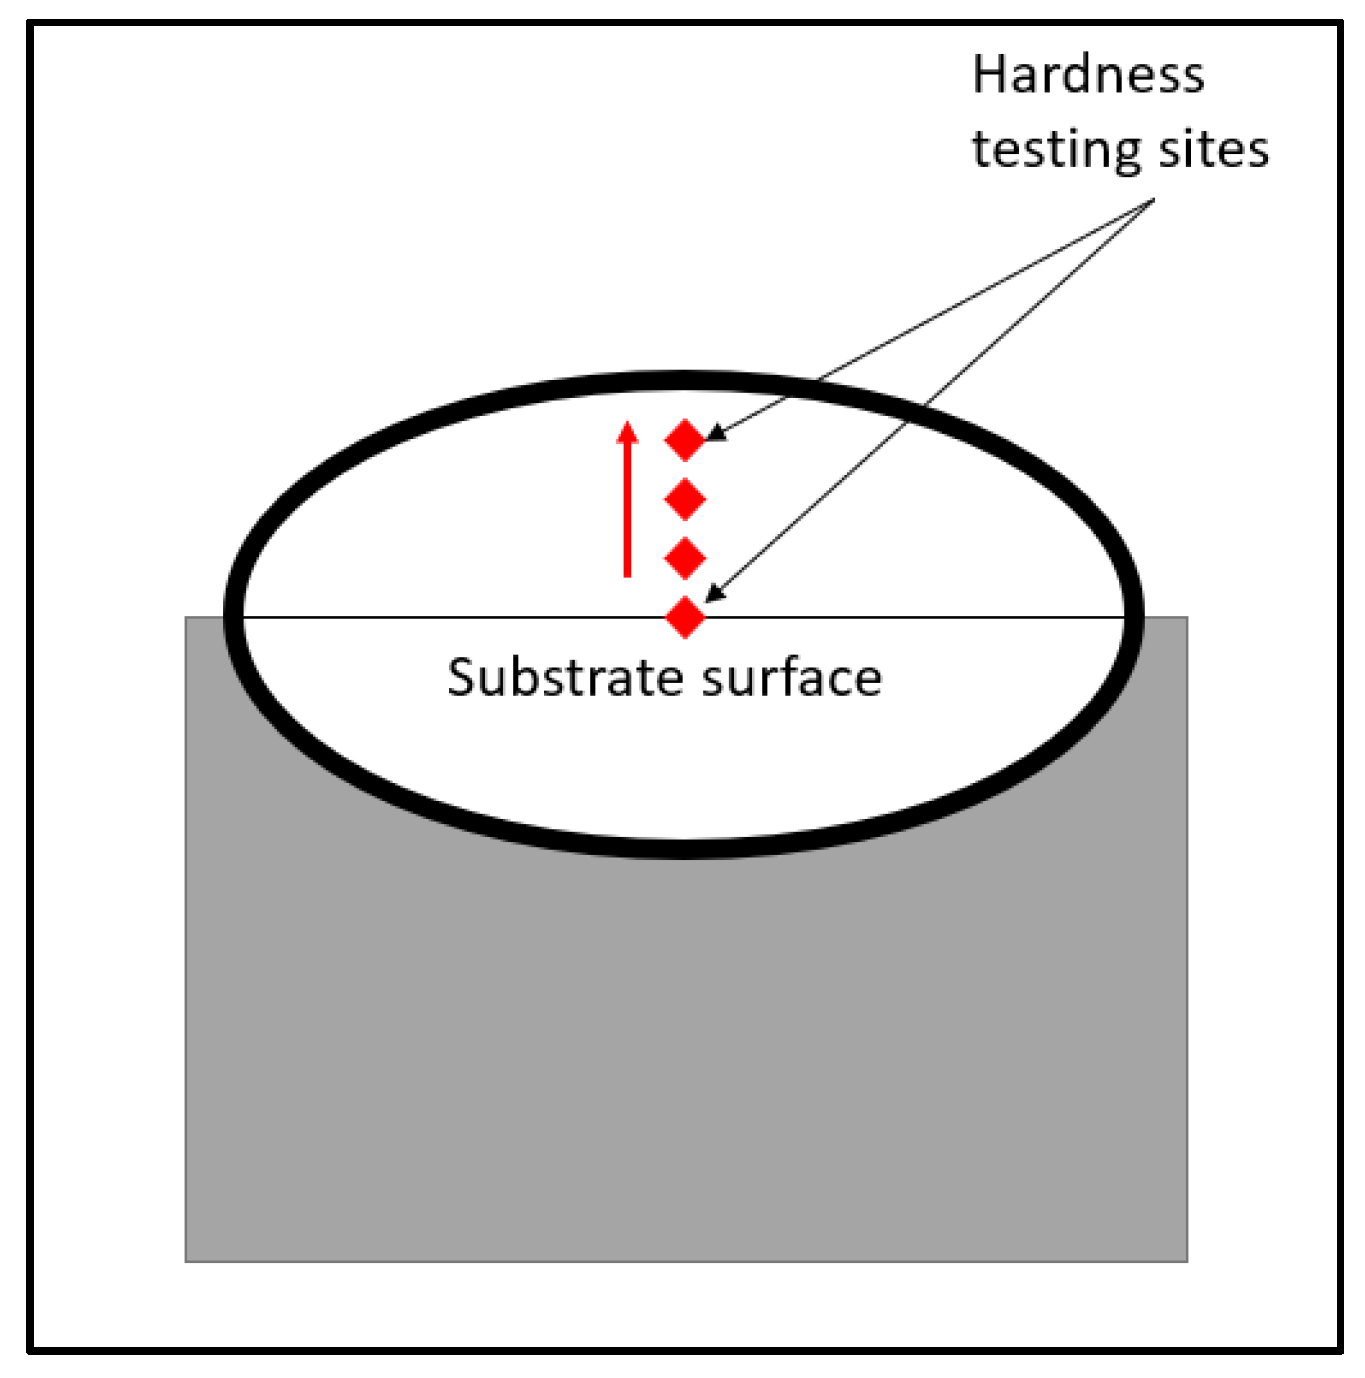
2.1. Microhardness Characterization

Microhardness and macroscopic imaging specimens were sectioned by cutting a 10 mm piece from the center of the deposition samples using an AMT brilliant 220 rotary blade saw. Specimens were then mounted and polished to perform Vickers low force microhardness testing. Hardness testing was performed using 500 g force applied for 10 s with test sites beginning at 0 mm from the substrate surface and a pitch distance of 0.25 mm between indentation locations (see Figure 3). Test parameters were selected to ensure diagonal indentation dimensions always remained larger than 0.02 mm as per the standard (ISO 6507-1) [27]. This data was then used to compare the effect of thermal energy input on deposition beads and document the variance of the mechanical properties throughout specimens with respect to both process mode and parameter settings. To assist in characterization of parameter sets, a calculated value for heat input has been adapted from BS EN 1011-1:1998 (see Equation (1)) [28].
Q = k ((U × I)/v)
where Q is the energy input in J/mm, I is welding current, U is voltage and v is welding speed. K represents the coefficient of process efficiency, which for MIG welding values are stated at 0.8 for this factor. Due to the difference in process cycles, CMT operates with lower thermal energy input, however the efficiency of the CMT process stated by Pepe et al. was found to be 3% higher than that of pulsed GMAW [26].
BS EN 1011-2 provides an equation for calculating the cooling time Dt8/5 in three-dimensional heat flow for bead-on-plate depositions (see Equation (2)) [29].
Dt8/5 = (6700 − 5 T0) × Q × (1/(500 − T0) − 1/(800 − T0)) × F3
where T0 is the preheating temperature and F3 is the three-dimensional shape factor, in the case of this study the shape factor is 1 as suggested for a bead on plate welds in BS EN 1011-2.

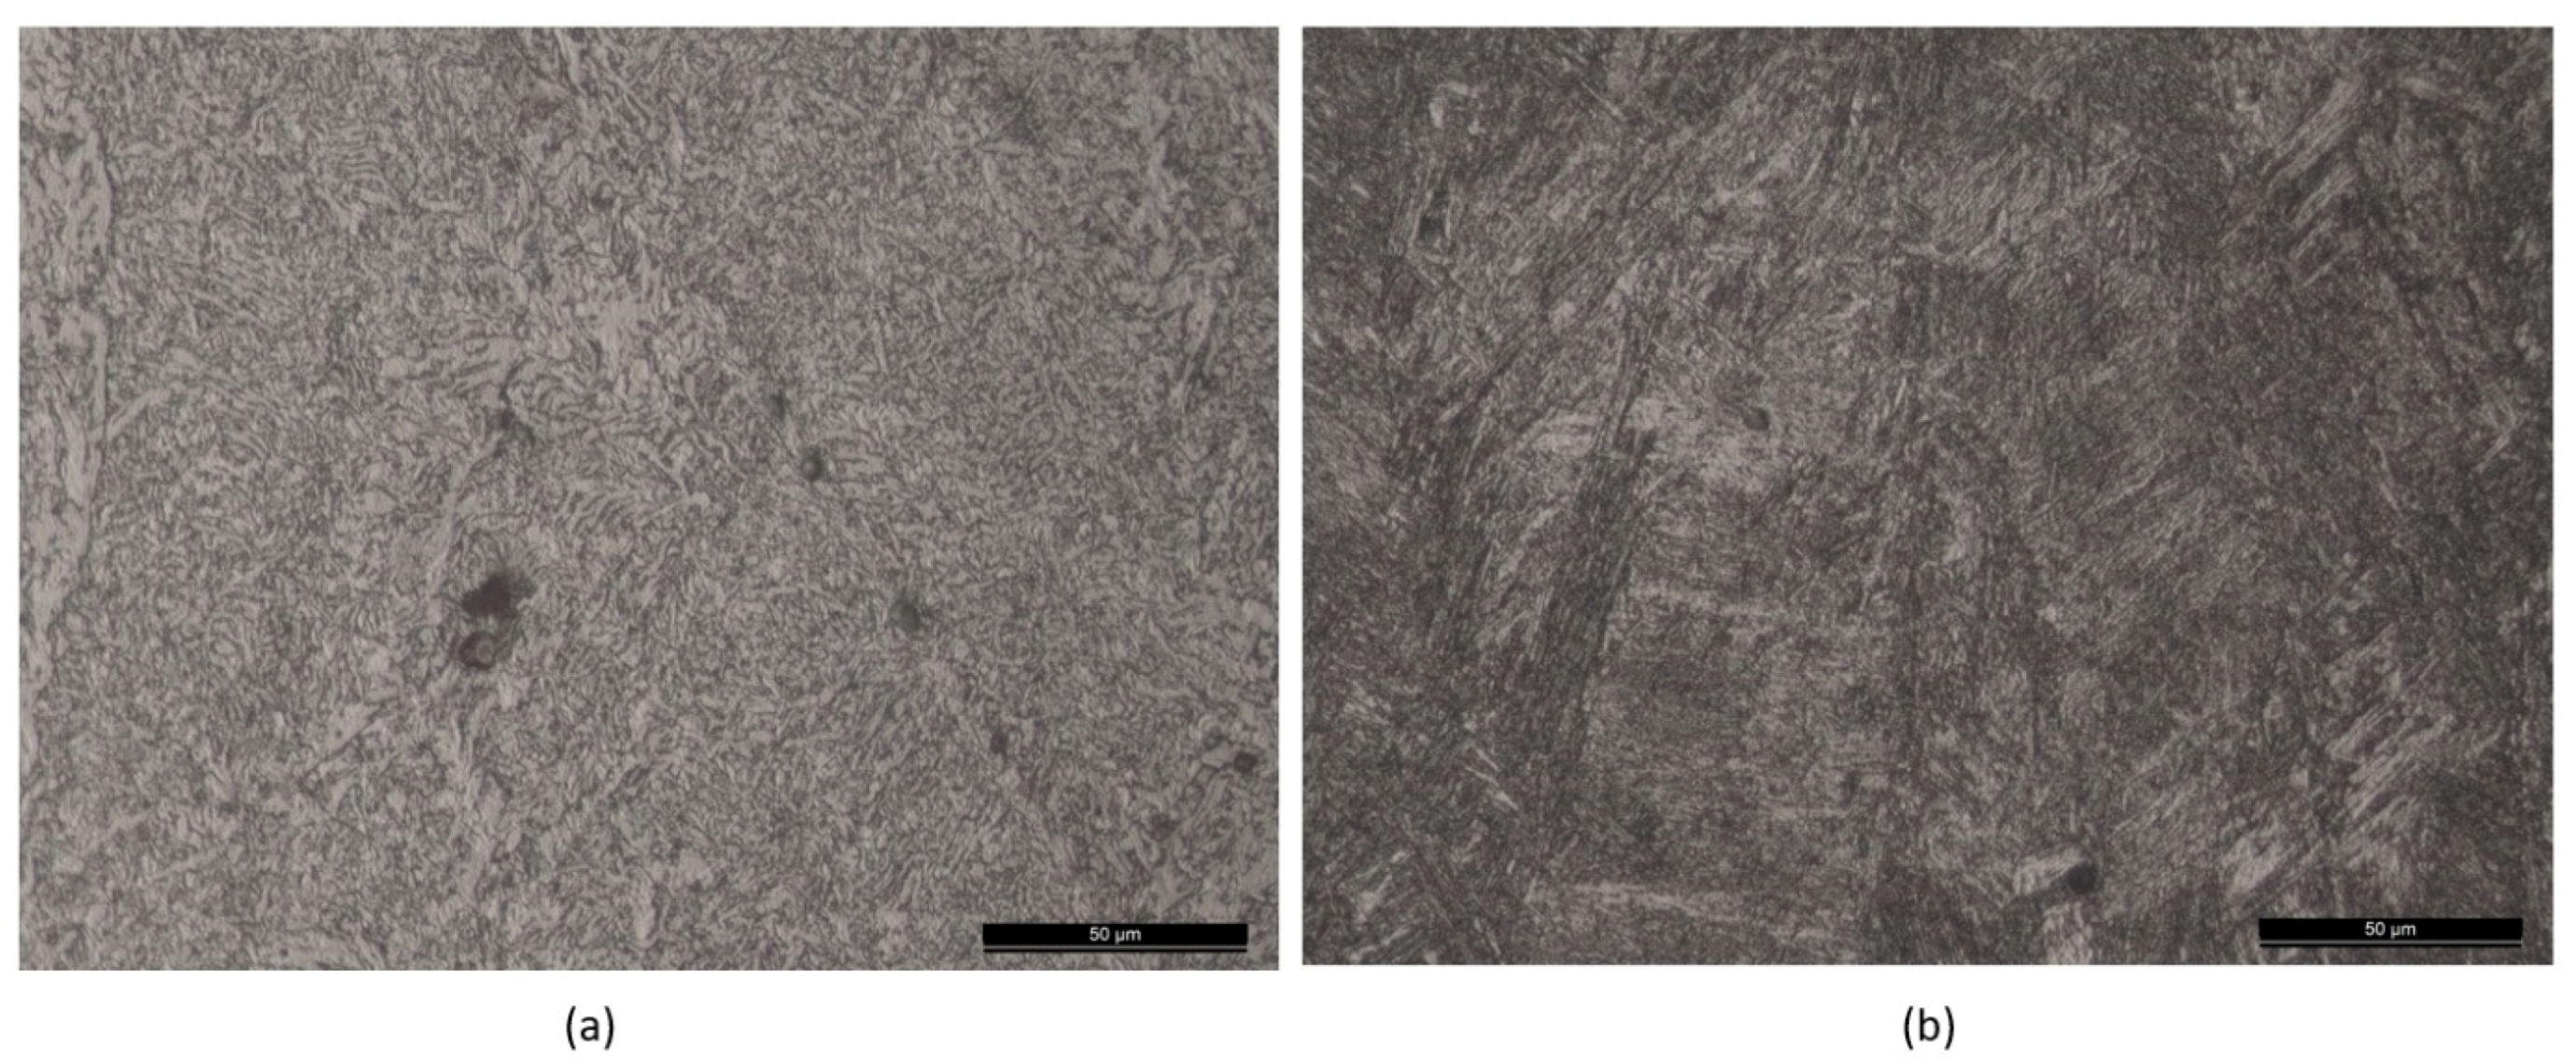
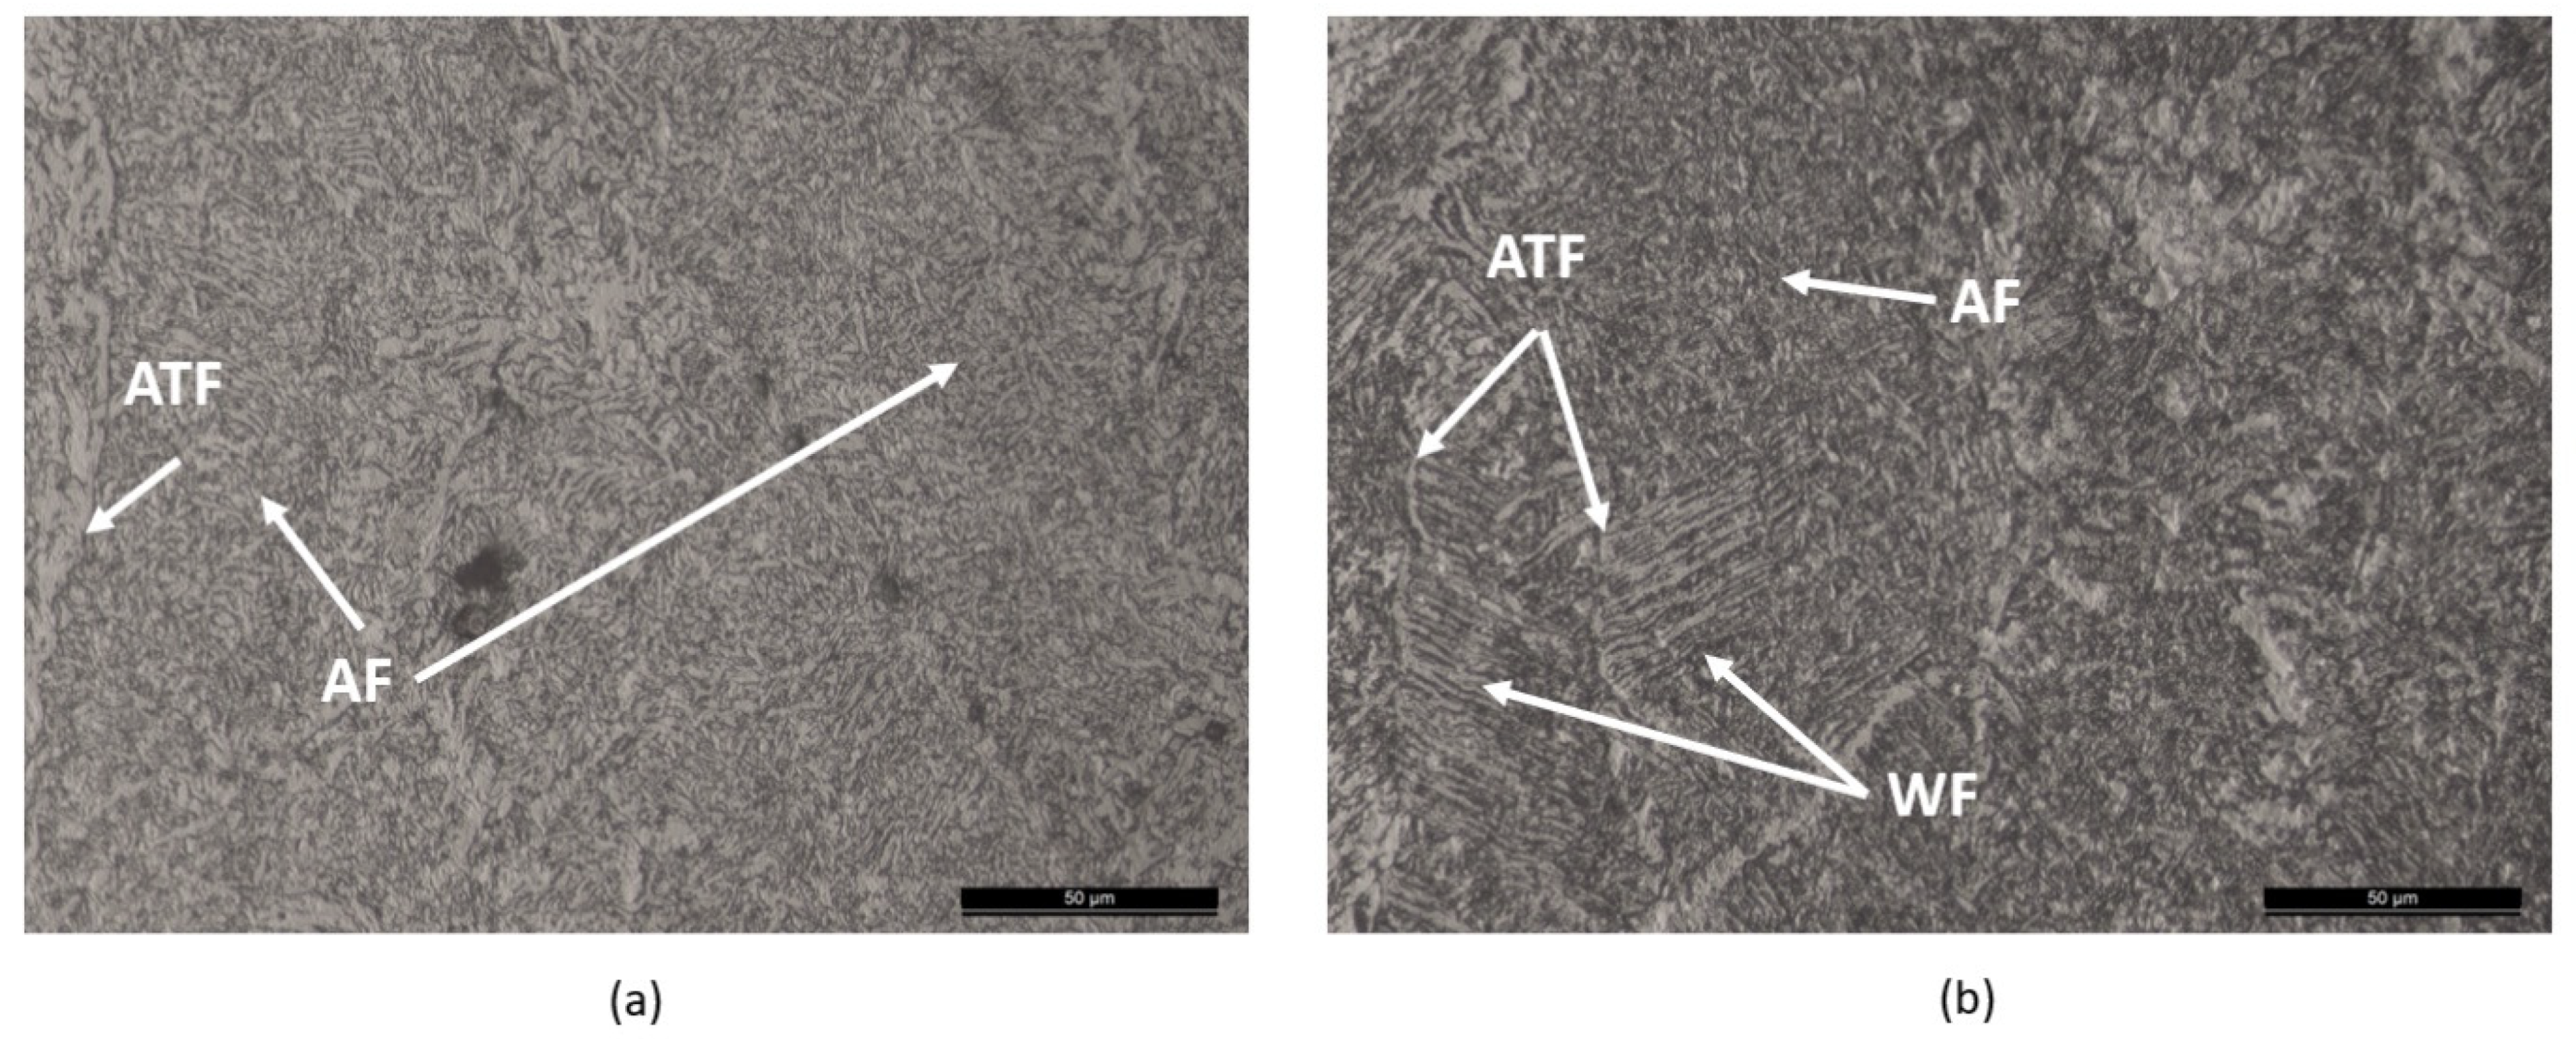
2.2. Microstructural Analysis

Mounted specimens were etched by swabbing 10% nital etchant on the polished metal surface for 25 s, and measurements of the deposition beads were taken using a Leica DMI8 microscope (Leica, Wetzlar, Germany). The dimensions were measured according to Figure 4. Sample bead height, bead width and penetration depth were used to compare the reliability and influence of process modes across the range of parameters stated in Table 2. The specimens were measured by taking an etched cross-section of a deposition sample and measuring the weld beads height, width, and penetration depth from the substrate surface (see Figure 4) [30].
Masses of the test samples were measured using digital scales before and after deposition to compare relative deposition rates of each processing mode for further comparison.

3. Results

3.1. Microhardness

The results from specimens across the parameter sets show the hardness values (Hv) respond to the calculated values of HI in each parameter set with inverse proportionality. This can be observed in Figure 4 in both CMT and MIG samples, where the lowest and highest hardness values correspond to samples with maximum and minimum HI values, respectively.
The influence of parameter settings on the hardness values seen in test samples was more pronounced than that of process mode alterations between CMT and MIG. Regardless of the process selection, the parameters had a similar influence on the hardness values between both CMT and MIG sample sets. This suggests that the overall influence of parameter selection will be greater than that of process mode and should be considered when seeking specific properties and microstructures within components in their as-deposited state.
Microhardness results were on average lower across the range of parameter settings in CMT mode by 1.65%. Ranges between the maximum and minimum hardness values obtained between process modes showed that MIG samples had a smaller max at 395 Hv compared to CMT with 402 Hv, with MIG also having a lower overall range in hardness values of 159 Hv compared to 170 Hv of CMT samples displayed in Figure 5. CMT samples had 1.65% lower Hv at the highest heat input setting with 232 Hv. When comparing hardness values against the calculated heat inputs of each processing mode it was found that increasing the thermal input by a factor of 9.6 resulted in a reduction of hardness values by a factor of 1.7 and 1.6 for CMT and MIG processes, respectively.
Table 3 provides the distribution analysis of the hardness values obtained from both process modes. The divergence in hardness value trendlines seen in Figure 5 suggests that with increasing heat input, the selection of the processing mode will have a larger influence than at lower heat inputs due to higher levels of dilution also occurring within the melt pool. The MIG process had an average of 3% more dilution when compared to CMT across all parameter sets with larger dilution values residing higher in the heat input range.
With less dilution of substrate alloying content occurring combined with the additional heat input from higher process efficiency CMT will cause slower cooling resulting in a softer hardness value in samples at the higher end of the heat input range. These findings also suggest that the process efficiency factor will have a greater influence at higher heat inputs resulting in more thermal energy transmitted to the deposition material [26]. Prado-Cerqueira et al. found similar responses from multilayer samples fabricated with ER70S-6 with CMT having lower hardness values than MIG samples in comparison using the same process parameters across both process modes [15].
Micrographs revealed that samples formed from both CMT and MIG had similar microstructural components, with the proportion of acicular ferrite increasing from low to high heat inputs in both process modes. This difference in microstructures between high and low heat inputs can be seen in Figure 6 which were taken from within the deposition area of the samples 2A4 and 2D1. In lower heat input samples, packets of a plate-like morphology can be seen in Figure 6b with minimal allotriomorphic ferrite decorating the austenite grain boundaries resembling the formation of bainite plates resulting in a harder microstructure [22,31]. Hardness values of the lowest heat input settings concur with those seen in the literature in the region of approx. 400 Hv, associated with an increasing presence of martensite and bainite [9,32]. Figure 7b also shows the presence of widmanstatten ferrite in the MIG high heat input (2/3A4) samples, though similar microstructures were also observed in CMT samples of the same parameter set.
Standard error measurements from parameter set repetitions were used to quantify the process reliability regarding microhardness values. It was found that, on average, across the ranges of parameters, hardness values for samples fabricated using the MIG process had 11.5% lower standard error values, meaning that the process was producing more repeatable hardness results when compared to CMT. Individual parameter sets arranged in order of increasing Ts revealed hardness value standard error was lower in samples at higher travel speeds for both MIG and CMT, suggesting that higher travel speeds for a given wire feed speed would minimize variance between builds in hardness values.
Figure 8 shows the cross-sectional dimensions of the CMT and MIG specimens and the distribution of the measurements across all parameter sets for each processing mode. These are used to compare the differences in process mode-driven bead characteristics on sample cross sections. Both process modes exhibited similar responses to changes to parameter settings with regards to the dimensions of sample cross sections.
Figure 9 displays the influence of process parameters for each of the bead dimensions and can be used to observe the relationship between bead geometry and process parameter changes.
As expected, proportionality was observed between increasing sample dimensions and the ratio of the Wfs/Ts due to a greater volume of material is being deposited per unit length. Figure 9 also shows all cross-sectional measurements responding in a similar manner to the changes in this ratio. A major deviation at the Wfs/Ts ratio of four can be seen between the two data points at this ratio from both MIG and CMT specimens across all cross-sectional dimensions. This was due to different input current parameters causing changes to the size of the melt pool forming on the surface of the substrate affecting the wetting of the material.
The distribution of the individual specimen dimensions showed that CMT had, on average, larger cross-sectional profile measurements for bead width, bead height and penetration depth by 8.4%, 3.5% and 6.4%, respectively. CMT also had a lower a standard error in the results for bead width and penetration depth by 3.8% and 15.3% on average across the parameter sets. The process did, however, have a higher average standard error value for bead height by 29.9% when compared to MIG samples.
Trends were observed with the average standard error per parameter set (grouped by Ts and arranged in order of ascending Wfs) in CMT samples for both the specimen bead height and penetration depth. Standard error measurements exhibited a positive trend with increasing wire feed speeds, as shown in Figure 10. This shows that operating at lower wire feed speeds can be employed to minimize deviations in bead geometry by a factor of 3.37 and 3.53 for deposition bead height and penetration depth, respectively.
The cross-section of depositions at higher heat inputs in both process modes showed a distinct difference in the shape of the penetration area seen in Figure 11, with a large deposition area overflowing onto a substantially smaller penetration area in CMT samples. Though not exclusive to the CMT process, this profile was sustained across a majority of the CMT specimens in this study, with only the MIG process displaying a similar profile in samples with lower current values.
The ratio of Wfs/Ts also displayed a correlation with the individual and total cross-sectional areas of the samples produced from each processing mode. Both process modes showed near-linear relationships with increasing deposition areas and Wfs/Ts ratios. A higher level of variance was observed in the penetration area measurements, clearly seen at Wfs/Ts ratios of four in Figure 9. The deviations at these ratios were related to a reduction in the current values to 78A. When compared to datapoints for the Wfs/Ts ratio of 2.67, which also had this current value penetration area, the measurements showed similar variance results, which increased with the amperage in both process modes seen in Figure 12. Kou compared the influence of welding current in GMAW and penetration depth and found that penetration depth responded with approximately and additional 1 mm per 100 A in mild steel [33].
The trendlines plotted for penetration area measurements in Figure 12 showed an increasing composition of the total cross-section comprised of the penetration area for MIG specimens, with this composition surpassing CMT samples in equivalent parameter settings.
The characteristics of the CMT process presented in the literature can also be illustrated with the difference in the deposition area measurements and their respective trendlines. Zhang and Xue described the formation of CMT bead profiles having a larger deposition area than the penetration area due to the lower current values associated with the process cycle [34]. Comparing the proportions of the total area in both process modes, it was found that MIG samples had an average of 3% more of their cross-section comprised of the penetration area, which would also result in a higher amount of dilution occurring in the samples fabricated in this process mode.
Average standard error values across all parameter sets for the respective deposition areas of each processing mode had similar area error values of 0.145 and 0.146 for CMT and MIG, respectively. A larger level of disparity in error values was observed in the penetration areas of samples with 0.103 for CMT and 0.124 for MIG specimens.

3.2. Deposition Mass

The deposition masses of processes were compared across all parameter settings. The mass deposited between the process modes in this study was, on average greater for the MIG process by 9.8%. CMT samples had lower maximum values for the mass of material deposited per 90 mm bead of 9.83 g compared to 11.26 g of equivalent parameter MIG samples, as seen in Figure 13. The lower minimum value obtained from the MIG samples was associated with the inability of this process mode to generate a consistent weld bead which failed in multiple preliminary trials at Wfs and Ts values of 2.00 m/min and 1.25 m/min. The CMT process, however, had a 21.6% lower average standard error regarding mass deposited compared to MIG across all parameter settings, demonstrating a higher level of control over mass transfer. This was attributed to the differences in wire feeding motion control and the inability of the MIG process to sustain reliable deposition at high Ts and low Wfs, with the CMT mode also having the capacity to deposit over a greater range of parameter settings.

4. Discussion

The selection of process parameters has been demonstrated to have a significant influence on the bead geometry and shape, as indicated from previous work in WAAM fabrication of steel components using GMAW processes. The influence of process mode is more subtle, with the most significant differences found in the repeatability, size, and shape of the bead geometry where CMT has the capacity to produce more volume of material in the deposition area per unit mass deposited with more consistent bead width and penetration depth. This benefits the use of CMT in the layered deposition as a more consistent bead geometry can result in higher accuracy of the deposition envelope and potentially minimize the amount of overbuilt material required in generating near net shape preforms to be machined.
The influence of process parameters on the hardness values corresponds to the findings of the literature of solidification of steels through continuous cooling for similar alloy mixtures [9,23,24]. Differences in the applied heat inputs through both process modes affected the final cooling rates resulting in the range of properties observed. Higher hardness values were associated with more rapid cooling rates by consequence of lower thermal energy input for a given set of parameters, with the substrate material acting as a heat sink during the deposition process [35]. Microstructural images taken from both MIG and CMT samples revealed similar microstructural components for samples of the same parameter settings for Wfs and Ts.
In parameter sets where higher heat inputs were applied, the CMT process exhibited softer microstructures. This has also been documented in the literature by Prado cequeria et al. in multilayer samples; however, the influence of dilution is more prominent in the first layer. Due to this, properties within the first layer of samples are influenced by a combination of the cooling rate as a function of heat input and the alloy composition changes due to differences in the feedstock alloy content. In a preliminary study where S275JR steel substrates were also used specimens produced with EN3B substrates exhibited hardness values approx. 10 Hv higher showing that the selection of substrate material can significantly influence the hardness in single- and first-layer deposition. In sample sets where lower thermal energy inputs were applied, the penetration profile of the bead was similar in both CMT and MIG with less divergence in the hardness values between process modes. This resulted in the influence of cooling having a greater effect on the properties than changes to the alloy composition via dilution [36]. For components fabricated where the substrate forms part of the final product, it is necessary to consider the formation of properties in the first-layer deposition due to the variance from the cyclic nature of heat applied during WAAM. It is known that a gradation of properties can occur in steels due to the thermal accumulation as successive layers are deposited [23]. In other instances, it may be required to form a weaker bond with the substrate in order to aid in releasing the part after deposition. This can give insight towards process planning and compensation for variance in properties during multilayer deposition. This work has revealed that process parameters can greatly influence first layer properties, and therefore, consideration must be given to planing for the desired properties throughout the build sequence.
The hardness values from existing work in the field have been observed to respond to differences in heat inputs, and consequently, cooling rates by changes to the composition of the microstructures of WAAM fabricated steels. Wang et al. found that Hv values appreciated with increasing cooling rate from of acicular ferrite forming at a lower temperature with dislocation density increasing [37]. Yildiz also commented on the changes from low to high heat input with decreasing volume fraction of bainitic and martensitic microstructural components and replaced by acicular ferrite [9]. Changes to the hardness due to the grain size have also been observed in the literature. Muda et al. noted grain size is connected to the hardness values of steel structures, with fine grain structures produced from lower heat inputs being associated with higher hardness values due to the larger density of grain boundaries and dislocations available to resist deformation [38].
The hardness and tensile characteristics of a material are also linked, and this relationship can be considered as an approximate ratio where the Vickers hardness value is approx. 0.33 times that of the material’s yield strength [39]. Rodrigues et al. noted that the increase in the presence of bainite in sample sets with lower heat inputs generated higher tensile strengths and lower ductility of HSLA multilayer WAAM fabricated steels. Bhadeshia summarized that the volume fraction of bainite for a given steel weld would decrease with higher heat inputs and subsequently be replaced by acicular and widmanstatten ferrite in the Heat-Affected-Zone (HAZ) [40]. Bhadeshia also stated that the proportion of bainite to acicular ferrite could be altered by the austenite grain size and presence of allotriomorphic ferrite with acicular morphologies favoring larger grain sizes and higher amounts of allotriomorphic ferrite [22]. Images taken at higher magnifications in both high and low-HI samples for CMT reveal a visibly larger proportion of microstructural components of allotriomorphic ferrite and intragranular nucleated acicular ferrite in high-HI specimens (Figure 10). Specimens created with lower heat inputs revealed plate-like packets and much finer microstructural compositions contributing to the higher hardness values obtained from these components.
Within the WAAM literature it is known that the deposition rates between GMAW variants can be in the order of kg/h. Wu et al. summarized that CMT and MIG processes had a difference in their peak deposition rates of 1–2 kg/h with CMT having typical rates of 2–3 kg/h and MIG having rates of 3–4 kg/h [2]. Quantifying these processes by only the factor of deposition rate can be misleading as demonstrated with the CMT specimens having on average a larger bead width when compared to MIG counterparts. As stated previously, in this work, the effective area of a deposition will influence the final component envelope size and deposition accuracy, as well as the amount of machining necessary to remove overbuilt material. The ability of CMT to provide, on average, larger and more reliable deposition in terms of bead width and penetration depth make it an attractive option regarding final component geometry. The lower values of standard error in the bead width will result in a lower susceptibility to failure due to fewer geometric deviations between builds.
The anomalies in the data for Wfs/Ts ratio values of four seen in Figure 9 (samples xA1 and xD3) can be explained by the heat inputs and current values between these two parameter settings. For sample 2-/3-D1, the faster cooling rates associated with the lower heat inputs and currents caused the material to rapidly cool on the substrate surface. The corresponding samples of 2-/3-A3 with higher input currents had larger penetration areas from larger melt pools forming, allowing more material from the filler to flow outwards onto the substrate surface. This flow and spreading of material can also be observed from the differences in the bead height measurements of these two sample sets, which had a difference of 16.1% and 22.8% in the bead height for CMT and MIG modes, respectively.
The concentrated penetration profile of depositions shown in Figure 11a has been observed in other works in the literature. Zhang and Xue attributed this overflowing filler material to the combination of lower currents and surface tension, resulting in a cap of excess filler material with a larger deposition area and a smaller penetration area. This is due to a limited volume in the weld pool to accommodate the melted filler material [34]. This concentrated penetration profile can also work to minimize the effect of warping of the components fabricated via WAAM, as narrow weld profiles impose less angular distortion [33].
Dirisu et al. also linked the Wfs and Ts to the mechanisms that drive surface waviness, which can be detrimental to final component properties. It was highlighted that phenomenon such as thermal accumulation and overheating of the melt pool can result in hampered final mechanical properties due to increasing surface waviness [14]. This can also impact the reliability of the cross-sectional geometry, resulting in larger deviations in the bead geometry. The current work revealed from SEM values of cross-sectional dimensions that with increasing Wfs, the dimensional reliability of the CMT processes suffered, and therefore, considerations should be made to operate at lower Wfs values to obtain the highest level of dimensional repeatability between depositions. The observations of CMT having a higher level of reliability regarding bead width can also be attributed to this.
Combining the data of the specimen dimensions with the mass deposition, it can be observed that per unit mass of material, CMT produces specimens with a higher proportion of material in the deposition area, resulting in larger specimen dimensions owing to its lower thermal energy input. This is illustrated by Figure 14, which demonstrates the capacity for CMT to provide larger total cross-sectional areas for a given mass of material deposited. This can be advantageous to the productivity of components fabricated using WAAM but could be detrimental to mechanical properties in the build direction. At lower heat inputs, however, the penetration depth of the deposition is at risk of insufficient adhesion between layers due to a lack of penetration into the substrate or preceding layers. Further study into these lower heat input settings should be undertaken to quantify the viable limits for fabricating steel structures at these parameter settings in multilayer settings and determining the strength of substrate adhesion for components that employ the substrate as a structural element.

5. Conclusions

The findings of this study have been presented with the following conclusions drawn:
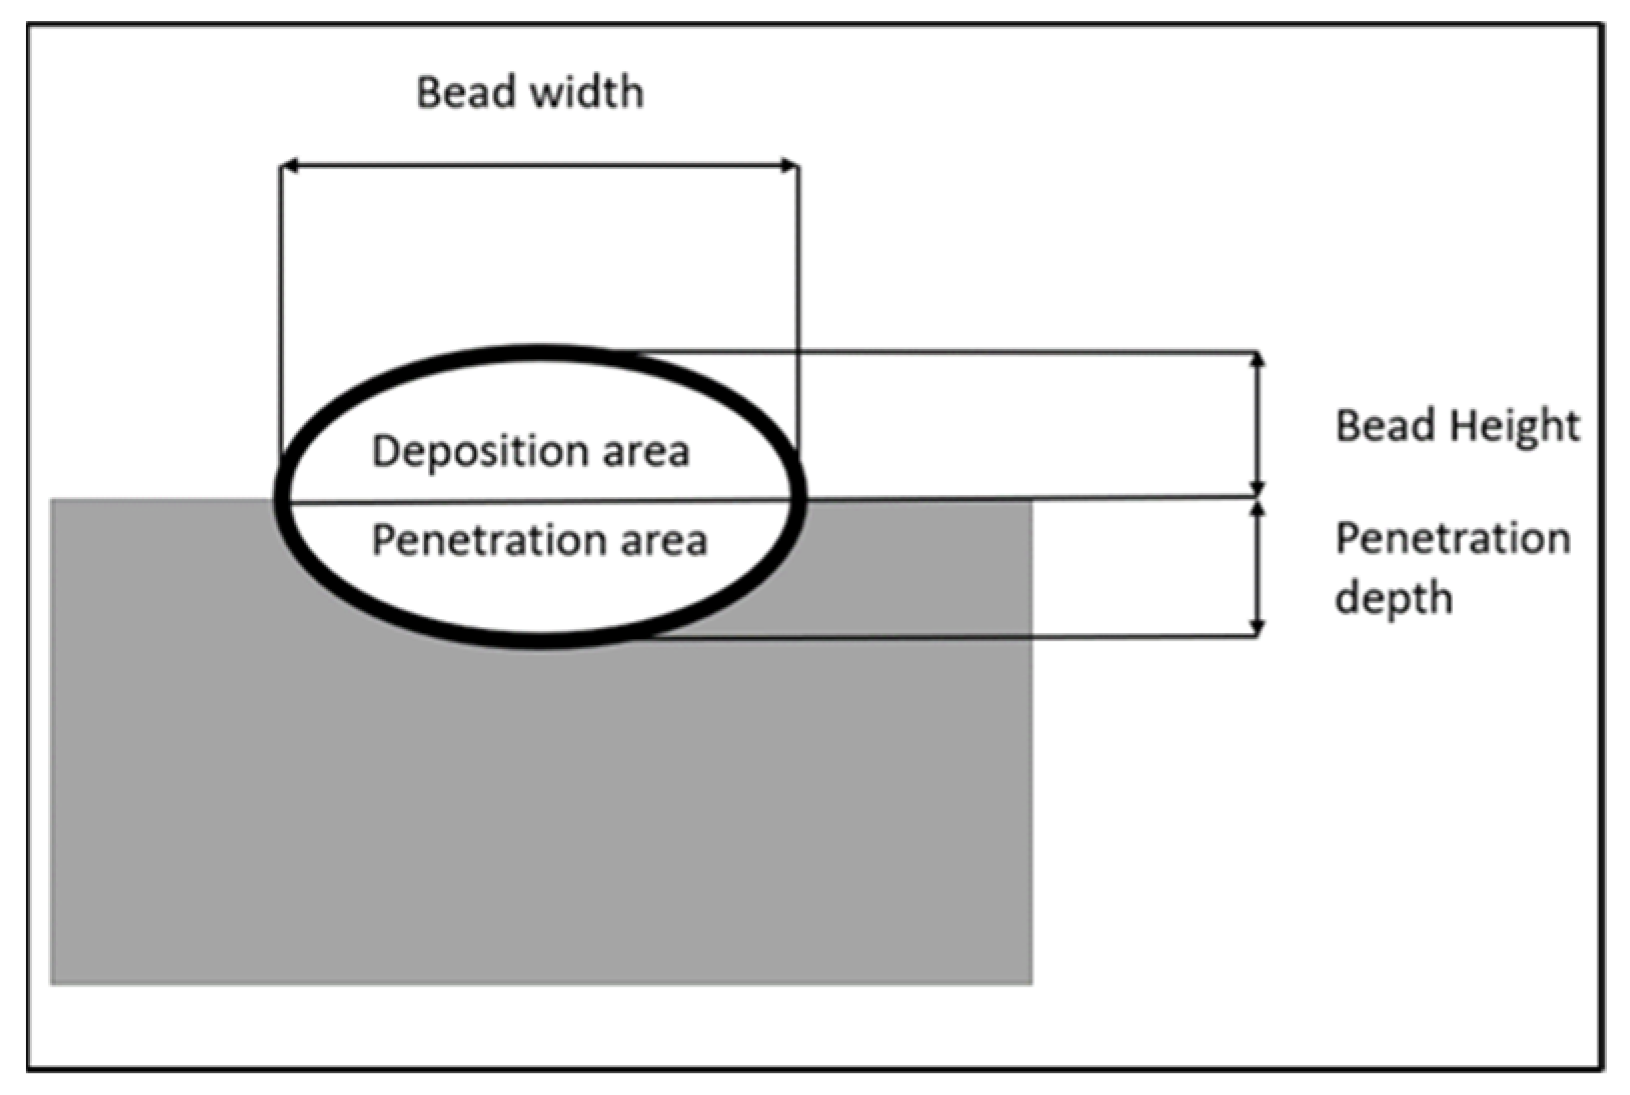
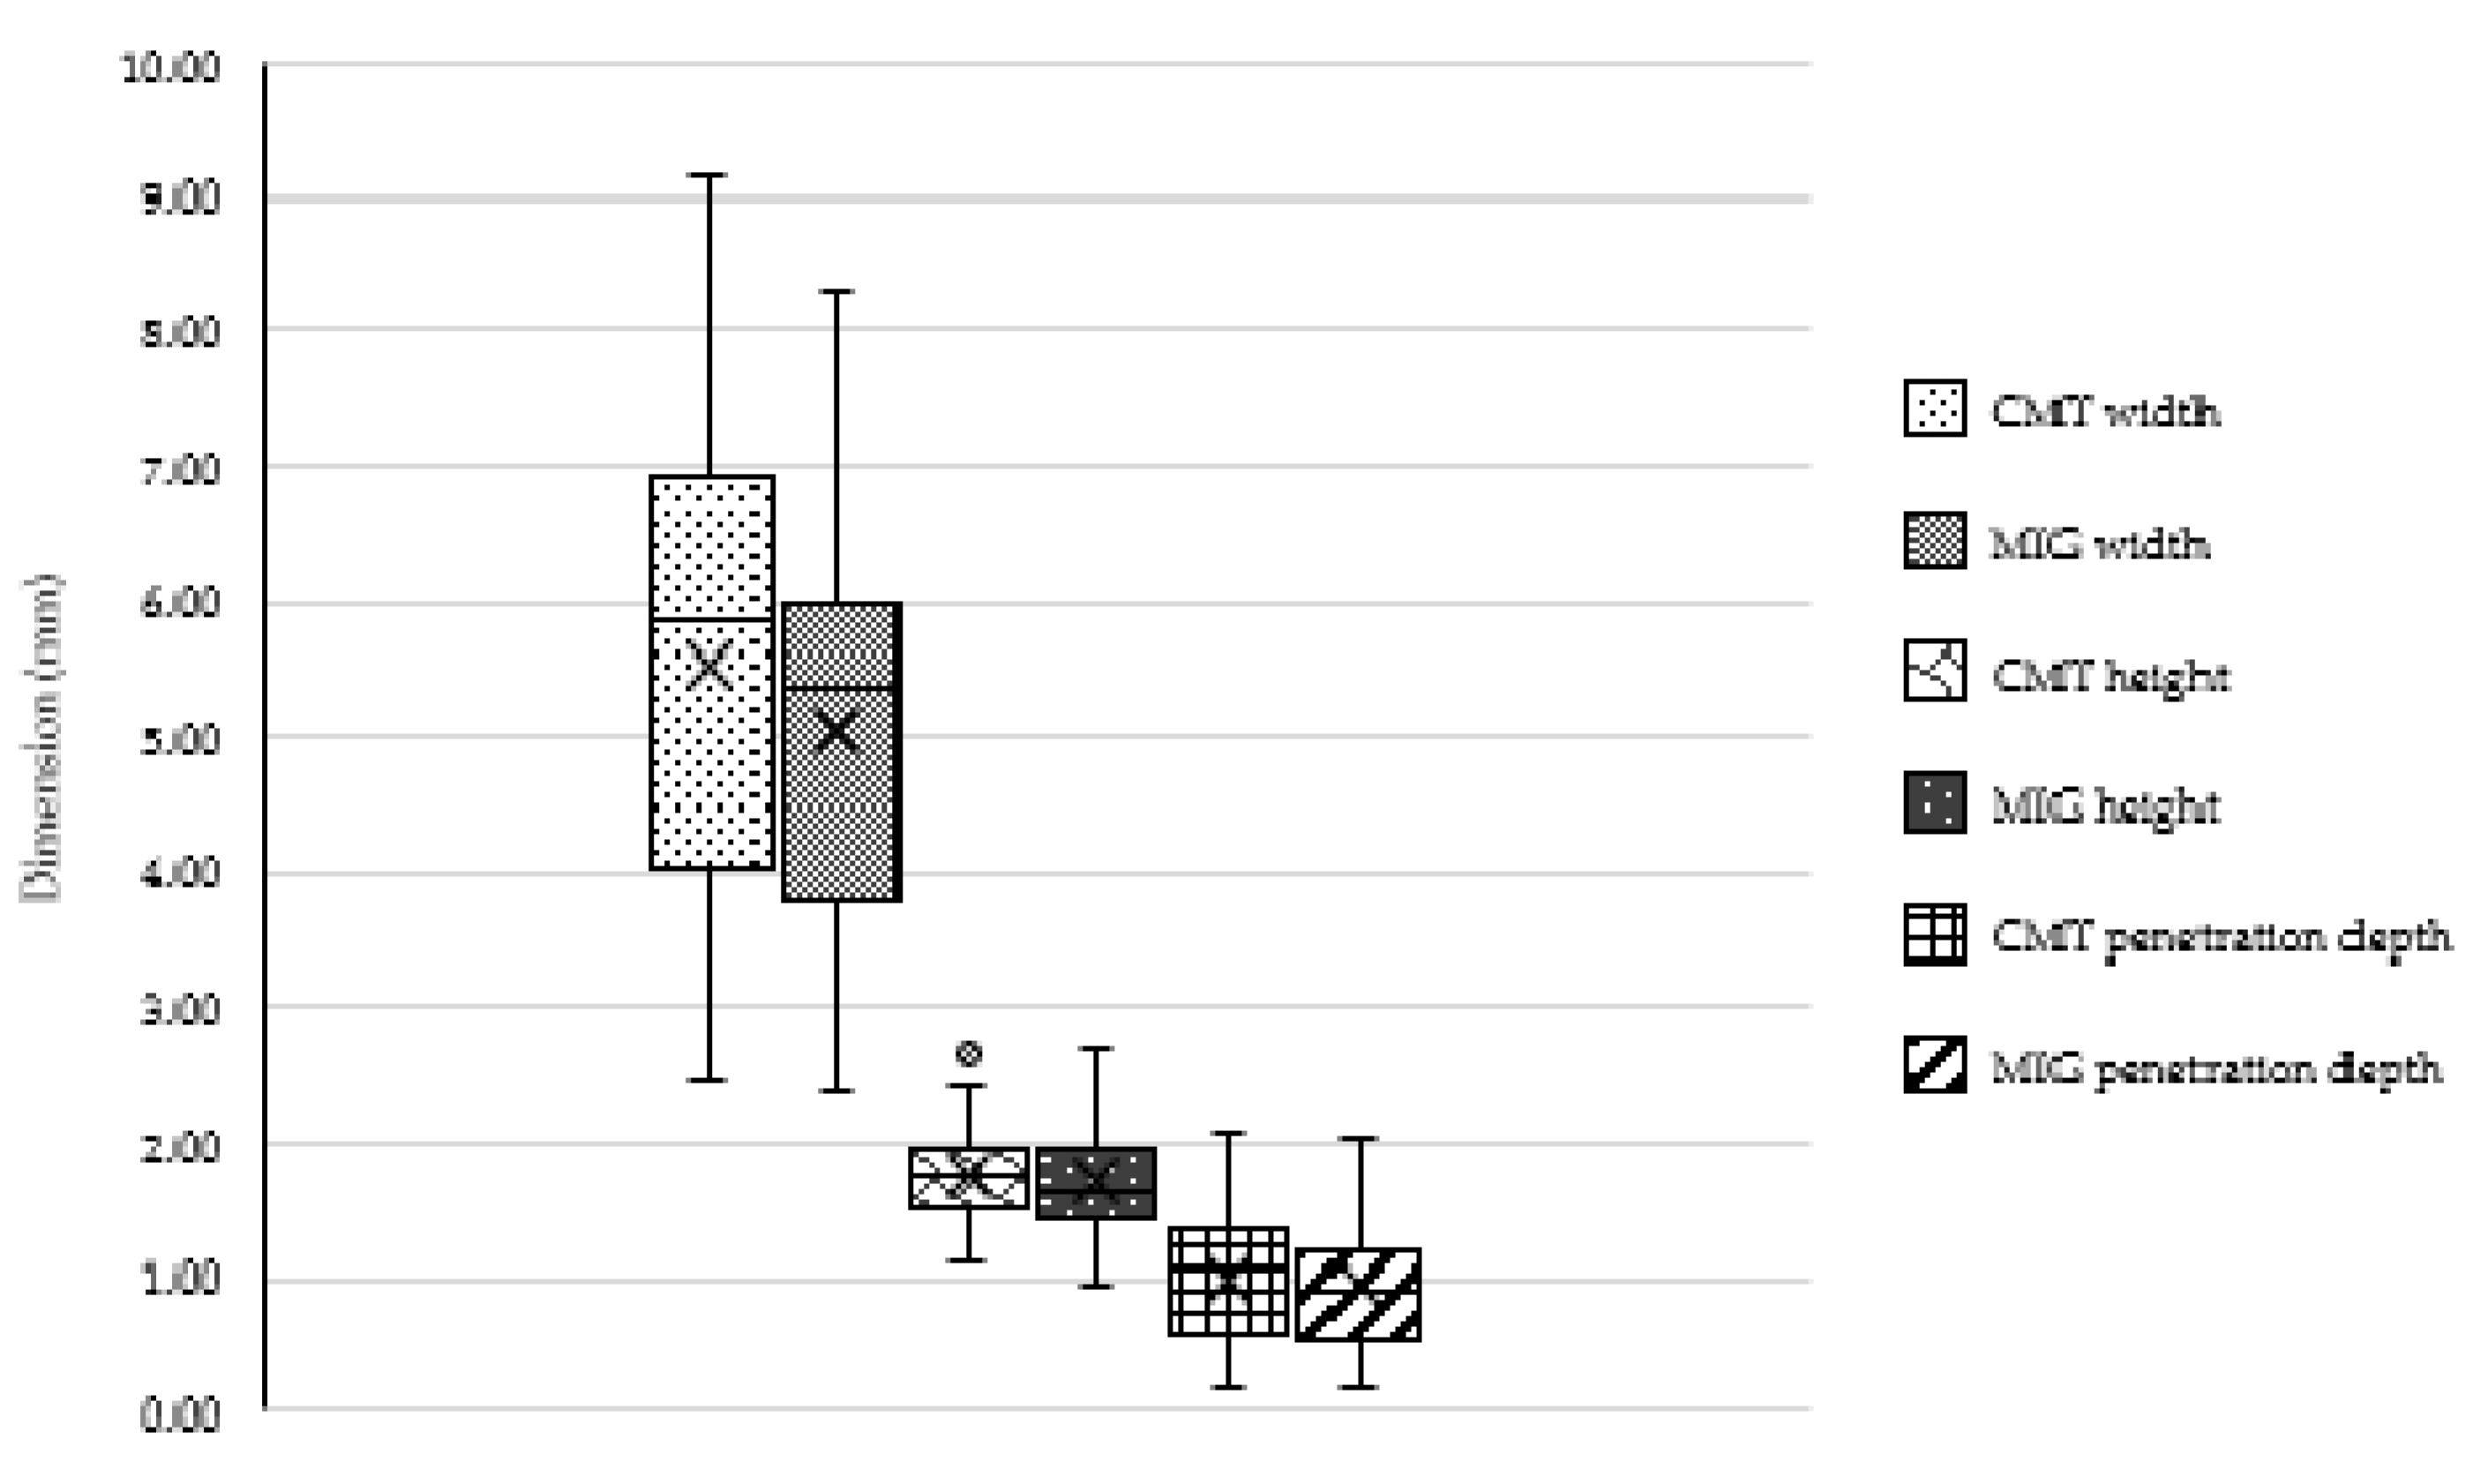
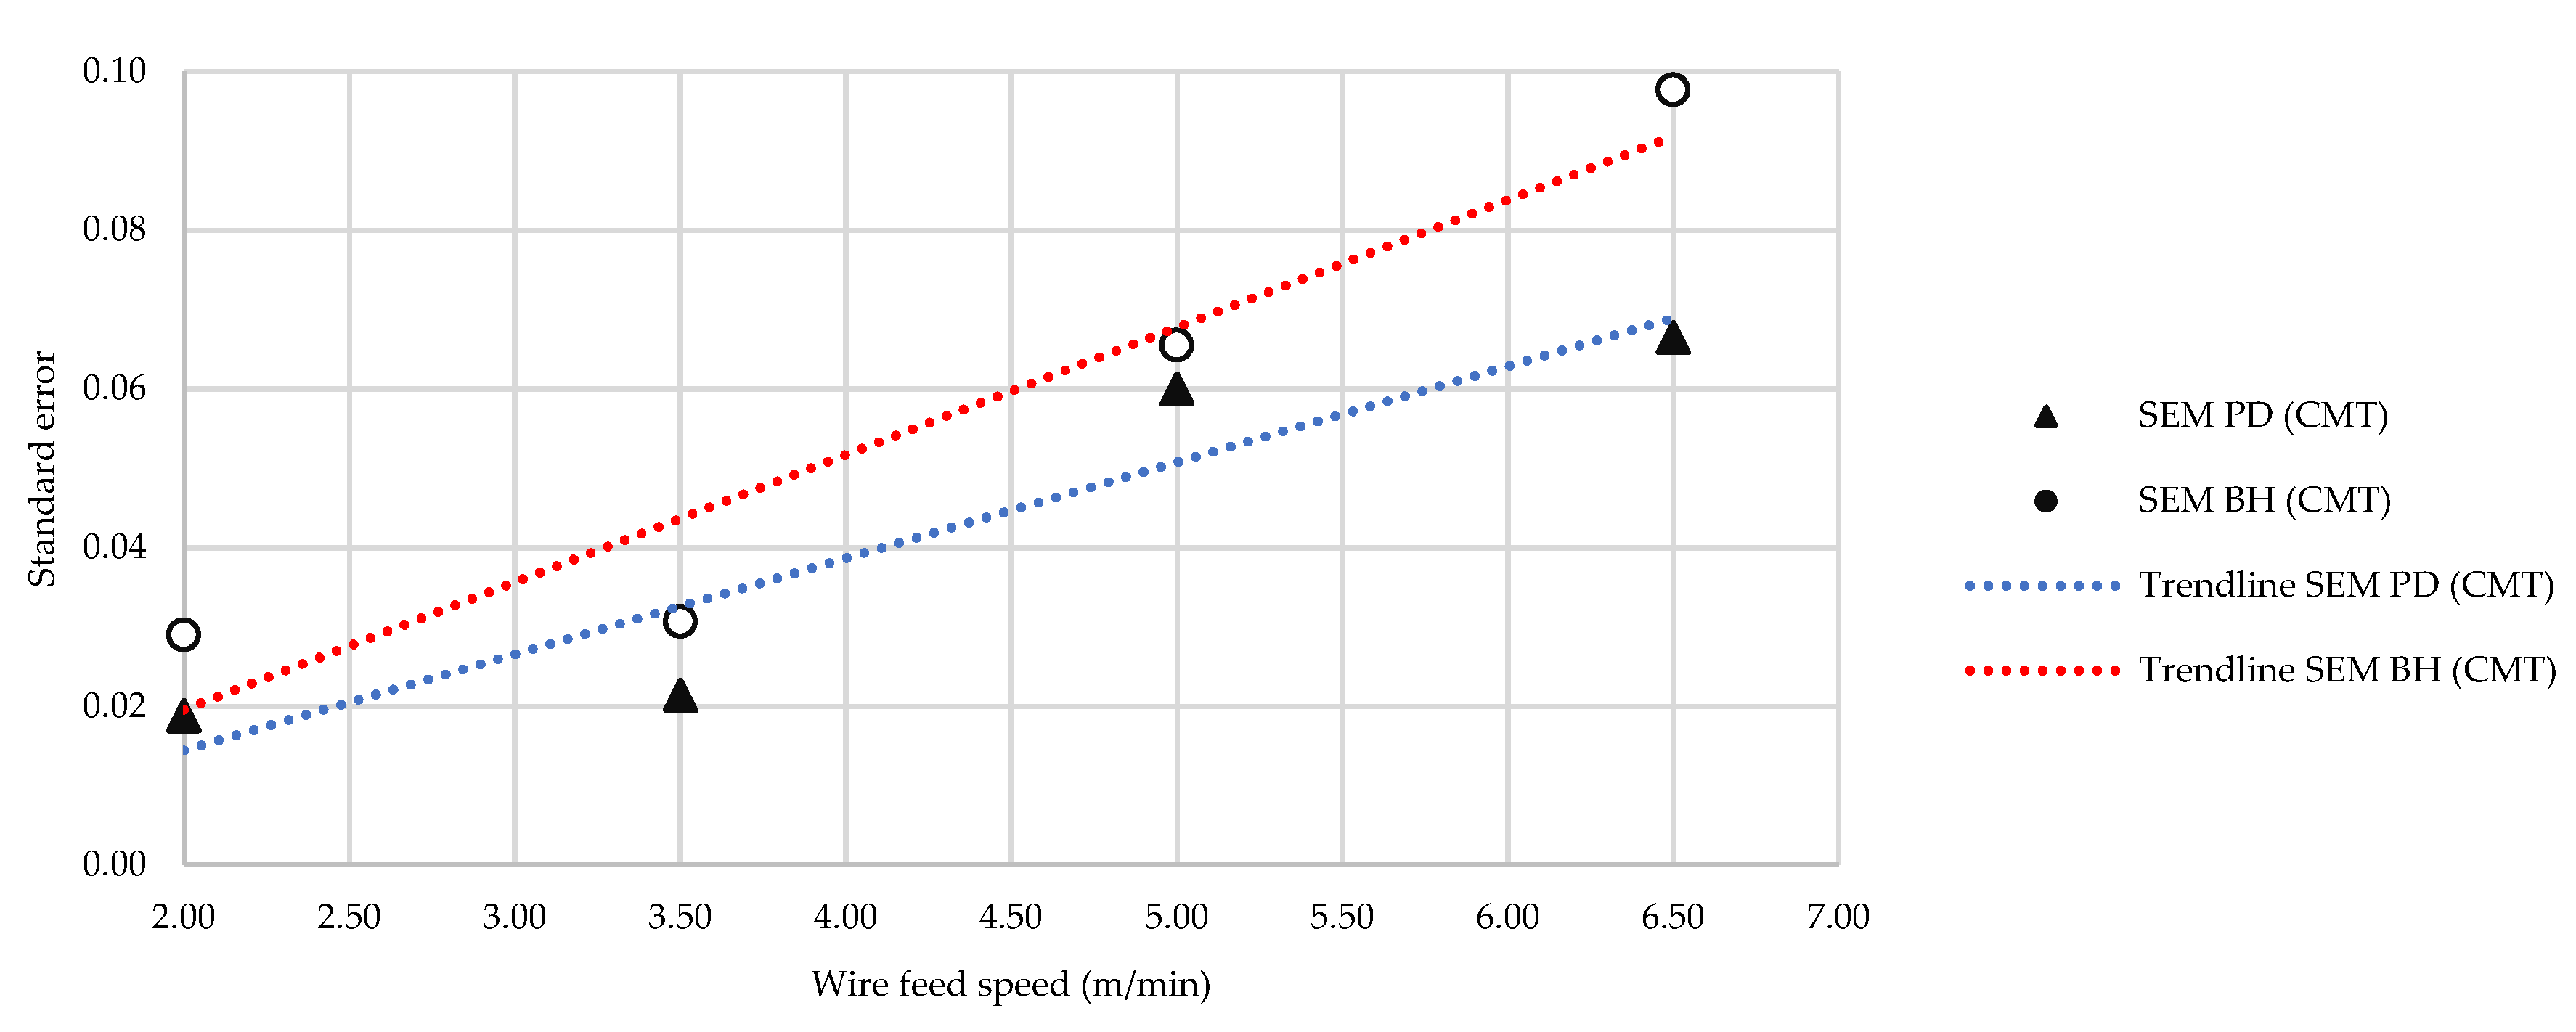
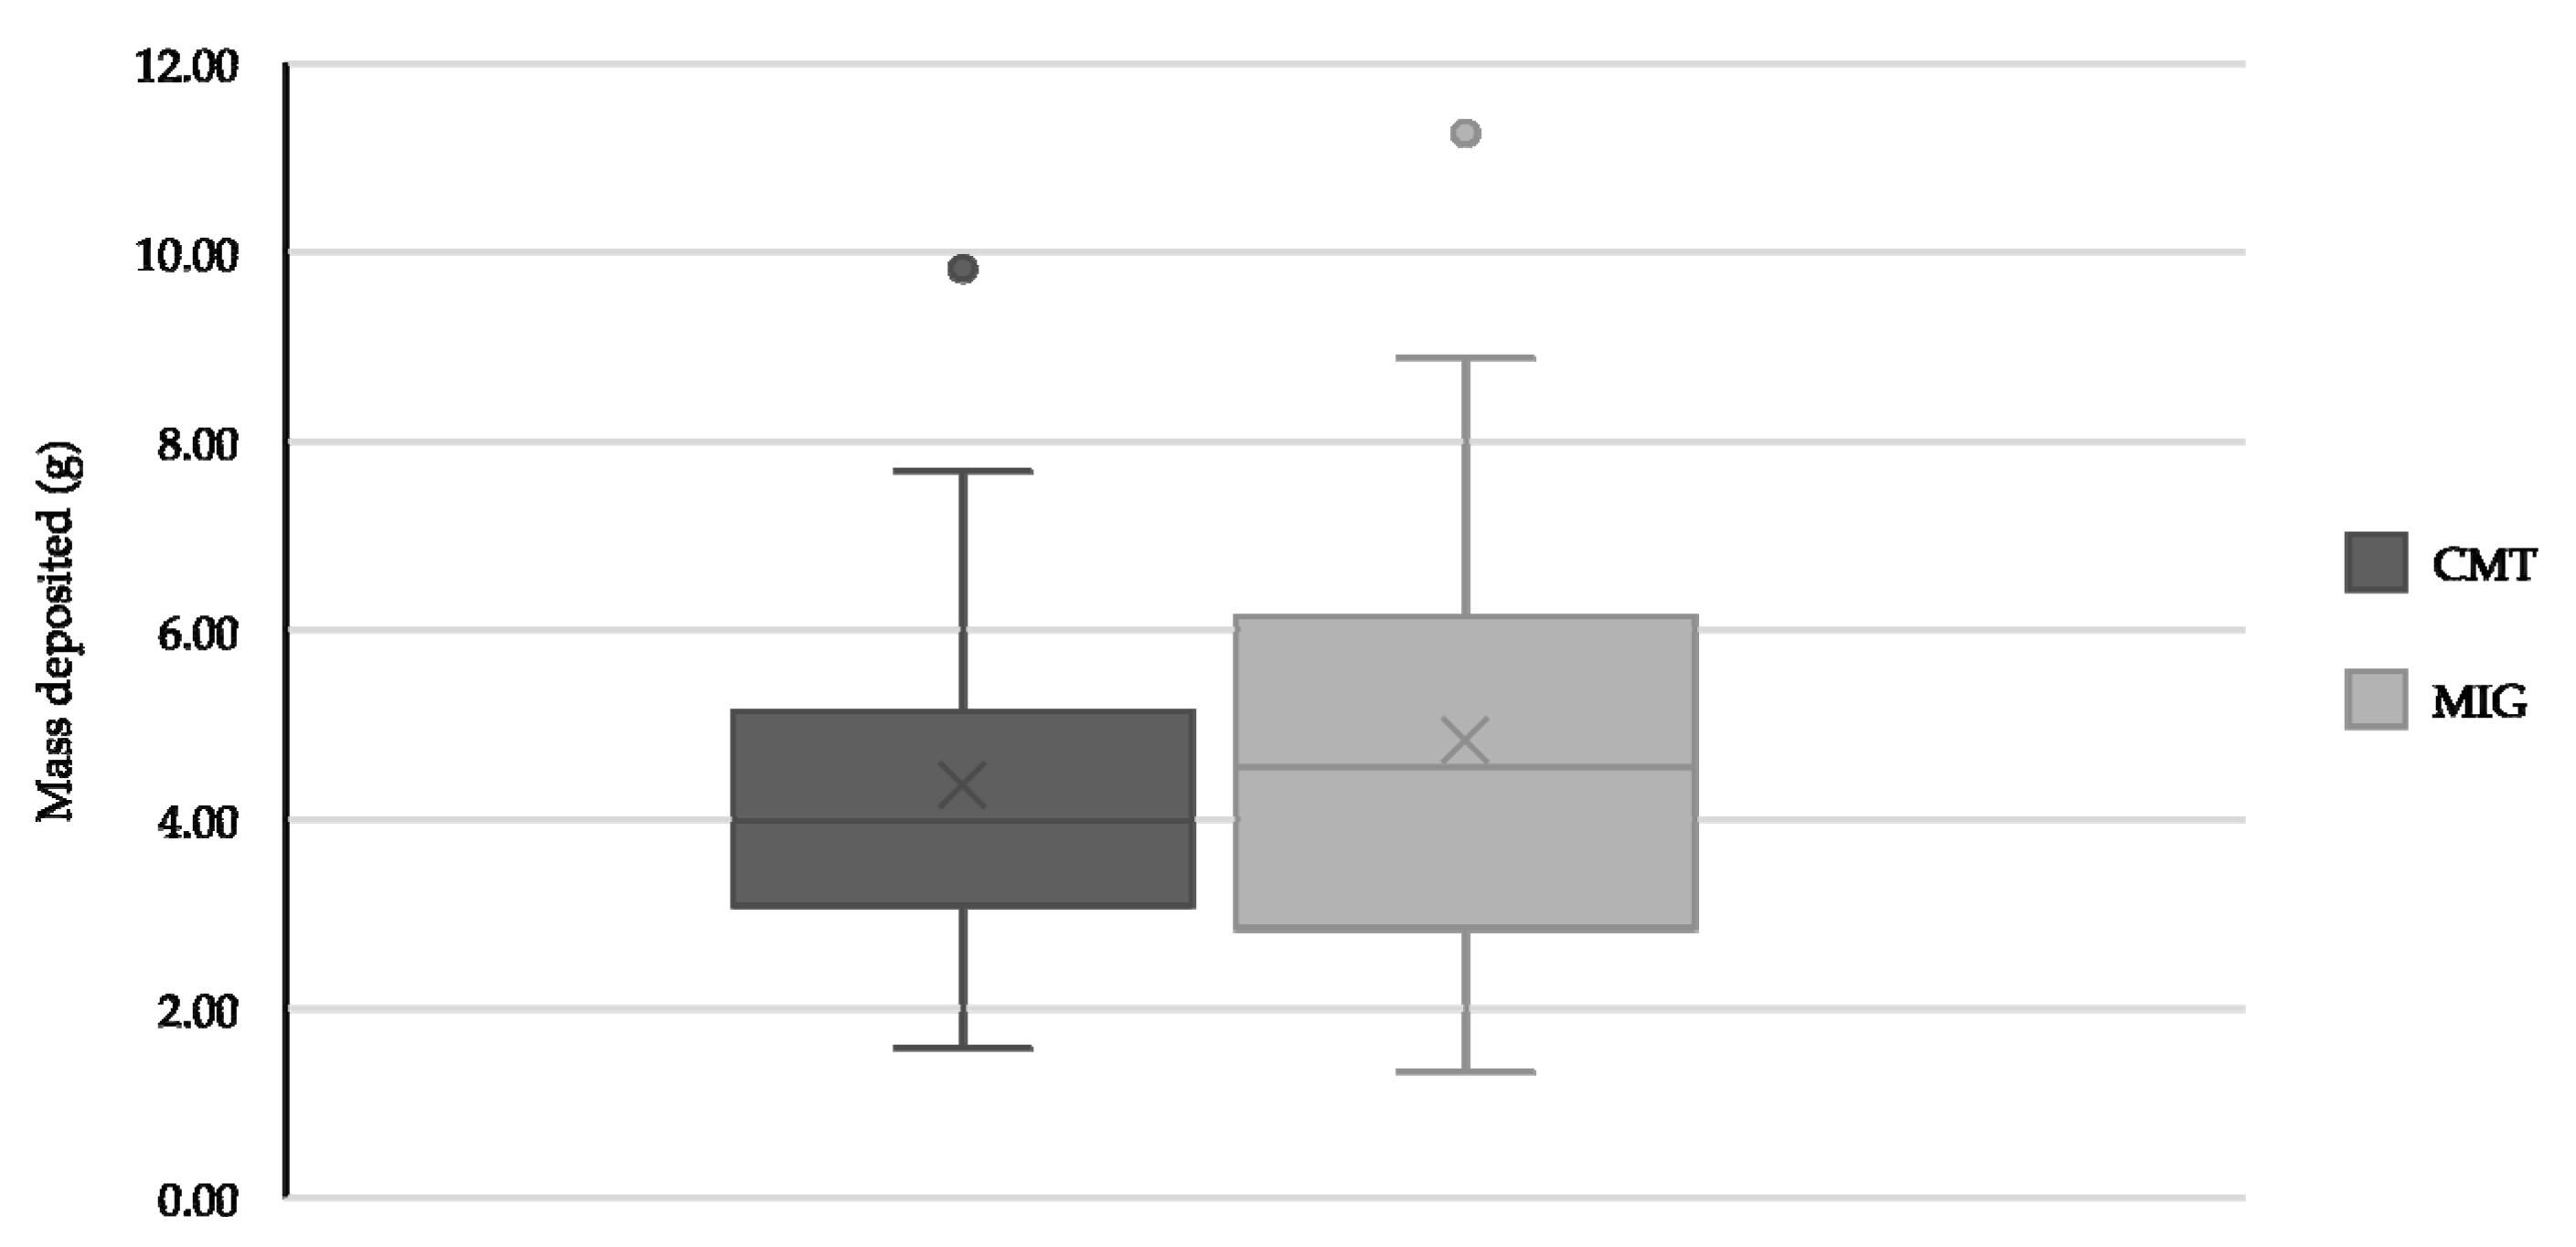
CMT produces more repeatable bead geometry with regards to bead width and penetration depth with lower standard error for these values of 3.8% and 15.3% respectively. The process also had a greater level of repeatability in its mass deposition with 21.6% lower average error values than the equivalent MIG parameter settings.
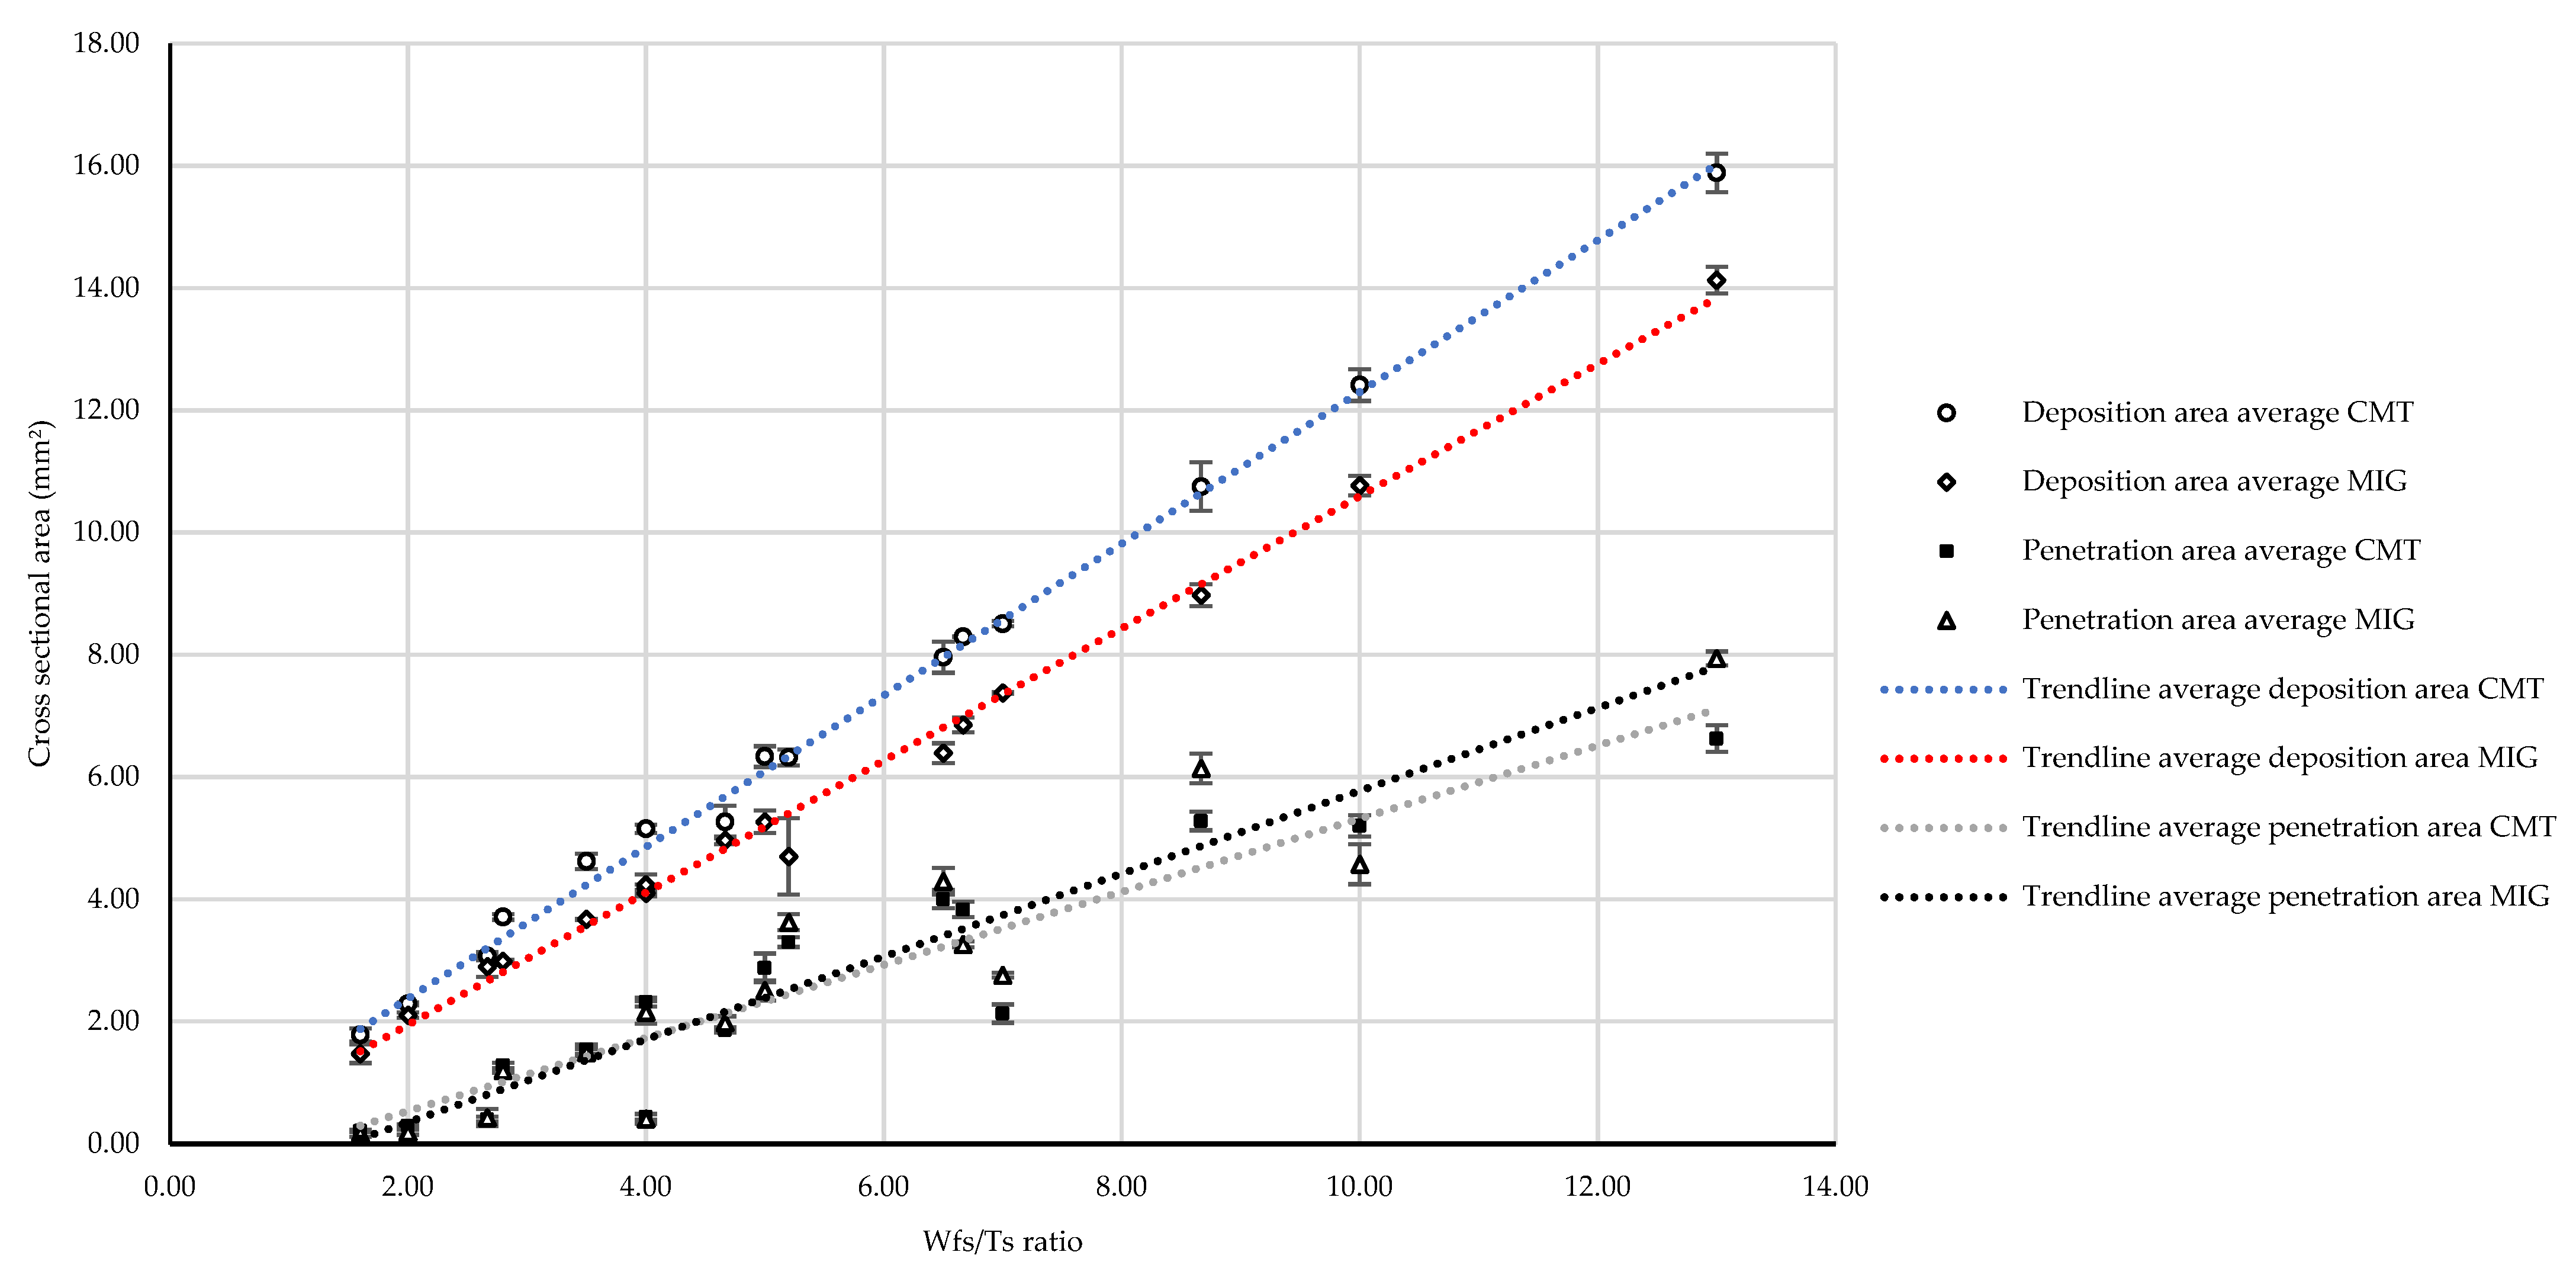
The CMT-mode created samples with larger proportions of the feedstock material in deposition area which can be conducive to higher productivity and material utilization. This processing mode also produced larger overall cross-sectional area measurements with a lower average mass deposited in all parameter sets.
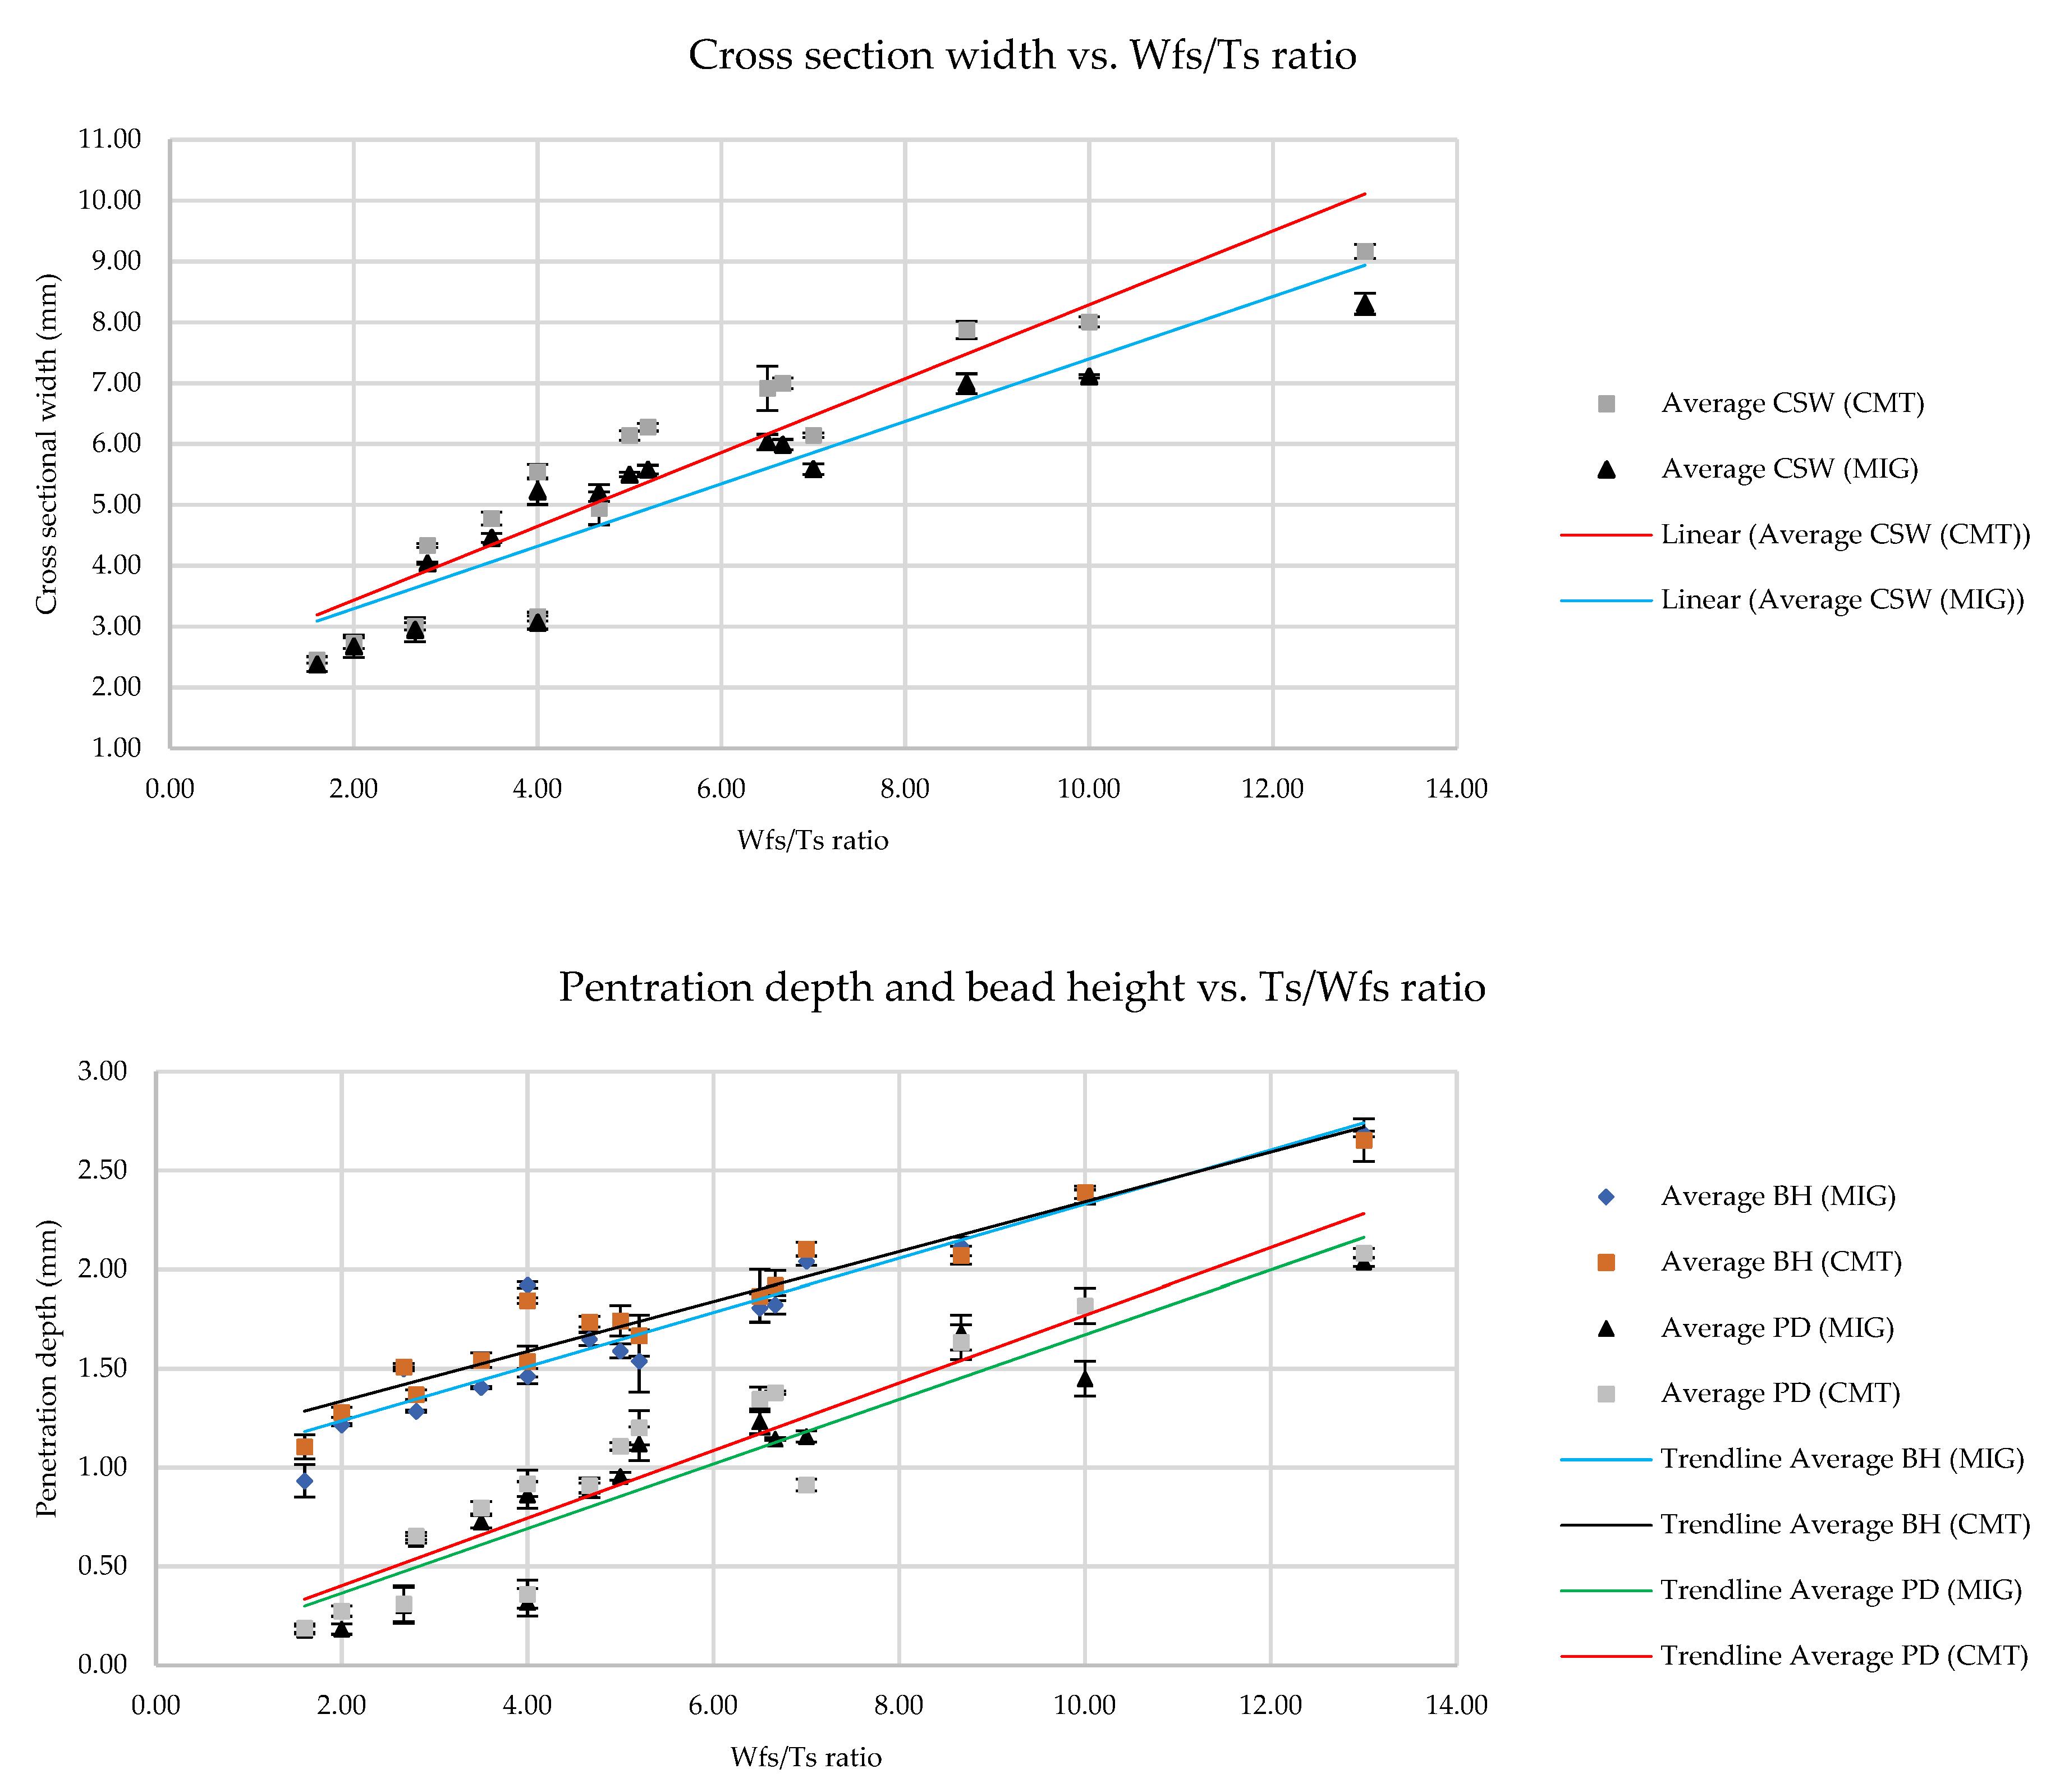
Increasing wire feed speeds will cause a loss of repeatability over the range of selected travel speeds in specimen dimensions, as a larger standard error was observed with changes to these parameters in CMT specimens.
Hardness values were influenced significantly more by changes to the process parameters of travel speeds, current and voltage values than by changes to process mode.
The influence of each process was more pronounced in high heat input specimens with regards to the observed relationship between heat input and hardness. As the heat inputs of the processes increase, so too does the influence of dilution, causing a change to the hardness values.
The calculated heat inputs of this study occupied a range lower than that of many examples in the literature cited. Further work may be necessary to fully understand the formation of the steel microstructures obtained at these ranges in both single and multilayer scenarios, particularly those of the lowest heat inputs reviewed in this study for the precise determination of microstructural components.
The differences seen in the shape of the deposition beads and the shape of the penetration areas could show a disparity between the sample’s mechanical properties, particularly in the build direction between process modes and parameter settings. Mechanical testing under a variety of loading conditions could help to characterize the potential differences seen between process modes as limited information exists on the subject.
The deposition accuracy and effective area should be reviewed against high and low wire feed speed parameter sets to quantify the differences caused by the deviations from higher thermal energy inputs and increased deposition rates in CMT multilayer samples. Future work could also investigate the productivity of utilizing more accurate low deposition rates against larger overbuild high deposition rates as changes to the cooling and dwell times between deposition layers and can impact the speed of deposition as well as the amount of machining time necessary to remove excess material.

Author Contributions

Conceptualization, H.S. and R.W.; methodology, H.S. and R.W.; software, H.S.; validation, H.S.; formal analysis, H.S.; investigation, H.S.; resources, R.W.; data curation, H.S.; writing—original draft preparation, H.S.; writing—review and editing, J.Q. and C.M.; visualization, H.S.; supervision, C.M. and J.Q.; project administration, C.M.; funding acquisition, H.S. All authors have read and agreed to the published version of the manuscript.

Funding

This research was funded by the Department for Economy.

Institutional Review Board Statement

Not applicable.

Informed Consent Statement

Not applicable.

Data Availability Statement

The data presented in this study is available on request from the corresponding author.

Conflicts of Interest

The authors declare no conflict of interest.

References

  1. Ding, D.; Pan, Z.; Cuiuri, D.; Li, H. Wire-feed additive manufacturing of metal components: Technologies, developments and future interests. Int. J. Adv. Manuf. Technol. 2015, 81, 465–481. [Google Scholar] [CrossRef]
  2. Wu, B.; Pan, Z.; Ding, D.; Cuiuri, D.; Li, H.; Xu, J.; Norrish, J. A review of the wire arc additive manufacturing of metals: Properties, defects and quality improvement. J. Manuf. Process. 2018, 35, 127–139. [Google Scholar] [CrossRef]
  3. Almeida, P.M.S.; Williams, S. Innovative process model of Ti-6Al-4V additive layer manufacturing using cold metal transfer (CMT). In Proceedings of the 21st Annual International Solid Freeform Fabrication Symposium—An Additive Manufacturing Conference, Austin, TX, USA, 9 August 2010; pp. 25–36. [Google Scholar]
  4. DebRoy, T.; Wei, H.L.; Zuback, J.S.; Mukherjee, T.; Elmer, J.W.; Milewski, J.O.; Beese, A.M.; Wilson-Heid, A.; De, A.; Zhang, W. Additive manufacturing of metallic components—Process, structure and properties. Prog. Mater. Sci. 2018, 92, 112–122. [Google Scholar] [CrossRef]
  5. Williams, S.W.; Martina, F.; Addison, A.C.; Ding, J.; Pardal, G.; Colegrove, P. Wire + Arc Additive Manufacturing. Mater. Sci. Technol. 2016, 32, 641–647. [Google Scholar] [CrossRef] [Green Version]
  6. Yilmaz, O.; Ugla, A. Shaped metal deposition technique in additive manufacturing: A review. Proc. Inst. Mech. Eng. Part B J. Eng. Manuf. 2016, 230, 1781–1798. [Google Scholar] [CrossRef]
  7. Rodrigues, T.; Duarte, V.; Avila, J.; Santos, T.G.; Miranda, R.; Oliveira, J.P. Wire and arc additive manufacturing of HSLA steel: Effect of thermal cycles on microstructure and mechanical properties. Addit. Manuf. 2019, 27, 440–450. [Google Scholar] [CrossRef]
  8. Cunningham, C.; Flynn, J.; Shokrani, A.; Dhokia, V.; Newman, S. Invited review article: Strategies and processes for high quality wire arc additive manufacturing. Addit. Manuf. 2018, 22, 672–686. [Google Scholar] [CrossRef]
  9. Yildiz, A.S.; Davut, K.; Koç, B.; Yilmaz, O. Wire arc additive manufacturing of high-strength low alloy steels: Study of process parameters and their influence on the bead geometry and mechanical characteristics. Int. J. Adv. Manuf. Technol. 2020, 108, 3391–3404. [Google Scholar] [CrossRef]
  10. Liberini, M.; Astarita, A.; Campatelli, G.; Scippa, A.; Montevecchi, F.; Venturini, G.; Durante, M.; Boccarusso, L.; Minutolo, F.M.C.; Squillace, A. Selection of Optimal Process Parameters for Wire Arc Additive Manufacturing. Procedia CIRP 2017, 62, 470–474. [Google Scholar] [CrossRef]
  11. Seow, C.E.; Coules, H.; Wu, G.; Khan, R.H.; Xu, X.; Williams, S. Wire + Arc Additively Manufactured Inconel 718: Effect of post-deposition heat treatments on microstructure and tensile properties. Mater. Des. 2019, 183, 108157. [Google Scholar] [CrossRef]
  12. Gu, J.; Cong, B.; Ding, J.; Williams, S.W.; Zhai, Y. WIRE+ARC additive manufacturing of aluminium. In Proceedings of the 25th Annual International Solid Freeform Fabrication Symposium � An Additive Manufacturing Conference, Austin, TX, USA, 6 August 2014; pp. 451–458. [Google Scholar]
  13. Brandl, E.; Baufeld, B.; Leyens, C.; Gault, R. Additive manufactured Ti-6Al-4V using welding wire: Comparison of laser and arc beam deposition and evaluation with respect to aerospace material specifications. Phys. Procedia 2010, 5, 595–606. [Google Scholar] [CrossRef] [Green Version]
  14. Dirisu, P.; Supriyo, G.; Martina, F.; Xu, X.; Williams, S. Wire plus arc additive manufactured functional steel surfaces enhanced by rolling. Int. J. Fatigue 2020, 130, 105237. [Google Scholar] [CrossRef]
  15. Prado-Cerqueira, J.L.; Camacho, A.M.; Diéguez, J.L.; Rodríguez-Prieto, Á.; Aragón, A.M.; Lorenzo-Martín, C.; Yanguas-Gil, A. Analysis of Favorable Process Conditions for the Manufacturing of Thin-Wall Pieces of Mild Steel Obtained by Wire and Arc Additive Manufacturing (WAAM). Materials 2018, 11, 1449. [Google Scholar] [CrossRef] [PubMed] [Green Version]
  16. Josten, A.; Höfemann, M. Arc-welding based additive manufacturing for body reinforcement in automotive engineering. Weld. World 2020, 64, 1449–1458. [Google Scholar] [CrossRef]
  17. Han, S.; Zhang, Z.; Liu, Z.; Zhang, H.; Xue, D. Investigation of the microstructure and mechanical performance of bimetal components fabricated using CMT-based wire arc additive manufacturing. Mater. Res. Express 2020, 7, 116525. [Google Scholar] [CrossRef]
  18. Jafari, D.; Vaneker, T.H.; Gibson, I. Wire and arc additive manufacturing: Opportunities and challenges to control the quality and accuracy of manufactured parts. Mater. Des. 2021, 202, 109471. [Google Scholar] [CrossRef]
  19. Lienert, T.J.B.; Sudarsanam, S.; Siewert, T.A.; Acoff, V.L. ASM Handbook, Volume 06A—Welding Fundamentals and Processes. Available online: https://app.knovel.com/hotlink/toc/id:kpASMHVAWA/asm-handbook-volume-06a/asm-handbook-volume-06a (accessed on 21 June 2021).
  20. Yunjia, H.; Frost, R.H.; Olson, D.L.; Edwards, G.R. Grain refinement of aluminum weld metal. Weld. J. 1989, 68, 280–289. [Google Scholar]
  21. Cong, B.; Ding, J.; Williams, S. Effect of arc mode in cold metal transfer process on porosity of additively manufactured Al-6.3%Cu alloy. Int. J. Adv. Manuf. Technol. 2015, 76, 1593–1606. [Google Scholar] [CrossRef]
  22. Bhadeshia, H.; Honeycombe, R. Steels Microstructure and Properties; Elsevier: Amsterdam, The Netherlands, 2017. [Google Scholar] [CrossRef]
  23. Shassere, B.; Nycz, A.; Noakes, M.W.; Masuo, C.; Sridharan, N. Correlation of Microstructure and Mechanical Properties of Metal Big Area Additive Manufacturing. Appl. Sci. 2019, 9, 787. [Google Scholar] [CrossRef] [Green Version]
  24. Rodrigues, T.A.; Duarte, V.; Miranda, R.M.; Santos, T.G.; Oliveira, J.P. Current Status and Perspectives on Wire and Arc Additive Manufacturing (WAAM). Materials 2019, 12, 1121. [Google Scholar] [CrossRef] [Green Version]
  25. Venturini, G.; Montevecchi, F.; Scippa, A.; Campatelli, G. Optimization of WAAM Deposition Patterns for T-crossing Features. Procedia CIRP 2016, 55, 95–100. [Google Scholar] [CrossRef] [Green Version]
  26. Pépe, N.; Egerland, S.; Colegrove, P.A.; Yapp, D.; Leonhartsberger, A.; Scotti, A. Measuring the process efficiency of controlled gas metal arc welding processes. Sci. Technol. Weld. Join. 2011, 16, 412–417. [Google Scholar] [CrossRef] [Green Version]
  27. British Standards. BS EN ISO 6507-4: 2018 BSI Standards Publication Metallic Materials—Vickers Hardness Test; British Standards: Geneva, Switzerland, 2018. [Google Scholar]
  28. British Standards Institution. Welding: Recommendations for Welding of Metallic Materials. Part 1. General Guidance for Arc Welding; British Standards Institution: Geneva, Switzerland, 1998. [Google Scholar]
  29. British Standards Institution. Welding: Recommendations for Welding of Metallic Materials, Part 2: Arc Welding of Ferritic Steel; British Standards Institution: Geneva, Switzerland, 2001. [Google Scholar]
  30. Miguel, P.; Almeida, S.; Thesis, P.; Williams, S. Process Control and Development in Wire and Arc Additive Manufacturing. Ph.D. Thesis, School of Applied Sciences Cranfield University, Bedford, UK, 2012. [Google Scholar]
  31. Wang, Q.; Ye, Q.; Wang, Z.; Kan, L.; Wang, H. Thickness Effect on Microstructure, Strength, and Toughness of a Quenched and Tempered 178 mm Thickness Steel Plate. Metals 2020, 10, 572. [Google Scholar] [CrossRef]
  32. Glover, A.G.; Mcgrath, J.T.; Tinkler, M.J.; Weatherly, G.C. The Influence of Cooling Rate and Composition on Weld Meta Microstructures in a C/Mn and a HSLA Steel. Simulation 1977, 60, 80. [Google Scholar]
  33. Kou, S. Residual Stresses, Distortion, and Fatigue Welding Metallurgy, 2nd ed.; John Wiley & Sons: Hoboken, NJ, USA, 2003; pp. 122–141. [Google Scholar]
  34. Zhang, Z.; Xue, J. Profile Map of Weld Beads and Its Formation Mechanism in Gas Metal Arc Welding. Metals 2019, 9, 146. [Google Scholar] [CrossRef] [Green Version]
  35. Gharibshahiyan, E.; Raouf, A.H.; Parvin, N.; Rahimian, M. The effect of microstructure on hardness and toughness of low carbon welded steel using inert gas welding. Mater. Des. 2011, 32, 2042–2048. [Google Scholar] [CrossRef]
  36. Sun, Y.; Obasi, G.; Hamelin, C.; Vasileiou, A.; Flint, T.; Balakrishnan, J.; Smith, M.; Francis, J. Effects of dilution on alloy content and microstructure in multi-pass steel welds. J. Mater. Process. Technol. 2019, 265, 71–86. [Google Scholar] [CrossRef]
  37. CWang, C.; Wang, X.; Kang, J.; Yuan, G.; Wang, G. Effect of Thermomechanical Treatment on Acicular Ferrite Formation in Ti–Ca Deoxidized Low Carbon Steel. Metals 2019, 9, 296. [Google Scholar] [CrossRef] [Green Version]
  38. Muda, W.S.H.W.; Nasir, N.S.M.; Mamat, S.; Jamian, S.; Kelantan, M. Effect of Welding Heat Input on Microstructure and Mechanical Properties at Coarse Grain Heat Affected Zone of Abs Grade a Steel. 2015. Available online: www.arpnjournals.com (accessed on 27 July 2021).
  39. Zhang, P.; Li, S.; Zhang, Z. General relationship between strength and hardness. Mater. Sci. Eng. A 2011, 529, 62–73. [Google Scholar] [CrossRef]
  40. Bhadeshia, H.K.D.H. Bainite in Steels, 2nd ed.; Maney Publishing: Leeds, UK, 2001; Volume 2, pp. 1–454. [Google Scholar] [CrossRef]
Figure 1. Diagram of multilayer specimen where A = effective wall area, Weff = effective wall thickness and B = overbuild material mass.
Metals 11 01530 g001
Figure 2. Diagram of specimen dimensions and cross-sectional cut area.
Metals 11 01530 g002
Figure 3. Diagram of sample cross section and associated dimensions.
Metals 11 01530 g003
Figure 4. Diagram of hardness testing sites and test direction.
Metals 11 01530 g004
Figure 5. Hardness values of samples plotted against corresponding calculated heat inputs.
Metals 11 01530 g005
Figure 6. Micrographs of high (a) and low (b) heat input samples fabricated using CMT.
Metals 11 01530 g006
Figure 7. Micrographs of high heat input specimens produced from CMT (a) and MIG (b) processes ATF = allotriomorphic.
Metals 11 01530 g007
Figure 8. Distribution of specimen dimensions for CMT and MIG comparison across all parameter sets.
Metals 11 01530 g008
Figure 9. Sample dimensions plotted against Wfs/Ts ratios.
Metals 11 01530 g009
Figure 10. Standard error values plotted against wire feed speed for CMT specimen penetration depth and bead height.
Metals 11 01530 g010
Figure 11. Cross-sections of the (a) CMT sample and (b) MIG sample showing distinctive shapes of the penetration area for each processing mode at higher heat inputs.
Metals 11 01530 g011
Figure 12. Combined cross-sectional area dimensions with Wfs/Ts ratios.
Metals 11 01530 g012
Figure 13. Comparison of material mass deposited throughout all of the parameter sets.
Metals 11 01530 g013
Figure 14. Combined data for deposit mass and total cross-sectional area plotted against each Wfs/Ts datapoint.
Metals 11 01530 g014
Table 1. Chemical composition of filler wire and substrate material.
CMnSiPSNiCrMoVCu
EN3BMin0.160.50N/AN/AN/AN/AN/AN/AN/AN/A
Max0.240.900.350.050.05N/AN/AN/AN/AN/A
ER70S-6Min0.061.400.80N/AN/AN/AN/AN/AN/AN/A
Max0.151.851.150.030.040.150.150.150.030.50
Table 2. Parameter settings and calculated values associated with each procesing mode.
TS (m/min)WFS (m/min)I (A)V (V)HI MIG (J/mm)HI CMT (J/mm)Dt8/5MIG (s)Dt8/5 CMT (s)Sample Designation CMT (MIG)
0.502.0078.0012.1090.6094.000.480.502A1 (3A1)
0.503.50129.0013.90172.14178.590.910.942A2 (3A2)
0.505.00176.0015.40260.20269.961.371.422A3 (3A3)
0.506.50224.0016.20348.36361.431.841.912A4 (3A4)
0.752.0078.0012.1060.4062.670.320.332B1 (3B1)
0.753.50129.0013.90114.76119.060.610.632B2 (3B2)
0.755.00176.0015.40173.47179.970.910.952B3 (3B3)
0.756.50224.0016.20232.24240.951.231.272B4 (3B4)
1.002.0078.0012.1045.3047.000.240.252C1 (3C1)
1.003.50129.0013.9086.0789.300.450.472C2 (3C2)
1.005.00176.0015.40130.10134.980.690.712C3 (3C3)
1.006.50224.0016.20174.18180.710.920.952C4 (3C4)
1.252.0078.0012.1036.2437.600.190.202D1 (3D1)
1.253.50129.0013.9068.8671.440.360.382D2 (3D2)
1.255.00176.0015.40104.08107.980.550.572D3 (3D3)
1.256.50224.0016.20139.35144.570.740.762D4 (3D4)
Table 3. Hardness value distribution analysis of CMT and MIG across parameter range.
Hardness Values (Hv)
CMTMIG
Minimum232236
Q1294301
Median322346
Q3363370
Max402395
Mean330336
Range170159
Std error1312
Std deviation5246
Publisher’s Note: MDPI stays neutral with regard to jurisdictional claims in published maps and institutional affiliations.

