Article

Effect of Al Concentration on the Microstructural Evolution of Fe-Cr-Al Systems: A Phase-Field Approach

Department of Nuclear Engineering, Kyung Hee University, Yongin-City 17104, Korea
*
Author to whom correspondence should be addressed.
Metals 2021, 11(1), 4; https://doi.org/10.3390/met11010004
Submission received: 27 November 2020 / Revised: 15 December 2020 / Accepted: 18 December 2020 / Published: 22 December 2020
(This article belongs to the Special Issue Modeling and Microstructure Evolution of Solid State Materials)

Abstract

:
In this study, the microstructural evolution of an Fe-Cr-Al system was simulated in two-dimensional (2D) and three-dimensional (3D) systems using the phase-field method. We investigated the effect of Al concentration on the microstructural evolution of the systems, with a focus on the nucleation and growth of the Cr-rich α phase. In addition, we quantitatively analyzed the mechanism of the effect of Al concentration on the microstructural characteristics of the 2D and 3D systems, such as the number of precipitates, average precipitate area (volume), and α phase fraction. In particular, we analyzed the effect of Al concentration and the dimensions of the system cell on the formation of the interconnected structure at high Cr concentrations, such as 35 Cr a t % and 40 Cr a t % . To enhance the performance of the simulations, we applied a semi-implicit Fourier spectral method for the ternary system and a parallel graphics processing unit computing technique. The results revealed that the initiation of phase separation in the 2D and 3D simulations was enhanced with an increase in the average Al concentration in the system. In addition, with an increase in the average Al concentration in both systems, the α phase fraction increased, while the change in the phase fraction decreased.

1. Introduction

Fe-Cr-based alloys are widely used in various fields, owing to their excellent corrosion resistance and high temperature strength [1,2,3,4]. Fe-Cr-based alloys are used as structural materials under extreme conditions, such as nuclear reactors [3,4,5]. The addition of Al to Fe-Cr alloys has been considered as an effective method to improve the mechanical properties of Fe-Cr-Al systems, owing to their effects on the behaviors of microstructures [5,6,7,8,9]. Therefore, it is important to extensively study the effects of Al on Fe-Cr-Al systems to optimize their microstructures.
Fe-Cr-Al alloys have received extensive attention in various fields, owing to their excellent radiation tolerance [9,10,11] and corrosion resistance at high temperatures [6,12,13,14,15]. An increase in the Cr concentration in Fe-Cr-Al systems improves the oxidation and corrosion resistance of the systems at high temperatures [1,2]; however, a high Cr concentration leads to the formation of the α phase, which generates embrittlement in the system [16,17,18,19,20,21]. In contrast, an increase in the Al concentration in an Fe-Cr-Al system improves the mechanical properties of the system while suppressing the formation of the α phase; however, an increase in the Al concentration makes the fabrication process of Fe-Cr-Al alloys difficult [22,23,24]. Therefore, it is important to determine the optimal compositions of Fe-Cr-Al alloys.
Several studies have investigated the microstructural behavior of the Fe-Cr-Al system using the phase-field method [25]. In addition, previous studies have quantitatively assessed the free energy of Fe-Cr-Al systems through the calculation of phase diagrams (CALPHAD) approach [26,27,28]. Furthermore, previous studies have reported that embrittlement is caused by the spinodal decomposition in Fe-Cr-Al ternary systems [25,29,30]. However, the effect of Al on the microstructural evolution of Fe-Cr-Al systems is not clearly understood. Therefore, in this study, we simulated the spinodal decomposition in an Fe-Cr-Al system using the phase-field method and CALPHAD approach to quantitatively evaluate the effect of Al in Fe-Cr-Al systems.
The semi-implicit Fourier spectral (SIFS) method is known to efficiently solve the Cahn–Hilliard equation with a high numerical stability [20,21,31,32,33]. Therefore, in this study, we present a strategy for solving the Cahn–Hilliard equation for ternary systems using the SIFS method. Recently, the CUDA(Compute Unified Device Architecture) parallel computing technique has been developing at a remarkable speed. With the cuFFT library, a discrete fast Fourier transform can be performed at a much faster speed than CPU parallelization [34], and we actively utilize this library to perform the existing technique. Microstructure change modeling for a ternary system, which has not yet been performed, was performed here in 3D. In addition, in order to solve a ternary system, more than twice the computational load is needed compared to the binary system. We applied the implicit method, which has much higher computational stability than the explicit method [35], with a cutting-edge parallel computing technology; with this, we could perform 256 3 3D grid simulations within five days, which took more than two months until 10 years ago. Thus, in this study, the quantitative differences between the microstructures of 2D and 3D multicomponent systems, which were not systematically studied in the past, could be evaluated.
All codes used in this study were executed as sets of in-house code written by the authors using CUDA-Fortran and provided by Nvidia HPC SDK, and the microstructures were visualized using the Paraview software. In this study, parallel computation was performed using different GPUs, such as the NVidia V100 or RTX 2080Ti.

2. CALPHAD-Based Phase-Field Method

2.1. Phase-Field Modeling Applied Using the Cahn–Hilliard Equation

Herein, we simulated the evolution of the Cr and Al concentration fields in an Fe-Cr-Al system by solving the following Cahn–Hilliard equation [25,36]:
c A ( r , t ) t = V m · M A , A δ F ( r , t ) δ c A + M A , B δ F ( r , t ) δ c B
where M A , B is the chemical mobility of the A , B components, which are pure Cr and Al, respectively), c A is the concentration of the A component, and V m is the molar volume. M A , B is given as [37,38]:
M C r , C r ( c F e , c C r , c A l ) = c C r [ ( 1 c C r ) 2 M C r + c C r c A l M A l + c C r c F e M F e ] M A l , A l ( c F e , c C r , c A l ) = c A l [ ( 1 c A l ) 2 M A l + c C r c A l M C r + c A l c F e M F e ] M C r , A l ( c F e , c C r , c A l ) = M A l , C r = c C r c A l [ c F e M F e ( 1 c C r ) M C r ( 1 c A l ) M A l ]
where M γ is the mobility of the γ elements (Fe, Cr, and Al). The diffusivity and mobility are related by Einstein’s relation, M γ = D γ / R T . The diffusivity of the solute D F e , D C r , D A l is given (in units of m 2 /s) as [39]:
D F e = 2.8 × 10 4 e x p 251 ( k J / m o l ) R T D C r = 3.7 × 10 3 e x p 267 ( k J / m o l ) R T D A l = 5.2 × 10 4 e x p 246 ( k J / m o l ) R T ,
where T is the absolute temperature and R(= 8.3144 /mol· K) is the gas constant. In addition, the total free energy in the ternary system can be expressed as [40,41,42]:
F ( r , t ) = V 1 V m [ f ( c F e , c C r , c A l ) + 1 2 κ ( c F e ) 2 + 1 2 κ ( c C r ) 2 + 1 2 κ ( c A l ) 2 ] d V ,
where f ( c F e , c C r , c A l ) is the chemical free energy in the ternary system. We assumed that the gradient coefficient, κ , for all components can be given as:
κ = 1 6 a 0 2 L F e C r .
We assumed that a 0 ( = 1 3 ( a F e + a C r + a A l ) ) , where a F e , a C r , and a A l are the lattice parameters of the pure elements and L F e C r is the regular solution interaction parameter. In addition, the local chemical potential δ F δ c A is the variational derivative. Therefore, it can be expressed as:
δ F ( r , t ) δ c A = f ( c F e , c C r , c A l ) c A 2 κ 2 c A κ 2 c B .
We solved two sets of Cahn–Hilliard equations to simulate a ternary Fe-Cr-Al system; for (1), A is Cr and B is Al, and for (2), A is Al and B is Cr in Equation (6), respectively.

2.2. Semi-Implicit Fourier Spectral Method with Variable Mobility

To improve the numerical stability, we employed the SIFS method for solving the Cahn–Hilliard equation [31,32]. In the Fourier space, Equation (1) is given as:
c ˜ A ( k , t ) t = i k · { M A , A i k f ( c F e , c C r , c A l ) c A k + 2 κ k 2 c ˜ A + κ k 2 c ˜ B r + M A , B i k f ( c F e , c C r , c A l ) c B k + 2 κ k 2 c ˜ B + κ k 2 c ˜ A r } k ,
where k = ( k 1 , k 2 ) is the reciprocal vector in the Fourier space. The c A ˜ ( k , t ) and the { f c A } k are the Fourier transforms of c A ( r , t ) and f c A , respectively. Therefore, the explicit Euler Fourier spectral scheme can be given as:
c ˜ A n + 1 ( k , t ) = c ˜ A n ( k , t ) + Δ t i k · { M A , A i k f c A k n + 2 κ k 2 c ˜ A n + κ k 2 c ˜ B n r + M A , B i k f c B k n + 2 κ k 2 c ˜ B n + κ k 2 c ˜ A n r } k .
We applied two suitable constants ( S A , S B ) to Equation (8) [31]. To calculate the c ˜ A n + 1 , c ˜ A n + 1 Δ t κ k 4 and c ˜ A n Δ t κ k 4 terms were added to the left side and the right side of the equation, respectively. In addition, we used the factor S A to calculate the c ˜ A n + 1 . Therefore, Equation (8) can be rearranged using factor S A as:
c ˜ A n + 1 ( k , t ) = c ˜ A n ( k , t ) + Δ t i k 1 + S A Δ t κ k 4 · { M A , A i k f c A k n + 2 κ k 2 c ˜ A n + κ k 2 c ˜ B n r + M A , B i k f c B k n + 2 κ k 2 c ˜ B n + κ k 2 c ˜ A n r } k
S A = 1 2 [ m a x ( M A , A ( r , t ) ) + m i n ( M A , A ( r , t ) ) ] ,
where m a x ( M A , A ( r , t ) ) and m i n ( M A , A ( r , t ) ) are the maximum and minimum values of M A , A , respectively. Similarly, we calculated the S B by the m a x ( M B , B ( r , t ) ) and m i n ( M B , B ( r , t ) ) . In addition, we used the semi-implicit factor S B to calculate the c ˜ B n + 1 .

2.3. CALPHAD-Type Free Energy

The molar chemical free energy f ( c F e , c C r , c A l ) in Equation (4) is given as: [28,43]
f ( c F e , c C r , c A l ) = c F e G F e + c C r G C r + c A l G A l + L F e C r c F e c C r + L C r A l c C r c A l + L F e A l c F e c A l + R T ln ( c F e ln c F e + c C r ln c C r + c A l ln c A l ) ,
where G F e , G C r , and G A l are the molar Gibbs free energies of pure Fe, Cr, and Al, respectively, and L F e C r , L C r A l , and L F e A l are the interaction parameters between the pure elements [28,44]. We simulated the microstructural evolution at a temperature of T = 710 K.
G F e = + 1225.7 + 124.134 × T 23.5143 × T × ln T 0.00439752 × T 2 5.89269 × 10 8 × T 3 + 77358.5 × T 1 G C r = 8856.94 + 157.48 × T 26.908 × T × ln T + 0.00189435 × T 2 1.47721 × 10 6 × T 3 + 139250 × T 1 G A l = 1193.24 + 218.235446 × T 38.5844296 × T × ln T + 0.018531982 × T 2 5.764227 × 10 6 × T 3 + 74092 × T 1 L F e C r = + 20 , 500 9.68 T L C r A l = 54 , 900 + 10.0 T L F e A l = 12 , 2452.9 + 31.6455 T .
To increase the computational efficiency, we used dimensionless values. Particularly, our simulations used the normalized values: r * = r / l , * = / ( r / l ) , t * = t D / l 2 , M A , B * = R T * M A , B / D , f * = f / ( R T * ) , and κ * = κ / ( R T * l 2 ) with D = D A l , critical temperature T * = 875 K , and lattice parameter l of a 0 in Equation (5). The initial Cr concentration was in the range of –0.005∼0.005. The time step was Δ t * = 0.001 and the simulation cell size was 512 Δ x * × 512 Δ y * , wherein the Δ x * and the Δ y * were 1.0. In addition, we simulated the 3D microstructural evolution using the phase-field method. The initial Cr concentration variation and Δ t * value were equal to those of the 2D simulation, and the system cell size was 256 Δ x * × 256 Δ y * × 256 Δ z * , wherein the Δ z * was also 1.0.
In addition, the parallelization technique using CUDA was used to increase the computational efficiency when solving the Cahn–Hilliard equation [20].
To investigate the effect of Al concentration on the microstructural evolution of the Fe-Cr-Al system, we simulated 30 sets for the 2D system and 21 sets for the 3D system. In this study, the % concentration means atomic percent. The average Cr concentration was set at 30%, 35%, and 40% at various average Al concentrations (0.1%–9%) in the 2D system. In the 3D system, the average Al concentration range was set between 0.1% and 10%.

3. Simulation Results and Analyses

3.1. Two-Dimensional Simulation of the Microstructural Evolution

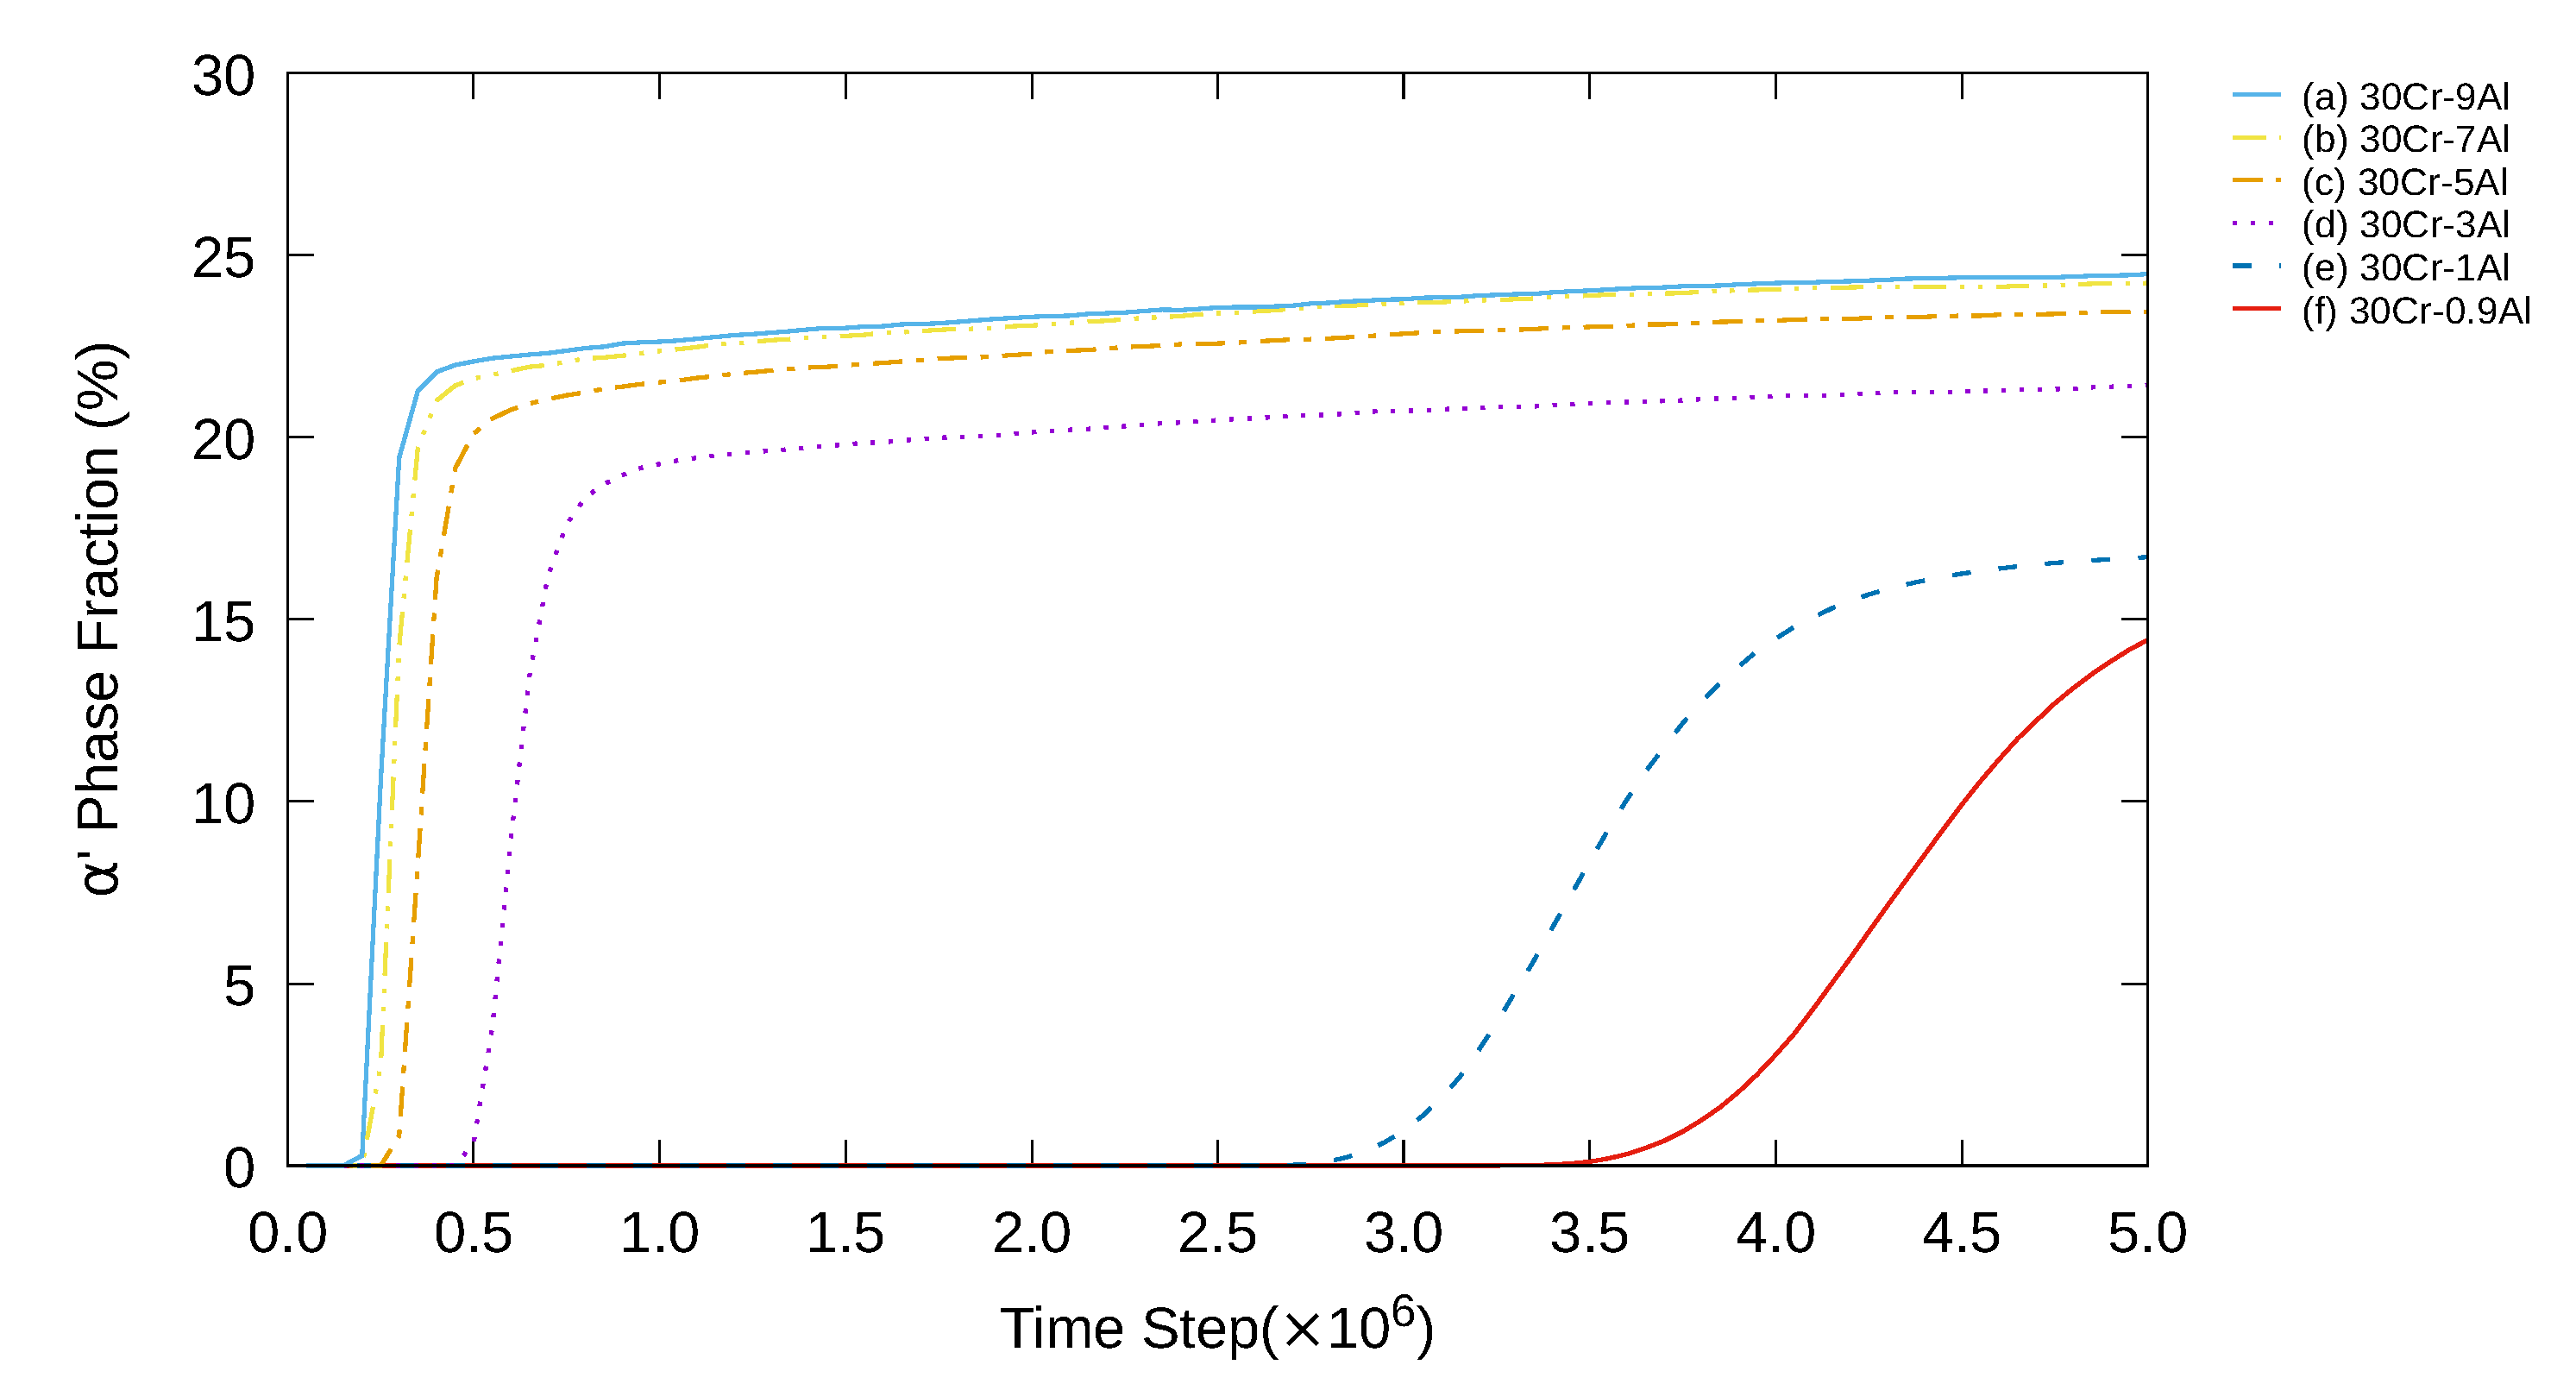
As shown in Figure 1 and Figure 2, at an average Cr concentration of 30%, the phase separation occurred when the average Al concentration was between 0.9% and 9%, which means that the concentration is placed outside the spinodal region. In addition, phase separation was not observed when the average Al concentration was between 0.1% and 0.7%. Furthermore, with an increase in the average Al concentration, the initiation of phase separation occurred earlier, and the α phase fraction increased, as shown in Figure 2. The discrepancy in the initial times for the occurrence of α can be largely divided into two groups in Figure 1: the high Al concentration group (3–9%) and the low Al concentration group (0.9–1%).
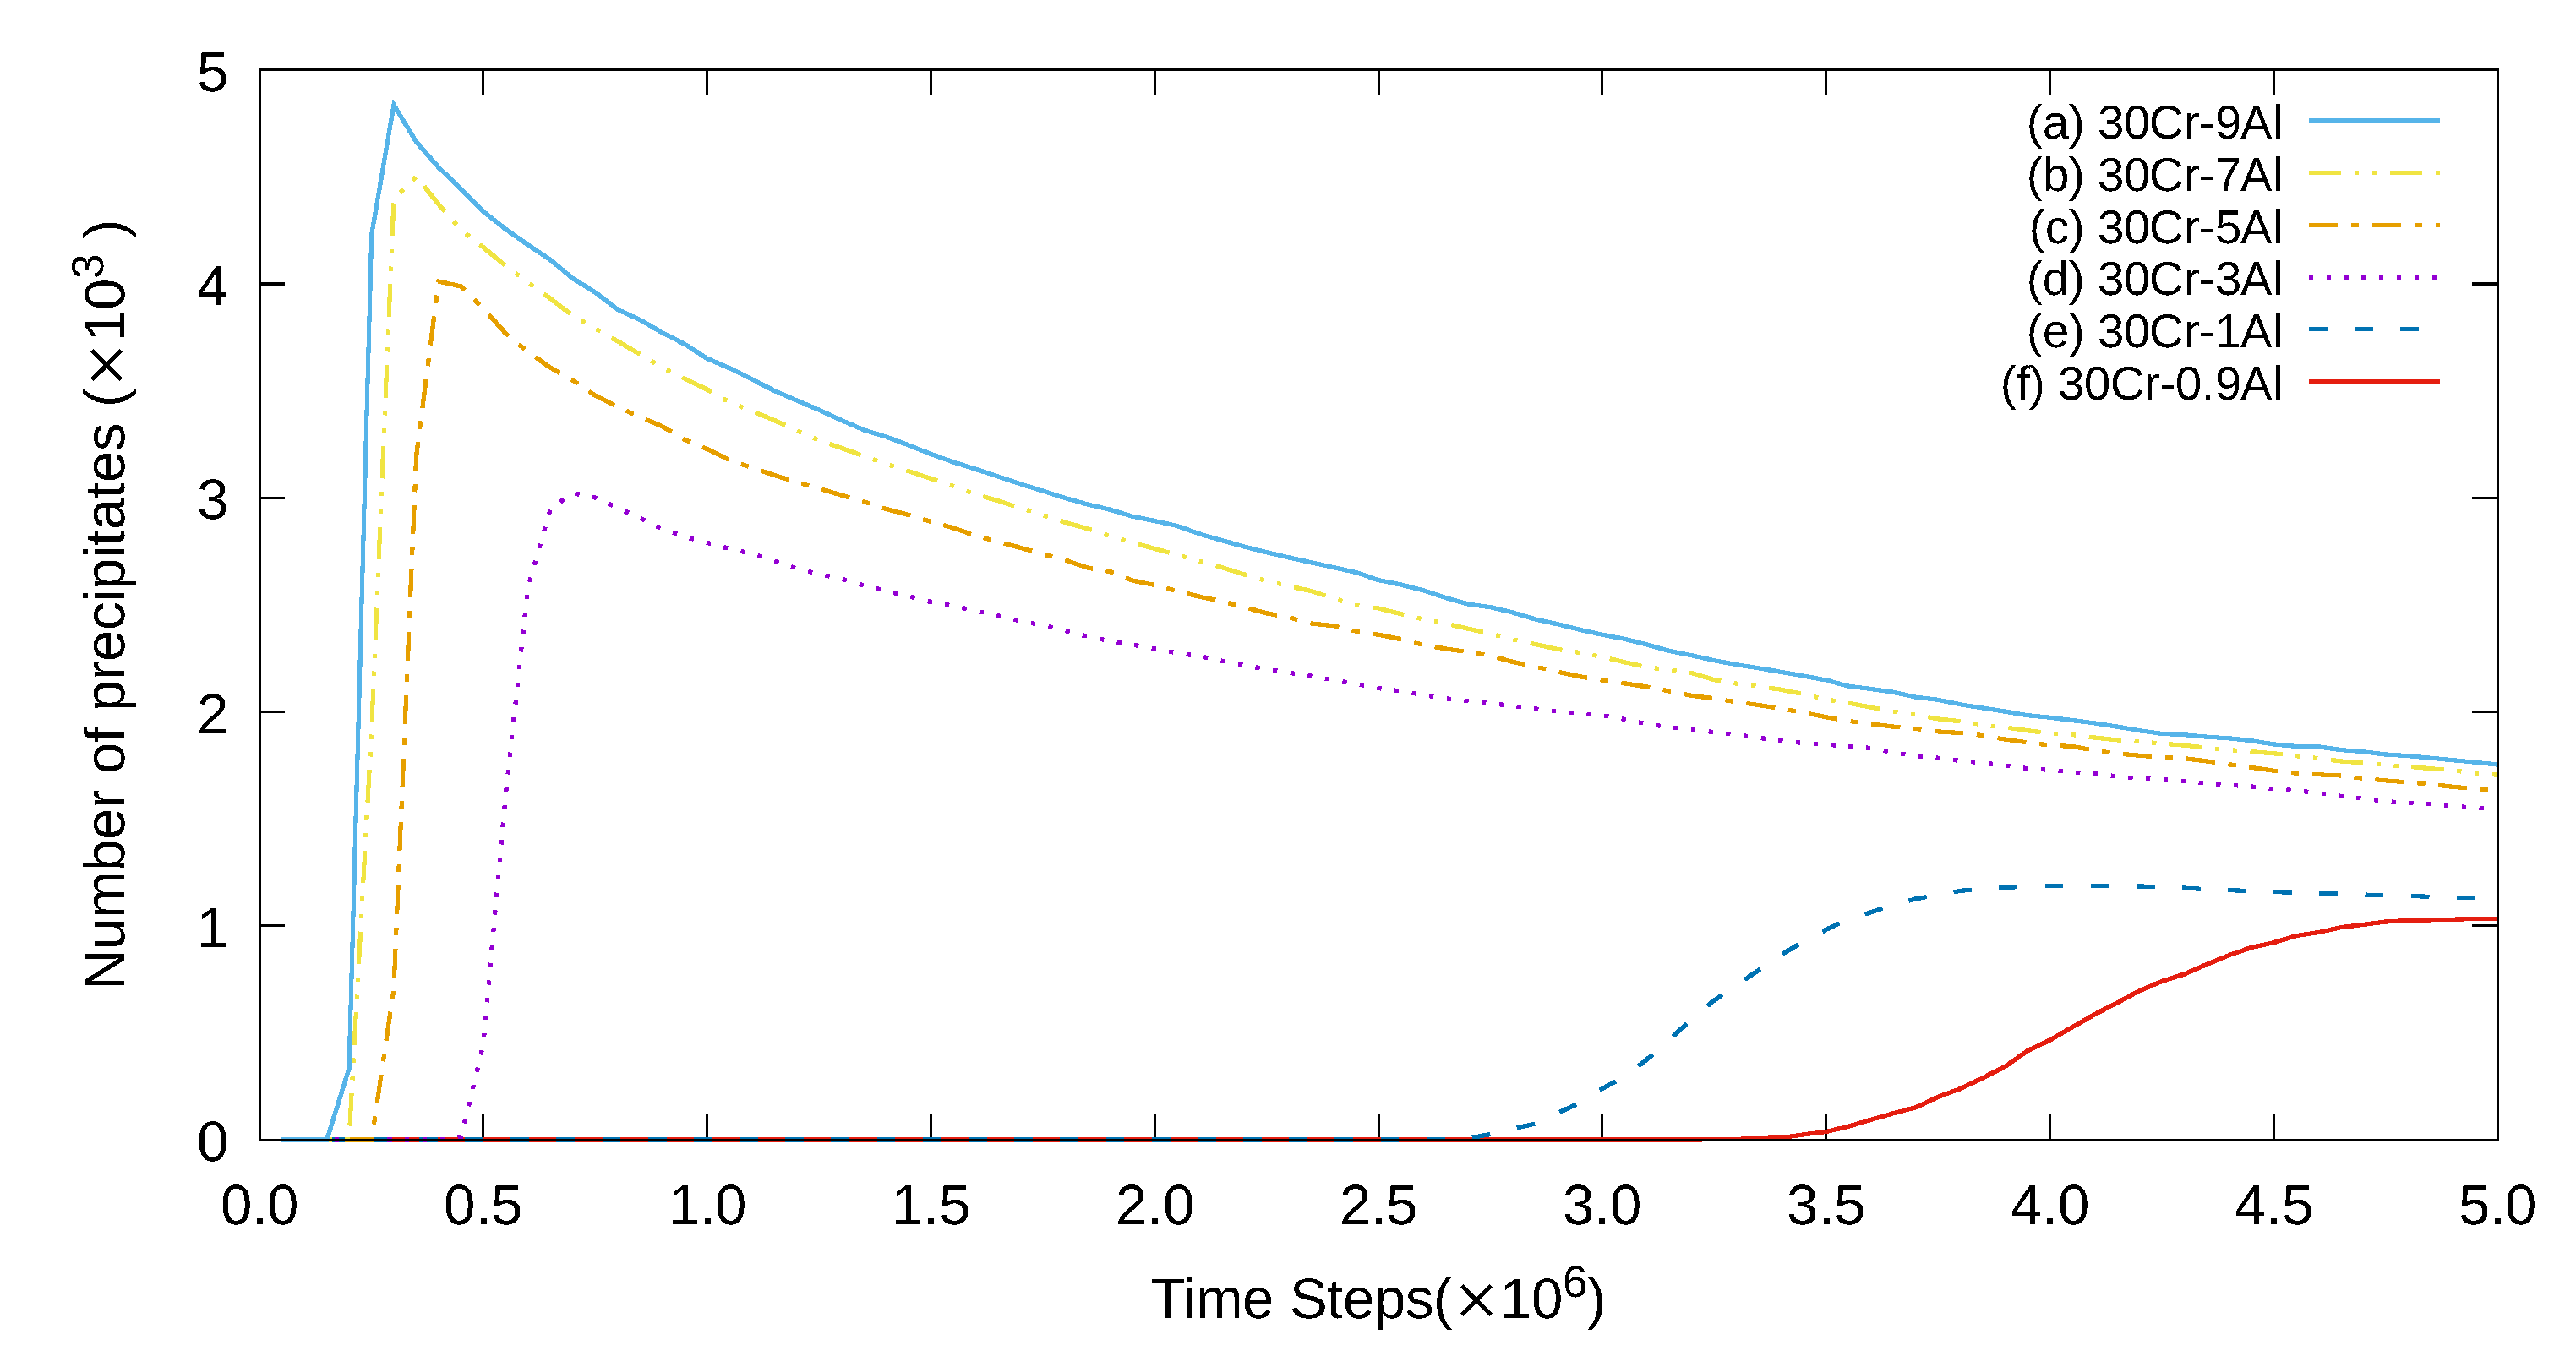
For convenience, the spot with the maximum number of precipitates in Figure 3 is named the initial peak of the system. As the average Al concentration increased, the amplitude of the initial peak increased with Fe-30%Cr, as shown in Figure 3. In addition, after the initial peak, the number of the α precipitate decreased significantly in the high Al concentration group in comparison to that of the low Al concentration group, according to Figure 3. In addition, we obtained the microstructure when the average Cr concentration was 30%, as shown in Figure 4.
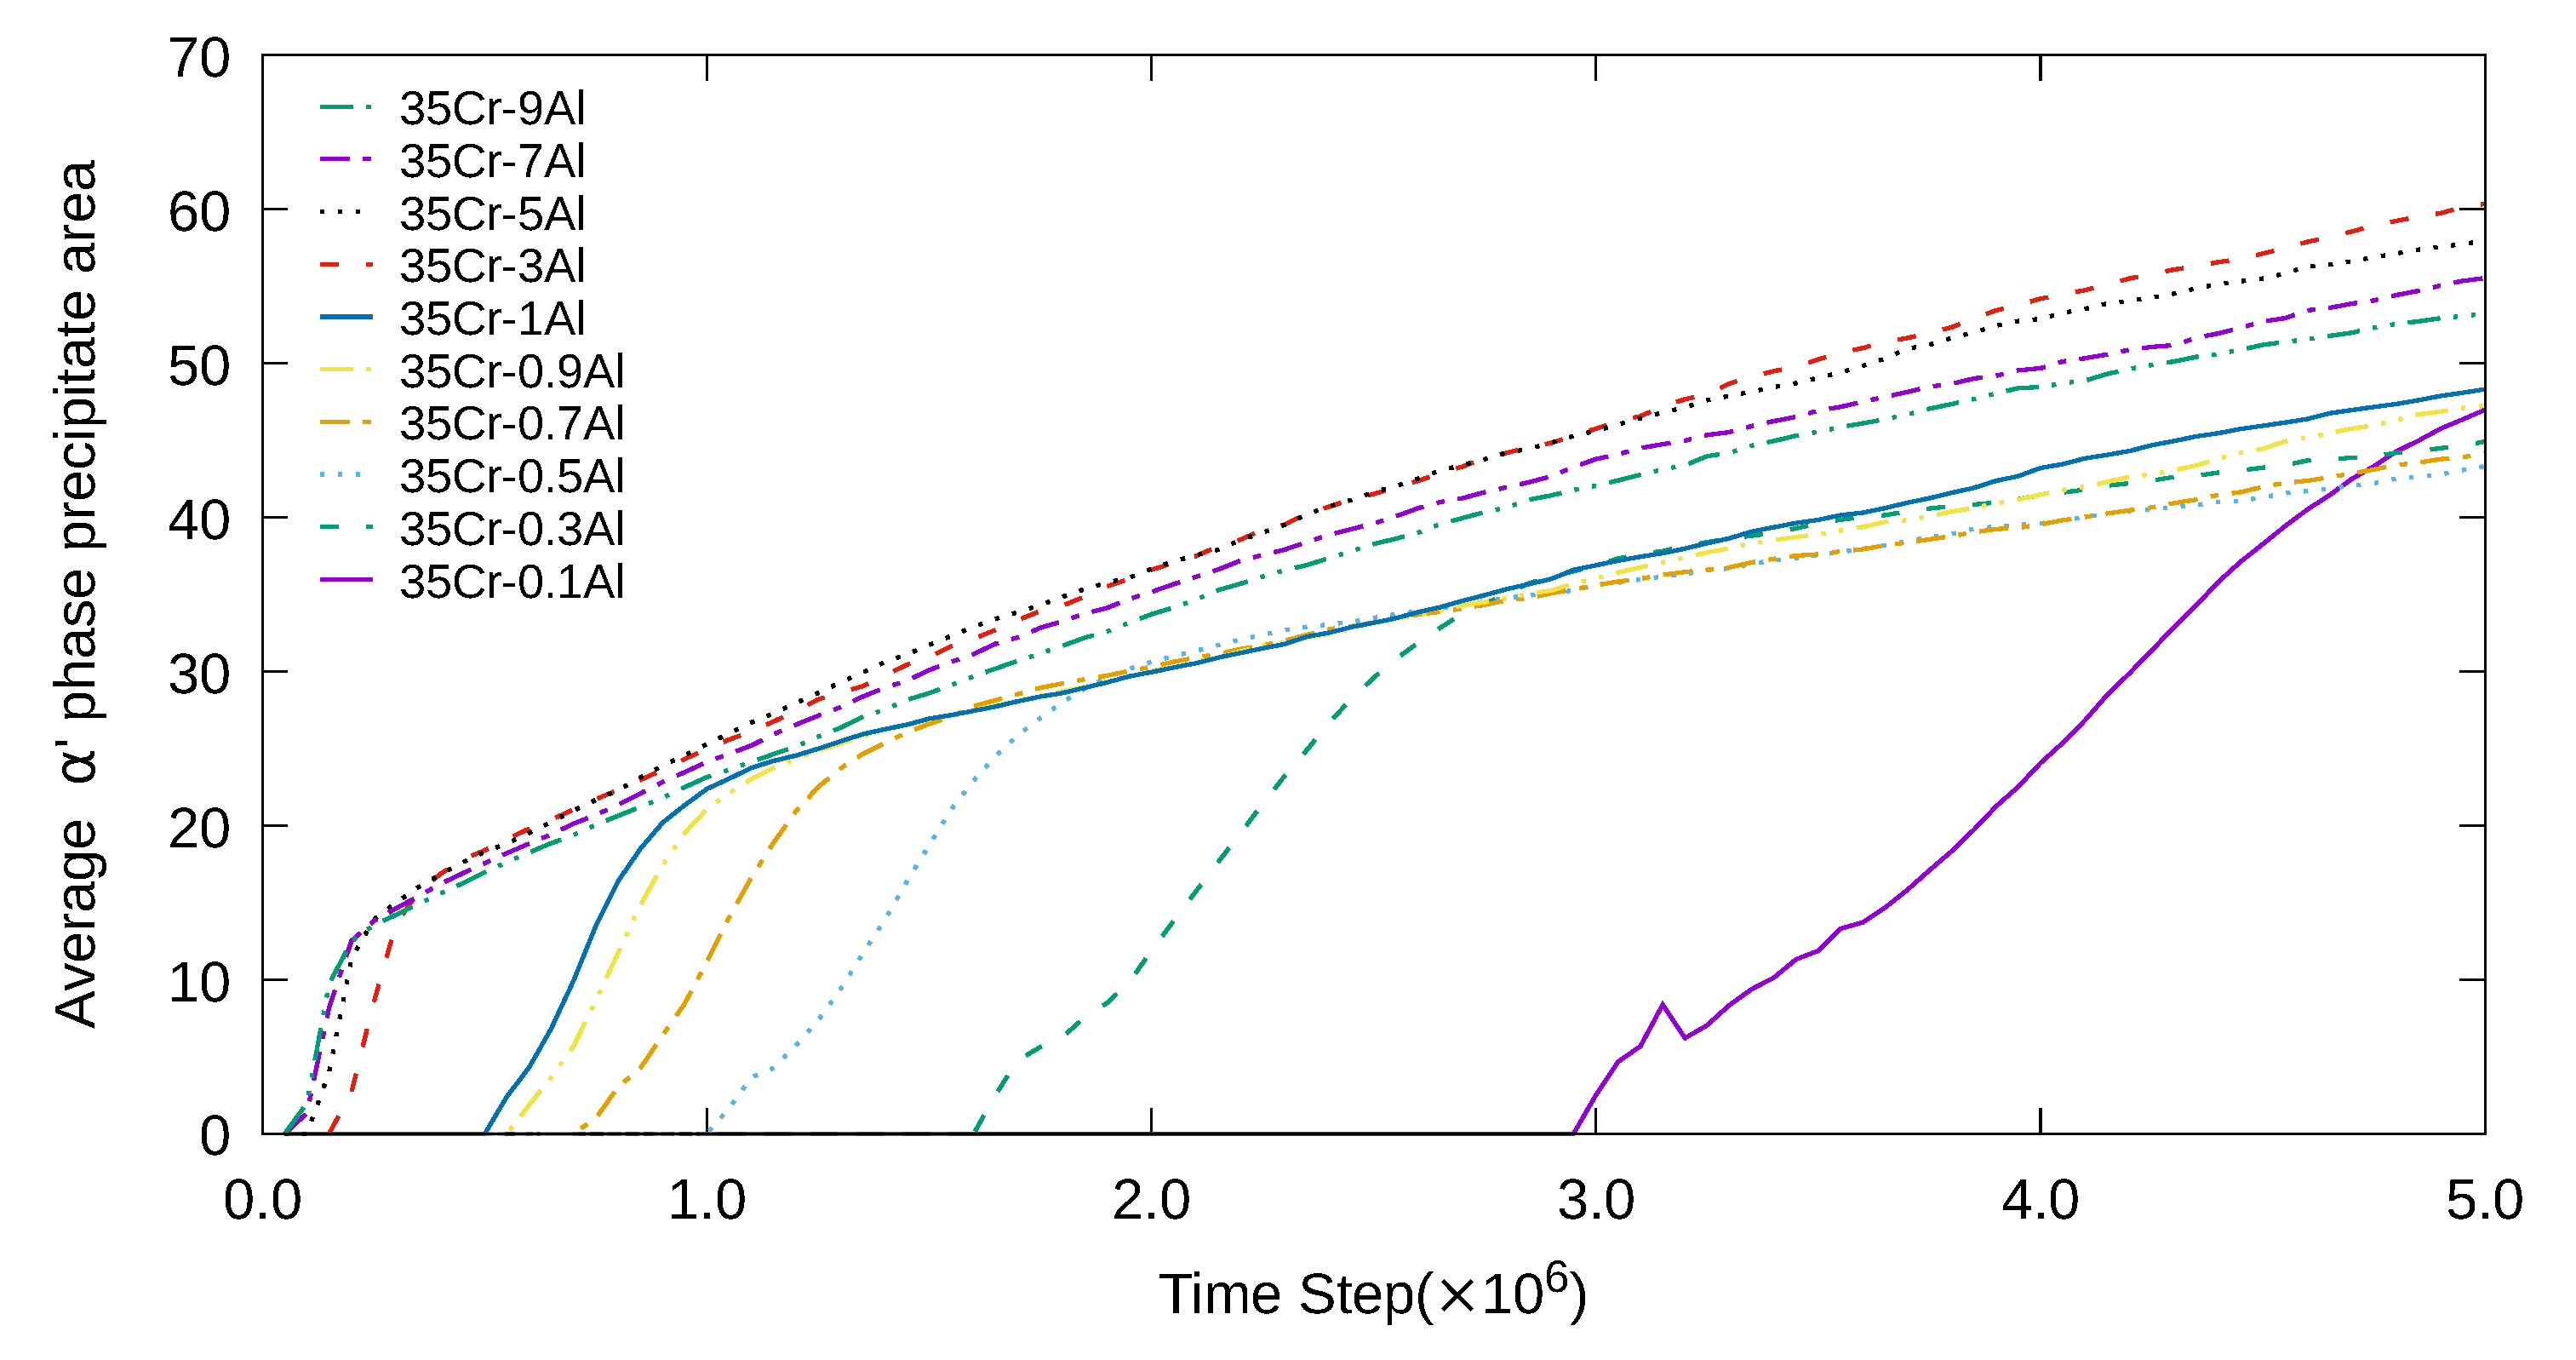
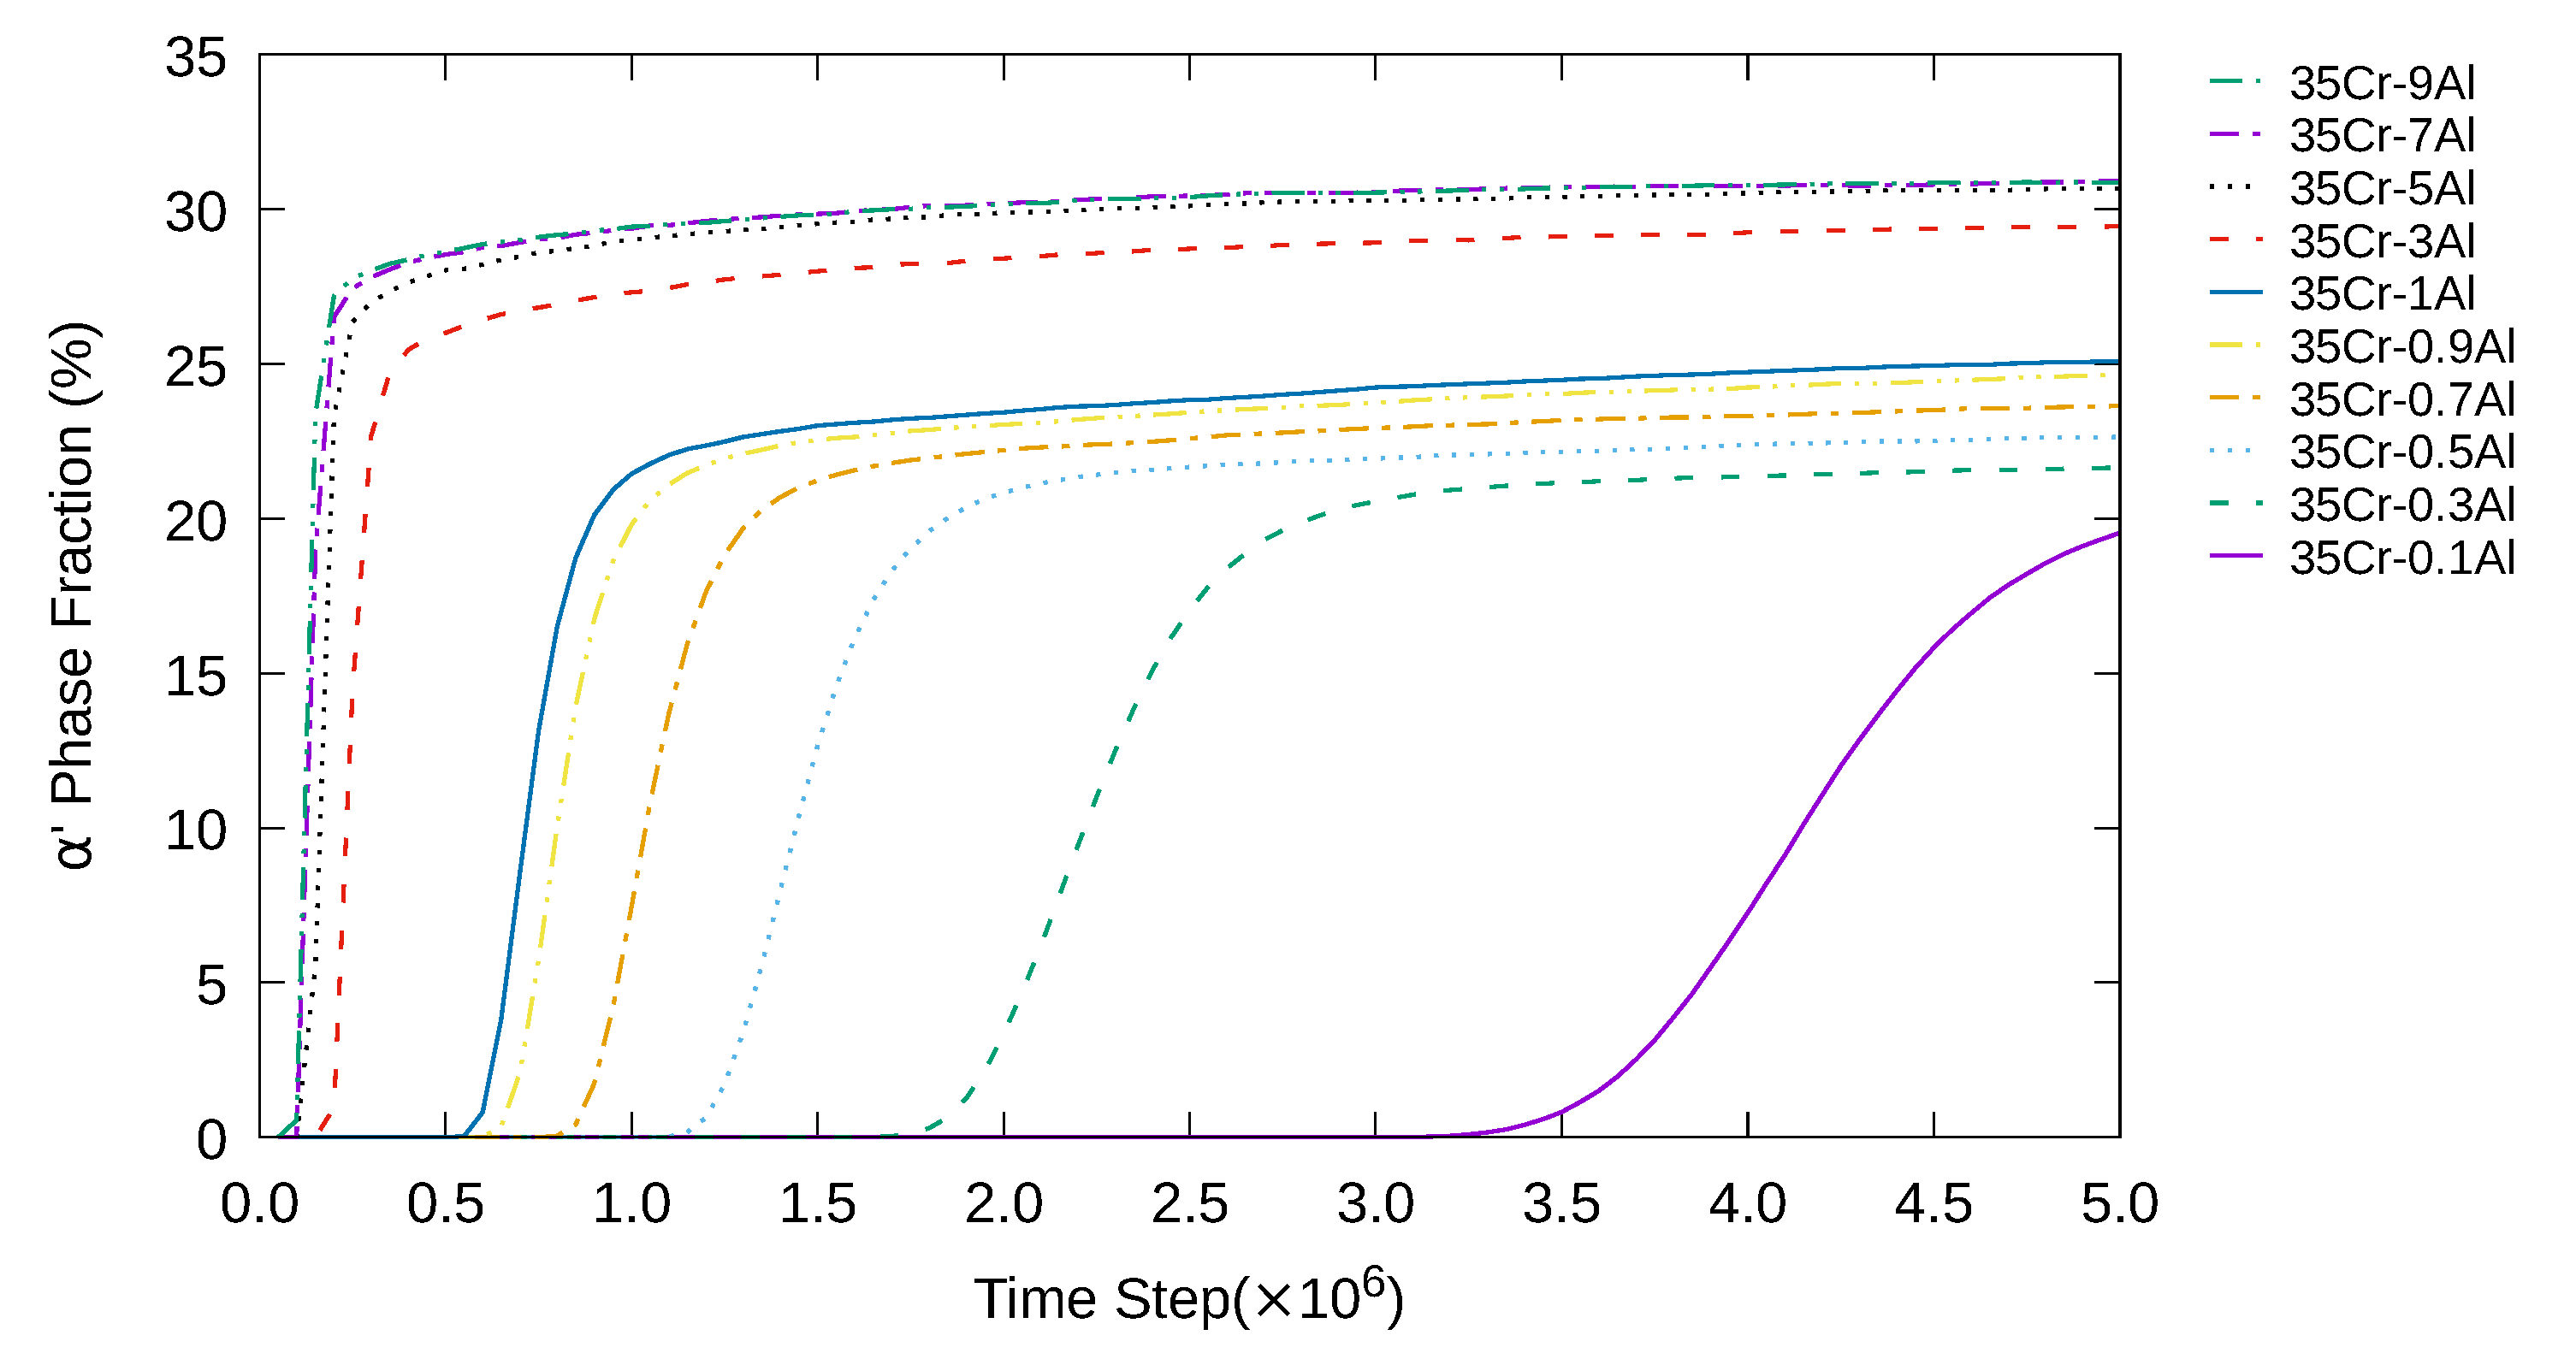
According to Figure 5, at the Cr concentration of 35%, the initiation of phase separation occurred when the average Al concentration was between 0.1% and 9%, which is a wider range than that of 30 Cr%. In addition, when the average Cr concentration was 35%, the initiation of phase separation increased with an increase in the average Al concentration, which is consistent with that of 30 Cr%. When the average Al concentration was between 3% and 9%, the initiation of phase separation occurred at a faster rate compared to that when the Al concentrations were between 0.1% and 1%.
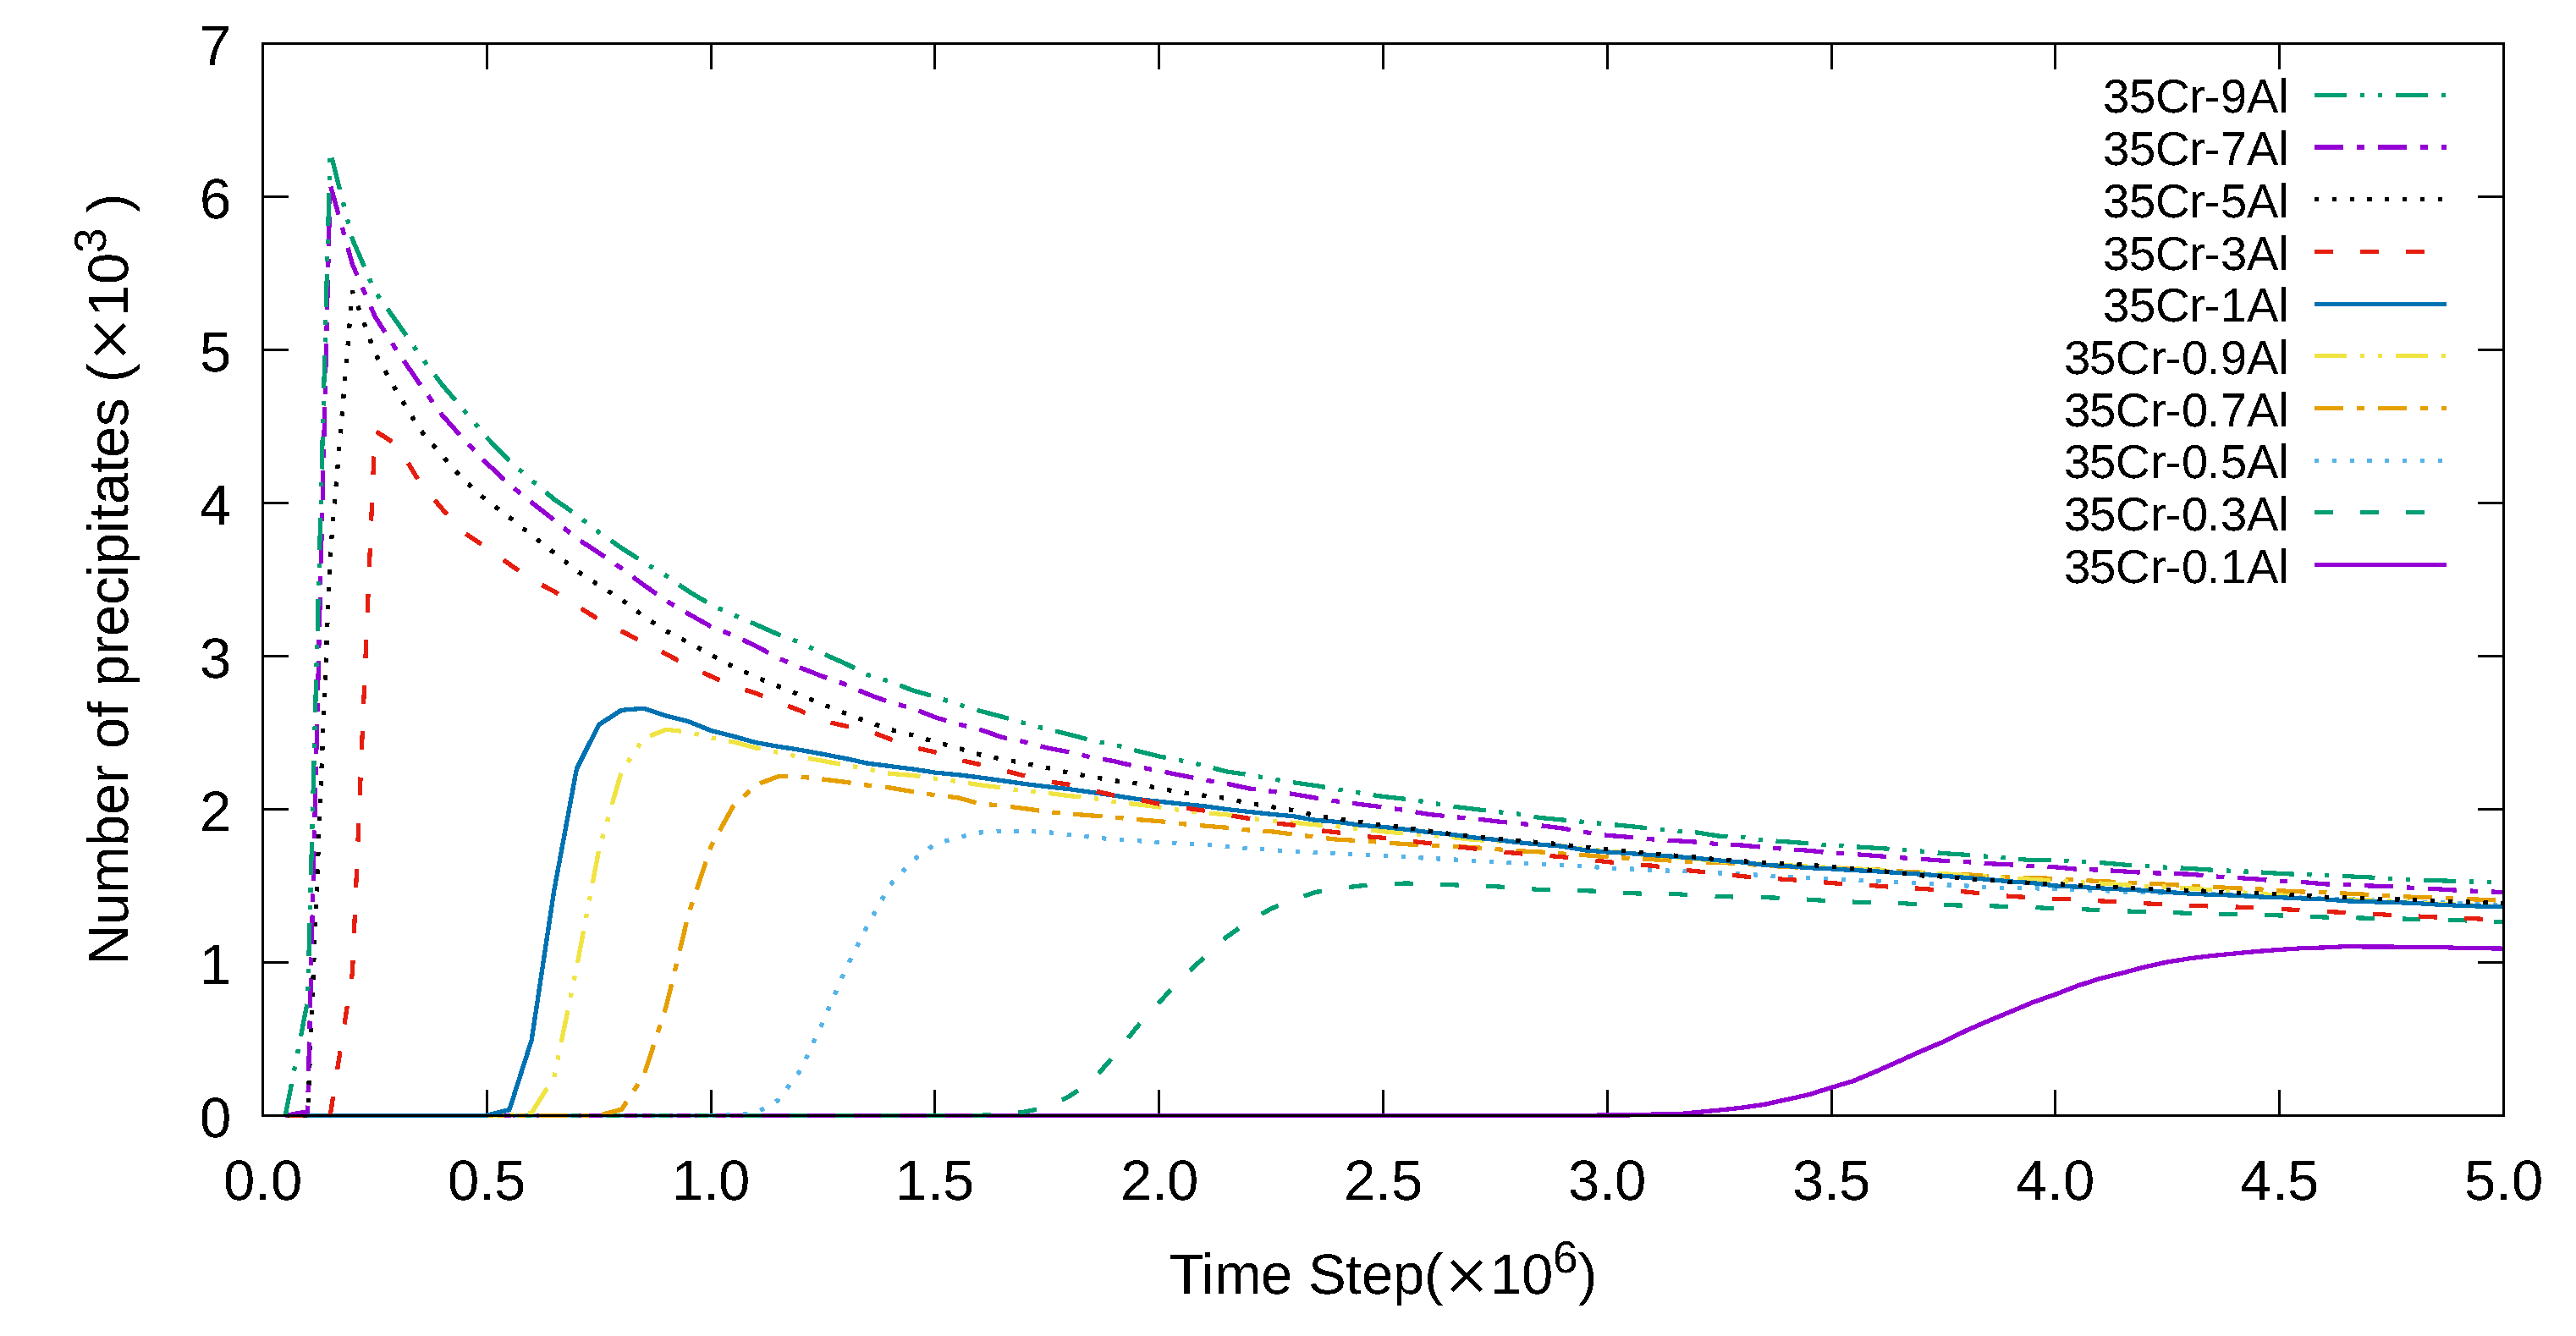
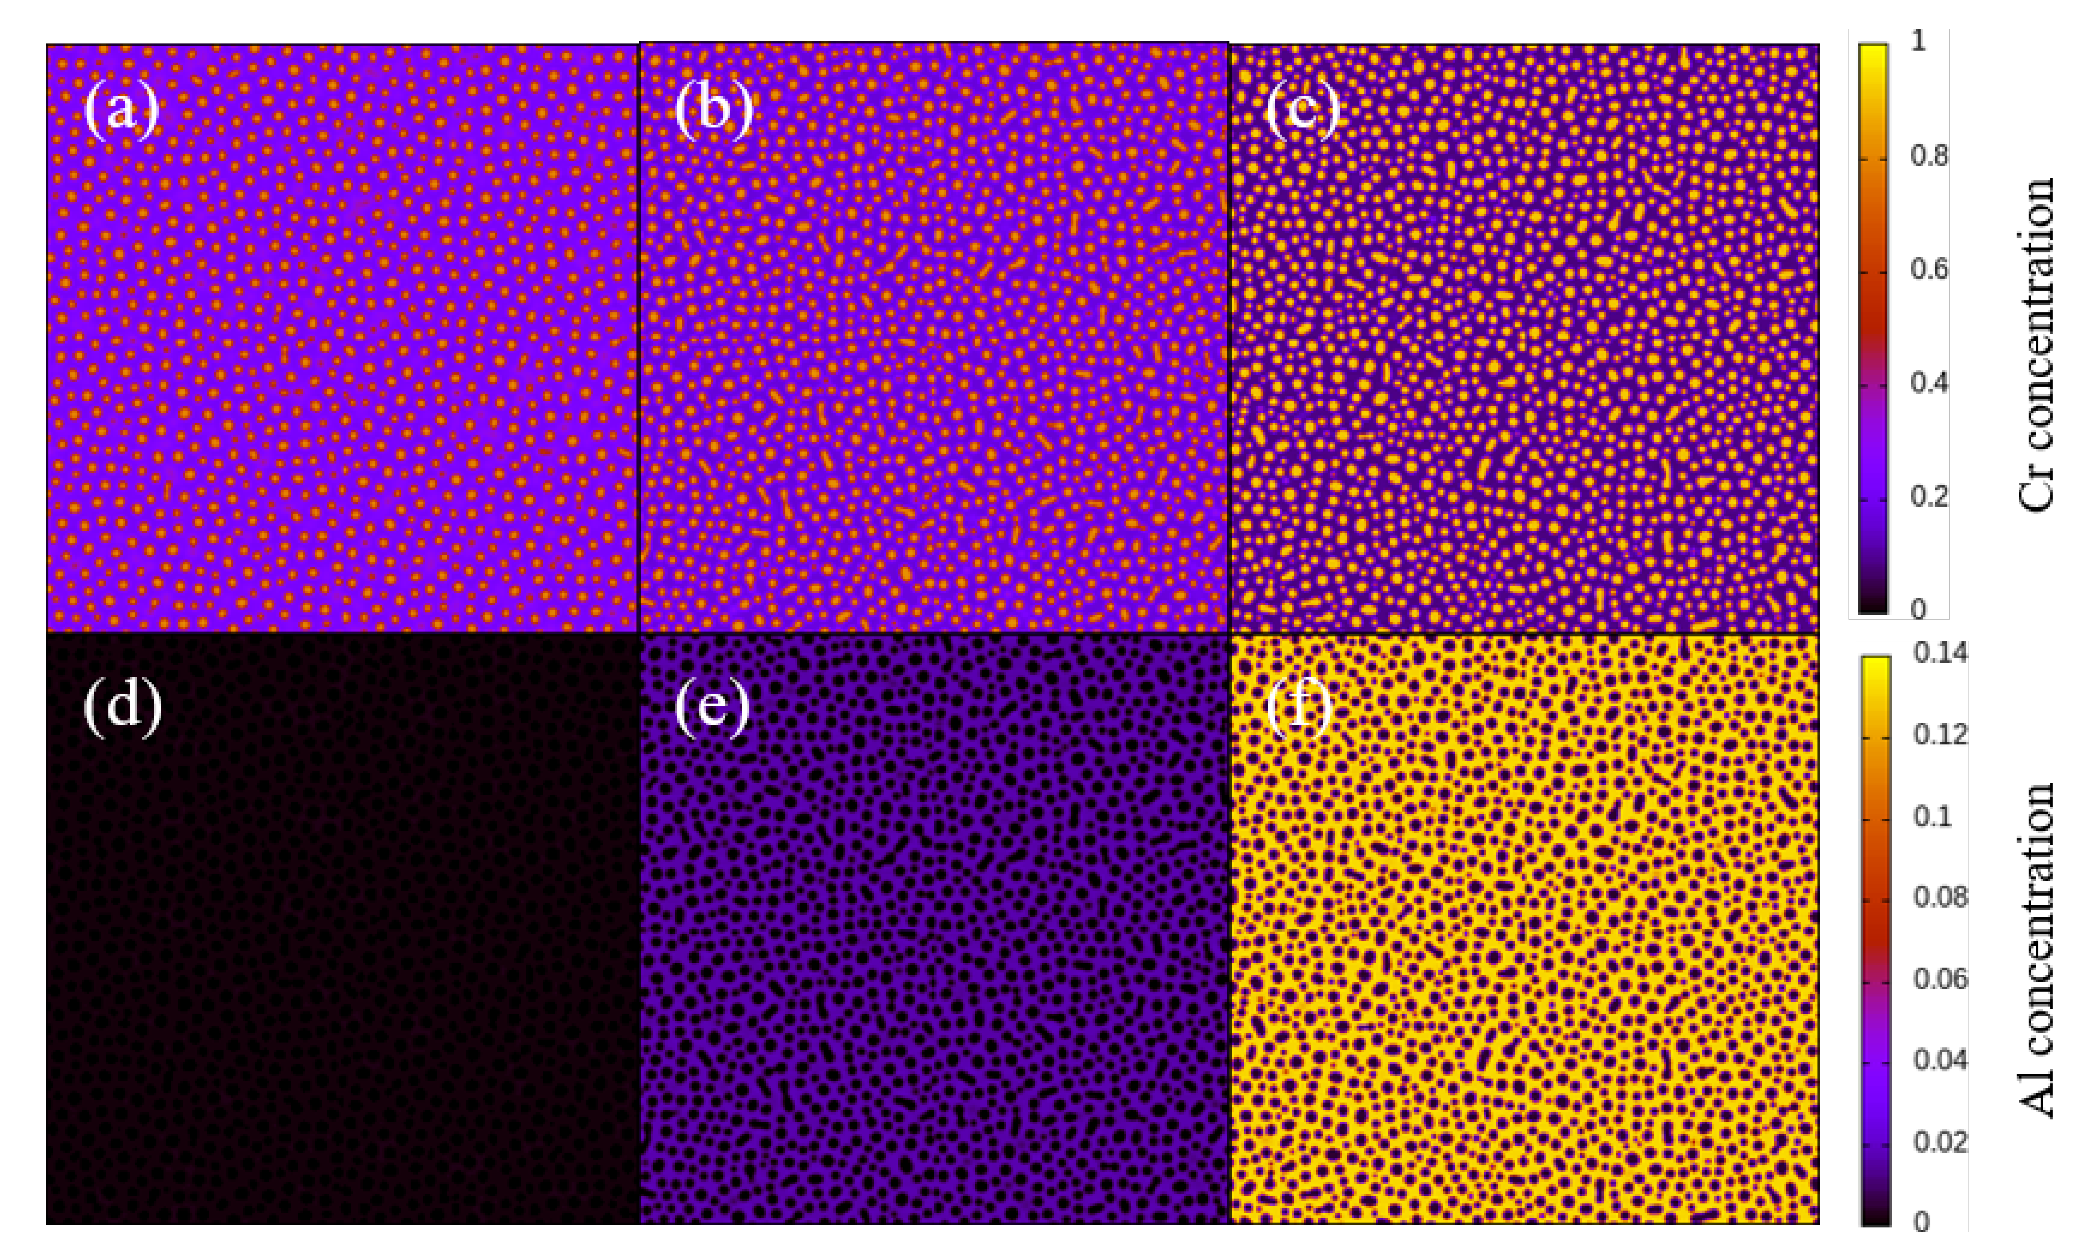
With an increase in the average Al concentration, the peak of the α phase number density increased, as shown in Figure 6. In addition, after the initial peak, when the average Al concentration was between 3% and 9%, the number of the α phase precipitates decreased significantly. Furthermore, as shown in Figure 7 and Figure 8, with an increase in the average Al concentration, the α phase fraction increased, which is consistent with that of 30 Cr%.
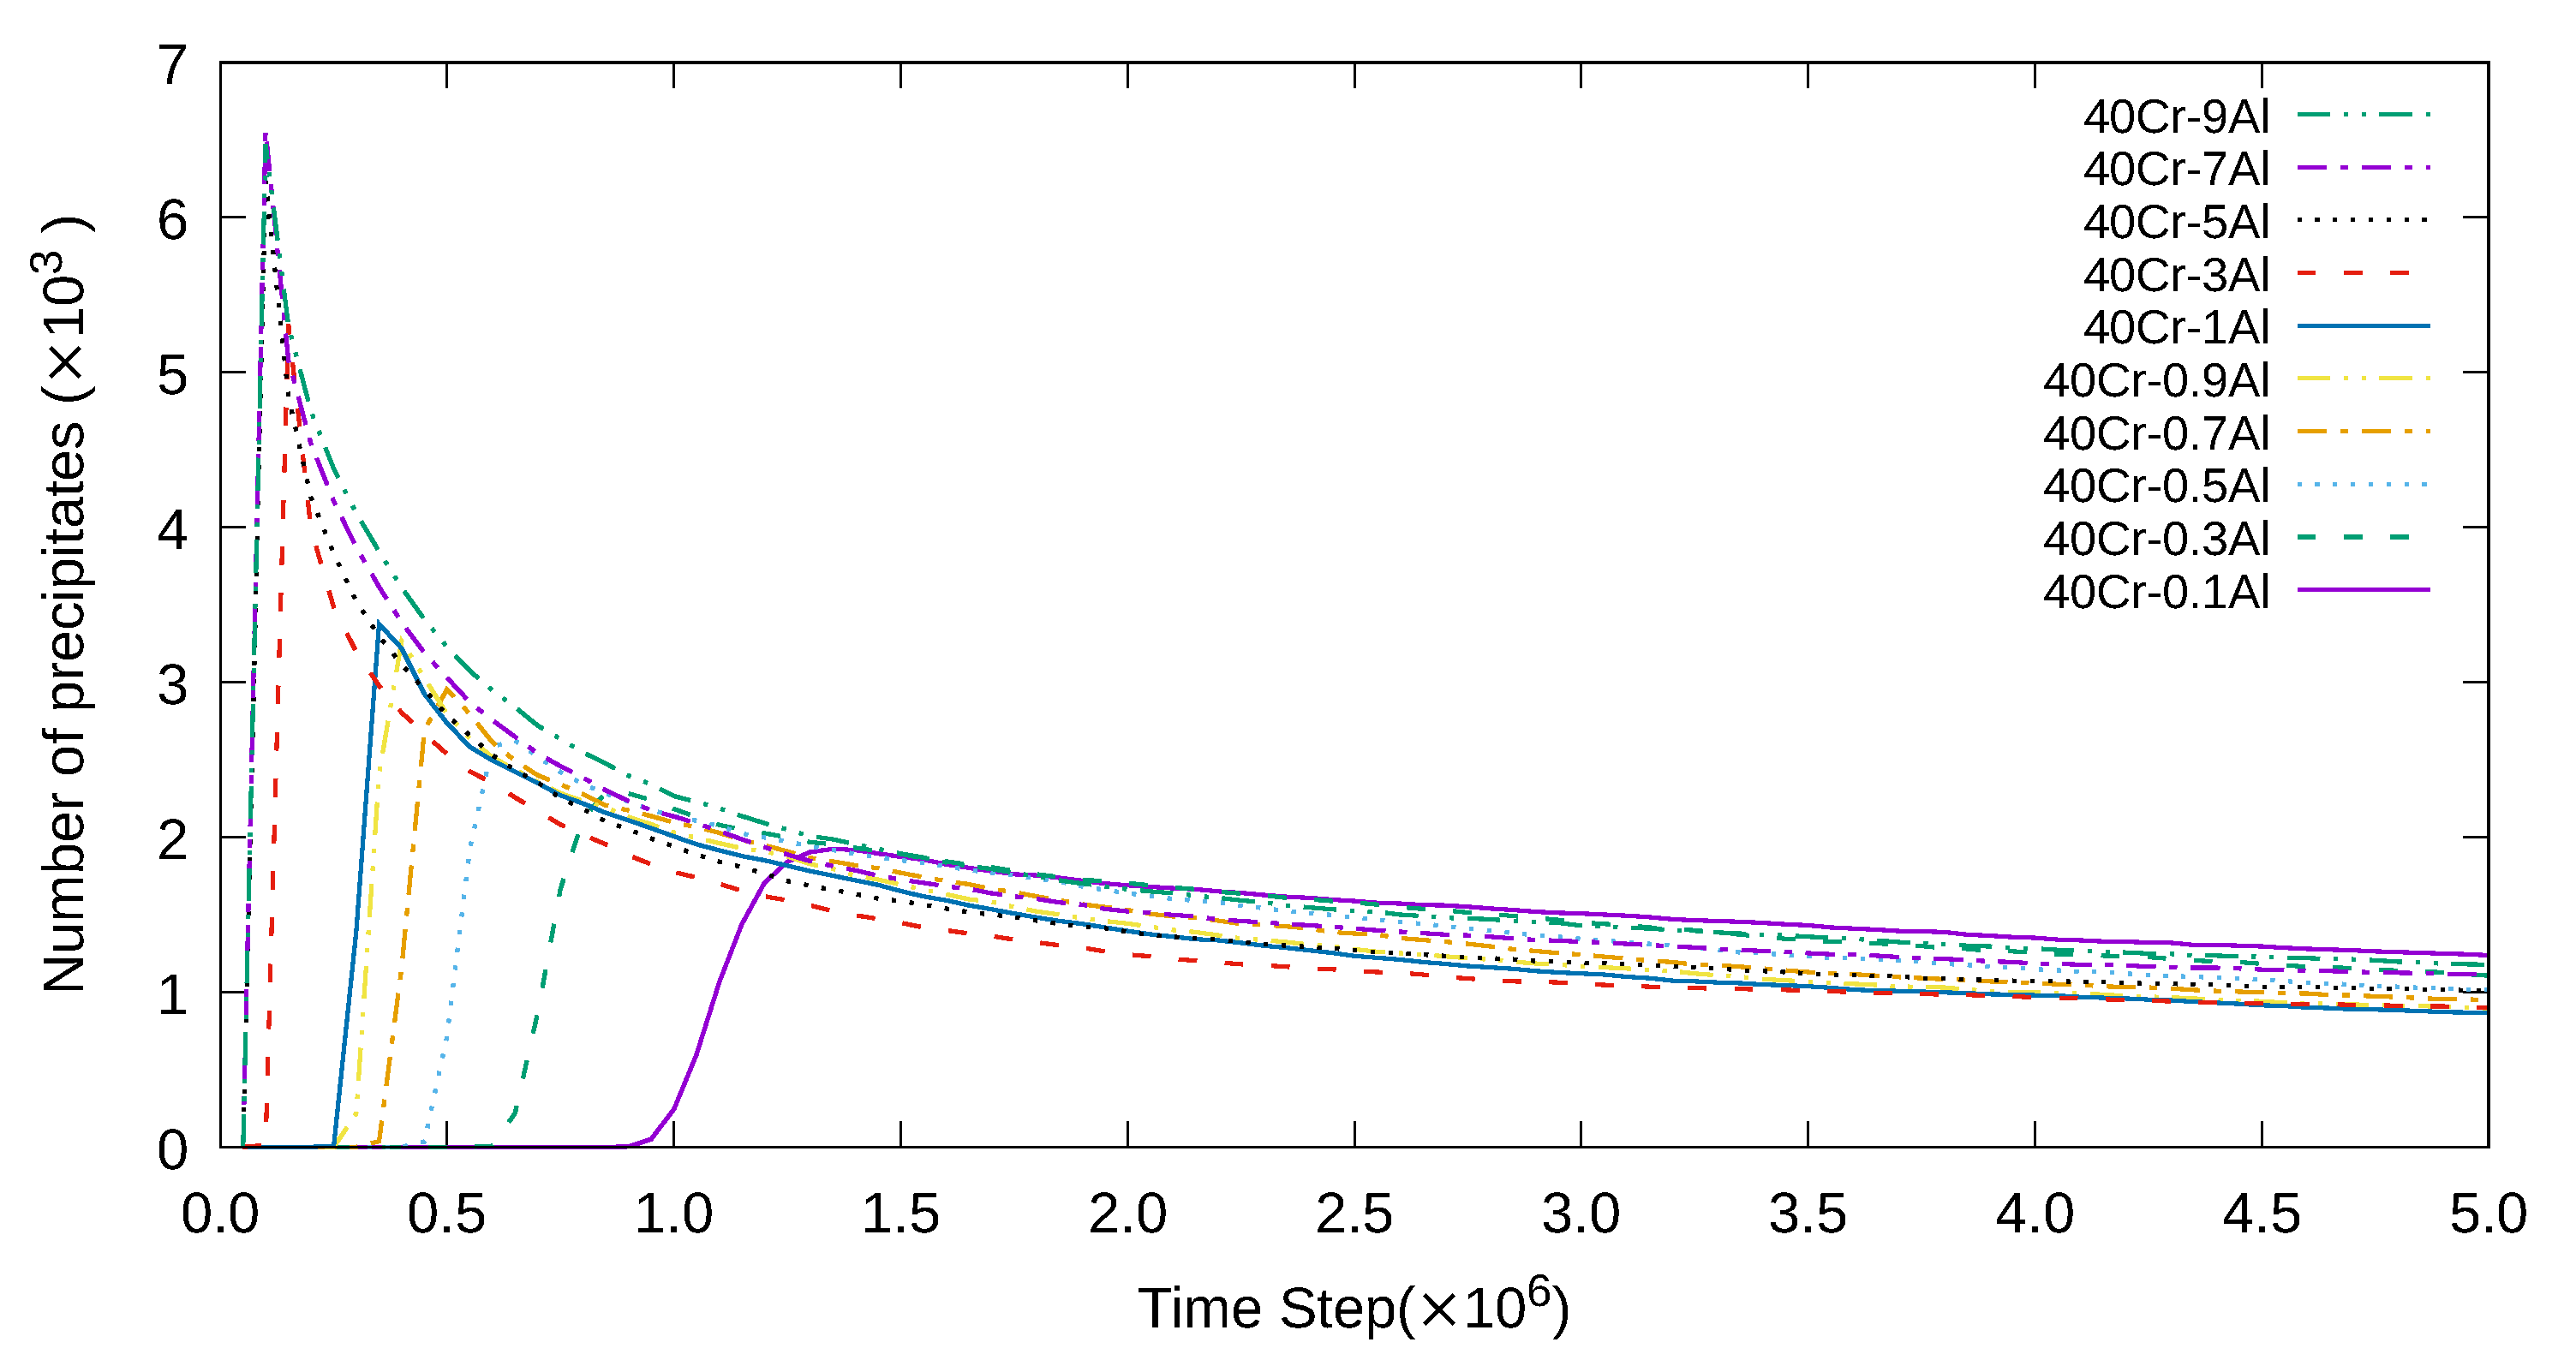
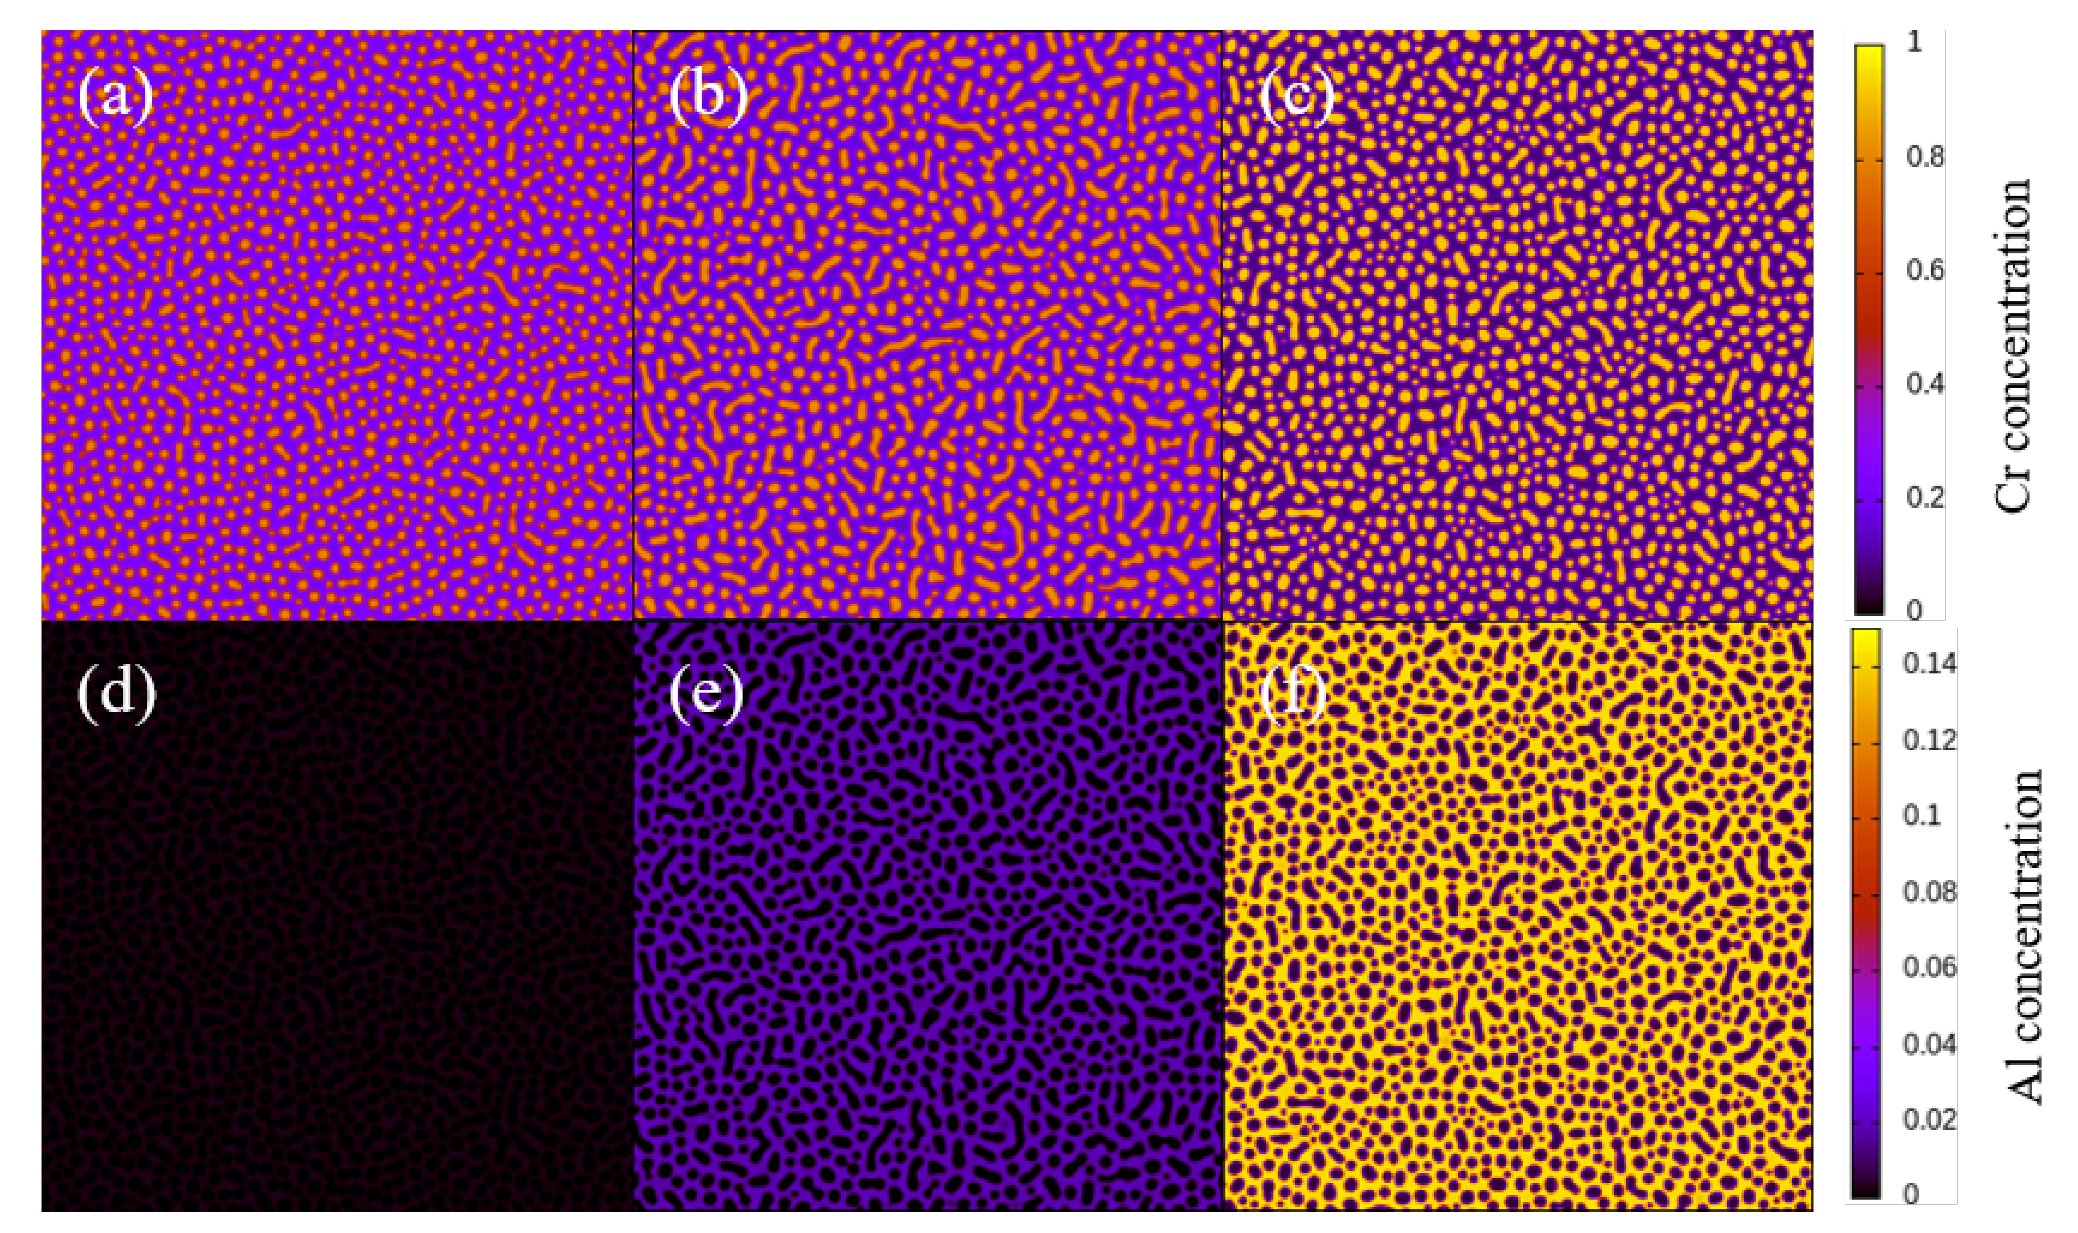
When the average Cr concentration was 40%, at any given Al concentration, the initiation of phase separation occurred faster in comparison to that when the Cr concentrations were 30% and 35%, as shown in Figure 9. In addition, the initial peak of the α phase number density shifted to the left compared to those of the 30% and 35% Cr concentrations. Furthermore, for 30 Cr% and 35 Cr%, the phase fractions increased with an increase in the average Al concentration, as shown in Figure 10.
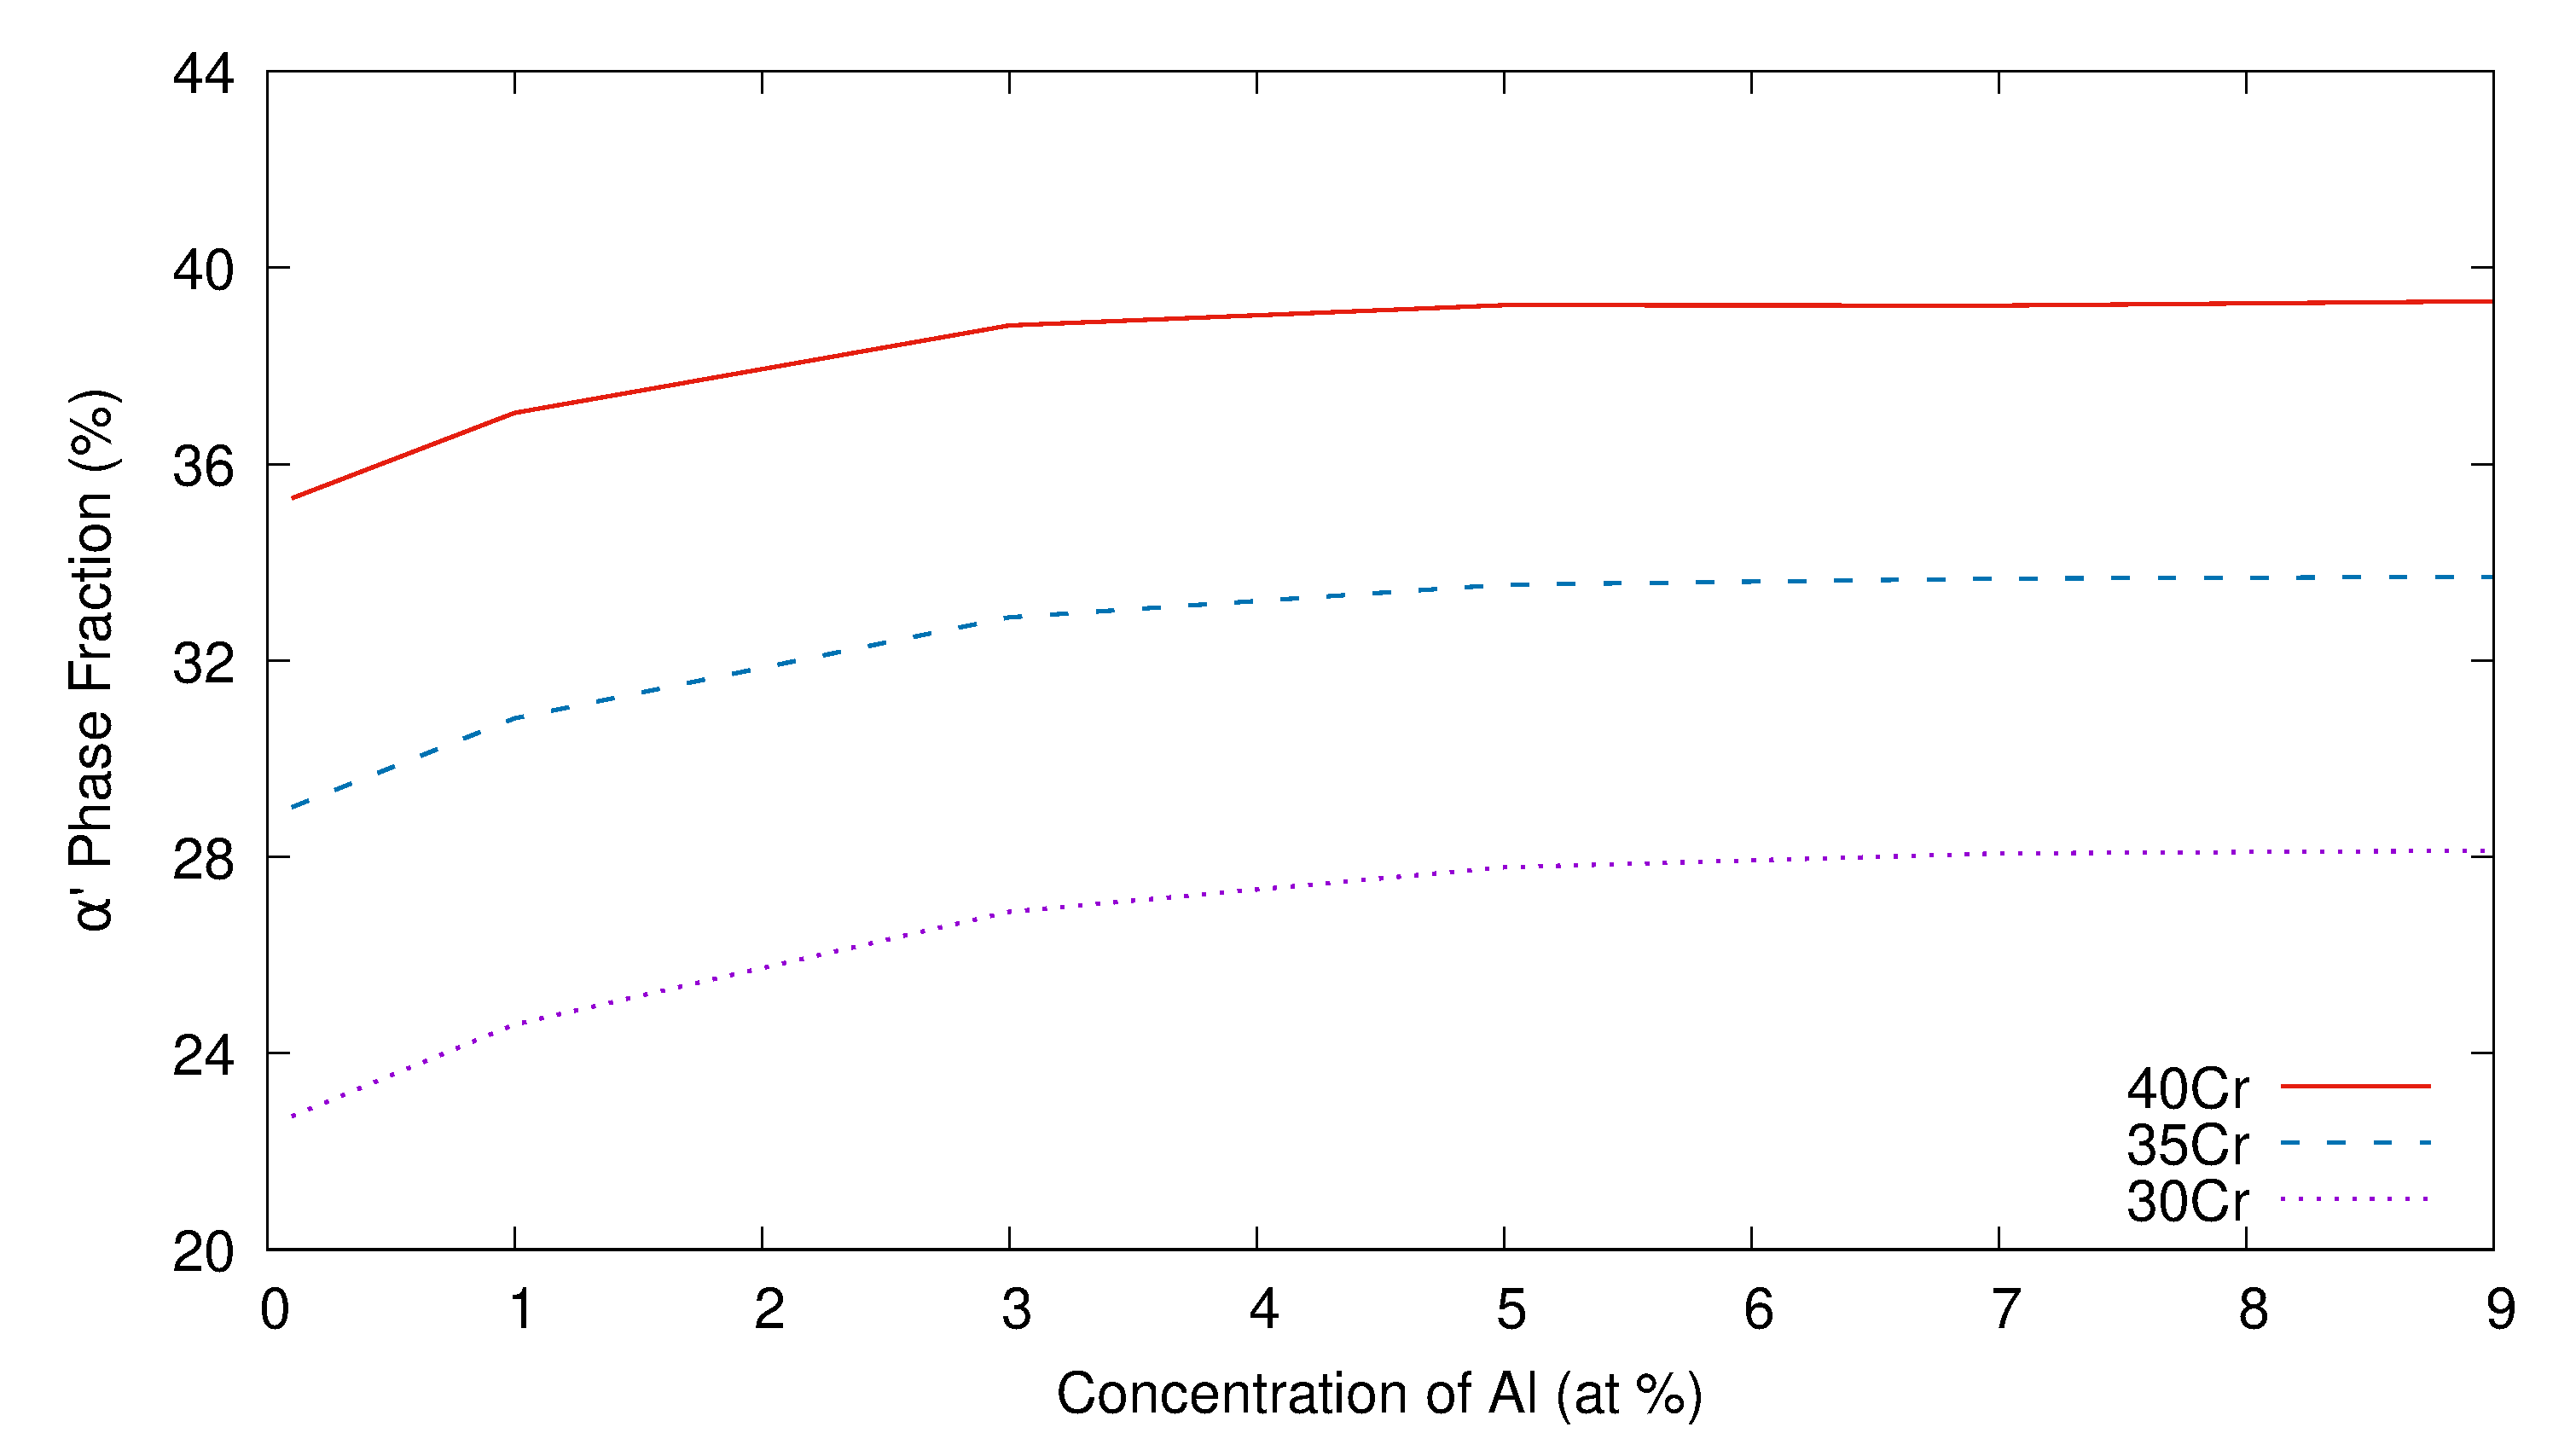
We predicted the α phase fraction using the FactSage thermochemical software and FactSage steel (FSstel) alloy databases [45]. As shown in Figure 11, the α phase fraction increased with an increase in the average Al concentration when the average Cr concentrations were 30%, 35%, and 40%. This trend is consistent with that of the thermodynamic modeling in Figure 11. In addition, we employed a non-dimensional parameter, χ , as in Equation (13), to quantify the relationship between the Al concentration and α phase fraction. The χ decreased and converged to 0 with an increase in the Al concentration ( > 5 a t % C r ), as shown in Figure 11. This tendency was generally observed for all 2D and 3D simulations.
χ = Changes of phase fraction ( % ) Changes of average Al concentration ( % )

3.2. Three-Dimensional Simulation of Microstructural Evolution

We simulated the microstructural evolution of the Fe-Cr-Al system until t * = 2.5 × 10 6 and analyzed the microstructure at t * = 2.5 × 10 6 .
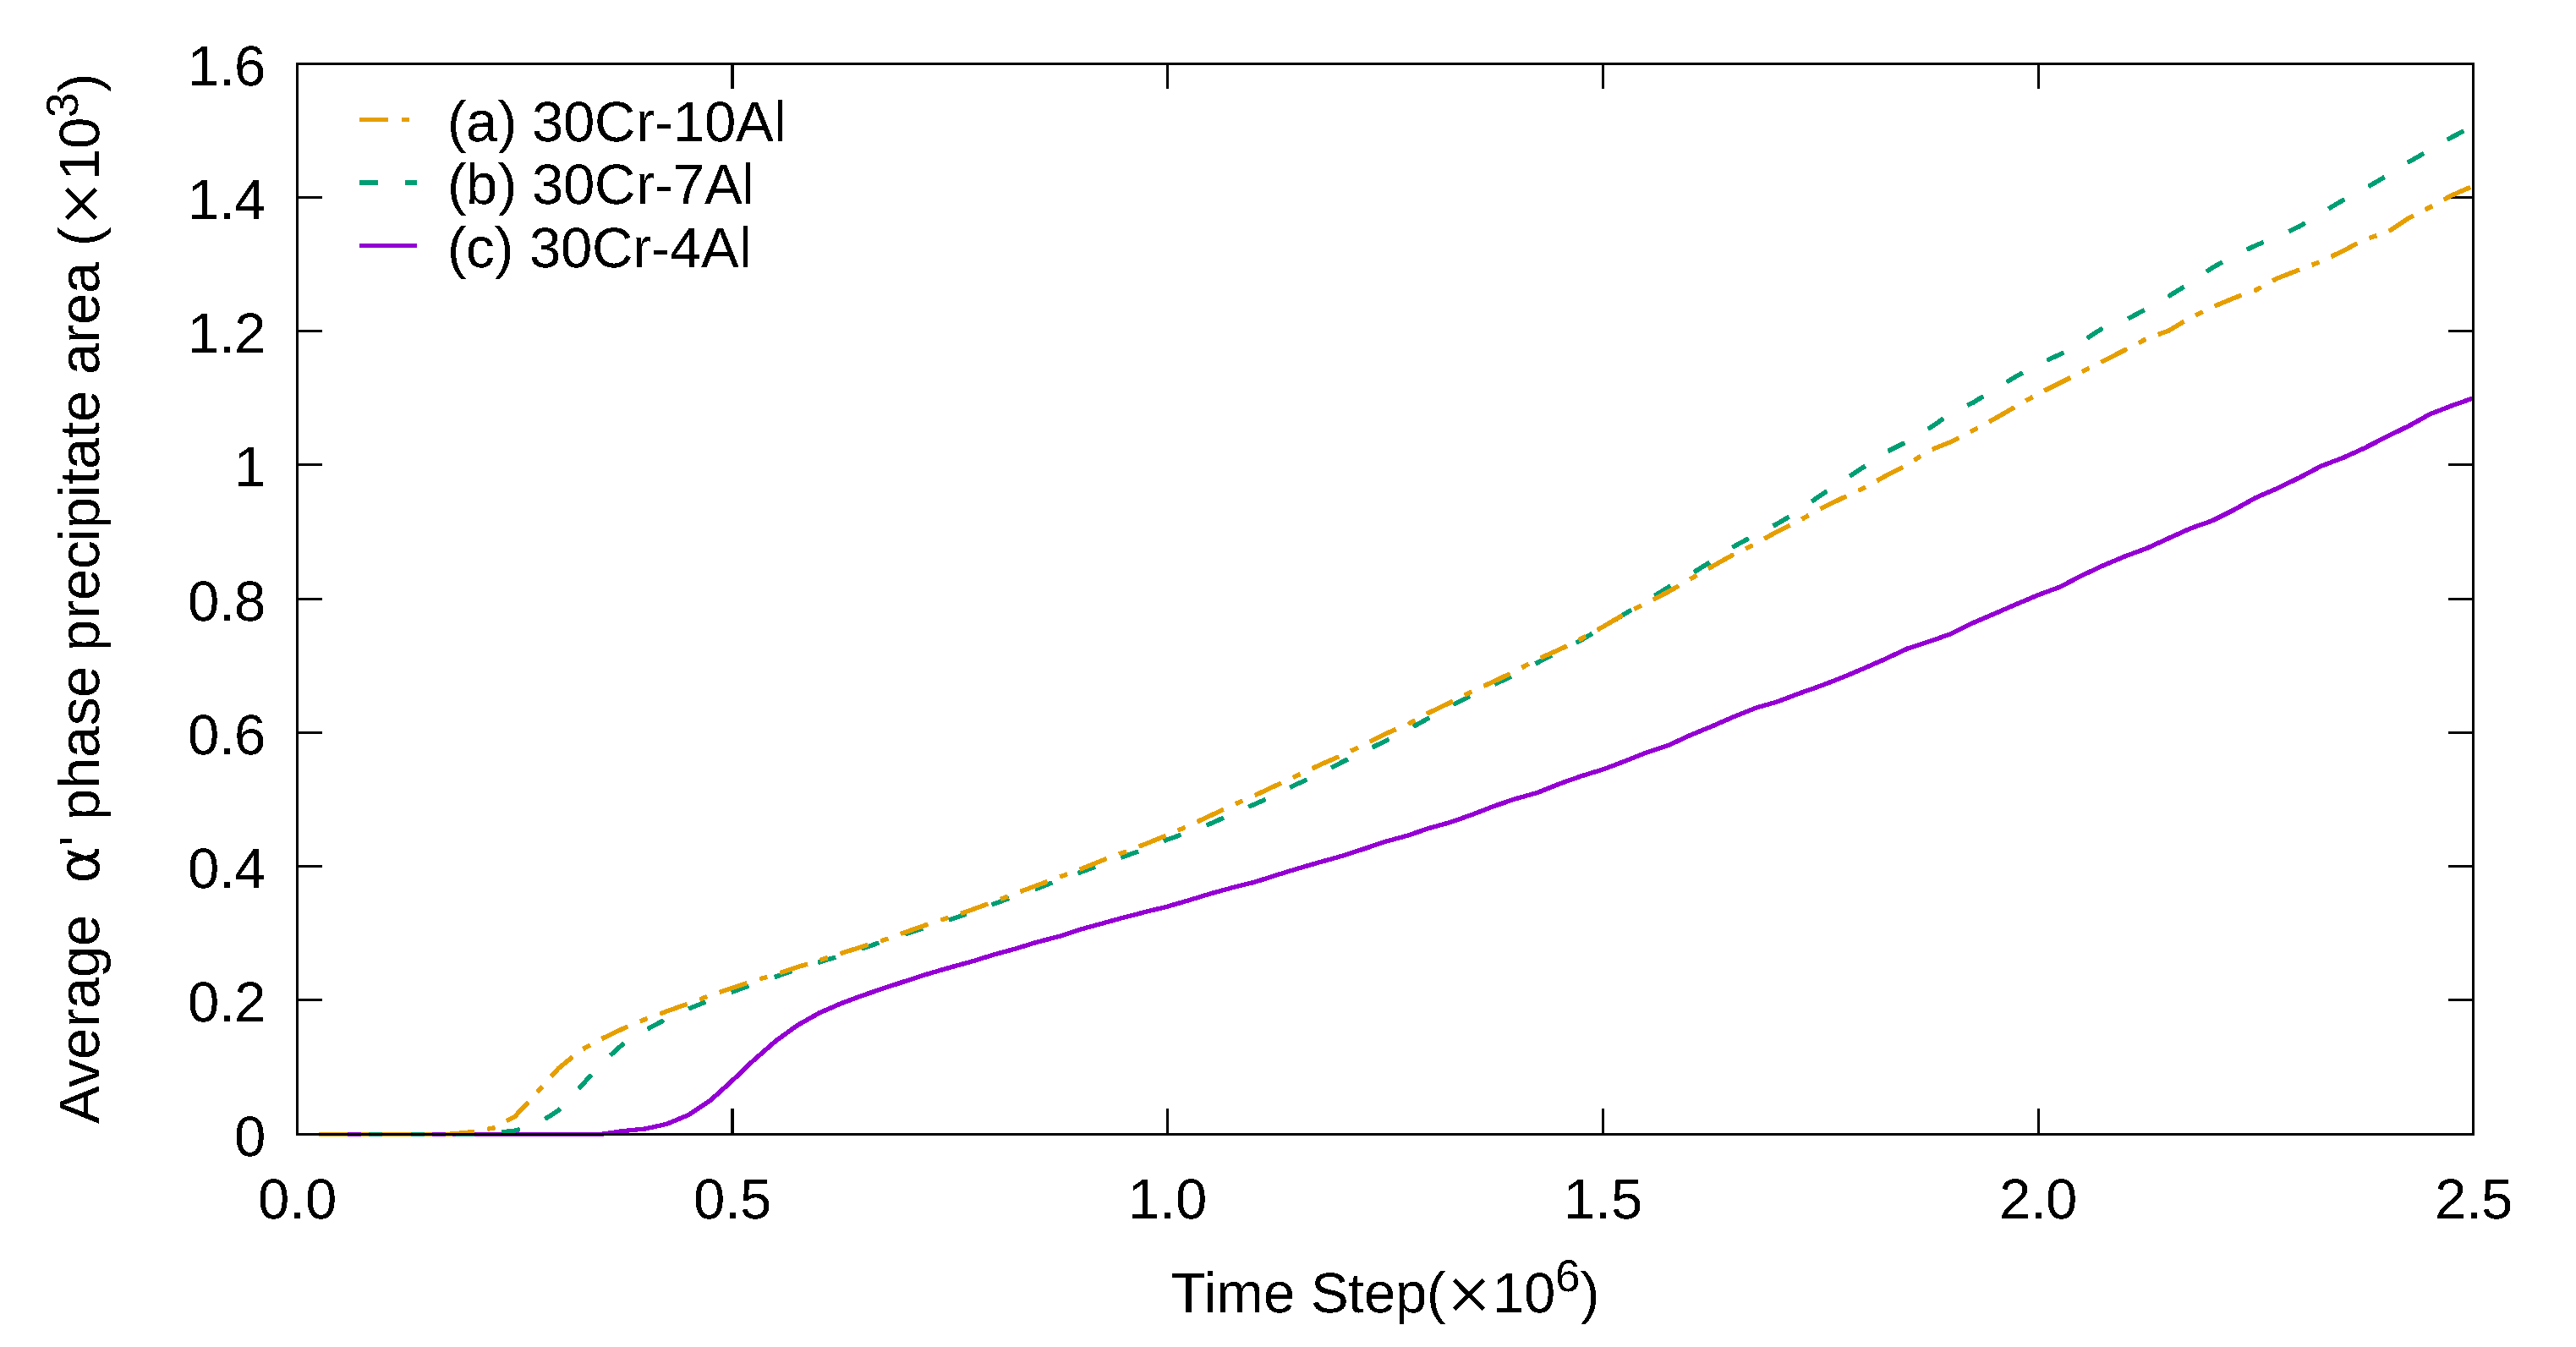
As shown in Figure 12, at an average Cr concentration of 30%, the phase separation occurred when the average Al concentration was between 4% and 10%. In contrast, phase separation was not observed when the Al concentration was between 0.1% and 1%. In addition, with an increase in the Al concentration from 4% to 10%, the initiation of phase separation occurred at a faster rate.
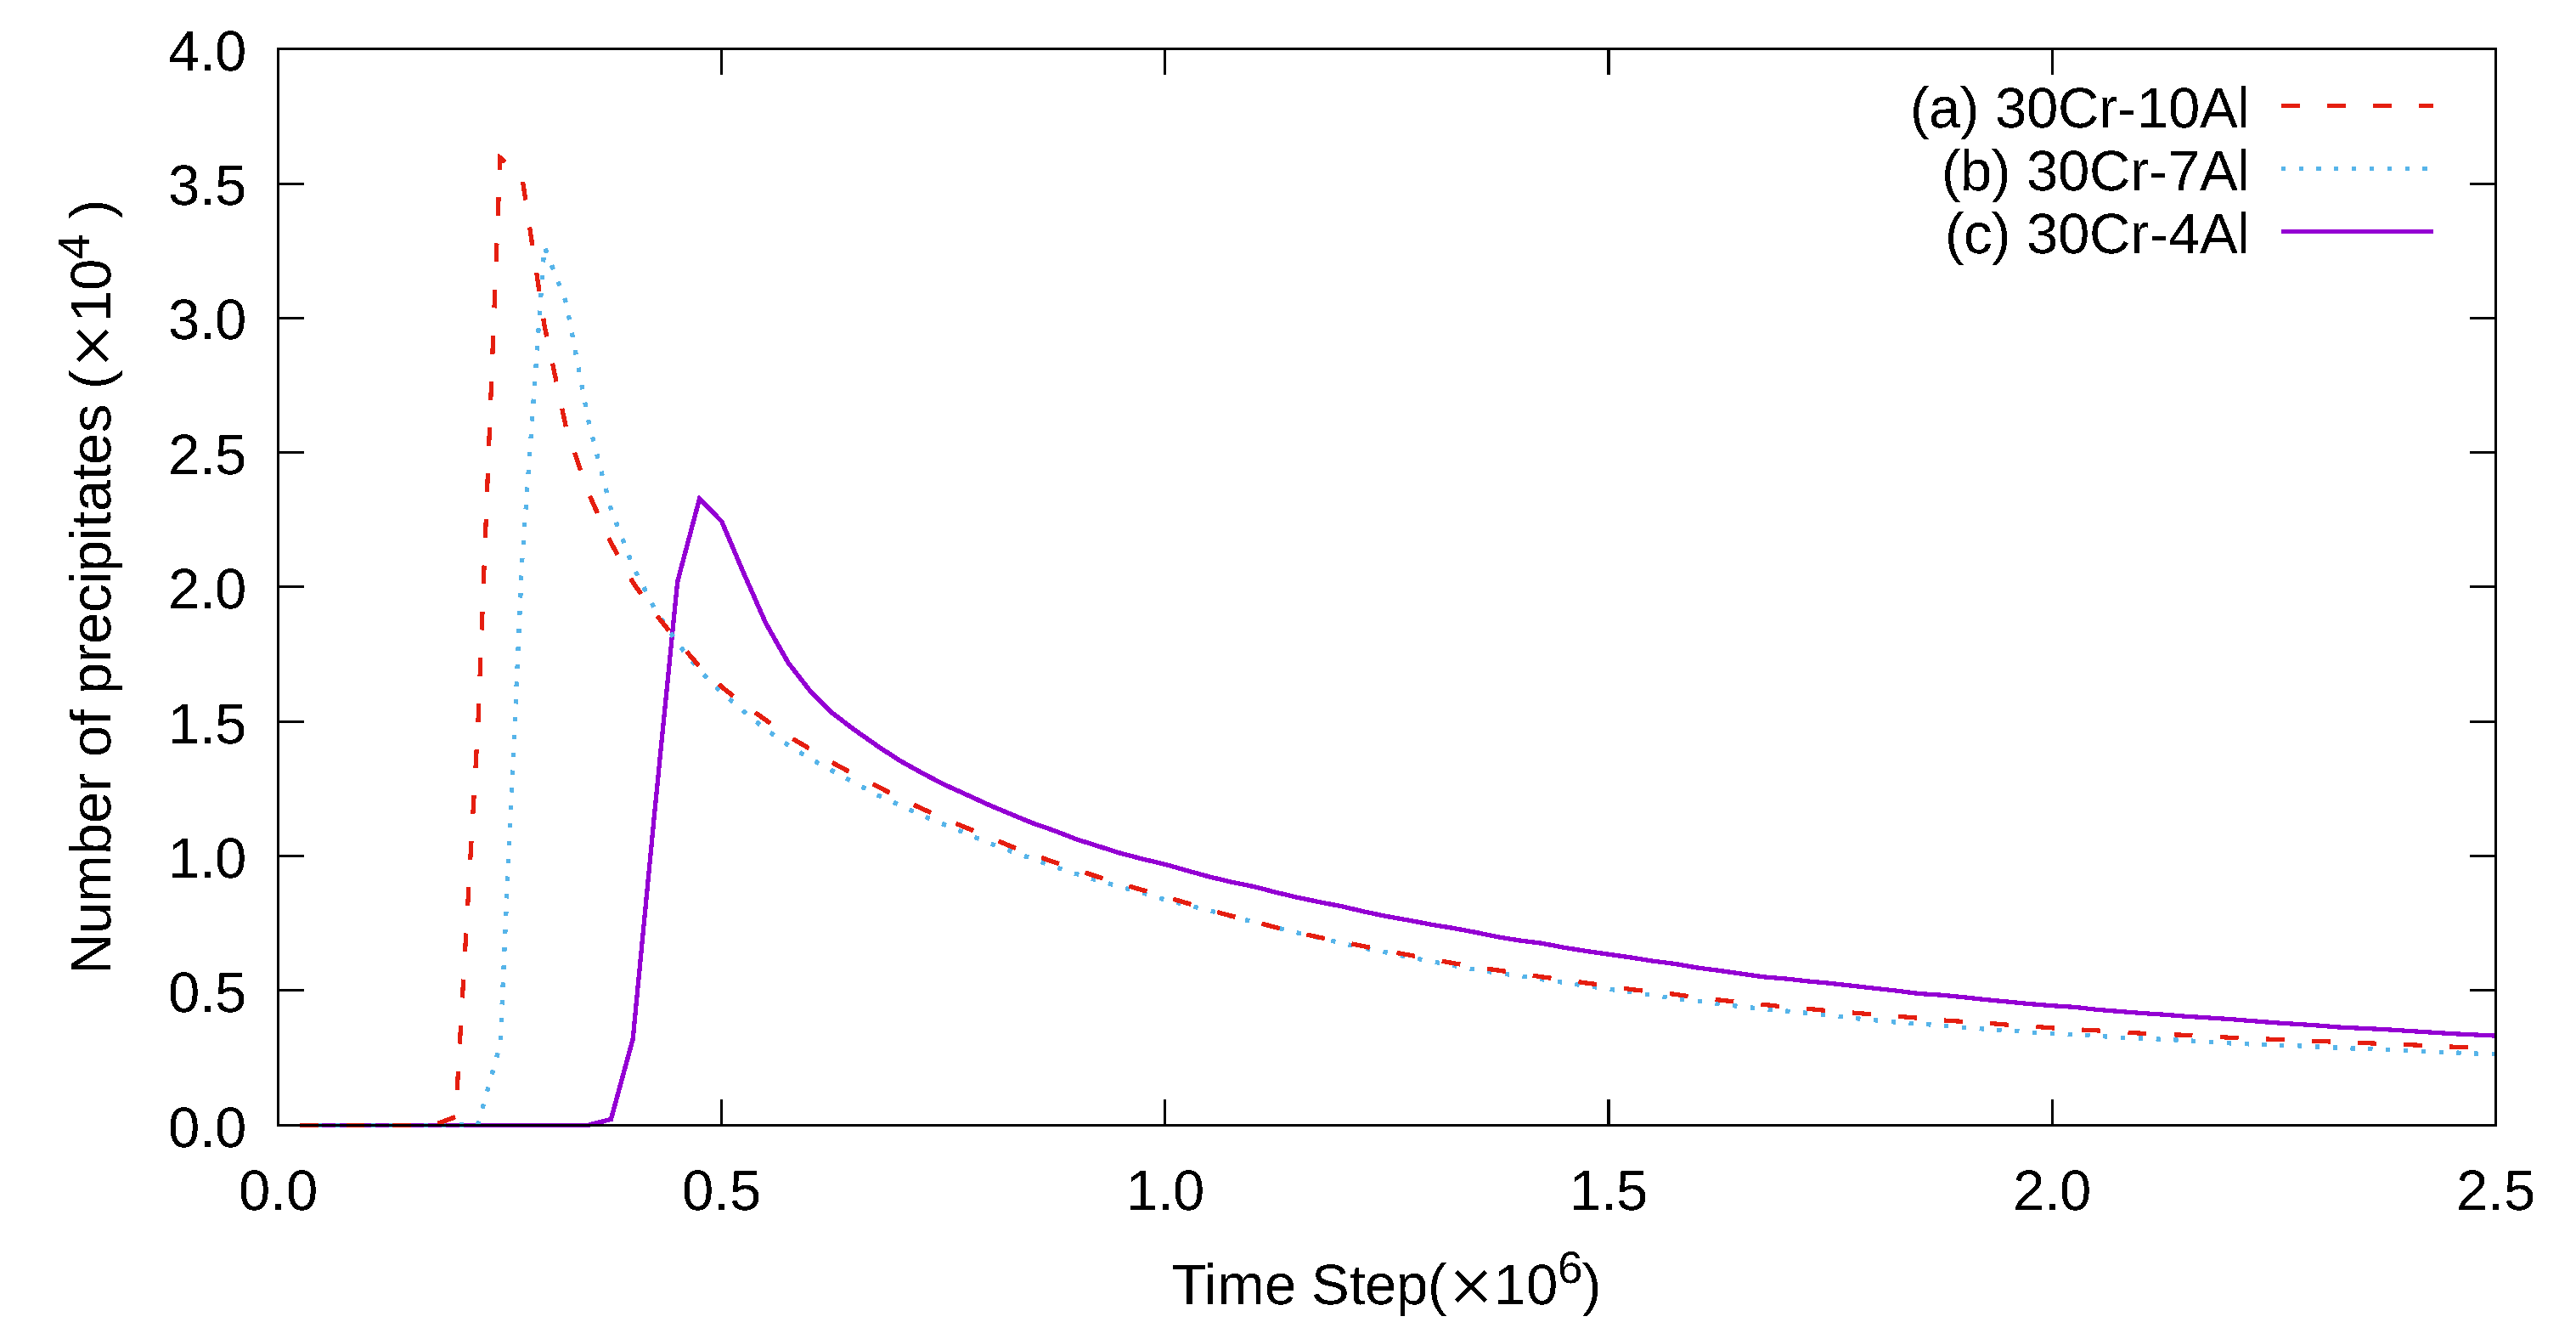
Similarly to the 2D simulation, with an increase in the Al concentration in the 3D simulation, the amplitude of the initial peak in Figure 13 increased. In addition, in the 2D simulation, the phase fraction of α increased with an increase in the Al concentration when the average Cr concentration was 30%.
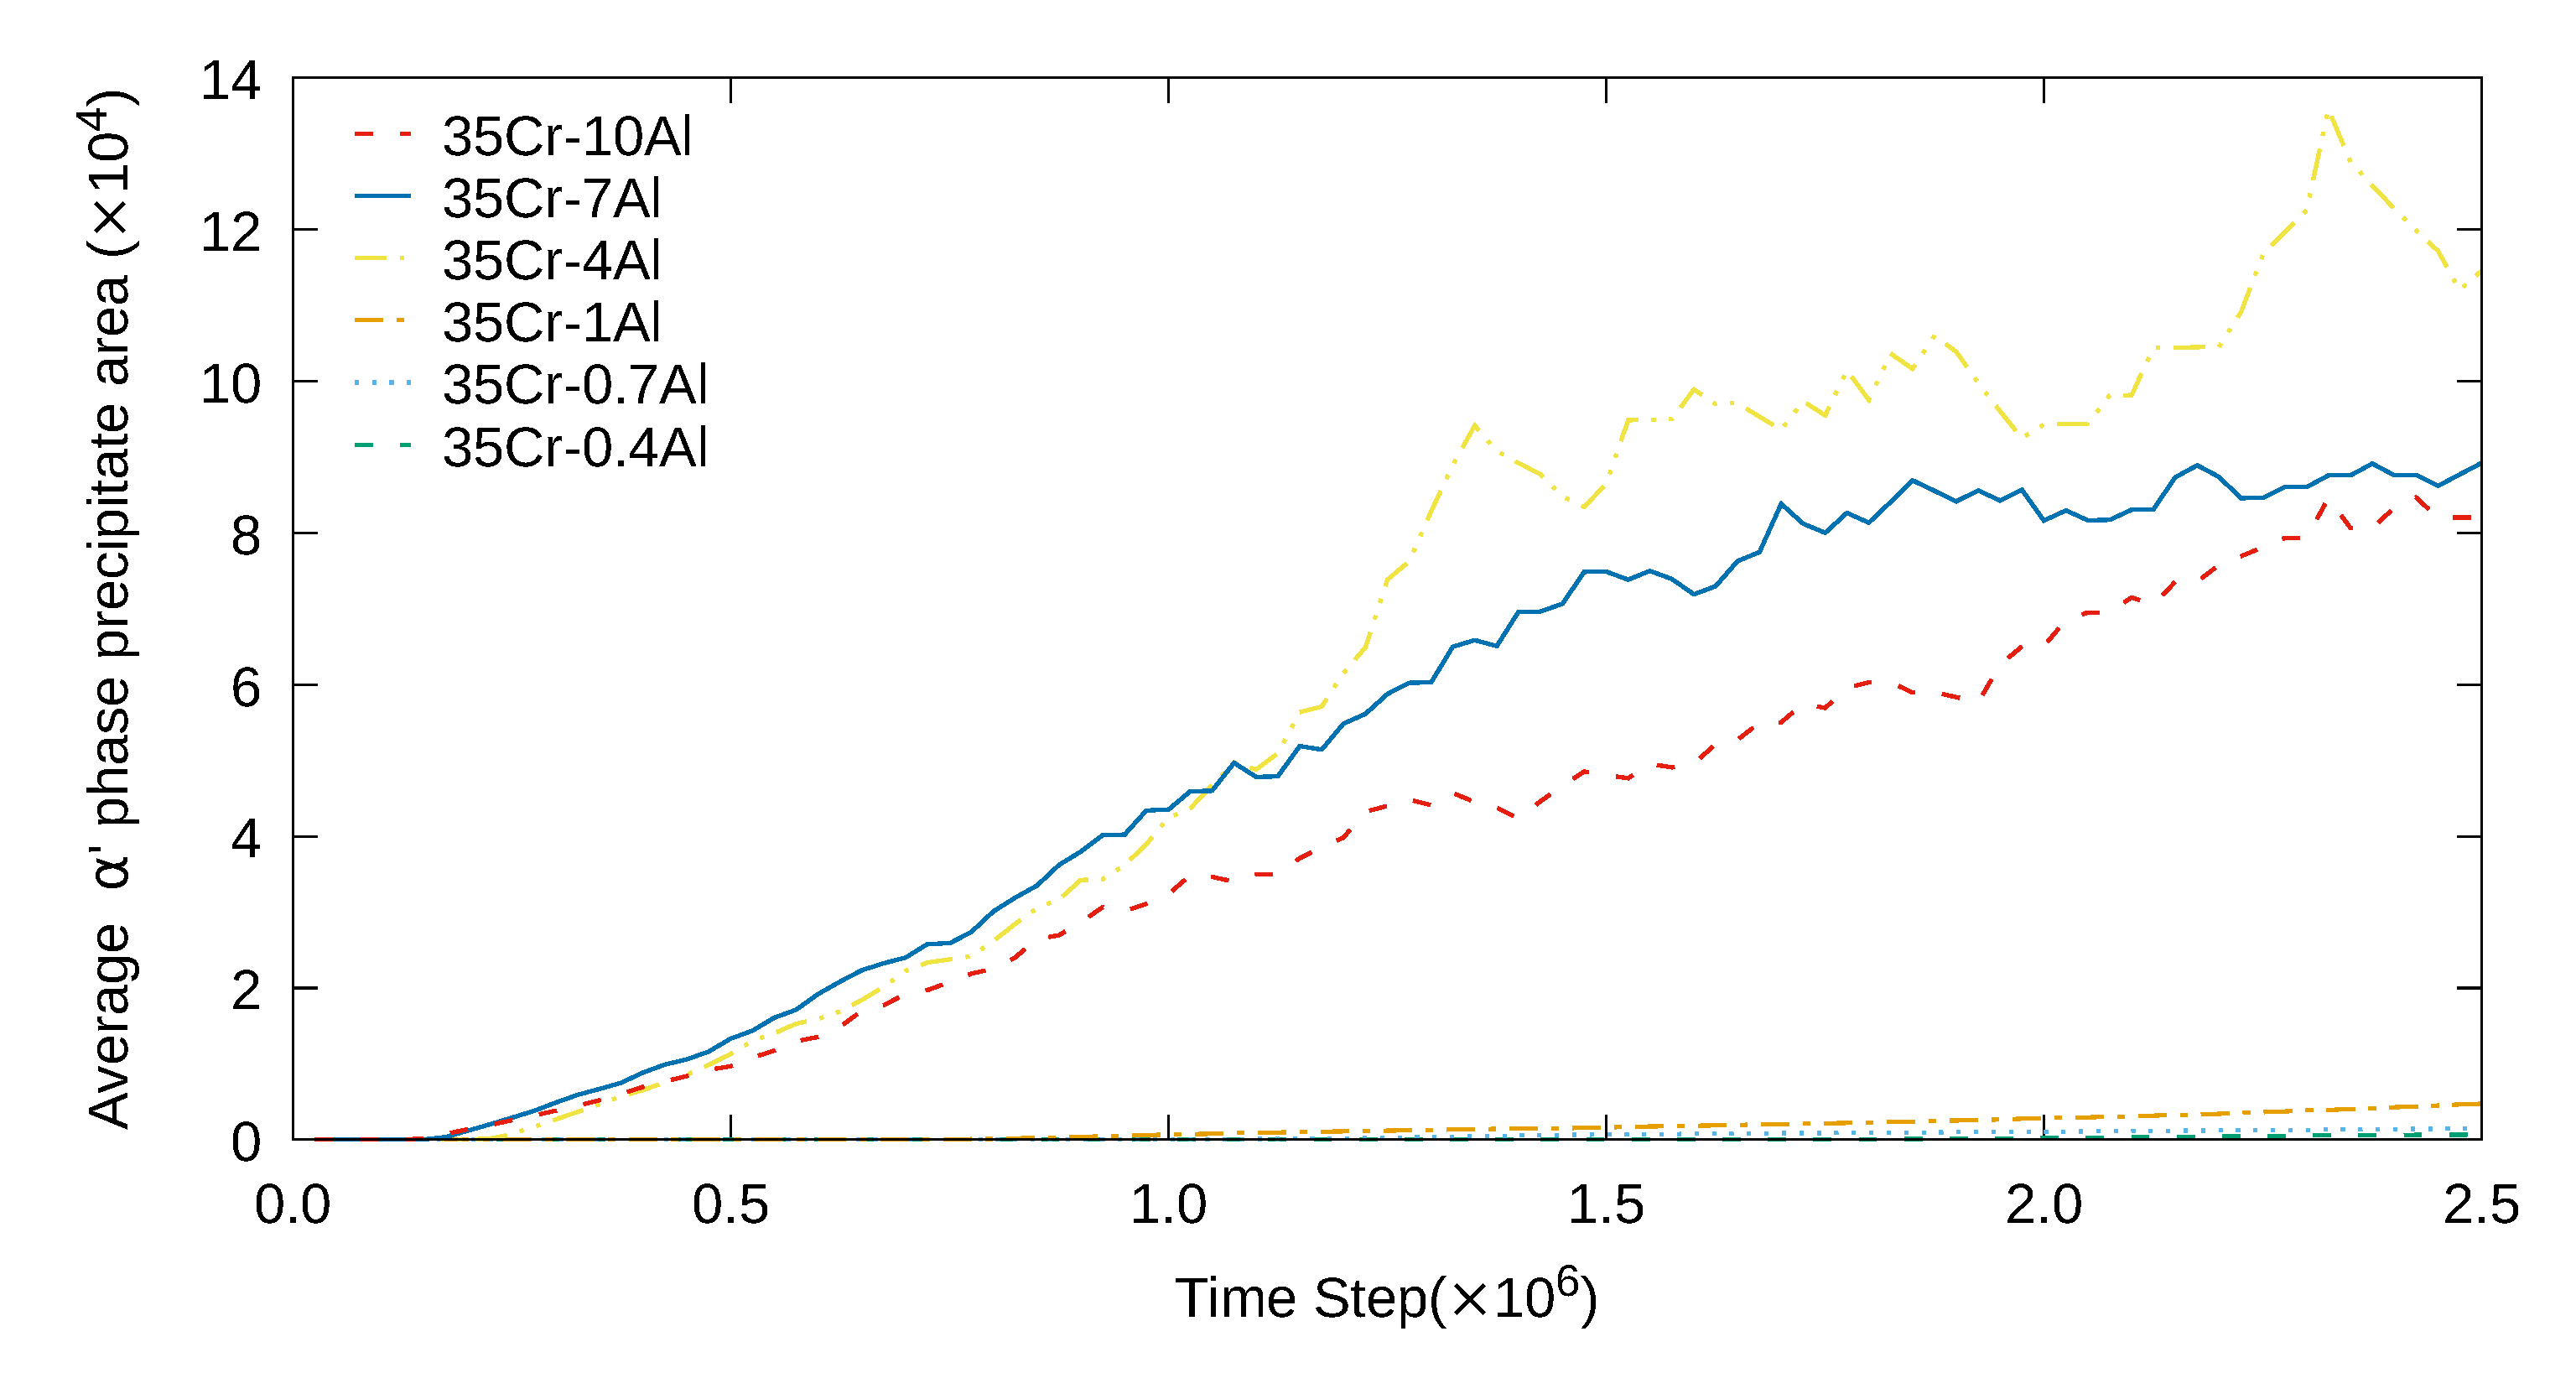
As shown in Figure 14, when the average Al concentration was between 4% and 10%, the average α precipitate volume was larger than that when the average Al concentration was between 0.4% and 1% at an average Cr concentration of 35%. In addition, the phase separation did not occur when the average Al concentration was 0.1%.
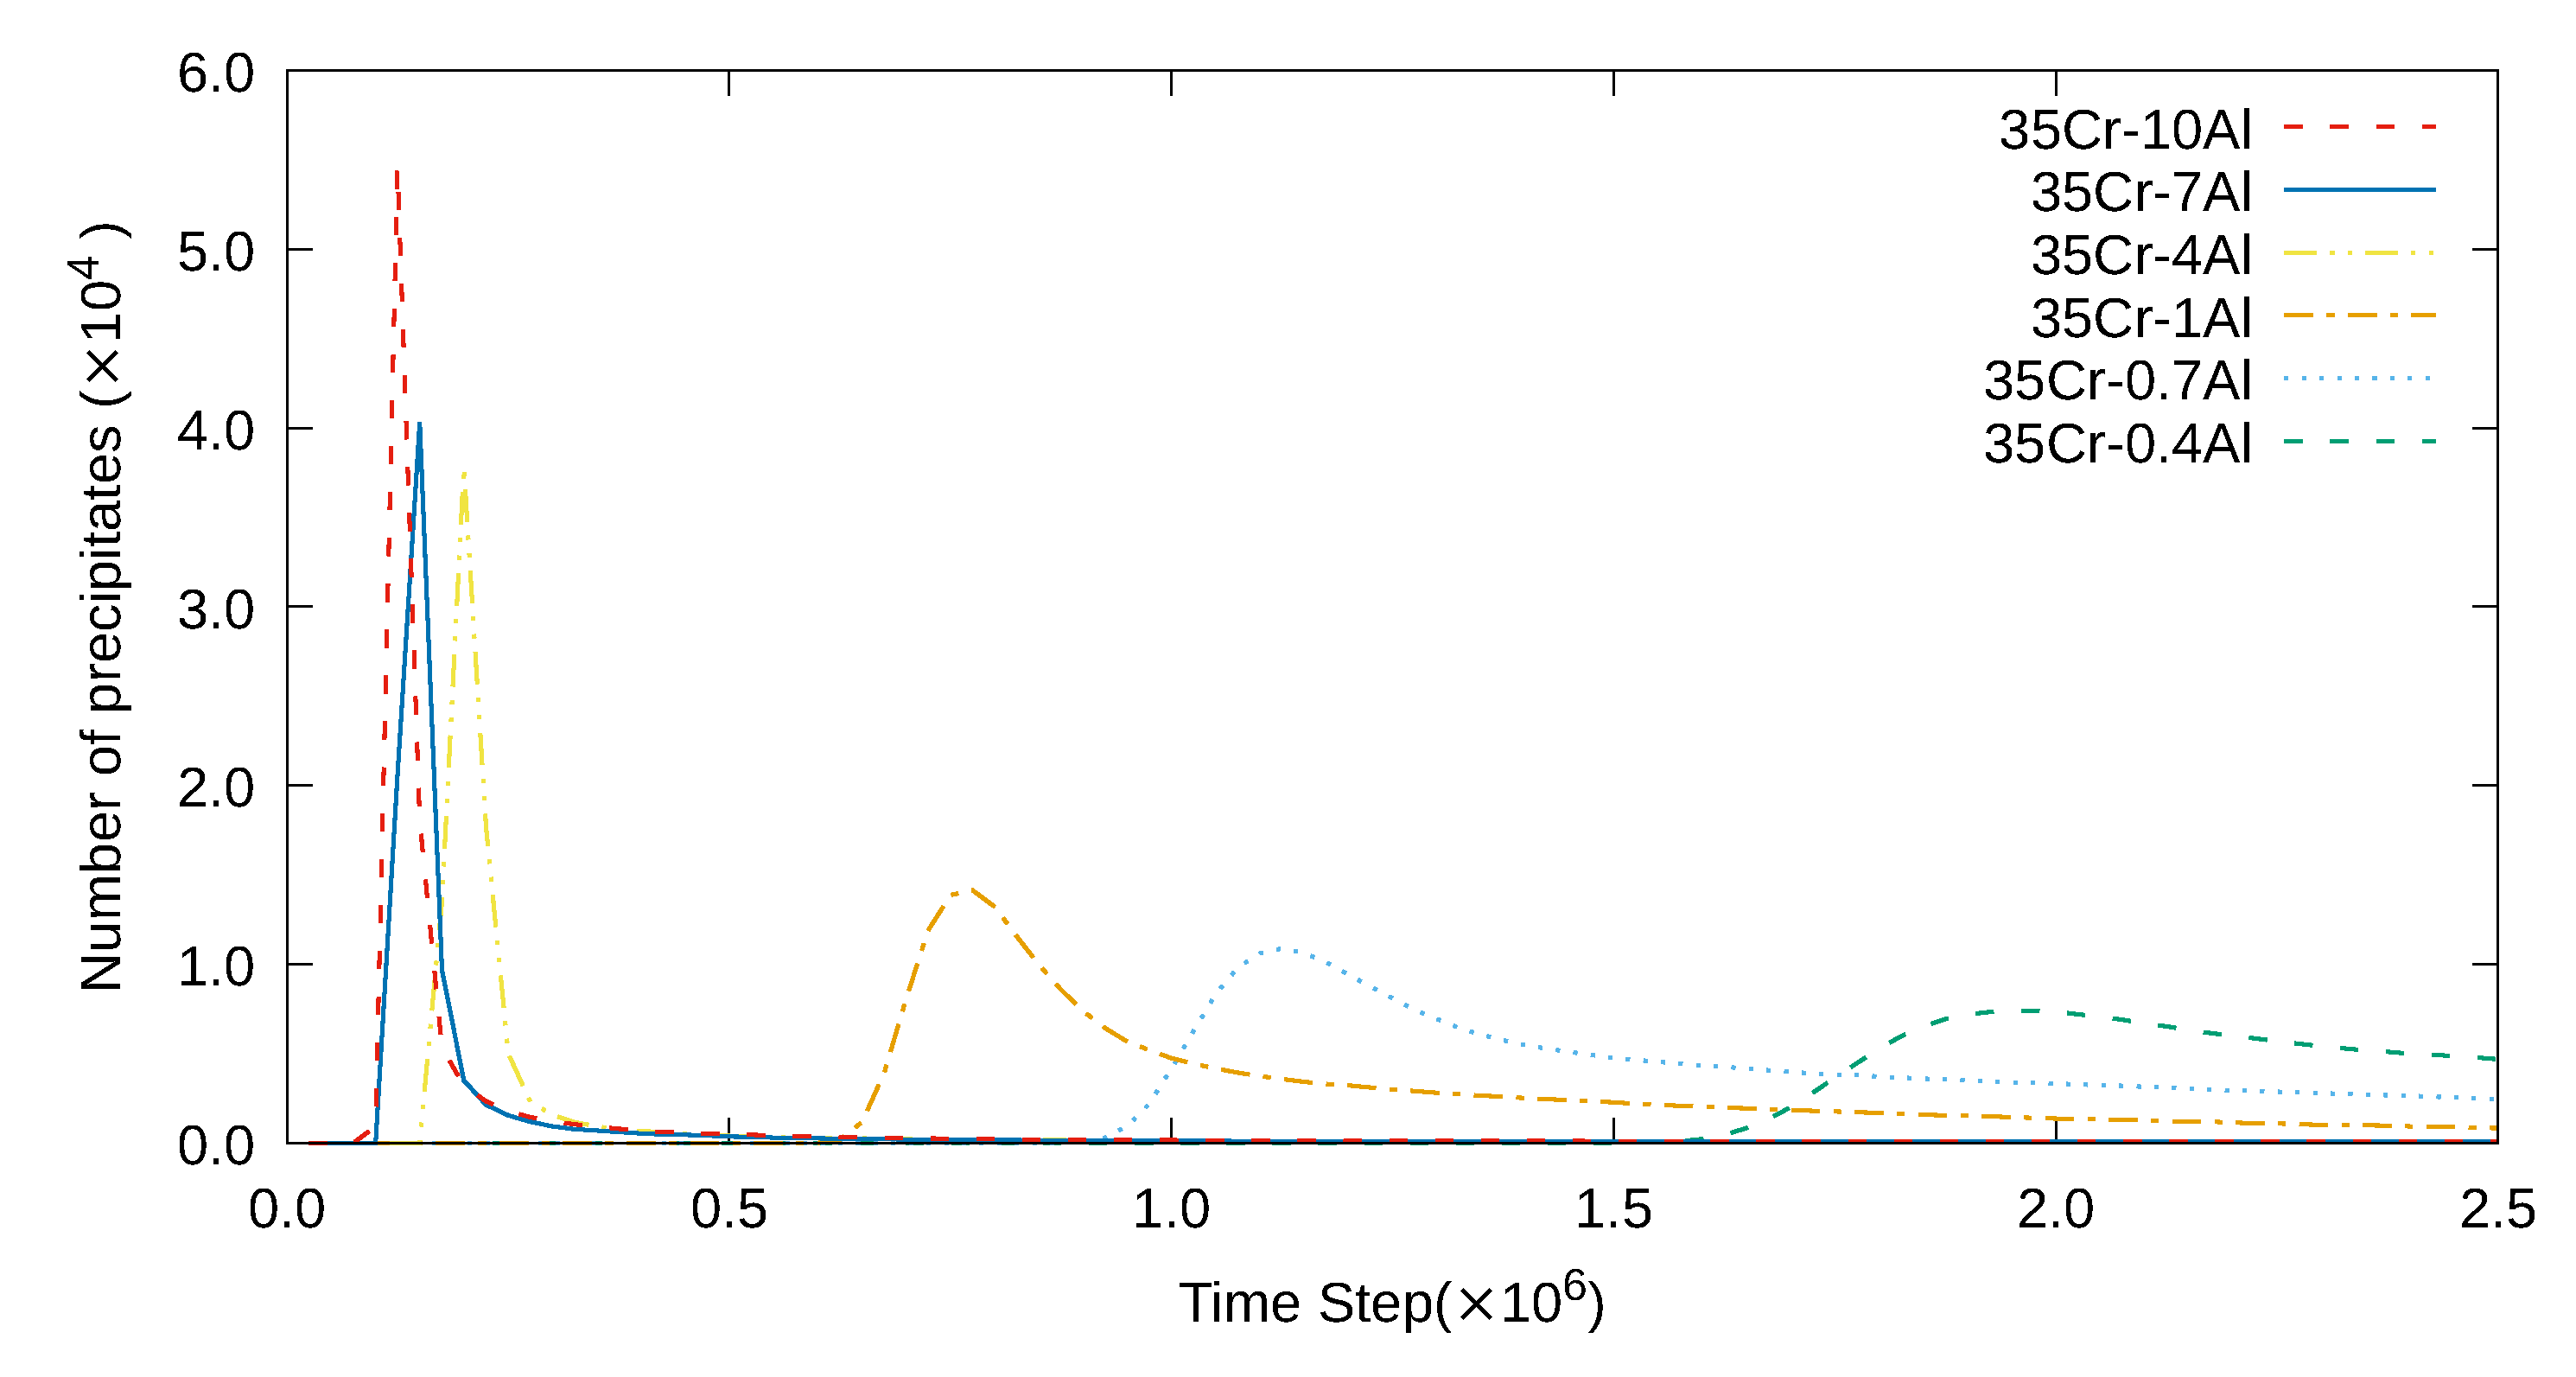
Similarly, with an increase in the average Al concentration, the amplitude of the initial peak increased, as shown in Figure 15. This trend is consistent with the results of the 2D simulation when the average concentration was 35%. Particularly, the initial peak was higher when the average Al concentration was 4% or above than that when the average Al concentration was between 0.4% and 1%. In addition, when the average Al concentration was 4% or more, the α phase number density after the peak decreased faster than that when the average Al concentration was between 0.4% and 1%. When the average Cr concentration was 35% and the average Al concentration was above 4%, we observed that the morphology of the α phase precipitate exhibited an interconnected microstructure, wherein the number of precipitates was less than 10, as shown in Figure 14 and Figure 15.
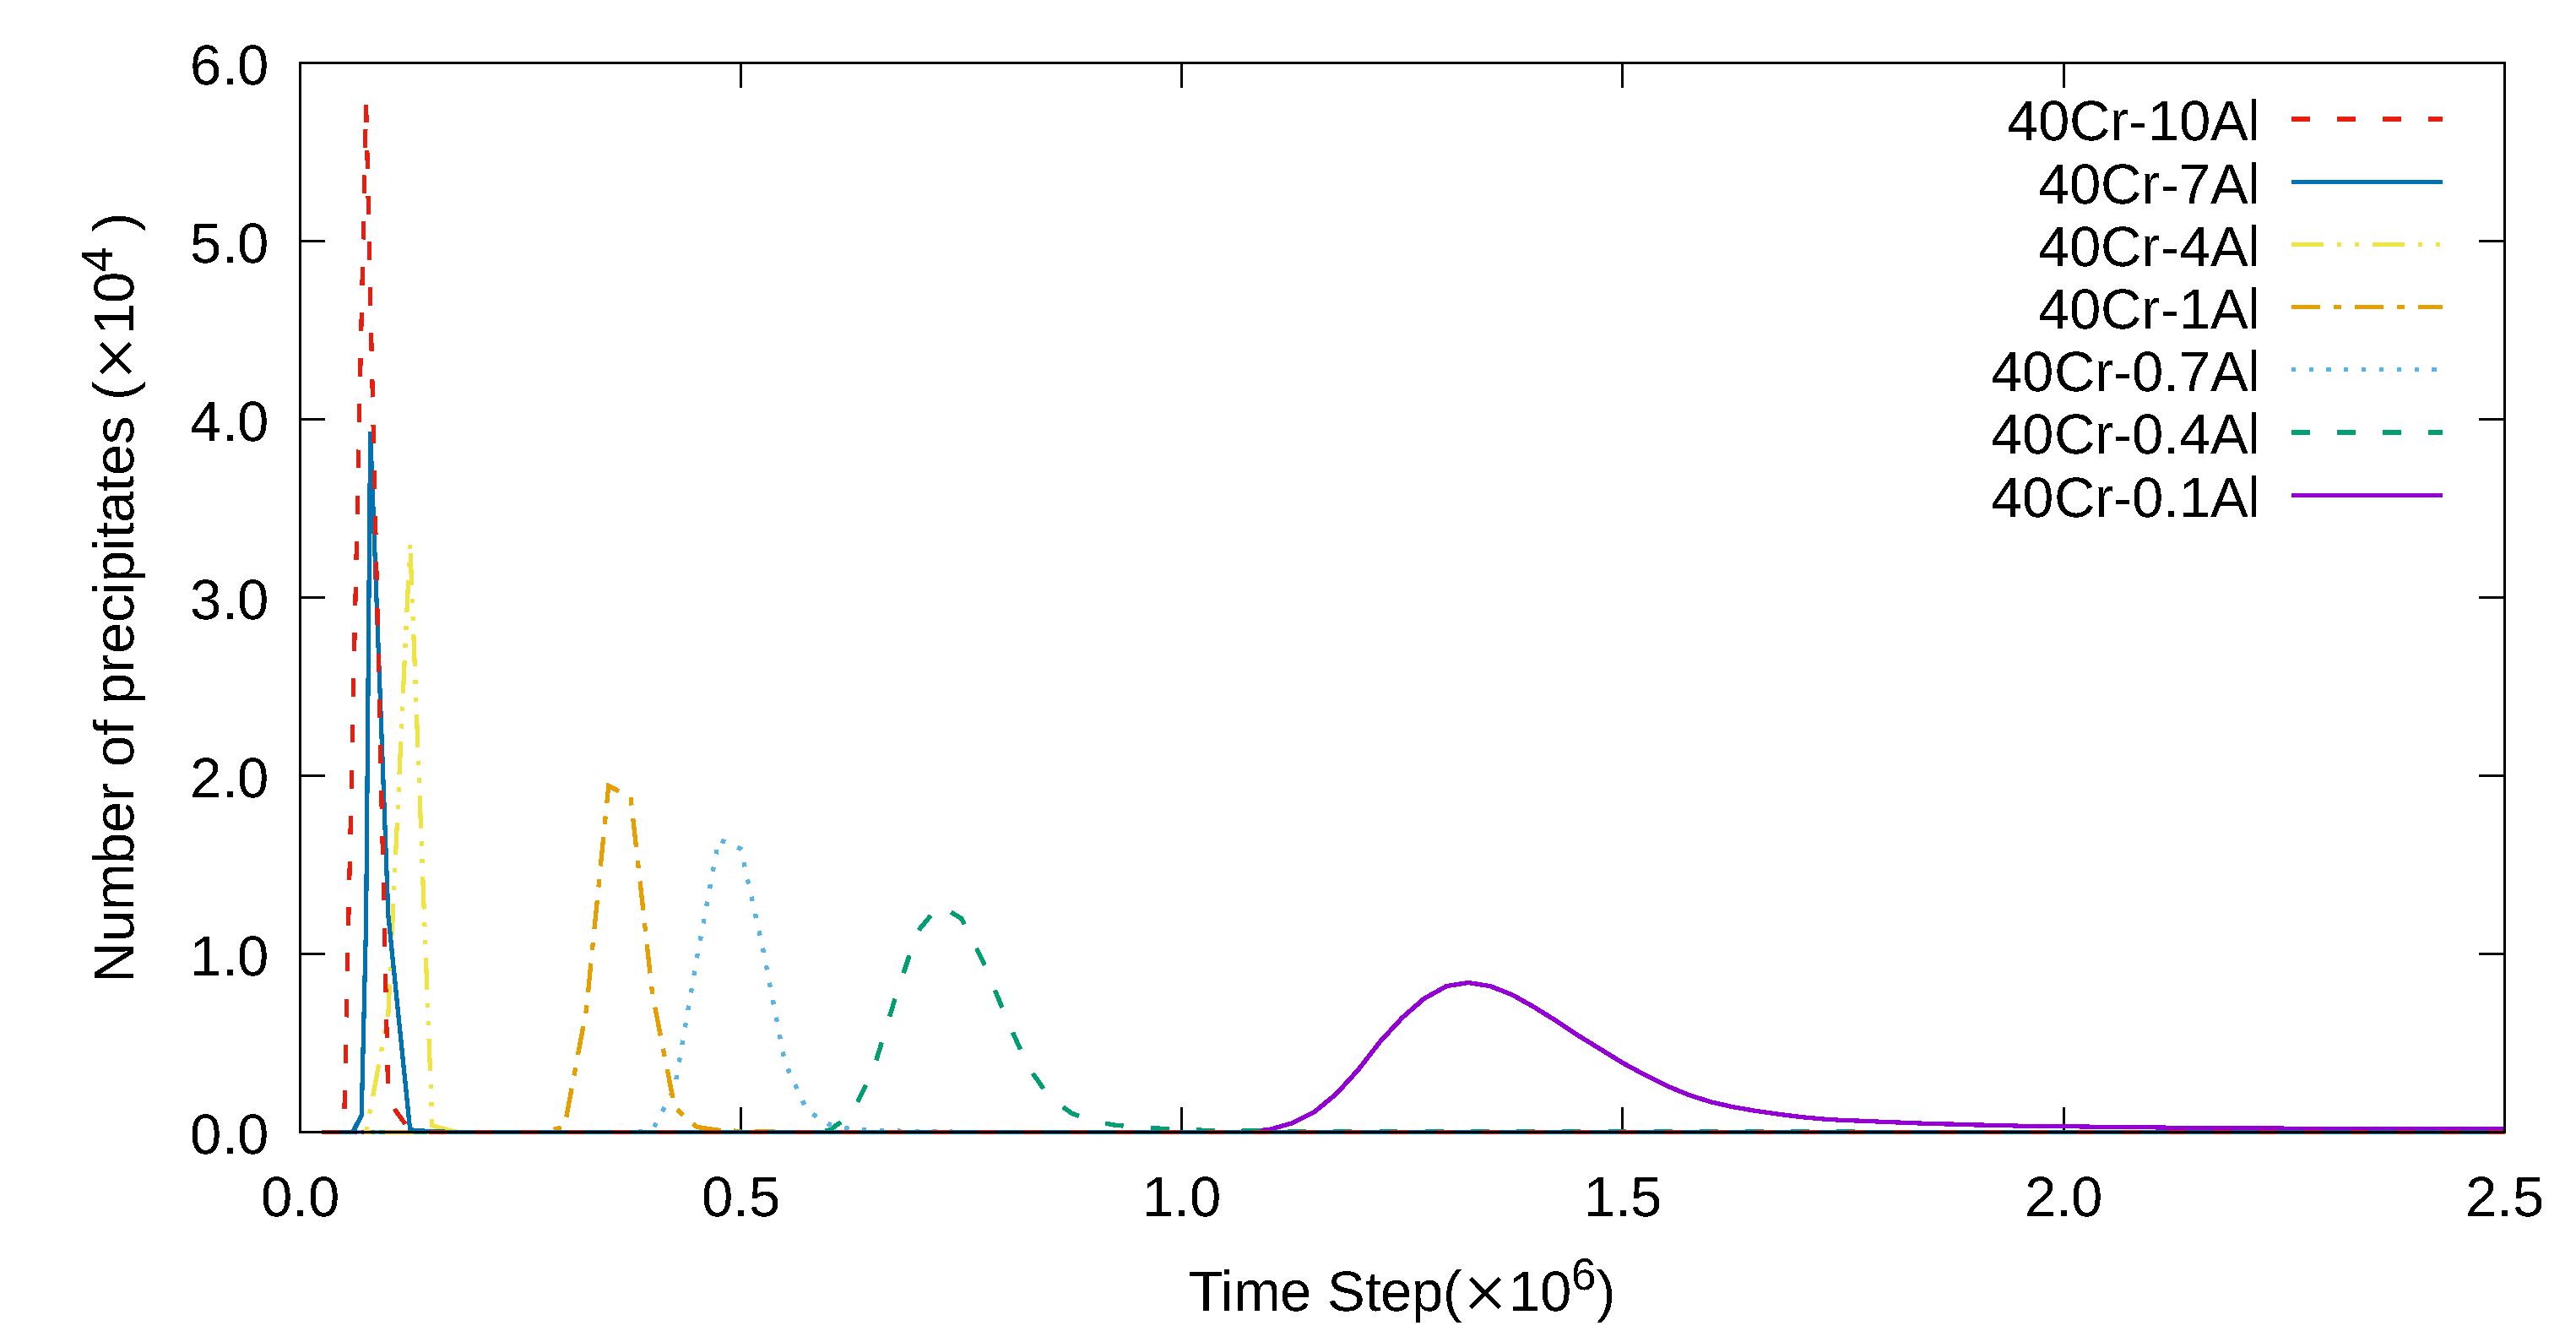
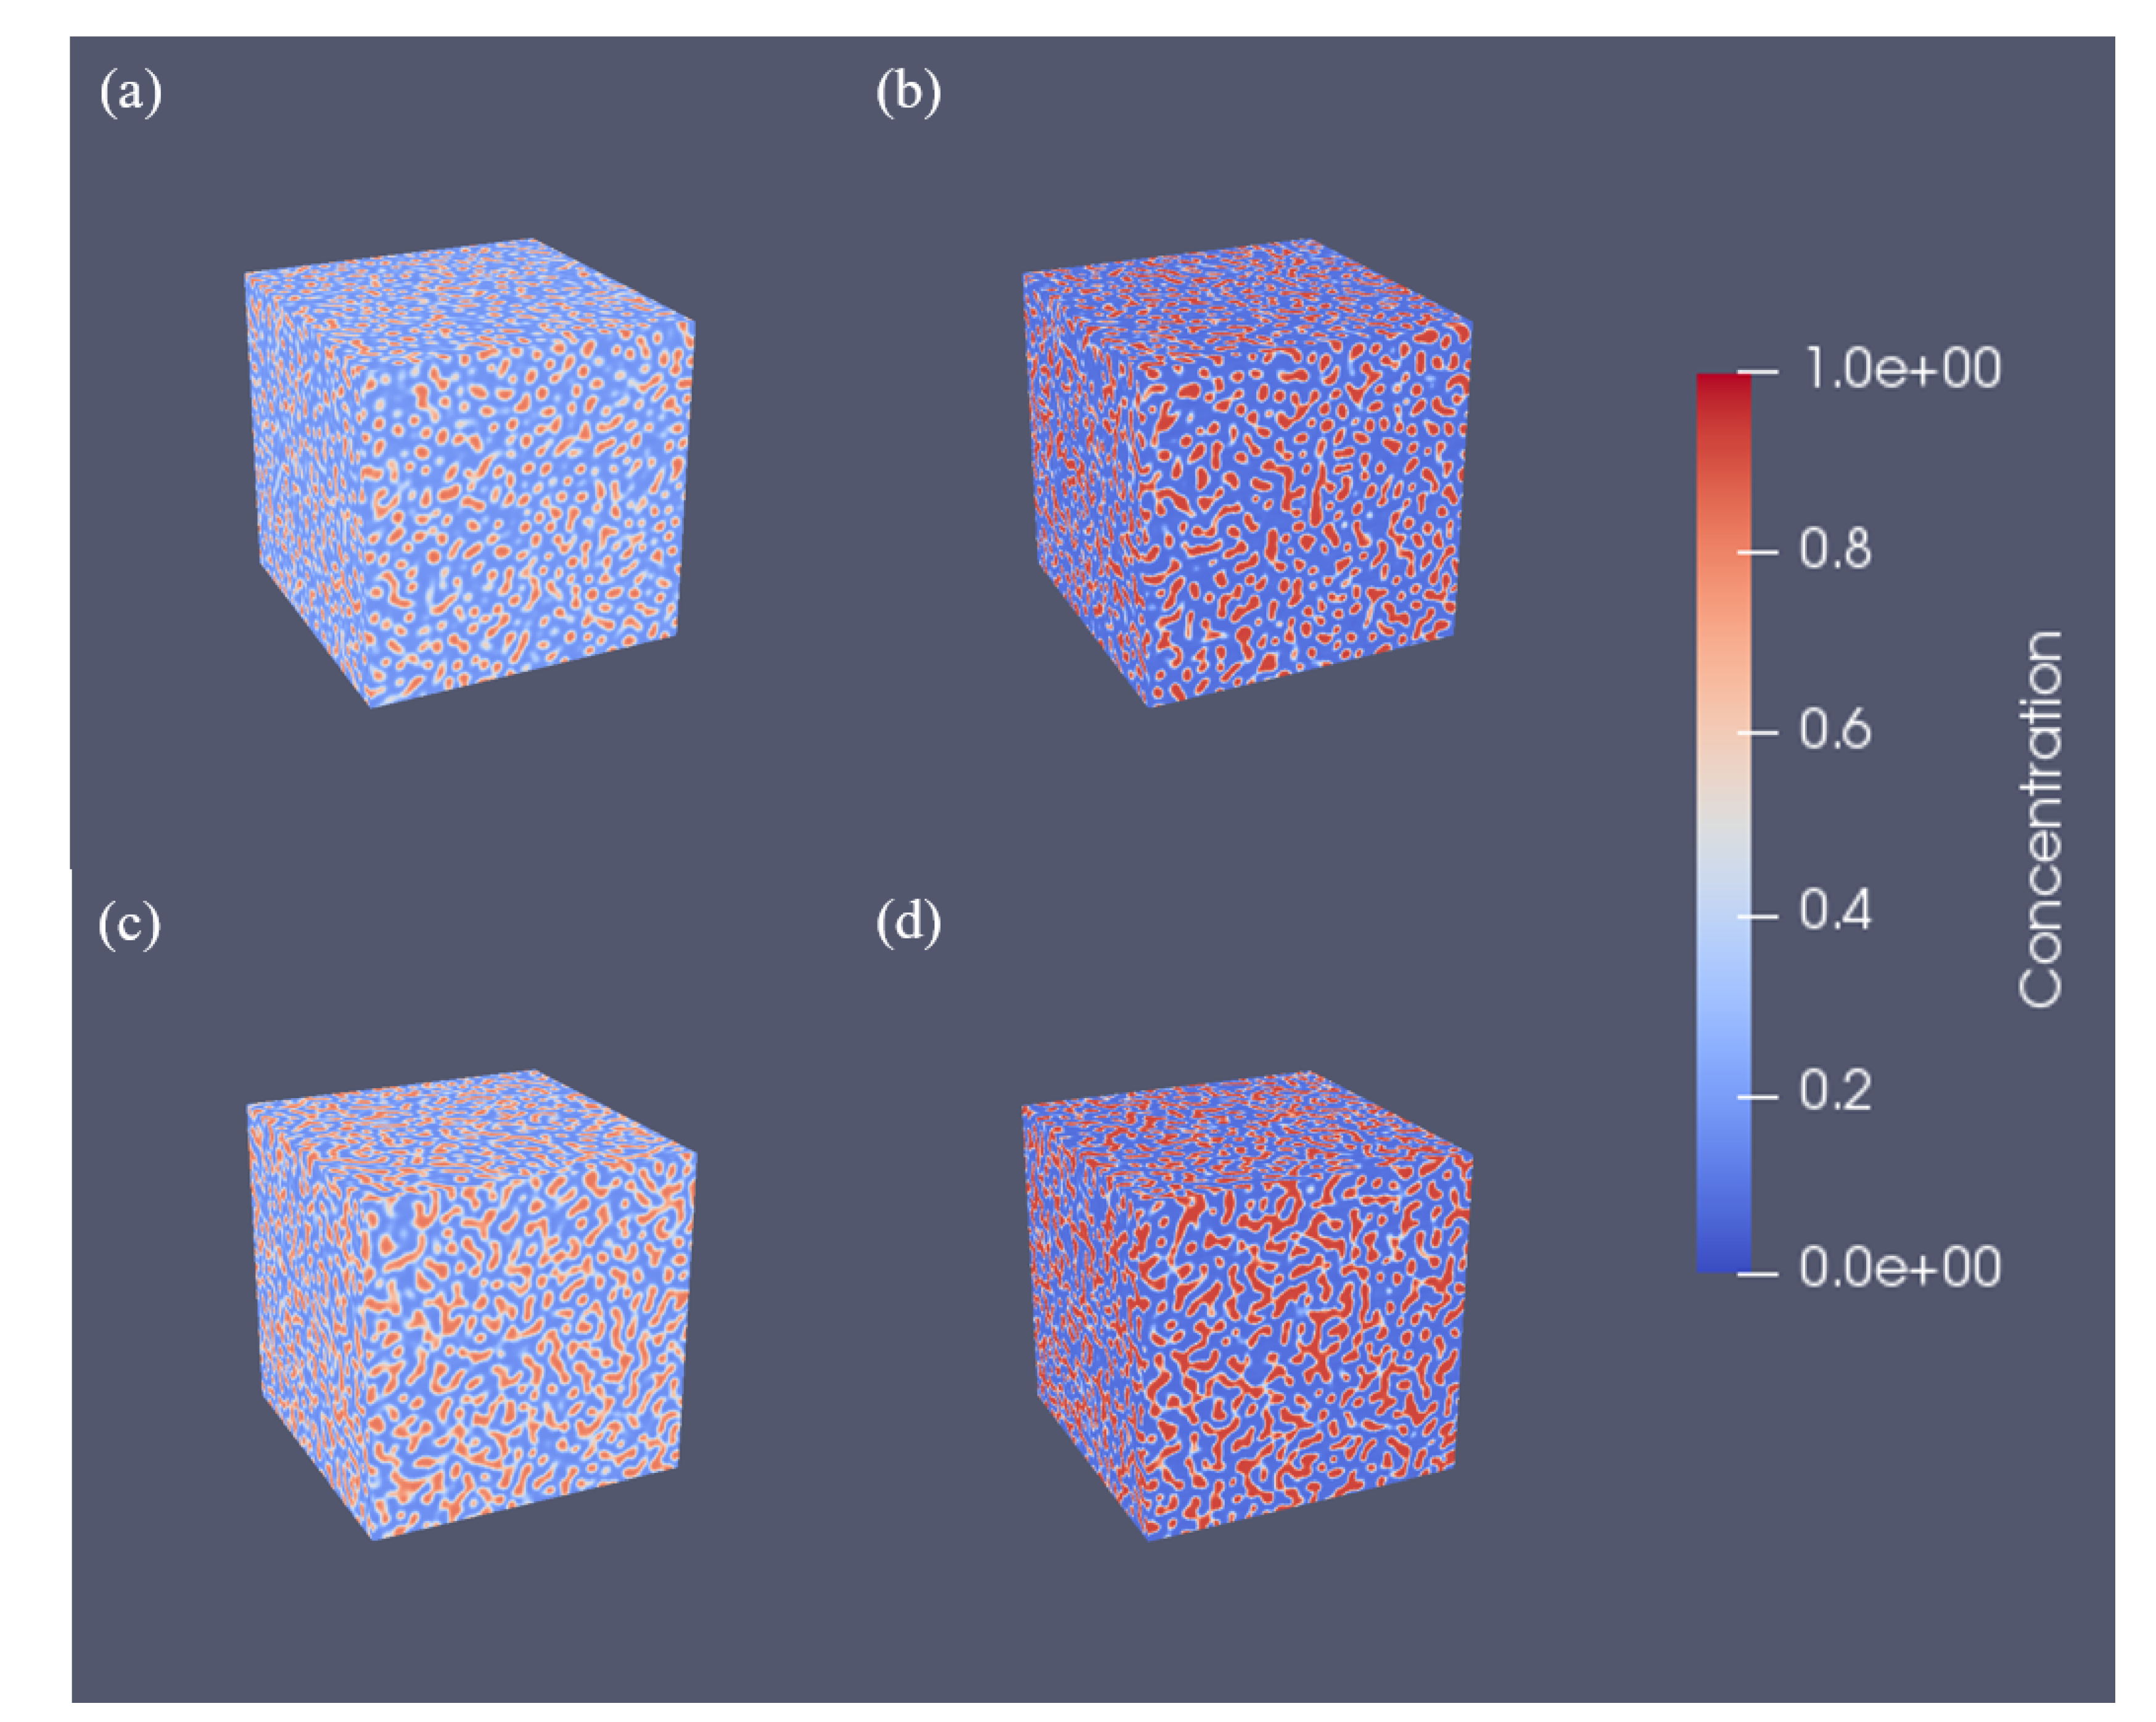
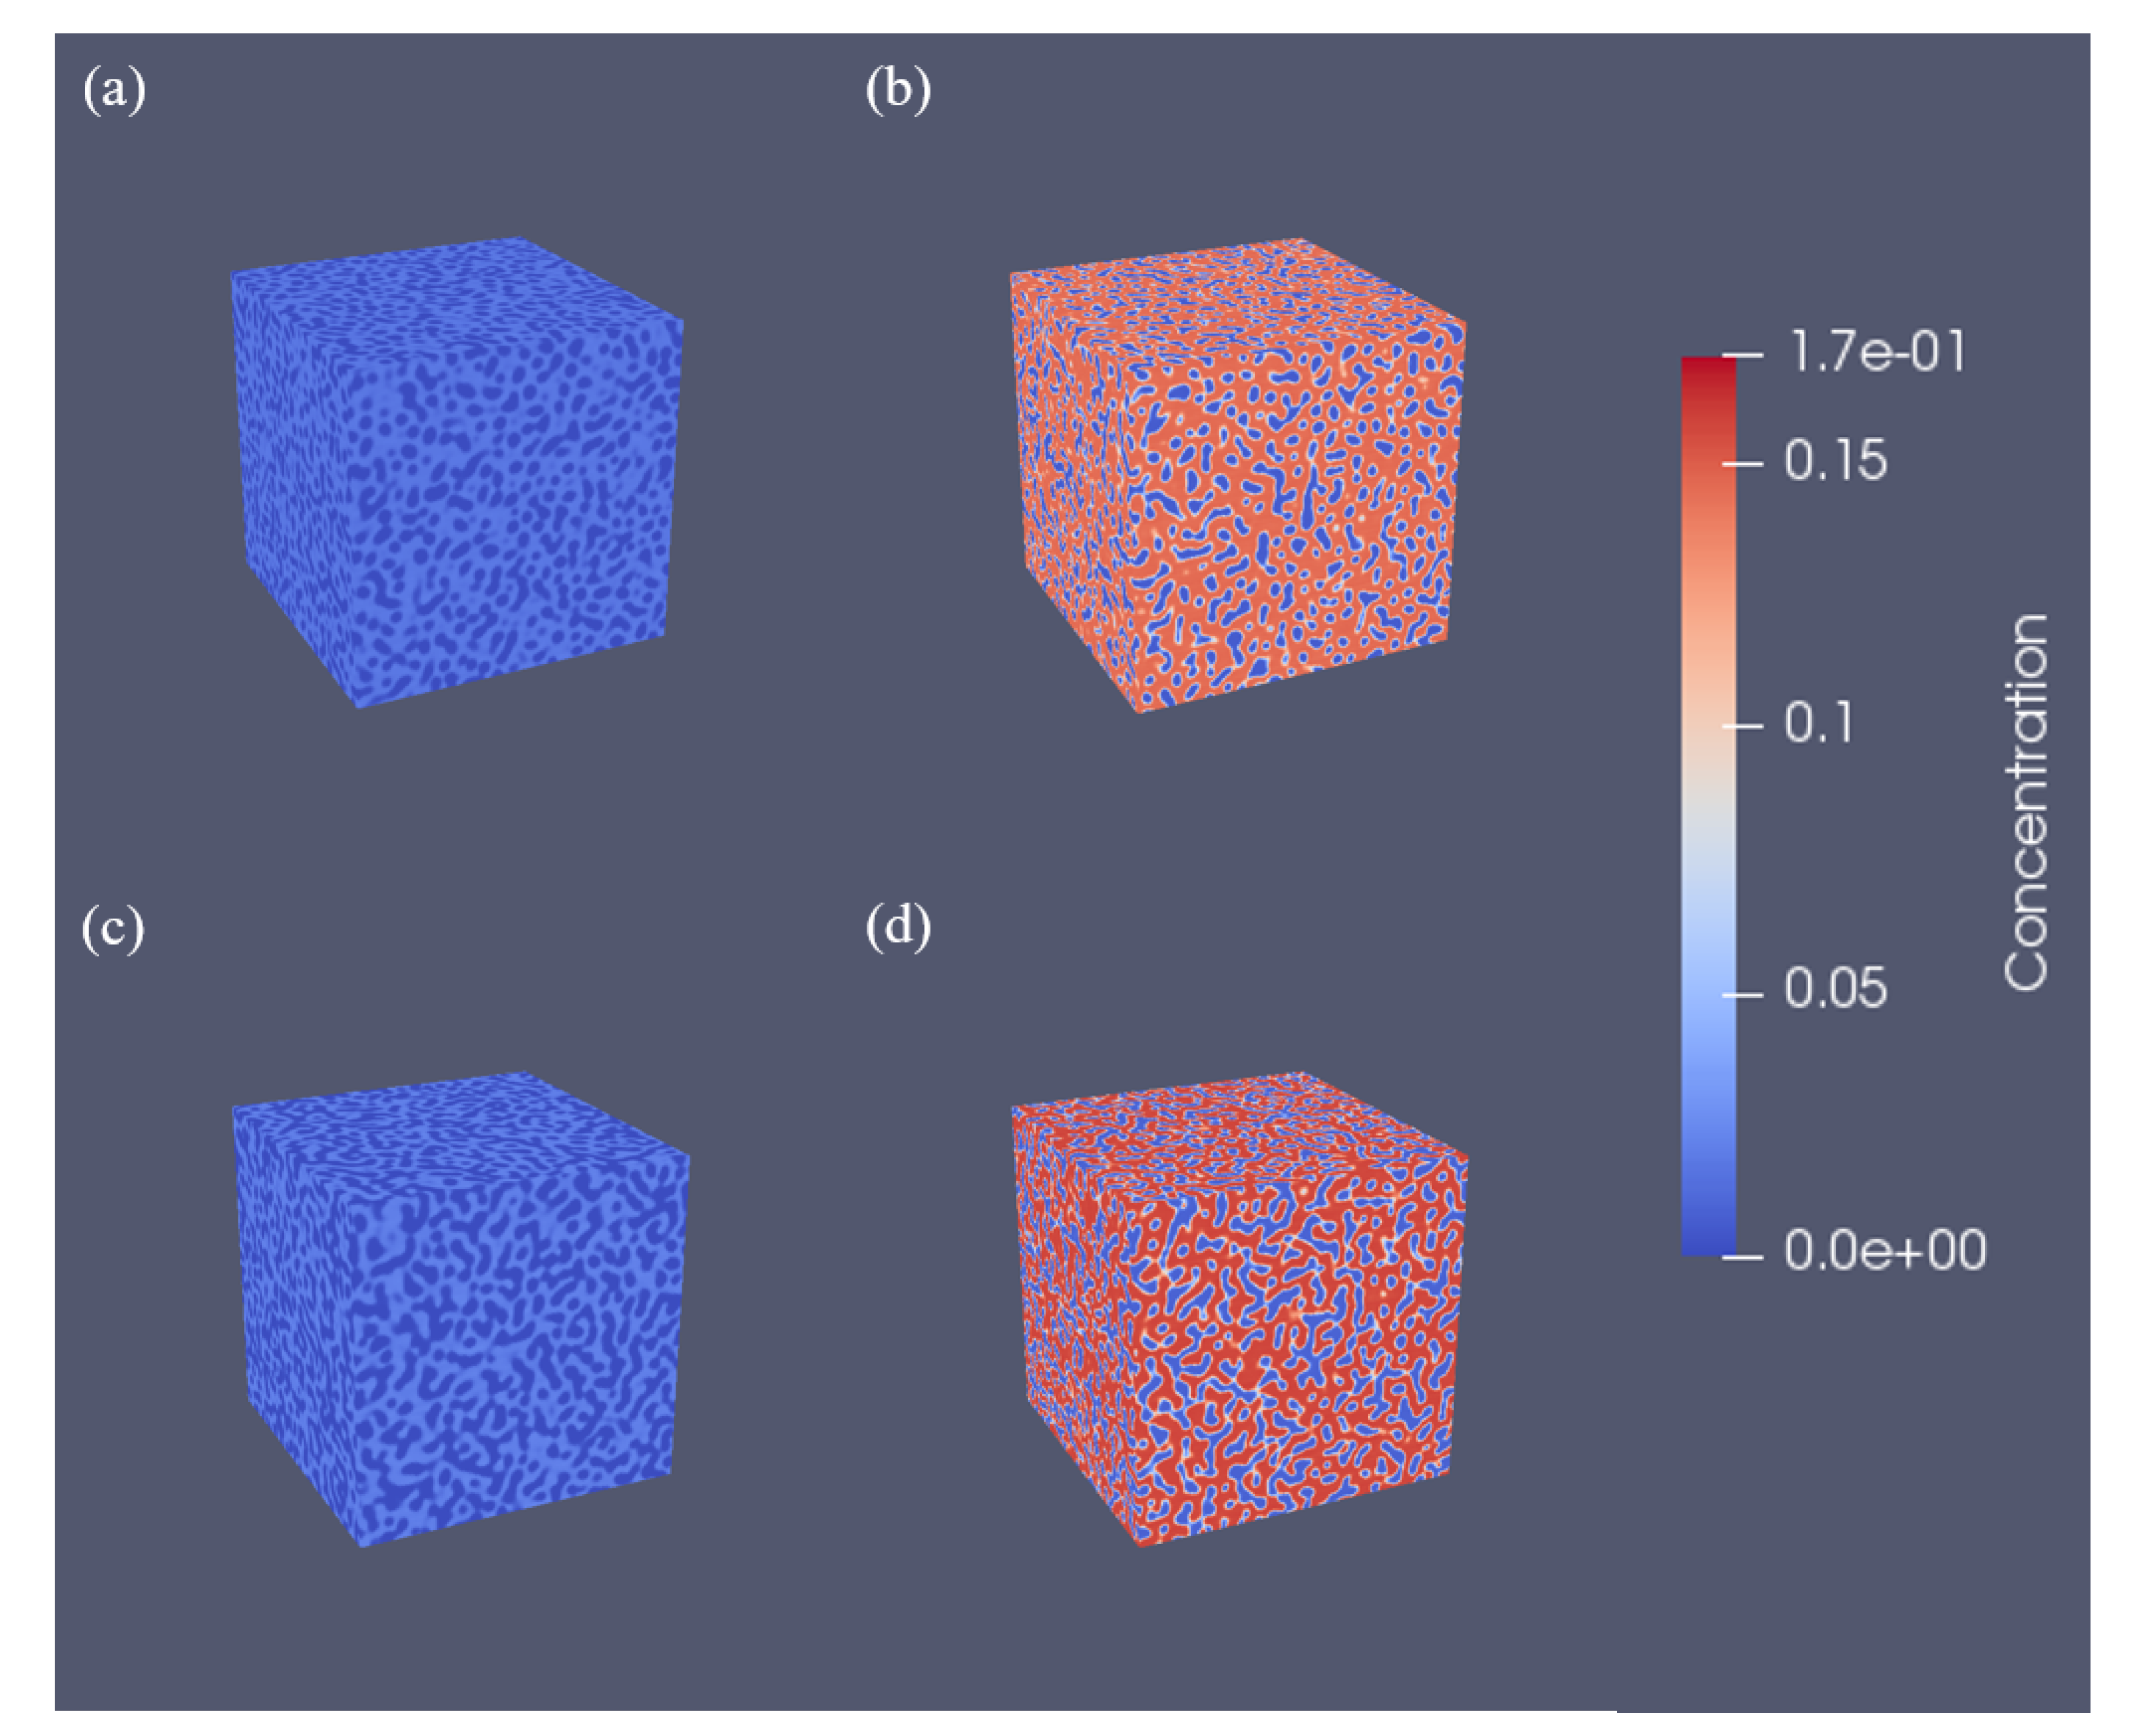
When the Cr concentration was 40%, with an increase in the average Al concentration, the amplitude of the initial peak increased and the initiation of phase separation was accelerated, as shown in Figure 16, which is consistent with the observation of the 30 Cr% case in the 2D simulation. In addition, when the average Cr concentration was between 35% and 40%, the phase fraction increased with an increase in the average Al concentration. The α phase formed the interconnected structures for the 40 Cr% case in the whole simulated range of Al concentrations. We obtained the morphology of the α phase precipitate, as shown in Figure 17 and Figure 18.
In the 3D simulation, an interconnected structure was clearly observed, as shown in Figure 15 and Figure 16, wherein the number of precipitates was less than 10. In addition, the formation of the interconnected two-phase structure was promoted with an increase in the Al concentration. In contrast, interconnected structures were not observed in the 2D simulation at similar Cr and Al concentrations. This is because the voxel-based microstructure of the 2D simulation [46] comprised the four nearest neighboring voxels for the voxel allocated to the α phase (voxel A), whereas the 3D simulation comprised six. When only one of the nearest neighboring voxels is assigned by the α phase (voxel B), the A and B voxels are included in a connected α region. Therefore, when the fraction of the α phase is f α , the tendency of a P i voxel of the α phase forming an interconnected structure in the 2D simulation can be estimated as follows:
P i 2 D = 1.0 ( 1 f α ) 4 .
In 3D, we have
P i 3 D = 1.0 ( 1 f α ) 6 .
For example, when f α = 0.2 , the P i 2 D is 0.590 and the P i 3 D is 0.738 . This indicates that the tendency of the 3D simulation to form an interconnected structure is higher than that of the 2D simulation.
According to previous experimental studies, the formation of the α phase is suppressed with an increase in the Al concentration [22,23,24]. Our simulation demonstrates that the number of precipitates decreases with an increase in the Al concentration, as shown in Figure 13, after the initial peak (after ∼ 1.0 × 10 6 time steps). This indicates that the precipitate number density decreases with an increase in the Al concentration in Fe-30Cr%, indicating that an increase in the Al concentration suppresses the precipitation of the α phase.

4. Conclusions and Future Work

In this study, the effect of Al concentration on the microstructural evolution of an Fe-Cr-Al system was investigated using the phase-field method. In both the 2D and 3D simulations, an increase in the average Al concentration enhanced the initiation of phase separation. In addition, in terms of the precipitate number density, the amplitude of the initial peak increased with an increase in the average Al concentration. Furthermore, with an increase in the average Al concentration, the phase fraction increased, while the change in the phase fraction decreased, which is consistent with the thermodynamic results. In addition, at 35 and 40 Cr%, the formation of an interconnected structure of the α phase was observed in the 3D simulation, whereas the interconnected structure was not formed at the same chemical composition in the 2D simulation. In an Fe-Cr-Al system, the atomic sizes of Fe and Cr are relatively similar, but since the Al atom is considerably smaller than that of Fe or Cr, the elastic effect due to the concentration of inhomogeneity cannot be ignored. Therefore, we are currently conducting a set of simulations to incorporate the inhomogeneous elasticity of the alloy due to the concentration inhomogeneity. Moreover, to incorporate the effect of neutron irradiation on the microstructural evolution of Fe-Cr-Al systems, we are conducting sets of simulations to evaluate the effect of a dislocation loop on the spatial distributions of solutes. If this simulation and analysis are performed as intended, it is expected that the combined effects of elasticities due to solute inhomogeneity and dislocation loops, which are normally nucleated by neutron irradiation, can be quantitatively evaluated. The research results are expected to be useful as basic data for microstructure optimization of Fe-Cr-Al-based accident-tolerant fuel cladding.

Author Contributions

Conceptualization, K.C. and K.P.; methodology, K.C.; software, J.L.; validation, K.C. and J.L.; formal analysis, J.L.; investigation, J.L.; resources, J.L.; data curation, J.L.; writing—original draft preparation, J.L.; writing—review and editing, K.C. and K.P.; visualization, J.L.; supervision, K.C.; project administration, K.C.; funding acquisition, K.C. All authors have read and agreed to the published version of the manuscript.

Funding

This study was supported by a National Research Foundation of Korea (NRF) grant funded by the Korean government (MSIT) (NRF-2017M2B2B1072806 and NRF-2018M2B2B1065635).

Institutional Review Board Statement

Not applicable.

Informed Consent Statement

Not applicable.

Data Availability Statement

Data available in a publicly accessible repository that does not issue DOIs Publicly available datasets were analyzed in this study. This data can be found here: [http://kunok.kr/?page_id=90].

Conflicts of Interest

The authors declare no conflict of interest.

References

  1. Klueh, R.; Nelson, A.T. Ferritic/martensitic steels for next-generation reactors. J. Nucl. Mater. 2007, 371, 37–52. [Google Scholar] [CrossRef]
  2. Tedmon, C., Jr. The effect of oxide volatilization on the oxidation kinetics of Cr and Fe-Cr alloys. J. Electrochem. Soc. 1966, 113, 766. [Google Scholar] [CrossRef]
  3. Zinkle, S.J.; Was, G. Materials challenges in nuclear energy. Acta Mater. 2013, 61, 735–758. [Google Scholar] [CrossRef]
  4. Pint, B.A.; Terrani, K.A.; Brady, M.P.; Cheng, T.; Keiser, J.R. High temperature oxidation of fuel cladding candidate materials in steam–hydrogen environments. J. Nucl. Mater. 2013, 440, 420–427. [Google Scholar] [CrossRef]
  5. Terrani, K.A.; Zinkle, S.J.; Snead, L.L. Advanced oxidation-resistant iron-based alloys for LWR fuel cladding. J. Nucl. Mater. 2014, 448, 420–435. [Google Scholar] [CrossRef]
  6. Yamamoto, Y.; Pint, B.A.; Terrani, K.A.; Field, K.G.; Yang, Y.; Snead, L.L. Development and property evaluation of nuclear grade wrought FeCrAl fuel cladding for light water reactors. J. Nucl. Mater. 2015, 467, 703–716. [Google Scholar] [CrossRef]
  7. Gussev, M.N.; Cakmak, E.; Field, K.G. Impact of neutron irradiation on mechanical performance of FeCrAl alloy laser-beam weldments. J. Nucl. Mater. 2018, 504, 221–233. [Google Scholar] [CrossRef]
  8. Lei, Q.; Li, Z.; Dai, C.; Wang, J.; Chen, X.; Xie, J.; Yang, W.; Chen, D. Effect of aluminum on microstructure and property of Cu–Ni–Si alloys. Mater. Sci. Eng. A 2013, 572, 65–74. [Google Scholar] [CrossRef]
  9. Field, K.G.; Hu, X.; Littrell, K.C.; Yamamoto, Y.; Snead, L.L. Radiation tolerance of neutron-irradiated model Fe–Cr–Al alloys. J. Nucl. Mater. 2015, 465, 746–755. [Google Scholar] [CrossRef] [Green Version]
  10. Hsiung, L.L.; Fluss, M.J.; Tumey, S.J.; Choi, B.W.; Serruys, Y.; Willaime, F.; Kimura, A. Formation mechanism and the role of nanoparticles in Fe-Cr ODS steels developed for radiation tolerance. Phys. Rev. B 2010, 82, 184103. [Google Scholar] [CrossRef]
  11. Parish, C.M.; Field, K.G.; Certain, A.G.; Wharry, J.P. Application of STEM characterization for investigating radiation effects in BCC Fe-based alloys. J. Mater. Res. 2015, 30, 1275–1289. [Google Scholar] [CrossRef]
  12. Airiskallio, E.; Nurmi, E.; Heinonen, M.; Väyrynen, I.; Kokko, K.; Ropo, M.; Punkkinen, M.; Pitkänen, H.; Alatalo, M.; Kollár, J.; et al. High temperature oxidation of Fe–Al and Fe–Cr–Al alloys: The role of Cr as a chemically active element. Corros. Sci. 2010, 52, 3394–3404. [Google Scholar] [CrossRef]
  13. Wolff, I.; Iorio, L.; Rumpf, T.; Scheers, P.; Potgieter, J. Oxidation and corrosion behaviour of Fe–Cr and Fe–Cr–Al alloys with minor alloying additions. Mater. Sci. Eng. A 1998, 241, 264–276. [Google Scholar] [CrossRef]
  14. Mrowec, S.; Wedrychowska, M. Kinetics and mechanism of high-temperature sulfur corrosion of Fe-Cr-Al alloys. Oxid. Met. 1979, 13, 481–504. [Google Scholar] [CrossRef]
  15. Field, K.G.; Briggs, S.A.; Sridharan, K.; Howard, R.H.; Yamamoto, Y. Mechanical properties of neutron-irradiated model and commercial FeCrAl alloys. J. Nucl. Mater. 2017, 489, 118–128. [Google Scholar] [CrossRef] [Green Version]
  16. Grobner, P. The 885 F (475 C) embrittlement of ferritic stainless steels. Metall. Trans. 1973, 4, 251–260. [Google Scholar] [CrossRef]
  17. Chandra, D.; Schwartz, L. Mössbauer effect study of the 475‡ C decomposition of Fe-Cr. Metall. Trans. 1971, 2, 511–519. [Google Scholar] [CrossRef]
  18. Solomon, H.; Levinson, L.M. Mössbauer effect study of ‘475 C embrittlement’of duplex and ferritic stainless steels. Acta Metall. 1978, 26, 429–442. [Google Scholar] [CrossRef]
  19. Miller, M.; Hyde, J.; Hetherington, M.; Cerezo, A.; Smith, G.; Elliott, C. Spinodal decomposition in Fe-Cr alloys: Experimental study at the atomic level and comparison with computer models—I. Introduction and methodology. Acta Metall. Mater. 1995, 43, 3385–3401. [Google Scholar] [CrossRef]
  20. Lee, J.; Chang, K. Effect of magnetic ordering on the spinodal decomposition of the Fe-Cr system: A GPU-accelerated phase-field study. Comput. Mater. Sci. 2019, 169, 109088. [Google Scholar] [CrossRef]
  21. Zhu, L.; Li, Y.; Liu, C.; Chen, S.; Shi, S.; Jin, S. Effect of applied strain on phase separation of Fe–28 at.% Cr alloy: 3D phase-field simulation. Model. Simul. Mater. Sci. Eng. 2018, 26, 035015. [Google Scholar] [CrossRef]
  22. Kobayashi, S.; Takasugi, T. Mapping of 475 C embrittlement in ferritic Fe–Cr–Al alloys. Scr. Mater. 2010, 63, 1104–1107. [Google Scholar] [CrossRef]
  23. Li, W.; Lu, S.; Hu, Q.M.; Mao, H.; Johansson, B.; Vitos, L. The effect of Al on the 475 C embrittlement of Fe–Cr alloys. Comput. Mater. Sci. 2013, 74, 101–106. [Google Scholar] [CrossRef]
  24. Han, W.; Yabuuchi, K.; Kimura, A.; Ukai, S.; Oono, N.; Kaito, T.; Torimaru, T.; Hayashi, S. Effect of Cr/Al contents on the 475 ºC age-hardening in oxide dispersion strengthened ferritic steels. Nucl. Mater. Energy 2016, 9, 610–615. [Google Scholar] [CrossRef] [Green Version]
  25. Chen, S.; Li, Y.; Shi, S.; Jin, S. Quantitative Phase-Field Simulation of Composition Partition and Separation Kinetics of Nanoscale Phase in Fe-Cr-Al Alloy. J. Nanomater. 2019, 2019. [Google Scholar] [CrossRef] [Green Version]
  26. Lukas, H.; Fries, S.G.; Sundman, B. Computational Thermodynamics: The Calphad Method; Cambridge University Press: Cambridge, UK, 2007. [Google Scholar]
  27. Saunders, N.; Miodownik, A.P. CALPHAD (Calculation of Phase Diagrams): A Comprehensive Guide; Elsevier: Amsterdam, The Netherlands, 1998. [Google Scholar]
  28. Dinsdale, A. SGTE data for pure elements. Calphad 1991, 15, 317–425. [Google Scholar] [CrossRef]
  29. Chang, K.; Meng, F.; Ge, F.; Zhao, G.; Du, S.; Huang, F. Theory-guided bottom-up design of the FeCrAl alloys as accident tolerant fuel cladding materials. J. Nucl. Mater. 2019, 516, 63–72. [Google Scholar] [CrossRef]
  30. Capdevila, C.; Miller, M.K.; Chao, J. Phase separation kinetics in a Fe–Cr–Al alloy. Acta Mater. 2012, 60, 4673–4684. [Google Scholar] [CrossRef] [Green Version]
  31. Zhu, J.; Chen, L.Q.; Shen, J.; Tikare, V. Coarsening kinetics from a variable-mobility Cahn-Hilliard equation: Application of a semi-implicit Fourier spectral method. Phys. Rev. E 1999, 60, 3564. [Google Scholar] [CrossRef] [Green Version]
  32. Chen, L.Q.; Shen, J. Applications of semi-implicit Fourier-spectral method to phase field equations. Comput. Phys. Commun. 1998, 108, 147–158. [Google Scholar] [CrossRef]
  33. Hu, S.; Chen, L. Solute segregation and coherent nucleation and growth near a dislocation—Phase-field model integrating defect and phase microstructures. Acta Mater. 2001, 49, 463–472. [Google Scholar] [CrossRef]
  34. Jodra, J.L.; Gurrutxaga, I.; Muguerza, J. A study of memory consumption and execution performance of the cufft library. In Proceedings of the 2015 10th International Conference on P2P, Parallel, Grid, Cloud and Internet Computing (3PGCIC), Krakow, Poland, 4–6 November 2015; pp. 323–327. [Google Scholar]
  35. Stoer, J.; Bulirsch, R. Introduction to Numerical Analysis; Springer Science & Business Media: Berlin, Germany, 2013; Volume 12. [Google Scholar]
  36. Cahn, J.W. On spinodal decomposition. Acta Metall. 1961, 9, 795–801. [Google Scholar] [CrossRef]
  37. Huang, C.; de La Cruz, M.O.; Swift, B. Phase separation of ternary mixtures: Symmetric polymer blends. Macromolecules 1995, 28, 7996–8005. [Google Scholar] [CrossRef]
  38. Wu, K.; Morral, J.; Wang, Y. A phase field study of microstructural changes due to the Kirkendall effect in two-phase diffusion couples. Acta Mater. 2001, 49, 3401–3408. [Google Scholar] [CrossRef]
  39. Metals Data Book; Japan Institute of Metals: Maruzen, Tokyo, 2004; Volume 21.
  40. Cahn, J.W. Phase separation by spinodal decomposition in isotropic systems. J. Chem. Phys. 1965, 42, 93–99. [Google Scholar] [CrossRef]
  41. Mohanty, R.; Sohn, Y. Phase-field investigation of multicomponent diffusion in single-phase and two-phase diffusion couples. J. Phase Equilibria Diffus. 2006, 27, 676–683. [Google Scholar] [CrossRef]
  42. Hillert, M.; Kjellqvist, L.; Mao, H.; Selleby, M.; Sundman, B. Parameters in the compound energy formalism for ionic systems. Calphad 2009, 33, 227–232. [Google Scholar] [CrossRef]
  43. Luo, Z.; Du, Y.; Liu, Y.; Tang, S.; Pan, Y.; Mao, H.; Peng, Y.; Liu, W.; Liu, Z. Phase field simulation of the phase separation in the TiC-ZrC-WC system. Calphad 2018, 63, 190–195. [Google Scholar] [CrossRef]
  44. Jacobs, M.; Schmid-Fetzer, R.; Markus, T.; Motalov, V.; Borchardt, G.; Spitzer, K.H. Thermodynamics and diffusion in ternary Fe–Al–Cr alloys, Part I: Thermodynamic modeling. Intermetallics 2008, 16, 995–1005. [Google Scholar] [CrossRef]
  45. Bale, C.W.; Chartrand, P.; Degterov, S.; Eriksson, G.; Hack, K.; Mahfoud, R.B.; Melançon, J.; Pelton, A.; Petersen, S. FactSage thermochemical software and databases. Calphad 2002, 26, 189–228. [Google Scholar] [CrossRef]
  46. Chang, K.; Krill III, C.E.; Du, Q.; Chen, L.Q. Evaluating microstructural parameters of three-dimensional grains generated by phase-field simulation or other voxel-based techniques. Model. Simul. Mater. Sci. Eng. 2012, 20, 075009. [Google Scholar] [CrossRef]
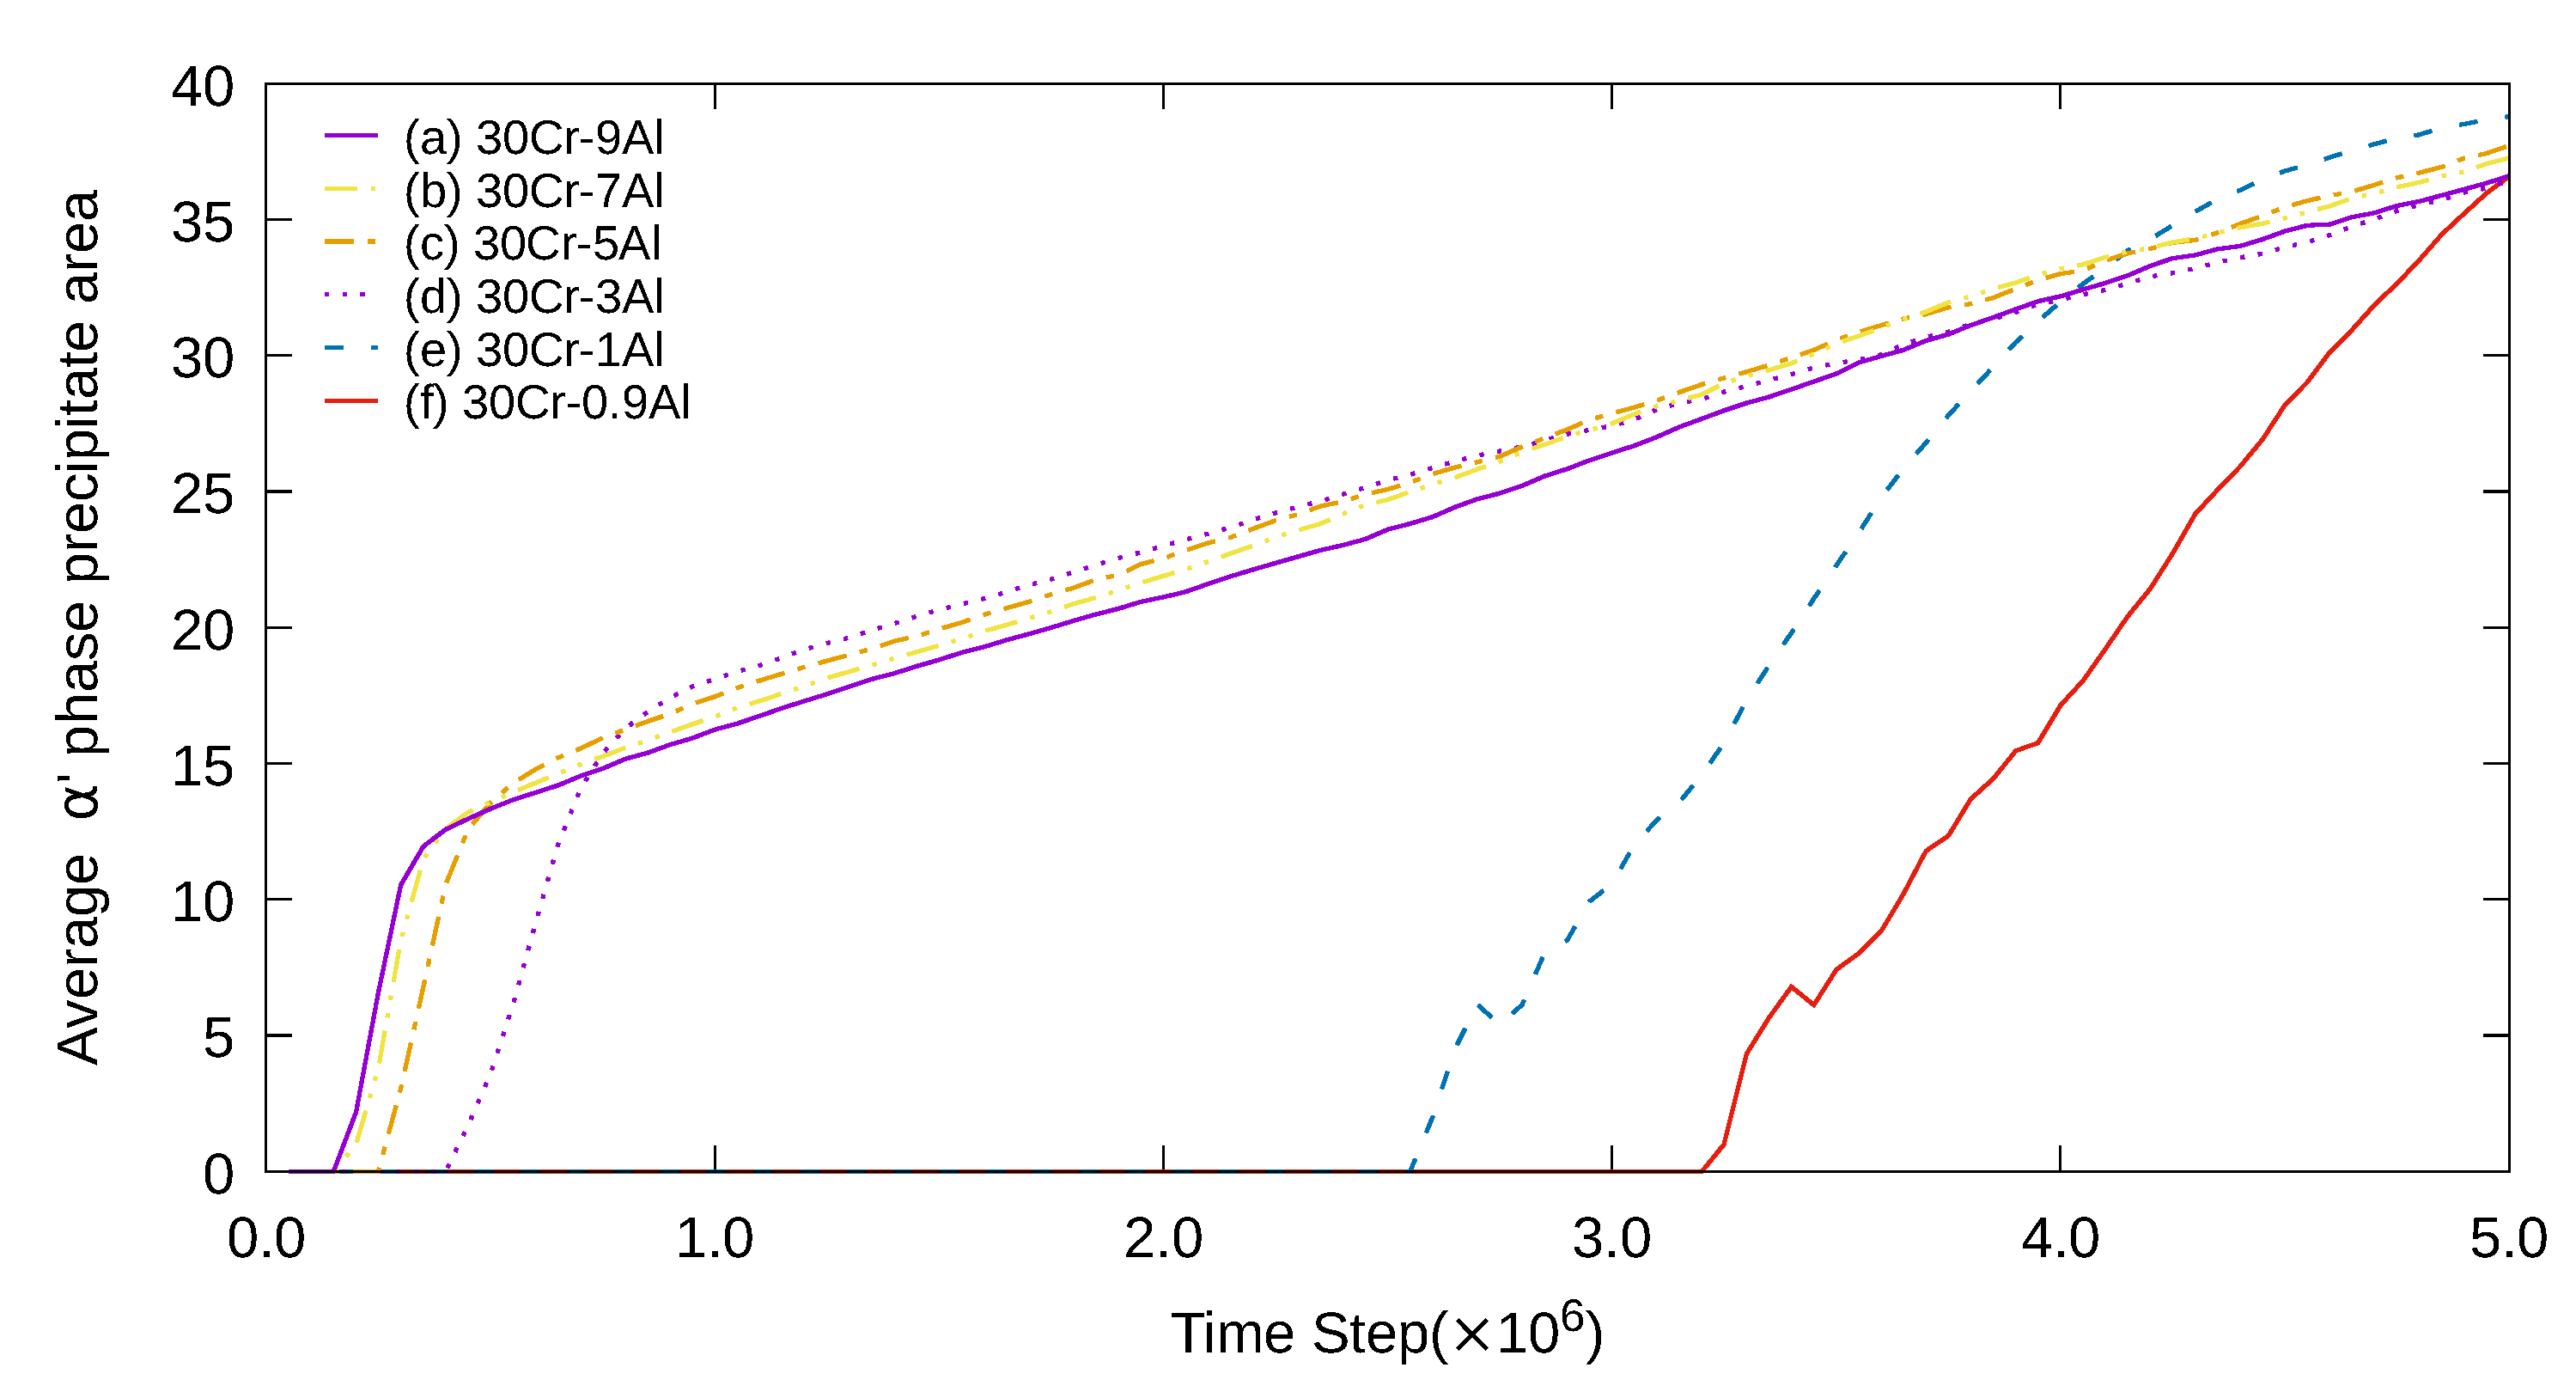
Figure 1. Average α precipitate area of the 2D simulation at an average Cr concentration of 30% when the average Al concentration was (a) 9%, (b) 7%, (c) 5%, (d) 3%, (e) 1%, and (f) 0.9%.
Metals 11 00004 g001
Figure 2. α phase fraction of the 2D simulation at an average Cr concentration of 30% when the average Al concentration was (a) 9%, (b) 7%, (c) 5%, (d) 3%, (e) 1%, and (f) 0.9%.
Metals 11 00004 g002
Figure 3. Number density of the α precipitates per cell size of the 2D simulation at an average Cr concentration of 30% when the average Al concentration was (a) 9%, (b) 7%, (c) 5%, (d) 3%, (e) 1%, and (f) 0.9%. Overshooting was observed before t * = 1.0 × 10 6 in (ad).
Metals 11 00004 g003
Figure 4. Plots of the Cr or Al concentration at t * = 5.0 × 10 6 when the average Cr concentration was 30% and the average Al concentration was (a,d) 0.1%, (b,e) 1%, and (c,f) 9%. Cases (ac) are plots of the Cr concentration field and cases (df) are plots of the Al concentration field.
Metals 11 00004 g004
Figure 5. Average α precipitate area of the 2D simulation when the average Cr concentration was 35% at various average Al concentrations.
Metals 11 00004 g005
Figure 6. Number of the α precipitates of the 2D simulation when the average Cr concentration was 35% at various average Al concentrations. Overshooting was observed before the t * = 5.0 × 10 5 when the average Al concentration was above 4%.
Metals 11 00004 g006
Figure 7. α phase fraction of the 2D simulation when the average Cr concentration was 35% at various average Al concentrations.
Metals 11 00004 g007
Figure 8. Plots of the Cr or Al concentration at t * = 5.0 × 10 6 when the average Cr concentration was 35% and the average Al concentration was (a,d) 0.1%, (b,e) 1%, and (c,f) 9%. Cases (ac) are plots of the Cr concentration field and cases (df) are plots of the Al concentration field.
Metals 11 00004 g008
Figure 9. Number of α precipitates of the 2D simulation when the average Cr concentration was 40% at various average Al concentrations. A clear overshooting was observed before the t * = 5.0 × 10 5 when the average Al concentration was above 0.7%.
Metals 11 00004 g009
Figure 10. Plots of the Cr or Al concentration at t * = 5.0 × 10 6 when the average Cr concentration was 40% and the average Al concentration was (a,d) 0.1%, (b,e) 1%, and (c,f) 9%. Cases (ac) are plots of the Cr concentration field and cases (df) are plots of the Al concentration field.
Metals 11 00004 g010
Figure 11. α phase fraction using the FactSage thermochemical software and FactSage steel (FSstel) database.
Metals 11 00004 g011
Figure 12. Average α precipitate area of the 3D simulation at an average Cr concentration of 30% when the average Al concentration was (a) 10%, (b) 7%, and (c) 4%.
Metals 11 00004 g012
Figure 13. Number of α precipitates of the 3D simulation at an average Cr concentration of 30% when the average Al concentration was (a) 10%, (b) 7%, and (c) 4%. Overshooting was observed before the t * = 1.0 × 10 6 in (ac).
Metals 11 00004 g013
Figure 14. Average α precipitate volume of the 3D simulation when the average Cr concentration was 35% at various average Al concentrations.
Metals 11 00004 g014
Figure 15. Number of α precipitates of the 3D simulation when the average Cr concentration was 35% at various average Al concentrations. Overshooting was observed before the t * = 5.0 × 10 5 when the average Al concentration was above 4%.
Metals 11 00004 g015
Figure 16. Numbers of α precipitates of the 3D simulation when the initial Cr concentration was 40% at various interval of Al concentration: when the initial Al concentration was less than 1% and 11%, and when the interval of Al concentration was 0.3% and 3%.
Metals 11 00004 g016
Figure 17. Cr concentrations at t * = 2.5 × 10 6 . The system size is 256 Δ x × 256 Δ y × 256 Δ z: (a) 35Cr-1Al, (b) 35Cr-10Al, (c) 40Cr-1Al, and (d) 40Cr-10Al.
Metals 11 00004 g017
Figure 18. Al concentration at t * = 2.5 × 10 6 . The system size is 256 Δ x × 256 Δ y × 256 Δ z (a) 35Cr-1Al, (b) 35Cr-10Al, and (c) 40Cr-1Al, (d) 40Cr-10Al.
Metals 11 00004 g018
Publisher’s Note: MDPI stays neutral with regard to jurisdictional claims in published maps and institutional affiliations.