Article

Understanding Size Effects and Forming Limits in the Micro-Stamping of Industrial Stainless Steel Foils

1
Institute for Frontier Materials, Deakin University, Waurn Ponds, Pigdons Rd., Geelong, VIC 3216, Australia
2
School of Engineering, Deakin University, Waurn Ponds, Pigdons Rd., Geelong, VIC 3216, Australia
3
Ford Motor Company, Research and Innovation Center, 2101 Village Rd., Dearborn, MI 48121, USA
*
Author to whom correspondence should be addressed.
Metals 2021, 11(1), 38; https://doi.org/10.3390/met11010038
Submission received: 27 November 2020 / Revised: 16 December 2020 / Accepted: 23 December 2020 / Published: 26 December 2020
(This article belongs to the Special Issue Micro-Forming)

Abstract

:
This study investigates the effect of grain size and composition on the material properties and forming limits of commercially supplied stainless steel foil for bipolar plate manufacture via tensile, stretch forming and micro-stamping trials. It is shown that in commercially supplied stainless steel the grain size can vary significantly and that ‘size effects’ can be influenced by prior steel processing and composition effects. While the forming limits in micro-stamping appear to be directly linked to the plane strain forming limits of the individual stainless steel alloys, there was a clear effect of the tensile anisotropy. In contrast to previous studies, forming severity and the likelihood of material failure did not increase with a decreasing channel profile radius. This was related to inaccuracies of the forming tool profile shape.

1. Introduction

Polymer electrolyte membrane (PEM) fuel cells have received considerable attention as a clean energy source and are of great interest to the automotive industry [1]. The bipolar plate is one of the major bottlenecks for the commercial application of PEM fuel cells and accounts for more than 70% of the fuel cell weight and 40% of the cost [2]. Conventional bipolar plates are made of graphite, but there has been an increasing focus on metal bipolar plates that can be produced using thinner gauge sheet steels and are more suitable for mass production [3]. Stainless steels have received the most attention [4] while there is now also increasing interest in the use of titanium foils [5]. Optimal fuel cell performance requires an aspect ratio of channel height, H to width, S of   A R = H / S = 1 [6] or higher [7], while other micro channel parameters only have a minor effect [8].
Several technologies have been developed to manufacture metal bipolar plates from stainless steel foil. These include micro electrical discharge machining (μEDM) [9], lithography galvanic moulding (LIGA) [10], electrochemical micro-machining (EMM) [11], hydroforming [12], and micro roll forming [13]. The micro-stamping process [14] promises the most economical solution, combined with easy and rapid implementation.
Several studies have investigated the micro-stamping of stainless steel (SS) foil in the thickness range between 0.05 [15] and 0.1 mm [16] and including the two most common alloy compositions SS304 and SS316. In most cases the maximum aspect ratio, AR, was limited to values between 0.18 [14] and 0.5 [15]. Therefore, a current key limitation of micro-stamping is the low aspect ratio that can be achieved, and further work is needed to improve the process.
This is challenging given that accounting for material behaviour and especially the forming limit of thin metal foil in numerical process models is difficult. Often common methods to analyse material properties and tune material models cannot be directly applied. Previous studies have developed special tests [17] and sample dimensions [18] to enable calibration of kinematic hardening and fracture model parameters. These models do not account for size effects.
In sheet metal of conventional thickness, the material strength increases with decreasing grain size. This material behaviour can be represented by the Hall-Petch Equation [19,20]. With a decrease in the ratio of material thickness, t , to grain size, d , the material behaviour of metal foil becomes inhomogeneous and deviates from that commonly observed in metal sheet of conventional thickness. These so-called “grain-specimen size effects” generally start occurring when the ratio of thickness to grain size ( N = t / d ) reaches values of N < 15 [21], or < 10 [22]. At this point, the material behaviour changes from polycrystal to single crystal behaviour where the deformation and the properties of individual grains play a more important role and the material starts behaving more like a laminate than a continuous sheet. Size effects in micro forming manifest themselves by a reduction in the tensile flow stress [23]. This can be explained with a surface layer model where the share of grains that represent the surface layer becomes higher with decreasing N. Free surface grains show less hardening compared with inner volume grains; this reduces the flow stress [24]. Other studies reported the occurrence of inhomogeneous deformation with decreasing N [25] and the reduction in forming [26] and fracture limits [27]. The grain-specimen size effect is usually mixed with the effect of the initial texture on the mechanical response and this results in the so-called statistical size effect [28]. Thereby with reducing number of grains through the thickness, the overall response of the material is increasingly influenced by the orientation of the individual grains. Towards the extreme case of a single crystal with a sharp texture, the flow stress will increase with decreasing N, i.e., will show the opposite trend compared to conventional grain-specimen size effect mentioned above. It is difficult to estimate the coupled grain-specimen size effect and the statistical size effect on the tensile strength [29]. In general, stainless steel foils used for bipolar plate production show N values that are beyond the range where statistical size effects would occur and the following part of this study will, therefore, be limited to the grain-specimen size effect, which for simplification will be termed as the “size effect”.
To account for size effects, some studies investigated common instability and ductile fracture models to numerically predict forming limits in micro-scale forming conditions [30]. Other investigation have established new failure and fracture criteria to account for size effects in the prediction of the forming limits of copper [31] and SS foils [32]. The calibration of these models requires extensive experimental effort and up till now most models have only been validated for simple forming cases; their applicability for industrial process optimisation has not been validated.
Up till now, only few studies have focused on the numerical analysis of the micro-stamping process. Karacan, et al. [33] assessed the forming limits of various metal foils including SS, aluminium and CP-Ti in micro-stamping by comparing predicted forming strains with the theoretical forming limit curves (FLDs) provided in the Dynaform® FEA software. Kolahdooz, et al. [34] used an FLD damage initiation criterion to estimate the likelihood of rupture in critical forming areas in the numerical analysis of rubber pad forming of 0.1 mm thick 316L steel. Some experimental validation was provided but the FLD values used for the damage criterion were taken from a different study and a 316L steel with 1.6 mm material thickness. A recent study by Hossein, et al. [35] suggested that failure initiation in rubber pad forming can be successfully predicted with a ductile fracture criteria. All of these studies did not account for size effects and only limited experimental validation was performed.
It is therefore unclear if the material behaviour of commercially supplied SS foils in micro-stamping can be assumed homogeneous or if size effects must be considered. It is further unknown if the material forming limits in micro-stamping can be estimated with the conventional FLD.
In this study the microstructure of five commercially supplied stainless steels, one 304, one 301 and three 316L alloys, were investigated and the detailed testing results are provided for the benefit of both the research and industrial communities. The mechanical properties of all steels were determined by tensile testing and individual forming limit diagrams (FLD) were established with a stretch forming tool. This was conducted to determine if there was a link between the microstructure and “potential size effects”, mechanical properties and forming limits. After this, micro-stamping trials were performed on the three 316L alloys and compared with their experimental FLDs to determine if material forming limits in micro-stamping can be assessed with the conventional FLD.

2. Experimental Procedure

2.1. Material

Five industrial stainless steel foils from various suppliers and having a thickness of 0.1 mm were analysed in this study. Their chemical compositions determined by glow discharge optical emission spectrometry are given in Table 1.
Three 316L austenitic chromium-nickel stainless steels were analysed. 316L is an extra-low carbon version of type 316 stainless steel and contains molybdenum to increase corrosion and pitting resistance in chloride ion solutions [36]. 316L alloys are high cost but currently represent the material of choice for metal bipolar plate applications [37]. In addition, there are two lower cost stainless steels, a 301 and a 304 stainless steel. Both have similar composition, but the content of carbon of the 301 stainless steel is almost twice that of the 304 stainless steel, while the nickel content in the 301 steel is lower. The 304 stainless steel has 0.06% carbon which is slightly higher than the three 316L steels, where carbon contents range between 0.04 and 0.05%. From the commercial 316L steels, the 316L2 has less manganese compared with the 316L1 alloy. Otherwise the compositions of 316L1 and 316L2 are approximately the same. All steels have nickel contents of 7% and higher and therefore can be considered austenitic stainless steels [38].

2.2. Heat Treatment

An annealing heat treatment was performed to produce two different grain sizes for the 316L1 material. The recommended annealing temperature range for 316L alloys is between 1040 and 1175 °C followed by air cooling or a water quench [39]. A muffle furnace with an argon atmosphere was used to prevent oxidation. The pre-cut samples were sealed in packages of 0.01 mm stainless steel foil to prevent oxygen exposure. The furnace was pre-heated to the required annealing temperature followed by the rapid placement of the sample packages. The samples for the tensile and the stretch forming trials were heat treated at 1050 °C for 20 min (316L1H1) and 60 min (316L1H2) followed by water quenching to prevent the re-precipitation of chromium carbides. The sheets for the micro-stamping trials were annealed at 1100 °C for 60 min; this gave the same grain size as for the 316L1H2 condition.

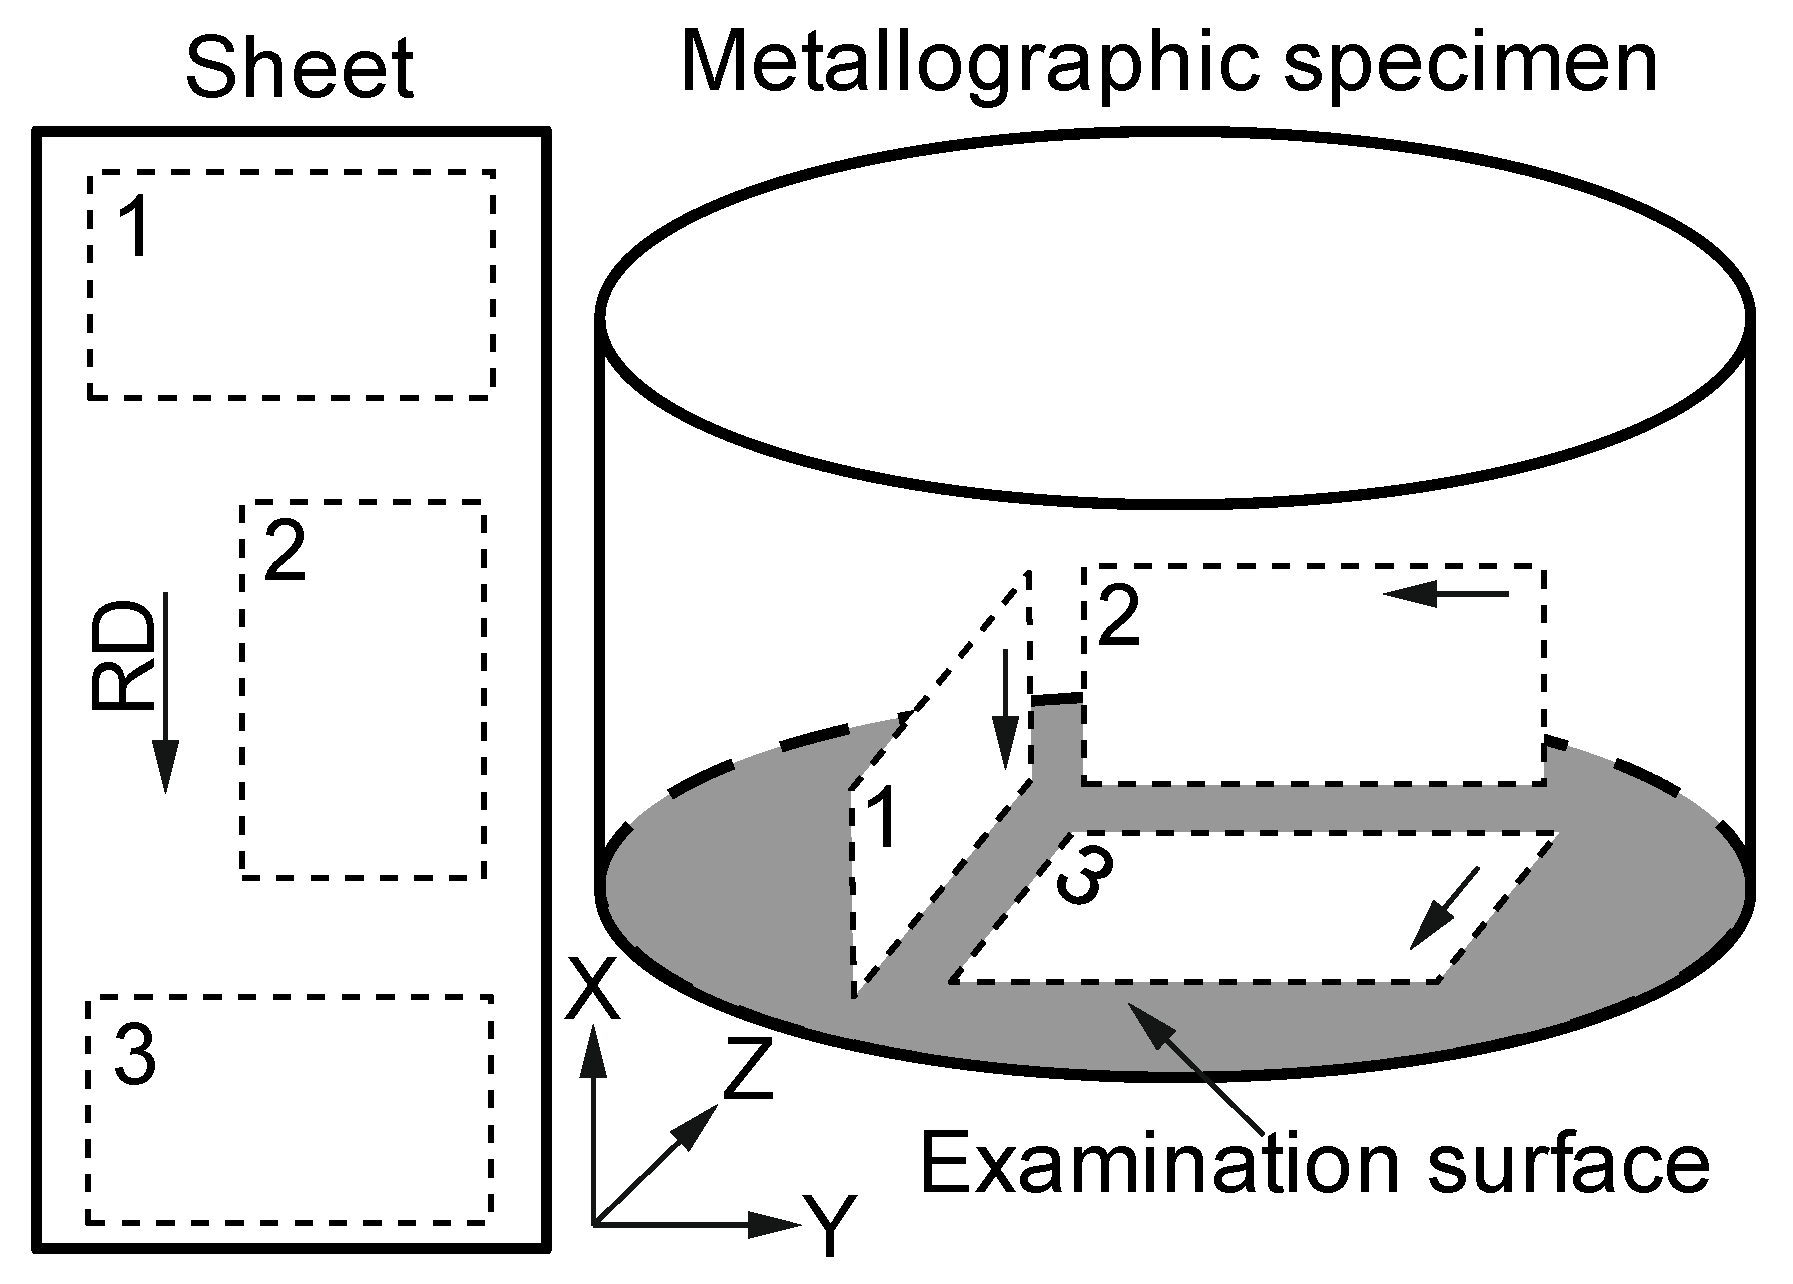
2.3. Microstructure Analysis
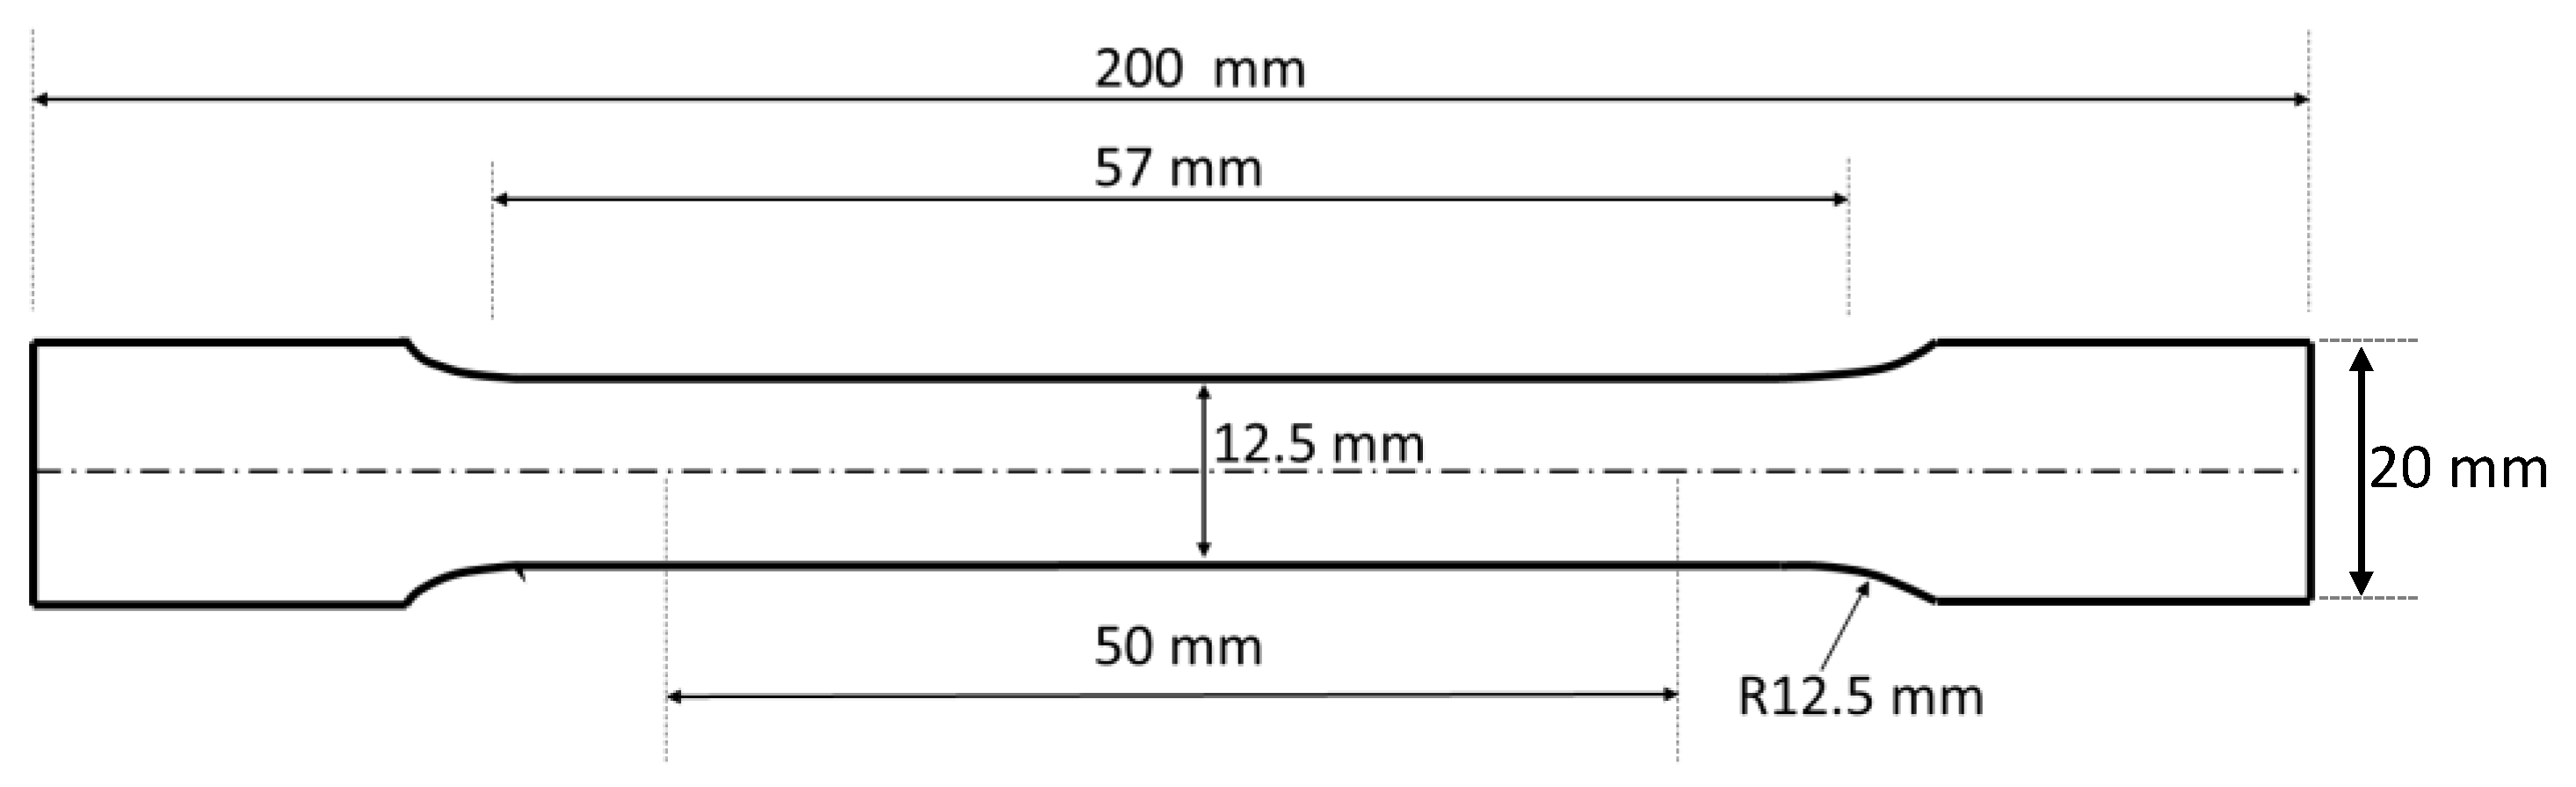
The grain size of all alloys was investigated with a SEM based angular selective backscattered (AsB) detector installed in a field emission scanning electron microscope (FE-SEM; 20 kV, SUPPRA 55-VP, Zeiss, Oberkochen, Germany). For this, the samples were cut into 3 rectangular sheets and hot mounted in the electrically conductive resin ‘PolyFast’ from the company Struers (Ballerup, Denmark). After hardening, the specimen surface was ground by hand, followed by polishing on a Struers ‘Rotopol’ polisher. The polishing was undertaken with 6 µm, 3 µm and then 1 µm diamond paste. This was followed by polishing with OPS diamond paste. The grain size of the five commercial alloys was investigated over the thickness in the rolling direction (RD) (Section 1 in Figure 1), transverse to the rolling direction (TD) (Section 2 in Figure 1) and in the normal direction (Section 3 in Figure 1). The grain size was analysed with the line intersection method according to ASTM E112-13 standard [40] and averaged over three samples for each orientation. For this, at least three SEM images were used and four or five random straight lines were drawn on each image. For each orientation, there were approximately 70 (coarse grain samples) to 169 (fine grain samples) grains crossed by these lines. The number of the grains intercepted by the lines were counted to estimate the mean intercept (unit mm) to give the nearest ASTM grain size number, G. The grain size used in this paper was obtained by finding the average diameter corresponding to G in Table 4 (Grain Size Relationships Computed for Uniform, Randomly Oriented, Equiaxed Grains) in ASTM E112-13 (2013). A similar method was used in previous studies that were aimed at size effects in micro sheet forming [32].

2.4. Tensile Tests

Tensile tests were performed according to ASTM standard E8 [41] on an Instron universal testing machine, using samples (Figure 2) which were wire cut at 0˚ (RD) and 90˚ (TD) to the rolling direction. The cross head-speed was set to 0.06 mm/s giving an initial strain rate of 0.001 s−1 and the tensile strain was measured with a video extensometer. Due to a limited field of vision, the distance between the measurement dots was set to 20 mm, which deviates from the usual test procedure which generally applies a 50 mm extensometer measurement range. This change enabled the tracking of material deformation over the whole test. The yield strength (YP0.2), the ultimate tensile strength (UTS) and the uniform elongation (UE) were determined from the engineering stress strain curves.

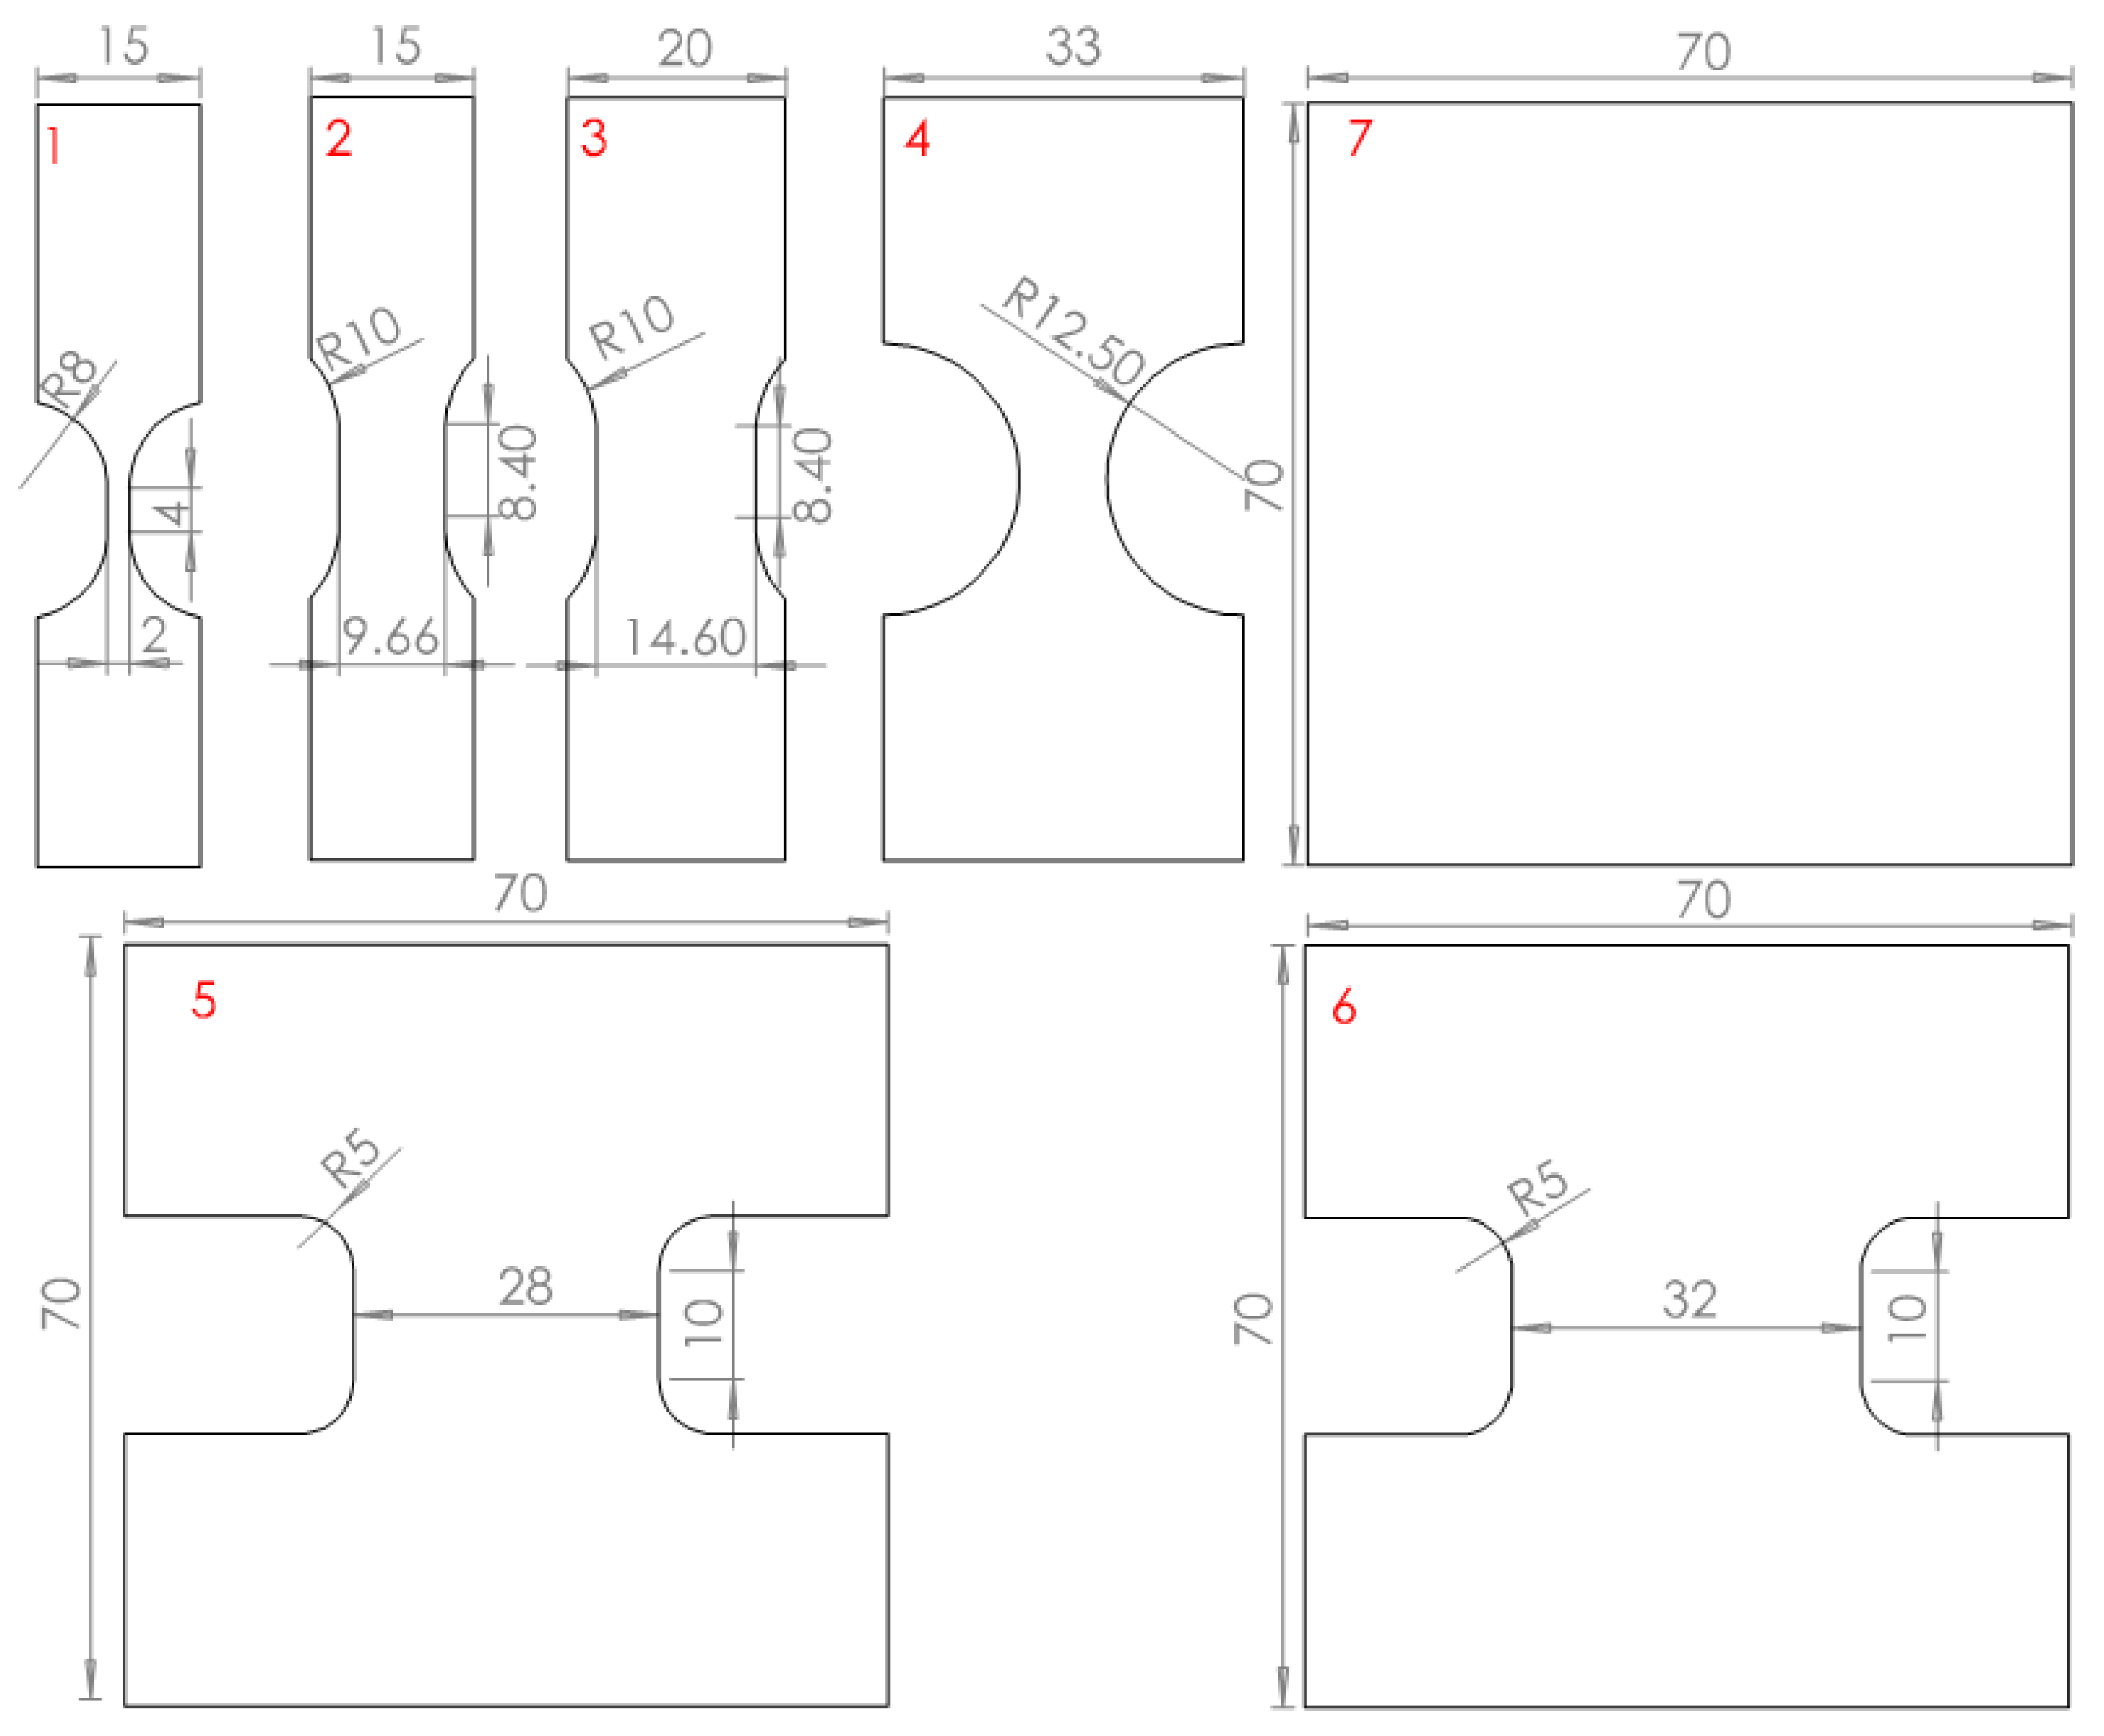
2.5. Forming Limit Tests

The forming limit diagrams (FLDs) were determined for all commercial alloys and the two heat treatment conditions. For this, sample shapes 1–2 (Figure 3) were tested in uniaxial tension with an Instron universal testing machine. The forming limits in plane strain and biaxial tension were analysed by stretch forming sample shapes 3–7 (Figure 3) over a hemispherical punch in the cupping test tool (Erichsen, Hemer, Germany) shown in Figure 4. This tool was incorporated in an Erichsen sheet metal tester. The test procedure conforms to that used in previous studies [31,42]. All specimen shapes were wire cut in the RD and the edges polished with fine sandpaper.
In the tensile tests, a cross head speed of 0.06 mm/s was used while the punch speed in the Erichsen test was 0.2 mm/s. This gave similar strain rates and quasi-static forming conditions in both tests. To ensure near frictionless conditions between the punch and the sheet in the stretch forming test, a sandwich layer lubrication system was used. This consisted of the following layers: milk grease–LDPE foil–milk grease–PPE foil–milk grease–LDPE foil–milk grease. The PPE and the LDPE foils had a thickness of 0.35 mm and 0.055 mm respectively. In most cases this gave necking and material failure in the dome peak centre area.
Forming strain was measured with a GOM Aramis camera system (ZEISS, Oberkochen, Germany). For this, the sample surface was painted with a stochastic pattern. The ‘linear best-fit method’ described in [43] was used to determine the forming limit strains.

2.6. Micro-Stamping Trials

The micro-stamping trials were limited to the three commercial 316L alloys and the 316L1H2 heat treatment condition. A hydraulic press was used in combination with the forming tool assembly shown in Figure 5a. The forming tool consists of a punch plate and a die block that includes the micro channel patterns. The forming tools are connected to the punch and the die shoes via dowel pins. High precision tool alignment was achieved with four guide pillars.
Pre-cut square blanks with the dimensions given in Figure 5b were formed without lubrication and clamped at the outer edges with draw beads. Tests were performed with blanks oriented with the rolling direction parallel to the direction of the micro channels (labelled TD*) and with the rolling direction perpendicular to the micro channel length direction (labelled RD*). Therefore, the TD* and RD* labels denote the main direction of forming with respect to the blank orientation.
The material was stretch formed into 17 straight micro channel patterns and three zigzag patterns; each included seven micro channels of 10 mm length (Figure 6a). Between the different channel patterns, the cross-sectional channel shape was varied to give different forming severity scenarios. This included different combinations of channel depth,   H , and width, S , to produce different aspect ratios and the variation of the top and bottom outer channel radii, R 1 and R 2   (Figure 6b).
The deformation of each pattern was not affected by the neighbouring patterns due to the design of the tooling and the spacing of the patterns. This was confirmed by measurement of material thinning in the flat area between the patterns, which was found to be very low.
A white light apparatus was used to illuminate the back surface of the formed samples. Individual patterns were manually placed over the opening (Figure 6c) and illuminated. If forming voids such as cracks or pinholes were present, the light from underneath of the formed panels would shine through the voids and be visible from the top surface, thus indicating failure. For each condition, five samples were tested. For some conditions the forming result was not clear—i.e., from the five samples that were tested, some failed while others did not. In this case the overall percentage of the successfully formed samples is given in the results.

3. Results

This section will present the results from our detailed testing of the stainless steel alloys (301, 304L, 316L). The 316L stainless steel samples were from three different commercial providers (316L1, 316L2, 316L3) and some of the 316L1 stainless steel samples were heat treated under two different conditions to change the microstructure. The heat treatments removed any prior processing effects on the microstructure. For each of the different sample types this section will present the microstructures, the mechanical properties, the forming limits, and micro-stamping results.

3.1. Microstructure and Average Grain Size over the Sheet Thickness

Figure 7 presents the microstructures over the material thickness in the Rolling Direction (RD) (Section 1 in Figure 1) together with the grain size values averaged over the three test directions for each particular alloy. Table 2 listed the averaged grain size and thickness to grain size ratio N.
Figure 8 shows microstructure results of 316L1, 316L2 and 316L3 over the material thickness direction in the TD direction (Section 2 Figure 1) and the normal direction (Section 3 in Figure 1). As seen from Figure 7 and Figure 8, these three alloys showed homogeneous grain sizes with only minor differences between the sample orientations.
From Figure 7 it is clear that the grain size varies significantly between the commercial alloys, ranging from approximately 11.2 μm for the 316L1 material to 22.5 μm for the 316L3 steel. This gives a thickness to grain size ratio between 8.9 and 4.4. Note that 316L2 has a similar chemical composition (Table 1) but almost 1.5 times the average grain size compared to the 316L1 material. The annealing heat treatment more than doubles and triples the grain size (i.e., the 316L1H1 and 316L1H2 conditions), compared to the ‘as received’ 316L1 material (Figure 7).

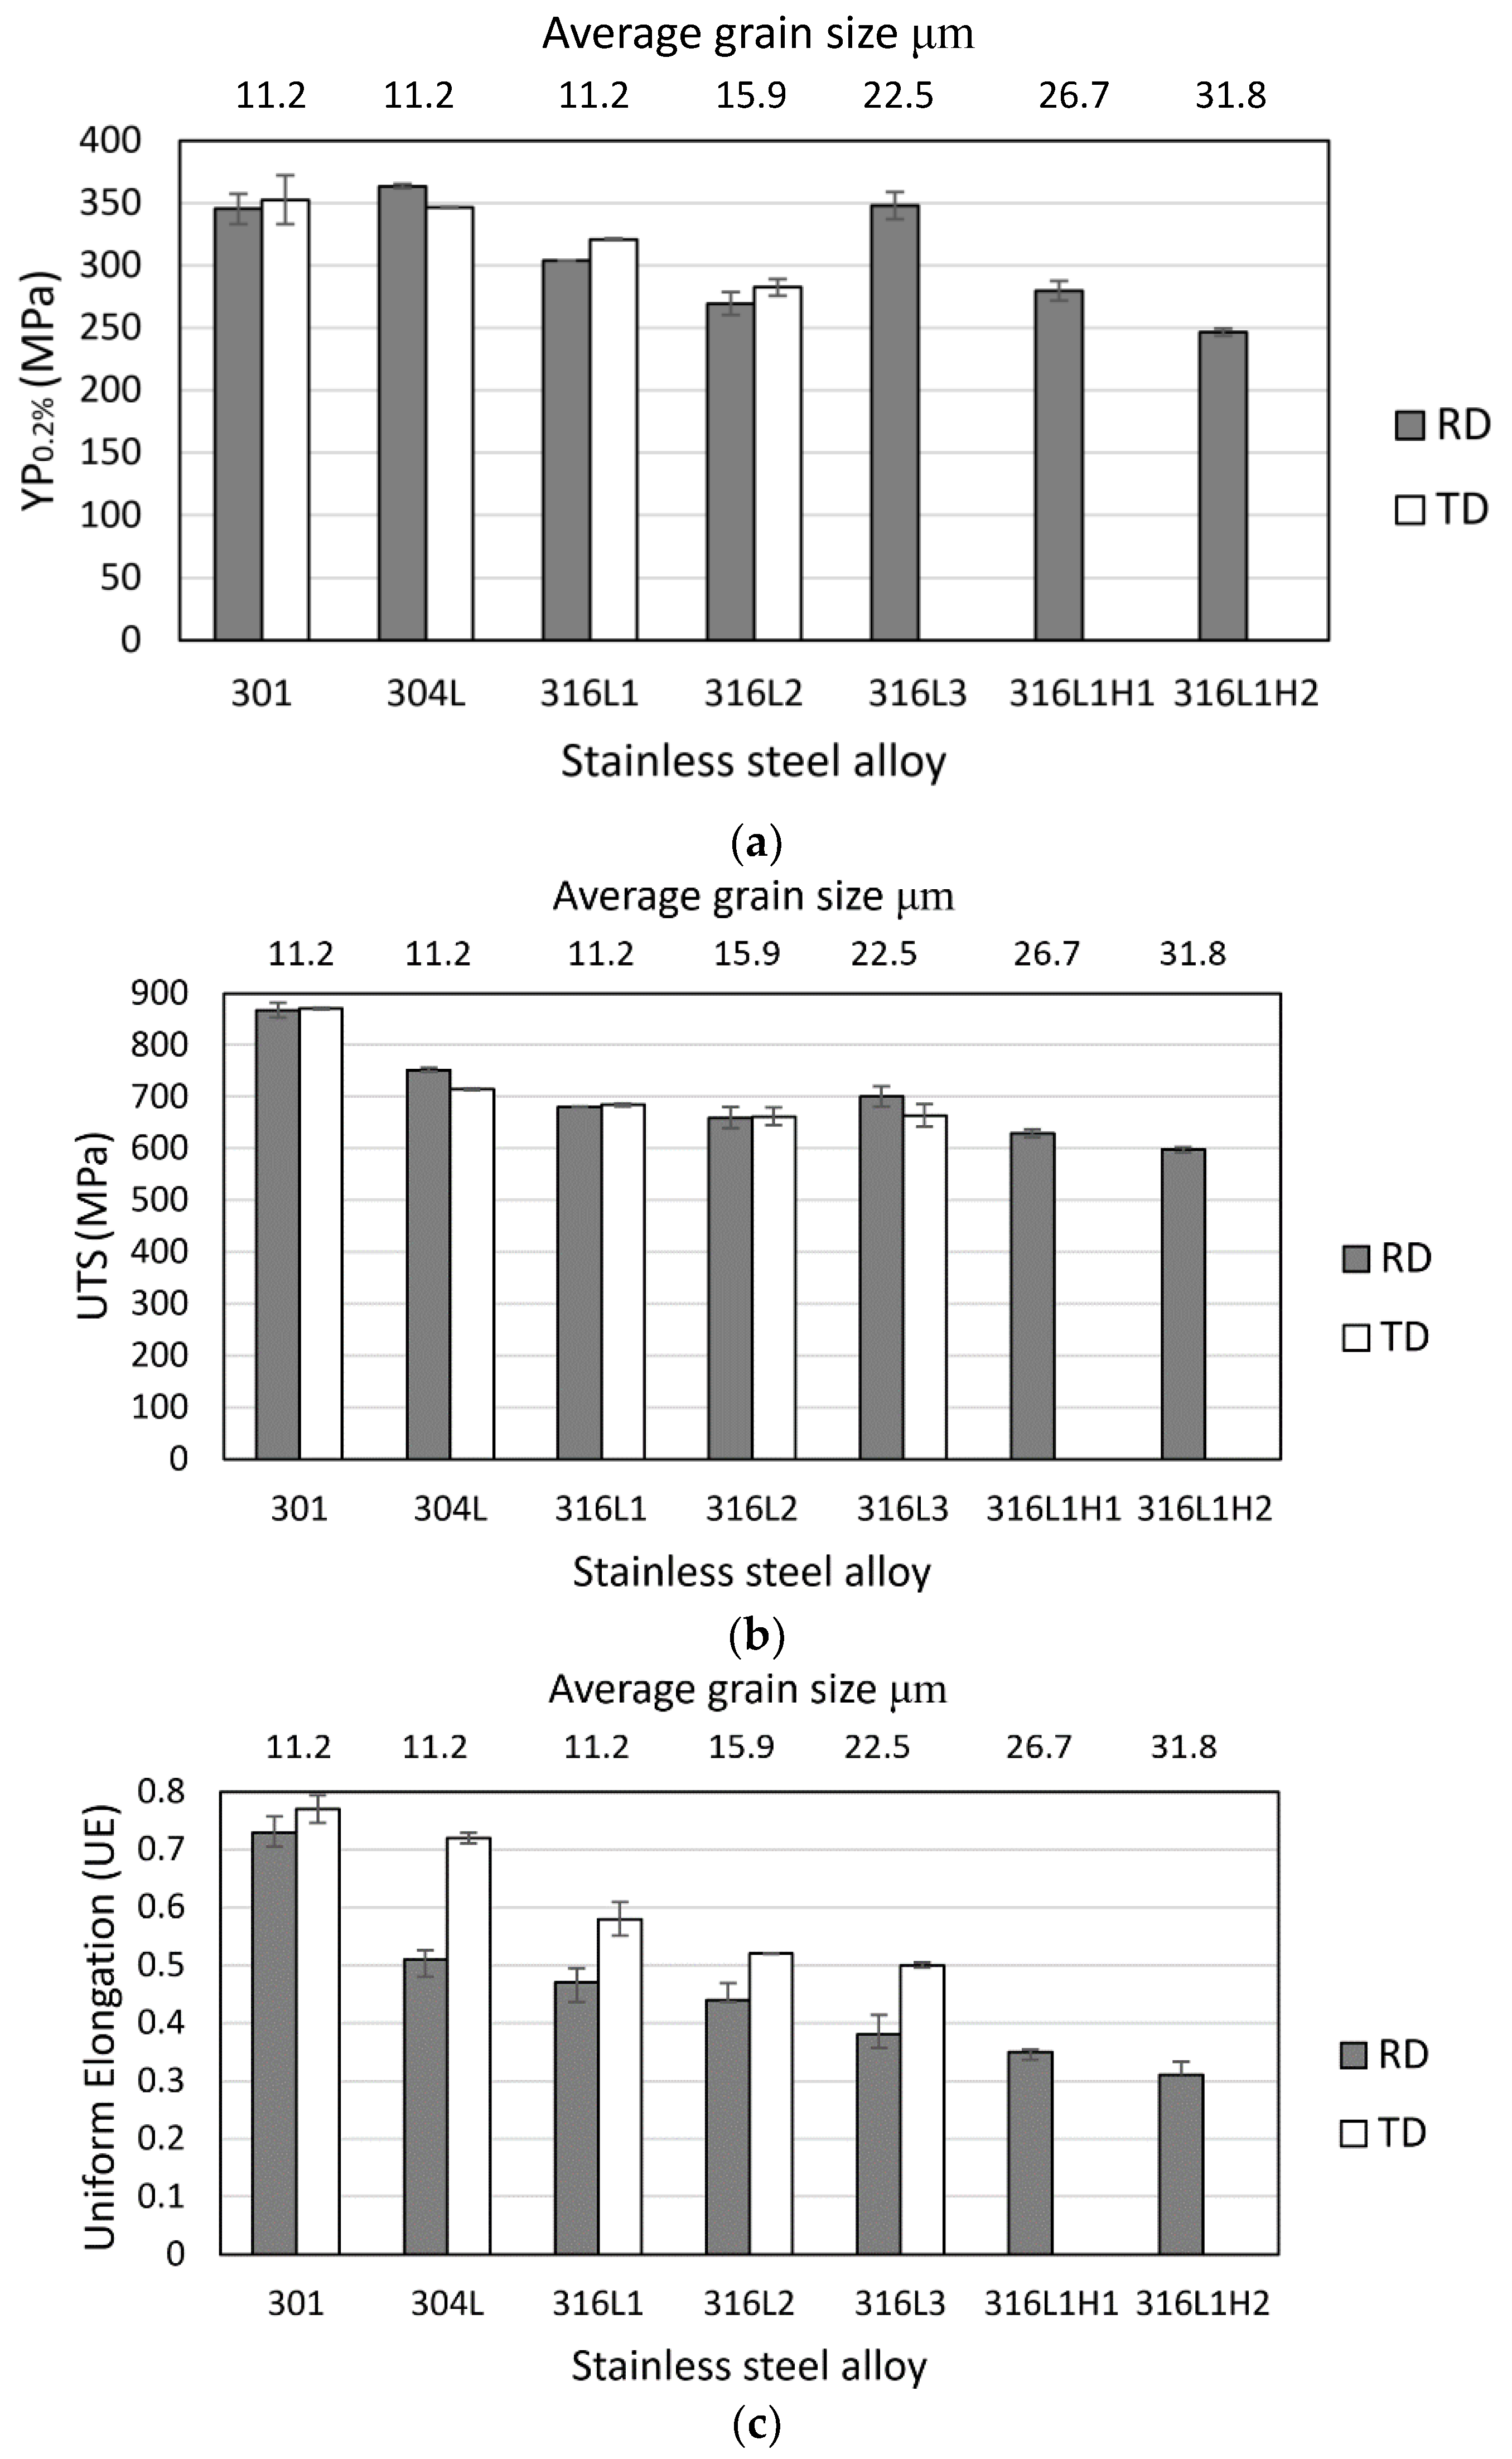
3.2. Mechanical Properties

All materials showed only minor material anisotropy and therefore only the engineering stress strain curves determined in the rolling direction RD are shown in Figure 9. Given their heat treatment, the 316L1H1 and the 316L1H2 material were only tested in the rolling direction. The values for yield strength (YP0.2) and ultimate tensile strength (UTS) are given for all directions in Figure 10a,b. Only minor necking before fracture was observed in the tensile tests and the uniform elongation (UE) coincided in all alloys with the total elongation (TE) at fracture. For this reason, only the UE is shown in Figure 10c.
Materials 301 and 304L, with the highest levels of carbon of 0.11 and 0.06 wt. %, respectively (Table 1), have the highest material strength and very similar YP0.2 (Figure 10a). Both alloys have the same grain size (Figure 7). Material 301 shows higher material hardening and has a higher UTS compared to 304L. This may be attributed to the material’s higher carbon content and the lower level of nickel. Low levels of nickel are common in 301 and 304 alloys and generally give increased material hardening and formability [39]. The UE of 301 is significantly higher compared to 304L (see Figure 10c).
The yield strength of the 316L3 alloy is higher compared to alloys 316L1 and 316L2 (Figure 10b) while its UE is significantly lower. The 316L1 and the 316L2 have the same alloy composition (Table 1) while the grain size of the 316L2 is approximately 1.5 times higher (Figure 7). The 316L1 alloy shows a higher YP0.2 compared to 316L2 which is partly due to material ageing. The UTS of the 316L1 is slightly higher (Figure 10b) while the UE of 316L1 is increased compared to 316L2 (Figure 10c).
While material anisotropy in regard to YP0.2 and UTS is low (Figure 9a,b), all commercial alloys showed lower UE in the RD compared to the TD (Figure 10c).

3.3. Forming Limits

The forming limit diagrams for the commercial alloys are shown in Figure 11a. It needs to be noted that due to the smaller punch size that was used, the forming limits may have been shifted in the major and minor strain directions. Previous studies suggest that a smaller hemispherical punch increases the level of bending deformation. This results in a nonlinear strain path and influences the forming limits [44]. Several authors have provided methods to correct for this [45]. Given the low material thickness that was tested, and that the thickness was the same for all alloys, the bending effect can be considered small. The forming limit values were, therefore, not corrected.
High forming limits can be observed for materials 301 and the 304L. This conforms well to the high UE and material hardening observed for both alloys in the tensile tests, Figure 9 and Figure 10c, respectively.
Similar to the uniaxial tensile results, the 316L2 alloy shows significantly lower formability compared with 316L1. The 316L3 which has the lowest UE (Figure 10c) also shows the lowest forming limits in the stretch forming test.
The forming limits of the 316L1 decrease with heat treatment and increasing heat treatment time (Figure 11b), which corresponds with the decrease in UE elongation with heat treatment that was observed in Figure 10c. A negative slope from plane to biaxial strain can be observed (Figure 11b) which has been reported in previous work [26]. The horizontal or even negative slope in the first quadrant of the FLD has been reported for non-ferritic materials such as brass and austinite stainless steels [46]. The phenomenon has been related to a high hardening exponent and the FCC (face centred cubic) structure of the material which promotes shear fracture prior to necking [47].

3.4. Micro-Stamping

In Table 3 the micro-stamping results are shown for the commercial alloys 316L2 and 316L3 and two sample orientations. Note that RD* and TD* are for samples positioned with the rolling direction and the transverse direction perpendicular to the micro channel length direction, respectively.
Due to the limited quantities of material being available, the micro-stamping trials on alloy 316L1 were limited to the as-received 316L1 and the second heat treatment condition, 316L1H2, and samples positioned with the rolling direction perpendicular to the micro channel direction (RD*). Five tests were performed for each condition. The dark grey colour in the cells of Table 3 indicates failure of all samples tested, while light grey shading indicates that all five samples were successfully formed. White cells denote that a fraction of the samples was successfully formed; with the percentage of parts successfully formed denoted in the particular table cell. The tool dimension conditions have been arranged from “easy” to “severe” from the left to the right to facilitate comparison. Columns 4.10 to 4.28 show results for the straight micro channels, while Columns Z4.9 to Z 4.19 represent the three zigzag channel conditions that were tested.

3.4.1. Effect of Micro-Stamping Tool Dimensions

The micro-stamping results only allow a qualitative analysis. All of the commercial alloys showed failure when micro-stamping channels with aspect ratios higher than 0.5. Only forming condition 4.15 (see Table 3) permitted the forming of all alloys to an AR of approximately 0.5. This is likely due to the large channel corner radii, R 1 and R 2 , which are 2 and 3 times the material thickness, respectively. When the corner radii are reduced (as is the case in forming condition 4.24), while keeping the aspect ratio at 0.5, all commercial alloys showed failure. Micro-stamping of ARs higher than 0.5 in combination with tight corner radii (see conditions 4.2 to 4.28 in Table 3) led to failure in all materials. This is in agreement with previous studies that suggested that if a rigid forming tool is used in combination with a quasi-static forming load, the AR in micro-stamping stainless steel foil channels is limited to an AR of 0.5 or less [15]
A direct comparison between the forming severity of the zigzag and the straight channel shapes can only be performed for conditions 4.15 and Z4.17 which show similar aspect ratios and channel corner radii. While in the straight channel condition (4.15 in Table 3) all alloys are successfully formed, in condition Z4.17 alloys 316L2 and 316L3 experience partial failure. This suggests that forming severity is higher when forming a zigzag channel shape.

3.4.2. Effect of Sample Orientation

The two commercial alloys, 316L2 and 316L3 show a clear effect of the sample orientation on the forming limits in micro-stamping. Both of these alloys have higher formability when samples are oriented with the sheet rolling direction oriented parallel to the micro channel length direction (TD*). This seems to correlate well with the higher UE both alloys show in TD in the uniaxial tensile tests (Figure 10c).

3.4.3. Effect of Alloy Type and Heat Treatment

From all of the commercial alloys, material 316L1 shows the highest forming limits in micro-stamping, followed by 316L2 for the forming of both straight and zigzag shaped channels (see conditions 4.15 to 4.18 and Z4.9 to Z4.14 in Table 3). This is for samples oriented with the RD perpendicular to the micro channel length direction (RD*). 316L3 shows the lowest formability of the three commercial alloys. This correlates well with the tensile and the FLD results where the 316L1 showed higher tensile UE in the RD (Figure 10c) and higher FLD forming limits (Figure 11b) compared to 316L2; while alloy 316L3 showed the lowest forming limits. The heat treatment of alloy 316L1 significantly reduces the material’s formability in micro-stamping, as can be observed when comparing conditions 316L1 and 316L1H2 in Table 3.

4. Discussion

This section will discuss three areas of interest arising from the results in the previous section. First, the effect of prior processing, grain size and alloy composition on the mechanical properties is presented. Second, the effect of grain size on the forming limit through material inhomogeneity is discussed. Finally, we relate each materials formability limits to the observed deformed shape when micro-stamping channels.

4.1. The Effect of Grain Size and Alloy Composition on the Mechanical Properties

The five commercial alloys show homogeneous microstructures with thickness to grain size ratios that range from 4.4 to 8.9. Previous studies have suggested that at values of N below 10 [21] to 15 [22], the material behaviour and forming limits of metal foil are influenced by size effects. This suggests that the material behaviour and forming limits of all commercial alloys should be influenced by size effects.
A direct comparison between 316L1 and 316L2 is possible given the similar composition of both alloys (Table 1). Their grain sizes are slightly different, d = 11.2 and 15.9 μm for 316L1 and 316L2 respectively. 316L2 with the coarser grain size has a lower material strength (Figure 9a,b) and UE (Figure 10c). This corresponds well with previous studies performed on heat treated SS304 foil [48].
The comparison of 316L1 with 316L3 is less conclusive. The 316L3 has almost double the grain size compared to 316L1 (Figure 7). This should have led to a lower flow stress in the 316L3 [48] compared to 316L1. Despite this fact, 316L3 shows a higher YP0.2 and similar UTS compared to 316L1 (Figure 10a,b). This trend may be related to the higher level of carbon in the 316L3 (which is known to increase material strength) and this may have balanced out some of the strength reduction related to the larger grain size. However, 316L3 shows significantly lower UE compared to 316L1 which conforms with trends observed in previous studies and [25] may be related to size effects.
A significant limitation of the current analysis is that the level of prior cold work and heat treatment in the commercial alloys is unknown. A higher level of cold work could also explain the higher material strength and lower ductility observed for the 316L3 alloy compared to 316L1. It has been previously shown that the forming limits of austenitic stainless steel 304 foil can be increased by an annealing heat treatment, even though the thickness to grain size ratio significantly reduced from N = 7.5 to 2.4 [49]. This suggests that in some circumstances, prior material processing can balance out size effects on the material properties of metal foil.
In contrast to the standard finding from the literature that the mechanical properties are influenced by size effects, prior processing of the blanks appears also to make a significant difference to the mechanical properties. Specifically, the higher material strength and lower ductility results of the commercial 316L alloys make it difficult to conclusively link the mechanical properties to size effects. Tests on heat treated 316L1 material were therefore performed. The heat treatment leads to an increase in grain size from d = 11.2 μm of the as received 316L1 condition to 26.7 and 31.8 μm after heat treatment. With increasing grain size, a clear reduction in material strength and UE in alloys 316L1H1 and 316L1H2 was observed (Figure 10a–c) compared to 316L1. The grains size of the heat treated 316L1H1 alloy is close to that of 316L3 (Figure 7) and the magnitudes of UE and FLDs are very similar even though their slopes on the right-side of the FLD are slightly different. In contrast, the 316L3 shows a significantly higher flow stress compared to 316L1H1 (Figure 10b,c). This seems to confirm the suggestion made earlier that the higher grain size in the 316L3 has led to a reduced ductility compared to 316L1, while the material maintained a higher material strength due to its higher content of carbon or prior material processing.

4.2. Grain Size Effects on the Forming Limits

Figure 11a suggests that the FLDs of the commercial alloys decrease with increasing grain size. 316L2 and 316L3 with the largest grain size show the lowest FLDs. A similar trend is observed in Figure 11b, where the FLDs of the commercial 316L1 and the heat treated conditions are shown. Increasing the grain size of the 316L1 alloy by heat treatment reduces the forming limits of the 316L1H1 and the 316L1H2 to levels that are comparable to those of the commercial alloys with the larger grain size (compare Figure 11a,b), 316L3 and 316L2.
Previous studies performed on heat treated copper foil suggest that the reduction in the forming limits with increasing grain size is due to an increasingly inhomogeneous material deformation that leads to an earlier strain localisation and necking [31].
To investigate if a similar mechanism has contributed to the lower forming limits observed in the coarse-grained stainless steel foils, the distribution of the von Mises strain is analysed over the deformation zone of the biaxial stretch formed samples. This was done at a punch stroke of 10 mm for all material conditions. Figure 12a shows the von Mises strain contour together with the two section cuts that were performed. The resulting distribution of strain over the section cut length for the two heat treated, coarse grained conditions are compared to the fine grained, as received 316L1 material in Figure 12b,c.
In both the 316L1H1 and the H2 alloys, the distribution of the von Mises strain is less homogeneous compared to the as received 316L1 material. Therefore, deformation seems to become more inhomogeneous with increasing heat treatment time and grain size (compare Figure 12b,c). This suggests that the decrease in forming limits with heat treatment observed for the heat treated stainless steel foil may be related to an increasing strain inhomogeneity as a result of the increased grain size. Noting that the unsymmetrical shape of 316L1 curves in Figure 12b,c indicates that the peak Mises strain was positioned slightly away from the peak of the dome. This may be a result of an uneven friction between the punch and sheet.
Comparing the coarse-grained commercial alloys in Figure 12d with Figure 12a also shows some strain inhomogeneity that is of a similar magnitude to the heat treated 316L1H1 condition. This indicates that the lower FLDs in the coarse-grained commercial steels are also related to an earlier necking initiation as a result of size effects. However, the level of strain inhomogeneity observed in this study is significantly lower compared with that previously reported for copper foil [25,31]. It should be noted that the softening of the surface layer might be another factor contributing to the decrease of the forming limit. Previous studies [31] revealed brittle material fracture behaviour and explained that this was due to the surface grains being less constrained by dislocation movement, which reduces the likelihood of void formation and stress concentration [50]. However, up to now it is still unclear whether the texture of the material significantly influences the forming limit in micro sheet forming.

4.3. The Effect of the Forming Mode

In the micro-stamping process, the metal foil is fully clamped in the draw beads. Material deformation, therefore, can plane strain and uniaxial stretch in the channel corner and the wall regions, respectively. In all cases, material failure was observed near the channel corner radii. This conforms with previous studies that observed the highest level of material thinning in the profile corner regions of micro-stamped channels [16]. Figure 13 shows an image of the micro-stamped profile determined with an Alicona non-contact profilometer (Alicona Imaging GmbH, Graz, Austria) for the most severe forming condition 4.28 (see Table 3). It is clear that failure mostly initiated in channel radius R1 while only some cracking can be observed in R2. This is surprising given that for forming condition 4.28, the forming radius R2 is half that of R1 (see Table 3) which is why failure initiation was expected at R2.
The situation becomes clear when comparing the scanned 2D profile of the forming tool with that of the formed channel shape in Figure 14a,b, respectively. Figure 14a indicates a rounded profile of the male forming die with a profile radius R2 between 0.137 and 0.145 mm which is larger compared to the original design of 0.120 mm (see Table 3). In contrast to this, profile radius R1 is reduced to values between 0.127 and 0.194 mm; this is significantly lower, compared to the designed radius of 0.220 mm (see Table 3).
Most importantly the designed channel shape and, in particular, profile radius, R2, are not fully formed, leading to a dome shaped top channel surface (Figure 14b) with an enlarged formed profile radius R ^ 2 . In contrast, a sharp corner radius, R ^ 1 , is formed.
The incomplete forming of the micro channel in the region of R2 may be due to the stainless steel foil failing at the corners R1 before it is fully wrapped around R2. Given the tool arrangement, R2 would not be fully formed before the male and the female die bottom out, while R1 is formed in the initial stages of the process. In the intermediate stage the male die seems to apply a 4-point bend-type deformation as it can observed by the near constant radius,   R ^ 2 , that is formed at the bottom of the channel (Figure 14b). Material deformation at the corners, R1, of the female die can be assumed to be plane strain stretching combined with bending. The plane strain stretch will reach failure first and this explains why material failure initiated near profile radius R1. The observed inaccuracies in the tool profile may be related to common wear or manufacturing issues and similar observations have been reported in previous studies [13,51]. Overall, the failure mode observed in the micro-stamping trials with material failure initiation in the corner radii suggests that material formability is governed by the plane strain forming limits of the material. This is confirmed when comparing the FLDs shown in Figure 11a with the micro-stamping results of Table 3. While the as received 316L1 material with the smallest grain size and the highest FLD shows the best performance, the 316L3 with the highest grain size and the lowest plane strain forming limit gives the lowest formability in the micro-stamping trials. The heat treated 316L1H2, which has similar grain size and FLD levels compared to 316L3, also shows low formability in micro-stamping.
A strong effect of the sample orientation can also be observed. Both the 316L2 and the 316L3 show higher forming limits in micro-stamping when samples were oriented with the TD perpendicular to the channel length direction (TD*). This conforms with the uniaxial tensile results in Figure 10c, where both the 316L2 and the 316L3 have higher UE in the TD compared to the RD. This suggests that material forming limits in the micro-stamping process are influenced by material anisotropy effects; even if they are relatively minor as for the current materials.

5. Conclusions

This study investigates for the first time the effect of prior processing, composition and microstructure on the mechanical properties of industrially supplied stainless steel foil and establishes the link with material behaviour and forming limits in micro-stamping. For this, tensile and stretch forming limit trials were performed on five commercial stainless steels and two heat treated conditions. This was combined with the micro-stamping and analysis of 20 different micro channel patterns representative for industrial metal bipolar plate production. The following conclusions can be made:
  • All tested commercial stainless steels show grain sizes that are within the range where size effects are likely to occur. However, the magnitude of size effects regarding material strength and hardening behaviour is influenced by material composition and prior steel processing effects.
  • Clear size effects are observed in regard to the material forming limits. For all commercial stainless steels the uniform tensile elongation and the stretch forming limits reduce with increasing grains size. This may be related to an increase in inhomogeneous material behaviour that leads to earlier strain localisation and necking but could also be due to the softening of the surface grains.
  • This study analysed for the first time the cross section shape of micro-stamping tools by surface scanning. The results suggest that tool shape inaccuracies due to tool wear or common manufacturing limits can affect material flow and forming limits in the micro-stamping process. The micro-stamping results of this study and of previous experimental and numerical investigations where tool dimensions were not explicitly measured should therefore be viewed with caution.
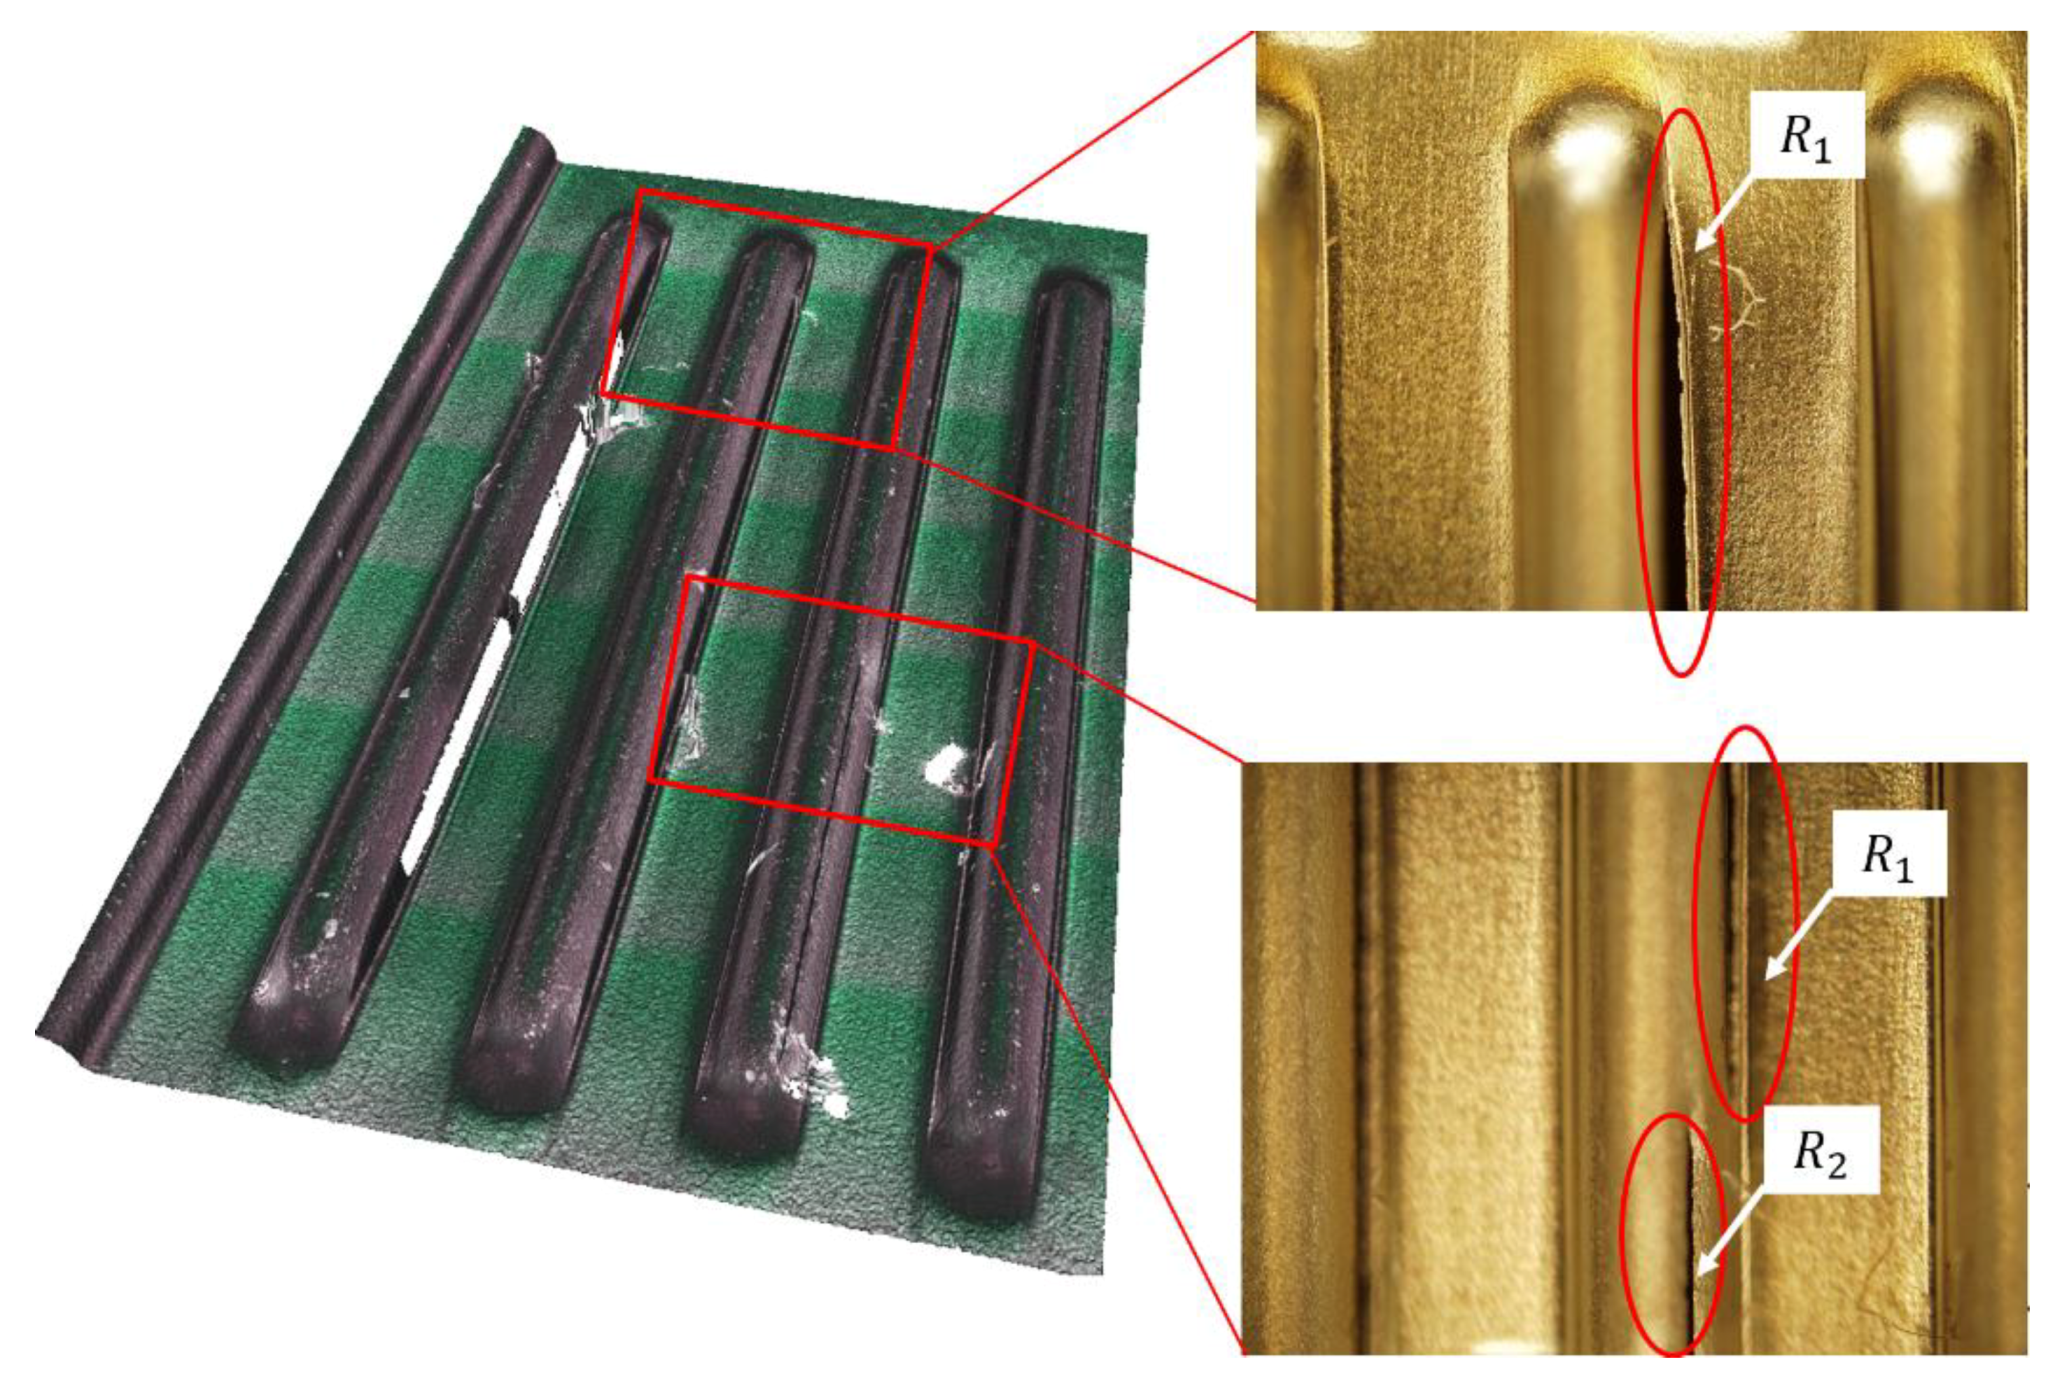
  • Failure in micro-stamping is initiated in the channel corner radii and our study provides first experimental proof that the forming limits are directly linked to the plane strain forming limits (FLDs) of the individual stainless steel alloys.
  • Some effect of the sample orientation in micro-stamping was observed and linked to the different levels of uniform tensile elongation determined in samples tested transverse and parallel to the rolling direction. This suggests that material anisotropy effects on formability need to be accounted for.

Author Contributions

Conceptualization, M.W. and D.E.W.; methodology, M.W., M.P.P., B.F.R. and P.Z.; formal analysis, M.W, M.P.P. and P.Z.; investigation, P.Z.; resources, D.E.W.; data curation, P.Z.; writing—original draft preparation, M.W.; writing—review and editing, M.P.P., B.F.R. and P.D.H.; funding acquisition, M.W., B.F.R. and P.D.H. All authors have read and agreed to the published version of the manuscript.

Funding

This research was funded by the Australian Research Council(LP150100059) and Ford Global.

Informed Consent Statement

Not applicable.

Data Availability Statement

The data that support the findings of this study are available from the corresponding authors upon reasonable request.

Acknowledgments

The authors would like to acknowledge the financial support by the Australian Research Council (LP150100059) and Ford Global. The authors further would like to thank J.L. Duncan for his assistance in writing this paper and appreciate the support from the RWTH master and internship students Christoph Muller, Marius Kaiser and Jens Muller, which was vital for the success of this project.

Conflicts of Interest

The authors declare no conflict of interest. The funders had no role in the design of the study; in the collection, analyses, or interpretation of data; in the writing of the manuscript, or in the decision to publish the results.

References

  1. Hermann, A.; Chaudhuri, T.; Spagnol, P. Bipolar plates for PEM fuel cells: A review. Int. J. Hydrog. Energy 2005, 30, 1297–1302. [Google Scholar] [CrossRef]
  2. Debe, M.K. Electrocatalyst approaches and challenges for automotive fuel cells. Nature 2012, 486, 43–51. [Google Scholar] [CrossRef] [PubMed]
  3. Richards, J.; Schmidt, K. Review–Metallic Bipolar Plates and Their Usage in Energy Conversion Systems. In Alloy Steel-Properties and Use; Morales, E.V., Ed.; InTech: Rijeka, Croatia, 2011; pp. 29–50. [Google Scholar] [CrossRef]
  4. Huya-Kouadio, J.M.; James, B.D.; Houchins, C. Meeting Cost and Manufacturing Expectations for Automotive Fuel Cell Bipolar Plates. ECS Trans. 2018, 83, 93–109. [Google Scholar] [CrossRef]
  5. Xu, Z.; Li, Z.; Zhang, R.; Jiang, T.; Peng, L. Fabrication of micro channels for titanium PEMFC bipolar plates by multistage forming process. Int. J. Hydrog. Energy 2020, in press. [Google Scholar] [CrossRef]
  6. Kumar, A.; Reddy, R.G. Effect of channel dimensions and shape in the flow-field distributor on the performance of polymer electrolyte membrane fuel cells. J. Power Sources 2003, 113, 11–18. [Google Scholar] [CrossRef]
  7. Xu, Y.; Peng, L.; Yi, P.; Lai, X. Analysis of the flow distribution for thin stamped bipolar plates with tapered channel shape. Int. J. Hydrog. Energy 2016, 41, 5084–5095. [Google Scholar] [CrossRef]
  8. Shimpalee, S.; Lilavivat, V.; Van Zee, J.W.; McCrabb, H.; Lozano-Morales, A. Understanding the effect of channel tolerances on performance of PEMFCs. Int. J. Hydrog. Energy 2011, 36, 12512–12523. [Google Scholar] [CrossRef]
  9. Hung, J.-C.; Chang, D.-H.; Chuang, Y. The fabrication of high-aspect-ratio micro-flow channels on metallic bipolar plates using die-sinking micro-electrical discharge machining. J. Power Sources 2012, 198, 158–163. [Google Scholar] [CrossRef]
  10. Lee, S.-J.; Chen, Y.-P.; Huang, C.-H. Electroforming of metallic bipolar plates with micro-featured flow field. J. Power Sources 2005, 145, 369–375. [Google Scholar] [CrossRef]
  11. Jang, H.S.; Park, D.S. Microfabrication of microchannels for fuel cell plates. Sensors 2010, 10, 167–175. [Google Scholar] [CrossRef] [Green Version]
  12. Mohammadtabar, N.; Bakhshi-Jooybari, M.; Hosseinipour, S.J.; Gorji, A.H. Feasibility study of a double-step hydroforming process for fabrication of fuel cell bipolar plates with slotted interdigitated serpentine flow field. Int. J. Adv. Manuf. Technol. 2016, 85, 765–777. [Google Scholar] [CrossRef]
  13. Abeyrathna, B.; Zhang, P.; Pereira, M.P.; Wilkosz, D.; Weiss, M. Micro-roll forming of stainless steel bipolar plates for fuel cells. Int. J. Hydrog. Energy 2019, 44, 3861–3875. [Google Scholar] [CrossRef]
  14. Kim, M.-J.; Jin, C.-K.; Kang, C.G. Comparison of formabilities of stainless steel 316L bipolar plates using static and dynamic load stamping. Int. J. Adv. Manuf. Technol. 2014, 75, 651–657. [Google Scholar] [CrossRef]
  15. Turan, C.; Cora, Ö.N.; Koç, M. Effect of manufacturing processes on contact resistance characteristics of metallic bipolar plates in PEM fuel cells. Int. J. Hydrog. Energy 2011, 36, 12370–12380. [Google Scholar] [CrossRef]
  16. Park, W.; Jin, C.; Kang, C. Improving channel depth of stainless steel bipolar plate in fuel cell using process parameters of stamping. Int. J. Adv. Manuf. Technol. 2016, 87, 1677–1684. [Google Scholar] [CrossRef]
  17. Pham, C.-H.; Thuillier, S.; Manach, P.-Y. Mechanical Properties Involved in the Micro-forming of Ultra-thin Stainless Steel Sheets. Metall. Mater. Trans. A 2015, 46, 3502–3515. [Google Scholar] [CrossRef]
  18. Zhang, P.; Pereira, M.; Abeyrathna, B.; Rolfe, B.; Wilkosz, D.; Weiss, M. Improving the shear test to determine shear fracture limits for thin stainless steel sheet by shape optimisation. Int. J. Mech. Sci. 2019, 164, 105116. [Google Scholar] [CrossRef]
  19. Hall, E.O. The Deformation and Ageing of Mild Steel: III Discussion of Results. Proc. Phys. Soc. Sect. B 1951, 64, 747–753. [Google Scholar] [CrossRef]
  20. Petch, N.J. The cleavage strength of polycrystals. J. Iron Steel Inst. 1953, 174, 25–28. [Google Scholar]
  21. Hansen, N. The effect of grain size and strain on the tensile flow stress of aluminium at room temperature. Acta Metall. 1977, 25, 863–869. [Google Scholar] [CrossRef]
  22. Vollertsen, F.; Schulze Niehoff, H.; Hu, Z. State of the art in micro forming. Int. J. Mach. Tools Manuf. 2006, 46, 1172–1179. [Google Scholar] [CrossRef]
  23. Gau, J.-T.; Principe, C.; Wang, J. An experimental study on size effects on flow stress and formability of aluminm and brass for microforming. J. Mater. Process. Technol. 2007, 184, 42–46. [Google Scholar] [CrossRef]
  24. Geiger, M.; Kleiner, M.; Eckstein, R.; Tiesler, N.; Engel, U. Microforming. Cirp Ann. 2001, 50, 445–462. [Google Scholar] [CrossRef]
  25. Yang, L.; Lu, L. The influence of sample thickness on the tensile properties of pure Cu with different grain sizes. Scr. Mater. 2013, 69, 242–245. [Google Scholar] [CrossRef]
  26. Cheng, C.; Wan, M.; Meng, B.; Fu, M.W. Characterization of the microscale forming limit for metal foils considering free surface roughening and failure mechanism transformation. J. Mater. Process. Technol. 2019, 272, 111–124. [Google Scholar] [CrossRef]
  27. Fu, M.W.; Chan, W.L. Geometry and grain size effects on the fracture behavior of sheet metal in micro-scale plastic deformation. Mater. Des. 2011, 32, 4738–4746. [Google Scholar] [CrossRef]
  28. Henning, M.; Vehoff, H. Statistical size effects based on grain size and texture in thin sheets. Mater. Sci. Eng. A 2007, 452–453, 602–613. [Google Scholar] [CrossRef]
  29. Fülöp, T.; Brekelmans, W.A.M.; Geers, M.G.D. Size effects from grain statistics in ultra-thin metal sheets. J. Mater. Process. Technol. 2006, 174, 233–238. [Google Scholar] [CrossRef]
  30. Peng, L.F.; Xu, Z.T.; Fu, M.W.; Lai, X.M. Forming limit of sheet metals in meso-scale plastic forming by using different failure criteria. Int. J. Mech. Sci. 2017, 120, 190–203. [Google Scholar] [CrossRef]
  31. Xu, Z.T.; Peng, L.F.; Fu, M.W.; Lai, X.M. Size effect affected formability of sheet metals in micro/meso scale plastic deformation: Experiment and modeling. Int. J. Plast. 2015, 68, 34–54. [Google Scholar] [CrossRef]
  32. Chen, C.H.; Lee, R.S.; Gau, J.T. Size effect and forming-limit strain prediction for microscale sheet metal forming of stainless steel 304. J. Strain Anal. Eng. 2010, 45, 283–299. [Google Scholar] [CrossRef]
  33. Karacan, K.; Celik, S.; Toros, S.; Alkan, M.; Aydin, U. Investigation of formability of metallic bipolar plates via stamping for light-weight PEM fuel cells. Int. J. Hydrog. Energy 2020. [Google Scholar] [CrossRef]
  34. Kolahdooz, R.; Asghari, S.; Rashid-Nadimi, S.; Amirfazli, A. Integration of finite element analysis and design of experiment for the investigation of critical factors in rubber pad forming of metallic bipolar plates for PEM fuel cells. Int. J. Hydrog. Energy 2017, 42, 575–589. [Google Scholar] [CrossRef]
  35. Talebi-Ghadikolaee, H.; Elyasi, M.; Mirnia, M.J. Investigation of failure during rubber pad forming of metallic bipolar plates. Thin-Walled Struct. 2020, 150, 106671. [Google Scholar] [CrossRef]
  36. Li, D.G.; Wang, J.D.; Chen, D.R.; Liang, P. Molybdenum addition enhancing the corrosion behaviors of 316 L stainless steel in the simulated cathodic environment of proton exchange membrane fuel cell. Int. J. Hydrog. Energy 2015, 40, 5947–5957. [Google Scholar] [CrossRef]
  37. Tawfik, H.; Hung, Y.; Mahajan, D. Metal bipolar plates for PEM fuel cell—A review. J. Power Sources 2007, 163, 755–767. [Google Scholar] [CrossRef]
  38. Rajasekar, S.; Chetty, R.; Neelakantan, L. Low-nickel austenitic stainless steel as an alternative to 316L bipolar plate for proton exchange membrane fuel cells. Int. J. Hydrog. Energy 2015, 40, 12413–12423. [Google Scholar] [CrossRef]
  39. McGuire, M.F. Thermal Processing. In Stainless Steels for Design Engineers; Asm International: Materials Park, OH, USA, 2008; pp. 161–171. [Google Scholar]
  40. ASTM E112-13. Standard Test Methods for Determining Average Grain Size; ASTM International: West Conshohocken, PA, USA, 2013. [Google Scholar]
  41. ASTM E8/E8M-16ae1. Standard Test Methods for Tension Testing of Metallic Materials; ASTM International: West Conshohocken, PA, USA, 2016. [Google Scholar]
  42. Zhang, P.; Pereira, M.P.; Abeyrathna, B.; Rolfe, B.F.; Wilkosz, D.E.; Hodgson, P.; Weiss, M. Plastic instability and fracture of ultra-thin stainless-steel sheet. Int. J. Solids Struct. 2020, 202, 699–716. [Google Scholar] [CrossRef]
  43. Hotz, W.; Merklein, M.; Kuppert, A.; Friebe, H.; Klein, M. Time Dependent FLC Determination Comparison of Different Algorithms to Detect the Onset of Unstable Necking before Fracture. Key Eng. Mater. 2013, 549, 397–404. [Google Scholar] [CrossRef]
  44. Affronti, E.; Merklein, M. Analysis of the bending effects and the biaxial pre-straining in sheet metal stretch forming processes for the determination of the forming limits. Int. J. Mech. Sci. 2018, 138–139, 295–309. [Google Scholar] [CrossRef]
  45. Stoughton, T.B.; Carsley, J.E.; Min, J.; Lin, J. Advances in characterization of sheet metal forming limits. In Proceedings of the NUMISHEET 2016: 10th International Conference and Workshop on Numerical Simulation of 3D Sheet Metal Forming Processes, Bristol, UK, 4–9 September 2016; p. 032073. [Google Scholar]
  46. Azrin, M.; Backofen, W.A. The deformation and failure of a biaxially stretched sheet. Metall. Trans. 1970, 1, 2857–2865. [Google Scholar] [CrossRef]
  47. Graf, A.; Hosford, W.F. Calculations of forming limit diagrams. Metall. Trans. A 1990, 21, 87–94. [Google Scholar] [CrossRef]
  48. Xu, J.; Guo, B.; Shan, D.; Li, M.; Wang, Z. Specimen Dimension and Grain Size Effects on Deformation Behavior in Micro Tensile of SUS304 Stainless Steel Foil. Mater. Trans. 2013, 54, 984–989. [Google Scholar] [CrossRef] [Green Version]
  49. Gau, J.-T.; Chen, P.-H.; Gu, H.; Lee, R.-S. The coupling influence of size effects and strain rates on the formability of austenitic stainless steel 304 foil. J. Mater. Process. Technol. 2013, 213, 376–382. [Google Scholar] [CrossRef]
  50. Xu, Z.T.; Peng, L.F.; Lai, X.M.; Fu, M.W. Geometry and grain size effects on the forming limit of sheet metals in micro-scaled plastic deformation. Mater. Sci. Eng. A 2014, 611, 345–353. [Google Scholar] [CrossRef]
  51. Zhang, C.; Ma, J.; Liang, X.; Luo, F.; Cheng, R.; Gong, F. Fabrication of metallic bipolar plate for proton exchange membrane fuel cells by using polymer powder medium based flexible forming. J. Mater. Process. Technol. 2018, 262, 32–40. [Google Scholar] [CrossRef]
Figure 1. Sample position in the mount for the microstructure analysis. Arrows indicate rolling direction.
Metals 11 00038 g001
Figure 2. ASTM E8 tensile specimen geometry, material thickness 0.1 mm [41].
Metals 11 00038 g002
Figure 3. Sample geometries used to determine the FLDs (Reproduced with permission from [42]; Copyright Elsevier, 2020).
Metals 11 00038 g003
Figure 4. Schematic of the Erichsen cupping test (dimensions given in mm) (Reproduced with permission from [42]; Copyright Elsevier, 2020).
Metals 11 00038 g004
Figure 5. (a) Micro-stamping tool assembly (b) Dimensioned sample blank shape with position of the drawbead and the die/punch insert indicated.
Metals 11 00038 g005
Figure 6. (a) Sample blank shape with micro-stamping patterns indicated. (b) Micro channel cross section parameters. (c) White light method used to determine material failure with a failed (left) and safe (right) example shown.
Metals 11 00038 g006
Figure 7. SEM microstructure images taken over the material thickness in the RD (Section 1 in Figure 1), with the averaged grain sizes measured for each particular alloy shown in brackets.
Metals 11 00038 g007
Figure 8. SEM microstructure images taken over the material thickness in the TD and normal direction (Sections 1 and 3 in Figure 1).
Metals 11 00038 g008
Figure 9. Engineering stress strain curves for tensile samples tested in RD for (a) Commercial stainless steel alloys; (b) Heat treated 316L1 alloys.
Metals 11 00038 g009
Figure 10. Tensile parameters determined with samples oriented in RD and TD with the averaged grain size measured for each particular alloy shown. (a) Yield Strength (YP0.2); (b) Ultimate Tensile Strength (UTS); (c) Uniform Elongation (UE).
Metals 11 00038 g010
Figure 11. Forming Limit Diagrams (FLDs) of (a) commercial alloys and (b) 316L1 in the as received and the two heat treated conditions.
Metals 11 00038 g011
Figure 12. Distribution of von Mises strain determined over two section cuts in the biaxial stretch forming samples. (a) Strain contour on the biaxial sample for the as received 316L1 condition with the two section cuts shown. (b) Comparison of the strain distribution for 316L1 and 316L1_H2. (c) Comparison of the strain distribution for 316L1 and 316L1H1. (d) Comparison of strain distribution for commercial alloys 316L3 and 316L2.
Metals 11 00038 g012aMetals 11 00038 g012b
Figure 13. 3D surface scan performed on micro-stamping condition 4.28 with an Alicona surface profilometer (left image), the right two images were obtained from an optical microscope.
Metals 11 00038 g013
Figure 14. 2D profile shape determined for micro-stamping condition 4.28 with an Alicona surface profilometer (a) Male and female stamping die (b) Formed micro channel shape (bottom sheet surface).
Metals 11 00038 g014
Table 1. Chemical composition (in weight %) determined by glow discharge optical emission spectrometry.
Element301304L316L1316L2316L3
C0.110.060.040.040.05
Cr19.1518.817.3817.718.21
Ni6.787.719.5610.159.43
Mn0.811.571.471.091.26
Si0.560.320.560.590.38
Mo0.280.392.111.982.09
Co0.110.120.150.110.2
Table 2. Averaged grain size and thickness to grain size ratio, N, for the commercial and heat treated alloys.
AlloysGrain Size (µm) N = t / d
30111.28.9
304L11.28.9
316L111.28.9
316L215.96.3
316L322.54.4
316L1H126.73.7
316L1H231.83.1
Table 3. Micro-stamping results with the successfully formed (light grey), partially formed (white) and failed (dark grey) shapes indicated. RD* and TD* are for samples positioned with the rolling direction and the transverse direction perpendicular to the micro channel length direction, respectively. Metals 11 00038 i001 100% Formed, Metals 11 00038 i002 0% Formed, Metals 11 00038 i003 Partial % Formed.
DimensionUnitPattern number
4.104.124.154.114.194.214.164.244.184.2
Hmm0.3500.4000.4500.4000.5000.3500.4750.4000.5000.500
Smm0.9950.9900.8910.8981.1970.7791.0910.8061.0740.826
AR 0.3520.4040.5050.4450.4180.4490.4350.4960.4660.605
R1mm0.2800.2700.3000.2400.3200.2100.2900.2100.2800.240
R2mm0.1800.1700.2000.1400.220.1100.1900.1100.1800.140
MaterialOrientationForming results
316L1RD*
316L2RD* 6080 20
316L3RD*
316L1H2RD*
316L2TD*
316L3TD* 20
DimensionUnitPattern number
4.134.224.234.254.264.274.28Z 4.9Z4.17Z4.14
Hmm0.4250.4500.4750.4500.4750.4750.5000.3500.4750.450
Smm0.7550.7840.8280.7380.7510.7970.8900.7610.9350.845
AR 0.5630.5740.5740.6100.6320.5960.5620.4600.5080.533
R1mm0.2200.2300.2500.2000.2000.2300.2200.2500.3200.270
R2mm0.1200.1300.1500.1000.1000.1300.1200.1500.2200.170
MaterialOrientationForming results
316L1RD*
316L2RD* 40
316L3RD*
316L1H2RD*
316L2TD*
316L3TD* 2020
Publisher’s Note: MDPI stays neutral with regard to jurisdictional claims in published maps and institutional affiliations.

