Abstract
Crushing performance is being widely investigated because it is the key performance indicator of the thin-walled beam structure in automobile safety components. In this study, five kinds of ageing state with different yield strengths were prefabricated with a self-developed KHC63 alloy. Using a rectangular tube profile, the physical relationship between crushing properties and mechanical properties, and the structure of the profile, were studied. According to variation characteristics, the crushing curve was divided into four typical stages: elastic stage, bending stage, compaction stage and folding stage. In the elastic stage, the peak load of the component is related to material elasticity and structure elasticity, and the relationship is approximately linear. In the bending stage, the driving factor of plastic hinge deformation is the bending moment, and it is always constant. In the compaction stage, the crushing curve correlates well with the cosine function. In the folding stage, the crushing process begins to lose stability and is hard to predict. The mathematical relationships between force and displacement were established according to the characteristics of each stage, and the calculated results were close to the measured results except for the folding stage. The deviation of the calculated energy absorption from the measured data in the first three stages is only 4.3%, but it is 10.6% in the folding stage. The calculation method used for the first three stages is, therefore, suitable.
1. Introduction
Thin-walled beams are often used as safety components in automobiles because of their superior energy absorption performance during axial deformation, such as in energy absorption boxes, and front and rear longitudinal beams. Due to the fact that the specific energy absorption ratios of aluminum alloys are higher than those of steel, aluminum alloys are gradually replacing steel in the development of lightweight automobiles, and are widely used in automobile safety structures.
In axial crush deformation, peak force (Fp) and collapse absorption energy (U) are often used to evaluate the crashworthiness of aluminum alloy thin-walled beams. Peak force is the maximum force value of a thin-walled beam. This should be less than the bearing limit of other structures during crushing, otherwise it cannot absorb energy. Energy absorption is the energy absorbed by the deformation of a thin-walled structure. The greater the energy absorption, the smaller the impact on other structures. In recent years, the energy absorption mechanisms of thin-walled beams have been studied by means of finite element simulation [1,2], the parametric modeling method of variable rolled blank–variable cross-sectional shape front longitudinal beam(VRB-VCS FLB) [3,4,5] and other experimental means [6,7,8], in order to improve the impact resistance of thin-walled beams.
Research on improving energy absorption generally falls into two categories: structural improvement and material property adjustment. In relation to the structure, changing the wall thickness, size and number of cells, setting the induced holes, etc. are all studied to increase energy absorption. Yamazaki [9] used the finite element simulation analysis method to study the crashworthiness of a rectangular tube, and proved that increasing wall thickness or reducing width improve the energy absorption performance. Cheng et al. [10] studied how the total energy absorbed by the 6061-T6 aluminum alloy square tubes could be increased to be within a range of 26.6–74.6% by introducing optimization through hole discontinuities. Sun et al. [11] found that the increasing number of corners on the cross-section of multicorner tubes improved the energy absorption performance of 6060 aluminum alloy thin-walled square tubes. In Fang et al. [12] a group of multi-cell tubes with different cell numbers were comprehensively investigated under axial impact loads. The finite element models were established. The simulation results showed that the increase in cell number can be beneficial to the energy absorption but detrimental due to increase in peak force under axial load. M. Kathiresan [13,14] studied the influence of the shape, size and quantity of the induced holes on the peak force, average load and energy absorption performance by experiment and finite element simulation. The introduction of suitable induction holes causes a thin-walled beam to deform uniformly, reducing the peak load and increasing the average load, thus improving the energy absorption performance. Wu et al. [15] noted that the crashworthiness, peak force and energy absorption performance of thin-walled beams all increased with the increase of the number of cells. In materials, changing the aging treatment to adjust the mechanical properties is the main method used to improve energy absorption. Arnold [16] studied the effect of both induced hole diameter and T4 and T6 aging treatments of 6061 aluminum alloy on crushing performance, by means of experiment and simulation. The results show that the energy absorption depends primarily on the mechanical properties. The introduction of induced holes can improve the energy absorption and nominal load level, but the relative influence is small. Nguyen-Hieu Hoang et al. [17] studied the influence of the cooling mode following a solid solution on the crushing performance of 6060 aluminum alloy thin-walled beam. The results show that peak aging after water cooling resulted in a high precipitation phase density of the alloy and improved the mechanical properties of the material, and the thin-walled beam could absorb more energy during the deformation process. These studies provide important insights into the structural improvement and material design of thin-walled beams.
In recent years, some studies have also aimed to calculate the crushing process. Wierzbicki [18] studied the folding patterns of rectangular tube and square tube when the cross-sections were deformed symmetrically, and established the average load model consistent with experimental results. Magee and Thornton [19] put forward empirical models for calculating the nominal load of deformation of thin-walled beam structures, which can help guide the design of beam structures. Granum et al. [20] investigated the axial crushing performances of rectangular hollow section profiles made fromAA6063, AA6061, and AA6110 aluminum alloy in T6, T7, and O tempers. A nanostructure-based finite element simulation model was developed and showed that excellent agreement is found between the numerical simulations and the experimental tests.
Our study is also aimed at the calculation of the crushing process, but the research objectives and methods are different from the above studies. In this study, we try to establish the physical model of the crushing force and displacement under the same structure based on the anatomy of the whole process sample, and the mathematical correspondence between the crushing performance and the mechanical properties. Finally, we aim to predict the peak force, crushing curve and crushing energy.
The energy absorption performance of aluminum alloy thin-walled beam can be improved by increasing the material strength appropriately. The traditional commercial 6000 series alloy will sacrifice the plasticity of the alloy while improving the strength, and the thin-walled beam will crack seriously during the deformation process, leading to the decrease of energy absorption level. Therefore, we developed a new KHC63 alloy to improve the crushing performance.
2. Materials and Methods
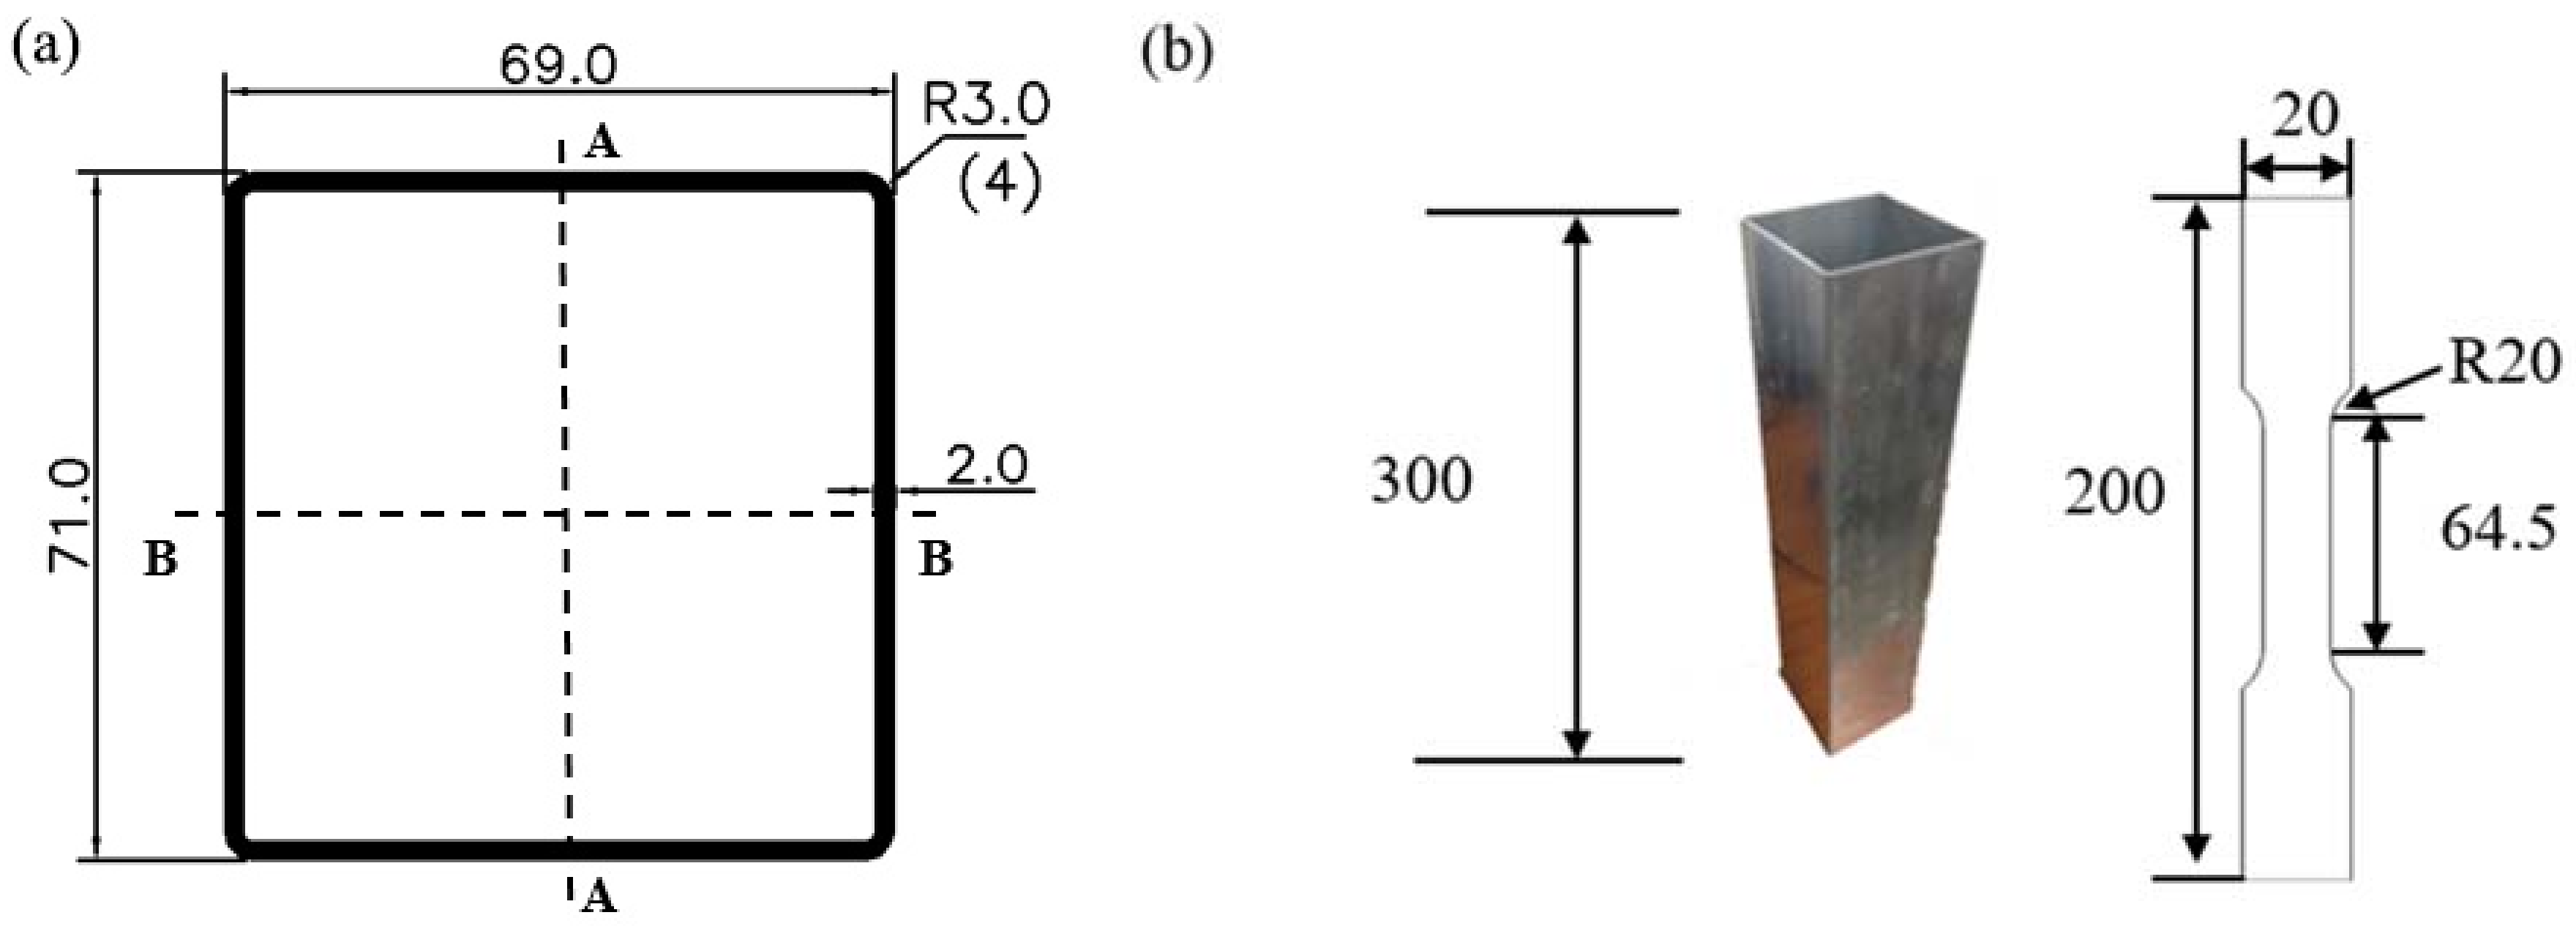
The alloy used in this study is a self-developed KHC63 aluminum alloy, and its composition is shown in Table 1. The profile used in the experiment was processed by a 2500UST extrusion press (Mei Ruey Industrial Co., LTD, Tainan City, Taiwan). The extrusion speed is 11 m/min, the extrusion ratio is 48:1, and the extrusion temperature is controlled at 520–540 °C during the extrusion process. The extruded profiles were water quenched on line. The thin-walled components are extruded profiles, and their cross-section is a rounded rectangle, which is shown in Figure 1. The section area is 537.1 mm2. Six KHC63 samples (S1–S6) with different strengths were prepared using different aging processes. S1–S5 are modeling samples, and S6 is a verification sample. The heat treatment process of the samples is shown in Table 2. The tensile performances of the samples at room temperature are shown in Figure 2. Each S1–S6 sample was used to prepare three axial crushing test specimens each with a length of 300 mm. The dimensions of the cross-section of each sample are shown in Figure 1. Two sections denoted A-A and B-B on the cross-section diagram are important for subsequent analysis.

Table 1.
Chemical composition of KHC63 alloy.

Figure 1.
(a) Profile cross-section geometry diagram of the extrusions and (b) geometry of extruded workpiece and tensile specimens. All measures are in mm.
Table 2.
Aging process of six samples.
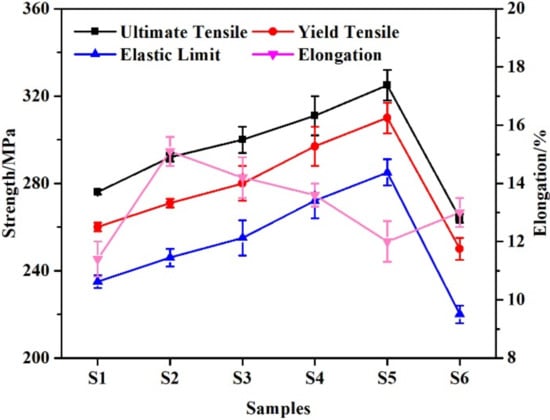
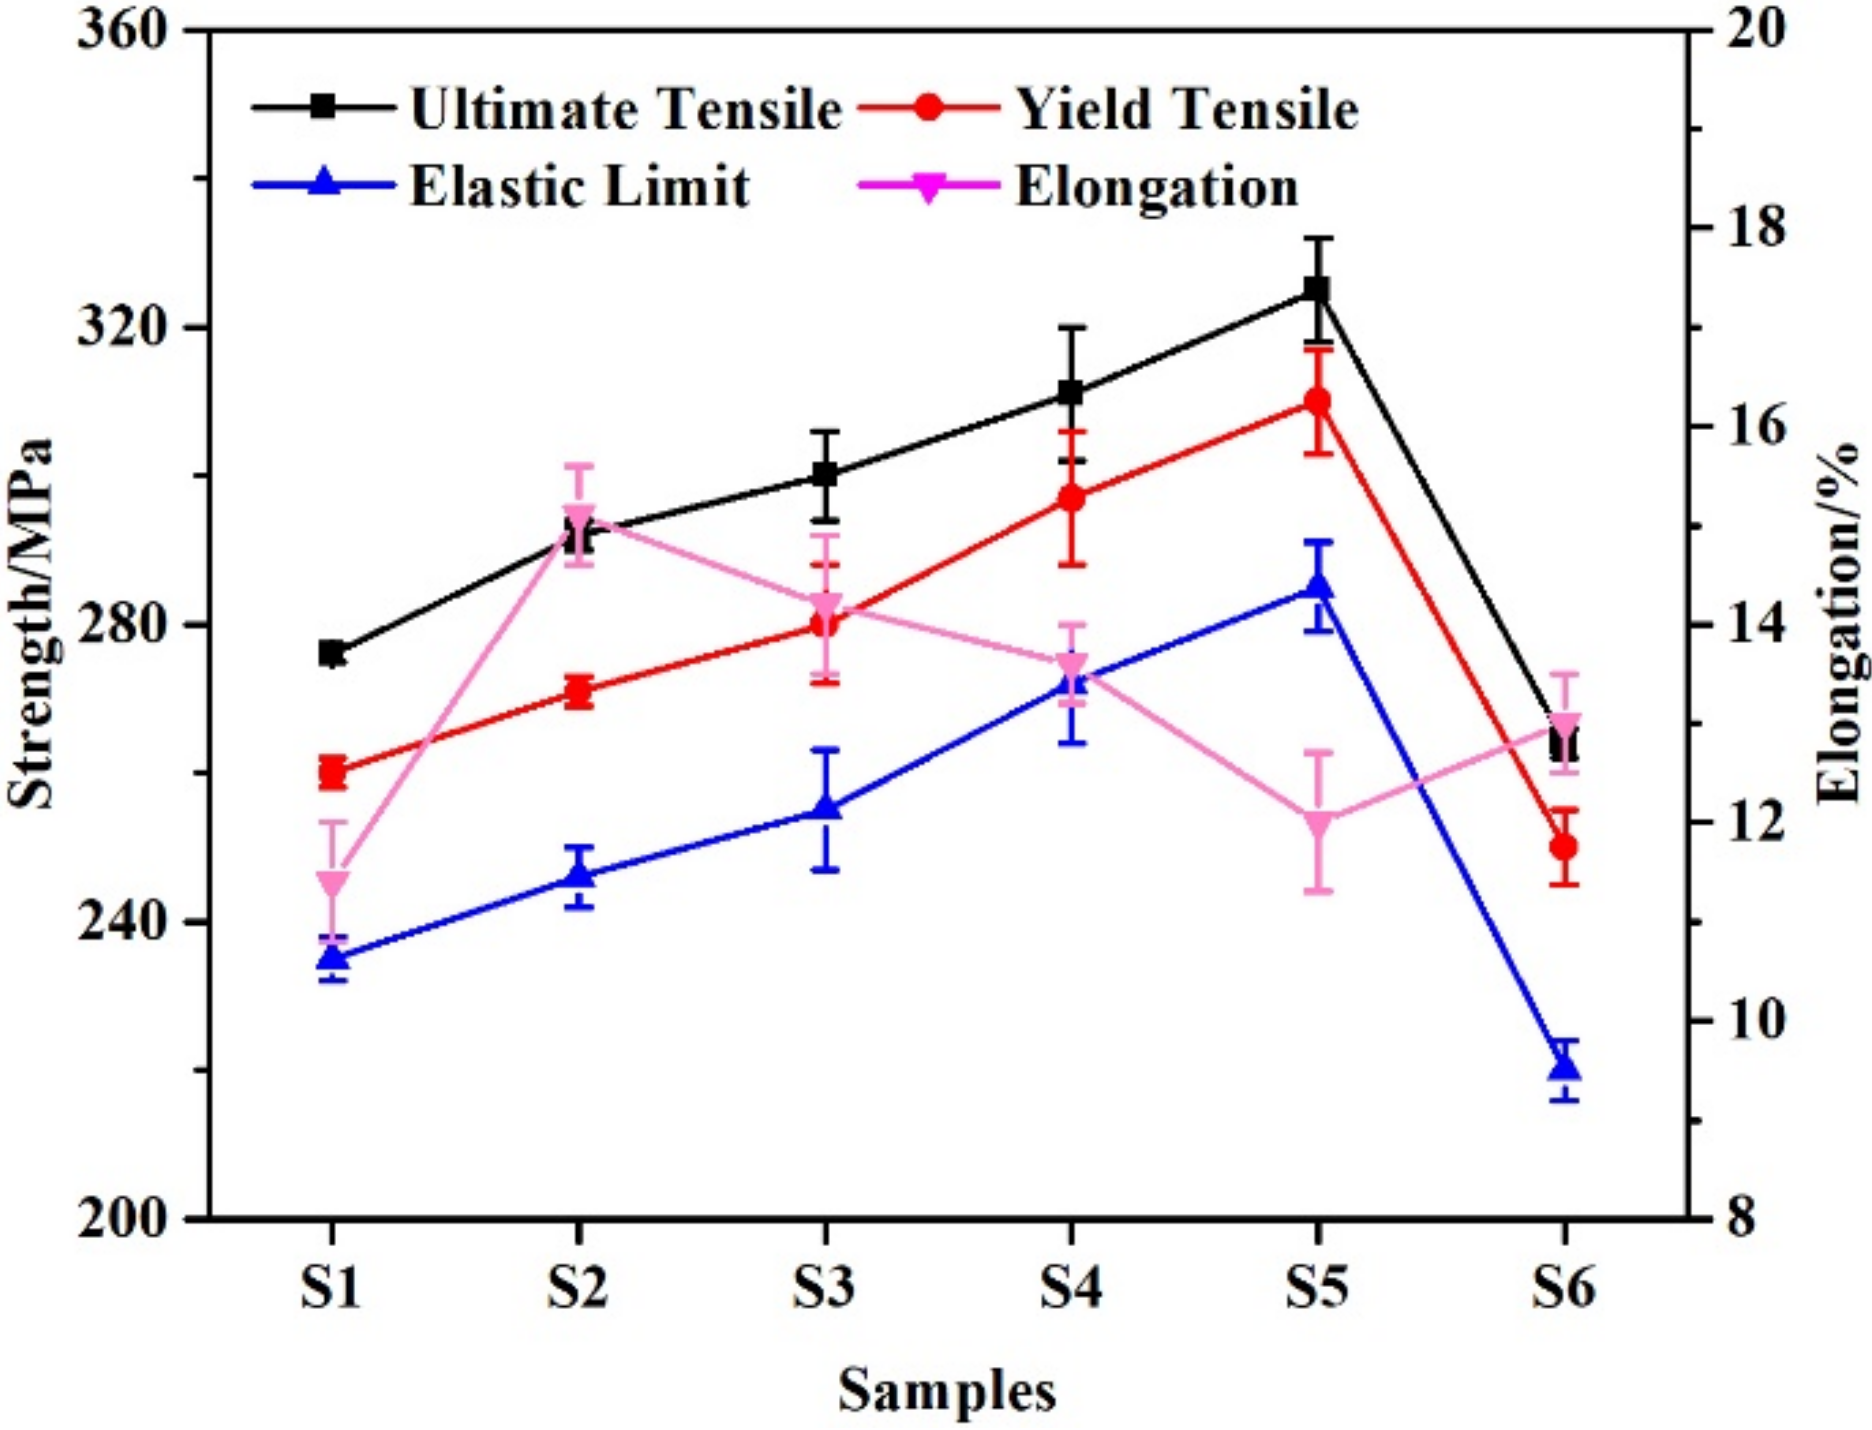
Figure 2.
Room temperature tensile properties of six samples.
Tensile tests were carried out on a WDW-300S microcomputer-controlled electronic universal testing machine (Shanghai Instron Co., LTD, Shanghai, China) at a tensile speed of 5 mm/min according to GB/T 228.1-2010. The tensile specimens were taken from the artificial aged profiles along the extrusion direction, and the geometry of the specimens is given in Figure 1b. The tensile specimen was intercepted in the extrusion direction. Axial crushing tests were carried out on a WAW-1000FC (Shandong Aubert Test Equipment Co. LTD, Jinan, Shangdong, China) hydraulic testing machine at a constant speed of 20 mm/min, and the data acquisition interval was 0.11 s. The total displacement was 200 mm.
3. Results and Discussion
3.1. Typical Crushing Process
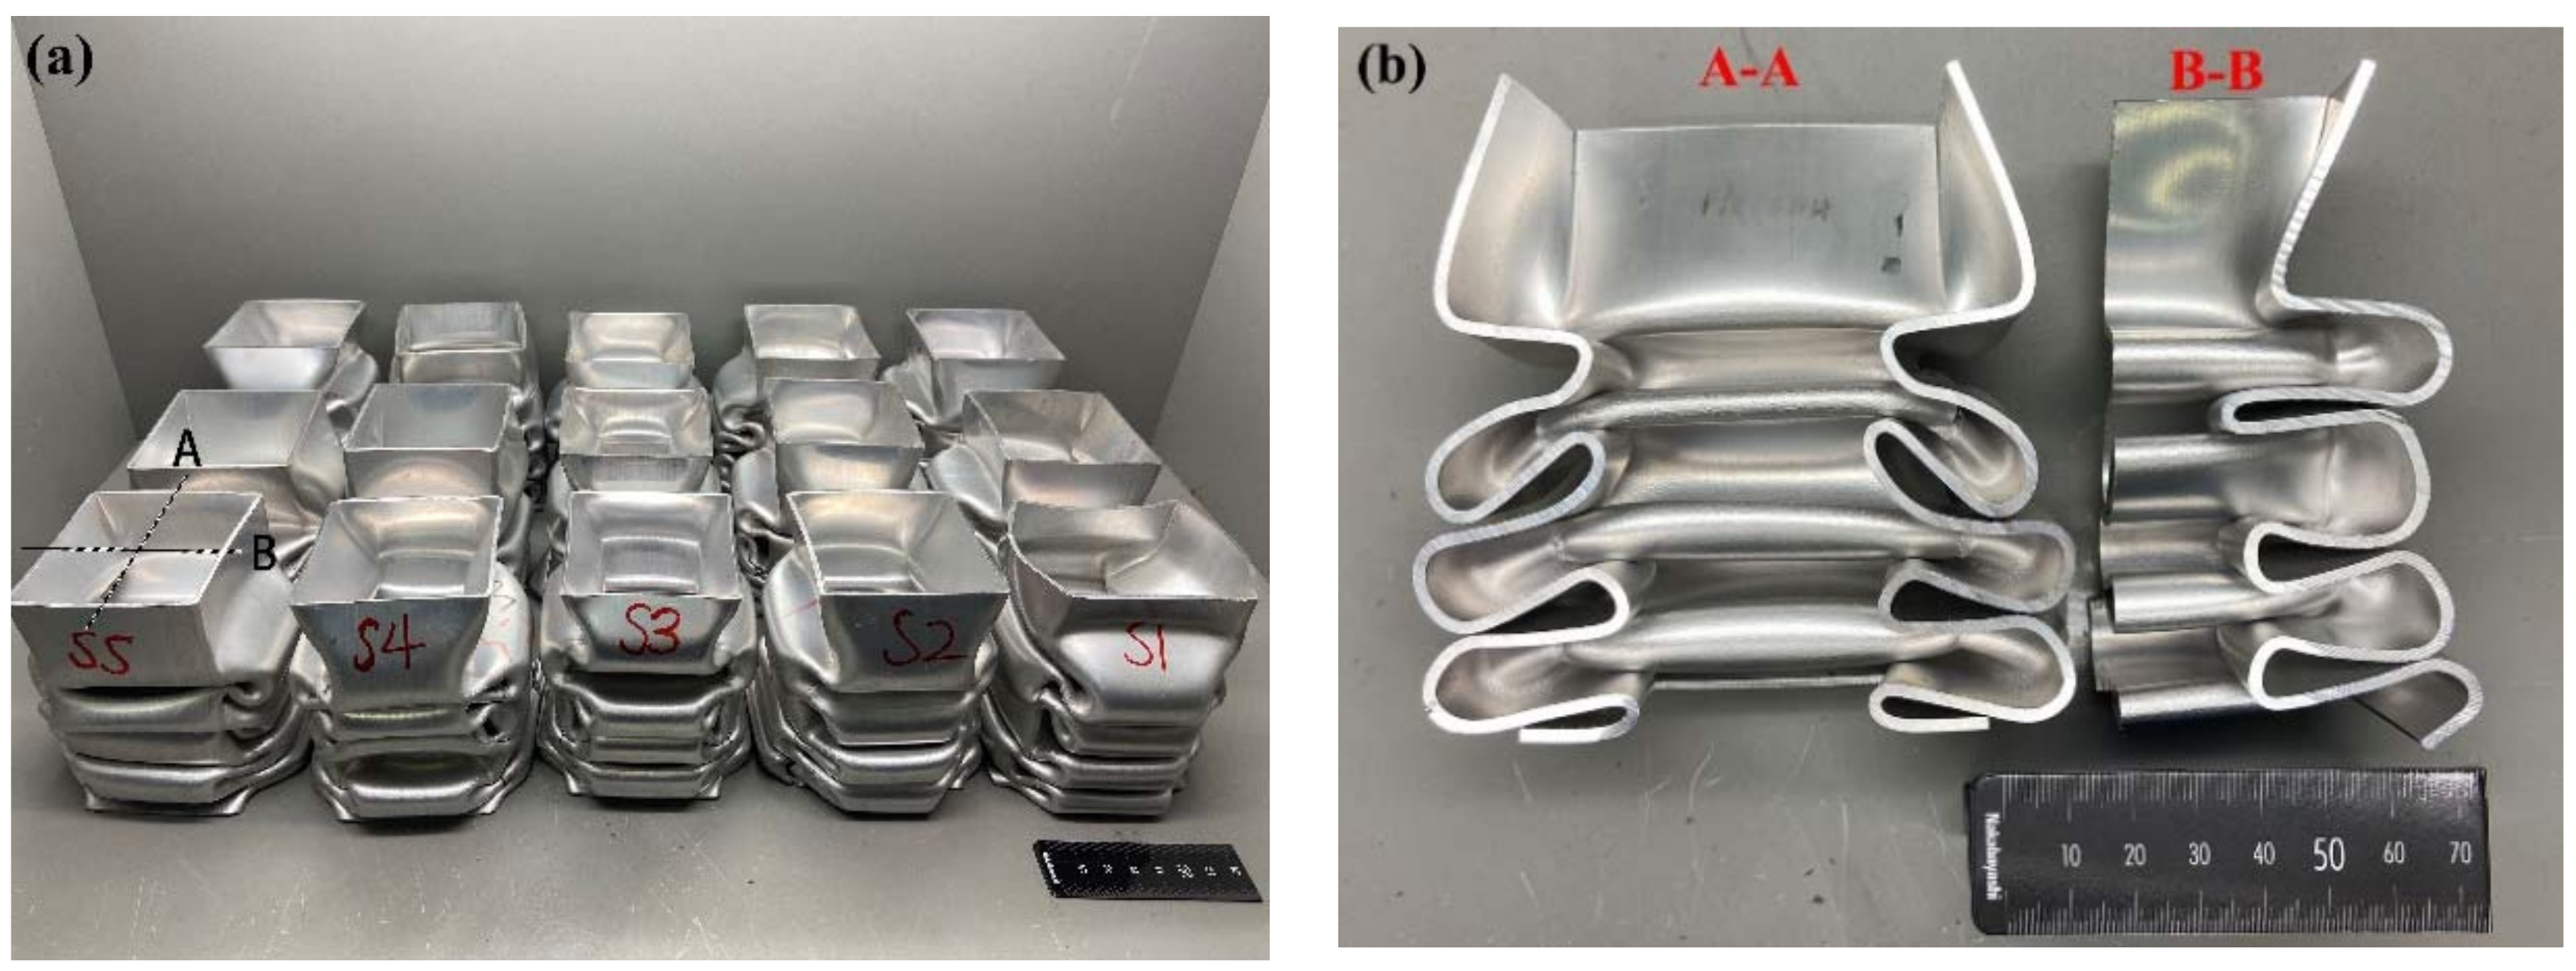
Figure 3 shows crushing photographs for five samples and the A-A and B-B sections of S1. Although the yield strengths of the five samples were different, they were all well-formed. There is no obvious cracking in S1 and S2, but there are small cracks in S3–S5. The deformation patterns of all 15 specimens were similar during the compression from 300 mm to 200 mm. Figure 3b shows the A-A and B-B sections of an S1 sample. The deformation morphology of the two sections is similar, but the formation directions of the plastic hinge are opposite. The crushing deformation mode is a symmetrical deformation mode [21,22].
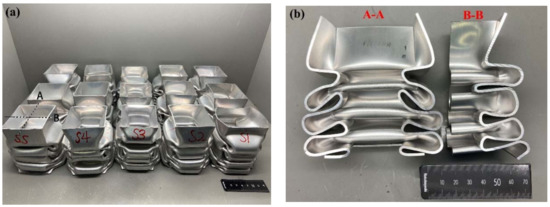
Figure 3.
Photographs of (a) samples after crushing test, (b) section diagram of S1.
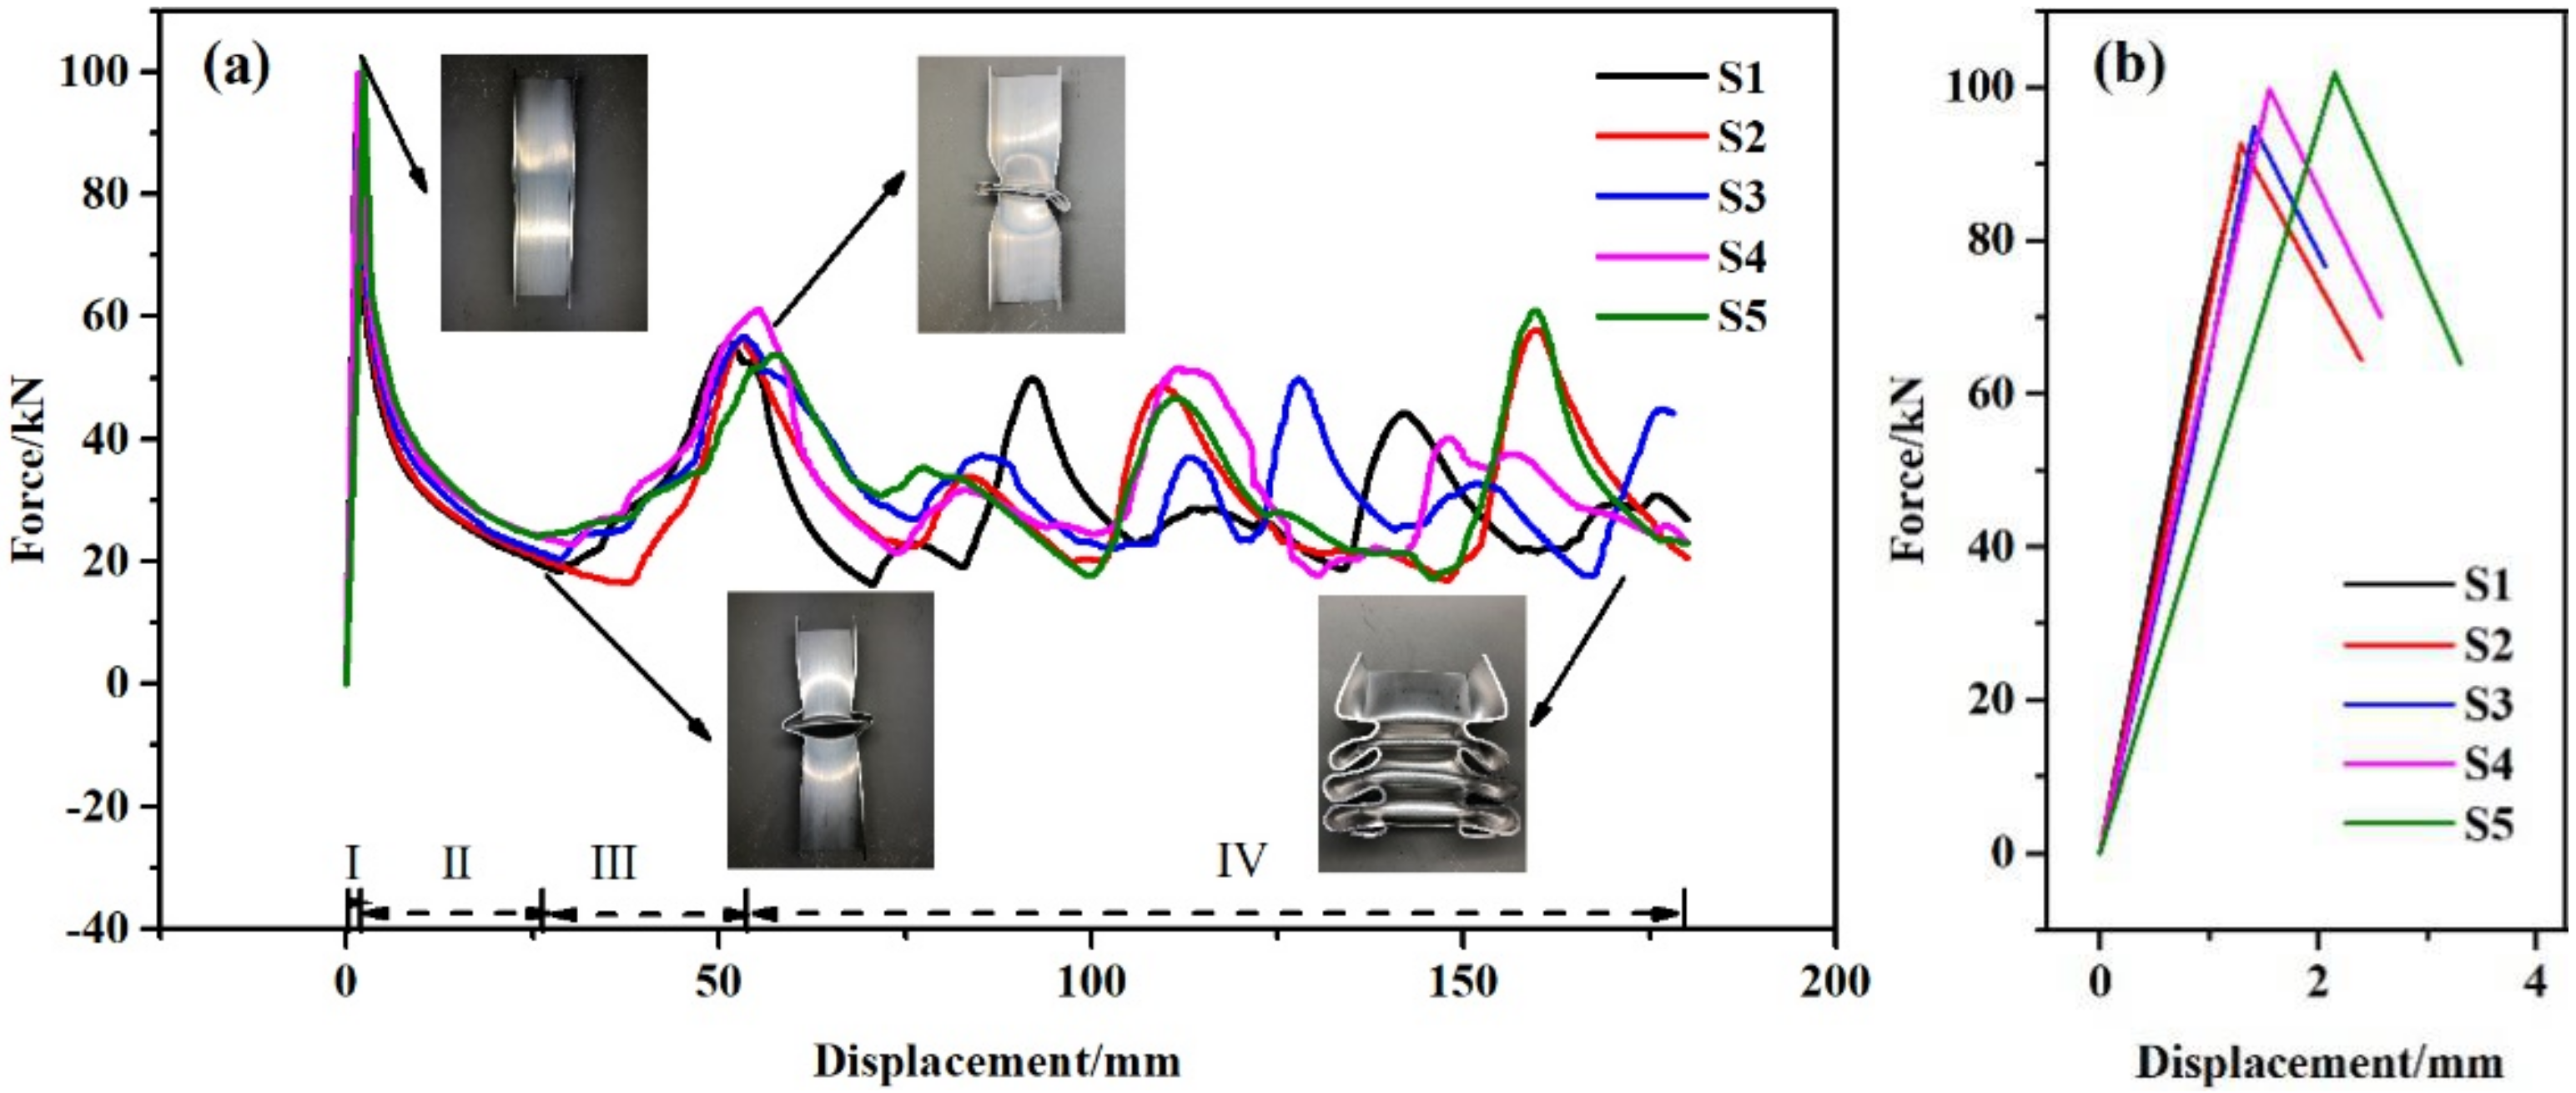
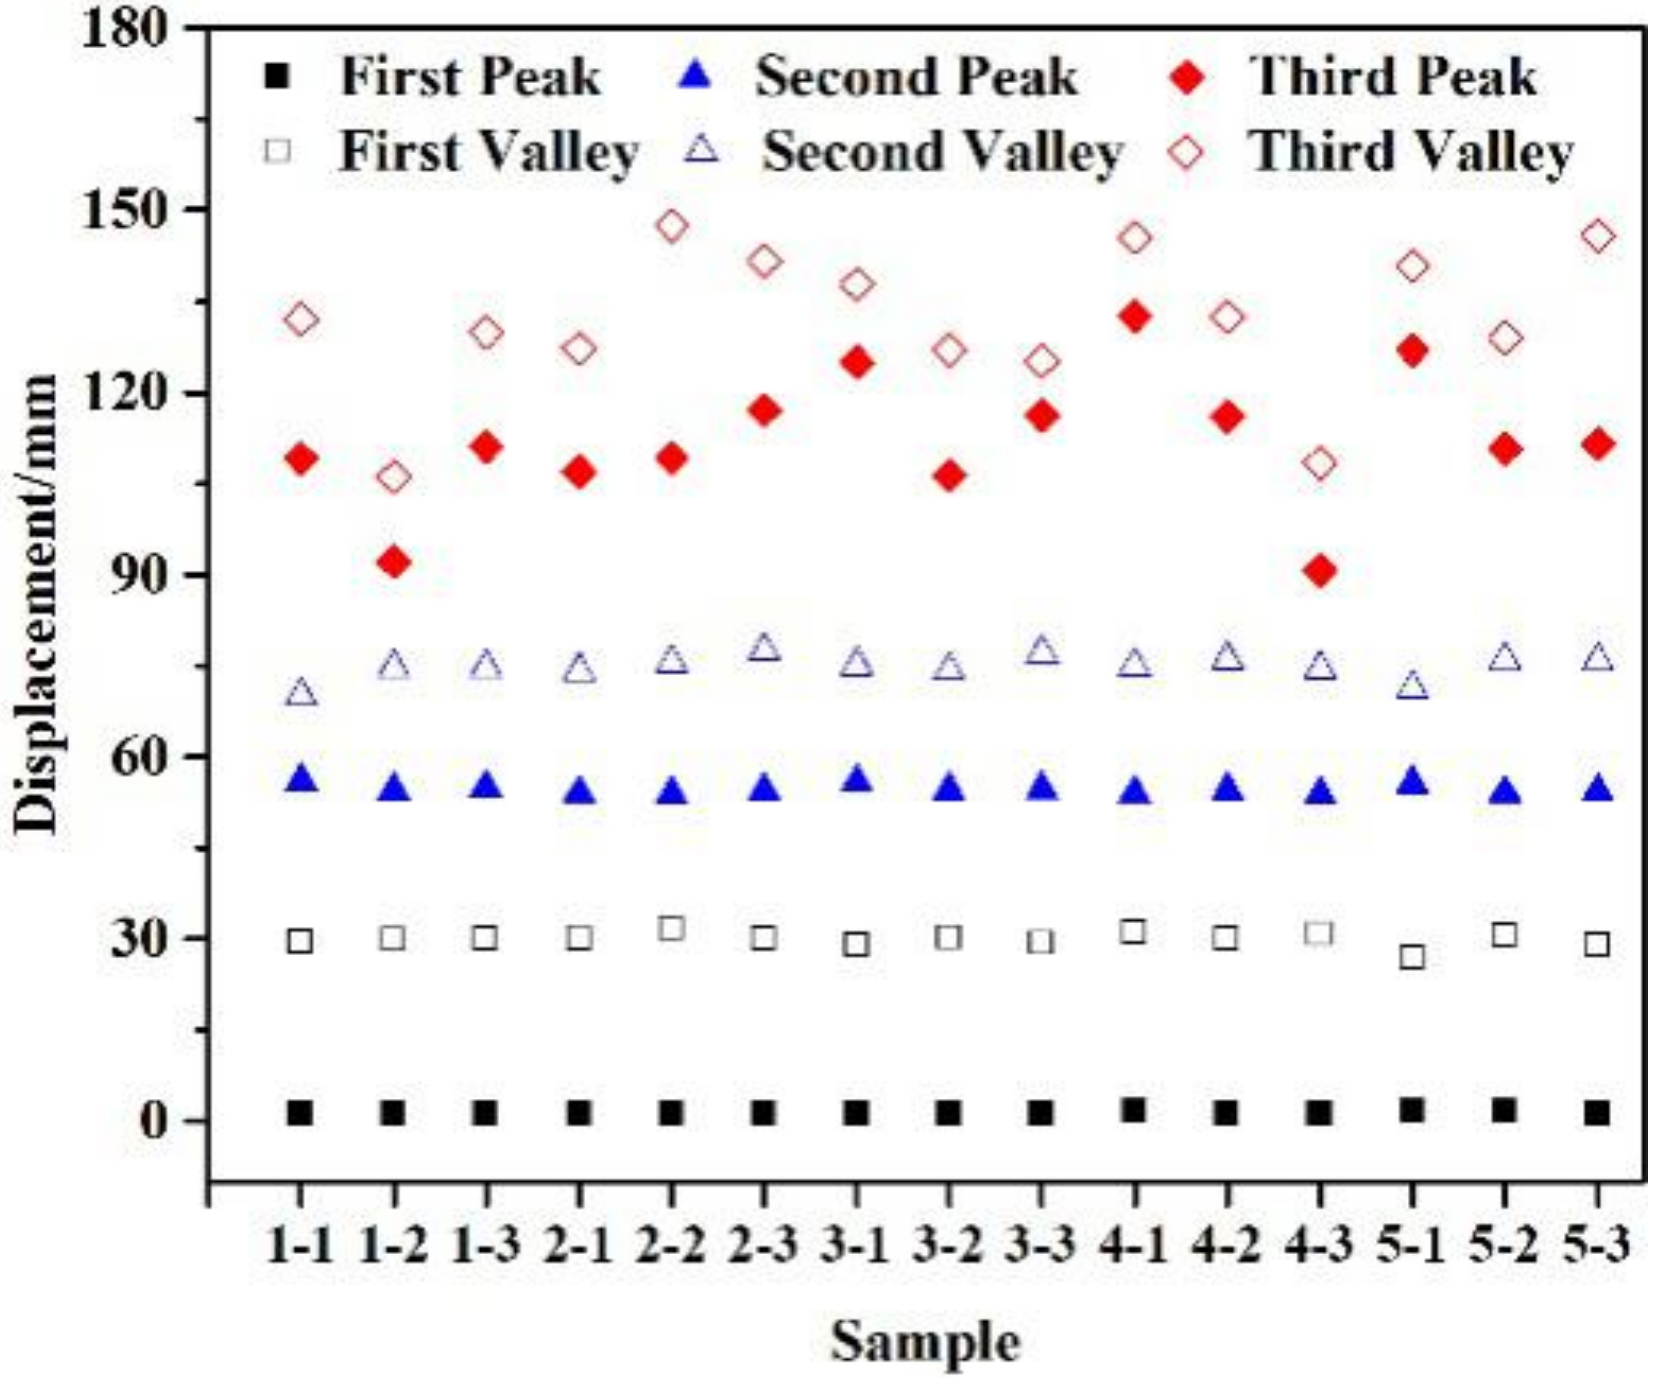
Figure 4a shows typical displacement-force curves during the specimen crushing process of the five samples (crushing curve for short). Figure 4b shows peak force of five samples. Although the crushing curves of the samples vary with the yield strength, each curve has similar properties. The extreme points on the crushing curves of all samples are counted in Figure 5. Combining Figure 5 with the crushing curves in Figure 4 and the cross-section morphology of the samples, the crushing process can be divided into four typical stages with extrema as the characteristic points.

Figure 4.
(a) Crushing curves of five samples: (I) elastic stage, (II) bending stage, (III) compaction stage, (IV) folding stage, (b) peak force of five samples.
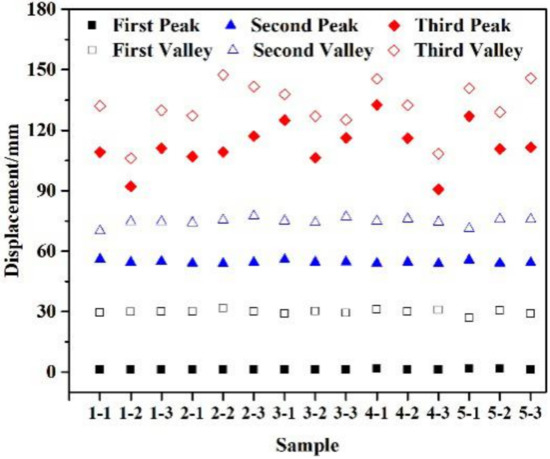
Figure 5.
Displacement of the extreme points of the crushing curve.
- (I)
- Elastic stage: the elastic stage is the initial stage of the crushing test. When the crushing test begins, the crushing force rises in a straight line until the peak load is reached. As indicated by the section morphology, the elastic deformation of the specimen mainly occurs in this stage. In the final stage, slight plastic deformation occurs and the specimen begins to form a plastic hinge [23,24]. Since the elasticity of the sample is related to the elasticity of the material and its structure, the length of the elastic stage varies with the elastic limit of the alloy. In this study, the length of the elastic section was about 1.23–1.65 mm.
- (II)
- Bending stage: after the plastic deformation begins, the plastic hinge is formed and starts to bend. Because of the existence of the plastic hinge, the compression force of axial deformation changes to axial crushing torque. Due to the effect of the lever, the length of the moment arm gradually increases during the pressing process, and the crushing force begins to decrease significantly. Until the outward protruding plastic hinge (A-A section) and the inward depressed plastic hinge (B-B) begin to make contact with each other, the bending is blocked. The crushing torque cannot make the plastic hinge continue to deform, and the crushing force reaches the first valley value. From Figure 5, we can see that there is no significant relationship between the first valley value and yield strength. All valleys are around 30 mm.
- (III)
- Compaction stage: this is the process in which two adjacent plastic hinges transition from contact to compaction. In the compaction stage, the crushing force begins to rise again. When both plastic hinges are completely compacted, the crushing force reaches the second peak. At this time, due to the constraint of the structure, the second plastic hinge has been formed, and the crushing torque starts to work again. However, the second peak force is much smaller. The second peak displacement is about 54 mm, and it is also stable.
- (IV)
- Folding stage: from the second peak, the crushing curve repeats the bending and compaction process. However, due to the inhomogeneity of the material, the deformation is not completely uniform. After the accumulation of several plastic hinges with uneven deformation, the crushing process begins to lose stability. Figure 5 shows that after the second peak, the peak and valley displacement are no longer fixed, and there are random fluctuations.
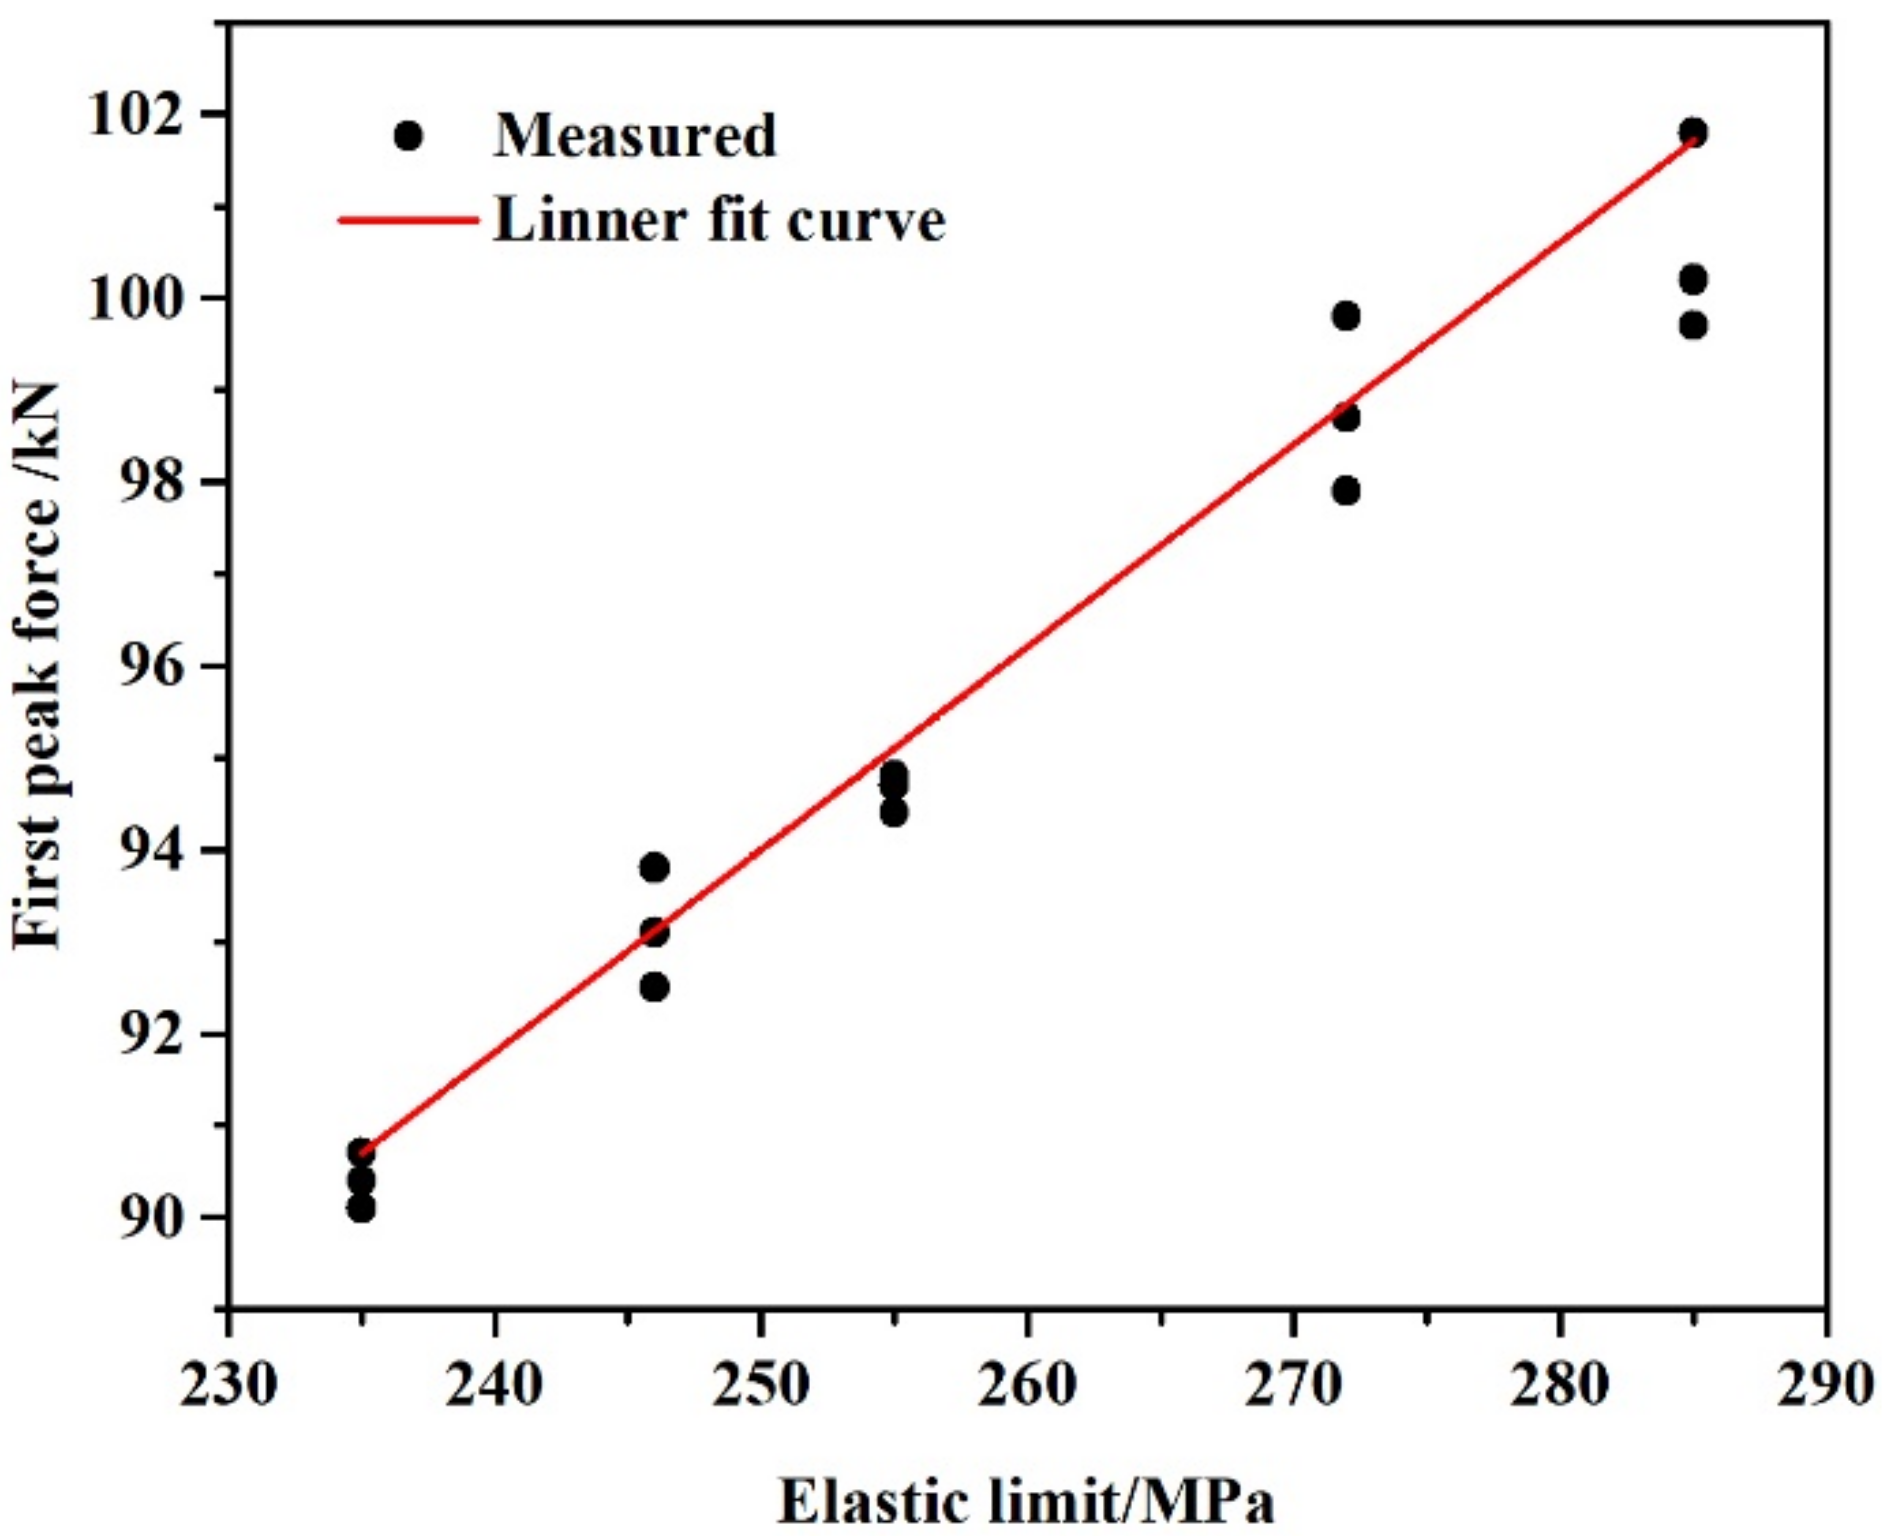
3.2. Relationship between Peak Load and Elastic Limit of Material
It can be seen from Figure 4b that the peak loads of different yield strength samples is different. Figure 6 shows that the relationship between the peak load and the elastic limit of five samples is approximately linear. Assuming that the peak loads is related to the elastic limit linearly, the peak load can be expressed as Equation (1).
where Fp is the peak force of the crushing test, S is the area of the cross-section, σe is the elastic limit of the alloys, k is the structural strengthening factor and σs is the elastic limit of the structure. Since all samples are the same structurally, S, k and σs are all constant.

Figure 6.
Relationship between peak load and elastic limit.
Equation (2) can be obtained by fitting the peak load and the elastic limit of the material by linear relation. The correlation coefficient (R2) of the fitting result reaches 0.99. According to Equations (1) and (2), the structural elastic limit σs is 72.4 MPa, and we will use this value for further calculation.
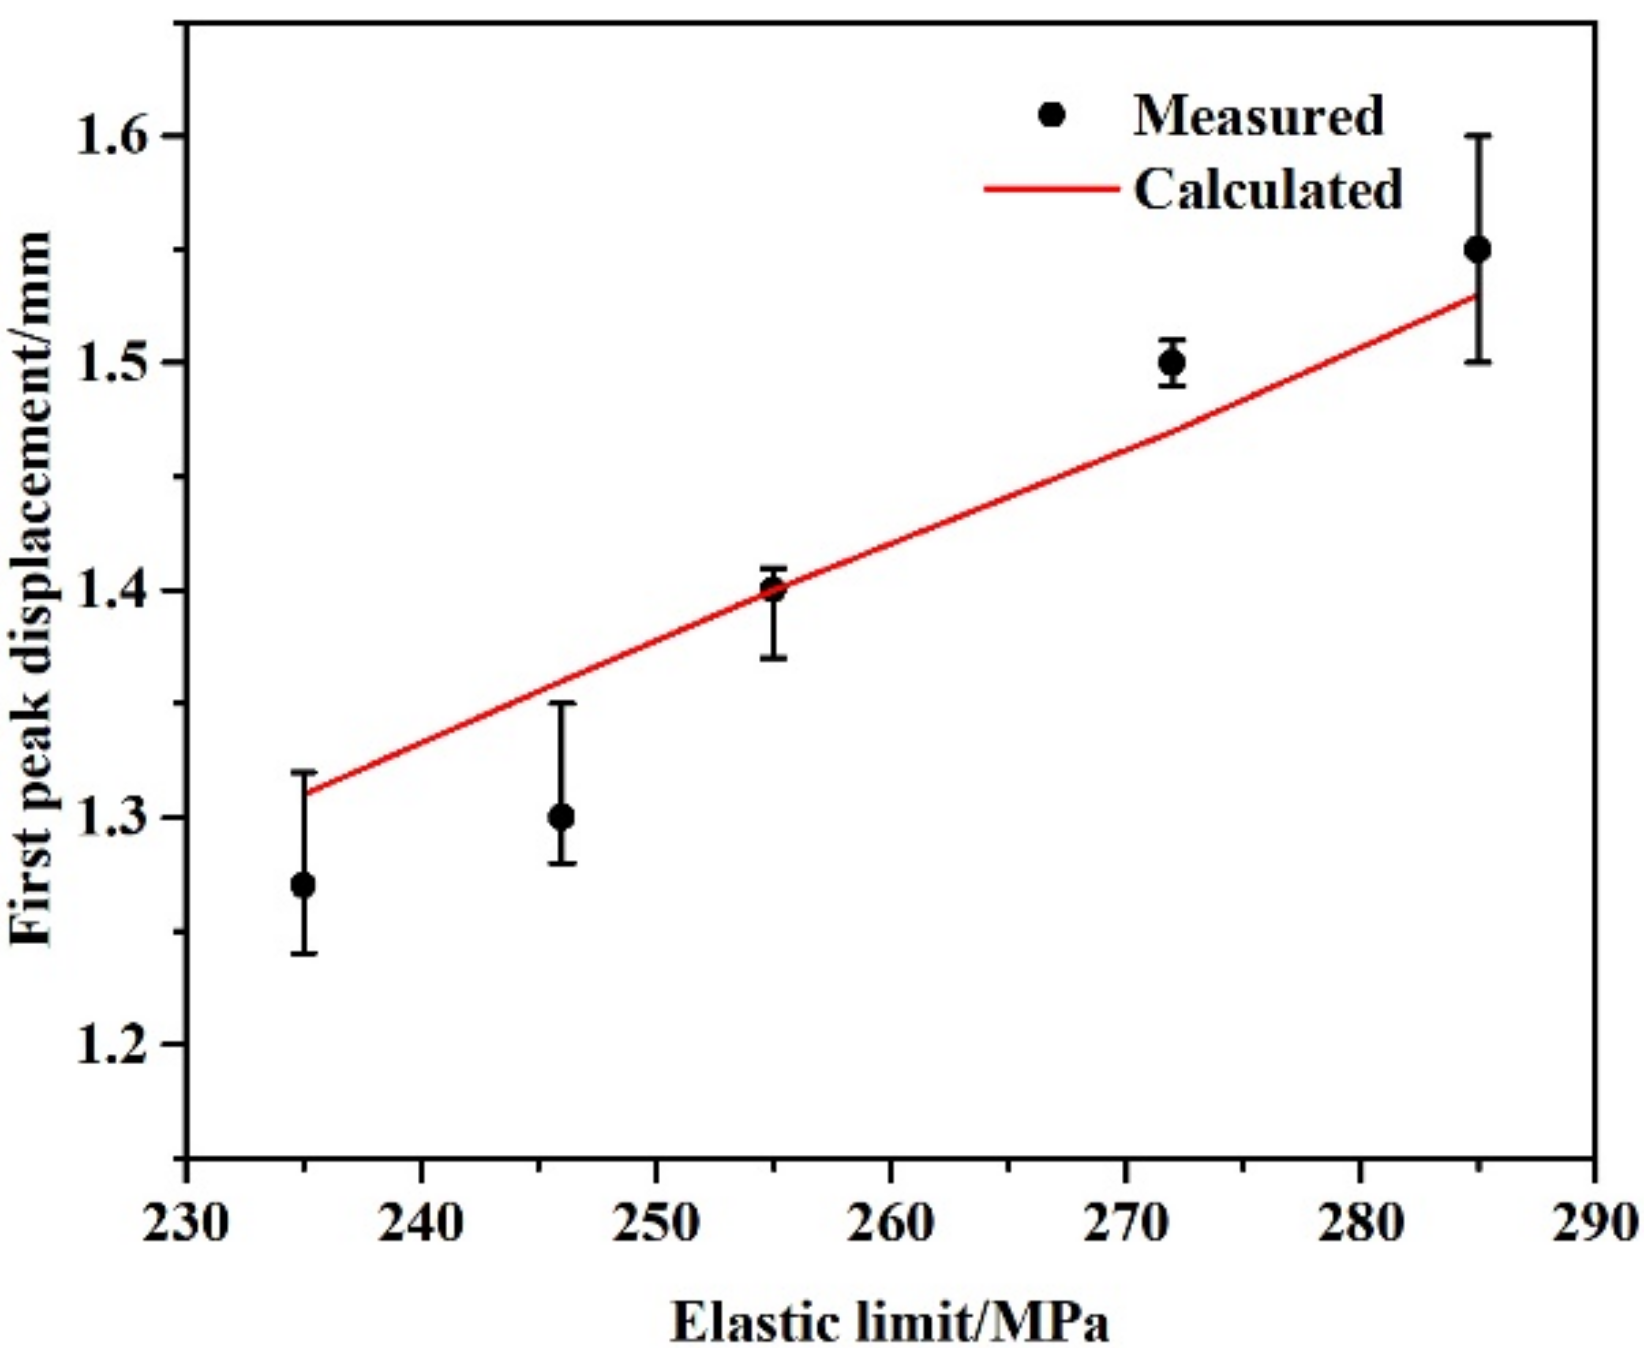
In the elastic stage the force and displacement are linear, so the crushing curve is calculated by Equation (3).
where F is crushing force, s is displacement and sp is peak force displacement. Since Fp is related to the elastic limit and structural elastic limit, the strain of Fp can be expressed as Equation (4).
where l0 is the length of the sample, which is 300 mm in this study.
The displacement at peak force is calculated by formula (4), and the calculated results and measured results are shown in Figure 7. The calculated results are in good agreement with the measured results. Using Equations (2)–(4), we can plot the crushing curve of the elastic stage for a fixed section. In these equations σe is the only unknown, so with σe we can predict the elastic stage. Figure 8 shows the comparison of the predicted and measured results, which correlate well. However, at the end of the elastic stage, there is some difference. This is due to the non-negligible data acquisition interval. By the end of the elastic stage, slight plastic deformation has occurred causing the decrease in crushing force.

Figure 7.
Comparison of calculated and measured results of first peak displacement.
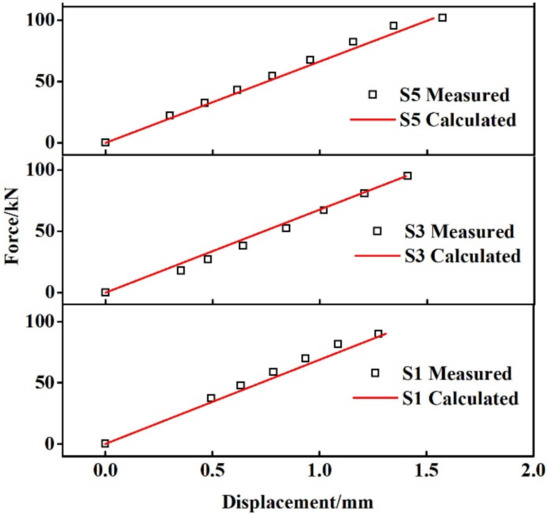
Figure 8.
Comparison of calculated and measured results of elastic stage.
3.3. Moment Conservation during Bending
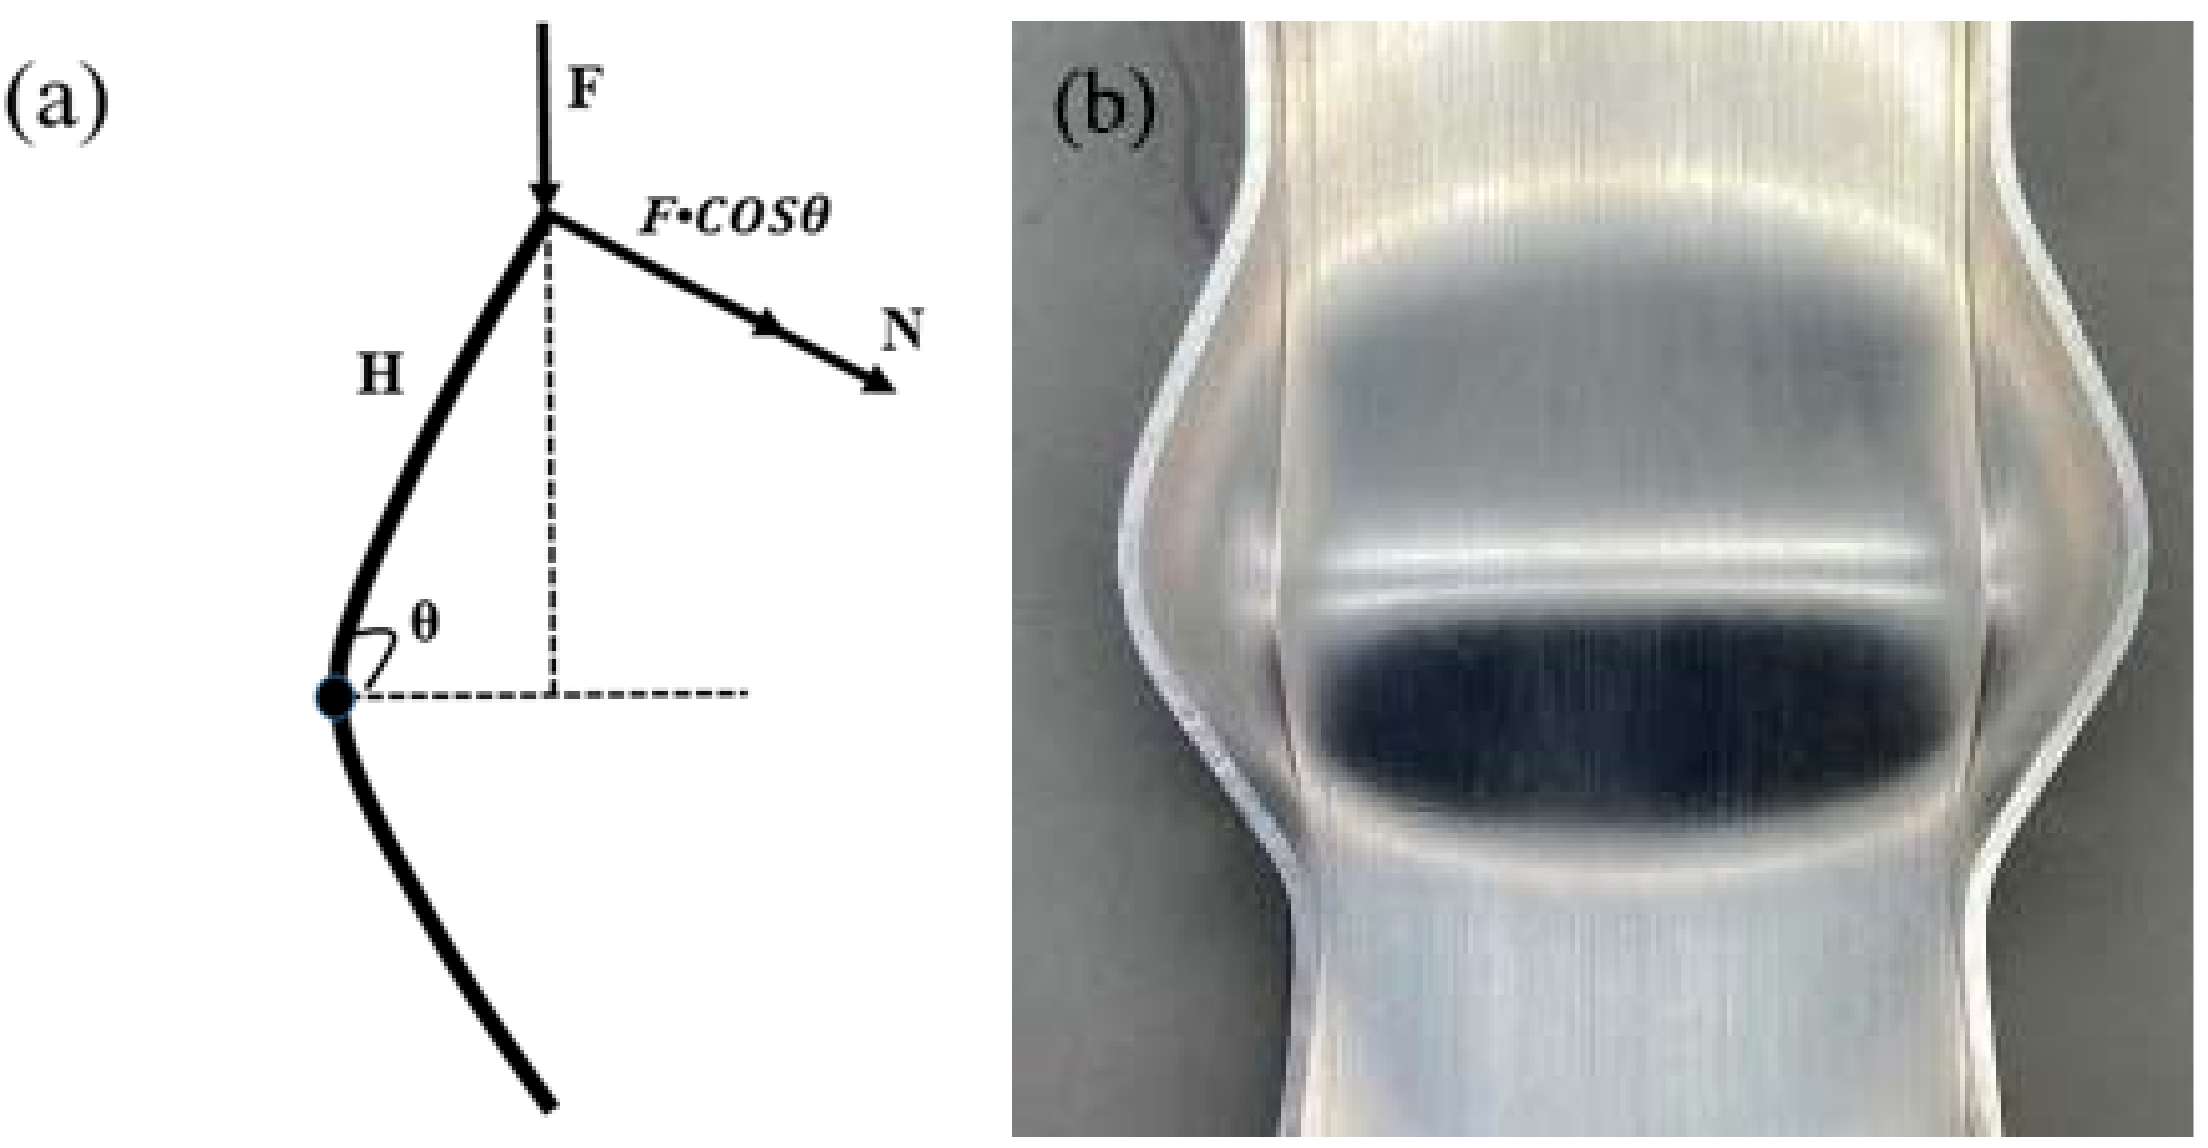
When the pressure collapse force is greater than the elastic limit of the sample, the plastic hinge is formed. The crushing force that causes deformation then changes to the crushing torque of the plastic hinge, as shown in Figure 9. The crushing torque can be calculated by Equation (5).
where N is the crushing torque, H is the plastic hinge arm and θ is half of the plastic hinge angle. The plastic hinge arm is related to the structure of the sample. According to analysis of several sections, the plastic hinge arms of different strength samples are about 30 mm. Fcosθ is the component of the crushing force perpendicular to the plastic hinge arm (see Figure 9a).

Figure 9.
Schematic diagram of bending stage. (a) Schematic for calculating the torque, (b) A-A section photo of crushing 10 mm.
Figure 10 shows the relationship of Fcosθ with the displacement of each specimen in the bending stage. It shows that Fcosθ changes little in the bending stage, so we can assume that the torque is constant. Then the torque is calculated by Equation (6).
where θp is half of the plastic hinge angle of the peak force. The relationship between crushing force and displacement in the bending section can then be deduced, see Equation (7).
Figure 10.
The relationship of parameter Fcosθ with the displacement of each specimen in the bending stage.
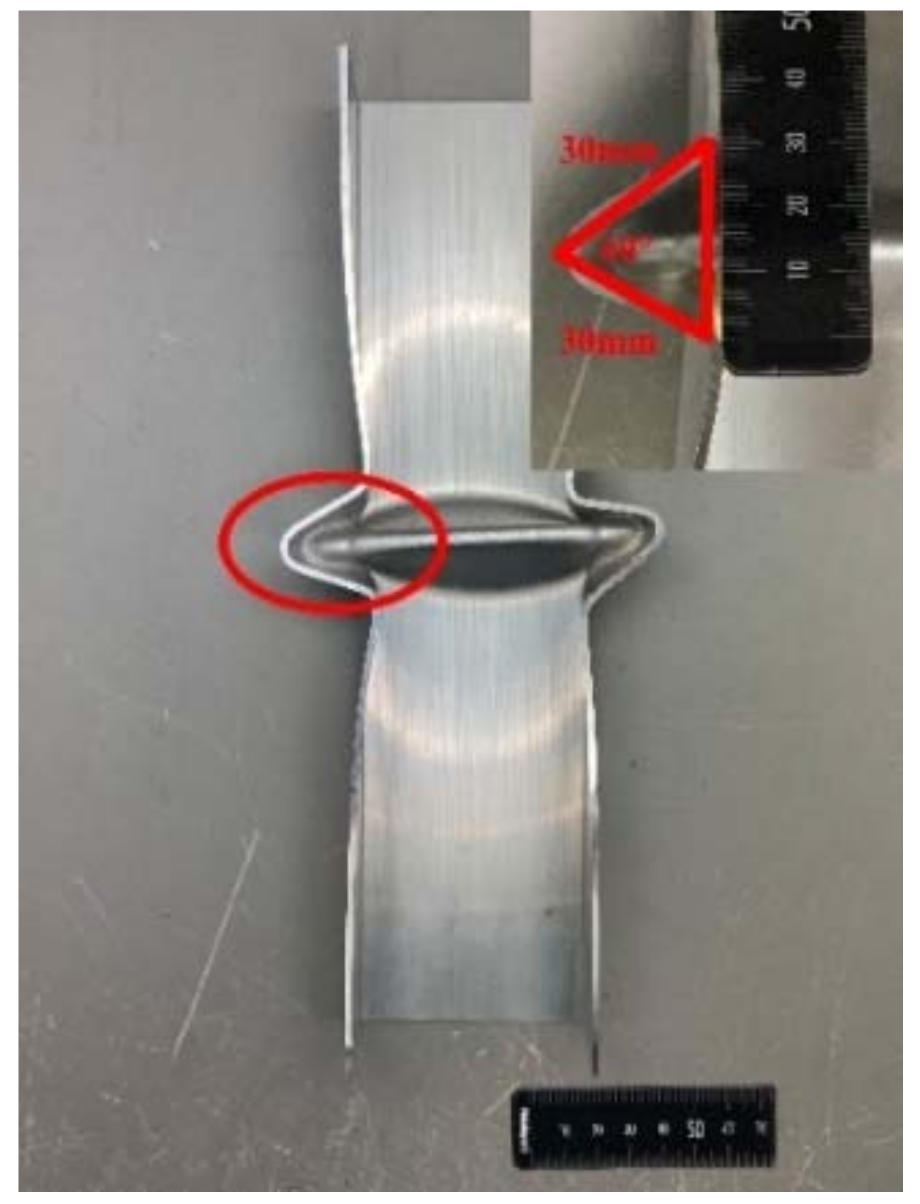
The first valley value is the end point of the bending stage, so its displacement determines the scope of application of Equation (7). Figure 10 shows that when the outer plastic hinge of the A-A section makes contact with the inner hinge of the of B-B section, the crushing force reaches the first valley. The wall thickness of the sample is the main factor that hinders the plastic hinge from continuing its compaction. The angle of the plastic hinge and the valley value are directly related to the wall thickness. In this study, from Figure 11, we can see that the angle of the first valley plastic hinge is about 60°, that is, the plastic hinge forms an equilateral triangle. As a result, the displacement of the first valley value can be calculated as H, and the scope of application of Equation (7) is (dp, H].

Figure 11.
The A-A section of the first valley.
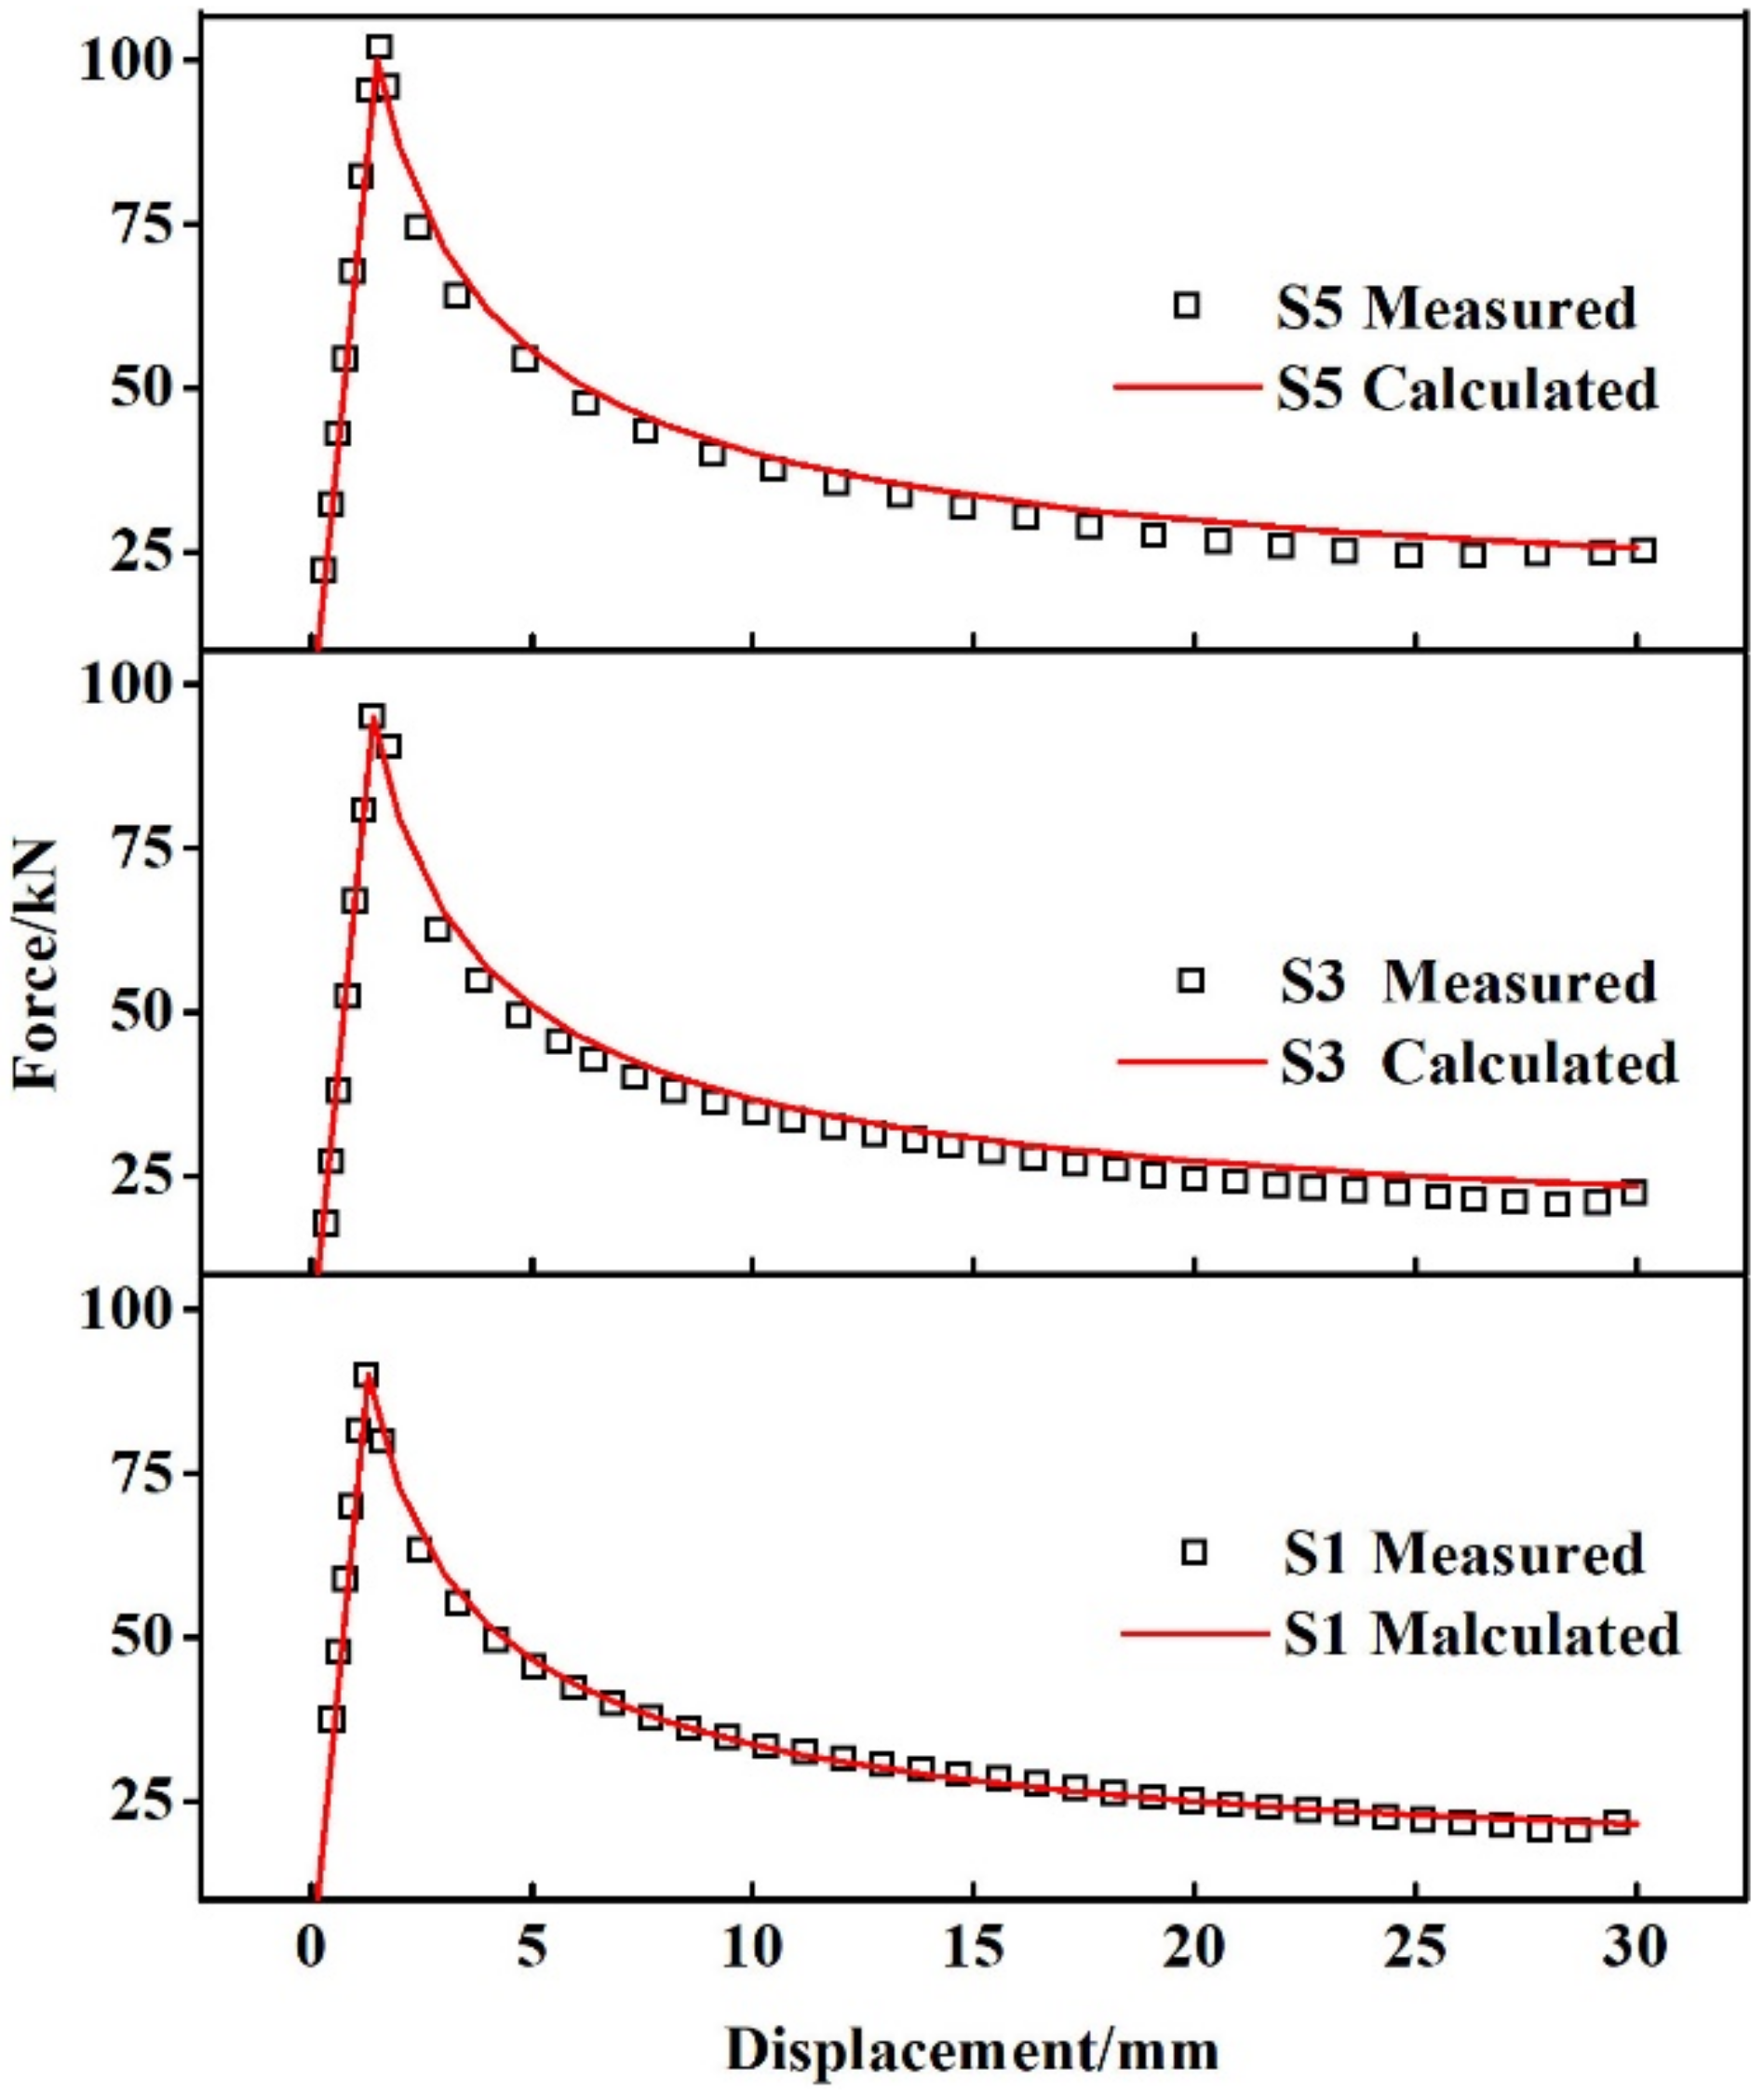
Figure 12 shows the comparison between the calculated results and the measured data of the crushing curve, which correlate well. These demonstrate that the conservation of the moment is reasonable.
Figure 12.
Comparison of calculated and measured results of the first two stages.
3.4. Fitting of Compaction Stage
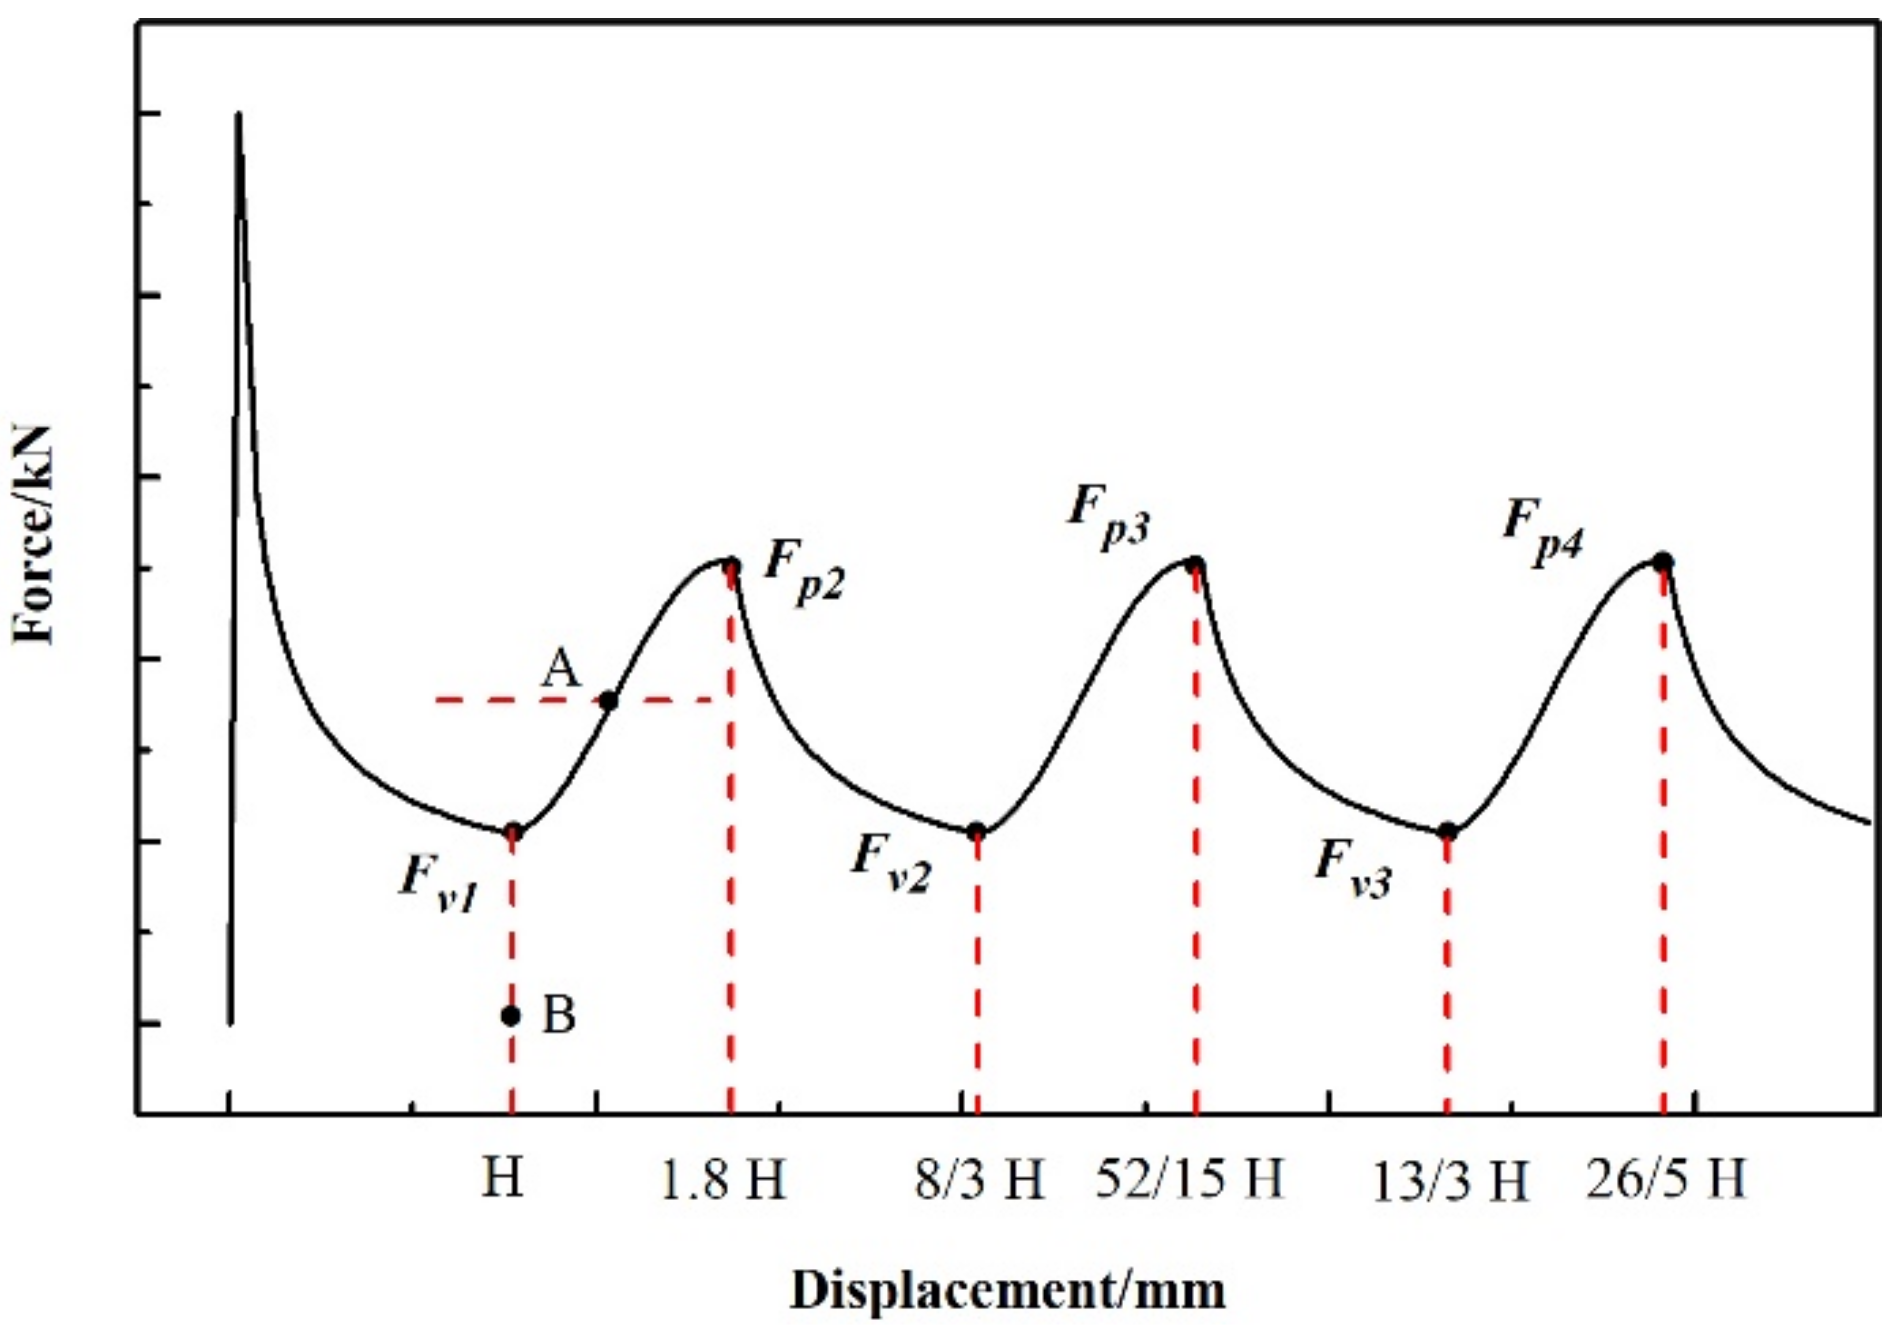
The deformation of the compaction stage is more complicated than the bending stage. At the end of the bending stage, the plastic hinges of the two sections have begun to make contact. The first step of the compaction stage is the compaction of one plastic hinge against another. As the first plastic hinge compacts, the second plastic hinge of section A-A begins to form again. The simultaneous compaction and forming of the plastic hinges make the calculation at this stage complicated. To simplify the calculation, it is assumed that the relationship between force and displacement at this stage conforms to the cosine function, and the compaction stage can be expressed as Equation (8). The schematic diagram is shown in Figure 13.
where Fp2 is the second peak force of the crushing test and Fv1 is the first valley force. In Equation (8), the scope of s is measured by the crushing test and the value is shown in Figure 13. When the crushing force reaches the second peak, the plastic hinge is compacted, and the crushing process changes to the bending stage again. Fp2 can then be calculated by Equation (6), as shown in Equation (9). Fv1 is calculated by Equation (7), therefore Equation (8) can be transformed to Equation (10).

Figure 13.
Schematic diagram of calculation in compaction and folding stages.
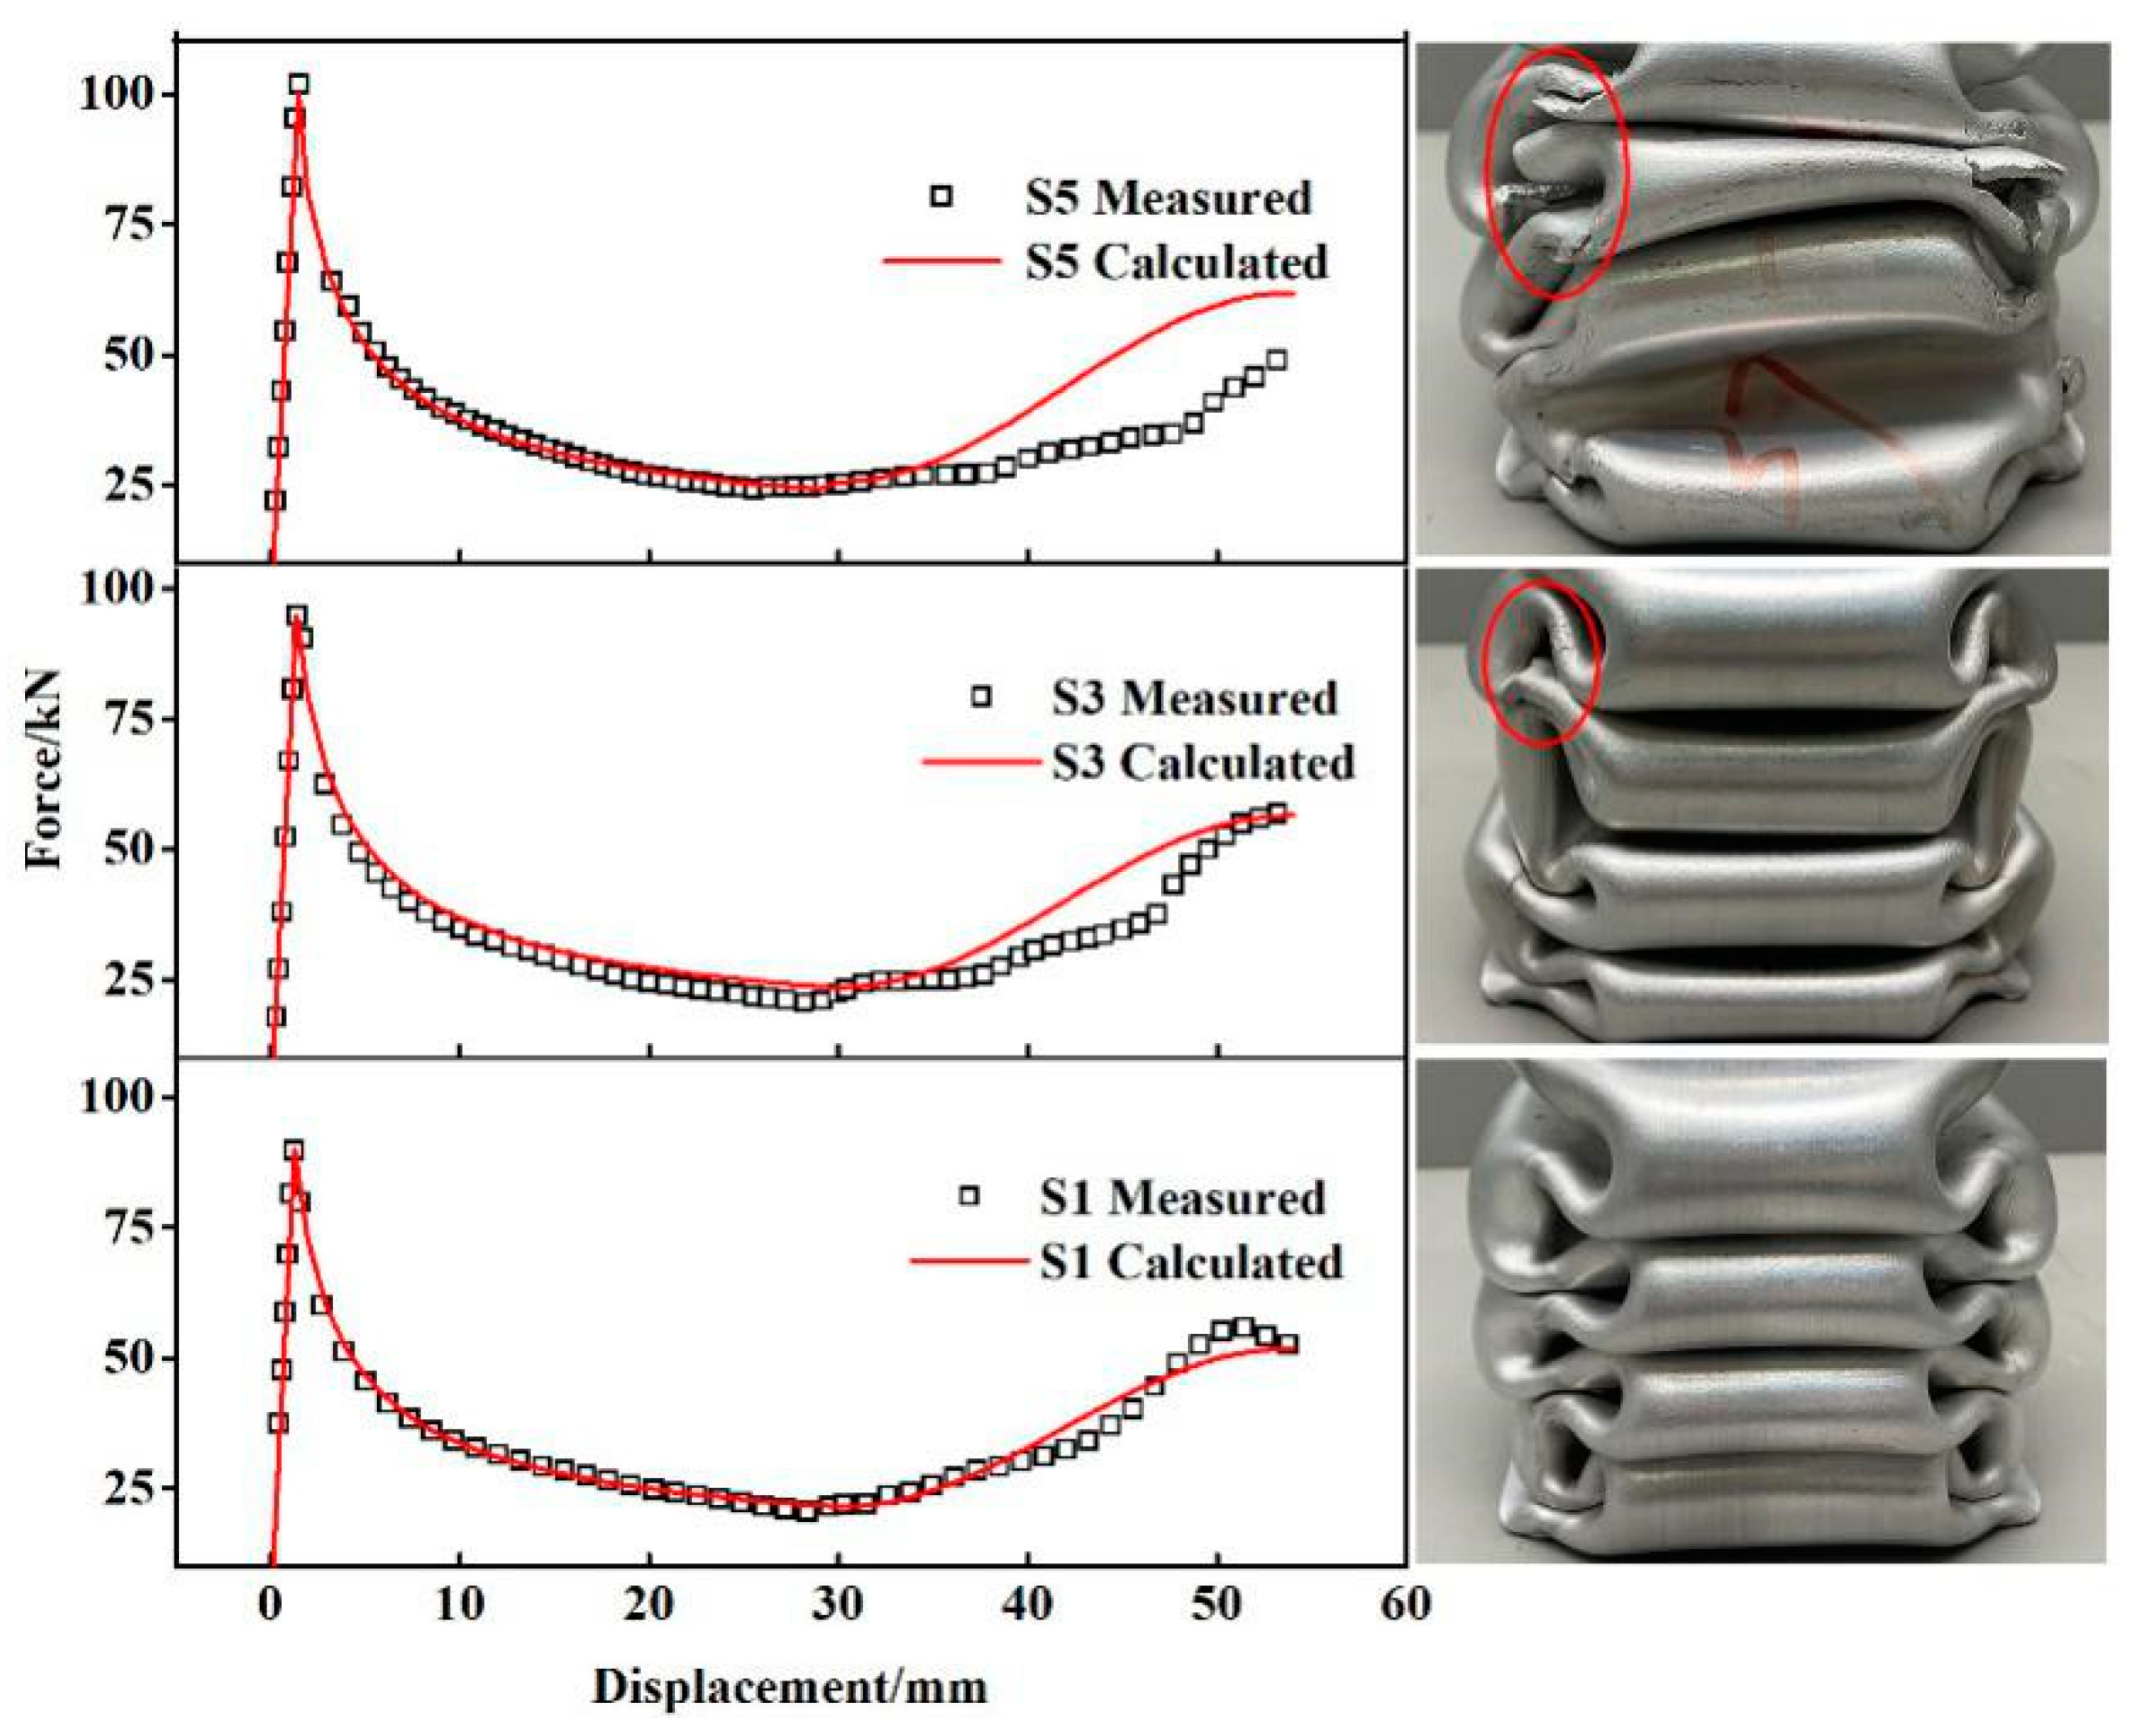
The crushing curve of the compaction stage calculated by Equation (10) is shown in Figure 14. The calculated curve S1 is in good agreement with the measured data, while the deviations of S3 and S5 are relatively larger. This is because S1 has not cracked, while S3 and S5 have slightly cracked in the position of reinforcement.
Figure 14.
Comparison of calculated and measured results of the first three stages.
3.5. Instability of Folding Stage
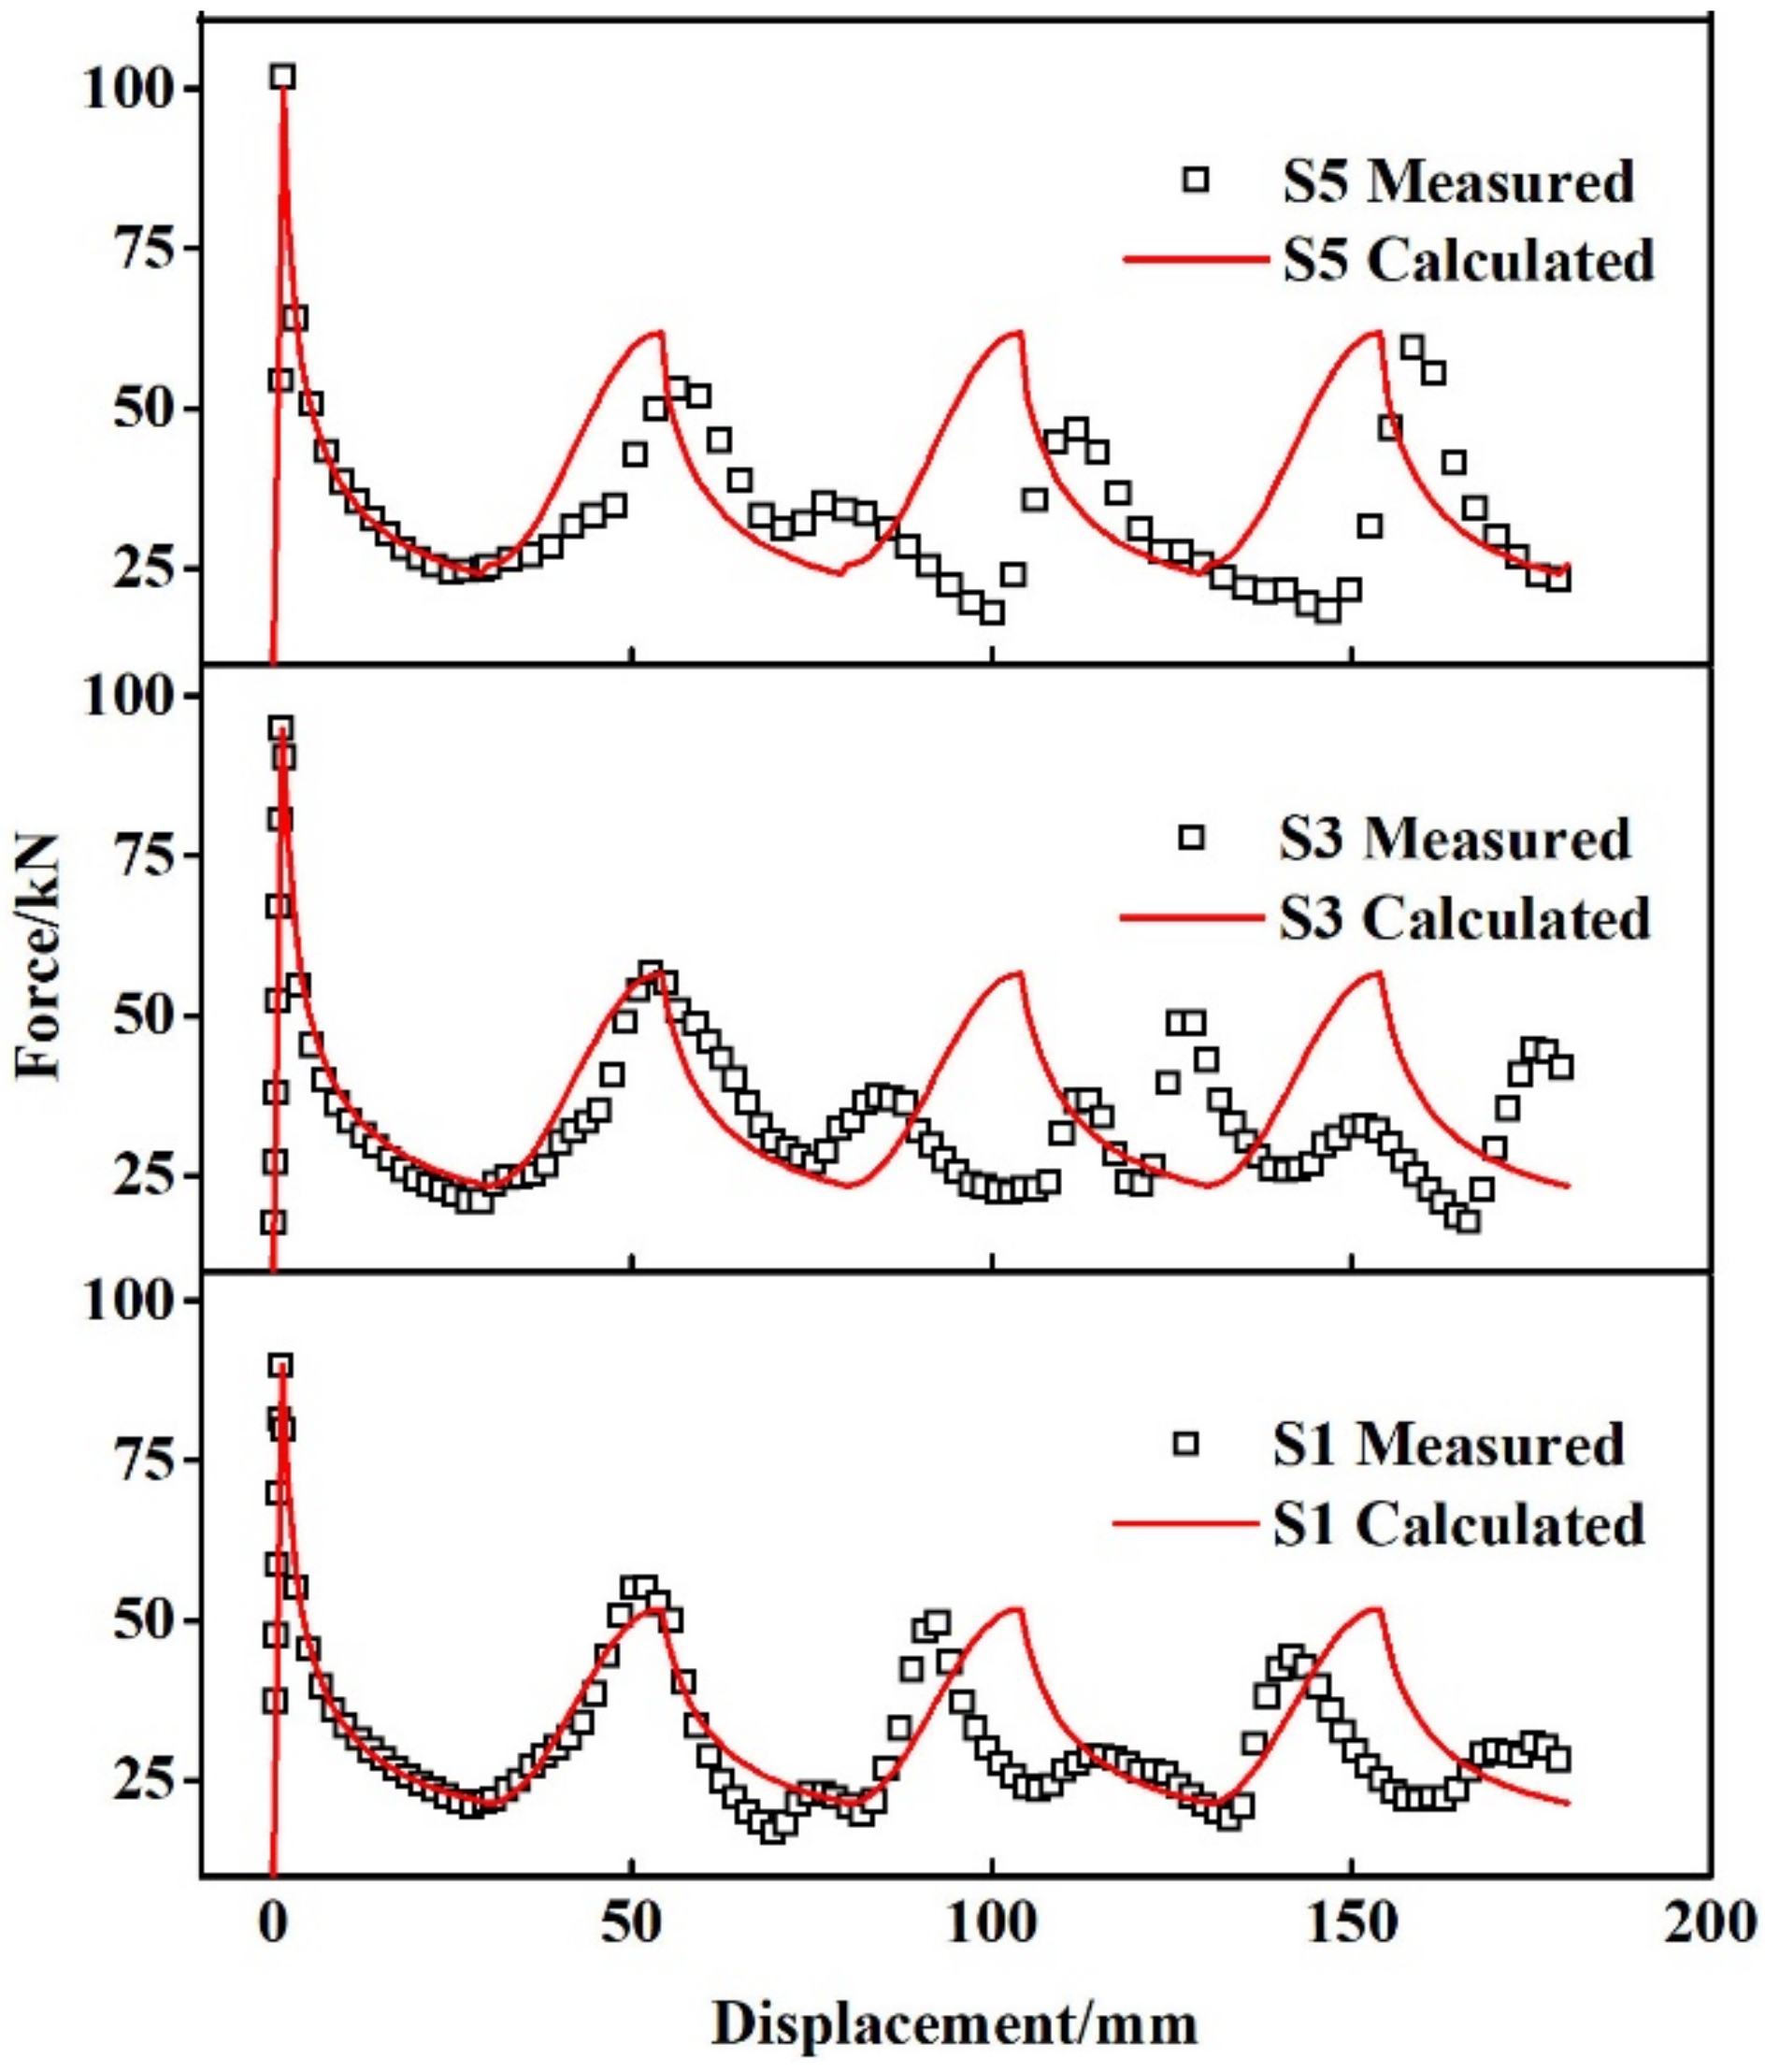
In the folding stage, the bending and compaction process of the sample will be repeated. The folding stage can be calculated by Equations (7) and (10), but the scope of application should be adjusted. The calculation formulae are shown in Equations (11) and (12). Thus, the stress-displacement curve for the whole crushing process can be plotted, as shown in Figure 15. The curve shows that the first three stages correlate well with the measured data, but the fitting degree is lower in the folding stage.
Figure 15.
Calculated and measured results of crushing curves.
As mentioned above, instability begins after the second peak of the crushing process. The instability of the crushing process is the main reason for the low fitting degree of the calculated crushing curve.
3.6. Verification
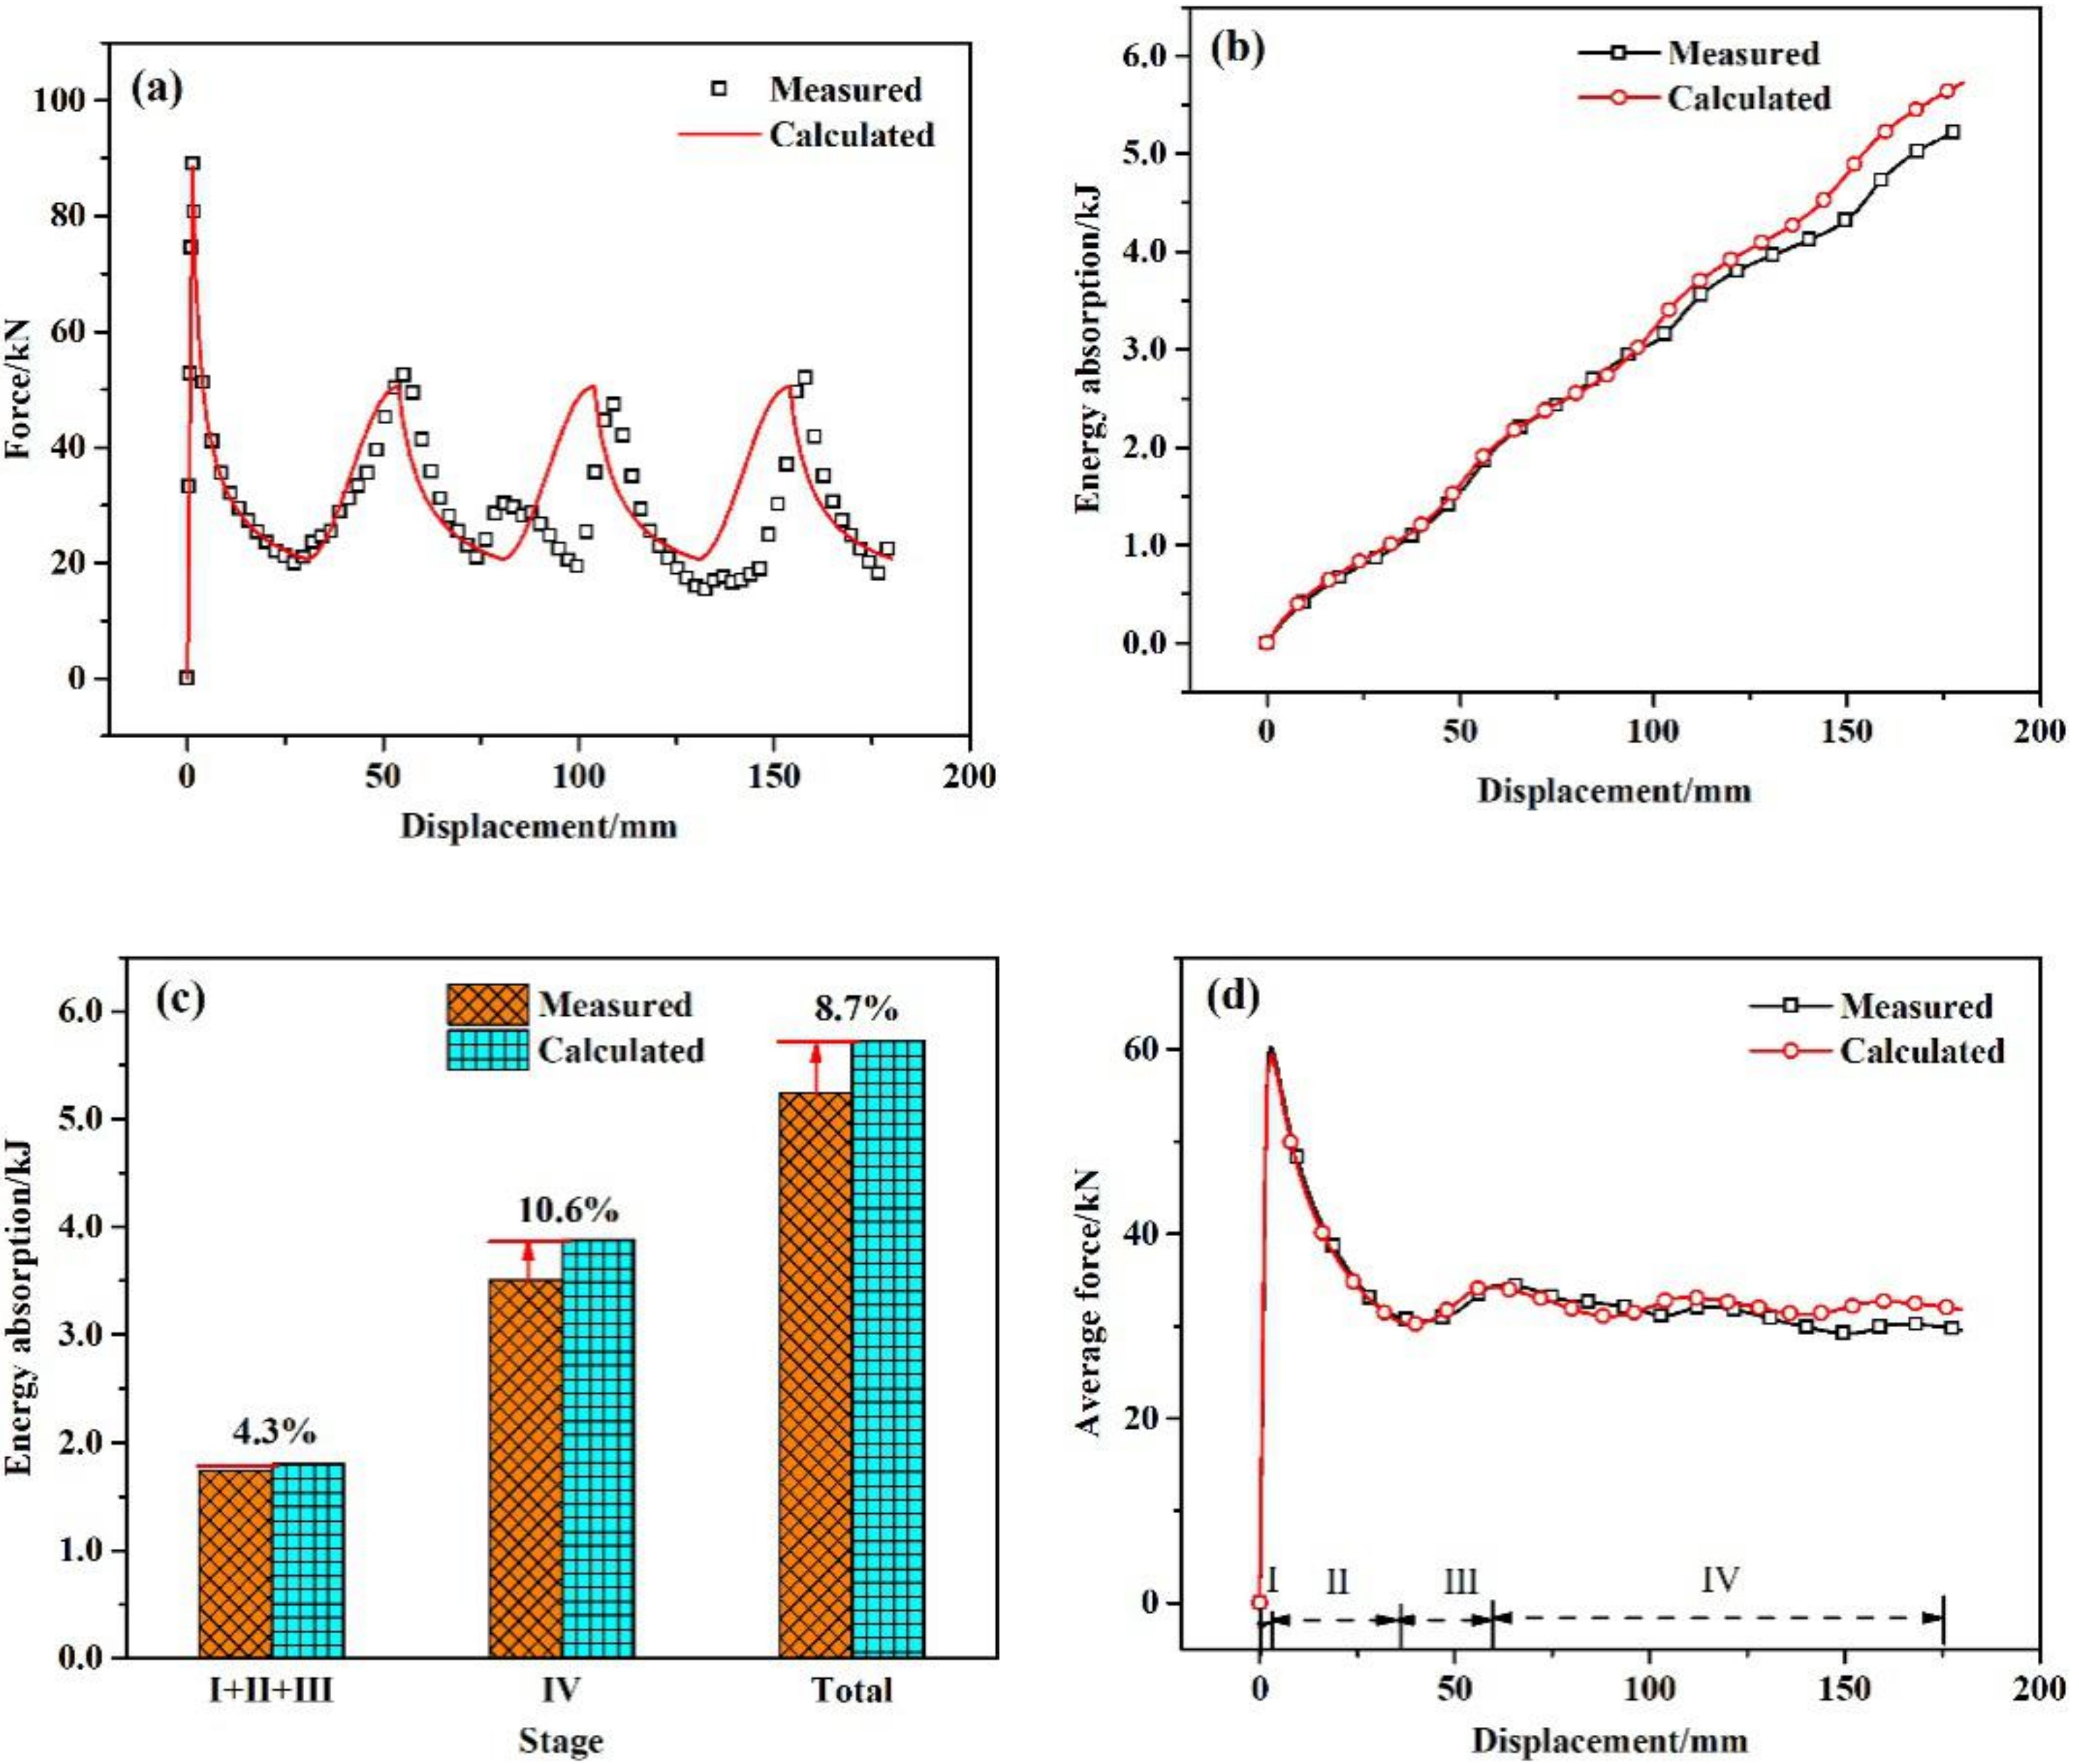
Based on the analysis above, the crushing curve can be calculated by piecewise function. Summarizing the calculation equations of the four stages, the crushing curve can be obtained by Equations (3), (7), (11) and (12). To verify these, an S6 sample with a different elastic limit to samples S0–S5 was selected, and the tensile properties of the alloys are shown in Figure 2. Validation includes comparison of measured and calculated crushing curves (Figure 16a), energy absorption (Figure 16b) and average force (Figure 16c). The energy absorption is calculated by Equation (13), and the average force is calculated by Equation (14).

Figure 16.
Verification: (a) crushing curve, (b) energy absorption curves, (c) energy absorption deviation, (d) average force.
Figure 16a shows that the first three stages of the calculated crushing curve correlate well with the measured data, but when the crushing begins to lose stability in the folding stage, the degree of fitting decreases significantly. Therefore, in the energy absorption curve, the calculated results in the first three stages are similar to the measured results, with a difference of only 4.3%. However, in the folding stage, there is a difference of up to 10.6%. The energy absorption difference of the whole crushing process is only 8.9%. Although the fitting degree of the folding stage is lower due to the instability, the variation law of force-displacement is the same with the measured values. The difference in energy absorption between the calculated and measured values is small. If the average load is used to evaluate the calculated and measured data, the difference between them will be very small, far less than the difference for the crushing curve.
4. Conclusions
Through our study of the crushing process of different elastic limit states of a KHC63 alloy, we divided the process into four typical stages according to deformation characteristics: elastic stage, bending stage, compaction stage and folding stage. We established a physical model and mathematical relationship between crushing force and displacement for each stage when the sample was not cracked. The following conclusions can be drawn.
- (1)
- Peak force is related to the elasticity of the material and its structure, and the relationship between peak force and the elastic limit of the material is approximately linear.
- (2)
- In the bending stage, the measured torque results show that the crushing torque is constant. The mathematical relationship between force and displacement derived using this principle correlates well with the measured data.
- (3)
- By way of verification, the energy absorption deviation between the first three stages and the measured results is only 4.3%. Due to the collapse of the component, the folded section begins to lose stability, and the deviation between the calculated results and the measured results is larger, i.e., about 10.6%.
Author Contributions
Conceptualization, H.G. and S.F.; methodology, Y.D.; formal analysis, S.F. and R.P.; investigation, resources, R.P.; writing—original draft preparation, H.G.; writing—review and editing, H.G.; visualization, H.G.; supervision, Y.D. All authors have read and agreed to the published version of the manuscript.
Funding
This work was financially supported by the National Key R&D Program of China (grant number 2016YFB0300901), the National Building Project of the Application Demonstration Platform on New Materials Products 2019 (grant number TC190H3ZV/2), the foundation for the Key Laboratory of National Defense Science and Technology for Equipment Pre-research (grant number 15308469779) and Kam Kiu Aluminium Products Group Limited.
Institutional Review Board Statement
Not applicable for studies not involving humans or animals.
Informed Consent Statement
Informed consent was obtained from all subjects involved in the study.
Data Availability Statement
The data presented in this study are available on request from the corresponding author. The data are not publicly available due to it involved some confidential information about Kam Kiu Aluminium Products Group Limited.
Conflicts of Interest
The authors declare no conflict of interest.
References
- Pirmohammad, S.; Nikkhah, H. Crashworthiness Investigation of Bitubal Columns Reinforced with Several Inside Ribs Under Axial and Oblique Impact Loads. Proc. Inst. Mech. Eng. Part D J. Automob. Eng. 2018, 232, 367–383. [Google Scholar] [CrossRef]
- Bilston, D.; Ruan, D.; Candido, A.; Durandet, Y. Parametric Study of the Cross-Section Shape of Aluminium Tubes in Dynamic Three-Point Bending. Thin Wall. Struct. 2019, 136, 315–322. [Google Scholar] [CrossRef]
- Duan, L.; Jiang, H.; Geng, G.; Zhang, X.; Li, Z. Parametric Modeling and Multiobjective Crashworthiness Design Optimization of a New Front Longitudinal Beam. Struct. Multidiscip. Optim. 2019, 59, 1789–1812. [Google Scholar] [CrossRef]
- Duan, L.; Jiang, H.; Cheng, A.; Xue, H.; Geng, G. Multi-Objective Reliability-Based Design Optimization for the VRB-VCS FLB Under Front-Impact Collision. Struct. Multidiscip. Optim. 2019, 59, 1835–1851. [Google Scholar] [CrossRef]
- Duan, L.; Xiao, N.; Hu, Z.; Li, G.; Cheng, A. An Efficient Lightweight Design Strategy for Body-In-White Based On Implicit Parameterization Technique. Struct. Multidiscip. Optim. 2017, 55, 1927–1943. [Google Scholar] [CrossRef]
- Qiu, N.; Gao, Y.; Fang, J.; Feng, Z.; Sun, G.; Li, Q. Crashworthiness Analysis and Design of Multi-Cell Hexagonal Columns Under Multiple Loading Cases. Finite Elem. Anal. Des. 2015, 104, 89–101. [Google Scholar] [CrossRef]
- Nia, A.A.; Parsapour, M. Comparative Analysis of Energy Absorption Capacity of Simple and Multi-Cell Thin-Walled Tubes with Triangular, Square, Hexagonal and Octagonal Sections. Thin Wall. Struct. 2014, 74, 155–165. [Google Scholar]
- Zhang, X.; Zhang, H. Energy Absorption of Multi-Cell Stub Columns under Axial Compression. Thin Wall. Struct. 2013, 68, 156–163. [Google Scholar] [CrossRef]
- Yamazaki, K.; Han, J. Maximization of the Crushing Energy Absorption of Tubes. Structural Optim. 1998, 16, 37–46. [Google Scholar] [CrossRef]
- Sun, H.; Wang, J.; Shen, G.; Hu, P. Energy Absorption of Aluminum Alloy Thin-Walled Tubes Under Axial Impact. J. Mech. Sci. Technol. 2016, 30, 3105–3111. [Google Scholar] [CrossRef]
- Kohar, C.P.; Zhumagulov, A.; Brahme, A.; Worswick, M.J.; Mishra, R.K.; Inal, K. Development of High Crush Efficient, Extrudable Aluminium Front Rails for Vehicle Lightweighting. Int. J. Impact Eng. 2016, 95, 17–34. [Google Scholar] [CrossRef]
- Fang, J.; Gao, Y.; Sun, G.; Qiu, N.; Li, Q. On Design of Multi-Cell Tubes Under Axial and Oblique Impact Loads. Thin Wall. Struct. 2015, 95, 115–126. [Google Scholar] [CrossRef]
- Kathiresan, M. Influence of Shape, Size and Location of Cutouts on Crashworthiness Performance of Aluminium Conical Frusta Under Quasi-Static Axial Compression. Thin Wall. Struct. 2020, 154, 106793. [Google Scholar] [CrossRef]
- Kathiresan, M.; Manisekar, K. Axial Crush Behaviours and Energy Absorption Characteristics of Aluminium and E-glass/epoxy Over-Wrapped Aluminium Conical Frusta under Low Velocity Impact Loading. Compos. Struct. 2016, 136, 86–100. [Google Scholar] [CrossRef]
- Wu, Y.; Fang, J.; Cheng, Z.; He, Y.; Li, W. Crashworthiness of Tailored-Property Multi-Cell Tubular Structures under Axial Crushing and Lateral Bending. Thin Wall. Struct. 2020, 149, 106640. [Google Scholar] [CrossRef]
- Arnold, B.; Altenhof, W. Experimental Observations on the Crush Characteristics of AA6061 T4 and T6 Structural Square Tubes with and without Circular Discontinuities. Int. J. Crashworthines. 2004, 9, 73–87. [Google Scholar] [CrossRef]
- Hoang, N.; Hopperstad, O.S.; Myhr, O.R.; Marioara, C.; Langseth, M. An Improved Nano-Scale Material Model Applied in Axial-Crushing Analyses of Square Hollow Section Aluminium Profiles. Thin Wall. Struct. 2015, 93–103. [Google Scholar] [CrossRef]
- Wierzbicki, T.; Abramowicz, W. On the Crushing Mechanics of Thin-Walled Structures. J. Appl. Mech. 1983, 50, 727–734. [Google Scholar] [CrossRef]
- Magee, C.L.; Thornton, P.H. Design Considerations in Energy Absorption by Structural Collapse. SAE Trans. 1978, 2041–2055. [Google Scholar]
- Granum, H.; Myhr, O.R.; Børvik, T.; Hopperstad, O.S. Nanostructure-Based Finite Element Analyses of Aluminium Profiles Subjected to Quasi-Static Axial Crushing. Thin Wall. Struct. 2018, 131, 769–781. [Google Scholar] [CrossRef]
- Abramowicz, W. Simplified Crushing Analysis of Thin-Walled Columns and Beams. Rozprawy Inzynierskie 1981, 29, 5–26. [Google Scholar]
- Abramowicz, W.; Wierzbicki, T. Axial Crushing of Multicorner Sheet Metal Columns. J. Appl. Mech. 1989, 56, 113–120. [Google Scholar] [CrossRef]
- Alexander, J.M. An Approximate Analysis of the Collapse of Thin Cylindrical Shells under Axial Loading. Q. J. Mech. Appl. Math. 1960, 13, 10–15. [Google Scholar] [CrossRef]
- Singace, A.A.; Elsobky, H.; Reddy, T.Y. On the Eccentricity Factor in the Progressive Crushing of Tubes. Int. J. Solids Struct. 1995, 32, 3589–3602. [Google Scholar] [CrossRef]


Publisher’s Note: MDPI stays neutral with regard to jurisdictional claims in published maps and institutional affiliations. |
© 2020 by the authors. Licensee MDPI, Basel, Switzerland. This article is an open access article distributed under the terms and conditions of the Creative Commons Attribution (CC BY) license (http://creativecommons.org/licenses/by/4.0/).