Compression Behavior of Sheets Metals of Pure Titanium 2 and Ti6Al4V Alloy under High Temperature: Evaluation of the Tension–Compression Asymmetry

 , ,
, , 
Abstract
1. Introduction
2. Materials and Methods
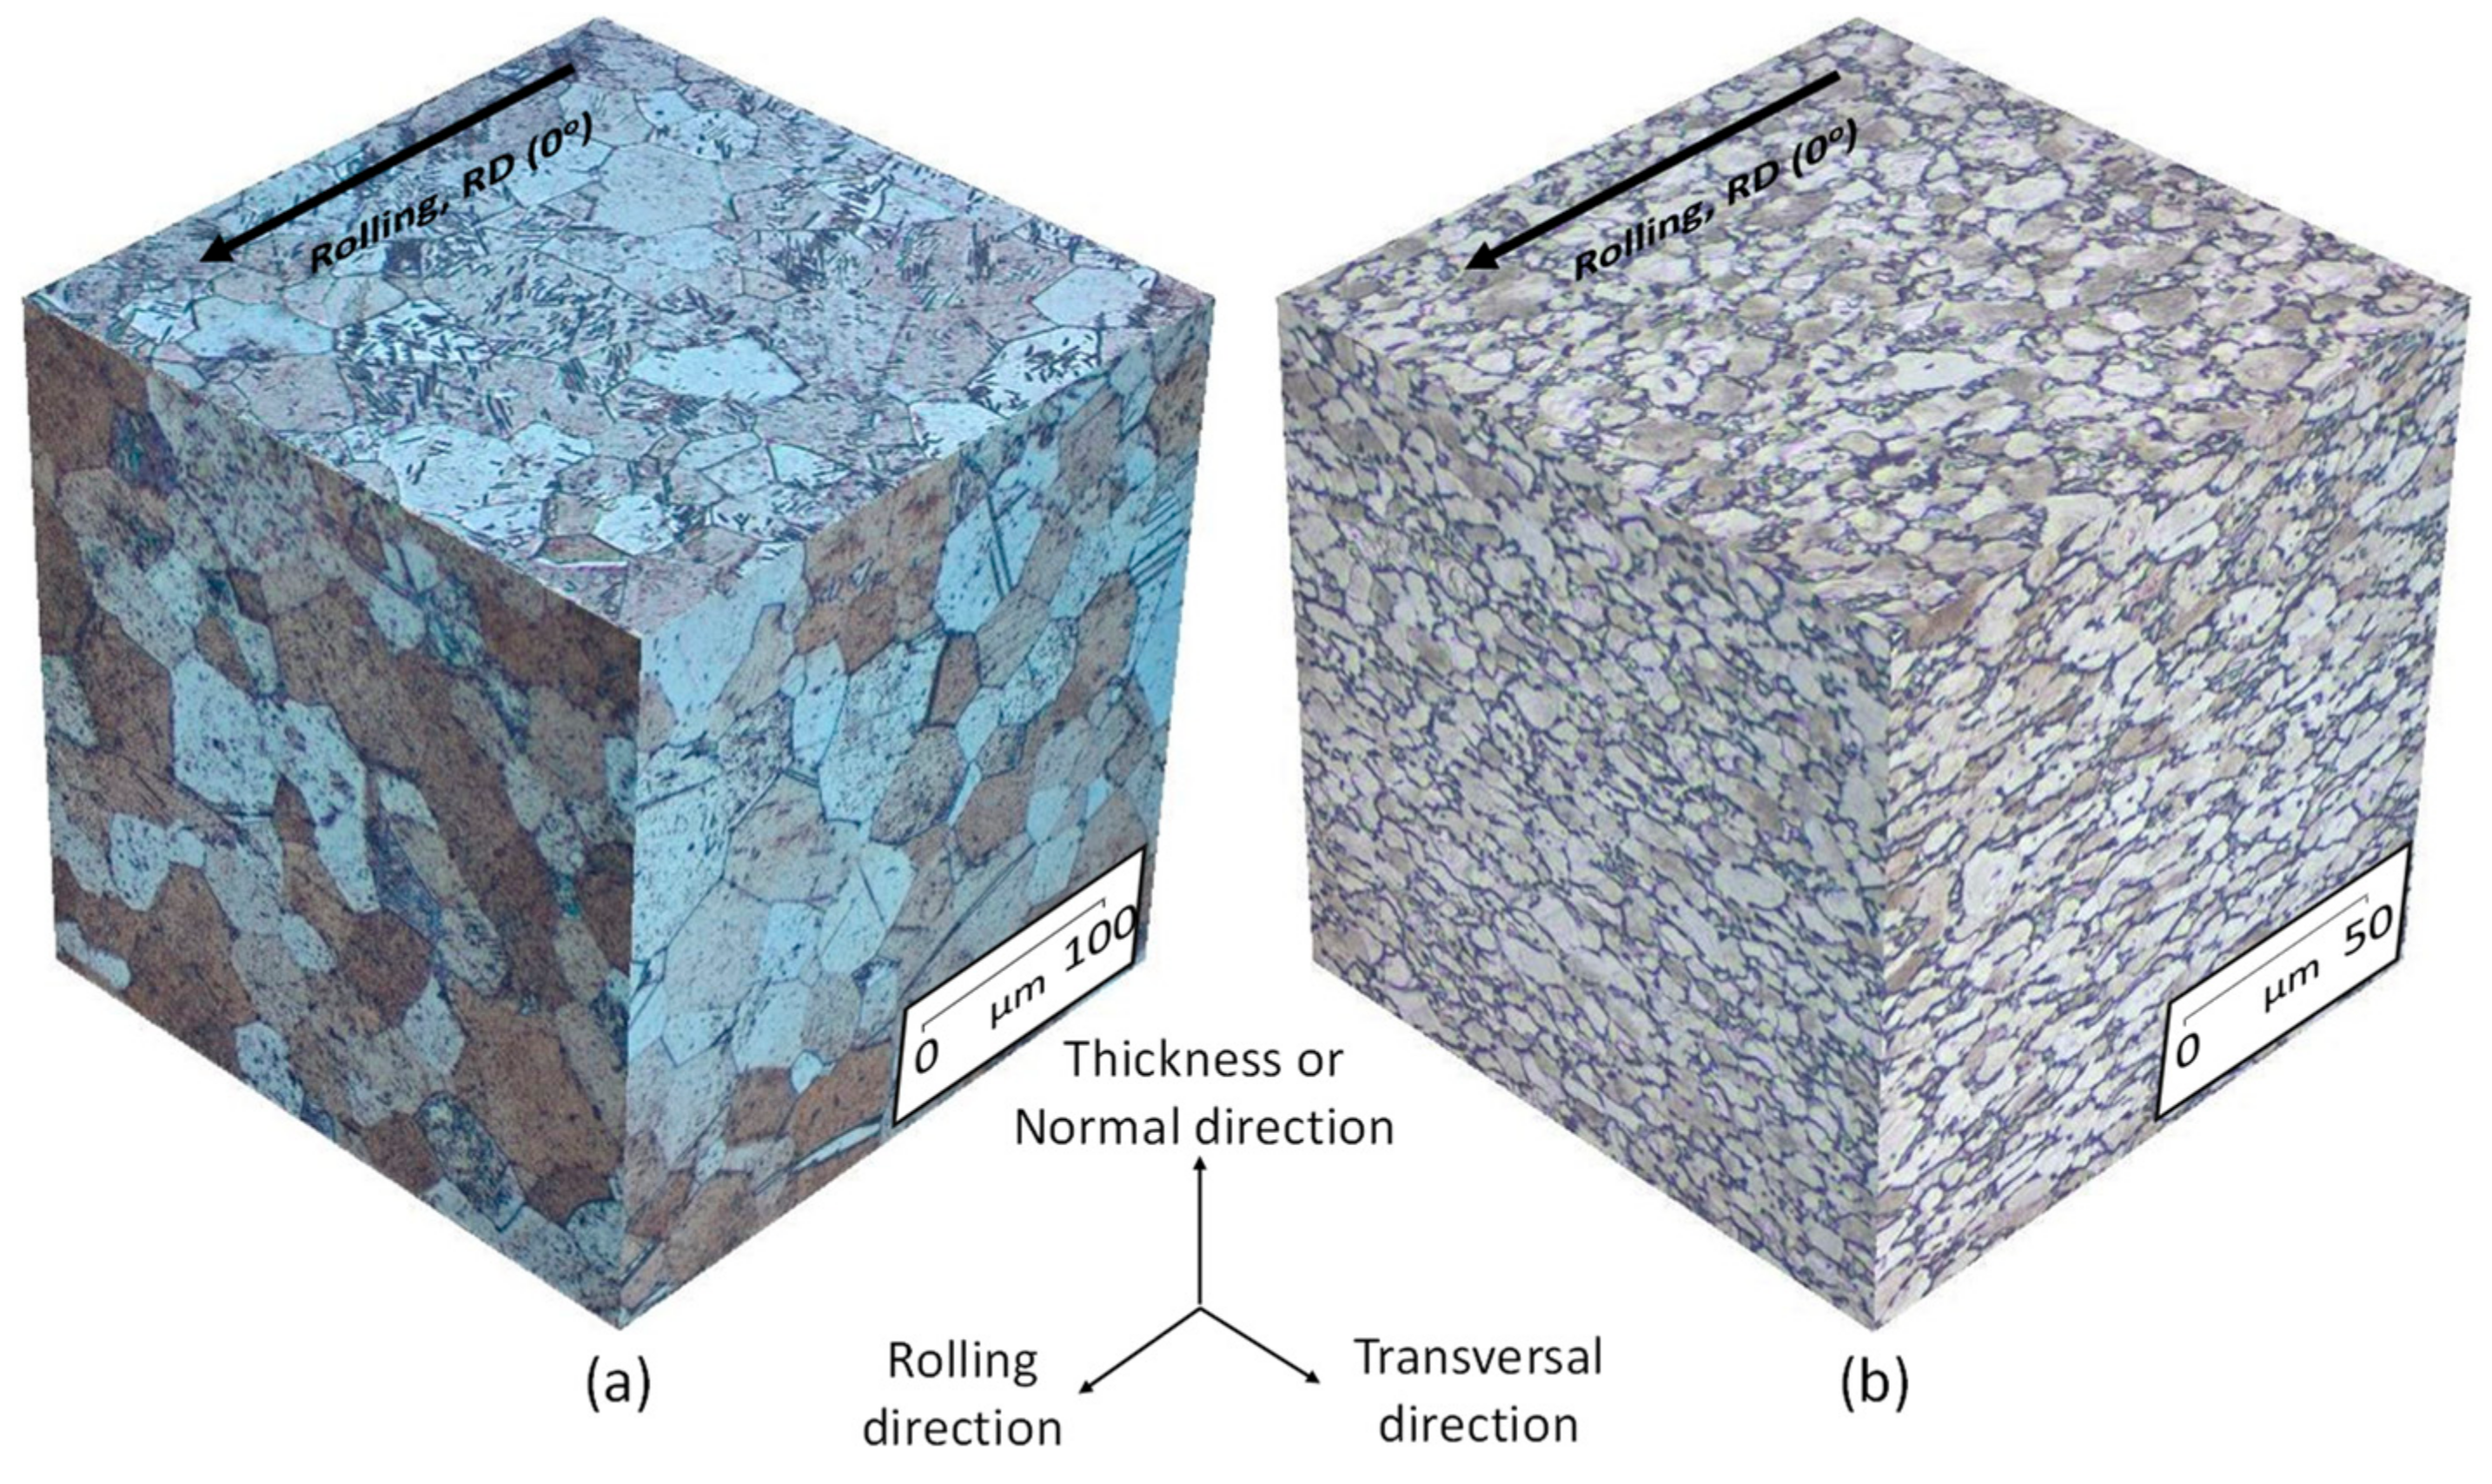
2.1. Materials
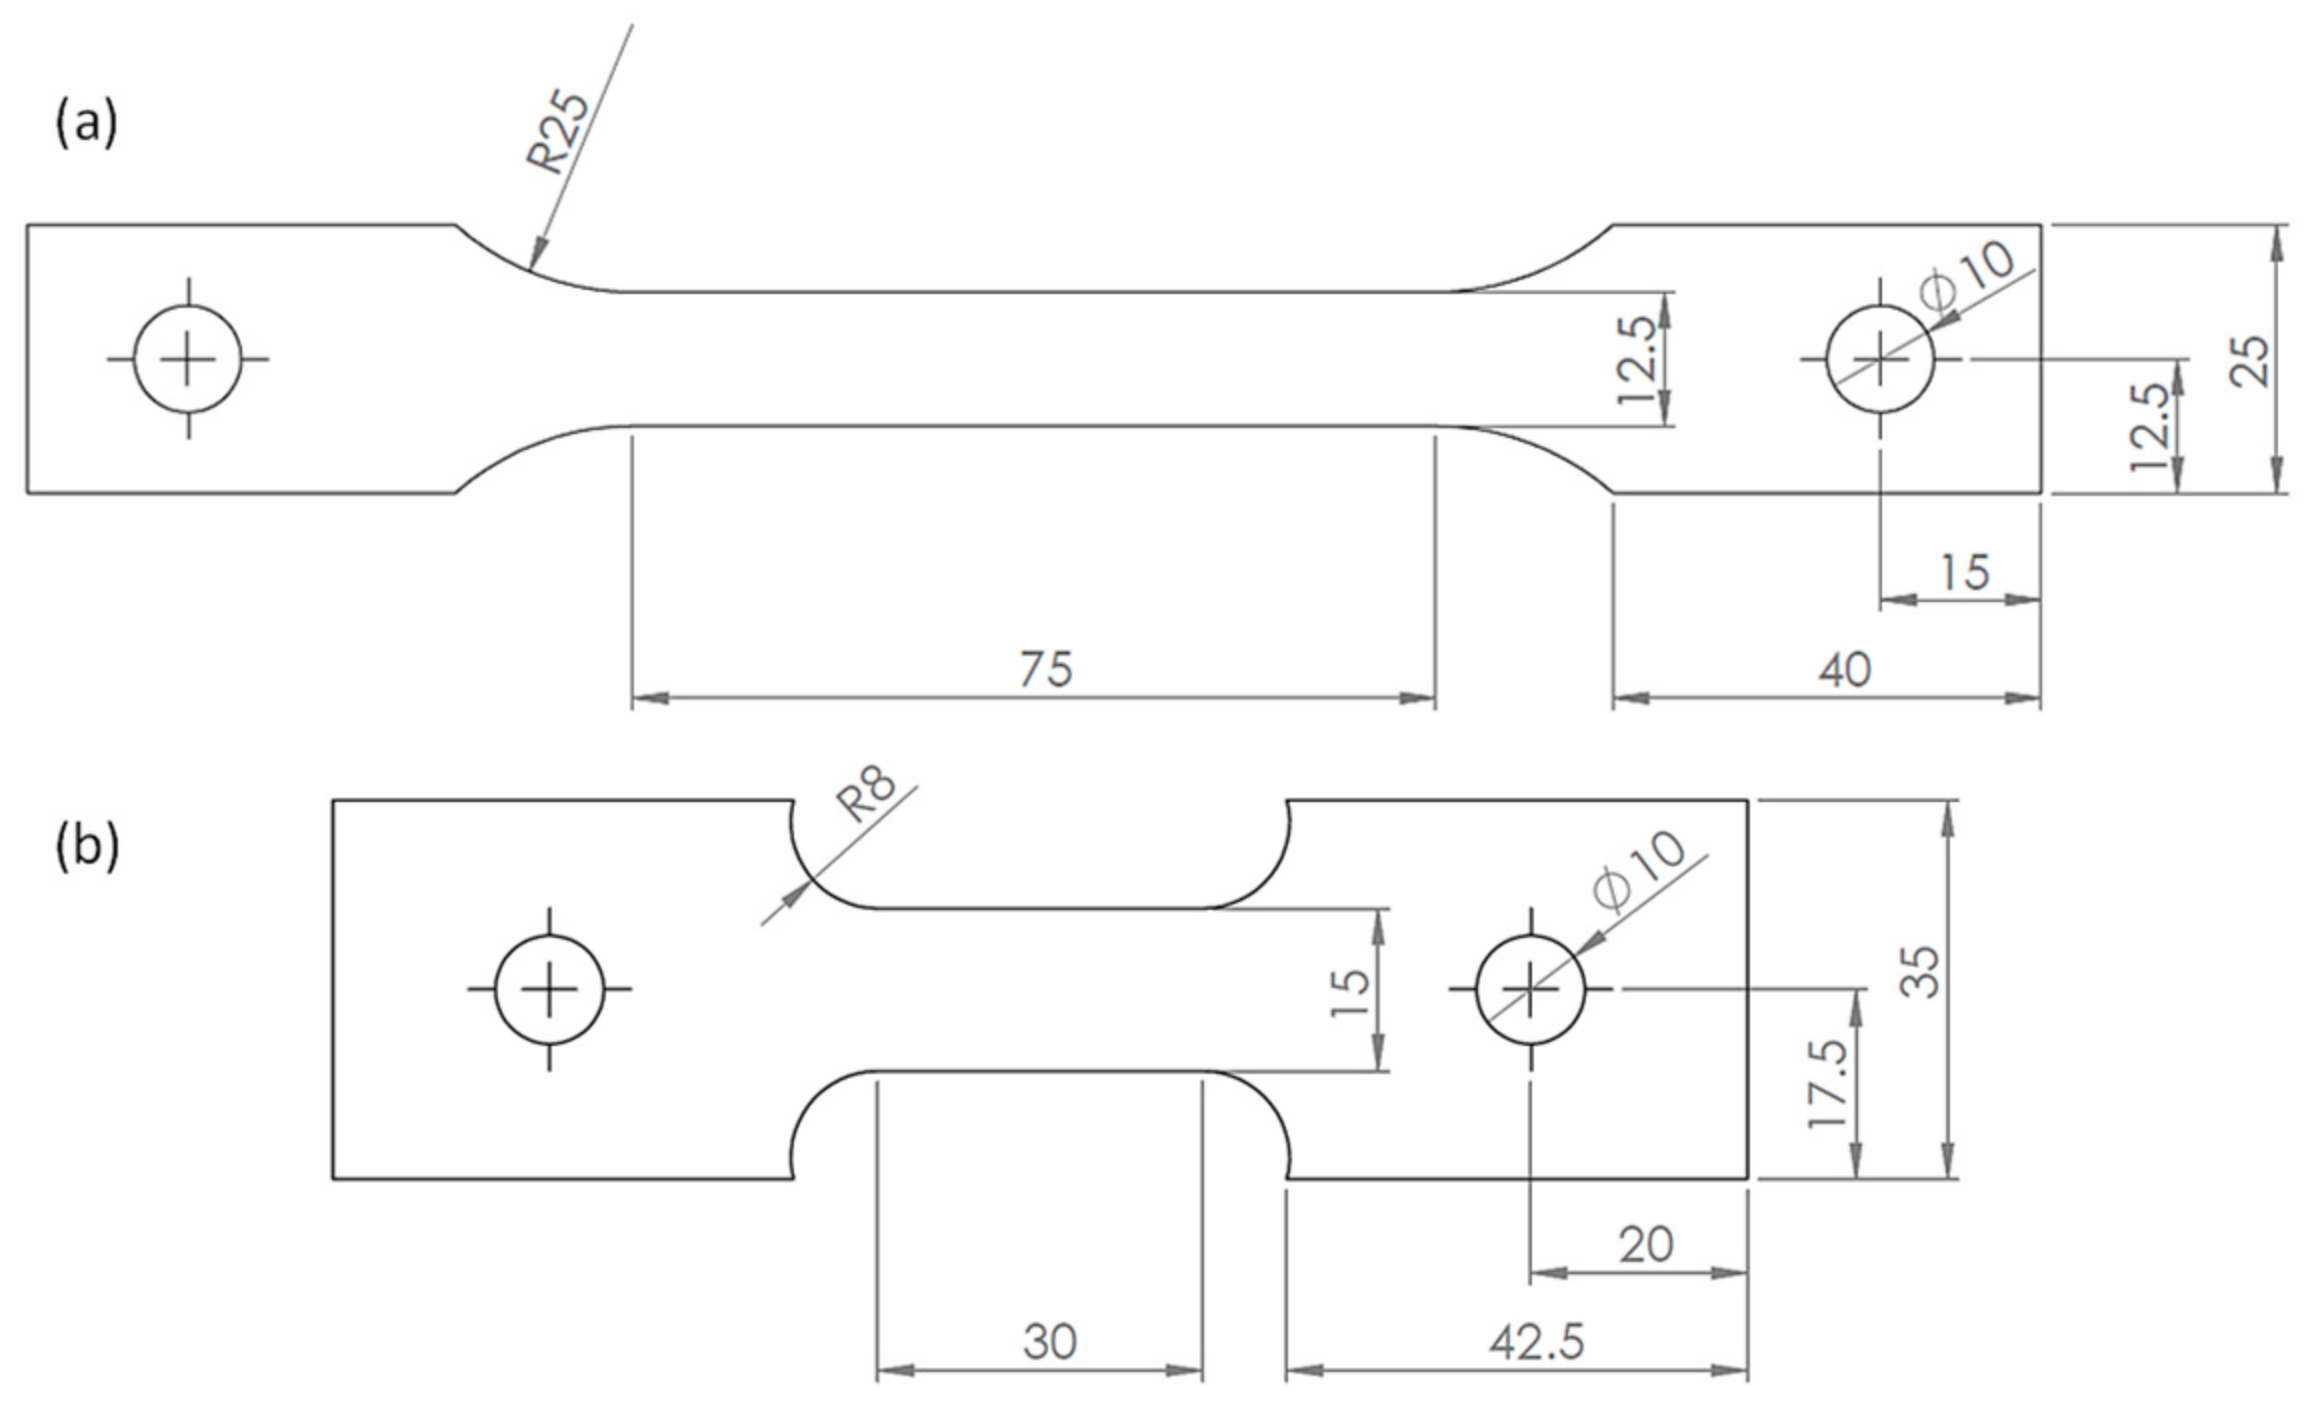
2.2. Tensile Tests
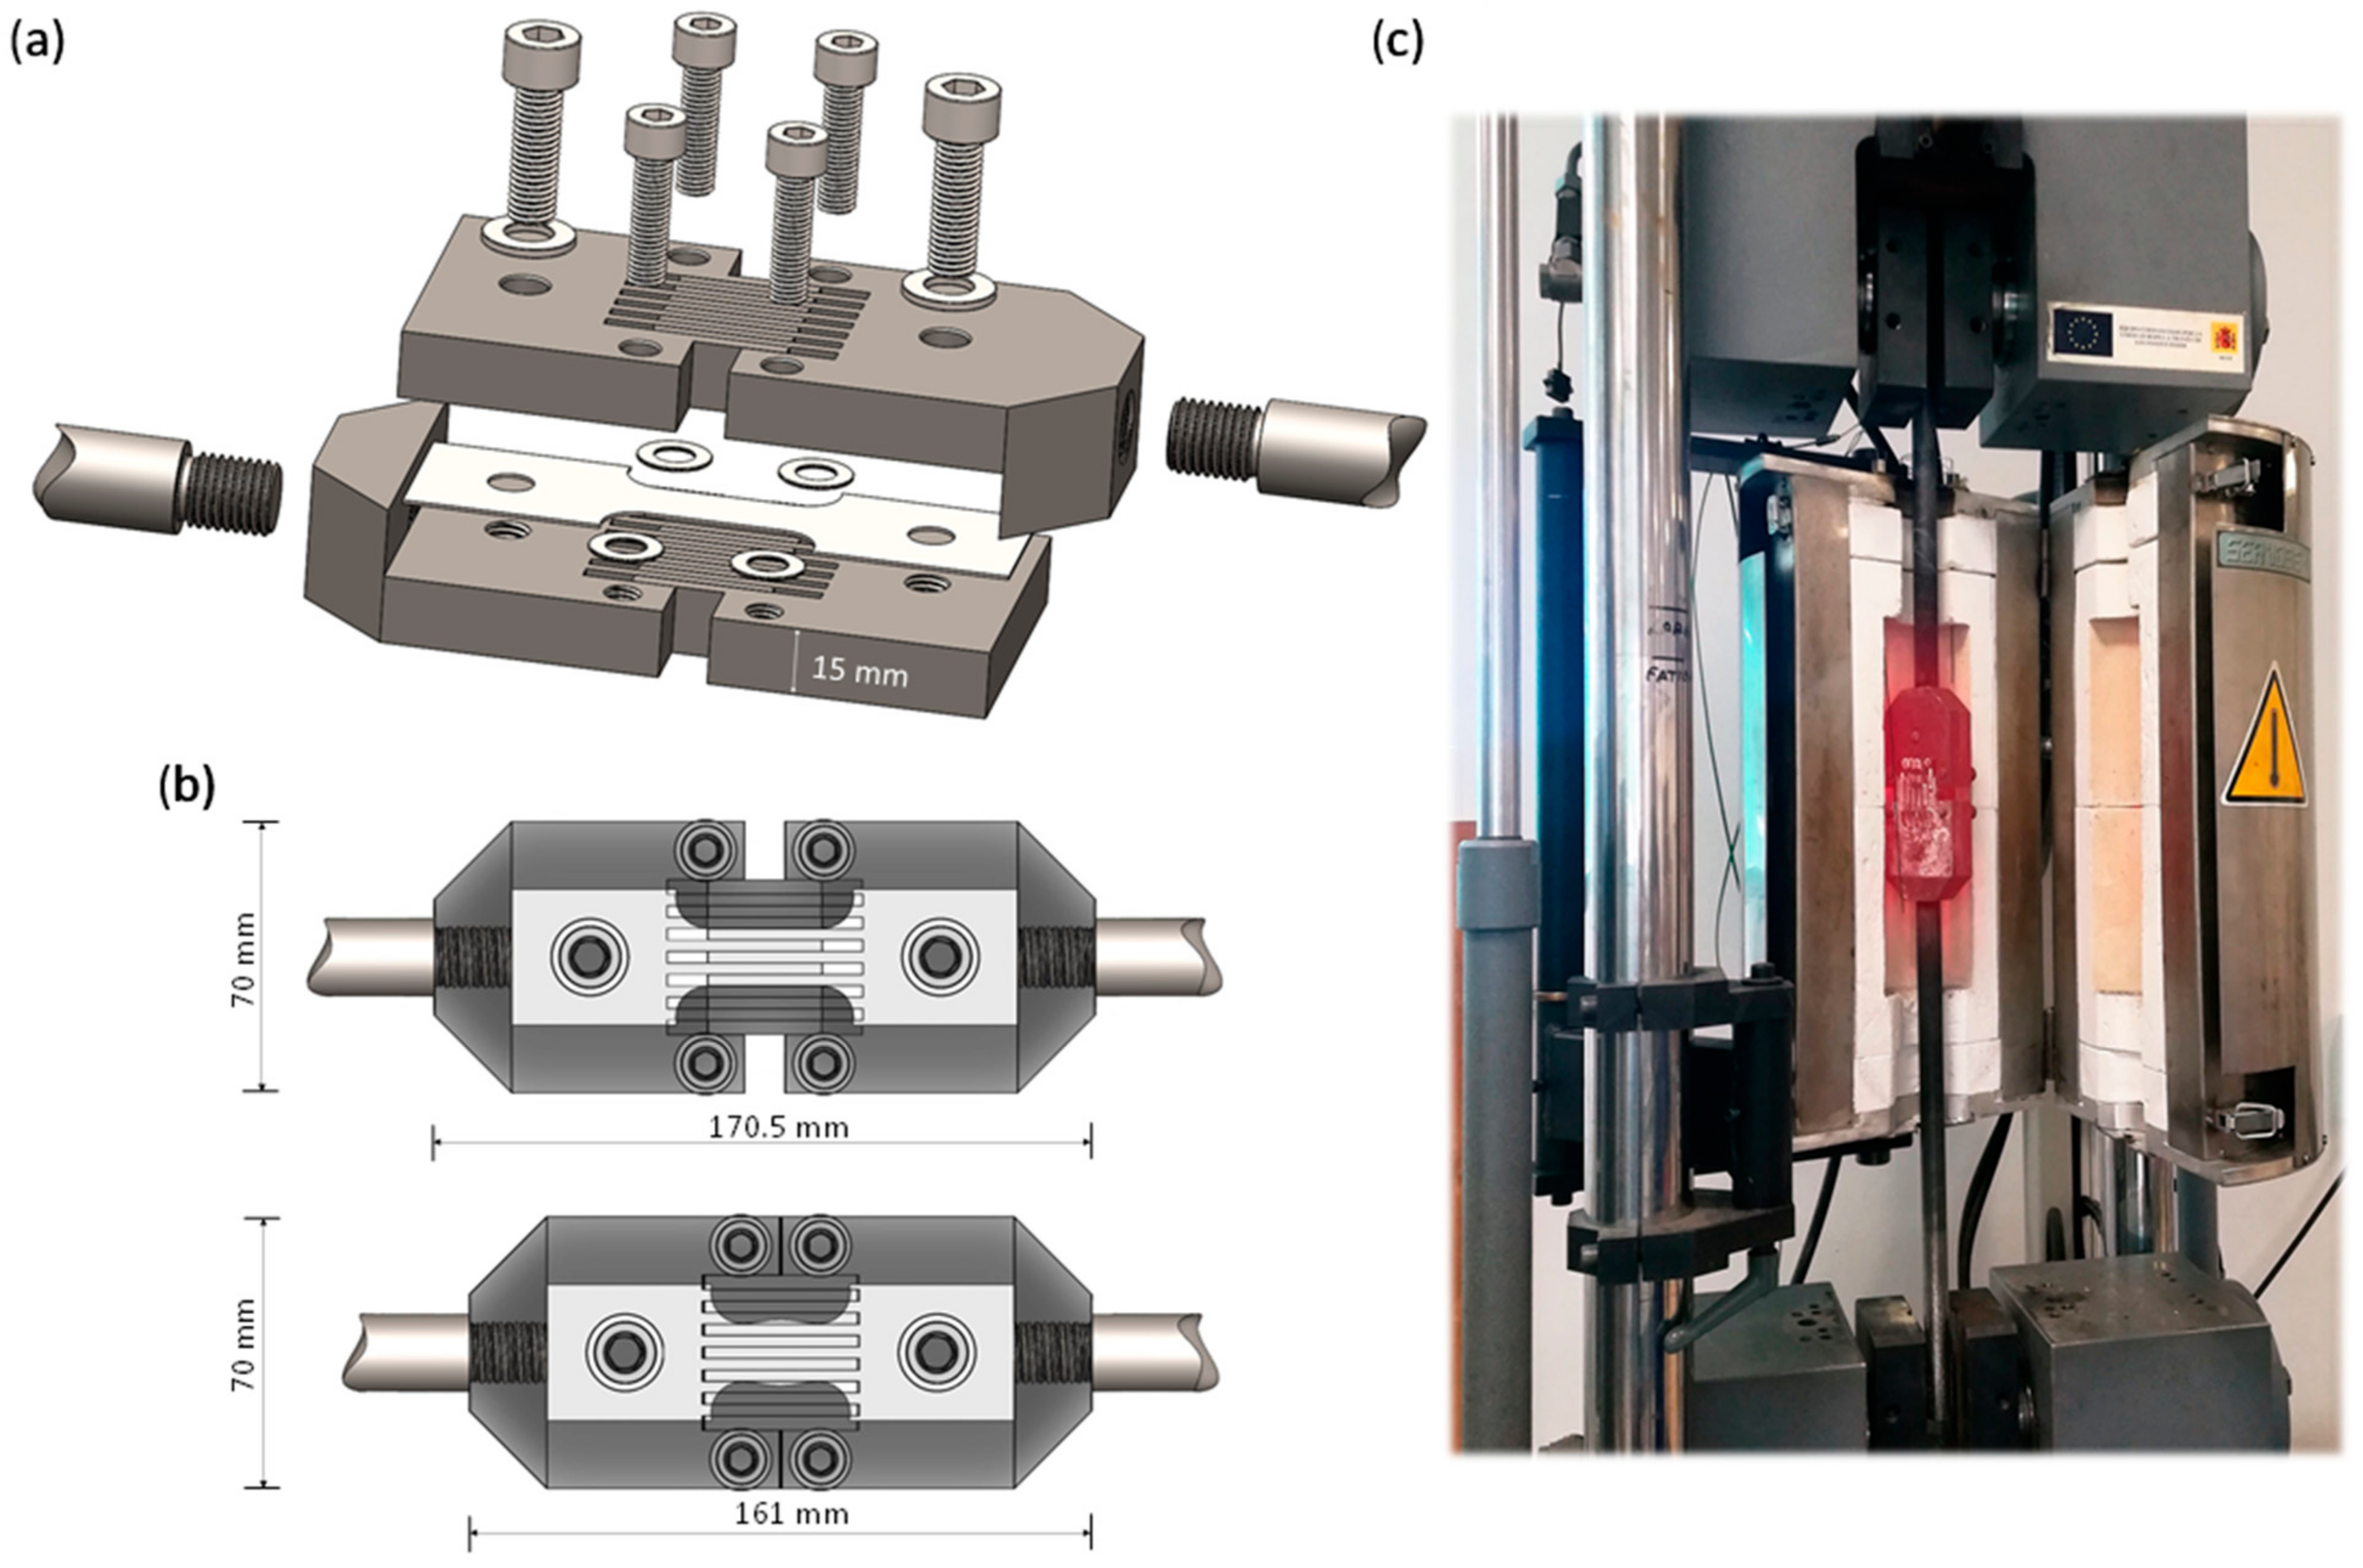
2.3. Compression Tests
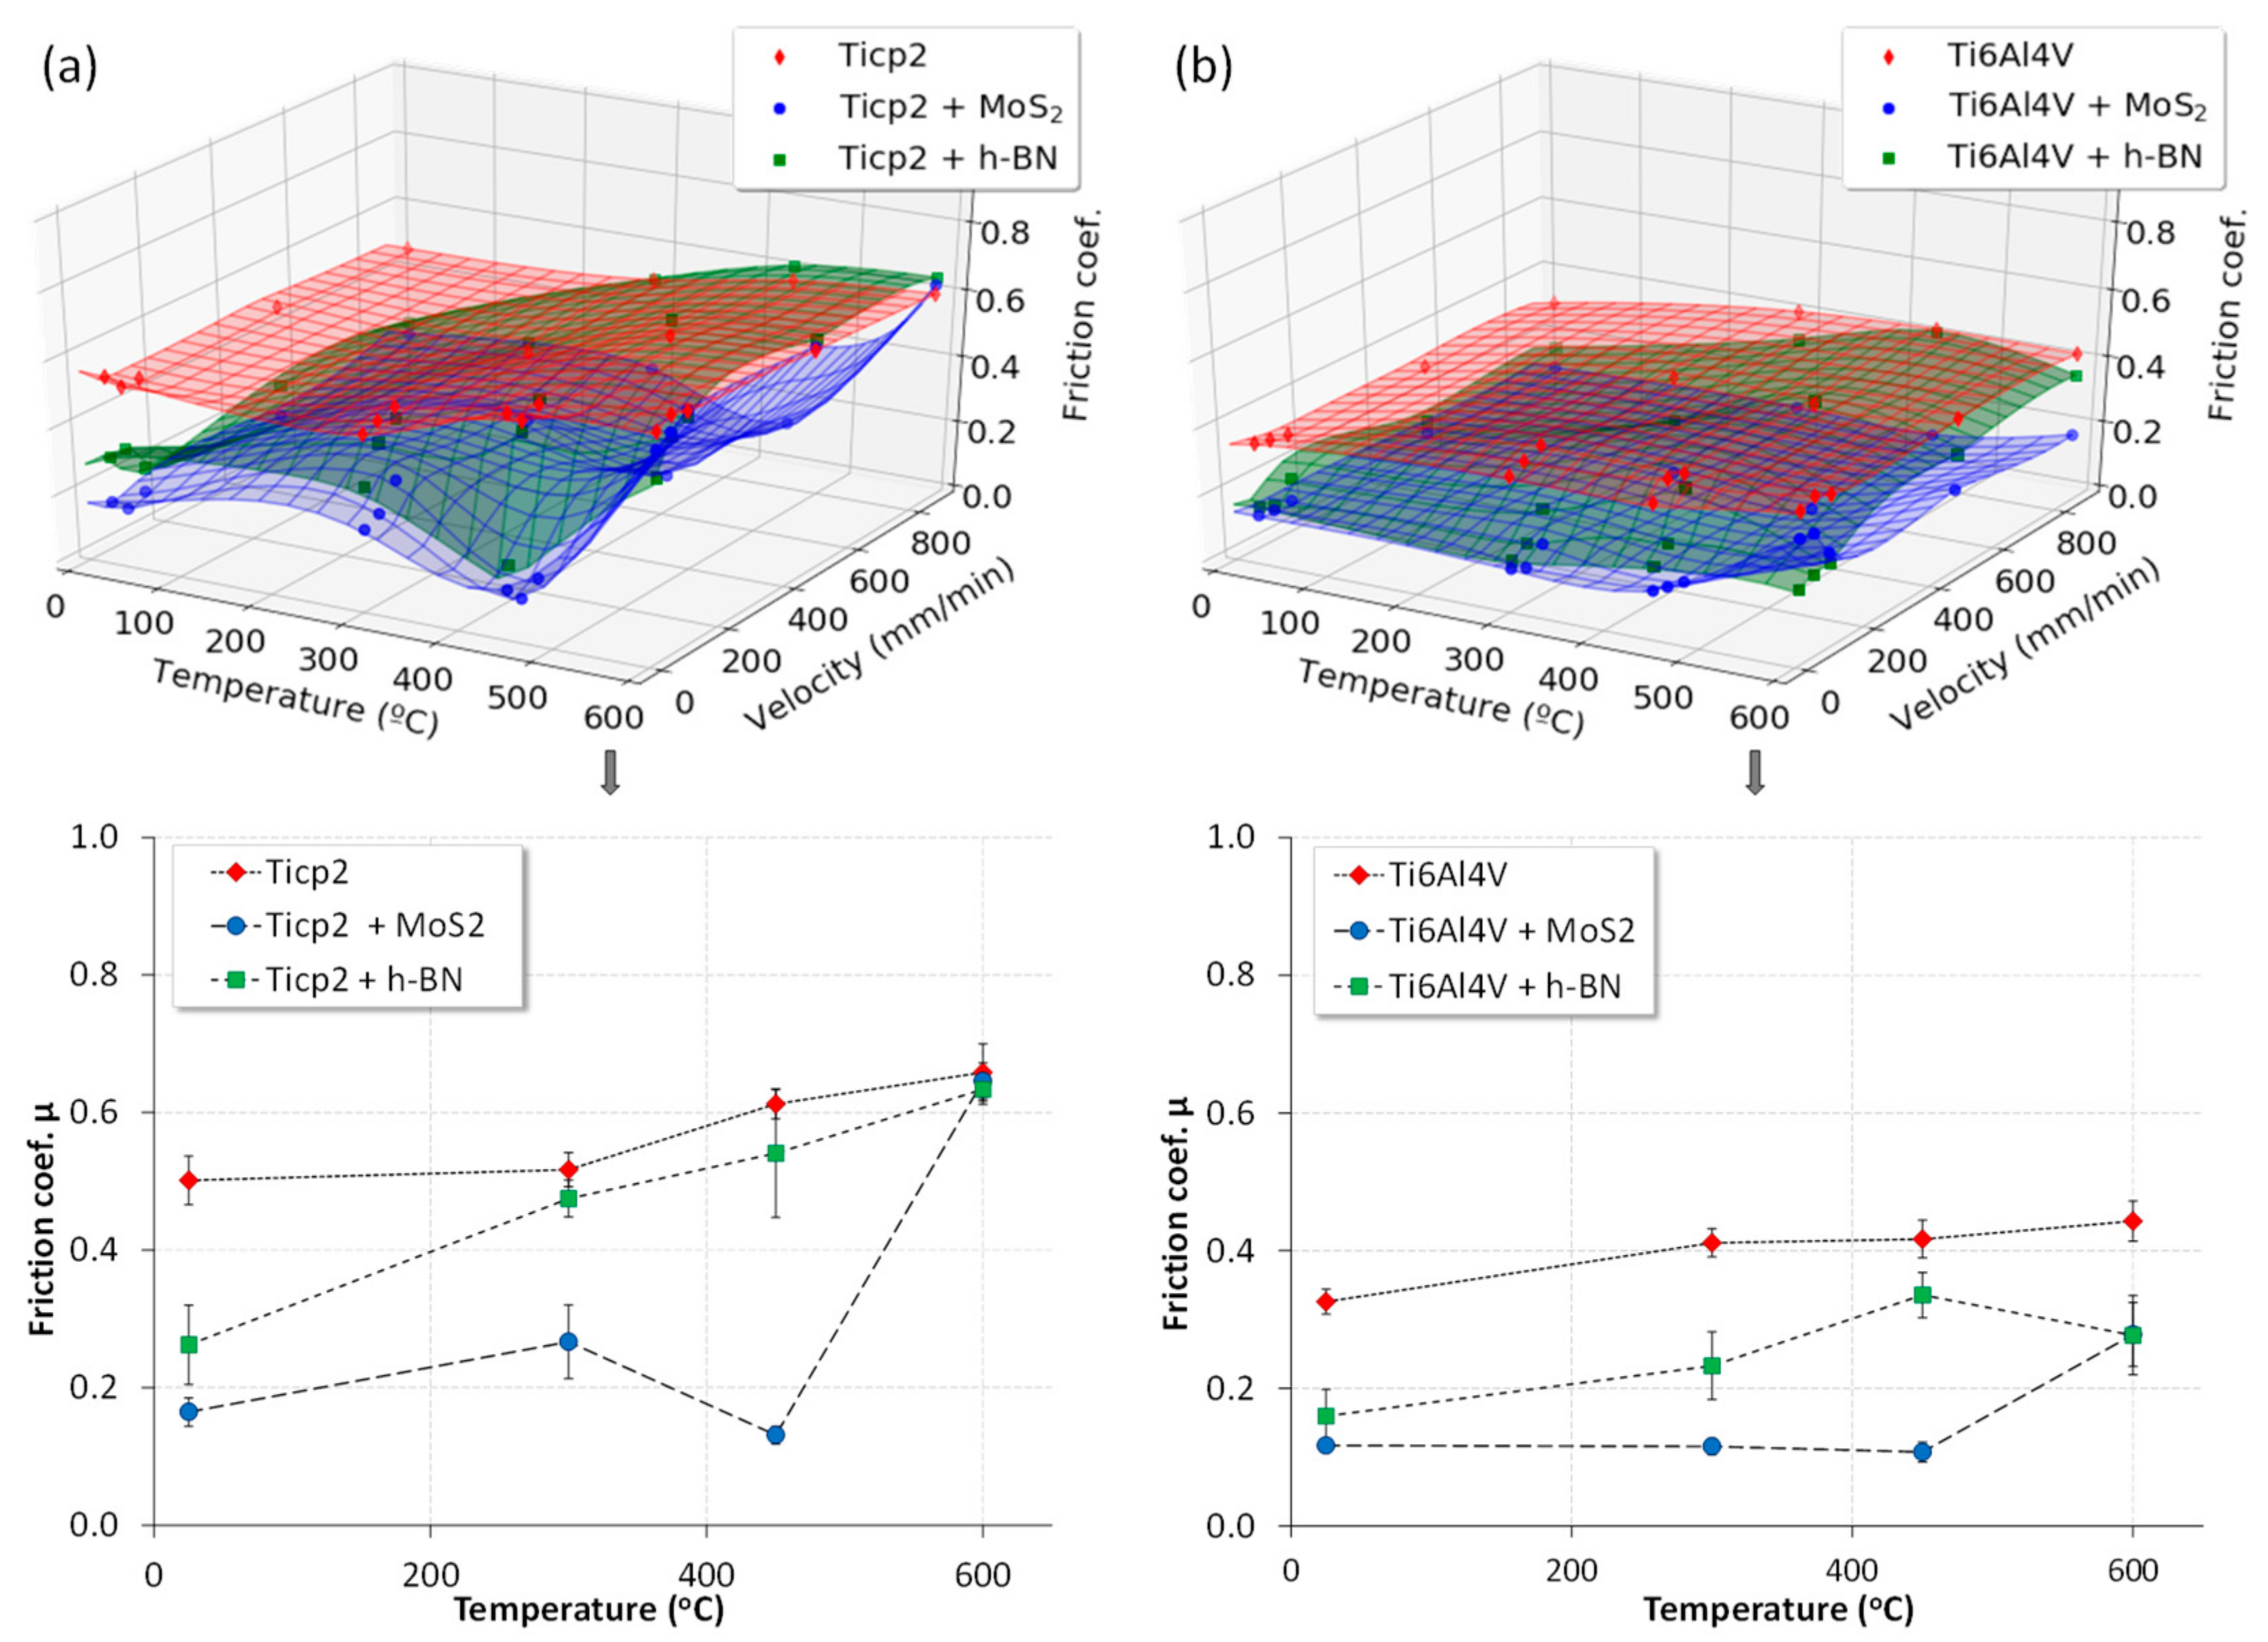
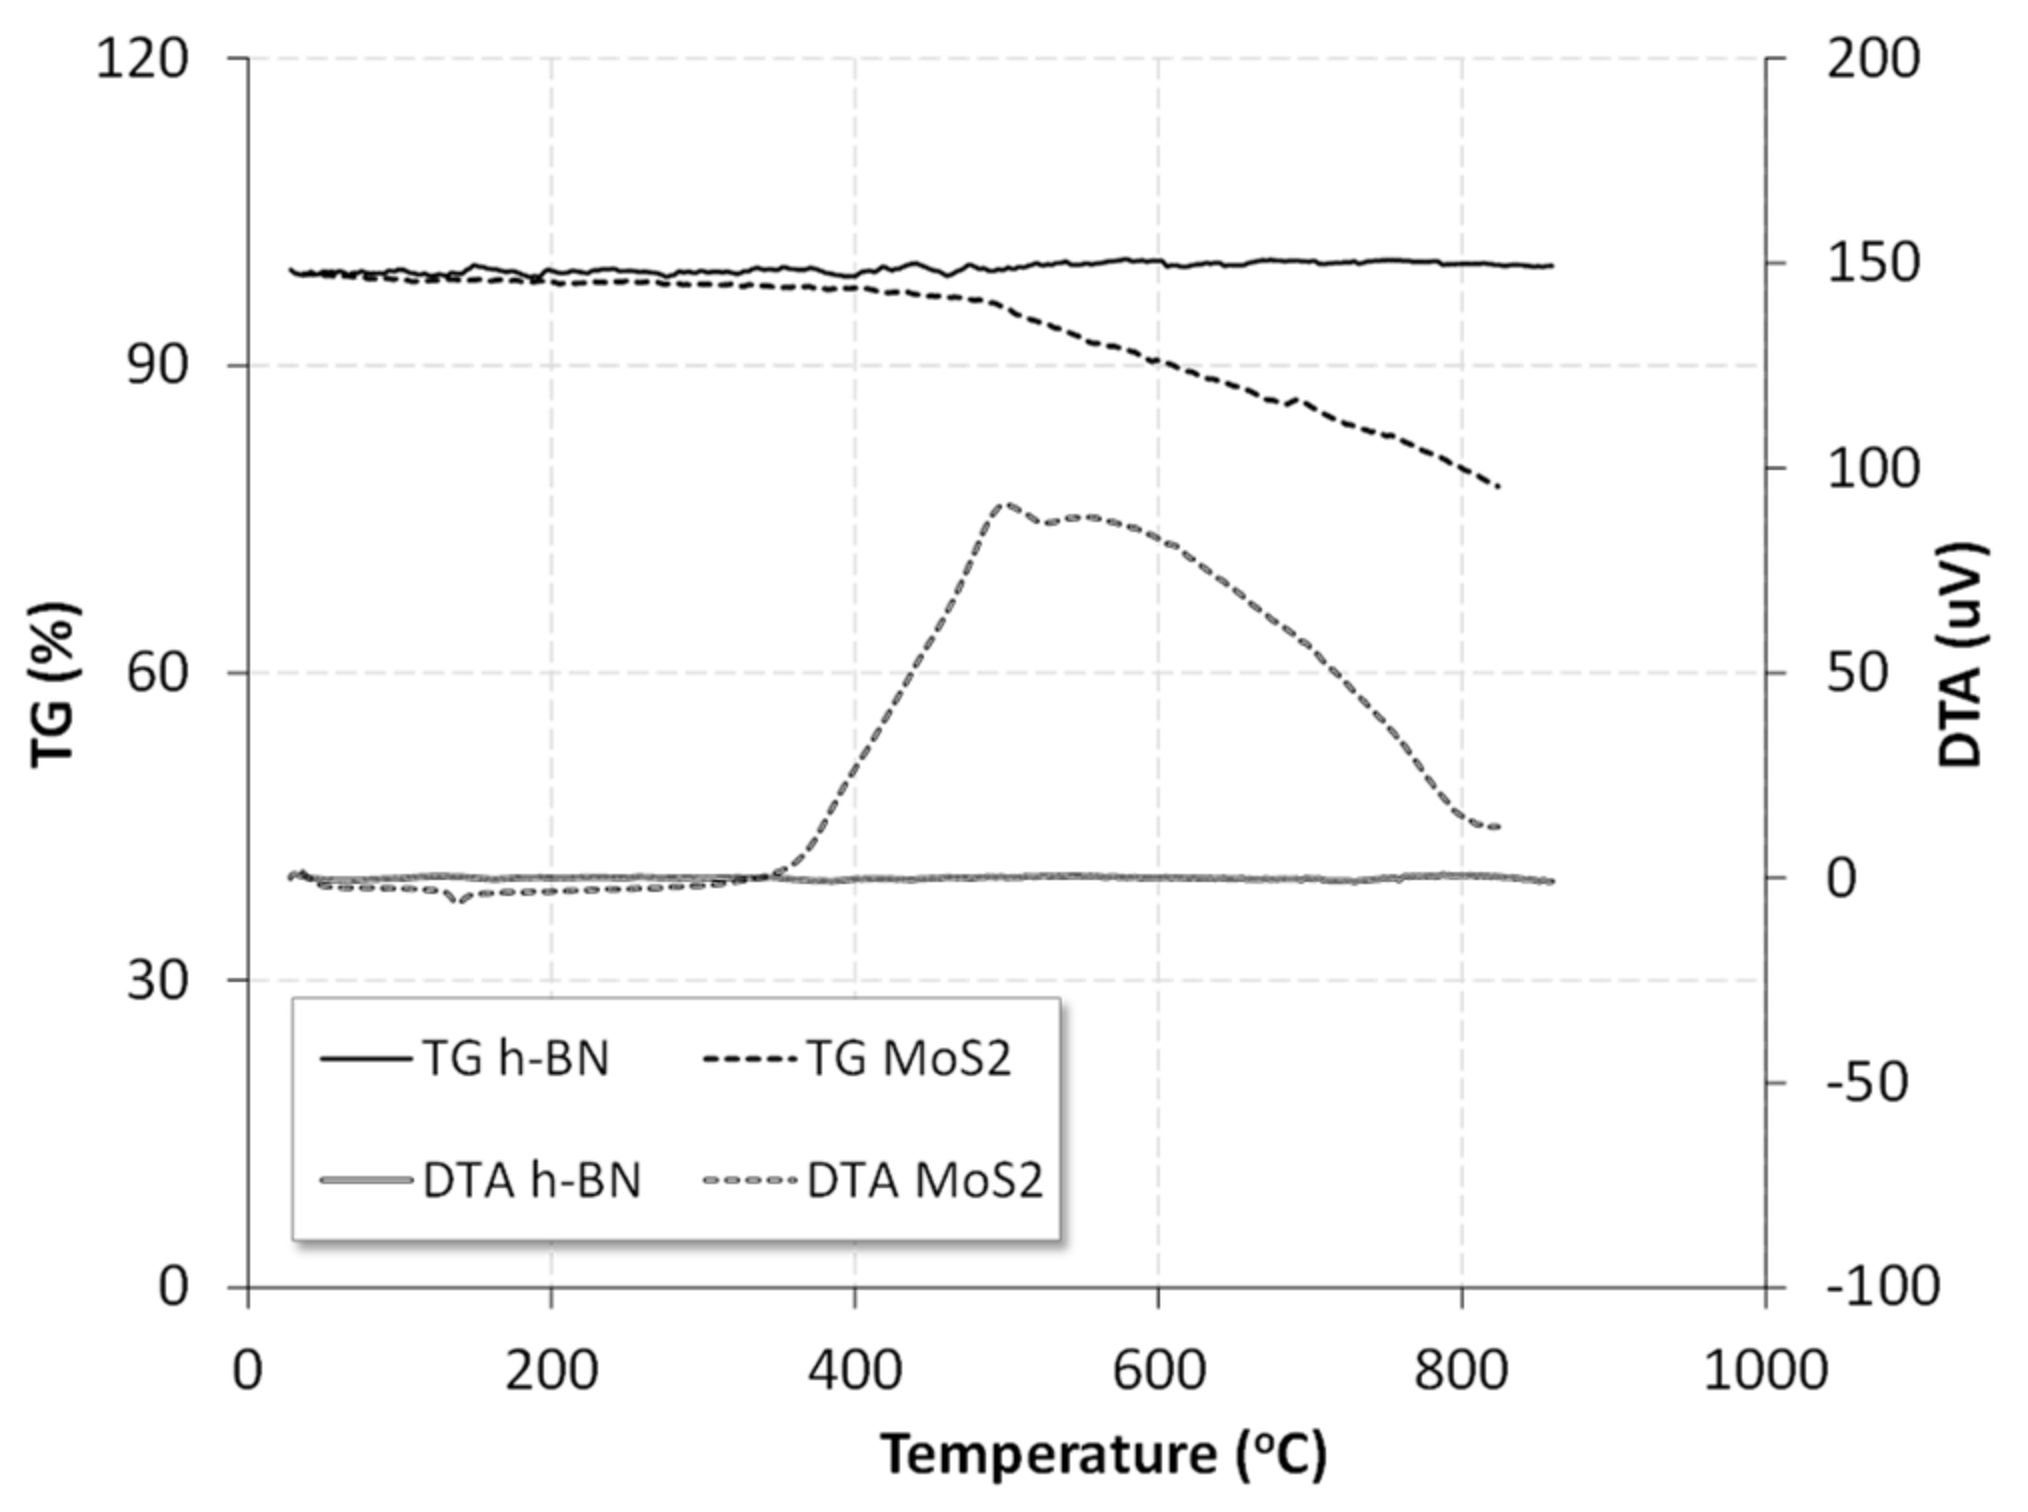
2.4. High-Temperature Lubricant Selection
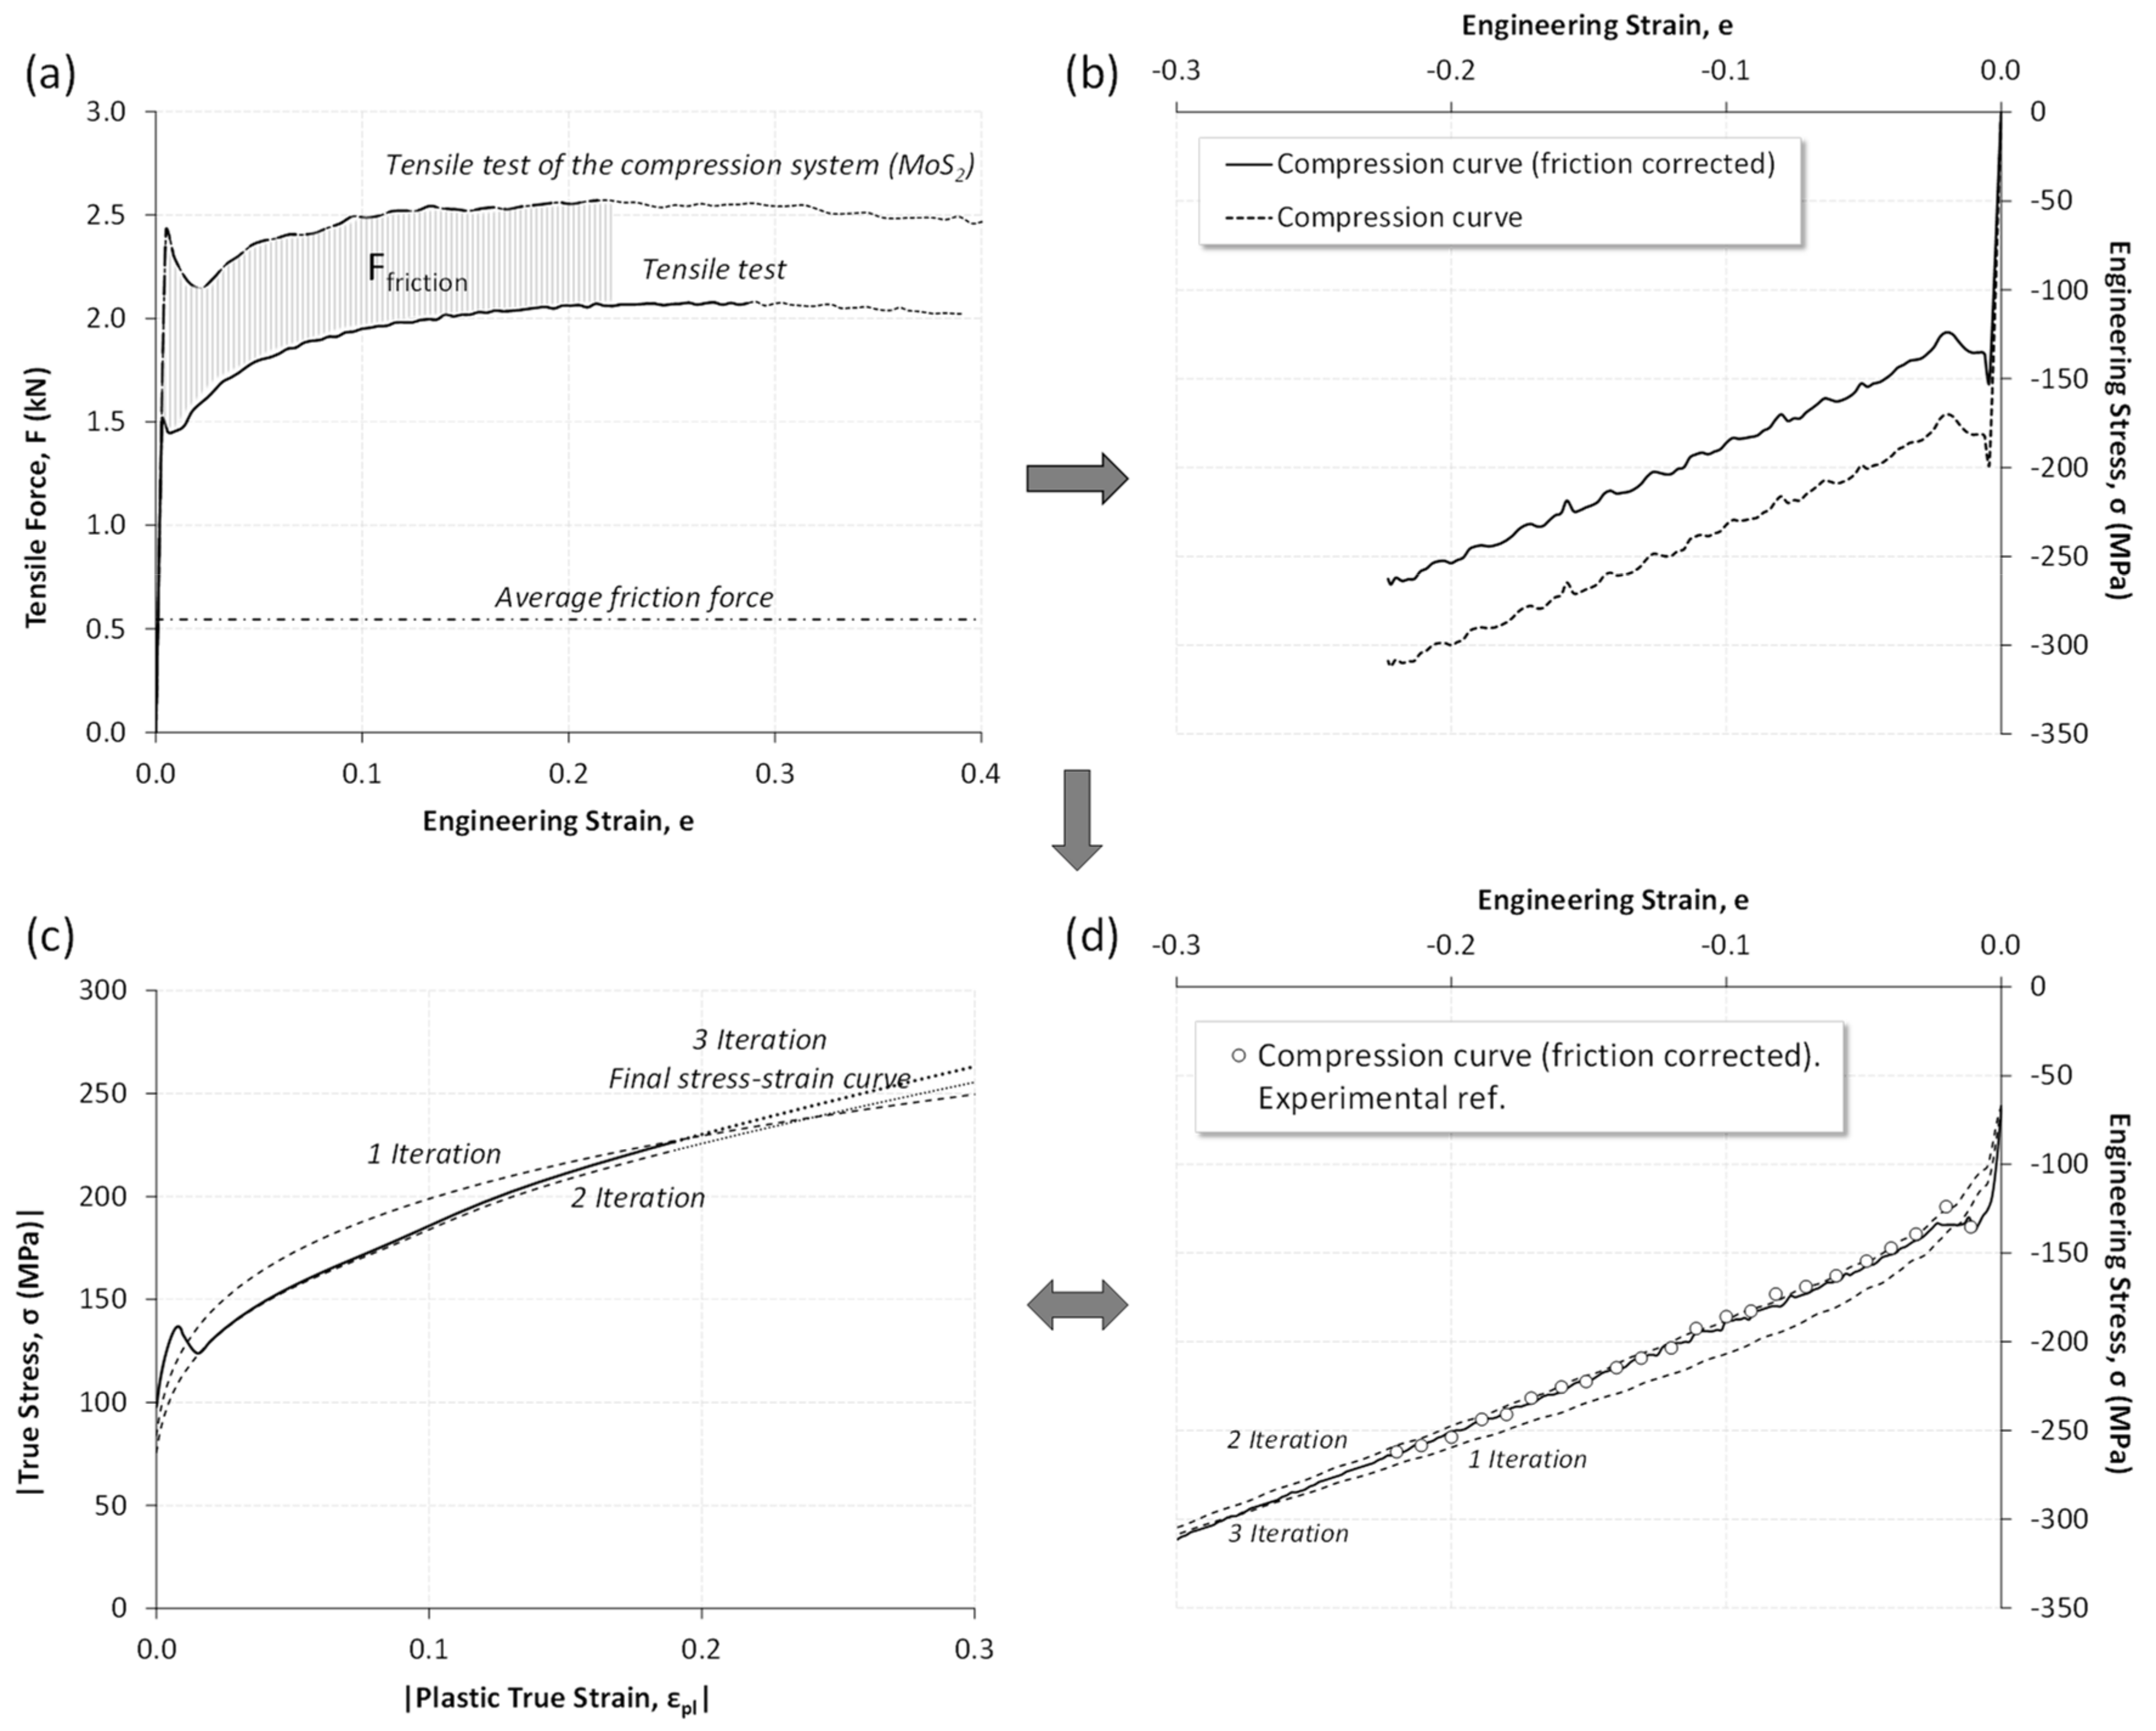
2.5. Evaluation of the Friction Component in Compression Tests
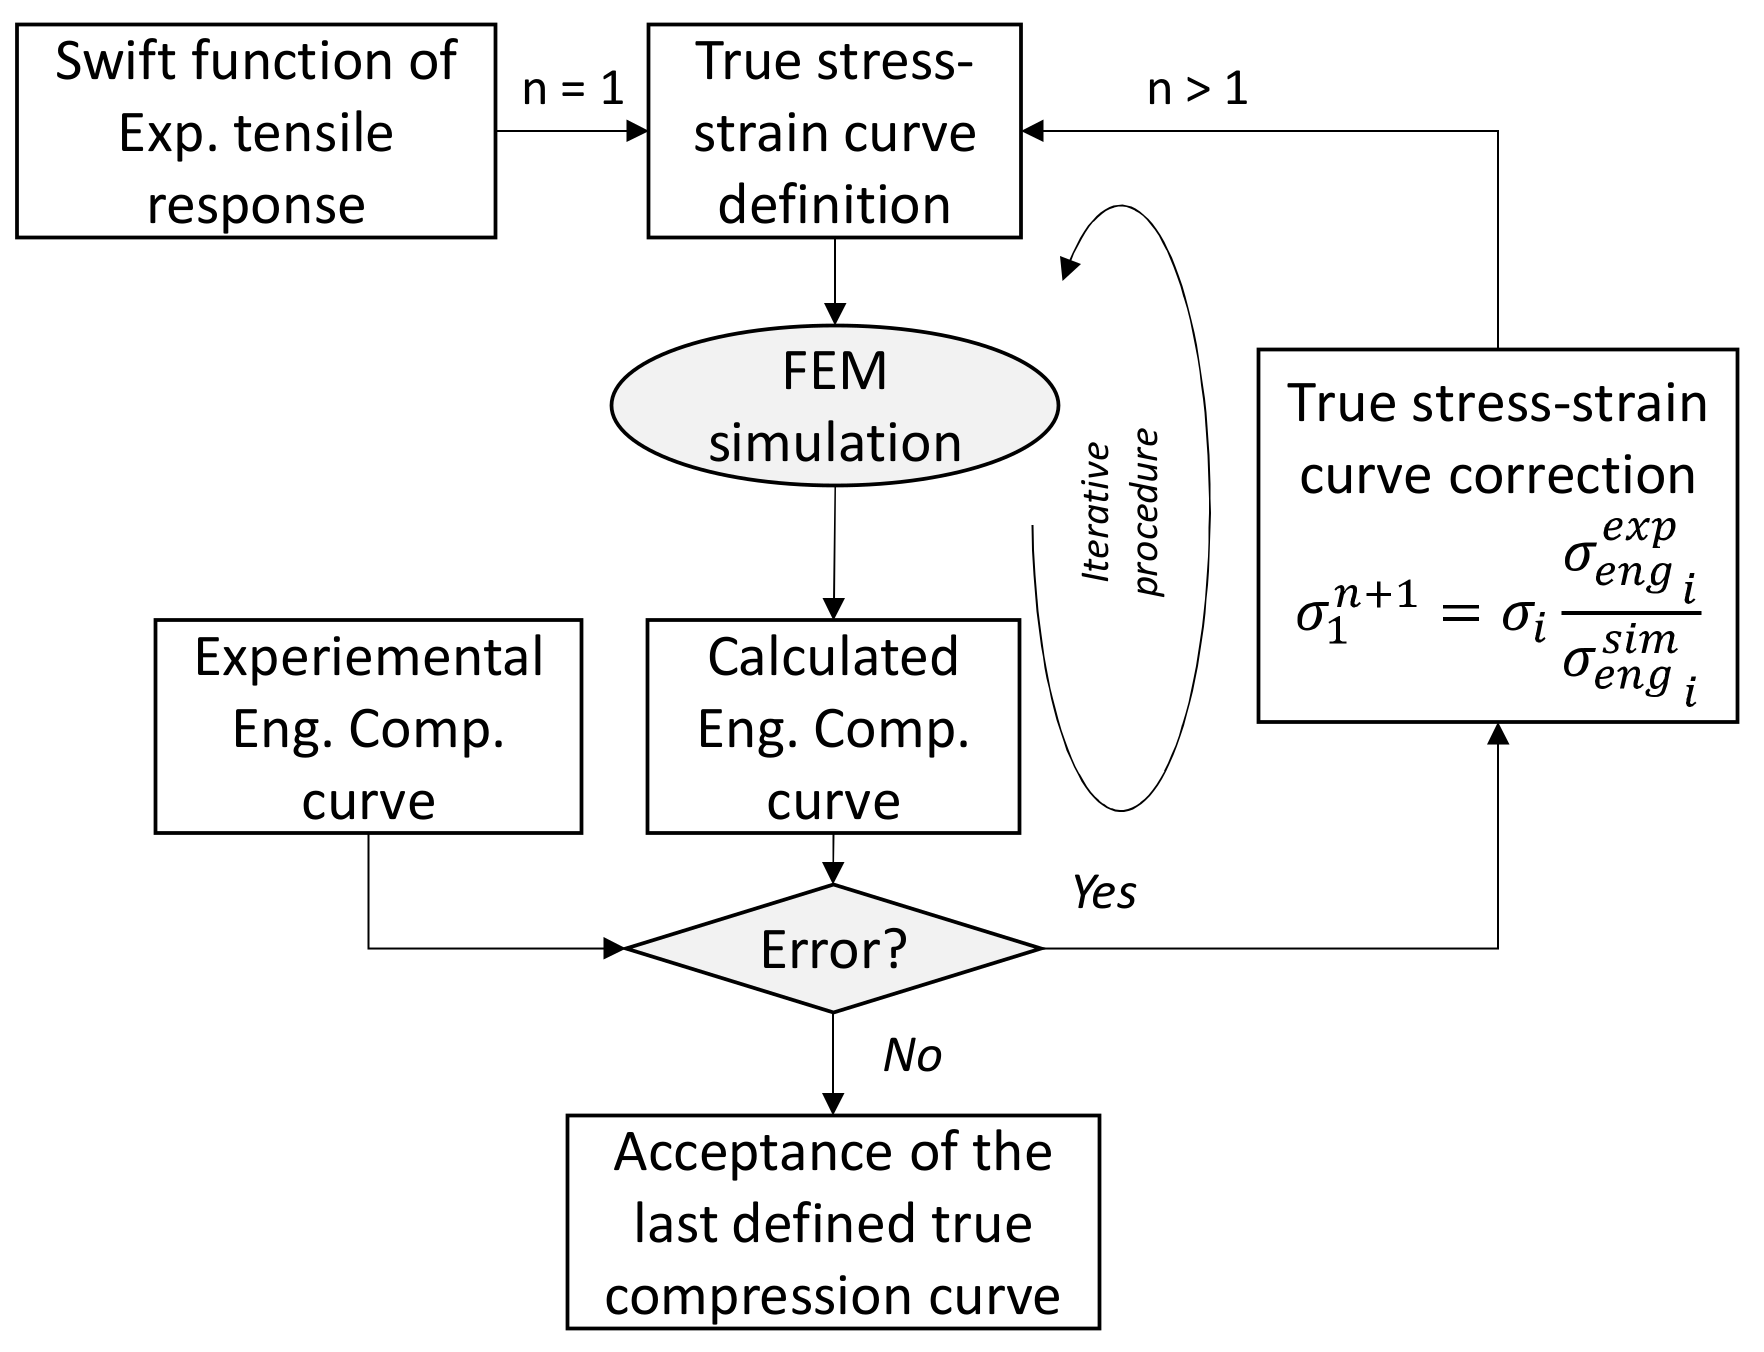
2.6. Determining the Compression True Stress–Strain Behavior
3. Results and Discussion
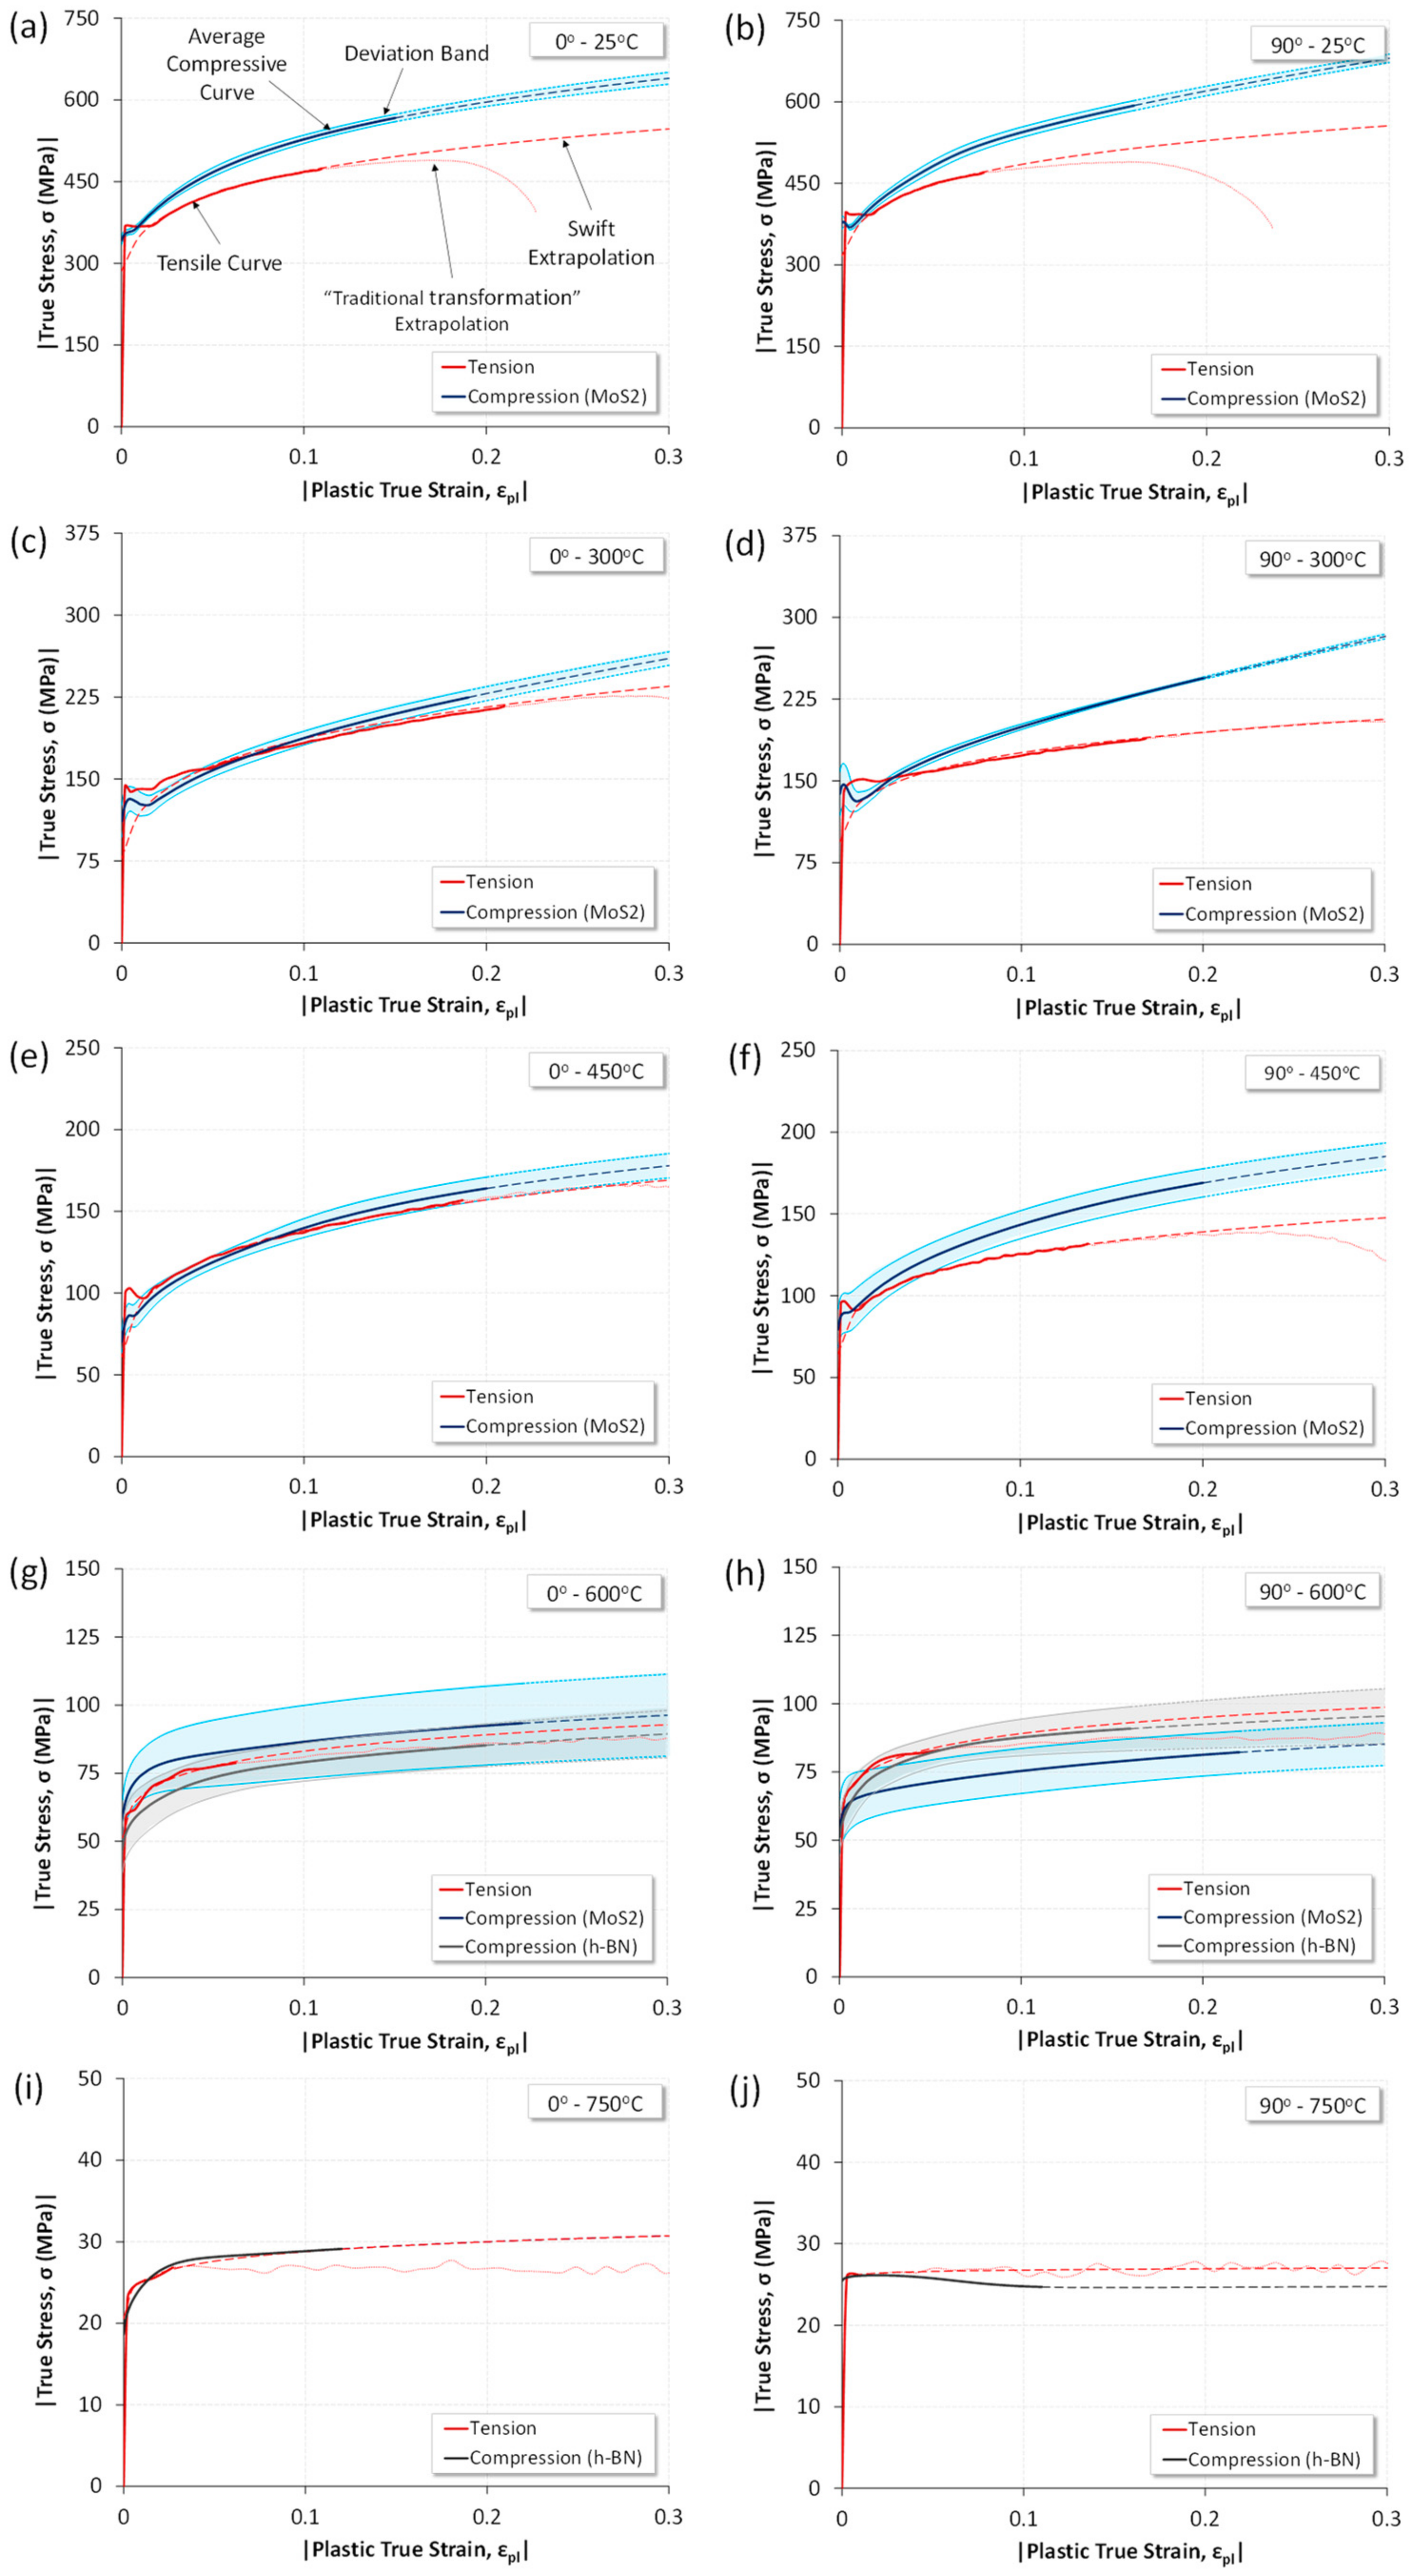
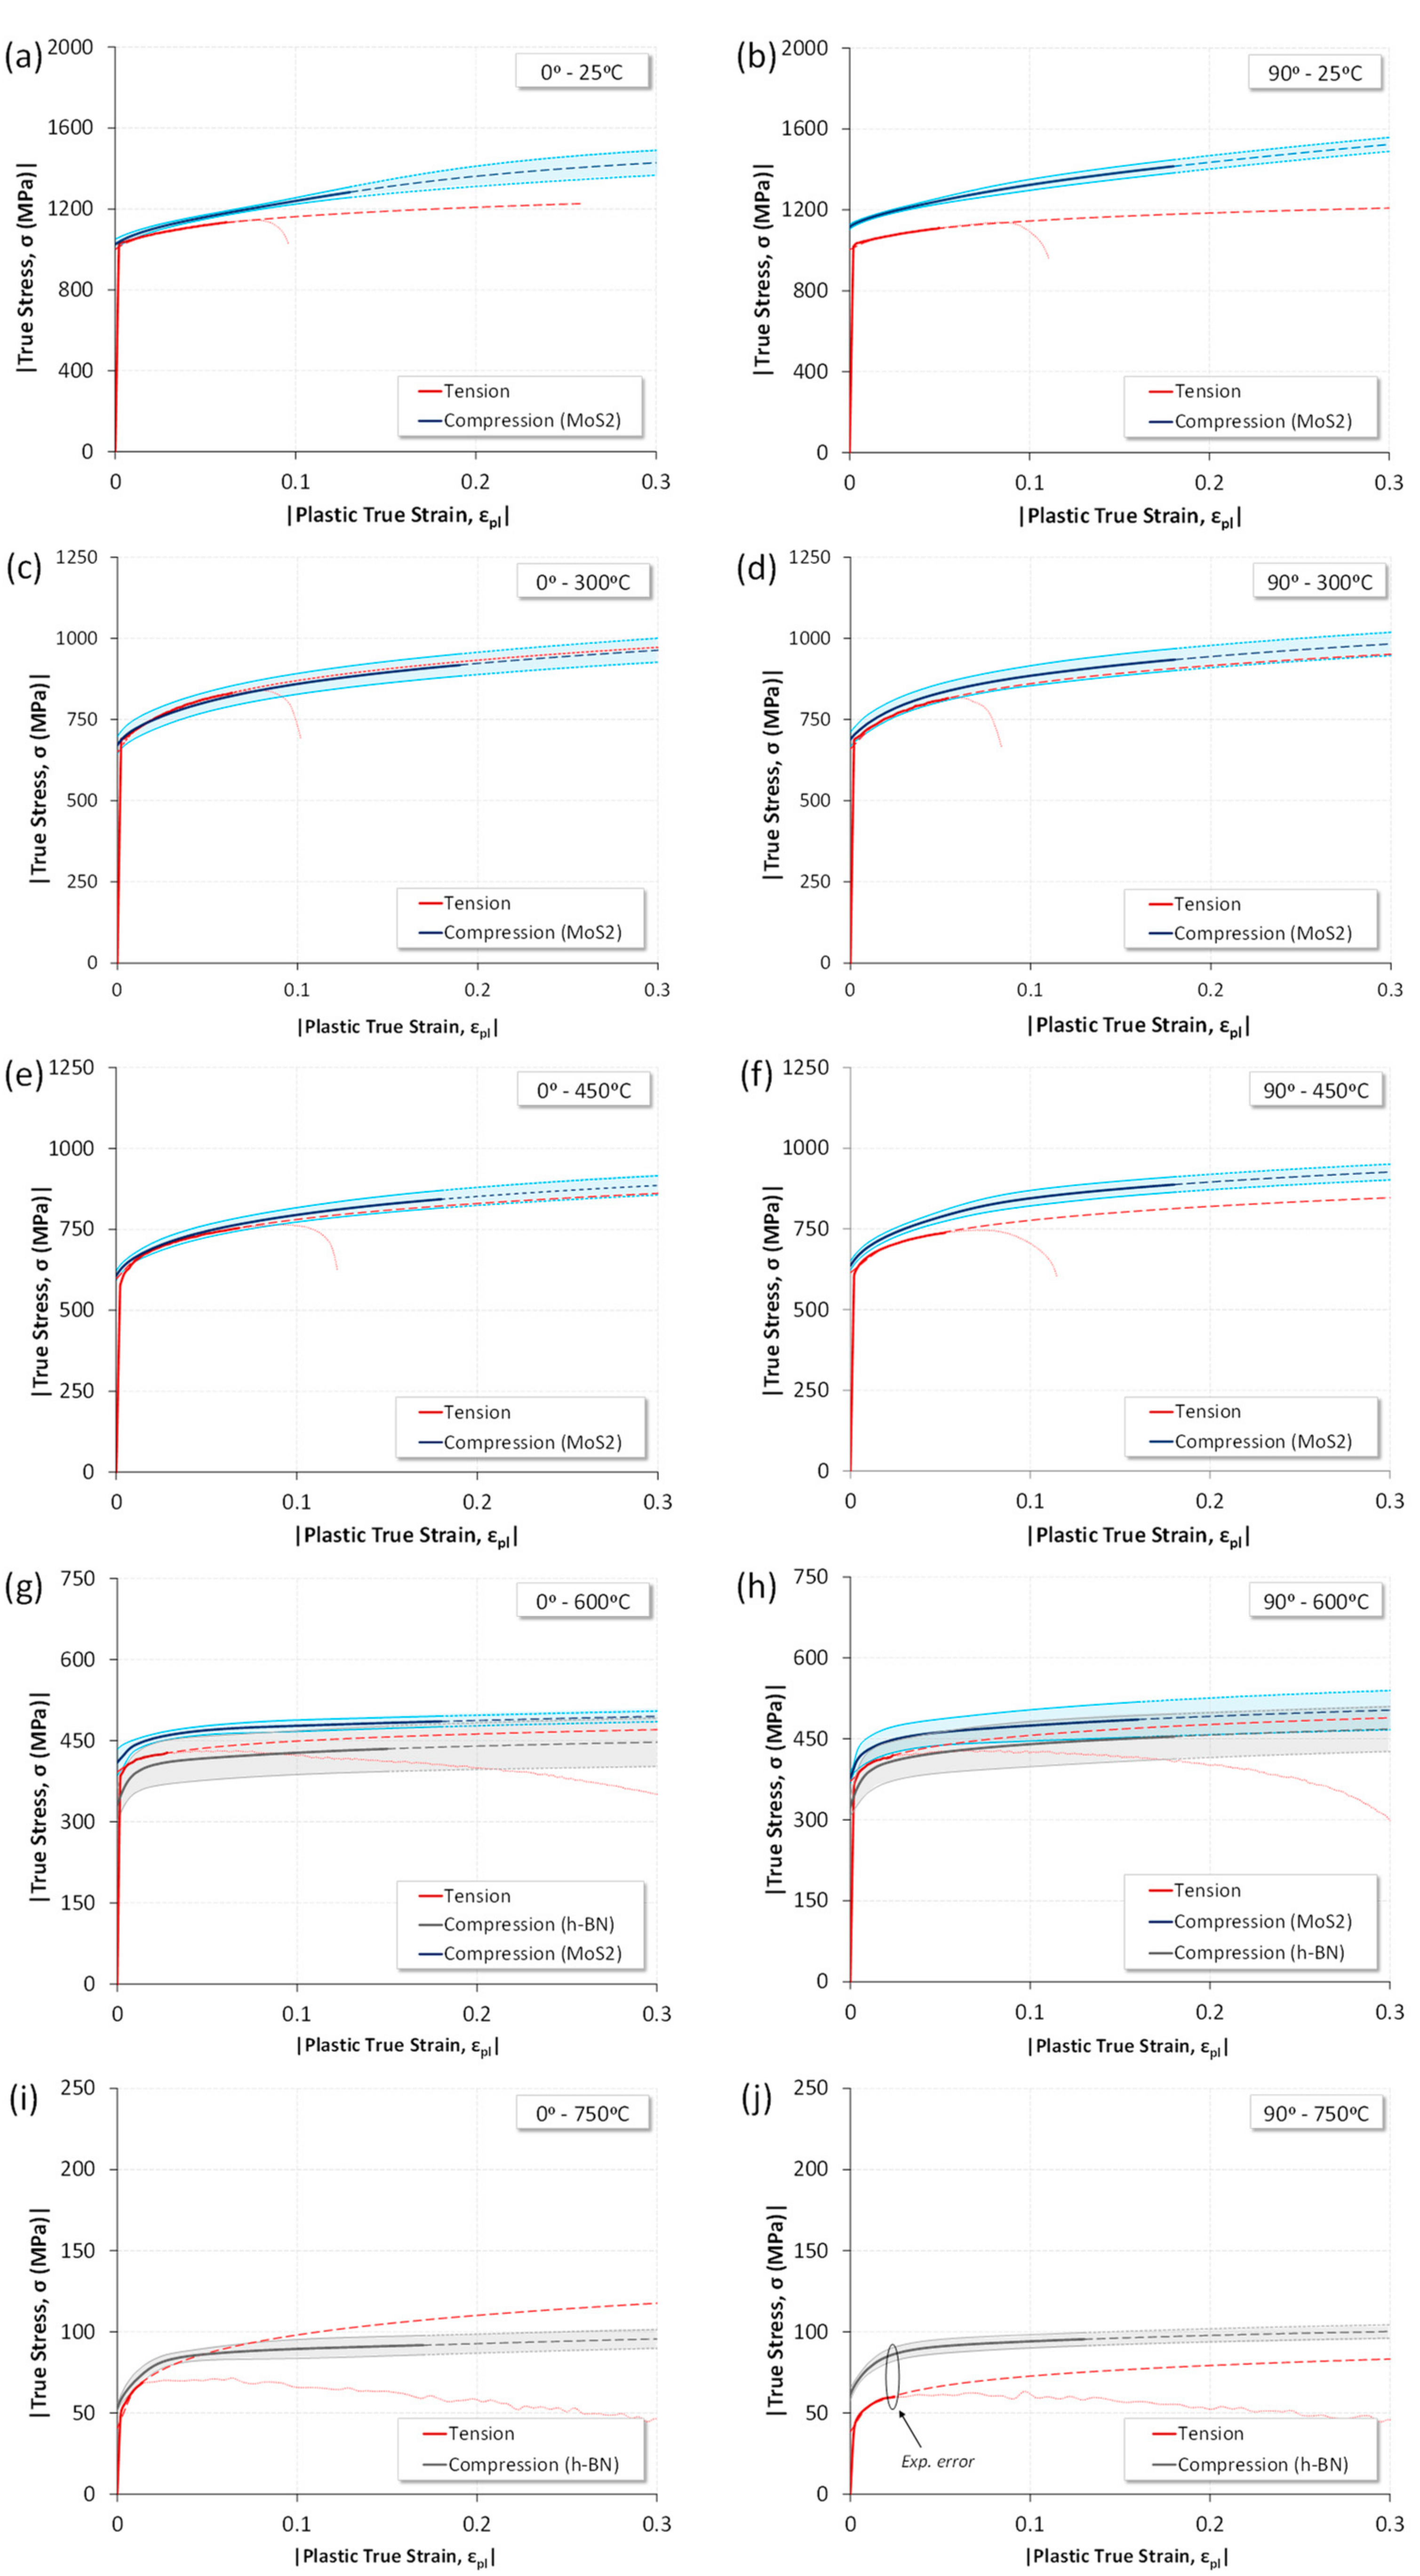
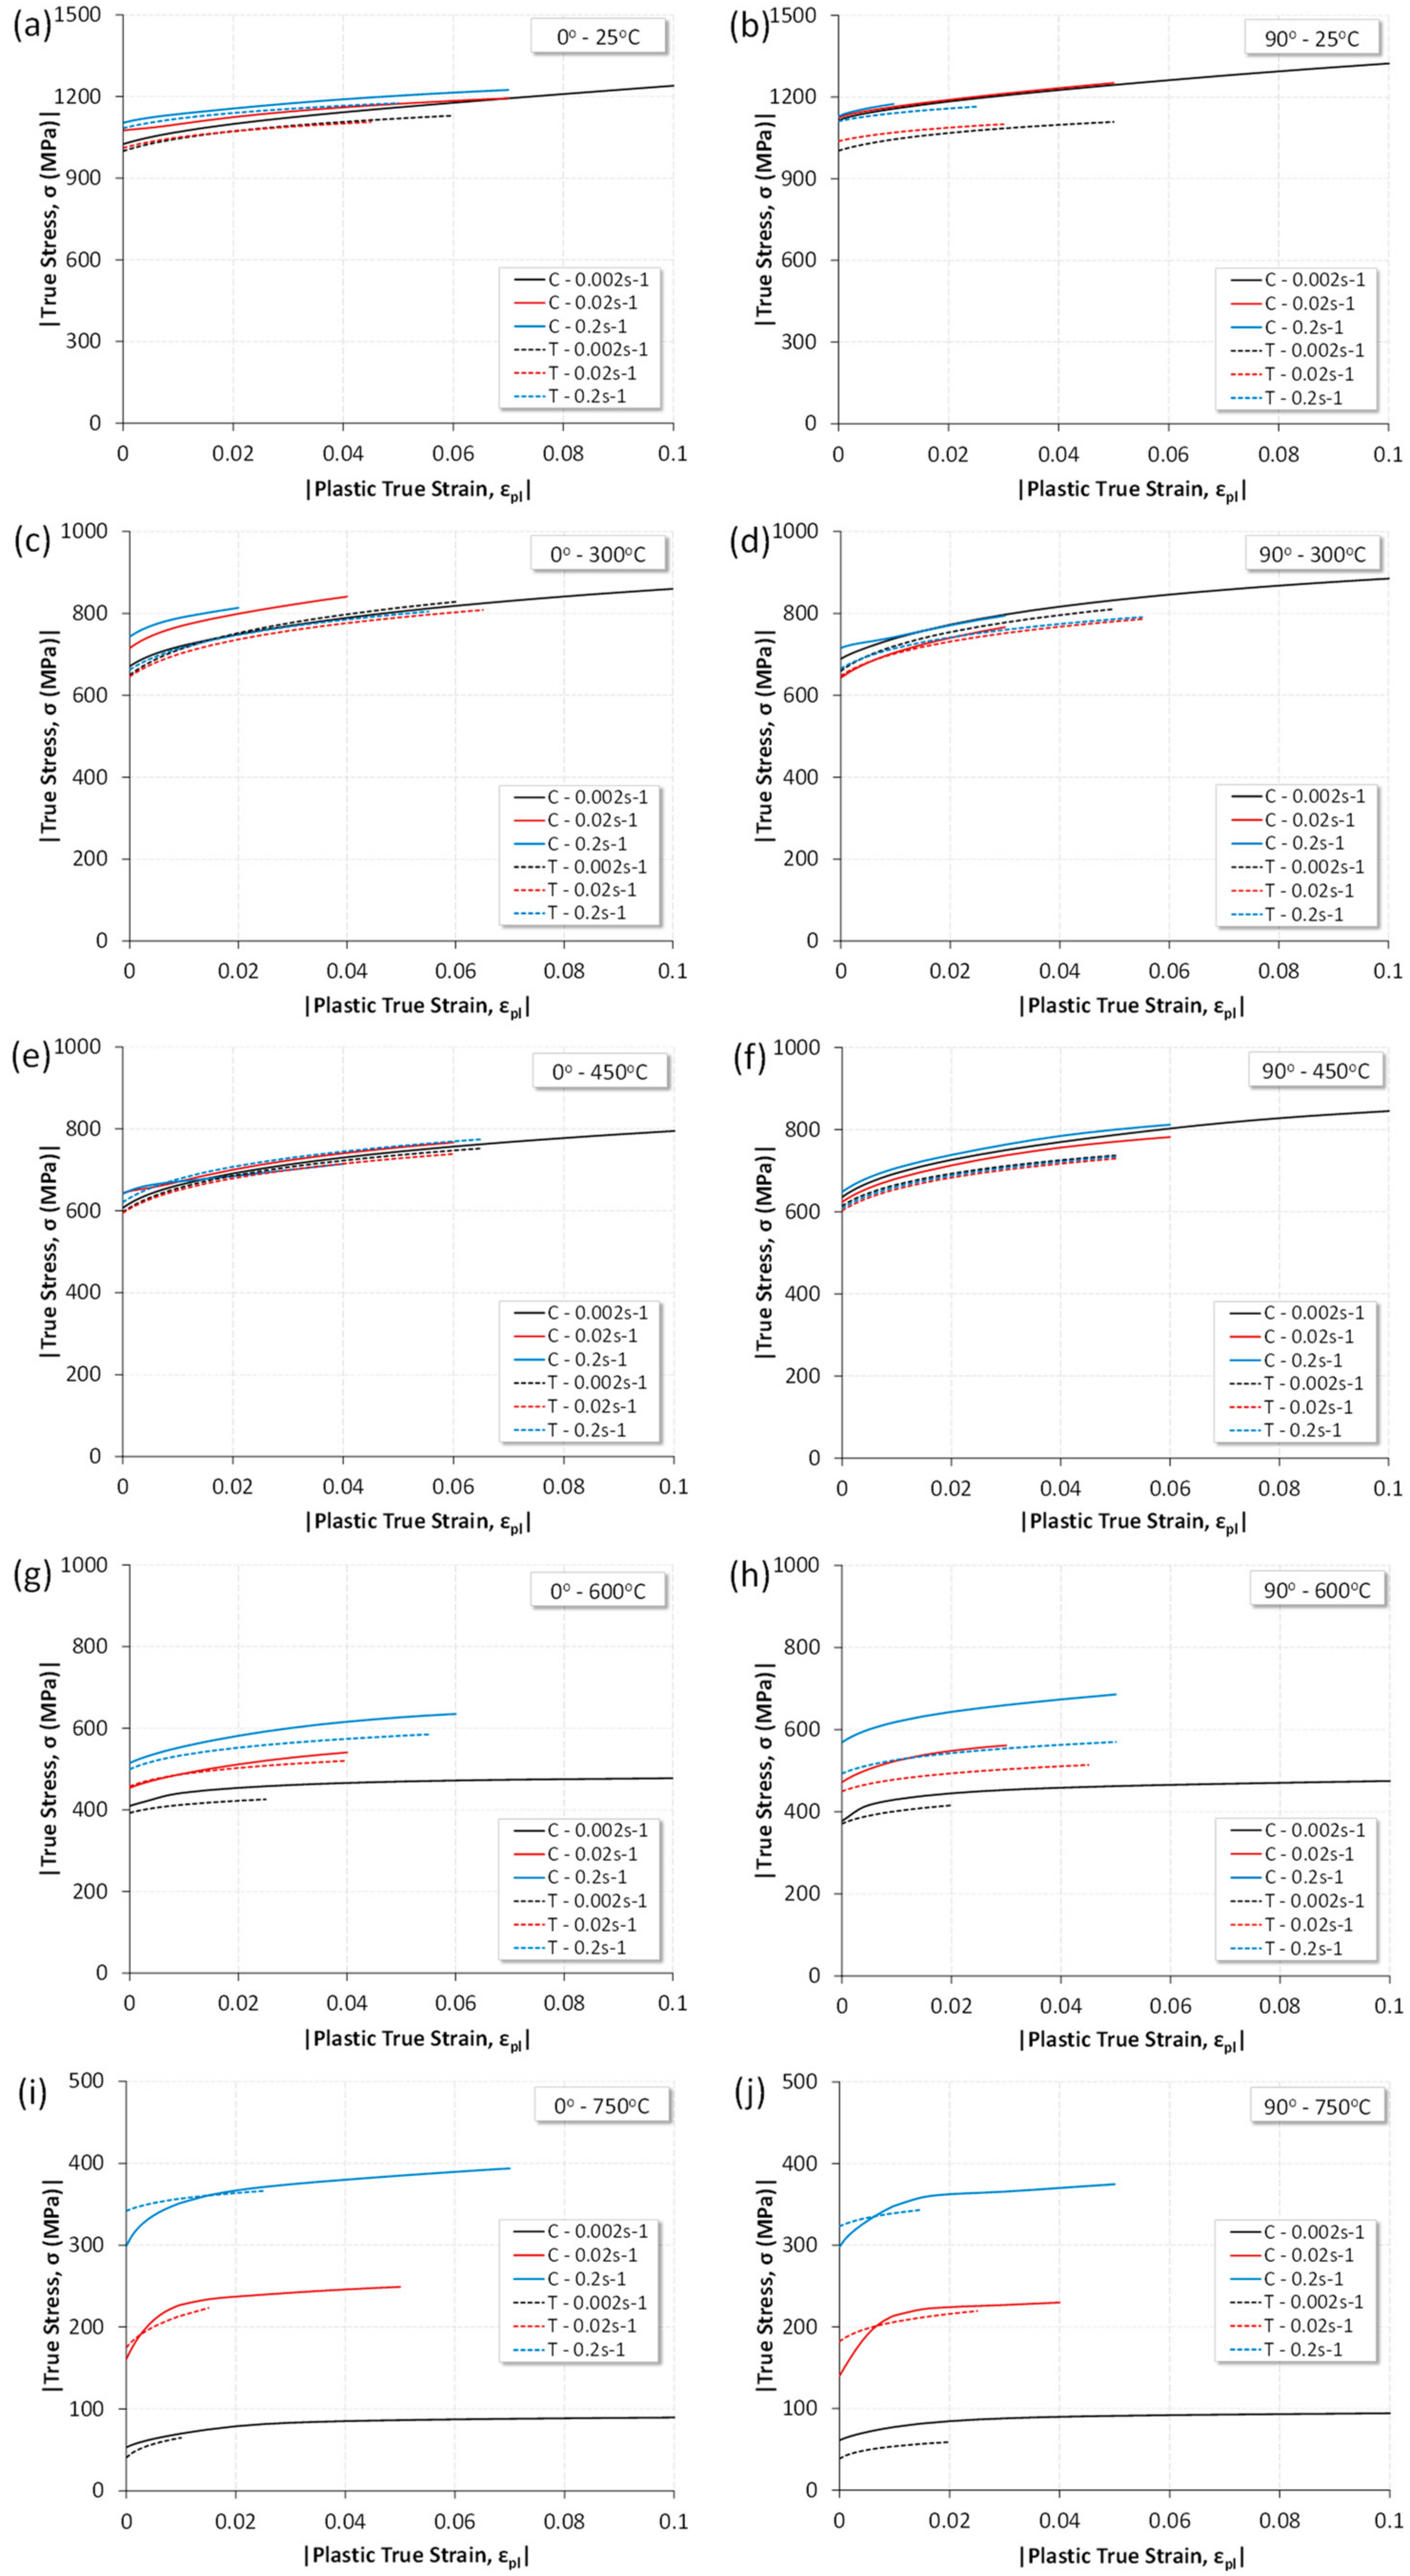
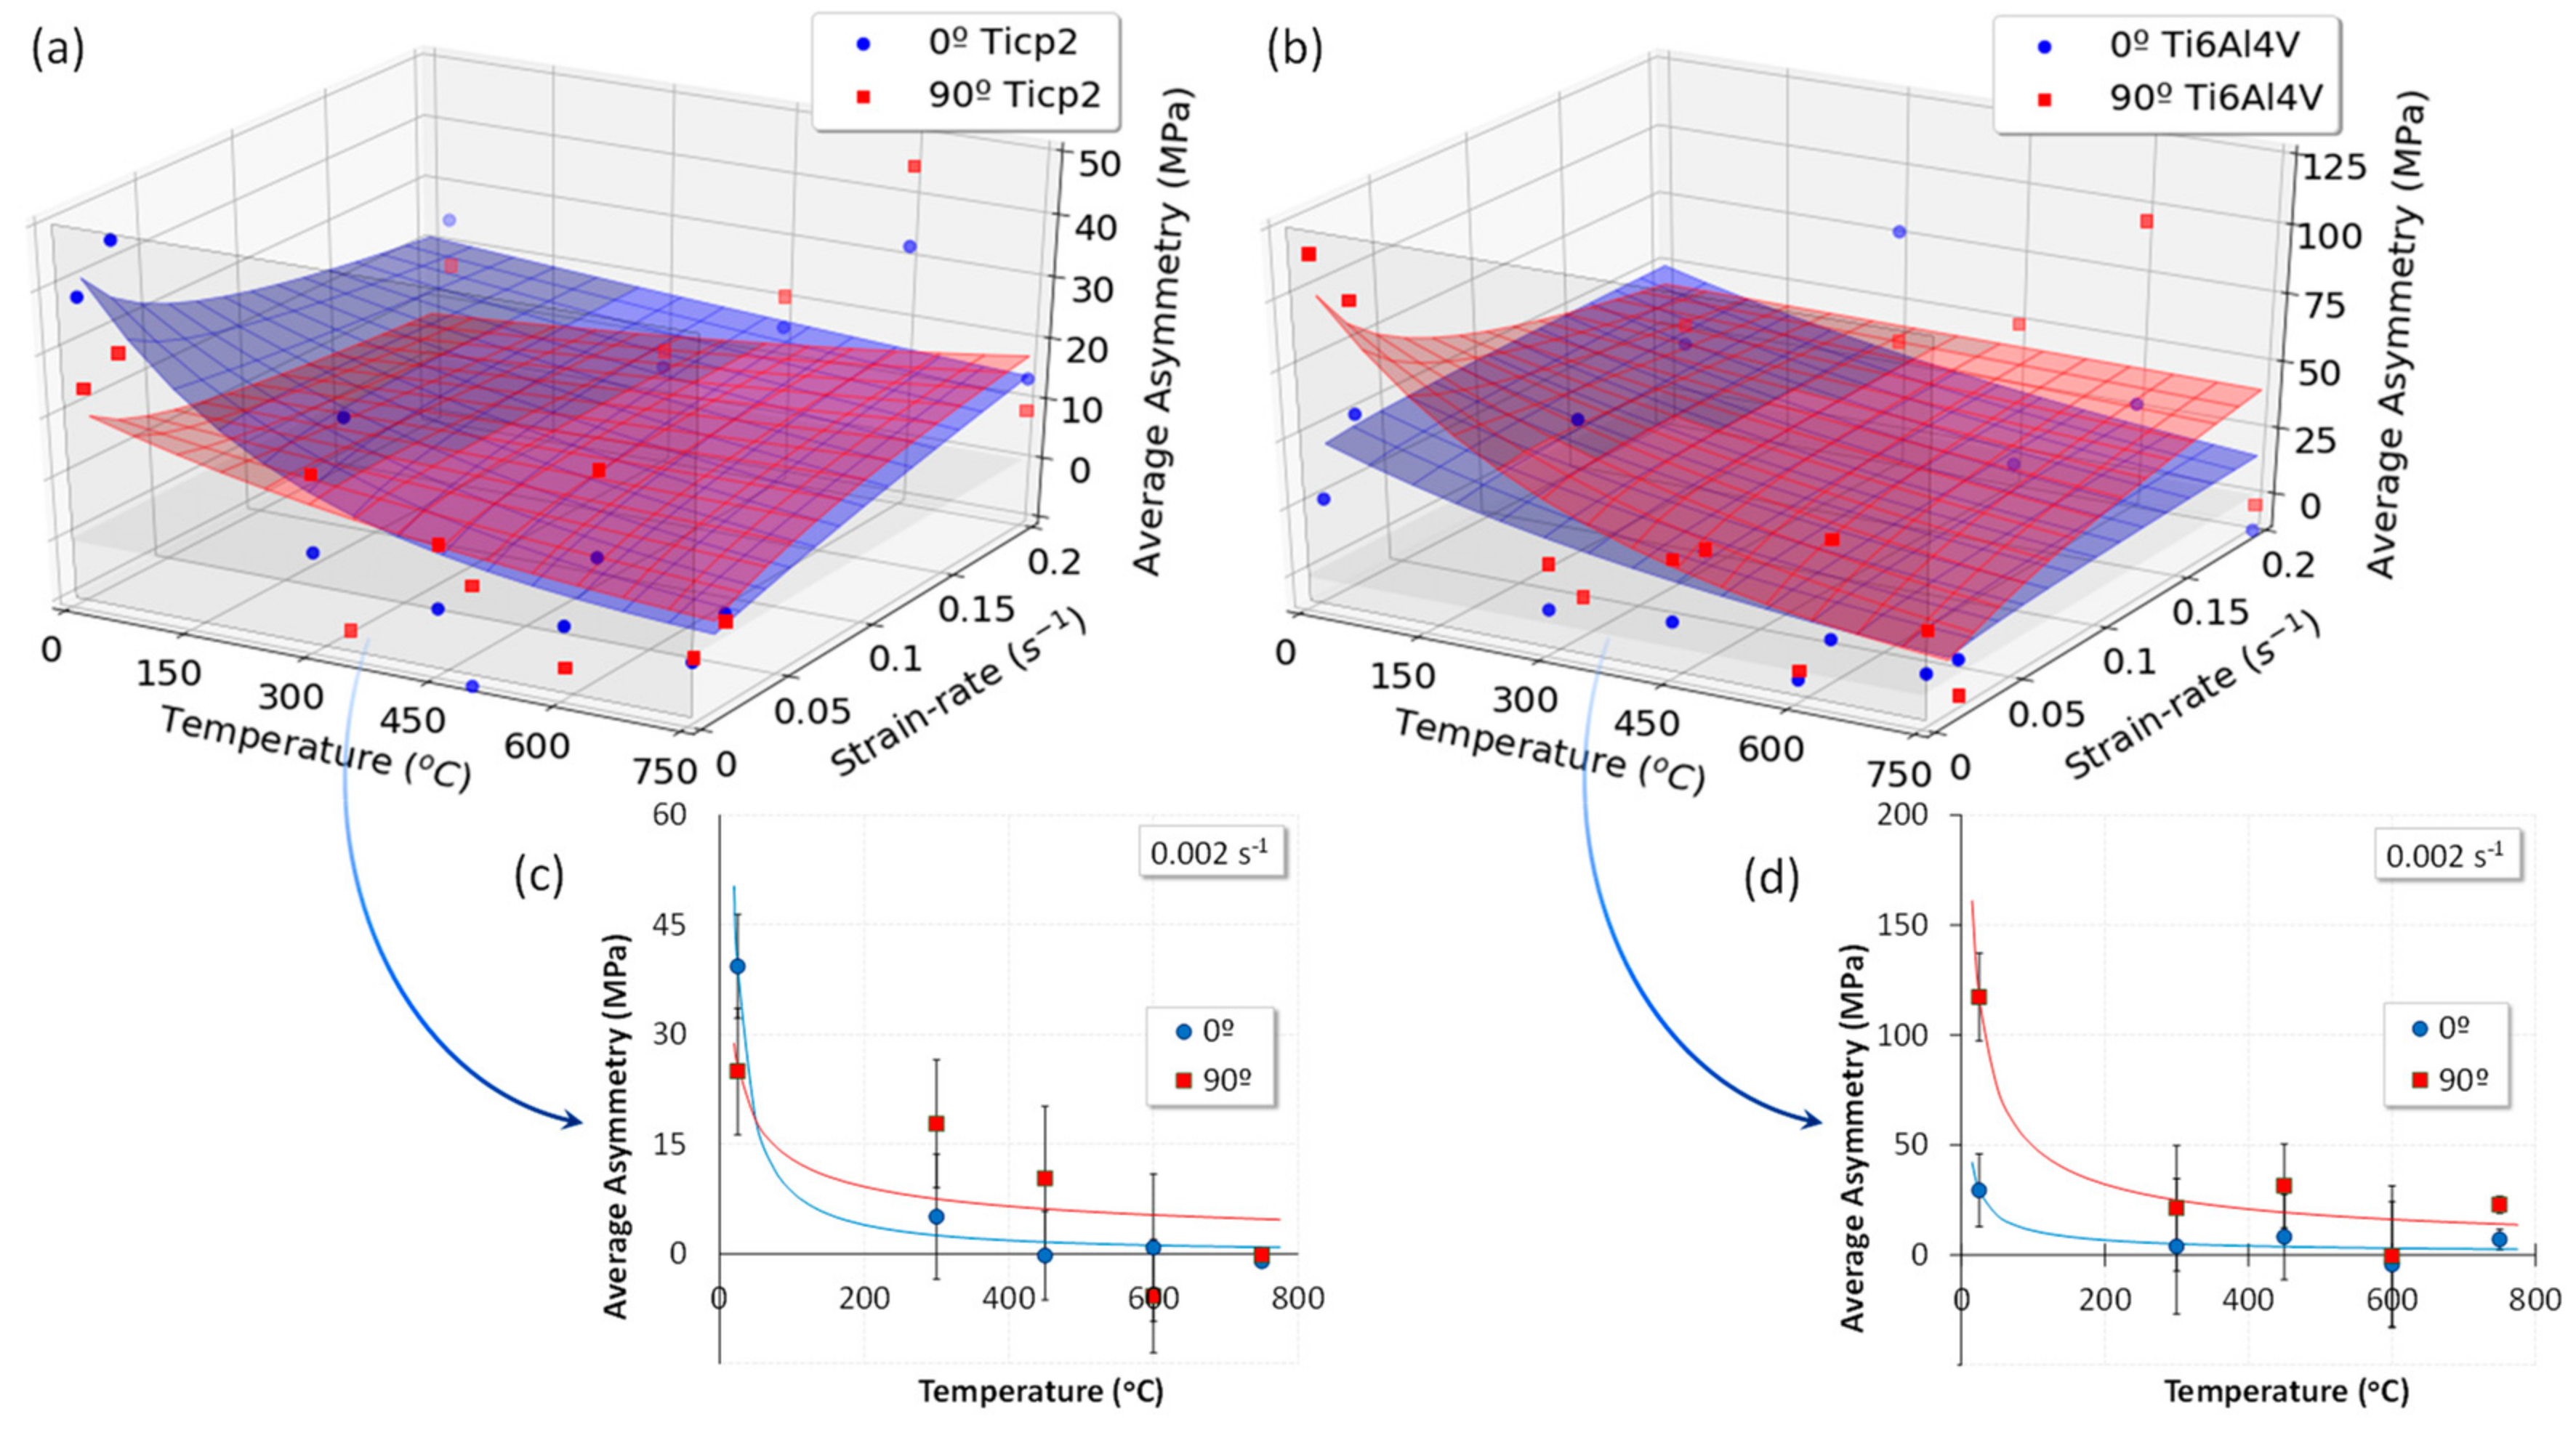
3.1. Asymmetric Tension–Compression Behaviour Depending on Temperature
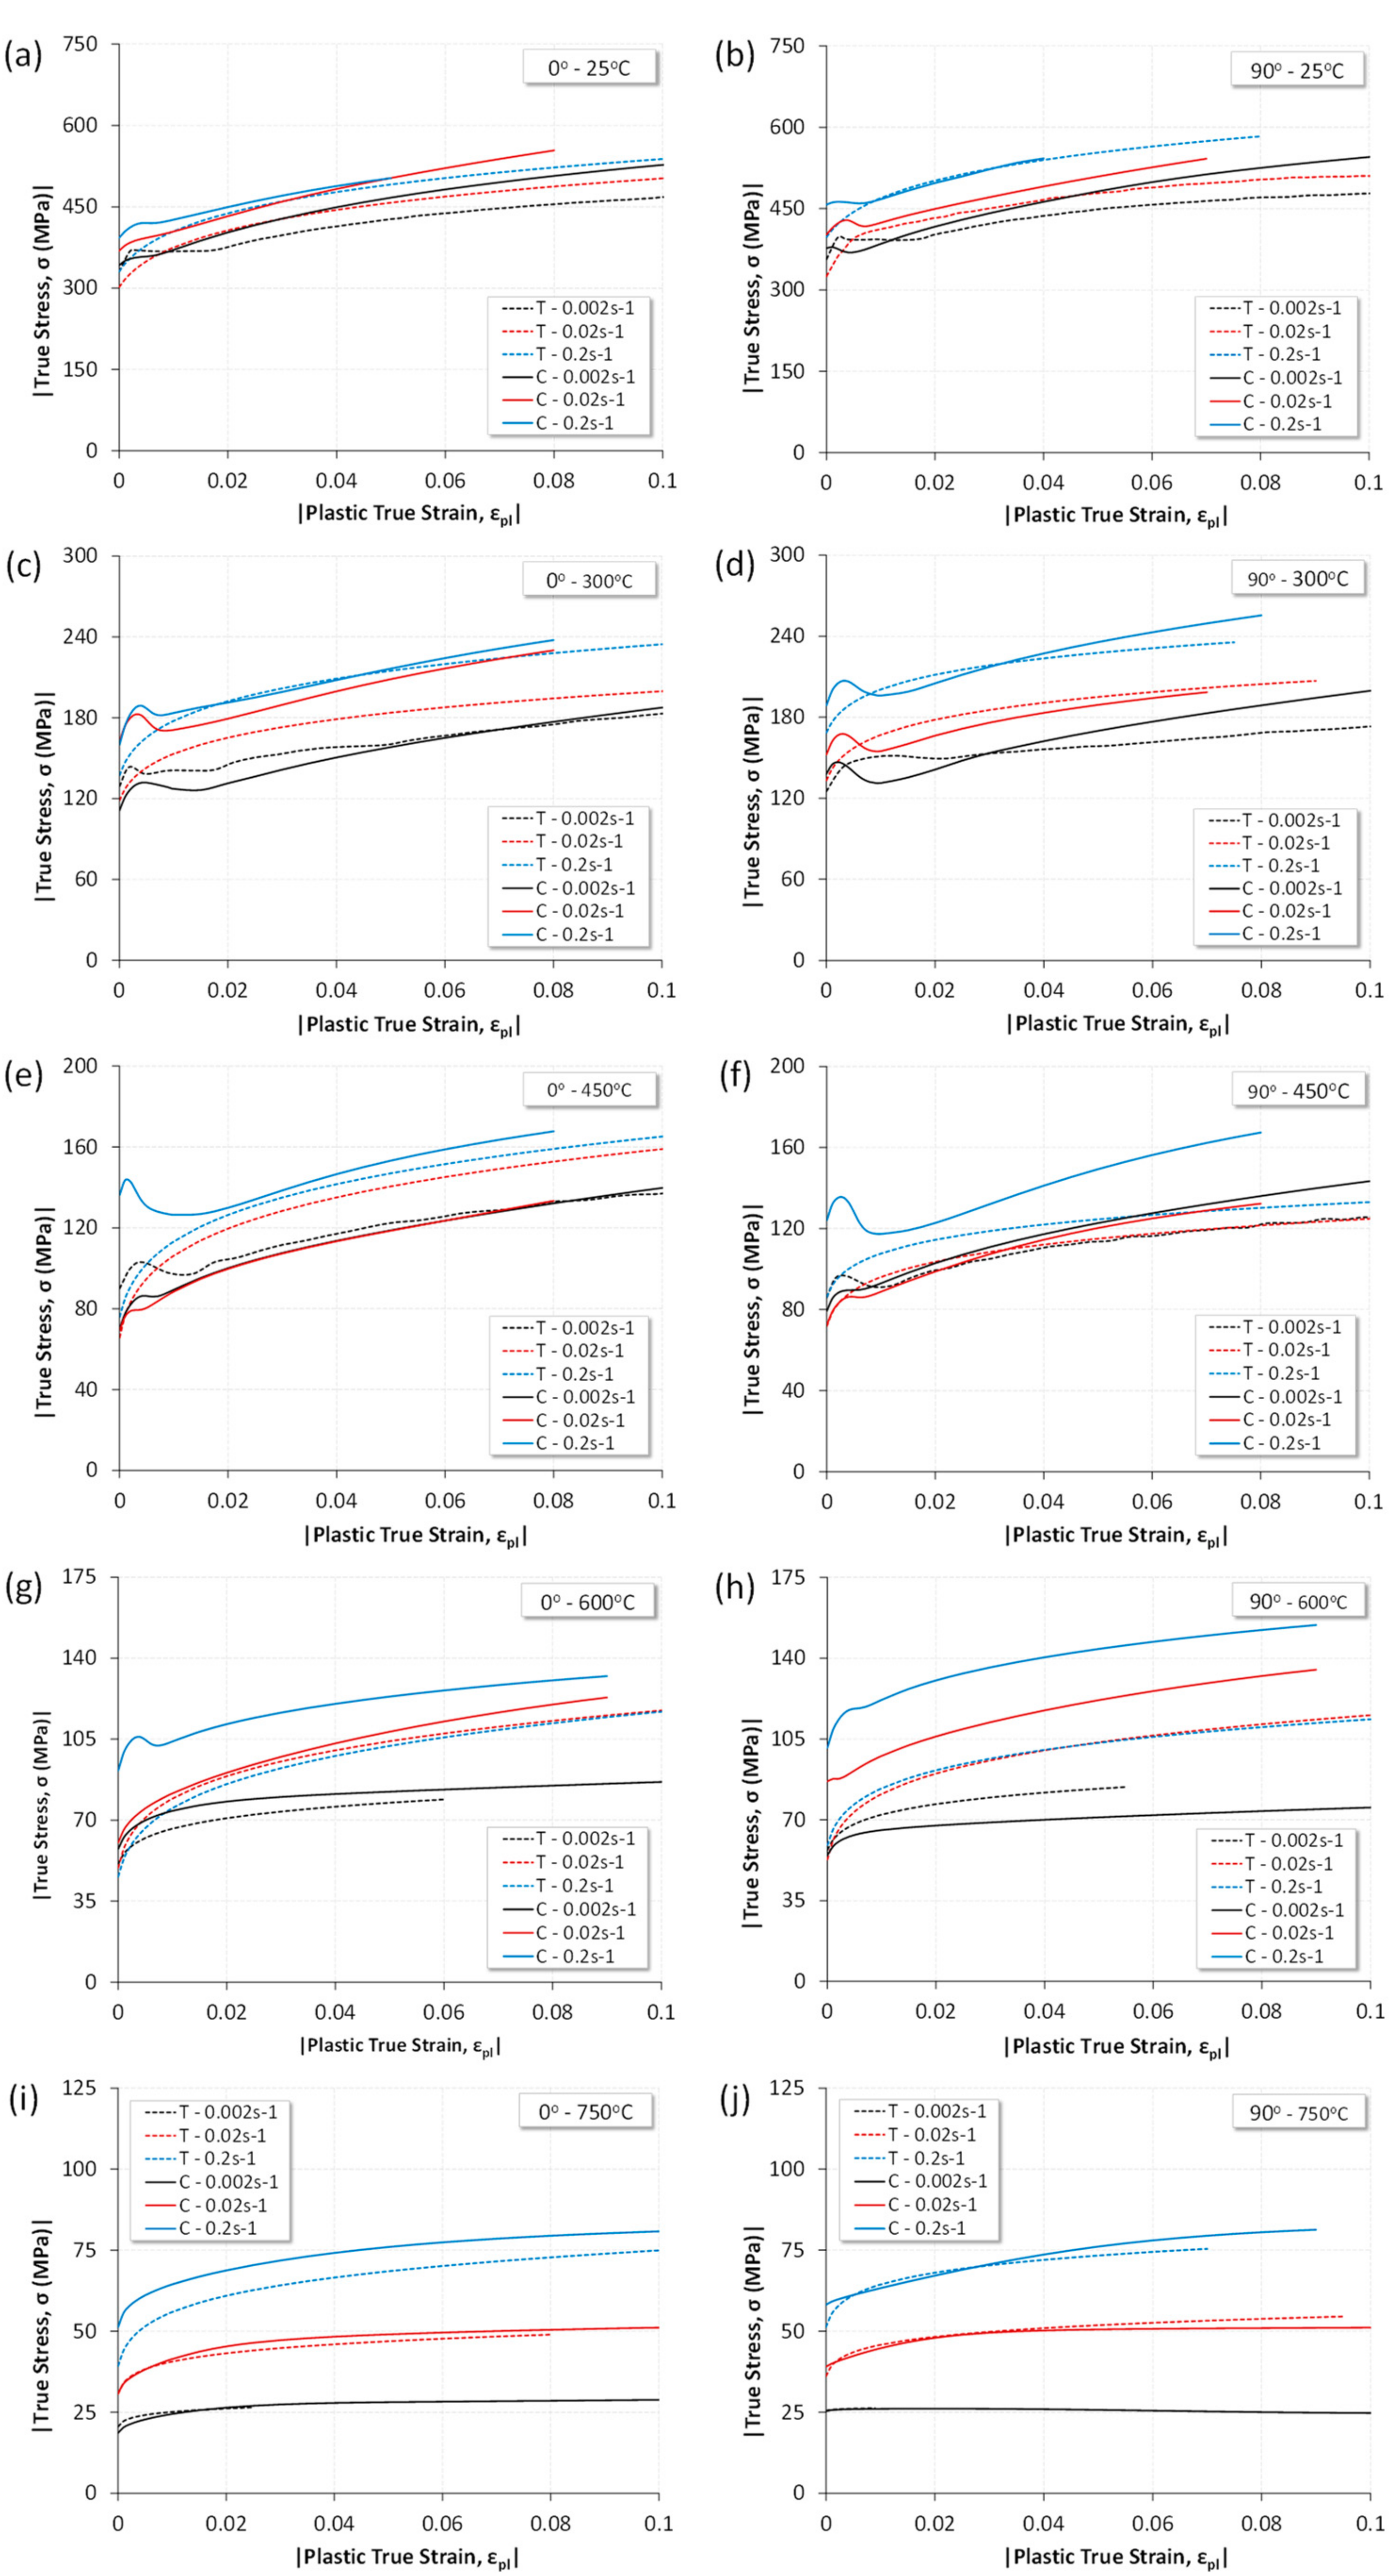
3.2. Asymmetric Tension–Compression Behavior Depending on Temperature and Strain Rates: Preliminary Studies
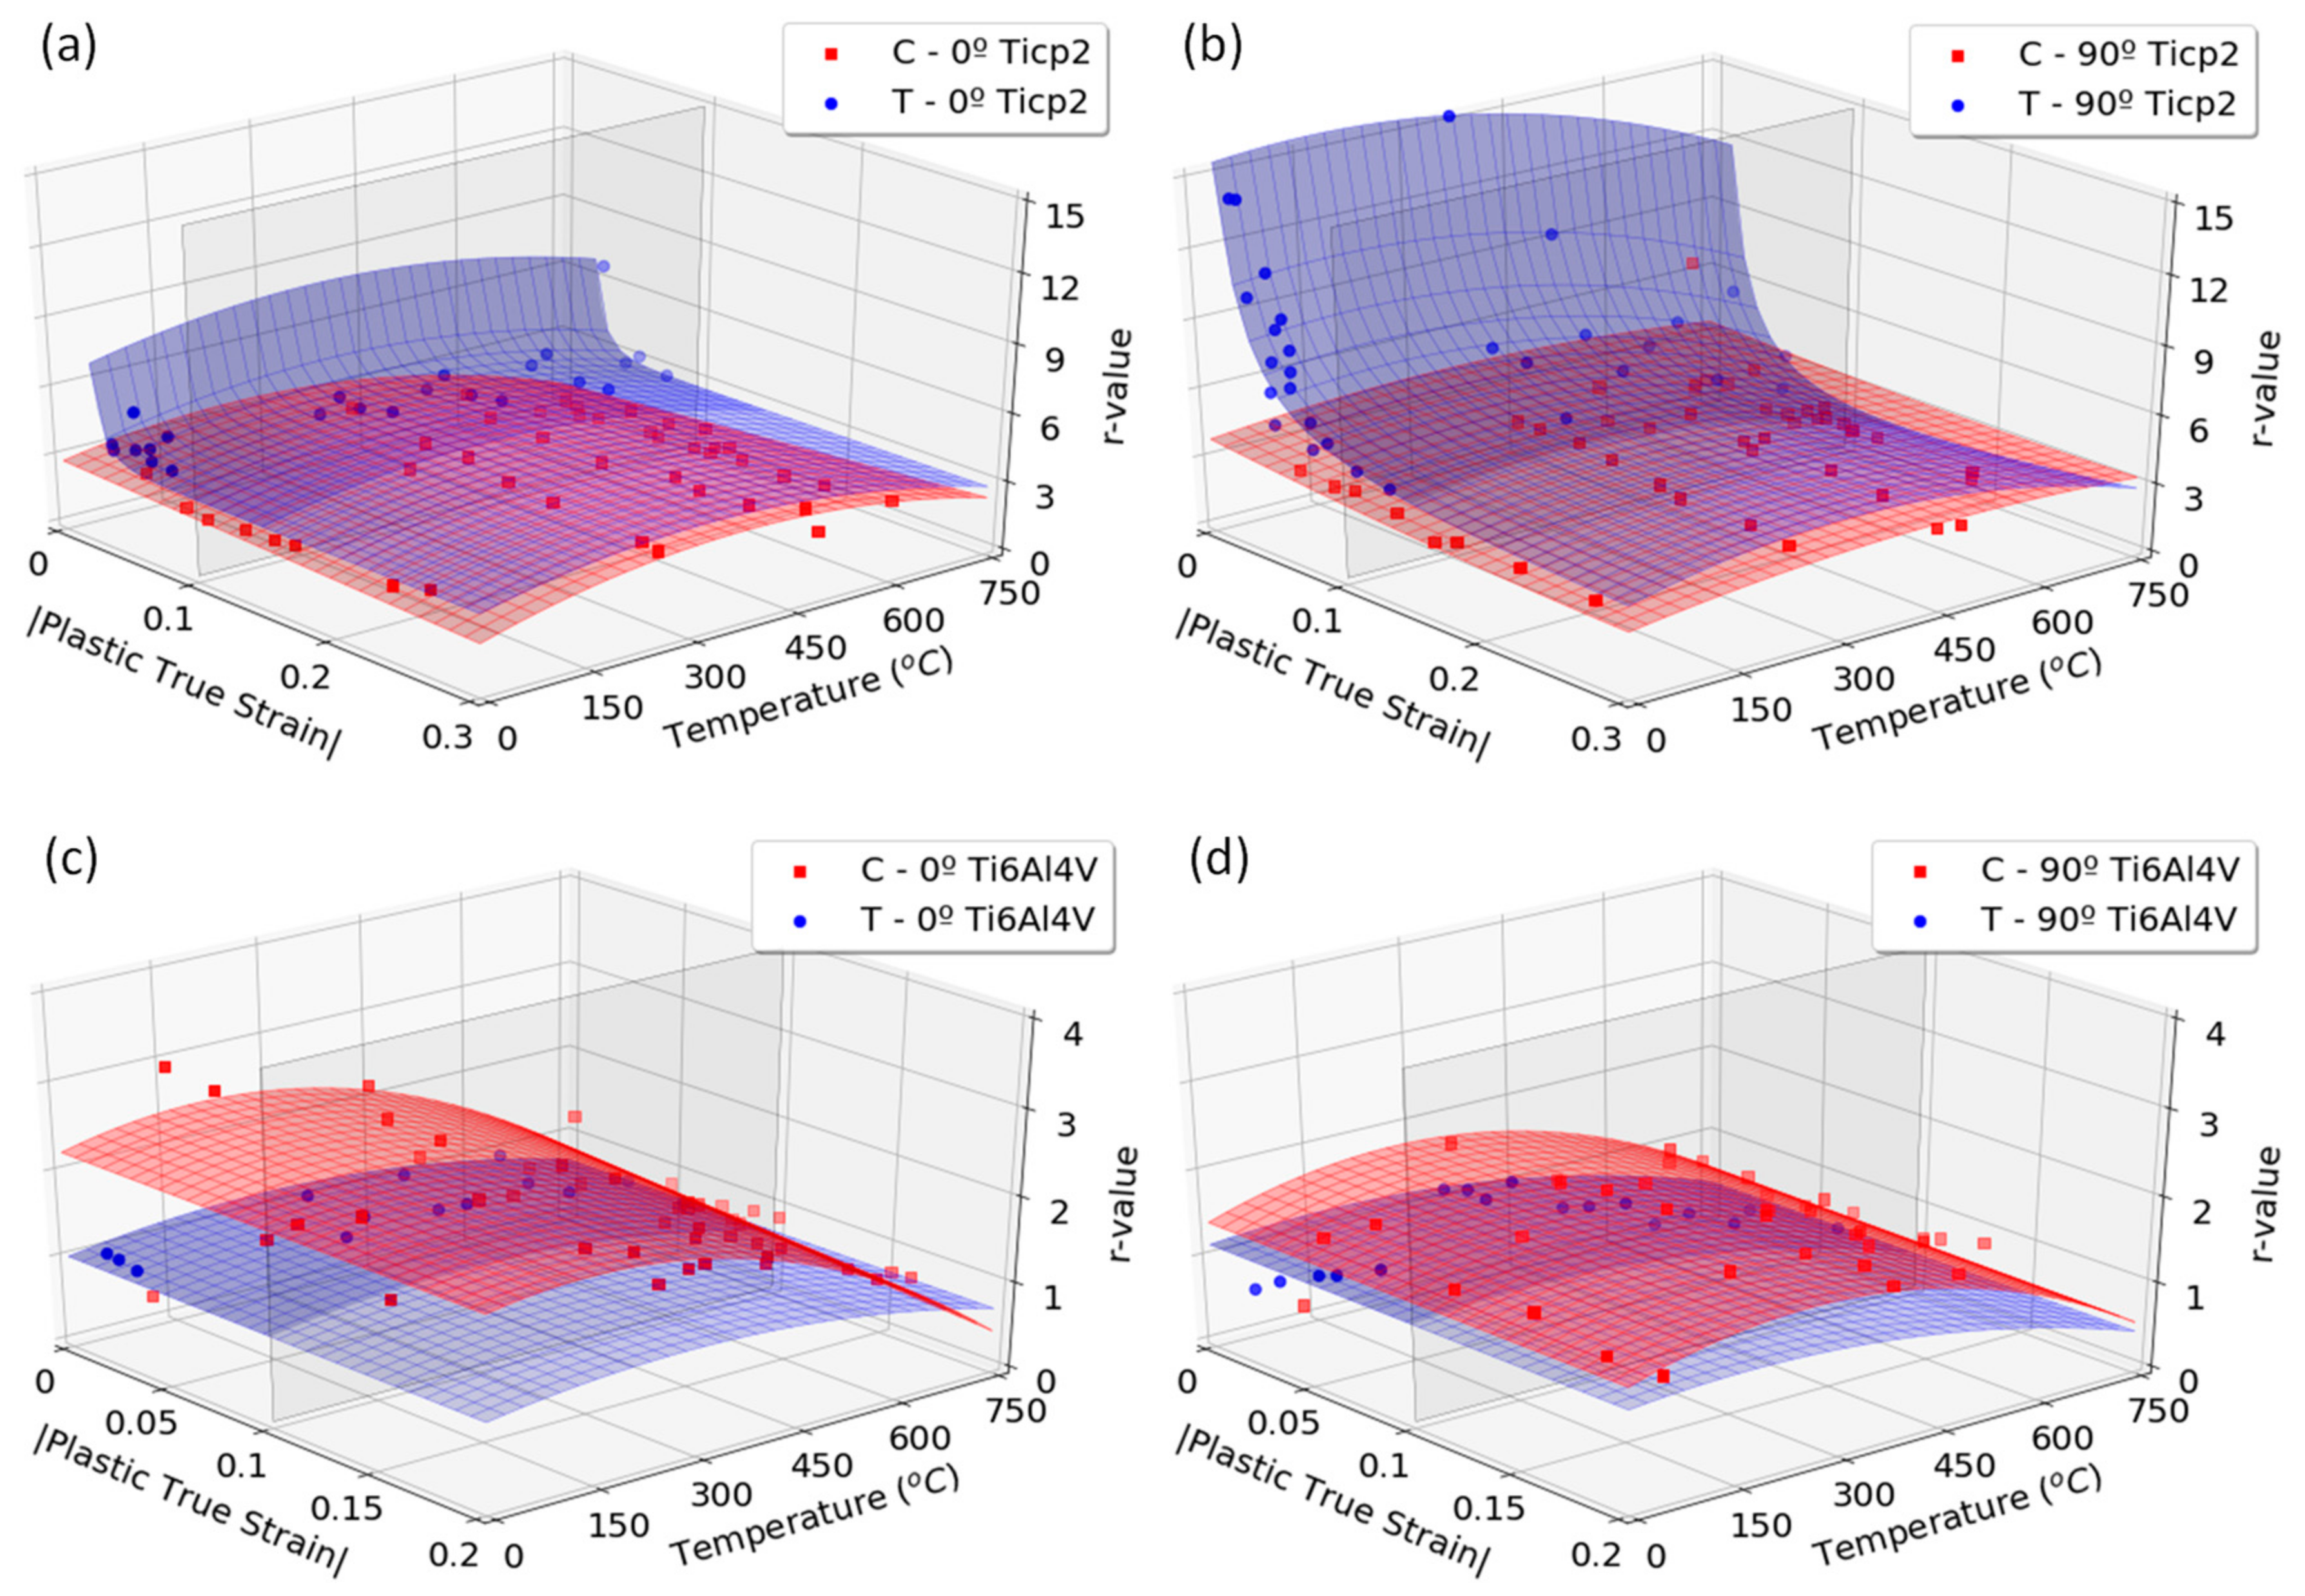
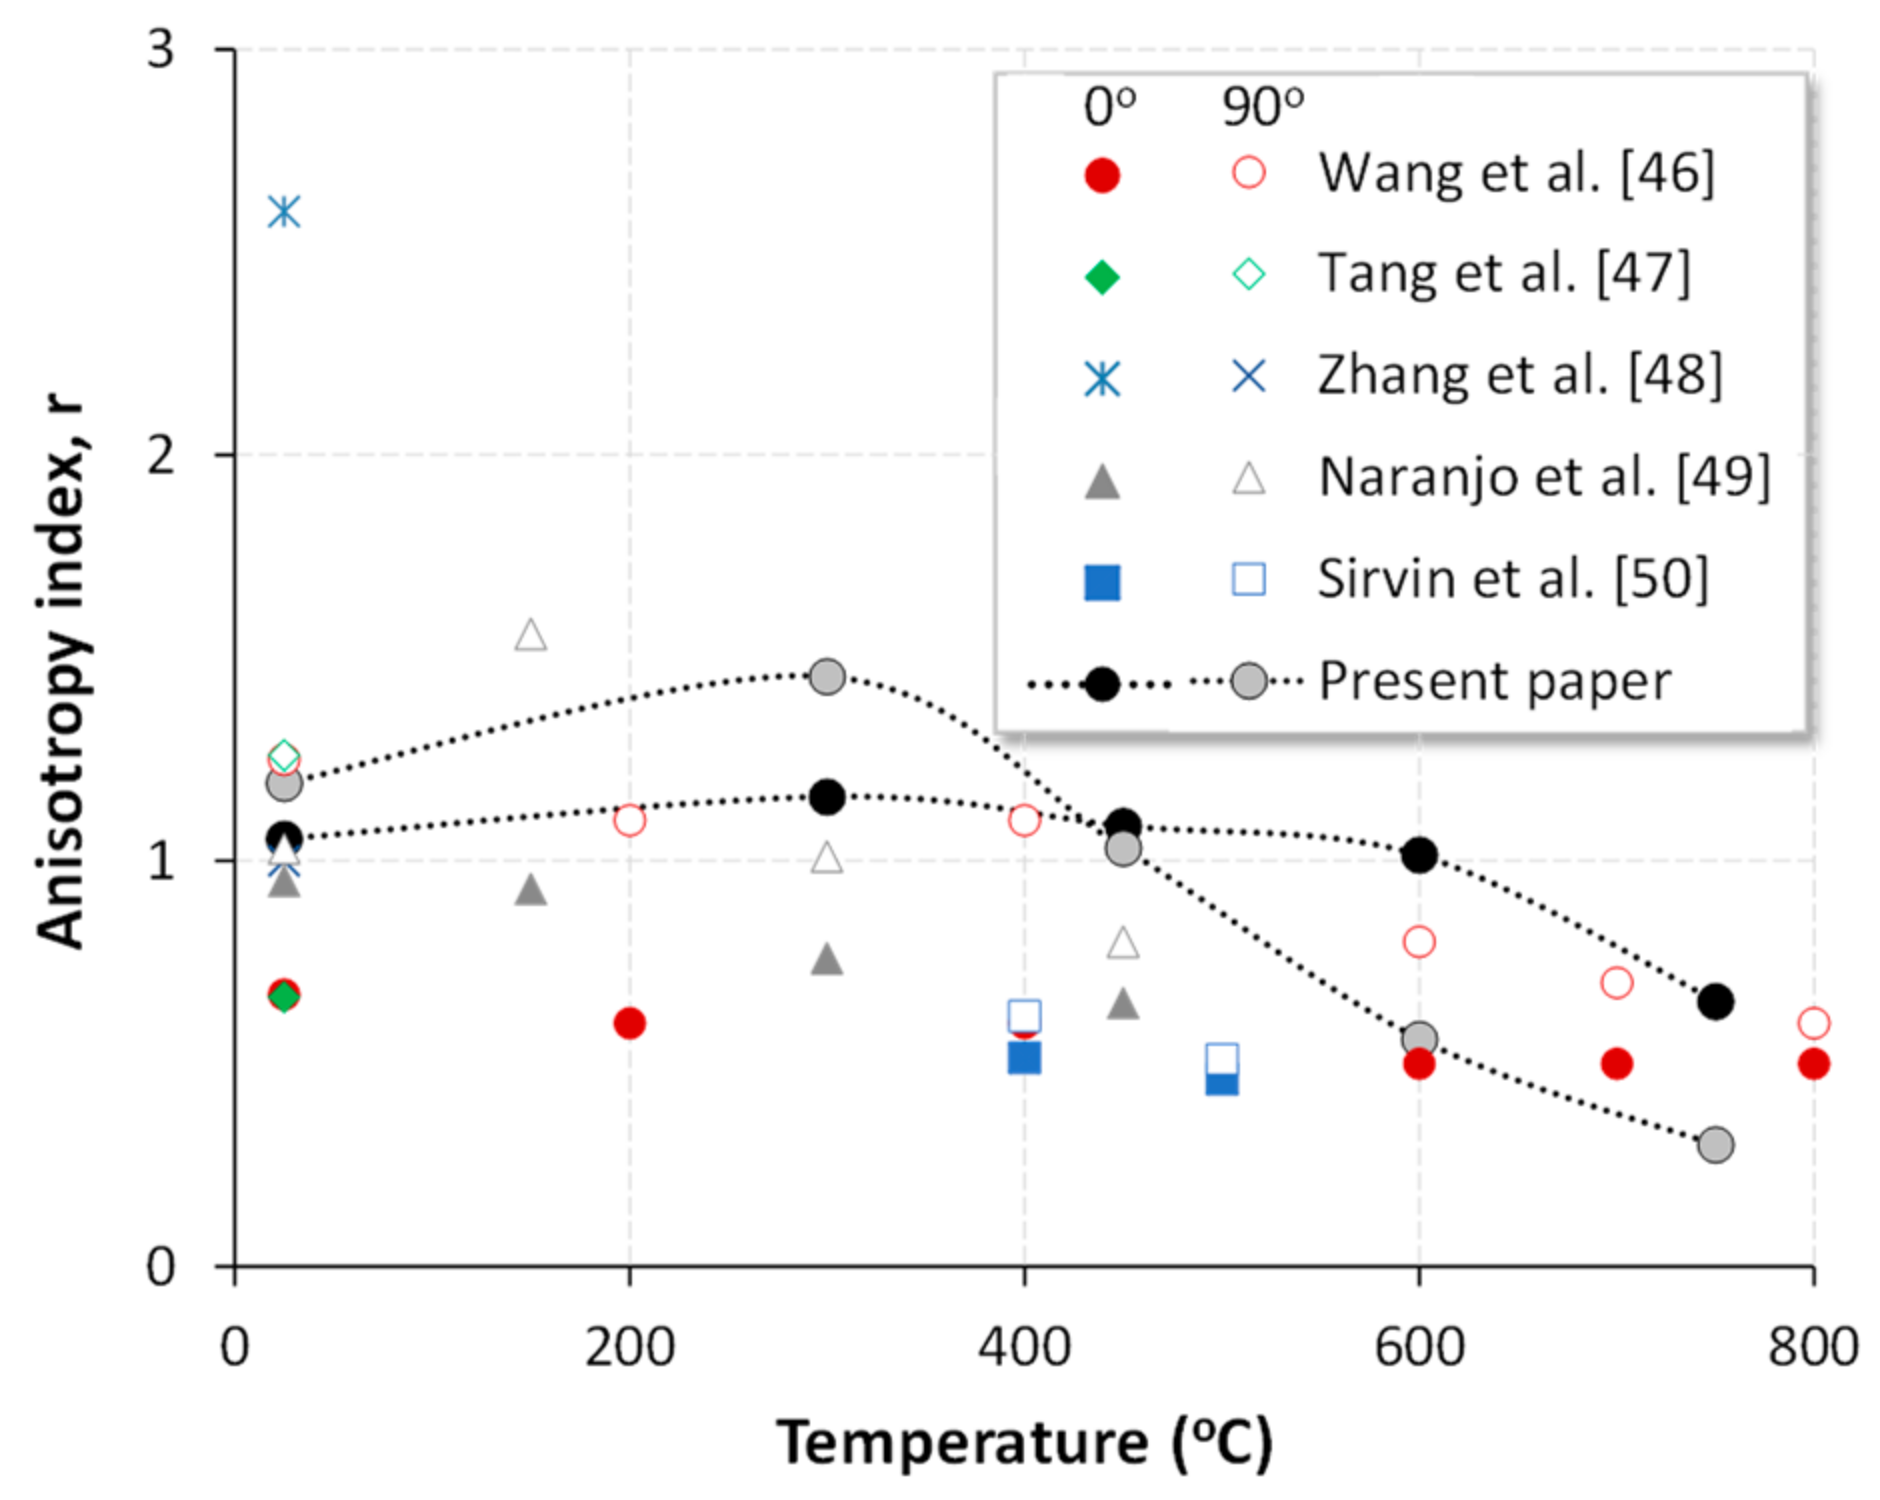
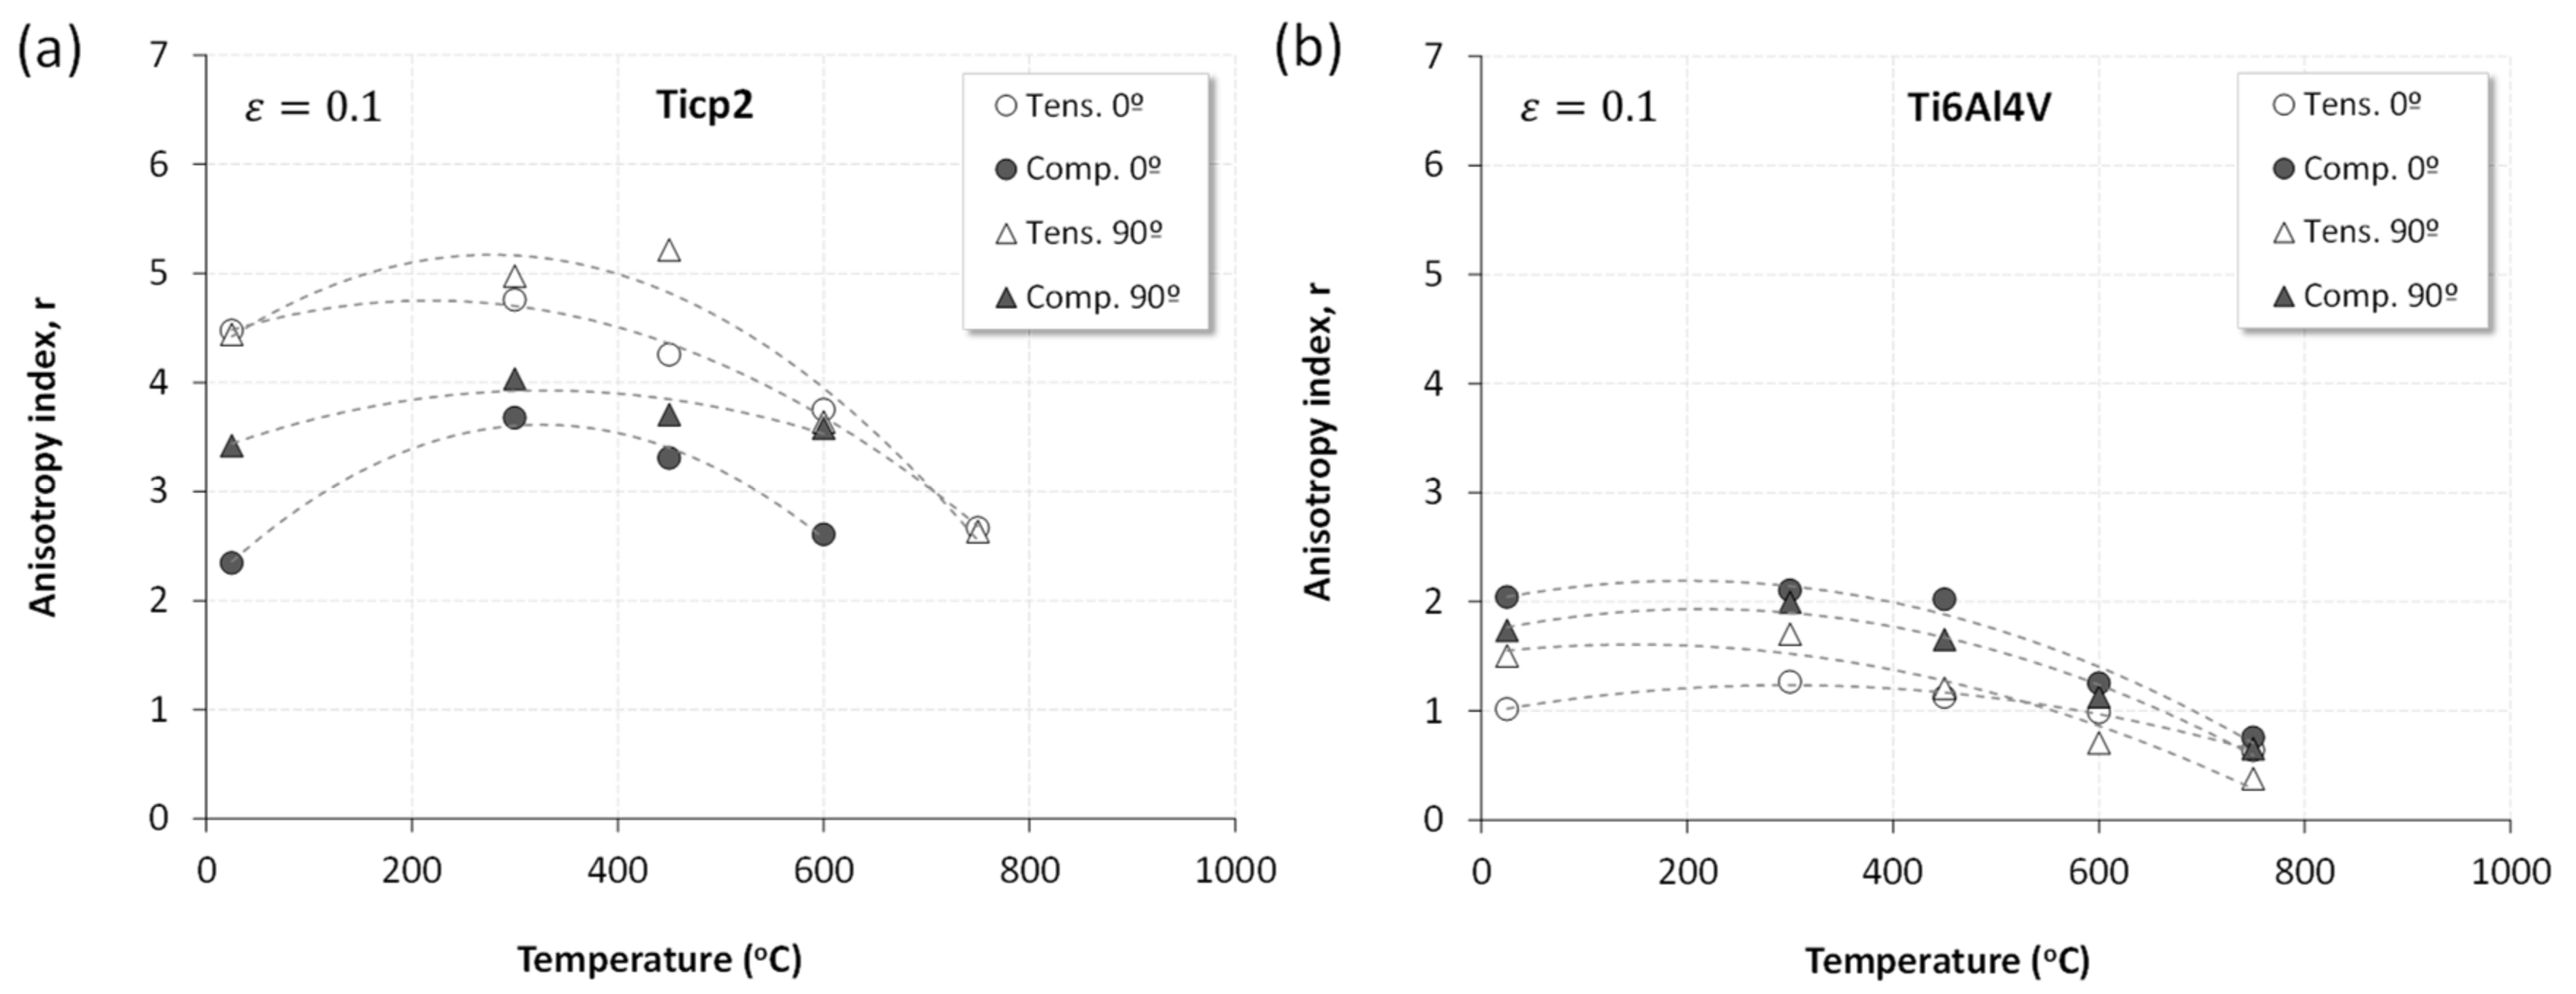
3.3. Analysis and Evaluation of the Anisotropy
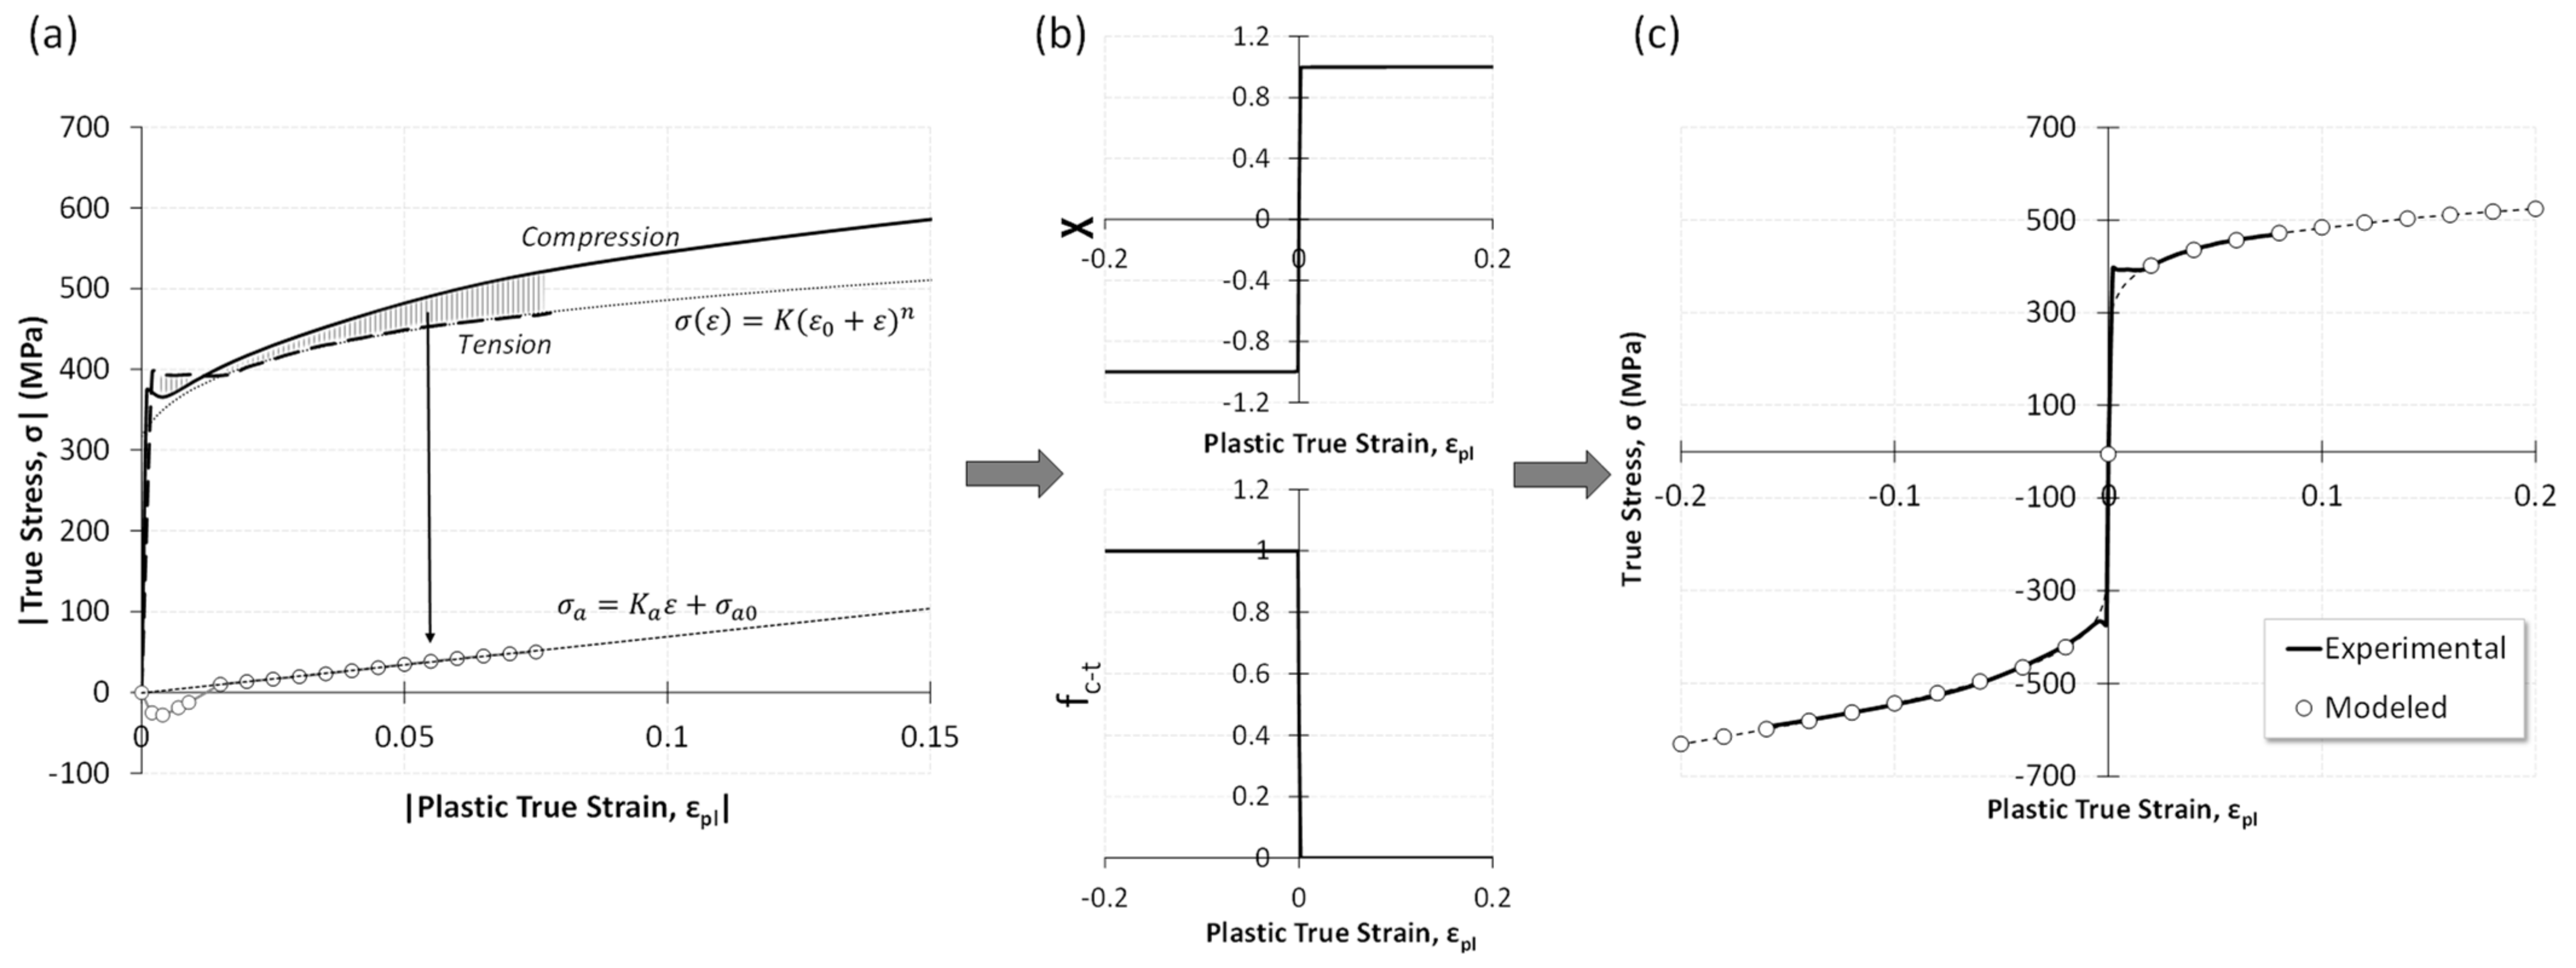
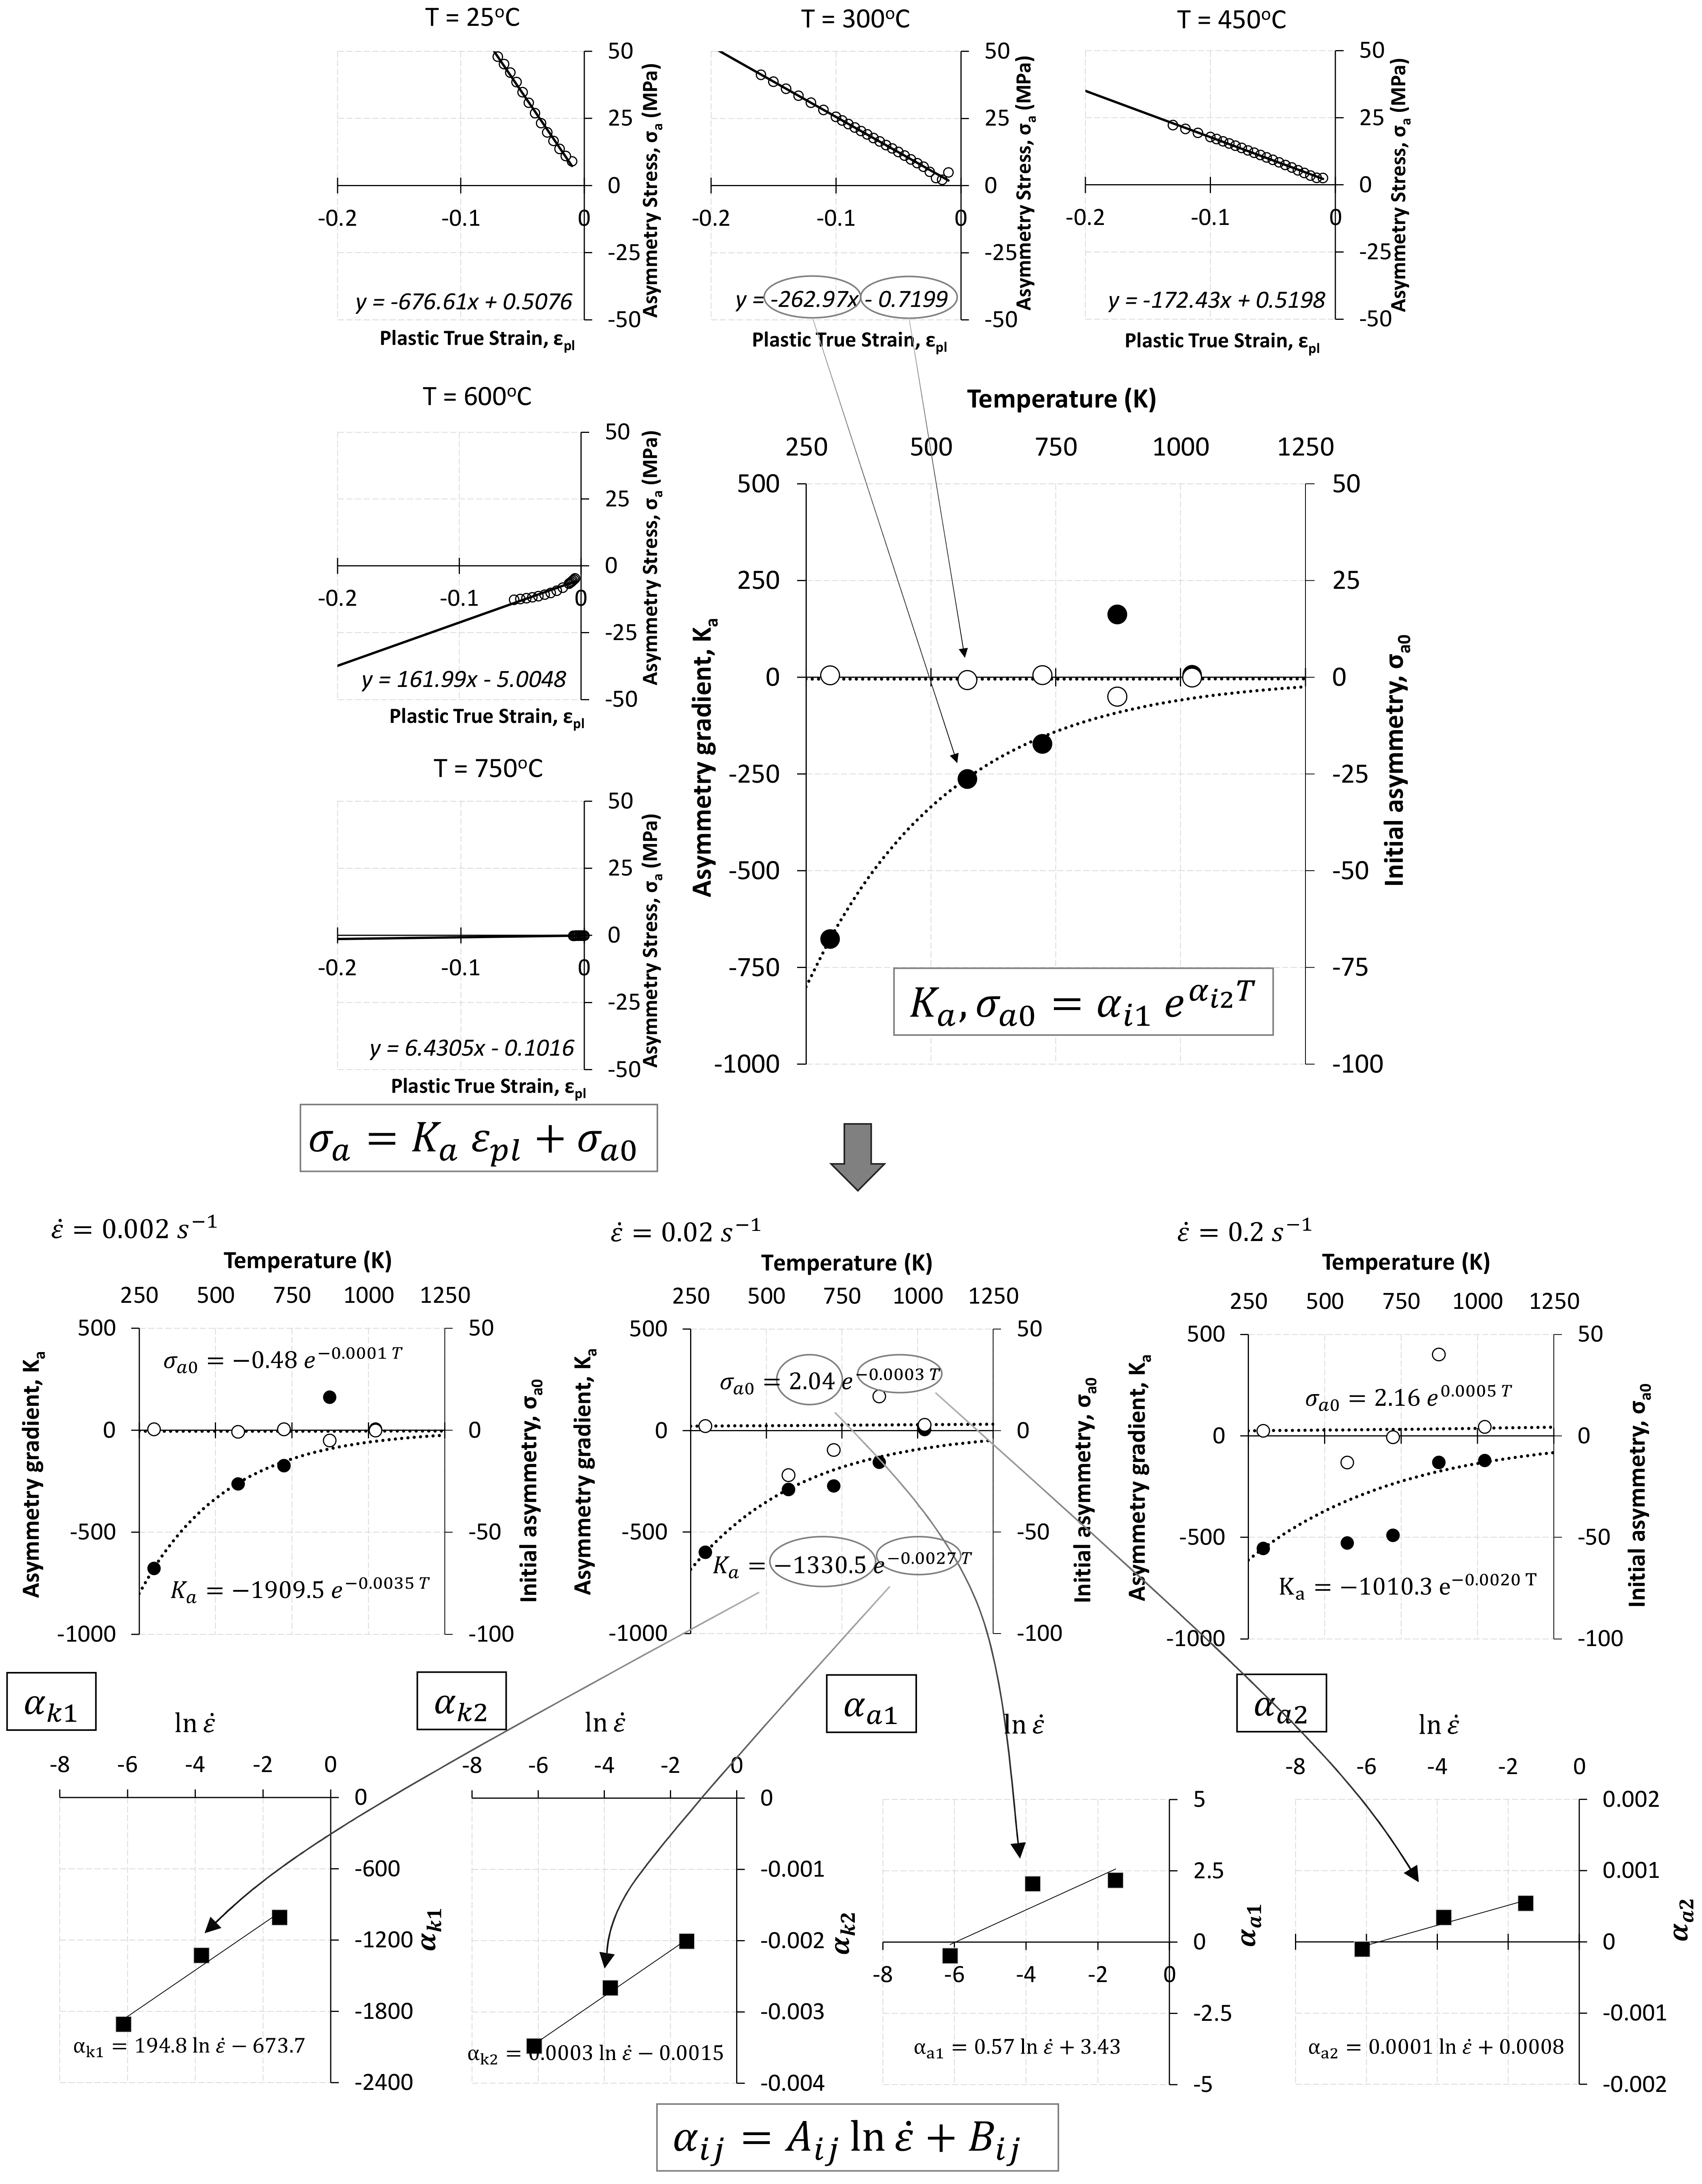
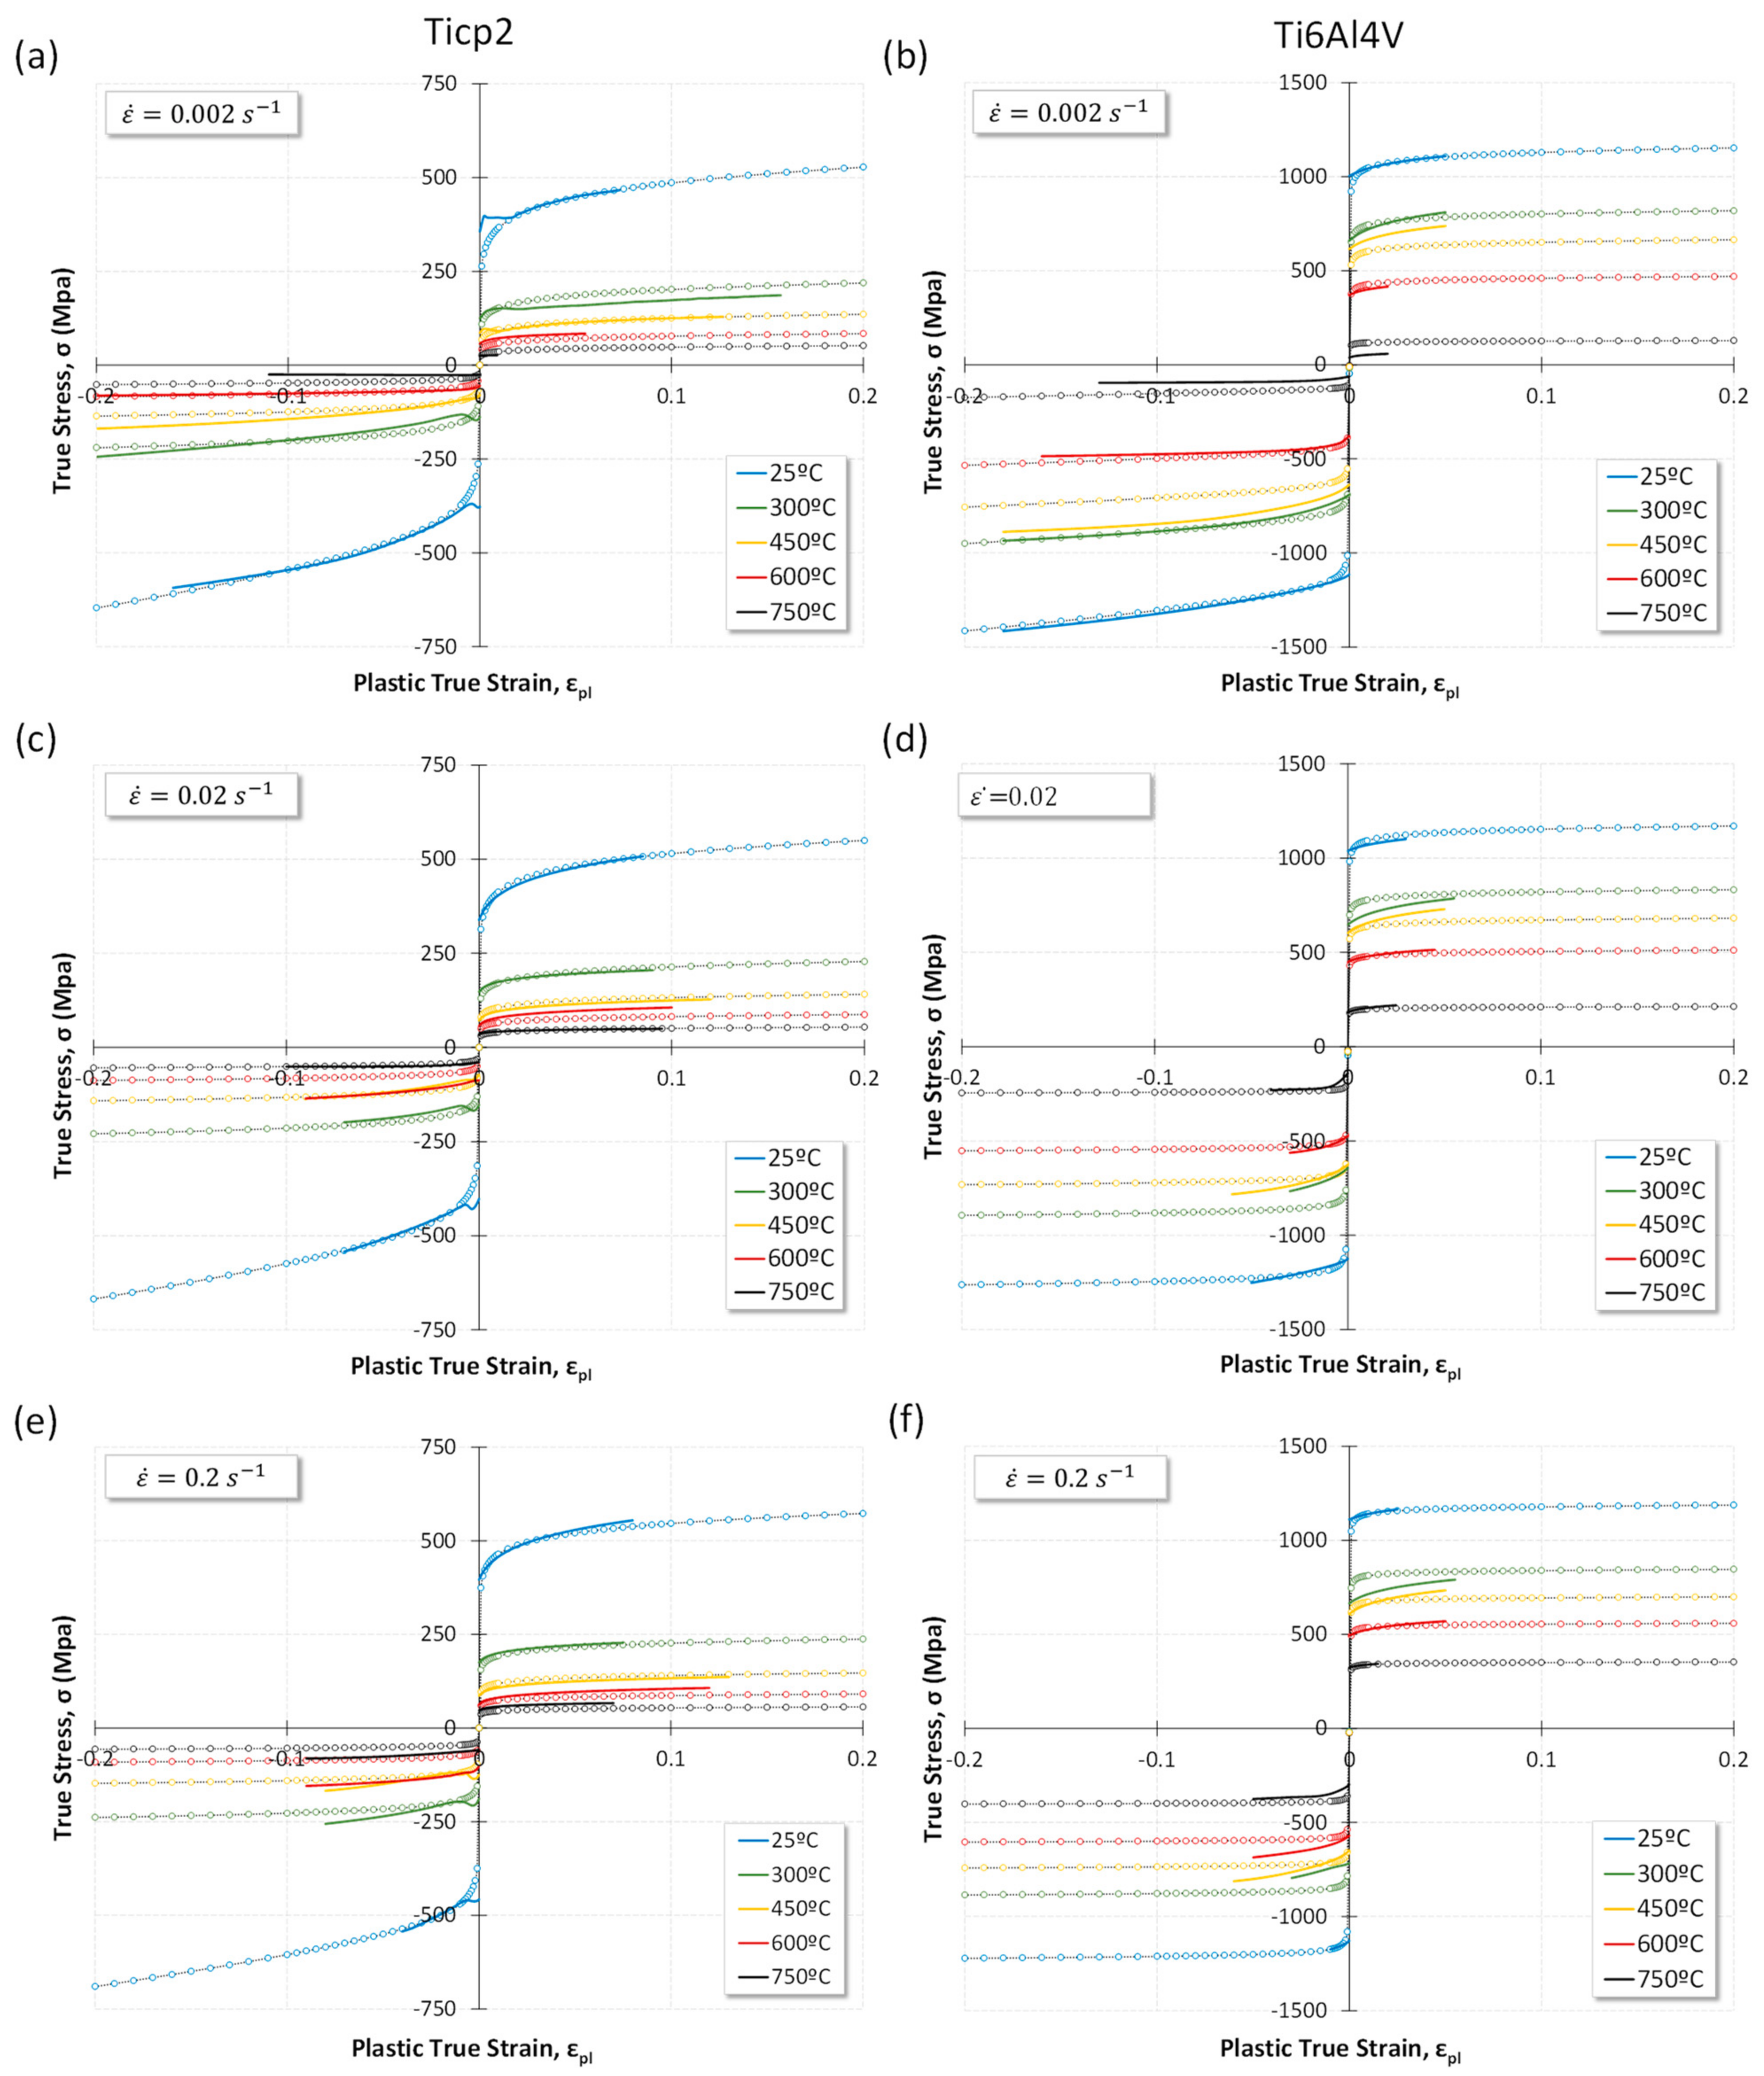
4. Modeling the Experimental Results
5. Conclusions
- The T-C asymmetry observed allows us to affirm that this phenomenon decreases with temperature and depends on the rolling direction. In the transverse direction, the asymmetry remains until higher temperatures (450 °C) are reached compared to the rolling direction. The strain rate seems to delay this effect. In addition, the asymmetry value obtained herein and the evolution of twinning density for pure titanium, as detected by other authors, are parallel phenomena that seem to behave in the same way as a function of the temperature and the strain rate. This statement might provide some light about the causes of asymmetry. Nevertheless, this point should be confirmed later on.
- The anisotropy for the mentioned conditions was determined, and it has been proven that under a compression state, the values are clearly different from those obtained by uniaxial tensile tests. In a deeper analysis, no pronounced anisotropy transient behavior with the strain has been found in compression, with the evolution of this parameter being more uniform than those obtained in some cases under tension. Nevertheless, for the highest temperatures, the r-values tend to be similar for both stress states.
- In view of the evolution of the anisotropy and asymmetry phenomena, it can be established that the traditionally assumed symmetrical behavior would not be considered for temperatures lower than 450 °C.
- An asymmetry-modifier parameter was defined to extend the traditional material constitutive models that permit the material behavior to be predicted for the whole field of tension–compression strains. The model was tested with an adapted Fields–Backofen equation, and a good agreement with the experimental results was obtained for all test conditions.
Author Contributions
Funding
Institutional Review Board Statement
Informed Consent Statement
Data Availability Statement
Conflicts of Interest
References
- Odenberger, E.L.; Oldenburg, M.; Thilderkvist, P.; Stoehr, T.; Lechler, J.; Merklein, M. Tool development based on modelling and simulation of hot sheet metal forming of Ti-6Al-4V titanium alloy. J. Mater. Process. Technol. 2011, 211, 1324–1335. [Google Scholar] [CrossRef]
- Mosecker, L.; Göttmann, A.; Saeed-Akbari, A.; Bleck, W.; Bambach, M.; Hirt, G. Deformation mechanisms of Ti6Al4V sheet material during the incremental sheet forming with laser heating. Key Eng. Mater. 2013, 549, 372–380. [Google Scholar] [CrossRef]
- Rack, H.J.; Qazi, J.I. Titanium alloys for biomedical applications. Mater. Sci. Eng. C 2006, 26, 1269–1277. [Google Scholar] [CrossRef]
- Odenberger, E.L.; Pederson, R.; Oldenburg, M. Finite element modeling and validation of springback and stress relaxation in the thermo-mechanical forming of thin Ti-6Al-4V sheets. Int. J. Adv. Manuf. Technol. 2019, 104, 3439–3455. [Google Scholar] [CrossRef]
- Hama, T.; Nagao, H.; Kobuki, A.; Fujimoto, H.; Takuda, H. Work-hardening and twinning behaviors in a commercially pure titanium sheet under various loading paths. Mater. Sci. Eng. A 2015, 620, 390–398. [Google Scholar] [CrossRef]
- Tirry, W.; Nixon, M.; Cazacu, O.; Coghe, F.; Rabet, L. The importance of secondary and ternary twinning in compressed Ti. Scr. Mater. 2011, 64, 840–843. [Google Scholar] [CrossRef]
- Salem, A.A.; Kalidindi, S.R.; Doherty, R.D.; Semiatin, S.L. Strain hardening due to deformation twinning in α-titanium: Mechanisms. Metall. Mater. Trans. A 2006, 37, 259–268. [Google Scholar] [CrossRef]
- Lin, R.; Hao, Y.; Zhang, B.; Zhang, S.; Chi, C.; Shen, J. Tension-compression asymmetry in yielding and strain hardening behavior of CP-Ti at room temperature. Mater. Sci. Eng. A 2017, 707, 172–180. [Google Scholar] [CrossRef]
- Roth, A.; Lebyodkin, M.A.; Ledebkina, T.A.; Lecomte, J.-S.; Richeton, T.; Amouzou, K.E.K. Mechanisms of anisotropy of mechanical properties of a-titanium in tension conditions. Mater. Sci. Eng. A 2014, 596, 236–243. [Google Scholar] [CrossRef]
- Tirry, W.; Coghe, F.; Bouvier, S.; Gasperini, M.; Rabet, L.; Schryvers, D. A multi-sacle characterization of deformation twins in Ti6Al4V sheet material deformed by simple shear. Mater. Sci. Eng. A 2010, 527, 4136–4145. [Google Scholar] [CrossRef]
- Yoo, M.H.; Morris, J.R.; Ho, K.M.; Agnew, S.R. Nonbasal deformation modes of HCP metals and alloys: Role of dislocation source and mobility. Metall. Mater. Trans. A 2002, 33, 813–822. [Google Scholar] [CrossRef]
- Gilles, G.; Hammami, H.; Libertiaux, V.; Cazacu, O.; Yoon, J.H.; Kuwabara, T.; Habraken, A.M.; Duchene, L. Experimental characterization and elasto-plastic modeling of the quasi-static mechanical response of TA-6V at room temperature. Int. J. Solids Struct. 2011, 48, 1277–1289. [Google Scholar] [CrossRef]
- Nemat-Nasser, S.; Guo, W.G.; Cheng, J.Y. Mechanical properties and deformation mechanisms of a commercially pure titanium. Acta Mater. 1999, 47, 3705–3720. [Google Scholar] [CrossRef]
- Becker, H.; Pantleon, W. Work-hardening and deformation mechanism maps during tensile deformation of commercially pure titanium. Comput. Mater. Sci. 2013, 76, 52–59. [Google Scholar] [CrossRef]
- Battaini, M.; Pereloma, E.V.; Davies, C.H.J. Effect of orientation and temperature on the mechanical properties of commercially pure titanium. Adv. Mater. Res. 2007, 15–17, 941–946. [Google Scholar] [CrossRef]
- Paton, N.E.; Backofen, W.A. Plastic deformation of titanium at elevated temperatures. Metall. Trans. 1970, 1, 2839–2847. [Google Scholar]
- Zeng, Z.; Zhang, Y.; Jonsson, S. Deformation behaviour of commercially pure titanium during simple hot compression. Mater. Des. 2009, 30, 3105–3111. [Google Scholar] [CrossRef]
- Nixon, M.E.; Cazacu, O.; Lebensohn, R.A. Anisotropic response of high-purity α-titanium: Experimental characterization and constitutive modeling. Int. J. Plast. 2010, 26, 516–532. [Google Scholar] [CrossRef]
- Battaini, M.; Pereloma, E.V.; Davies, C.H.J. Orientation effect on mechanical properties of commercially pure titanium at room temperature. Metall. Mater. Trans. A 2007, 38, 276–285. [Google Scholar] [CrossRef]
- Liu, K.; Dong, X.; Xie, H.; Wu, Y.; Peng, F.; Chen, F. Asymmetry in the hot deformation behavior of AZ31B magnesium sheets. Mater. Sci. Eng. A 2016, 659, 198–206. [Google Scholar] [CrossRef]
- Raemy, C.; Manopulo, N.; Hora, P. On the modelling of plastic anisotropy, asymmetry and directional hardening of commercially pure titanium: A planar Fourier series based approach. Int. J. Plast. 2017, 91, 182–204. [Google Scholar] [CrossRef]
- Manopulo, N.; Raemy, C.; Hora, P. A flexible modelling approach for capturing plastic anisotropy and strength differential effects exhibited by commercially pure titanium. Int. J. Solids Struct. 2018, 151, 91–98. [Google Scholar] [CrossRef]
- Zhou, P.; Beeh, E.; Friedrich, H.E. Influence of tension-compression asymmetry on the mechanical behavior of AZ31B magnesium alloy sheets in bending. J. Mater. Eng. Perform. 2016, 25, 853–865. [Google Scholar] [CrossRef]
- Nixon, M.E.; Lebenshon, R.A.; Cazacu, O.; Liu, C. Experimental and finite-element analysis of the anisotropic response of high-purity x-titanium in bending. Acta Mater. 2010, 58, 5759–5767. [Google Scholar] [CrossRef]
- Barros, P.D.; Alves, J.L.; Oliveira, M.C.; Menezes, L.F. Modeling of tension-compression asymmetry and orthotropy on metallic materials: Numerical implementation and validation. Int. J. Mech. Sci. 2016, 114, 217–232. [Google Scholar] [CrossRef]
- Boger, R.K.; Wagoner, R.H.; Barlat, F.; Lee, M.G.; Chung, K. Continuous, large strain, tension/compression testing of sheet material. Int. J. Plast. 2005, 21, 2319–2343. [Google Scholar] [CrossRef]
- Kuwabara, T.; Kumano, Y.; Ziegelheim, J.; Kurosaki, I. Tension-compression asymmetry of phosphor bronze for electronic parts and its effect on bending behavior. Int. J. Plast. 2009, 25, 1759–1776. [Google Scholar] [CrossRef]
- Piao, K.; Lee, J.K.; Kim, J.H.; Kim, H.Y.; Chung, K.; Barlat, F.; Wagoner, R.H. A sheet tension/compression test for elevated temperature. Int. J. Plast. 2012, 38, 27–46. [Google Scholar] [CrossRef]
- Lee, M.G.; Kim, J.H.; Kim, D.; Seo, O.S.; Nguyen, N.T.; Kim, H.Y. Anisotropic hardening of sheet metal at elevated temperature: Tension-compressions test development and validation. Exp. Mech. 2013, 53, 1039–1055. [Google Scholar] [CrossRef]
- Ayllón, J.; Miguel, V.; Martínez-Martínez, A.; Coello, J.; Naranjo, J.A. A new approach for obtaining the compression behavior of anisotropic sheet metals applicable to a wide range of test conditions. Metals 2020, 10, 1374. [Google Scholar] [CrossRef]
- ISO 6892-2: 2018 Metallic Materials—Tensile Testing—Part 2: Method of Test at Elevated Temperature; ISO: Geneva, Switzerland, 2018.
- ISO 10113: 2016 Metallic Materials—Sheet and Strip—Determination of Plastic Strain Ratio; ISO: Geneva, Switzerland, 2016.
- Podgornik, B.; Kafexhiu, F.; Kosec, T.; Jerina, J.; Kalin, M. Friction and anti-galling properties of hexagonal boron nitride (h-BN) in aluminium forming. Wear 2017, 388–389, 2–8. [Google Scholar] [CrossRef]
- Guo, J.; Zhan, M.; Fu, M.W.; Gao, P.F.; Ma, F. Extrapolation based constitutive modeling of flow stress of titanium alloy sheet under hot-working condition. Mater. Des. 2018, 154, 96–107. [Google Scholar] [CrossRef]
- Lin, P.; He, Z.; Yuan, S.; Shen, J. Tensile deformation behavior of Ti-22Al-25Nb alloy at elevated temperatures. Mater. Sci. Eng. A 2012, 556, 617–624. [Google Scholar] [CrossRef]
- Odenberger, E.L.; Hertzman, J.; Thilderkvist, P.; Merklein, M.; Kuppert, A.; Stöhr, T.; Lechler, J.; Oldenburg, M. Thermo-mechanical sheet metal forming of aero engine components in Ti-6Al-4V-PART 1: Material characterisation. Int. J. Mater. Form. 2013, 6, 391–402. [Google Scholar] [CrossRef]
- Tuninetti, V.; Gilles, G.; Milis, O.; Pardoen, T.; Habraken, A.M. Anisotropy and tension-compression asymmetry modeling of the room temperature plastic response of Ti-6Al-4V. Int. J. Plast. 2015, 67, 53–68. [Google Scholar] [CrossRef]
- Kuwabara, T.; Katami, C.; Kikuchi, M.; Shindo, T.; Ohwue, T. Cup drawing of pure titanium sheet finite element analysis and experimental validation. In Proceedings of the 7th International Conference Numerical Methods in Industrial Forming Processes; Mori, K., Ed.; Balkema: Lisse, The Netherlands, 2001; p. 781. [Google Scholar]
- Cao, J.; Lee, W.; Cheng, H.S.; Seniw, M.; Wang, H.-P.; Chung, K. Experimental and numerical investigation of combined isotropic-kinematic hardening behavior of sheet metals. Int. J. Plast. 2009, 25, 942–972. [Google Scholar] [CrossRef]
- Lee, M.G.; Kim, D.; Kim, C.; Wenner, M.L.; Wagoner, R.H.; Chung, K. Spring-back evaluation of automotive sheets based on isotropic-kinematic hardening laws and non-quadratic anisotropic yield functions. Part II: Characterization of material properties. Int. J. Plast. 2005, 21, 883–914. [Google Scholar]
- Baral, M.; Hama, T.; Knudsen, E.; Korkolis, Y. Plastic deformation of commercially-pure titanium: Experiments and modeling. Int. J. Plast. 2018, 105, 164–194. [Google Scholar] [CrossRef]
- Pham, Q.T.; Lee, M.G.; Kim, Y.S. Characterization of the isotropic-distortional hardening model and its application to commercially pure titanium sheets. Int. J. Mech. Sci. 2019, 160, 90–102. [Google Scholar] [CrossRef]
- Singh, A.; Basak, S.; Prakash, L.; Roy, G.G.; Jha, M.N.; Mascarenhas, M.; Panda, S.K. Prediction of earing defect and deep drawing behavior of commercially pure titanium sheets using CPB06 anisotropy yield theory. J. Manuf. Process. 2018, 33, 256–267. [Google Scholar] [CrossRef]
- Jianjun, W.; Bao, W.; Weiping, L. Mechanical properties and planar anisotropy of TC1 titanium alloy sheet. Rare Met. Mater. Eng. 2017, 46, 363–369. [Google Scholar] [CrossRef]
- Liu, D.K.; Huang, G.S.; Gong, G.L.; Wang, G.G.; Pan, F.S. Influence of different rolling routes on mechanical anisotropy and formability of commercially pure titanium sheet. Trans. Nonferrous Met. Soc. China 2017, 27, 1306–1312. [Google Scholar] [CrossRef]
- Wang, Q.L.; Novella, M.F.; Guiotti, A.; Bruschi, S. Anisotropy influence on flow behaviour and plastic instability of Ti6Al4V sheets deformed in a wide range of temperatures and strain rates. Proc. Eng. 2017, 207, 2161–2166. [Google Scholar] [CrossRef]
- Tang, B.; Wang, Q.; Guo, N.; Li, X.; Wang, Q.; Ghiotti, A.; Bruschi, S.; Luo, Z. Modeling anisotropic ductile fracture behavior of Ti-6Al-4V titanium alloy for sheet forming applications at room temperature. Int. J. Solids Struct. 2020, 207, 178–195. [Google Scholar] [CrossRef]
- Zhang, K.; Badreddine, H.; Saanouni, K. Ductile fracture prediction using enhanced CDM model with Lode angle-dependency for titanium alloy Ti-6Al-4V at room temperature. J. Mater. Process. Technol. 2020, 277, 116462. [Google Scholar] [CrossRef]
- Naranjo, J.A.; Miguel, V.; Martínez, A.; Coello, J.; Manjabacas, M.C. Evaluation of the formability and dimensional accuracy improvement of Ti6Al4V in warm SPIF processes. Metals 2019, 9, 272. [Google Scholar] [CrossRef]
- Sirvin, Q.; Velay, V.; Bonnaire, R.; Penazzi, L. Mechanical behaviour modelling and finite element simulation of simple part of Ti-6Al-4V sheet under hot/warm stamping conditions. J. Manuf. Process. 2019, 38, 472–482. [Google Scholar] [CrossRef]
- Martinez, A.; Miguel, V.; Coello, J. A new approach to evaluate bending forces for deep-drawing operations of a TRIP700+EBT steel sheet. Int. J. Mater. Form. 2018, 11, 619–641. [Google Scholar] [CrossRef]
- Ahn, K. Plastic bending of sheet metal with tension/compression asymmetry. Int. J. Solids Struct. 2020, 204–205, 65–80. [Google Scholar] [CrossRef]
- Ayllon, J.; Miguel, V.; Coello, J.; Martinez-Martinez, A. Experimental results and constitutive model of the mechanical behavior of Ti6Al4V alloy at high temperature. Proc. Manuf. 2019, 41, 723–730. [Google Scholar]


| Material | Ti | V | Al | Fe | C | O | N | Y | H | O + H |
|---|---|---|---|---|---|---|---|---|---|---|
| Ticp2 | Remainder | - | - | 0.09–0.10 | 0.01 | 0.14–0.15 | <0.01 | - | 0.002 | - |
| Ti6Al4V | Remainder | 4.01–3.97 | 6.19–6.16 | 0.18–0.16 | 0.017–0.014 | 0.20–0.19 | 0.008–0.007 | <0.0004 | - | 0.21–0.20 |
| Material | Direction | Q | ||||||||
|---|---|---|---|---|---|---|---|---|---|---|
| Ticp2 | 0° | 1.428 | 8.786 | 0.050 | −2.13 × 10⁻⁶ | 1.553 | 115167.7 | −1.25 × 10⁻⁵ | −0.017 | 10,000 |
| 90° | 1.428 | 8.786 | 0.050 | −2.13 × 10⁻⁶ | 1.553 | 114321.7 | −1.25 × 10⁻⁵ | −0.018 | 10,000 | |
| Ti6Al4V | 0° | 1.428 | 8.786 | 0.050 | −3.84 × 10⁻⁶ | 2.389 | 2491.76 | −1.92 × 10⁻⁴ | −0.005 | 10,000 |
| 90° | 49.667 | 45.919 | 8.59 × 10⁻⁴ | 1.80 × 10⁻³ | −255.98 | 7.94 | −0.082 | −0.507 | 10,000 | |
| Material | Direction | |||||||||
| Ticp2 | 0° | 1558.61 | −0.003 | 0.088 | −0.009 | −7.43 × 10⁻⁵ | 1.53 × 10⁻⁴ | 0.050 | −0.330 | |
| 90° | 1657.95 | −0.003 | 0.051 | −0.011 | −7.44 × 10⁻⁵ | 1.53 × 10⁻⁴ | 0.050 | −0.330 | ||
| Ti6Al4V | 0° | 1792.25 | −0.001 | 0.021 | −0.003 | −8.26 × 10⁻⁵ | 1.54 × 10⁻⁴ | 4.33 × 10⁻⁷ | 0.013 | |
| 90° | 1746.26 | −0.001 | 0.005 | −0.004 | −8.72 × 10⁻⁵ | 1.55 × 10⁻⁴ | 4.33 × 10⁻⁷ | 0.013 |
Publisher’s Note: MDPI stays neutral with regard to jurisdictional claims in published maps and institutional affiliations. |
© 2021 by the authors. Licensee MDPI, Basel, Switzerland. This article is an open access article distributed under the terms and conditions of the Creative Commons Attribution (CC BY) license (http://creativecommons.org/licenses/by/4.0/).
Share and Cite
Ayllón, J.; Miguel, V.; Martínez-Martínez, A.; Coello, J.; Naranjo, J.A.; García-Sevilla, F. Compression Behavior of Sheets Metals of Pure Titanium 2 and Ti6Al4V Alloy under High Temperature: Evaluation of the Tension–Compression Asymmetry. Metals 2021, 11, 168. https://doi.org/10.3390/met11010168
Ayllón J, Miguel V, Martínez-Martínez A, Coello J, Naranjo JA, García-Sevilla F. Compression Behavior of Sheets Metals of Pure Titanium 2 and Ti6Al4V Alloy under High Temperature: Evaluation of the Tension–Compression Asymmetry. Metals. 2021; 11(1):168. https://doi.org/10.3390/met11010168
Chicago/Turabian StyleAyllón, Jorge, Valentín Miguel, Alberto Martínez-Martínez, Juana Coello, Jesús Andrés Naranjo, and Francisco García-Sevilla. 2021. "Compression Behavior of Sheets Metals of Pure Titanium 2 and Ti6Al4V Alloy under High Temperature: Evaluation of the Tension–Compression Asymmetry" Metals 11, no. 1: 168. https://doi.org/10.3390/met11010168
APA StyleAyllón, J., Miguel, V., Martínez-Martínez, A., Coello, J., Naranjo, J. A., & García-Sevilla, F. (2021). Compression Behavior of Sheets Metals of Pure Titanium 2 and Ti6Al4V Alloy under High Temperature: Evaluation of the Tension–Compression Asymmetry. Metals, 11(1), 168. https://doi.org/10.3390/met11010168