Article

The Creep and Oxidation Behaviour of Pesting-Resistant (Mo,Ti)5Si3-Containing Eutectic-Eutectoid Mo-Si-Ti Alloys

Karlsruhe Institute of Technology (KIT), Institute for Applied Materials (IAM-WK), Engelbert-Arnold-Straße 4, 76131 Karlsruhe, Germany
*
Author to whom correspondence should be addressed.
Metals 2021, 11(1), 169; https://doi.org/10.3390/met11010169
Submission received: 11 November 2020 / Revised: 7 January 2021 / Accepted: 12 January 2021 / Published: 18 January 2021
(This article belongs to the Special Issue Creep Behavior of Metals and Alloys)

Abstract

:
In this study we present a series of light-weight (6.24 to 6.42 g/cm3), Ti-rich Mo-Si-Ti alloys (≥40 at.% nominal Ti content) with the hitherto best combination of pesting and creep resistance at 800 and 1200 °C, respectively. This has been achieved by fine-scaled eutectic-eutectoid microstructures with substantial fractions of primarily solidified (Mo,Ti)5Si3. (Mo,Ti)5Si3 was found to be oxidation-resistant in these alloys and also beneficial for the creep resistance. The enhanced solidus temperature is of specific relevance with respect to the latter point. The creep resistance is competitive to the non-pesting resistant, but most creep-resistant (among the Mo-Si-Ti alloys) eutectoid alloy Mo-21Si-34Ti developed by Schliephake et al. [Schliephake et al., in Intermetallics 104 (2019) pp. 133–142]. Moreover, it is favourably superior to the commercially applied Ni-based single crystal alloy CMSX-4 for the applied compressive loading conditions under vacuum.

1. Introduction

High-temperature applications demand materials with manifold property profiles, including especially suitable creep and oxidation resistance. International research activities have been facing tough challenges in order to achieve those properties in Mo-Si-based alloys. Understanding and suppression of the so-called ”pesting“-phenomenon [1,2] below temperatures of 1000 °C is of major interest [3,4,5,6]. Pesting is the common term for typical catastrophic oxidation behaviour being characterised by either volatilisation of the oxidation product or sample degradation caused by the formation of high voluminous solid oxides at interfaces like grain boundaries [1,2,7]. This oxidation behaviour is observed in well evolved creep-resistant Mo-Si-B-(Ti) alloys, due to the formation of volatile MoO3; even though, these alloys benefit from the formation of a low viscous borosilicate layer at temperatures above 1000 °C [8,9]. Based on the previous idea of macro-alloying Mo-Si-B alloys with Ti, which led to a significant reduction in density and an improvement of the oxidation behaviour at higher temperatures [8,9], B-free Mo-Si-Ti alloys have been developed [4,10,11]. The ternary Mo-Si-Ti system profits from eutectic and eutectoid phase reactions [12,13], which result in fine-scaled microstructures, which are likely to be beneficial for a sufficient oxidation behaviour. The development of eutectic-eutectoid Mo-Si-Ti alloys has shown promising results [10]. A fully eutectic alloy Mo-20Si-52.8Ti (at.%) composed of bcc Mo solid solution MoSS and intermetallic hexagonal D88 (Ti,Mo)5Si3 was found to possess an outstanding oxidation behaviour in the pesting regime at 800 °C [11] even up to 1000 h of oxidation [4] combined with a reasonable creep resistance at 1200 °C [11]. Further alloy design led to eutectic-eutectoid alloys without any significant primary solidification (other than (Mo,Ti)3Si, which serves as the precursor of the eutectoid fraction in the microstructure). These alloys are composed of MoSS + (Ti,Mo)5Si3 (hexagonal Mn5Si3-type, D88) and MoSS + (Mo,Ti)5Si3 (tetragonal W5Si3-type) regions, respectively and withstand catastrophic oxidation at 800 °C when the threshold of the nominal Ti concentration of 43 at.% is exceeded [10]. The suitable oxidation resistance is attributed to the formation of thin mixed SiO2-TiO2 oxide scales outbalancing the evaporation of MoO3. Furthermore, the Ti content in the pesting-critical phase MoSS (strongly correlating to the nominal Ti content in the alloy) is found to be decisive whether pesting can be suppressed or not. In order to combine an adequate oxidation resistance with a suitable creep performance within this alloy system an optimum ratio of Ti/Mo needs to be established. An increase in Mo content leads to an increased solidus temperature and therefore improved creep resistance on the one hand, but to a deterioration of the oxidation resistance on the other hand, as MoO3 formation is getting more dominant. However, the potential of these eutectic-eutectoid alloys seems to be already exploited as it is shown that the creep resistance is mainly determined by the solidus temperature of the alloys [10].
Consequently, the predicament within these alloys is the ratio of Mo to Ti, which determines the solidus temperature, and thus, the creep resistance [10]. Conclusively, the best creep performing and pesting-resistant alloy is the one with a sufficient Ti content providing pesting stability, but maximised Mo content for creep resistance. Hence, Mo-21Si-43.4Ti, presented in [10], is presumably the best choice for an optimum creep and pesting resistance.
For further improvement of the creep resistance, while maintaining pesting-stability, strengthening phases need to be considered. As Ti5Si3 is known to possess an inferior creep resistance compared to the other phases, which are thermodynamically stable in the Ti-/Mo-rich Mo-Si-Ti system, (Mo,Ti)5Si3 is considered as strengthening phase by primary solidification. Mo5Si3 is especially targeted, as it is known to be creep-resistant [14], but also pesting-resistant when macro-alloyed with 40 at.% Ti [15,16]. Supported by thermodynamic calculations, tailored eutectic-eutectoid microstructures with varying fractions of primary (Mo,Ti)5Si3 crystals will be presented over the course of this article. In conjunction with microstructural analysis, compression creep testing is conducted for evaluation of the achieved creep performance, which is compared to the commercially applied single crystal Ni-based superalloy CMSX-4 providing a frame of reference of industrial relevance.

2. Materials and Methods

The alloy design was guided by thermodynamic calculations based on the Calphad approach (Calculation of Phase Diagrams), which were performed using Pandat (version of 2018) and a commercially available PanMo2018a database (both CompuTherm LLC, Middleton, WI, USA).
The standard arc-melting route was applied to manufacture the investigated alloys from high-purity elements (Mo: 99.95%, Si: 99.99%, Ti: 99.8%). An arc melter of type AM/0,5 (Edmund Bühler GmbH, Bodelshausen, Germany) was used with a water-cooled Cu crucible. An Ar atmosphere was established after evacuating and flooding multiple times and cleaned from O residuals by means of melting a Zr getter in advance. The melting process was performed five times in a half mould crucible and the last melting step in a cuboid-shaped one. The resulting composition was confirmed to deviate less than 0.5 wt.% from the nominal composition, which was initially weighted in.
The samples were machined by electrical discharge machining (EDM) and afterwards ground down to SiC grit P2500. Further polishing steps, including a final step with colloidal suspension OP-S (Buehler ITW, Esslingen, Germany), were performed depending on their intended use. While all faces of the oxidation samples and the punch contact faces of the compression creep samples were prepared by grinding, the microstructural samples for secondary electron analysis (SEM) were additionally polished.
Hardness tests were performed at room temperature by means of a Q10A+ Vickers hardness tester (Qness ATM GmbH, Mammelzen, Germany). A load of 9.8 N (HV10) was applied. Five individual indentations were used for determination of the average hardness.
Cyclic oxidation testing was performed with samples of dimensions of (5 × 5 × 4) mm3, which were taken from the middle of the as-cast cuboid by EDM. The samples were placed in Al2O3 crucibles throughout the whole testing procedure. The cycles were conducted in a muffle furnace at 800 °C (and 1200 °C) in stationary laboratory air. Between each cycle, cooling down to room temperature was allowed within 15 min. Then, the weight was precisely determined, namely, ±1 µg, by means of a high precision balance. The first cycles lasted 1 h and were extended to 5 and 10 h after 20 and 50 h total test duration, respectively, as illustrated in Figure 1.
The creep tests were performed at constant true compressive stresses between 50 to 300 MPa at 1200 °C under vacuum (<2 × 10⁻³ mbar) on parallelepiped creep samples with dimensions of (5 × 3 × 3) mm3, which were machined from the center of the as-cast cuboid. Vacuum was used here to exclude possible superimposed impact of oxidation on the creep performance. For that, a universal testing machine of type Z100 (ZwickRoell, Ulm, Germany) was used, which was combined with a vacuum furnace (Maytec GmbH, Olching, Germany). Si3N4 compression punches were used and the impact of friction between them and the creep samples was minimised by lubricating the contacting faces with hexagonal BN. Creep strain was continuously monitored by utilising extensometer with three Al2O3 sticks, detecting the distance to the upper crosshead as well as the reference distance to the lower compression punch. Additionally, compression tests were performed for selected alloys at 1200 °C. The same testing machine and sample geometry were used as for the compression creep tests. An initial strain rate of 10−3 s−1 was applied.
Scanning electron microscopy (SEM) analysis was carried out in order to study the microstructure in the as-cast state, after oxidation and creep testing. An EVO 50 SEM with an integrated energy dispersive X-ray spectroscopy (EDX) system (Thermo Fisher Scientific Inc., Waltham, USA) was used, as well as an Auriga 60 SEM (Carl Zeiss AG, Oberkochen, Germany). An operating acceleration voltage of 20 kV was applied. The constituting phases were distinguished by applying backscatter electron imaging (BSE) in combination with EDX measurements and were identified by X-ray diffraction (XRD). For the latter, a D2 Phaser (Bruker Corporation, Karlsruhe, Germany)was used, which was operated in Bragg–Brentano geometry. The measurements were performed with Cu Kα radiation at 30 kV and 10 mA. Ni foil was used for filtering the resulting radiation, which was then detected by means of a LynxEye line detector by at a step size of 0.01° in 2Θ.
Moreover, the areal fractions of the constituting phases/microstructural regions were determined from BSE micrographs by manual assignment and greyscale evaluation with the image processing software Corel Photo Paint and ImageJ. The areal fractions were regarded as volume fractions based on the assumption that the microstructures are isotropic and isometric. The microstructural length scale was evaluated by determining the interface boundary fraction P by a line intersection method analogous to [5]. P is calculated by the number of intersections N ¯ of the lines with phase boundaries and of the overall line length L , as expressed in the following equation:
P   =   2 N ¯ L .

3. Results and Discussion

3.1. Alloy Design and Microstructural Characterisation

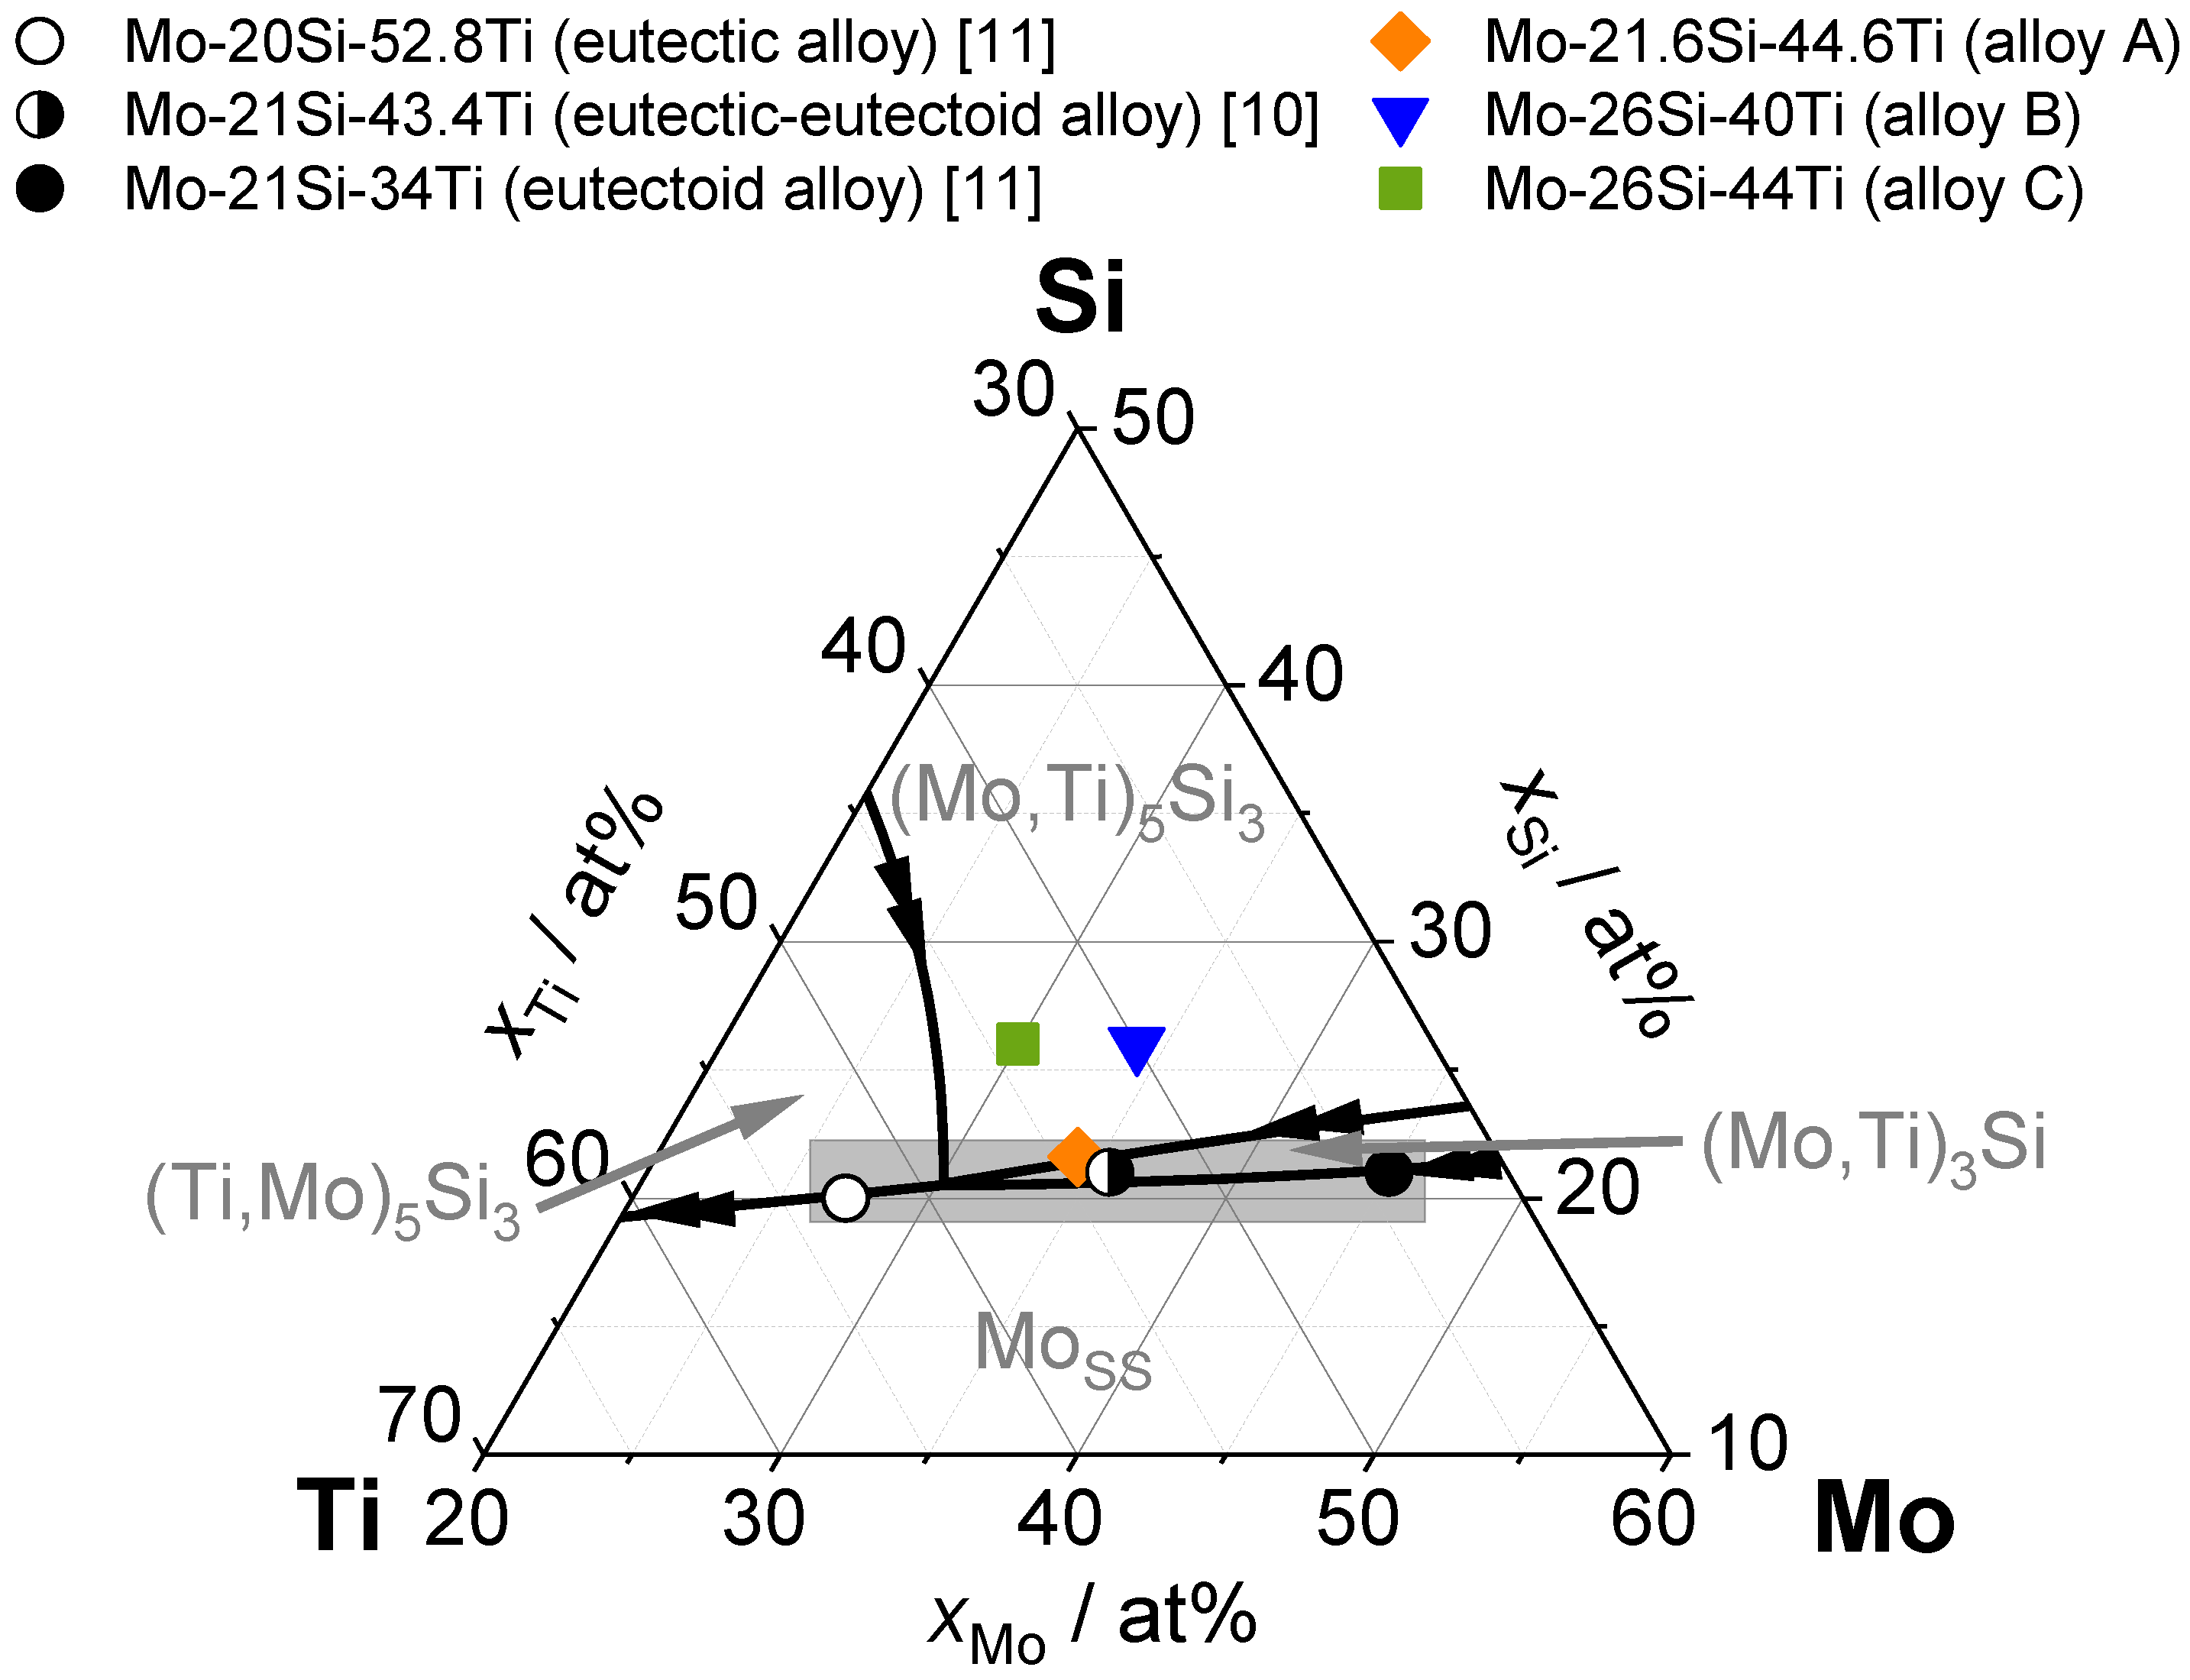
Figure 2 represents the liquidus projection of the Mo-Si-Ti phase diagram with the composition ranges of the primarily solidifying phases as denoted in grey colour. The initial eutectic-eutectoid alloy development as studied in [5,10] has been performed within the grey rectangle framed by a fully eutectic (white circular symbol) and eutectoid alloy (black circular symbol).
In this article, the above mentioned Mo-21Si-43.4Ti alloy represents the intermediate eutectic-eutectoid reference alloy without primarily solidified (Mo,Ti)5Si3 (half-opened circular symbol). In order to investigate the impact of primarily solidified (Mo,Ti)5Si3 on the creep behaviour, the pesting-resistant alloy Mo-21.6Si-44.6Ti [5] (here designated as alloy A, orange diamond symbol) is of particular interest, as it is just located in the primary solidification region of (Mo,Ti)5Si3 and, thus, comprises a low fraction of primarily solidified (Mo,Ti)5Si3. Additionally, significant primary solidification of (Mo,Ti)5Si3 is triggered by considerably increasing the Si content (here to 26 at.%), which is pursued in two novel alloys: Mo-26Si-40Ti (designated as alloy B, blue triangular symbol) and Mo-26Si-44Ti (designated as alloy C, green square symbol). The Ti content is varied here deliberately with the purpose of investigating the creep behaviour of alloys with different Mo to Ti ratios and, thus, different solidus temperatures (see Table 1).
The compositional and microstructural, as well as physical details of the investigated alloys are summarised in Table 1. It is revealed that the fraction of silicide phases is increased from around 50 vol.% in the eutectic-eutectoid reference alloy and alloy A up to more than 70 vol.% in the high (Mo,Ti)5Si3-containing alloys B and C. The hardness at room-temperature was determined to be in the range of 660 to 730 HV10 for the eutectic and eutectic-eutectoid reference alloy. The (Mo,Ti)5Si3-containing alloys B and C exhibit 820 to 960 HV10.
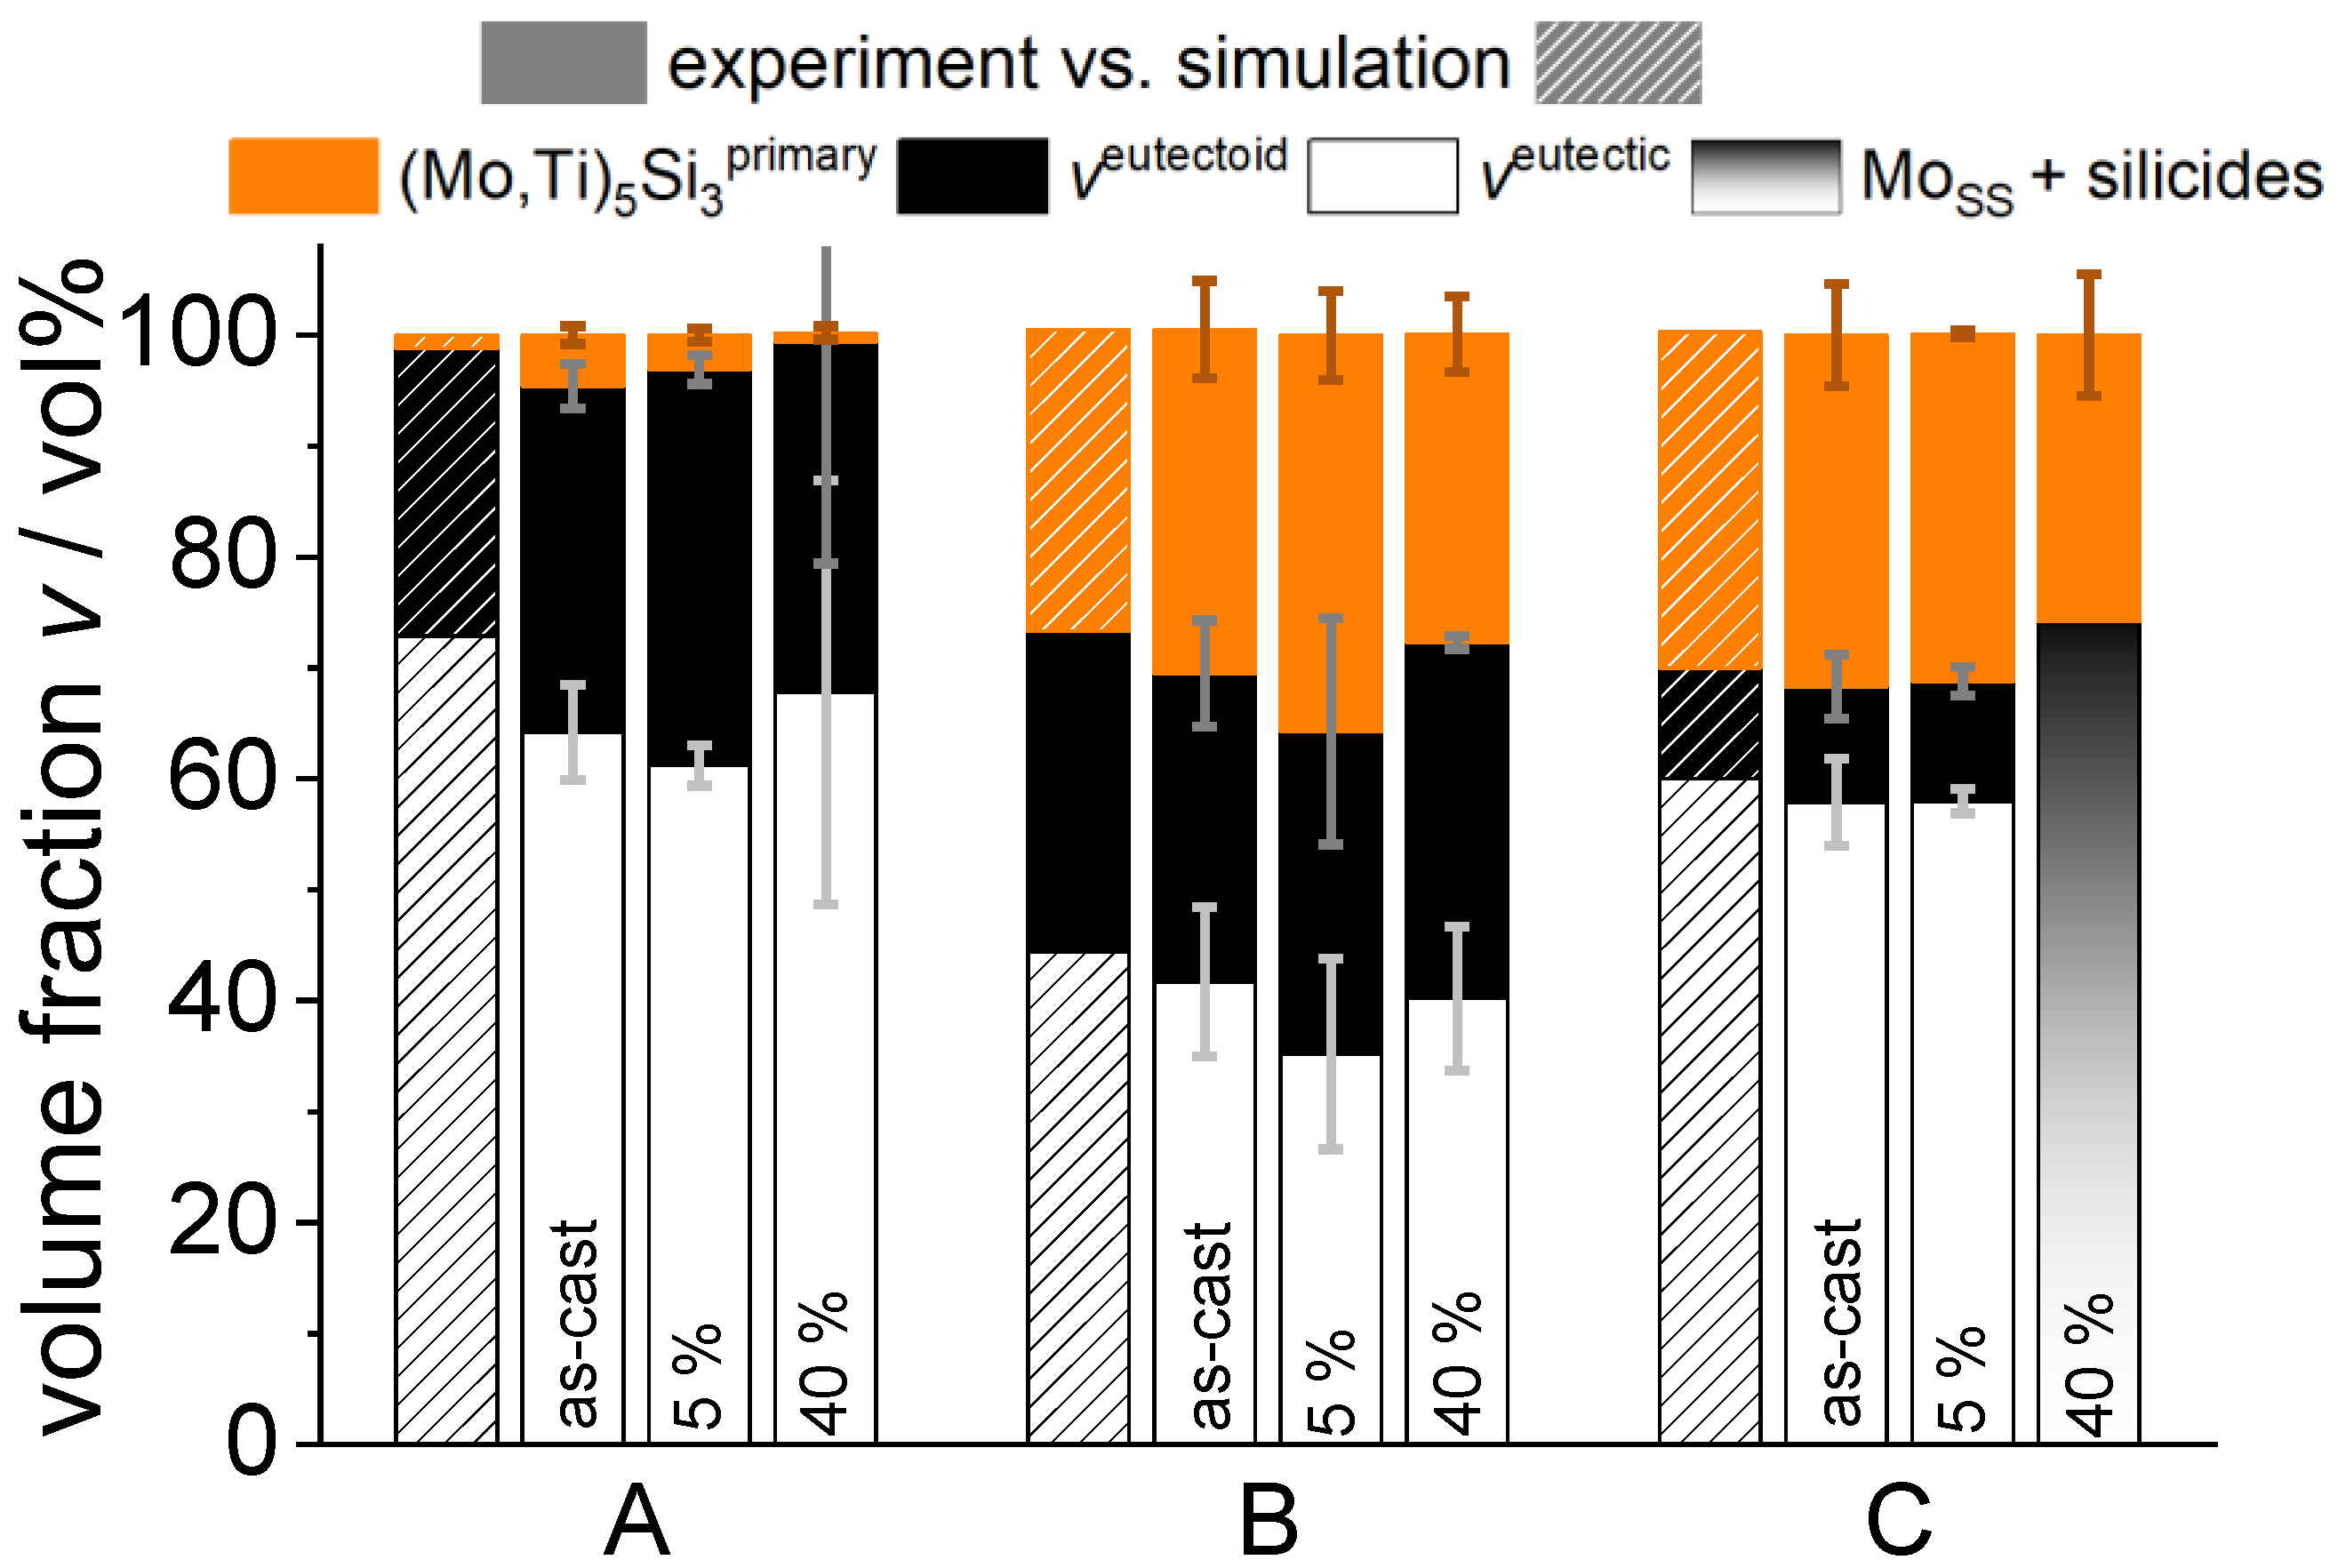
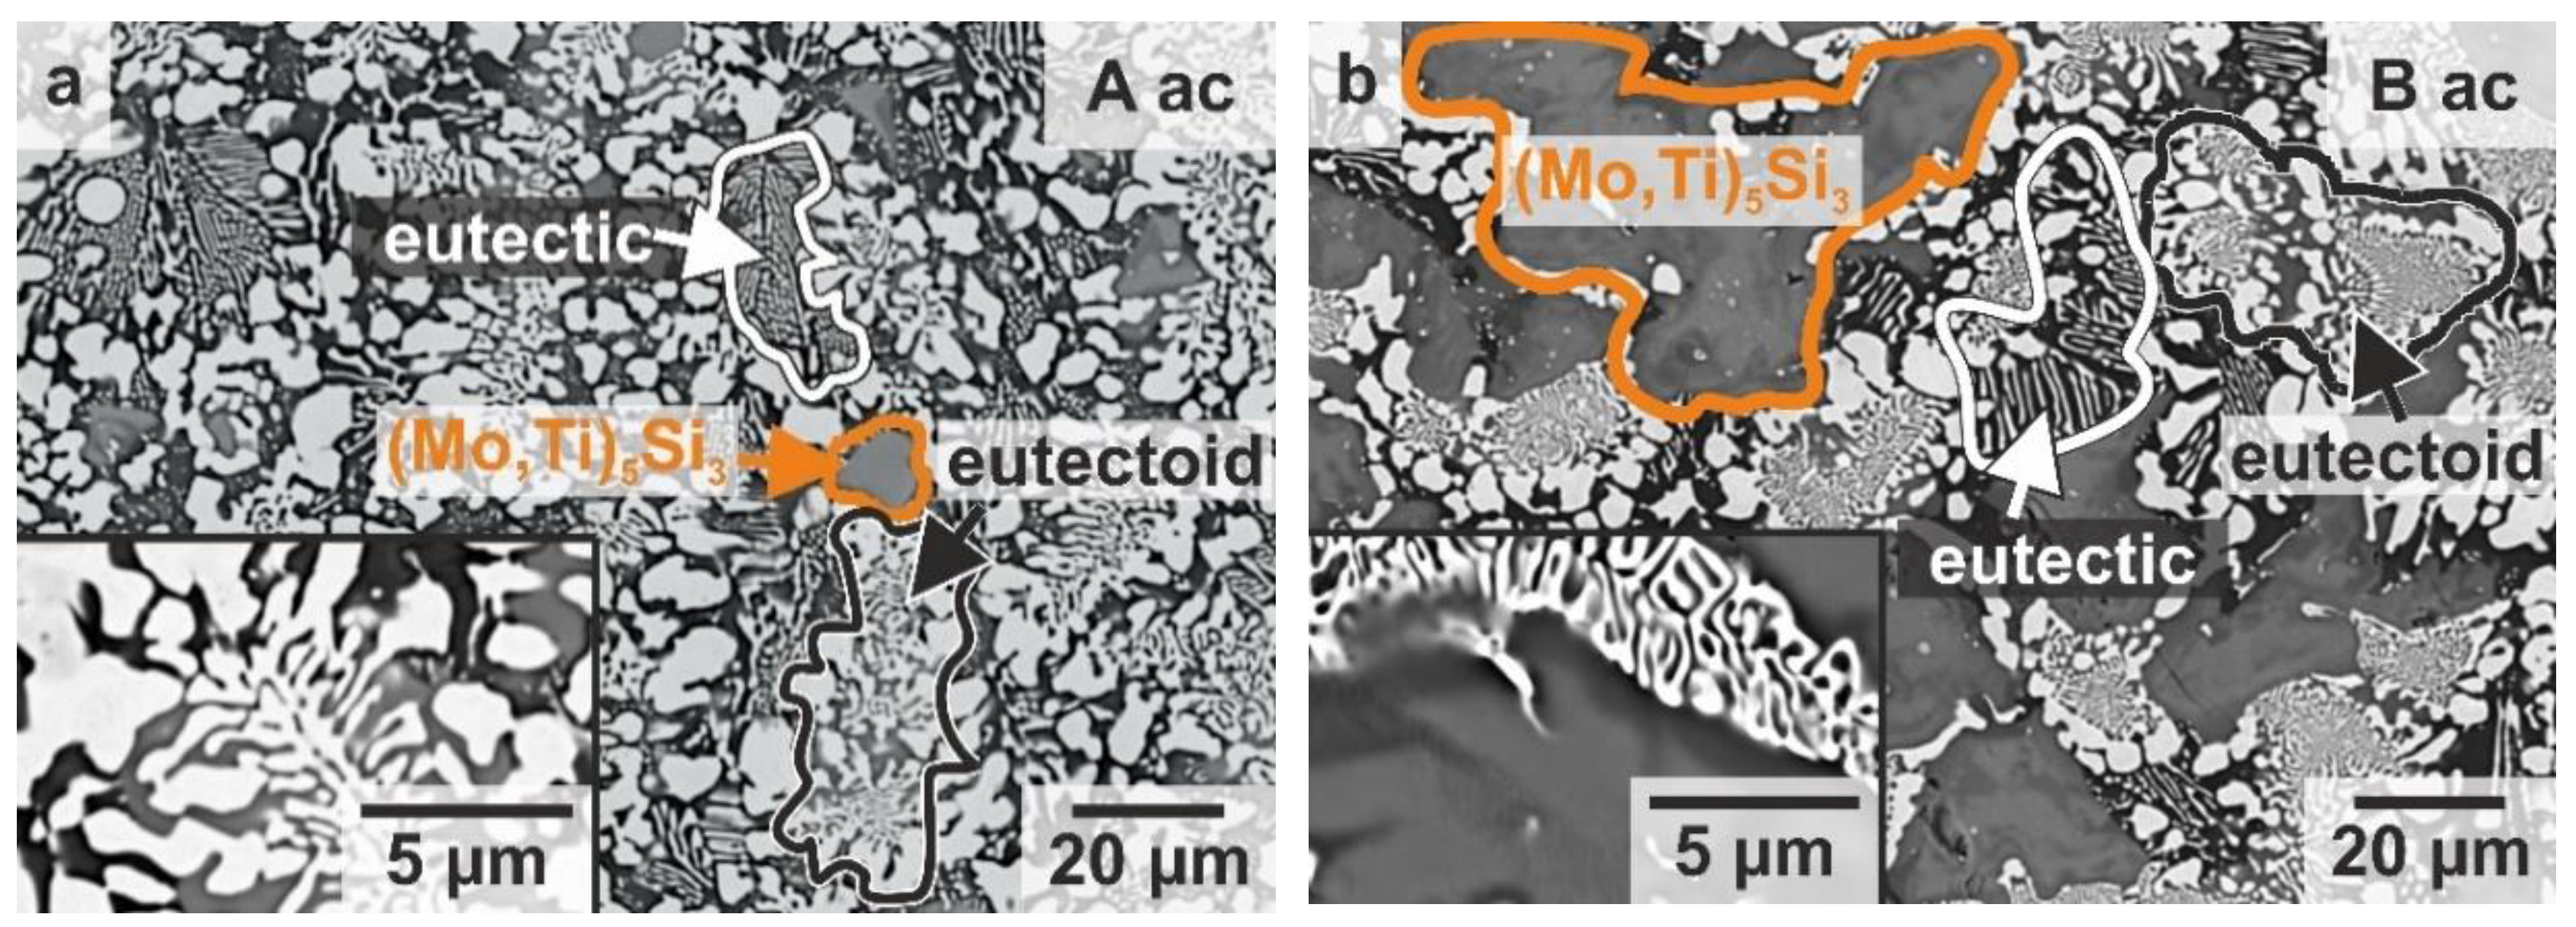
The corresponding as-cast (ac) microstructures of the alloys A to C are shown in Figure 3a–c. The eutectic and eutectoid regions (formed from (Mo,Ti)3Si) are distinguished by both, the greyscale value of the silicide phase caused by the Z -contrast in BSE imaging mode (bright grey: (Mo,Ti)5Si3, dark grey: (Ti,Mo)5Si3 vs. white: MoSS) and the morphology indicating the solidification sequence from which the respective microstructural constituents originate. The eutectic regions originate from the final solidification step of the residual melt and are, therefore, apparent in interdendritic form, while the eutectoid regions are either present as dendrites (alloys A and B) or located adjacent to (Mo,Ti)5Si3 regions (alloy C). The transition between the eutectic and eutectoid regions is shown in higher magnification in the insets in Figure 3. Alloy A is characterized by an intermixed eutectic-eutectoid matrix with a small fraction of embedded globularly-shaped (Mo,Ti)5Si3 precipitates, which are considered as primarily solidified (see Figure 3a). In contrast, alloys B and C reveal a high fraction of primarily solidified (Mo,Ti)5Si3 particles, which are surrounded by eutectic, as well as by eutectoid regions (see Figure 3c,d). The presence of bcc MoSS, hexagonal D88 (Ti,Mo)5Si3 and tetragonal W5Si3-type (Mo,Ti)5Si3 was confirmed by XRD (see Figure A1). (Mo,Ti)3Si is completely decomposed during the eutectoid decomposition. The comparison of the experimentally determined volume fraction of the microstructural constituents with the thermodynamic predictions reveals good agreement, especially in alloys B and C (see Figure 3d). The increase in Ti content from alloy B to C leads to a reduction in eutectoid volume fraction from (28 ± 5) to (10 ± 3) vol.%, while the amount of primarily solidified (Mo,Ti)5Si3 remains nearly unaffected in the range of (30 ± 5) vol.%. The latter is determined by the temperature range during which primary solidification of (Mo,Ti)5Si3 occurs, which was found to be comparable for both alloys by thermodynamic solidification simulations.

3.2. Investigation of the Oxidation Behaviour at 800 and 1200 °C

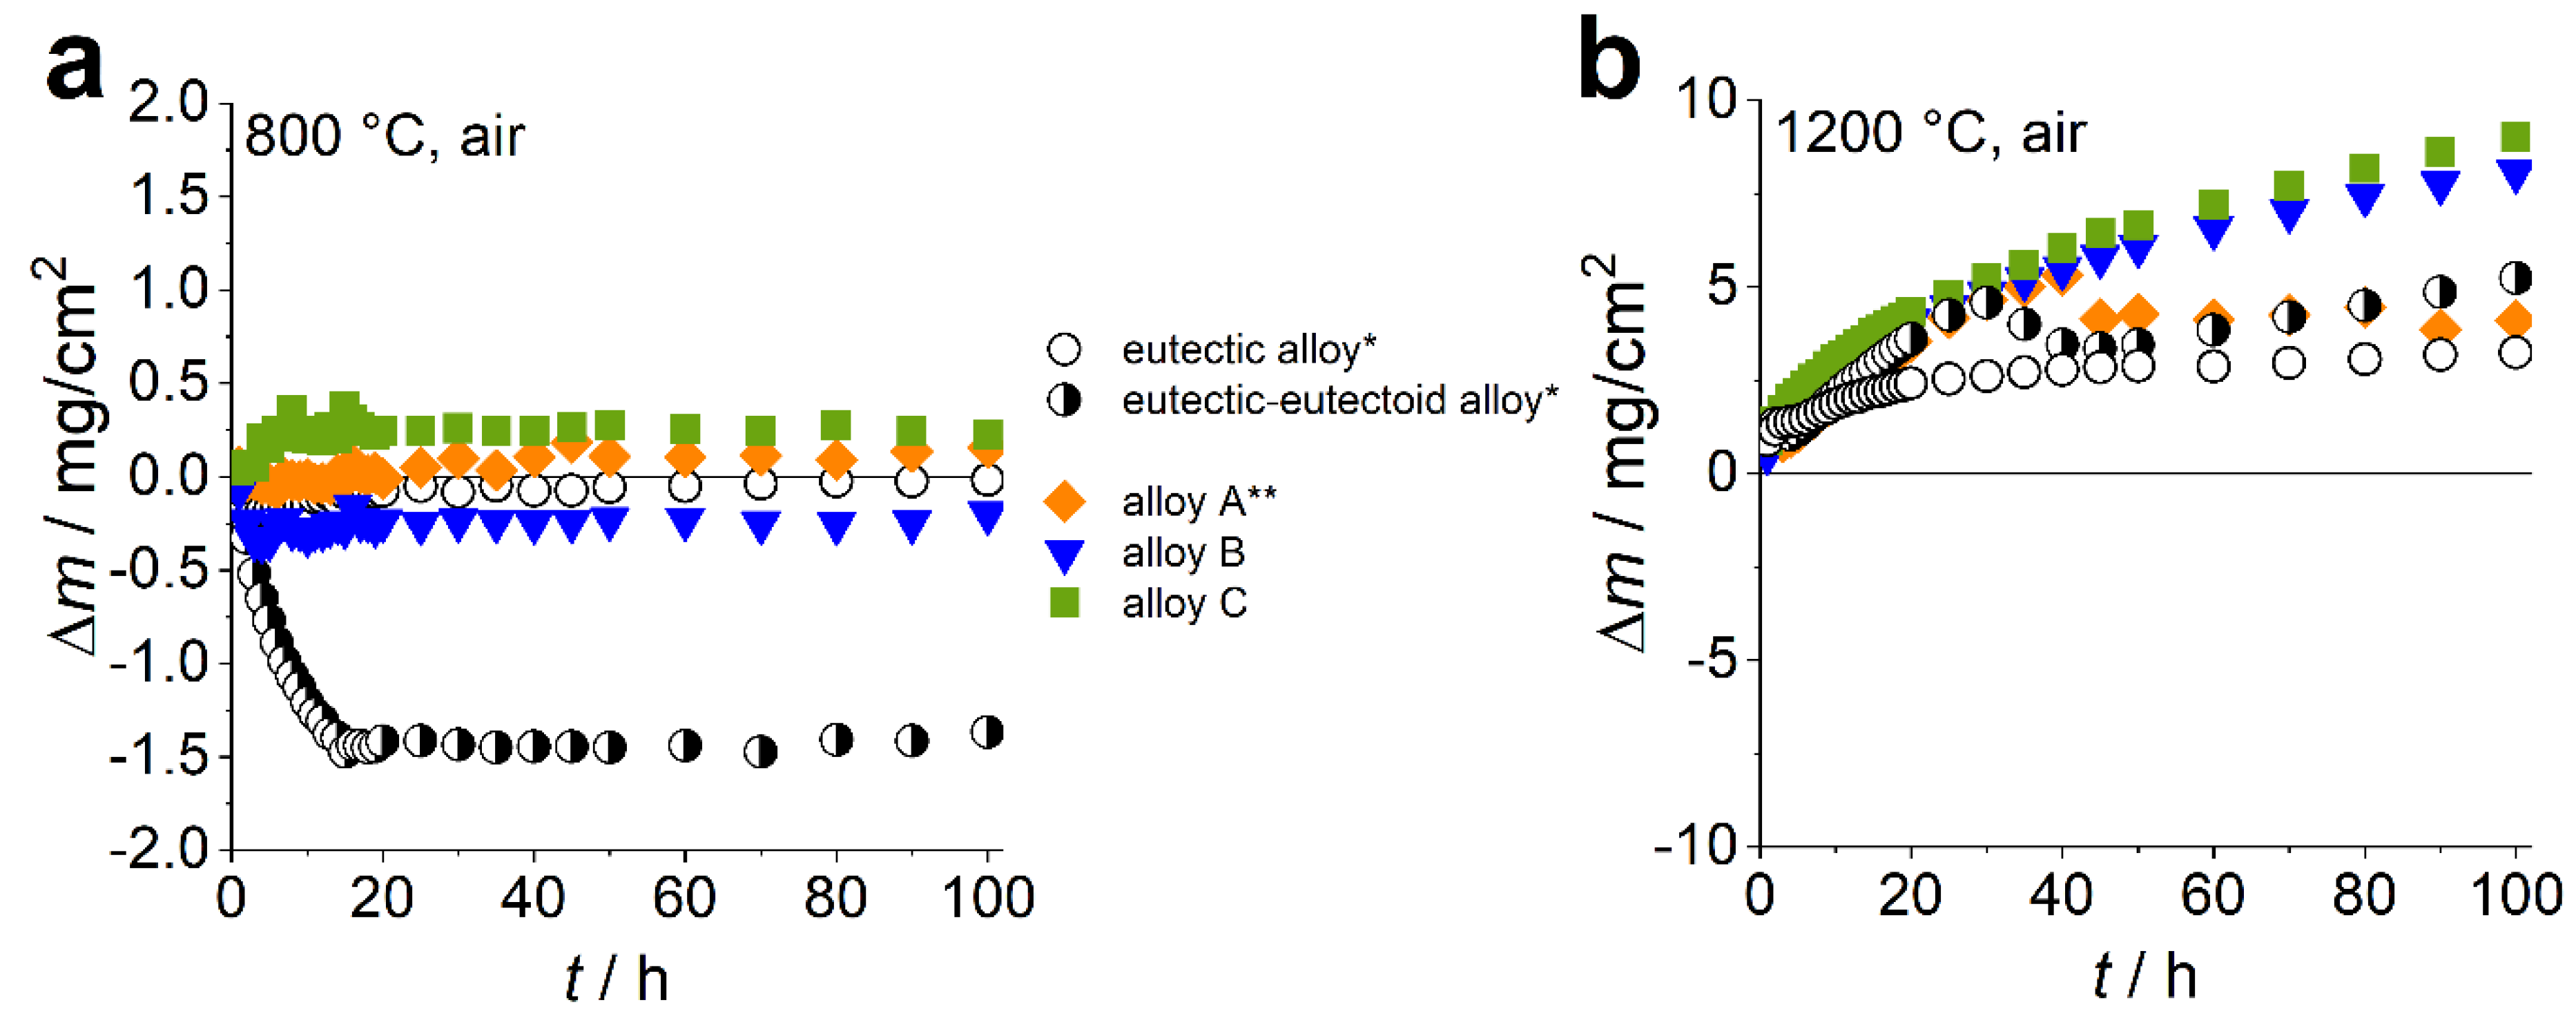
Prior to assessing the creep behaviour of the (Mo,Ti)5Si3-containing alloys, the oxidation resistance is briefly addressed at 800 and 1200 °C, as these alloys are only viable when being oxidation-resistant, especially pesting-resistant below 1000 °C. Therefore, small mass changes (smaller than ± 5 mg/cm2) are targeted in conjunction with thin oxide scale growth for achieving pesting-resistance. A temperature of 800 °C represents the critical pesting regime, whereas 1200 °C is regarded as future application temperature and the temperature creep is assessed at in the last part of this publication. The results on the cyclic oxidation experiments at 800 °C are depicted in Figure 4a (note that three specimens were tested for each alloy, but only one representative sample is shown). In general, the observed mass changes are a superposition of mass gain due to solid oxide scale growth and mass loss caused by evaporation of gaseous MoO3 [10]. The eutectic alloy Mo-20Si-52.8Ti (opened circles) and the eutectic-eutectoid reference alloy Mo-21Si-43.4Ti (half-filled circles) are considered as benchmark, as these represent excellent [10,11] and just adequate pesting resistance [10], respectively. Alloy A (orange diamonds) has already been oxidation tested and was found to exhibit pesting resistance as well [5]. Therefore, a direct comparison with the novel high (Mo,Ti)5Si3-containing alloys B (blue triangles) and C (green squares) is allowed. Both new alloys exhibit good pesting resistance with mass changes of (−0.2 ± 0.1) (alloy B) and (0.2 ± 0.0) mg/cm2 (alloy C) after 100 h, which is even better compared to the eutectic-eutectoid reference alloy. The negative mass changes observed for alloy B and the eutectic-eutectoid reference alloy are likely to be caused by the initial evaporation of MoO3 until an oxide scale is formed passivating the alloy substrate. As has been previously reported [5,10], the Ti content solved in MoSS is decisive for the suppression of pesting. A threshold of 35 at.% Ti solved in MoSS was postulated to be exceeded in order to achieve pesting resistance [10]. The here investigated alloys A, B, and C comprise 39, 37, and 34 at.% Ti in MoSS (determined by comparing the lattice parameters of bcc MoSS to literature data on resulting Ti concentrations [17], analogous to [10]). These results support the former determined threshold [10] and lead to the suggestion that the threshold can be adjusted to minimum 34 at.% Ti in MoSS for pesting resistance. However, although the Ti content in MoSS is very similar in the eutectic-eutectoid reference alloy (35 at.% [10]) and alloy C (34 at.%), the difference in mass change is considerable. Thus, the high fraction of (Mo,Ti)5Si3 seems to be beneficial and even compensates the conceivable deteriorative impact of the reduced concentration of nominal Ti (43 at.% in the eutectic-eutectoid reference alloy vs. 40 at.% in alloy C).
At 1200 °C, the alloys A to C exhibit adequate oxidation resistance as well (see Figure 4b). Due to accelerated oxide scale growth kinetics at higher temperatures, which hinder the MoO3 volatilization, positive mass changes are observed. The mass changes of alloy A are comparable to the ones observed for the eutectic-eutectoid reference alloy, which are (1.2 ± 5.3) and (2.7 ± 1.9) mg/cm2, respectively [10]. The high (Mo,Ti)5Si3-containing alloys reveal mass changes in the range of (8.0 ± 0.2) (alloy B) and (8.8 ± 0.2) mg/cm2 (alloy C). Note the temporary decline in mass change for alloy A and the eutectic-eutectoid alloy after 30 to 40 h. Since no indications of scale spallation were observed by SEM, it is likely that somehow the evaporation of MoO3 is gaining temporarily dominance.
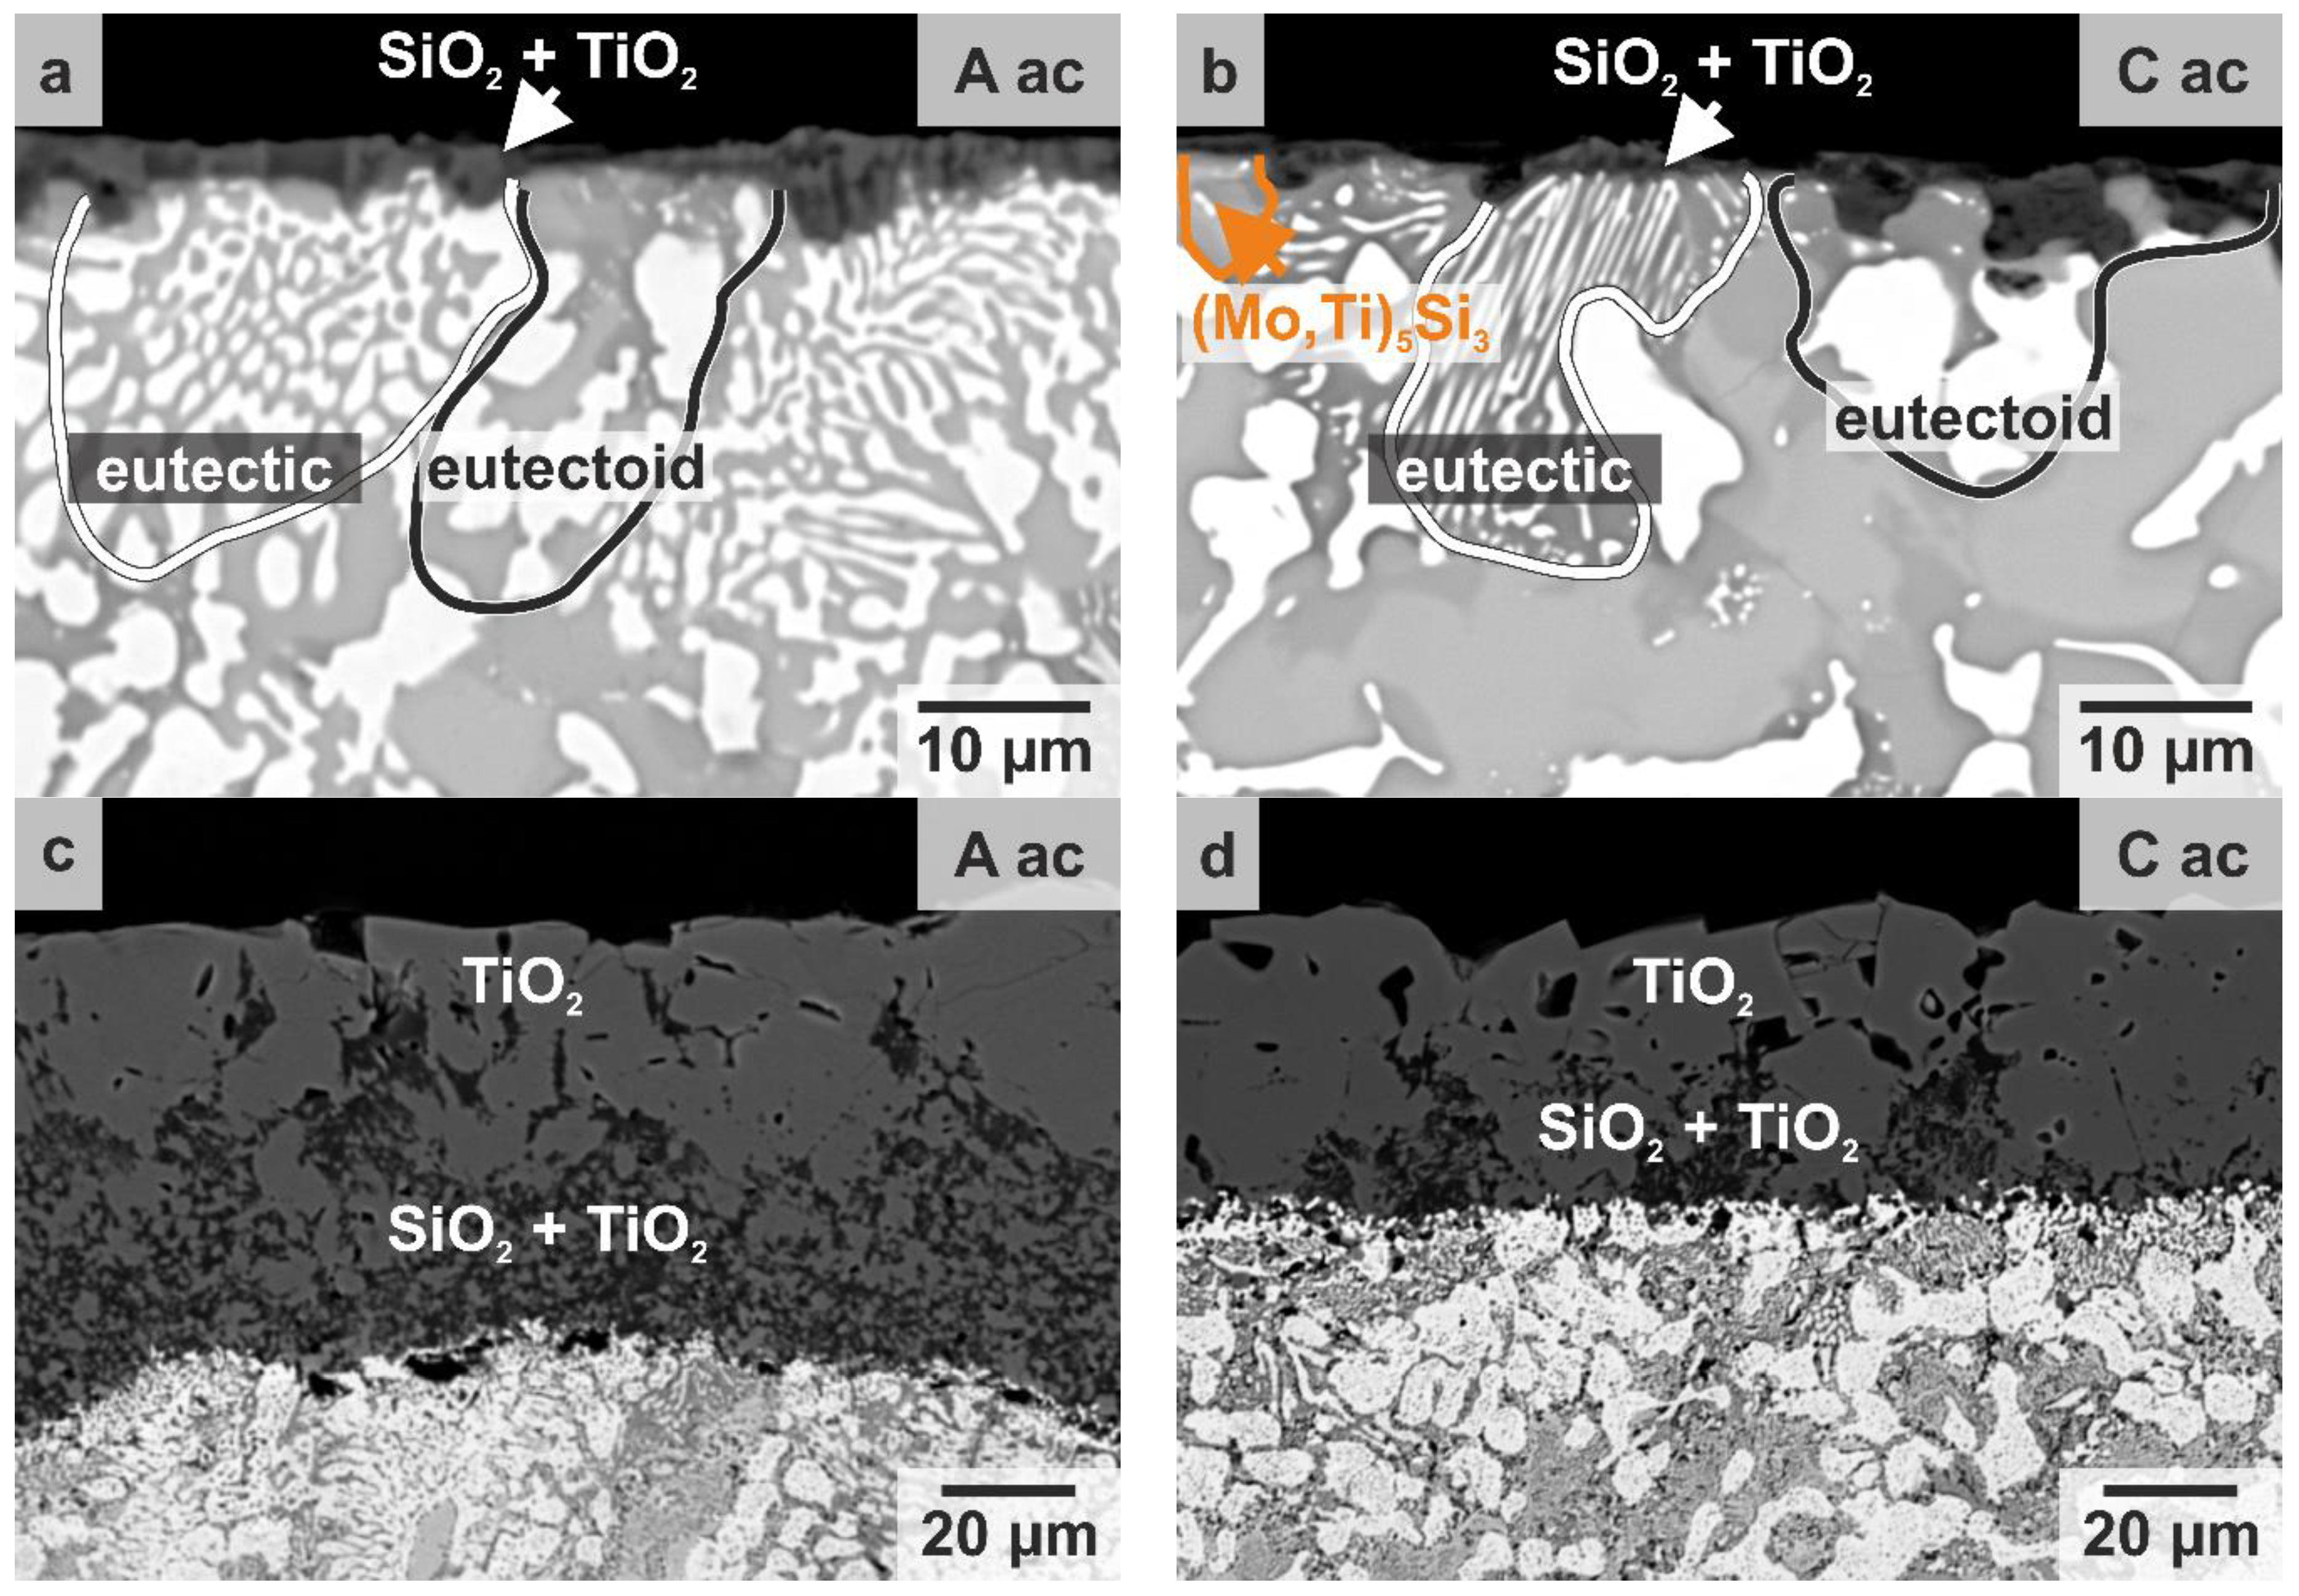
SEM analyses of the oxide scales formed at 800 °C reveal that comparably thin, mixed SiO2-TiO2 oxide scales are formed with thicknesses of (4.3 ± 1.8) (alloy A), (4.1 ± 2.4) (alloy B) and (2.3 ± 1.7) µm (alloy C) after 100 h of cyclic oxidation (see Figure 5a,b, micrographs of the oxide scale formed on alloy B are not included due to similarity to alloy C). The surface-near (Mo,Ti)5Si3 precipitates slowly oxidise outwards to thin oxide scales, while the oxide scale grows quicker and especially inwards on surface-near MoSS regions within the eutectic and eutectoid areas (see Figure 5b). This selective oxidation behaviour is especially observed in the high (Mo,Ti)5Si3-containing alloys B and C.
The oxide scales formed at 1200 °C are characterised by a similar morphology like of the eutectic and eutectic-eutectoid reference alloys [10,11] (see Figure 5c,d). An outer TiO2 oxide scale is formed on top of a SiO2-TiO2 duplex scale with average scale thicknesses of (60 ± 12) (alloy A), (40 ± 16) (alloy B), and (38 ± 7) µm (alloy C) in total. The oxide scales are thinner on the high (Mo,Ti)5Si3-containing alloys B and C with a lower fraction of around (30 ± 7) vol.% SiO2 within the duplex scale. For comparison, the duplex scales formed on the eutectic and eutectic-eutectoid reference alloys are composed of around (50 ± 5) vol.% SiO2 [10,11]. This difference is likely to be caused by the primarily solidified (Mo,Ti)5Si3 particles, which oxidise slower and, therefore, the fast growing TiO2 forming from the MoSS regions is dominating. Some porosity is enclosed at the substrate/oxide scale interface, which is only below 2 vol.% of the oxide scale including the interface region. The surface-near pores or cavities might result from the oxide scale growth. It is assumed that the porosity does not directly affect the oxidation resistance of the investigated alloys.
Conclusively, all alloys are found to be oxidation-resistant at 800 and 1200 °C and are, hence, considered for creep testing.

3.3. Investigation of the Creep Behaviour

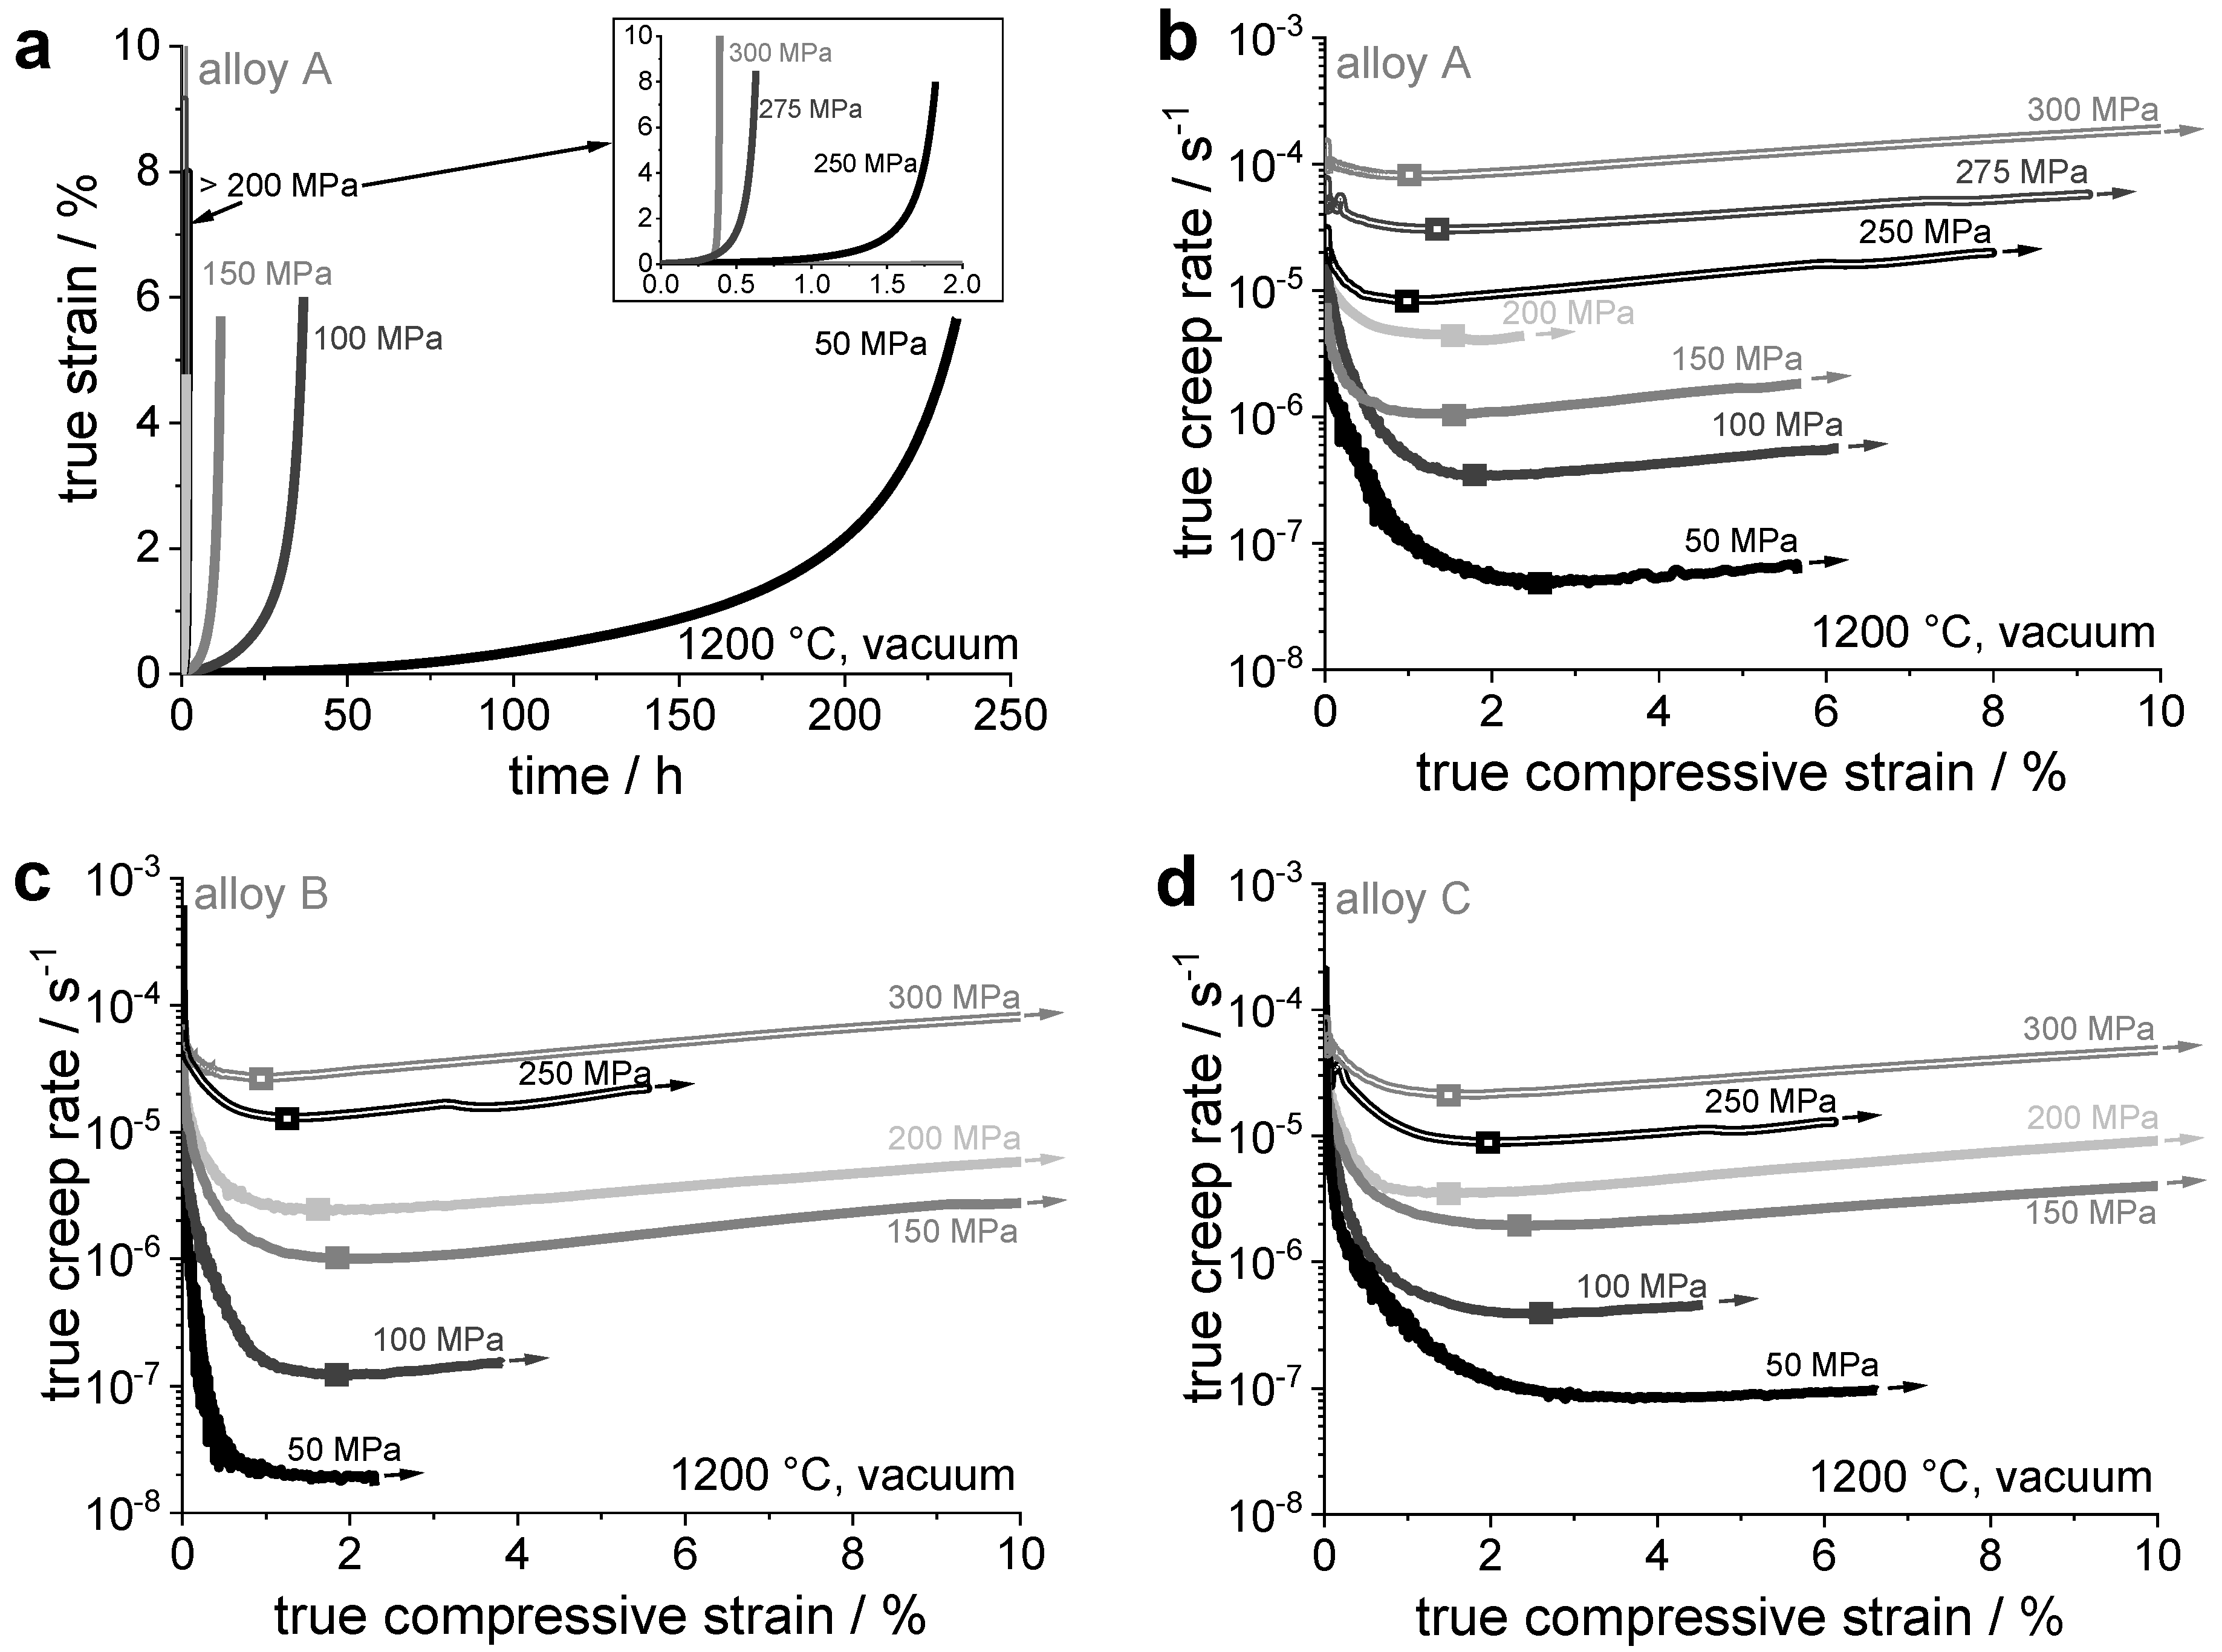
The capability of the developed alloys to withstand plastic deformation caused by constant load at temperature higher than 0.4–0.5 T solidus , namely the creep resistance, is of key importance for future application. Thus, the creep behaviour of the alloys A to C was exemplarily assessed at 1200 °C under compressive true stress σ . The evolution of the true strain with time is shown in Figure 6a for alloy A and the resulting true creep rates are displayed in Figure 6b–d for alloys A to C as a function of true strain. In general, the evolution of the creep rate is characterized by a significant deceleration during the primary stage of creep until a minimum ε ˙ min is reached (marked by square symbols). These observations apply to all alloys at almost all stress levels, independent of the (Mo,Ti)5Si3 fraction. The only exception is observed at 50 MPa for alloys B and C. Here, the true creep rate seems to assume a macroscopic steady-state for the tested strains [18].
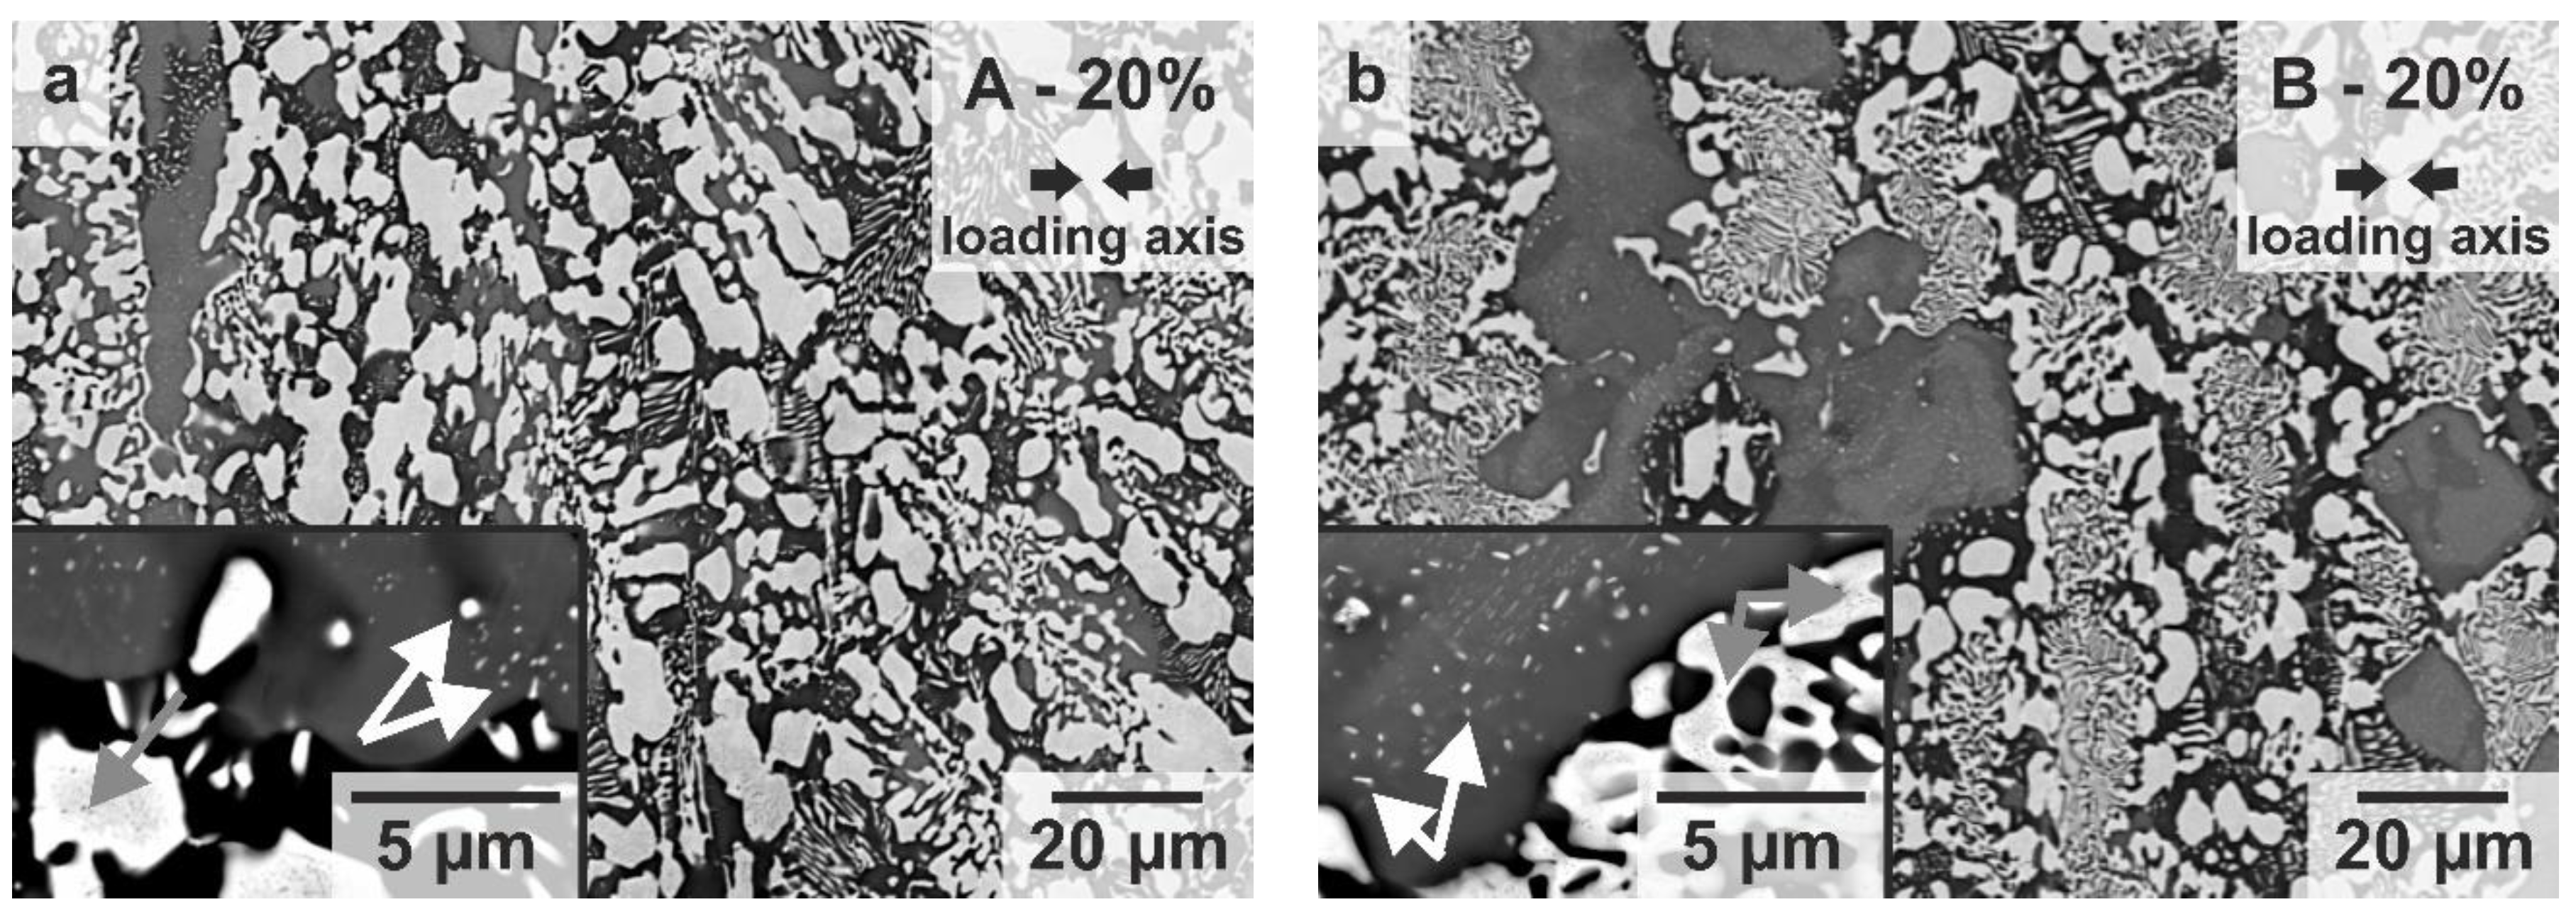
The determined creep rate minima as well as the steady-state values are plotted against the corresponding stress levels for all alloys along with the commercially applied Ni-based superalloy CMSX-4 in a Norton plot in Figure 7a. Note that up to three tests were performed at selected stress levels (especially at 200 MPa) and the respective average values are used with standard deviations (see error bars). The eutectic, eutectic-eutectoid and eutectoid alloys (Mo-20Si-52.8Ti, Mo-21Si-43.4Ti, and Mo-21Si-34Ti, respectively) are included as well for comparison. These represent the potential of the hitherto developed Mo-Si-Ti alloys and highlight the already mentioned dilemma of oxidation and creep resistance. The most creep-resistant eutectoid alloy (black circular symbols) is not pesting-resistant [11]. In contrast, the eutectic-eutectoid alloy, just exhibiting pesting resistance is less creep-resistant by more than half an order of magnitude increased minimum creep rates [10]. However, the here investigated (Mo,Ti)5Si3-containing, pesting-resistant alloys exhibit creep resistances competitive to the eutectoid alloy and superior to CMSX-4. Especially, the creep behaviour of alloy A is improved compared to the eutectic-eutectoid reference alloy, although it exhibits a lower Mo/Ti ratio of 0.77 and even a slightly lower solidus temperature. This is unexpected, and it is questionable whether this enhancement in creep resistance can be reasoned by the rather low fraction of (5 ± 1) vol.% of primarily solidified (Mo,Ti)5Si3. Assuming power law creep: ε ˙ min     σ n , two different creep mechanisms seem to be apparent in alloy A, as the stress exponent n is determined to be 3.4 for stresses up to 200 MPa, and then 8.6 at increased stress levels. The exponent n = 3.4 reveals dislocation climb controlled creep, which is in accordance to the eutectic, eutectic-eutectoid and eutectoid alloys, exhibiting stress exponents in the range of 3.5 to 3.7 [10,11]. At higher stress levels power law break-down seems to be apparent in alloy A indicating that particle strengthening effects determine the creep mechanism. This is further supported by SEM analysis of the deformed microstructure showing precipitates in (Mo,Ti)5Si3, as well as in MoSS regions as displayed in Figure 8a. Such precipitation is not observed for the as-cast state (see Figure 3a).
Alloy B, which contains a considerably increased volume fraction of silicide phases of around 70 vol.% compared to the so far investigated Mo-Si-Ti alloys (alloy A, the eutectic-eutectoid alloy [10], and the eutectic and eutectoid alloy [11]) and the highest Mo/Ti ratio of 0.85, competes with the eutectoid alloy the best at intermediate stress levels. At stresses below 200 MPa, the stress exponent is found to be around 3.5 indicating dislocation-controlled creep deformation. At stresses exceeding 200 MPa, power law break-down is indicated by an increased stress exponent of 6.7. This results in higher minimum creep rates than those of the eutectoid alloy. Particle strengthening effects seem to become more relevant as also indicated by SEM analysis confirming severe precipitation in the deformed microstructure (see Figure 8b).
Alloy C, being characterized by the lowest Mo/Ti ratio of 0.68, reveals a comparable creep behaviour to alloy A for intermediate stress levels (up to 200 MPa). The main difference is the constant stress exponent of 3.0 of alloy C within the entire tested stress regime (50 to 300 MPa). The reduced Mo/Ti ratio of alloy C compared to alloy A is presumably compensated by its significantly higher volume fraction of silicide phases and increased solidus temperature.
Interestingly, there is no immense improvement in creep resistance from alloy A to B or C. This indicates that the volume fraction of primarily solidified (Mo,Ti)5Si3 does not control the creep resistance. Therefore, the solidus temperatures of the alloys are considered for further discussion. Thus, the minimum creep rates are assessed as a function of temperature, which is normalised by the solidus temperature, in double logarithmic manner. The resulting Arrhenius plot allows for the solidus-temperature-independent comparison of the creep resistance of these alloys (see Figure 7b). It is found that alloys A, B, and C possess an apparent activation energy for creep of 405, 403, and 463 kJ/mol, respectively. As this is in the same order of the other Mo-Si-Ti alloys (eutectic alloy: 471 kJ/mol [11], eutectic-eutectoid alloy: 484 kJ/mol [10] and eutectoid alloy: 444 kJ/mol [11]), all data points nearly represent a single master straight. Conclusively, all alloys exhibit comparable creep resistance when compared at the same homologous temperature. These results are in good agreement with the observations made for the Mo-Si-Ti alloys without primarily solidified (Mo,Ti)5Si3 by Obert et al. [10].
To further investigate the mechanical behaviour of these Ti-rich Mo-Si-Ti alloys, some compression tests were conducted for the eutectic reference alloy and alloy B. Since 1200 °C represents a high testing temperature and the selected strain rate of 10−3 s−1 is rather fast, the ultimate compressive strength (maximum stress) was chosen as parameter for comparison to avoid influence of inhomogeneous, localized sample deformation. The eutectic alloy exhibits a compressive strength in the range of 305–355 MPa, while alloy B reveals a higher compressive strength of around 675–690 MPa. In order to relate this to the creep behaviour, the linear fit functions in the Norton plot (see Figure 7a) were (i) extrapolated to a strain rate of 10−3 s−1; and (ii) varied by ± 0.2 in the slope (less bold straights), considering the uncertainty of the stress exponent n . A stress regime of 350–420 MPa is identified for the eutectic alloy, in comparison to 490–515 MPa for alloy B. Note that these ranges might scatter due to the logarithmic extrapolation of the apparent power law for creep. Additionally, the discrepancy between the compressive strength and the stress range observed for alloy B might be attributed to the limited data in the vicinity of the power law break-down at around 200 MPa. If the stress for the break-down is taken higher, or if the stress exponent in the break-down regime is assumed to be lower, the stress range is observed at higher stress levels. Better consistence with the ultimate strength of the quasistatic compression tests is observed in that case.
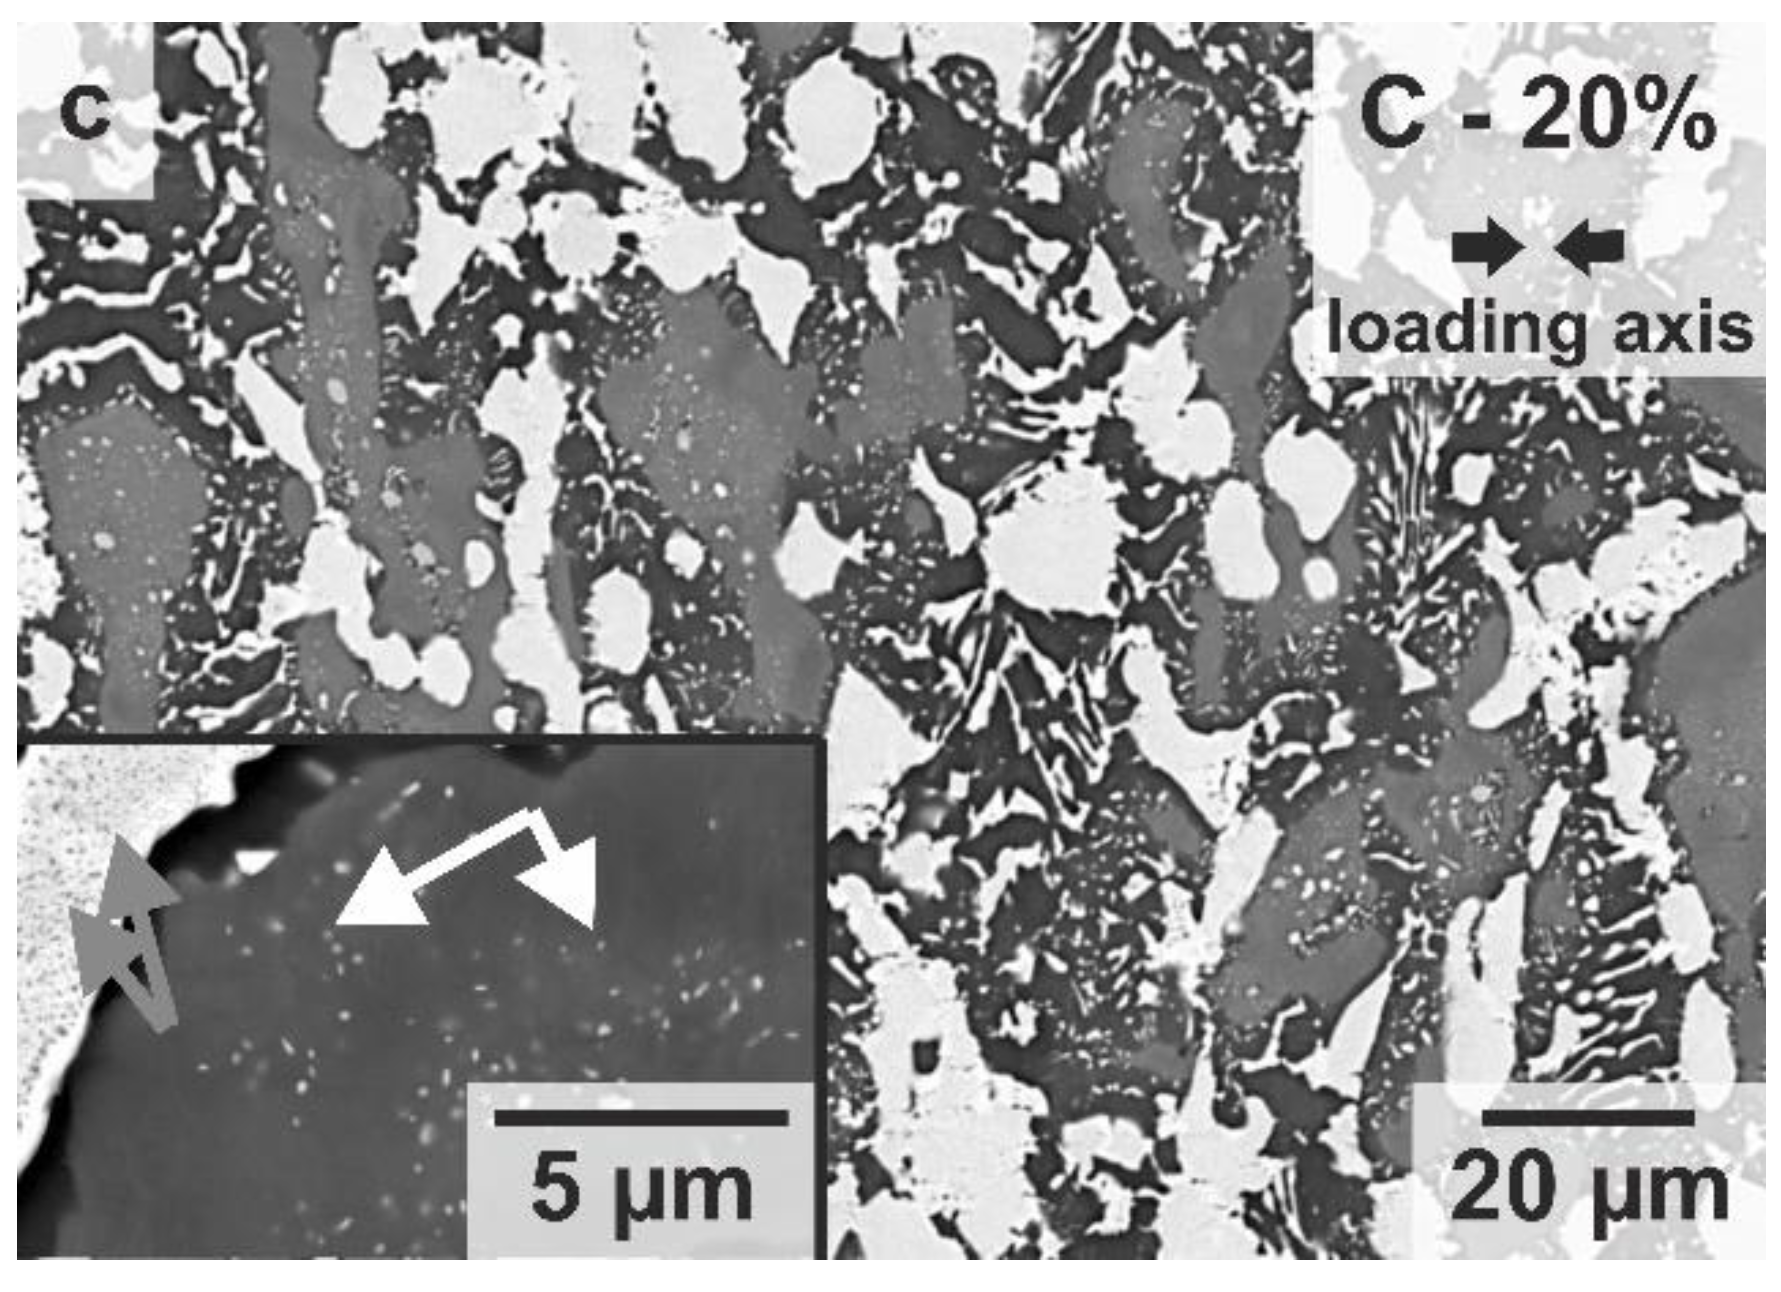
In order to investigate the impact of the different microstructural constituents on the overall creep deformation, microstructural analyses after 5, 20, and 40% true strain were undertaken. As no considerable microstructural changes were observed in the 5% compressed samples, these are excluded in the following discussion. Representative BSE micrographs of alloys A to C are shown in Figure 8 after 20% creep deformation. It is revealed that the eutectic, as well as the eutectoid regions deform considerably in alloy A. Thus, it is not possible to identify whether either one of those regions is less prone to creep deformation, even after only 5% strain (not shown here). However, there is evidence of considerable degeneration and alignment of MoSS along the loading axis (see Figure 8a). In comparison, it seems as if the eutectoid regions still exhibit their original as-cast morphology in alloy B, while the interdendritic, eutectic regions are degenerated as well (see Figure 8b). The (Mo,Ti)5Si3 regions are not aligned noticeably and seem not to participate in creep deformation at 20% compression. In contrast, the crept microstructure of alloy C is characterized by significant compression and alignment of the (Mo,Ti)5Si3 regions perpendicular to the loading axis (see Figure 8c). The former eutectic regions are degenerated and coarsened compared to the as-cast condition. Moreover, the former eutectoid regions cannot be distinguished anymore. Precipitation within the primarily solidified (Mo,Ti)5Si3, as well as in MoSS regions is observed in all alloys (see white and grey arrows in insets of Figure 8). Interestingly, alloys A and B show power law break-down at around 200 MPa, which is assumed to be controlled by particle strengthening effects. The respective stress level for power law break-down seems higher for alloy C, or might not be interpreted as clear as for the other alloys due to the statistical deviations in the creep data. The precipitation is triggered by the thermal heat impact during creep testing at 1200 °C as SEM analyses confirm similar precipitation in heat-treated, but not deformed samples (not shown here).
The determination of the volume fractions of the microstructural constituents after creep deformation at 1200 °C confirms that no phase transformation has occurred in alloys A and B (see Figure A2). This applies to alloy C as well, but only up to 5% true strain, as for higher strains the eutectoid regions cannot be identified anymore. However, it is proven that the volume fractions of primarily solidified (Mo,Ti)5Si3, MoSS and the silicide phases remain unchanged after creep deformation (Figure A2).
In order to analyse the individual contributions of the thermal impact and the compressive load to the observed microstructural changes, solely heat-treated microstructures ( σ = 0, 1200 °C, 100 h) were analysed for comparison. The interface density P was determined according to Equation (1) in Section 2 for the as-cast, heat-treated, and creep tested conditions (see Figure 9). It reveals that the microstructures of all investigated alloys are stable at 1200 °C for at least 100 h, as the interface density is comparable to the as-cast condition. Thus, the observed coarsening in 20 and 40% deformed creep samples of the alloys A and B is related to the degeneration and coagulation of phase regions like MoSS. In comparison, the microstructure of alloy C does not show any change in interface boundary fraction.
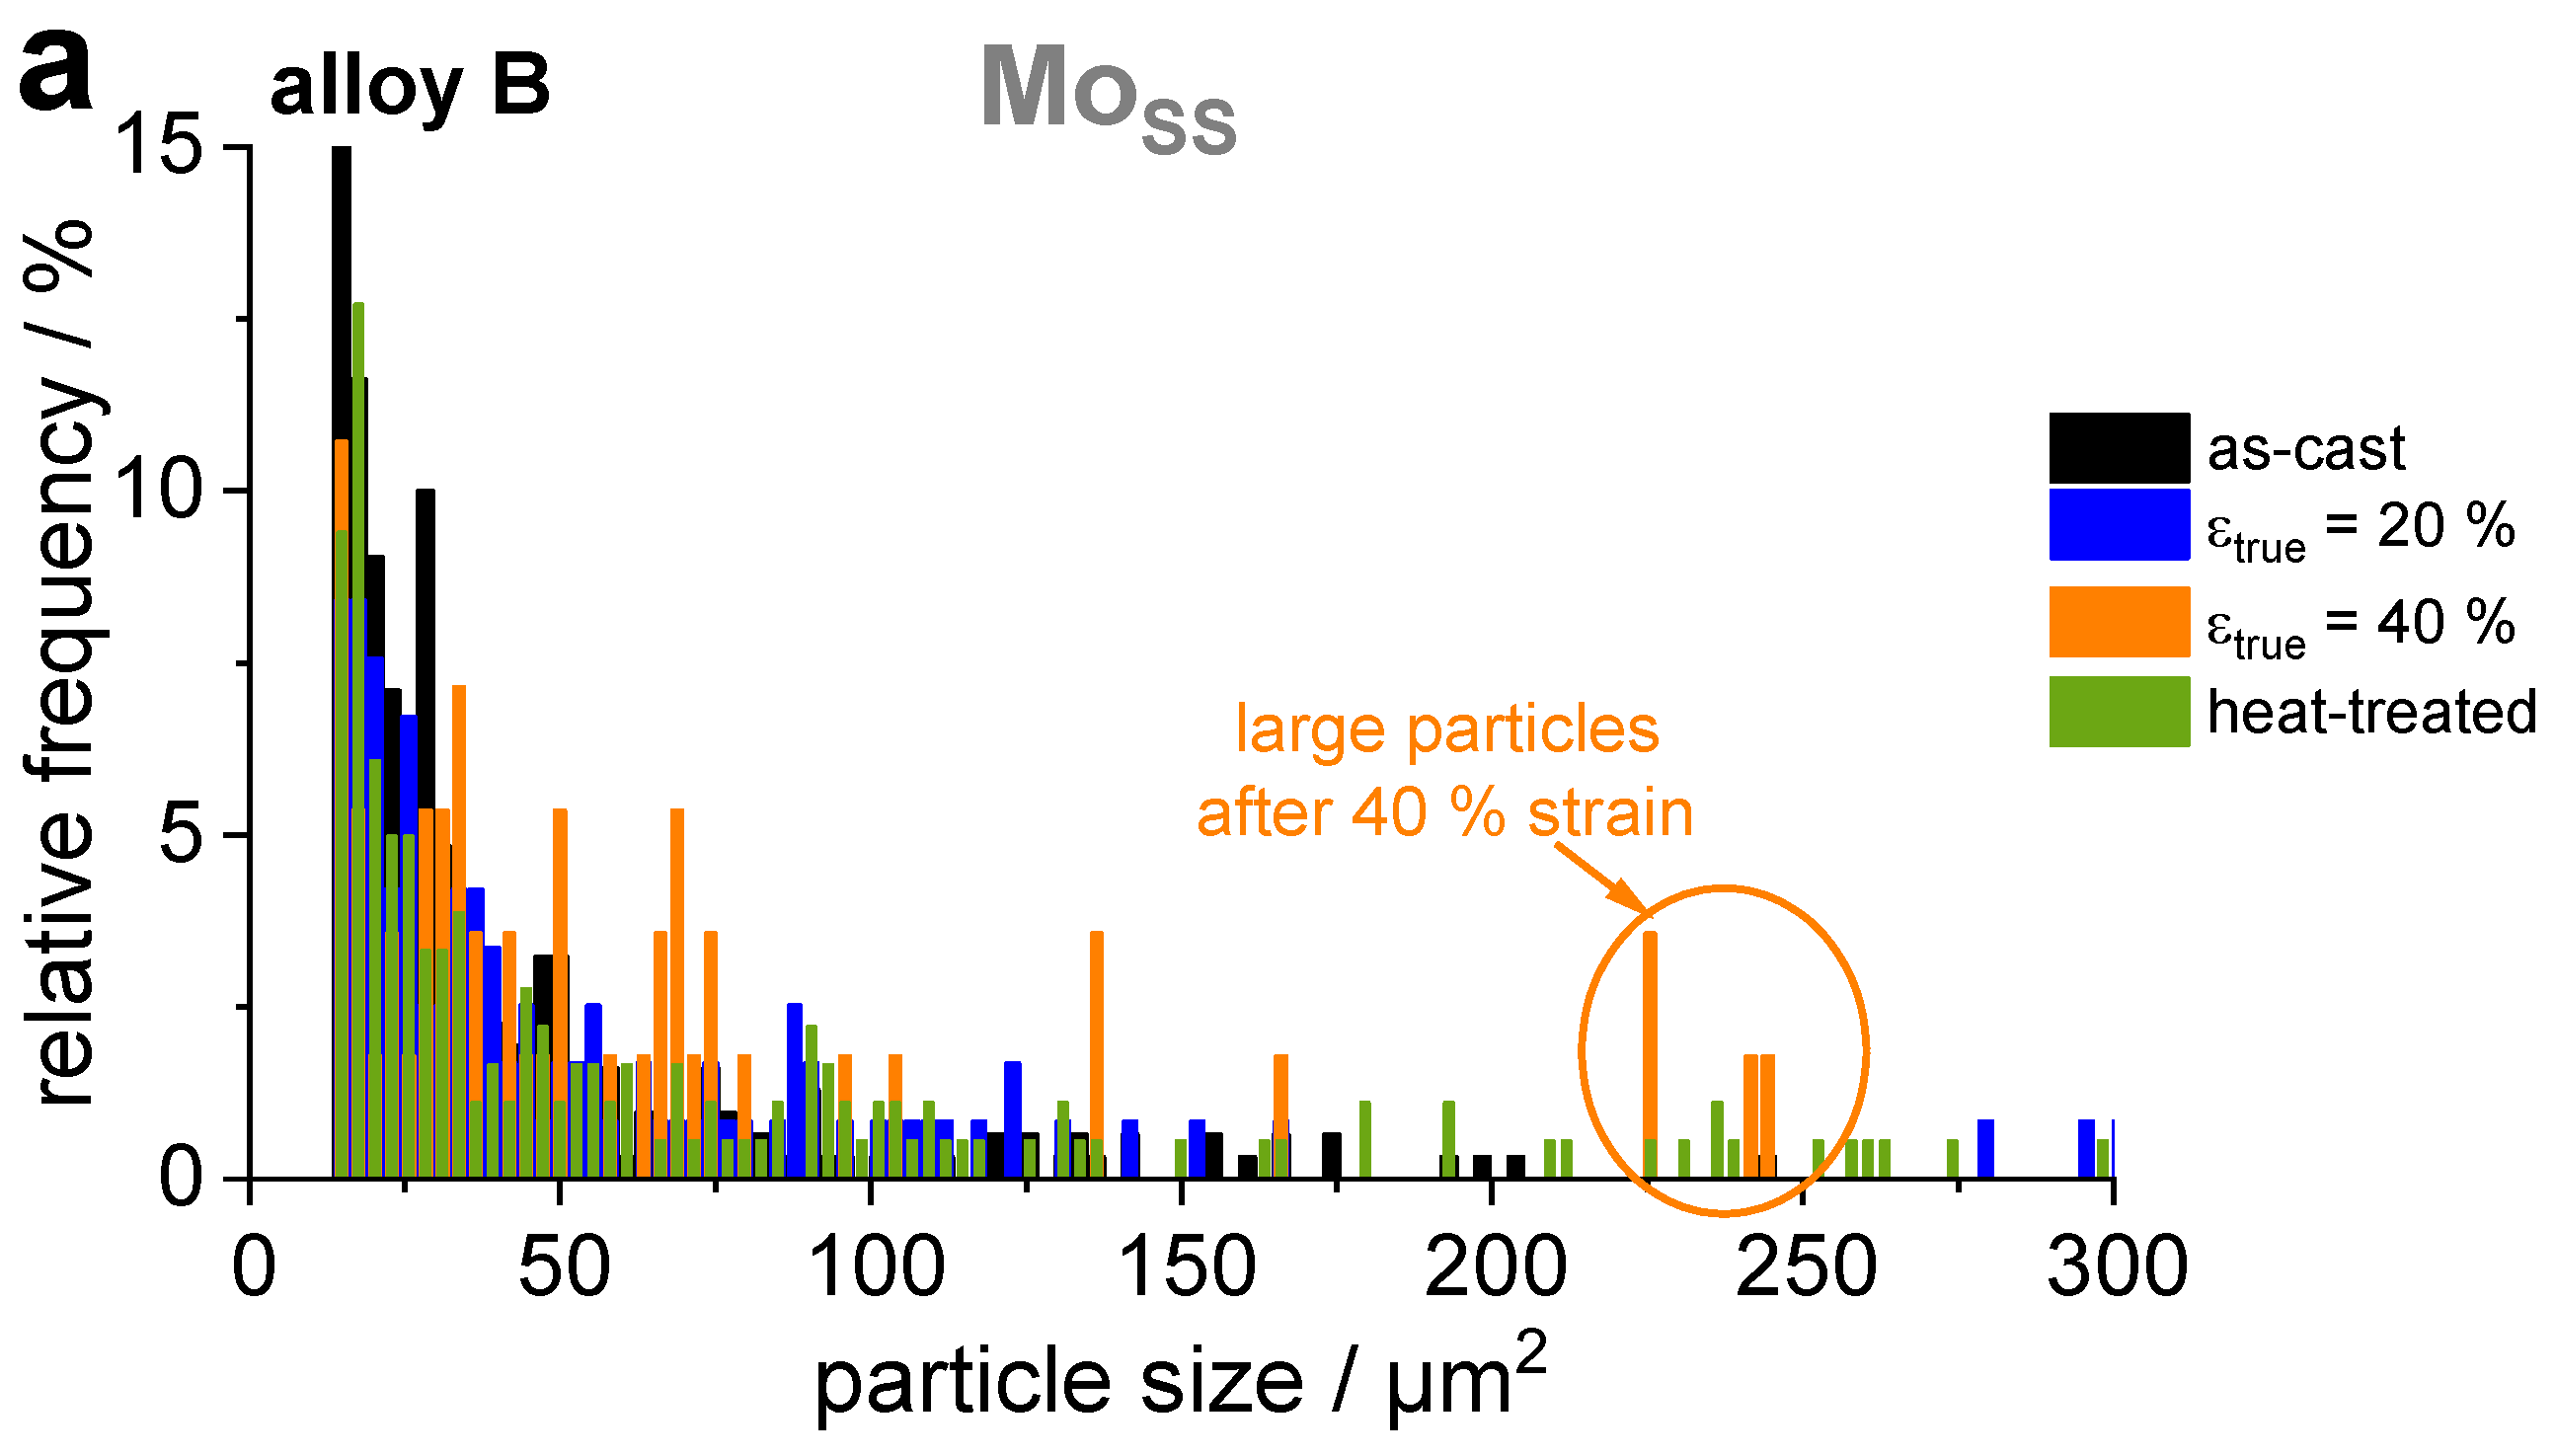
The microstructural degeneration and coagulation was quantitatively assessed by analysing the size and orientation of the different phase regions (MoSS and (Mo,Ti)5Si3). Thereby, only phase regions with a minimum areal size of 12 µm2 (corresponding to 100 pixels) were considered, in order to avoid misleading results due to small precipitates of MoSS in (Mo,Ti)5Si3 and vice versa. The shape of these regions was approximated by an ellipsoid and the corresponding area (regarded as an estimate for the particle size) and orientation towards the loading axis were evaluated (see Figure 10a for results of alloy B and Figure A3a of alloys A and C, respectively). The analysis was performed for one individual sample for each condition (as-cast, 20 and 40% creep compression). Thereby, for the analysis in as-cast condition, a representative cross-section of the as-cast cuboid (investigated cross sectional area: 15 × 20 mm2) was analysed allowing for conclusions on the overall microstructural appearance. Thus, variations between different locations within the as-cast cuboid are minimised.
The coarsening/coagulation of MoSS regions as observed by SEM analysis is confirmed for all alloys. This is demonstrated when comparing the fraction of particles with an intermediate size of 12 to 50 µm2 in as-cast condition and after creep deformation. The fraction of such small MoSS particles reduces from 73 to 51% (alloy A), 79 to 57% (alloy B) and 73 to 61% (alloy C) when comparing the as-cast state with the 40% compressed microstructures. Especially, large MoSS particles of more than 200 µm2 in size are present (see Figure 10a orange circle). While there are less than 1% of the particles of more than 200 µm2 in size in the as-cast condition, this fraction is increased up to 11, 14, and 7% in alloys A to C, respectively.
In the heat-treated samples of all alloys (no external load), the fraction of particles of size 12 to 50 µm2 is determined to be comparable to the as-cast condition. Conclusively, it is the creep loading, which accounts for the coarsening or coagulation of the MoSS regions.
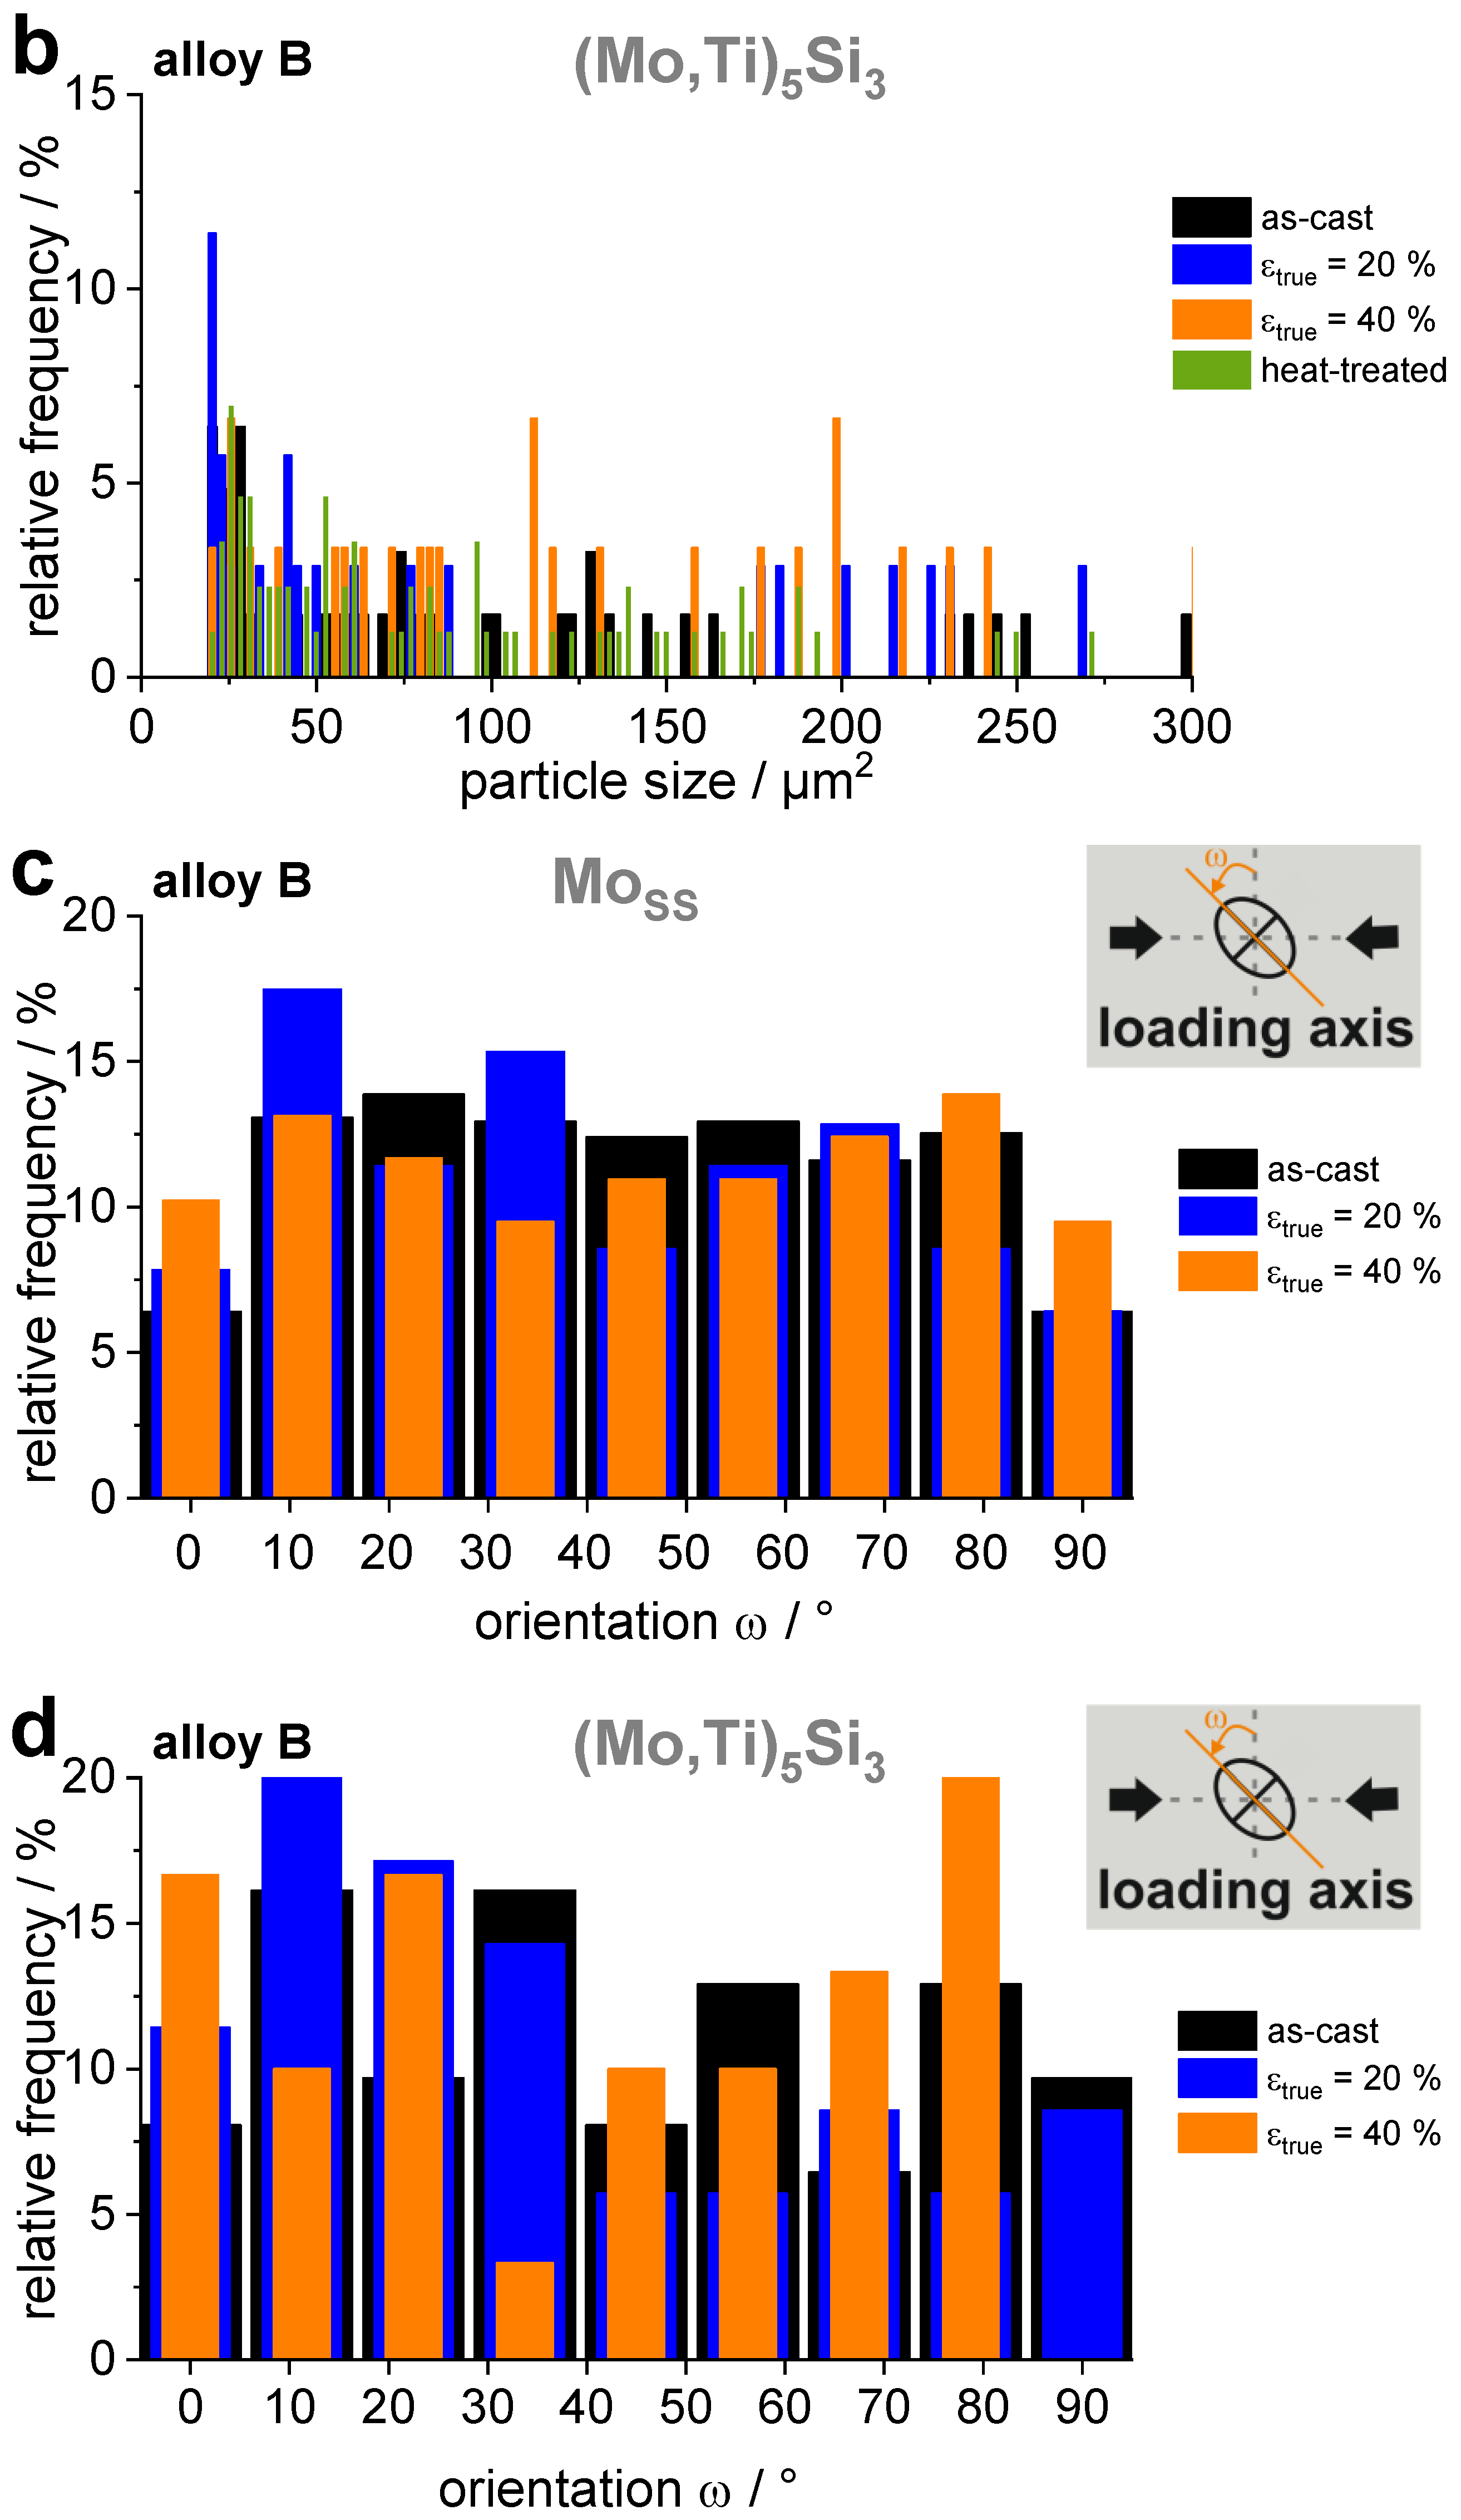
The investigation of the primarily solidified (Mo,Ti)5Si3 particles does not reveal coarsening upon creep deformation. Their size is considerably varying due to the casting procedure and is not changing consistently with increasing true strain (see Figure 10b for results of alloy B and Figure A3b of alloys A and C).
The assessment of the particle orientation reveals strong alignment of both MoSS and (Mo,Ti)5Si3 regions perpendicular to the loading axis (corresponds to a reference angle ω = 0°, see inset in Figure 10c,d. This is demonstrated in alloy B by the increase in relative frequency of such oriented particles from the as-cast to the 40% compressed state (see Figure 10c,d for results of alloy B and Figure A3c,d of alloys A and C). Especially, (Mo,Ti)5Si3 aligns with increasing creep deformation, as in the as-cast state only 8% are oriented perpendicular to the loading axis, while this are 17% after 40% creep compression.
In conclusion, MoSS is regarded as main participant to the plastic deformation under creep conditions in all alloys. However, note the different degrees of deformation of the primary (Mo,Ti)5Si3 particles in alloys B and C, as (Mo,Ti)5Si3 deforms to a greater extent than in alloy C (compare Figure 8b,c). This is confirmed by the following observations for the deformed microstructures of alloys B and C: (i) The primarily solidified (Mo,Ti)5Si3 particles are less deformed in alloy B than in alloy C. (ii) The degeneration and coagulation of MoSS is more pronounced in alloy B, as the particles size is reduced by a factor of approximately 0.27 (from 79 to 57%) after 40% compression in contrast to a factor of only 0.16 (from 73 to 61%) in alloy C. (iii) The boundary fraction remains nearly unchanged upon creep deformation in alloy C. Conclusively, it seems as if (Mo,Ti)5Si3 and MoSS participate with a varying degree to the overall creep deformation in alloys B and C.
The difference in creep behaviour of alloys B and C might be influenced by the following reasons: (i) Solid solution strengthening of (Mo,Ti)5Si3 by Ti to a different extent, as the alloys possess a difference in nominal Ti content of 4 at.%. However, thermodynamic calculations in equilibrium conditions reveal a reduced difference in dissolved Ti in (Mo,Ti)5Si3 of 2 at.% when comparing alloys B and C. Hence, this impact is assumed to be negligible. Additionally, this is difficult to assess experimentally due to significant segregation within (Mo,Ti)5Si3 (see varying BSE contrast in (Mo,Ti)5Si3 regions) and the fine scaled microstructure. (ii) Particle strengthening of (Mo,Ti)5Si3 by Mo-rich particles (see bright particles within (Mo,Ti)5Si3 in the insets of Figure 3b,c and Figure 8b,c. However, further research on those particles has to be conducted in order to quantitatively evaluate their impact on the creep performance. (iii) The different volume fraction of eutectoid microstructure, which is (28 ± 5) and (10 ± 3) vol.% in alloys B and C, respectively. Thus, as the same loading and compression state was applied to both alloys, the load partitioning on the different microstructural constituents is assumed to result in the different deformation behaviour of the primarily solidified (Mo,Ti)5Si3 regions.

4. Summary and Conclusions

By adjusting the chemical composition of the Mo-Si-Ti alloys, considerable volume fractions of primarily solidified (Mo,Ti)5Si3 up to 30 vol.% were attained in eutectic-eutectoid microstructures. Alongside with this increase in the volume fraction of silicide phases ( 70 vol.%), an increase in solidus temperature (>1900 °C) was achieved. The oxidation behaviour at 800 °C was found to be comparable to the behaviour observed for a single-phase (Mo,Ti)5Si3 alloy in [16] and, thus, is characterized by pesting resistance. While a threshold of 35 at.% Ti content in MoSS was postulated to be exceeded in order to achieve pesting resistance in eutectic-eutectoid Mo-Si-Ti alloys [10], in the here investigated (Mo,Ti)5Si3-containing alloys, 34 at.% Ti are found to be sufficient for suppression of pesting. The creep performance of these alloys was found to be superior to the so far presented pesting-resistant Mo-Si-Ti alloys in [10,11]. Alloy B revealed the lowest minimum creep rates, which are comparable to the eutectoid, non-pesting-resistant Mo-21Si-34Ti alloy [11]. The creep behaviour of the here investigated (Mo,Ti)5Si3-containing alloys was confirmed to be dependent on the solidus temperature, as was already observed for other Mo-Si-Ti alloys in [10]. Therefore, it is not the volume fraction of primarily solidified (Mo,Ti)5Si3, but the increase in solidus temperature, which accounts for the improved creep resistance due to creep at lower homologous temperature. The microstructures of alloys A to C were found to degenerate upon creep loading. Especially MoSS participates in creep deformation by coagulation and alignment to the loading axis. The (Mo,Ti)5Si3 particles deformed and orientated perpendicularly to the loading axis as well, particularly at higher strain. The analysis of heat-treated, non-deformed microstructures confirmed microstructural stability and no coarsening by thermal impact at 1200 °C. Thus, the coagulation of MoSS is attributed to the applied compressive creep loading.
In conclusion, the here investigated (Mo,Ti)5Si3-containing Mo-Si-Ti alloys are promising for high-temperature applications, as these are light-weight (density <6.5 g/cm3), pesting-resistant and exhibit superior creep resistance to the Ni-based superalloy CMSX-4 for the here applied testing conditions (1200 °C, vacuum, compressive loading 50–300 MPa). Furthermore, these alloys are the most creep-resistant among the other so far investigated pesting-resistant Mo-Si-Ti alloys.

Author Contributions

Conceptualization, S.O., A.K. and M.H.; Data curation, S.O. and A.K.; Testing, S.O. and R.P.; Formal Analysis, S.O., R.P., D.S. and F.H.; Investigation, S.O., A.K., R.P., D.S. and F.H.; writing—original draft preparation, S.O.; writing—review and editing, A.K., R.P., D.S., F.H. and M.H.; Visualization, S.O. and R.P.; Supervision, A.K. and M.H.; Project Administration, S.O., A.K., and M.H.; Funding Acquisition, A.K. and M.H.; Resources, M.H. All authors have read and agreed to the published version of the manuscript. Please turn to the CRediT taxonomy for the term explanation.

Funding

This research was funded by Deutsche Forschungsgemeinschaft (DFG), grant number HE 1872/33-1 and HE 1872/33-2. This work was partly carried out with the support of the Karlsruhe Nano Micro Facility (KNMF, www.knmf.kit.edu), a Helmholtz Research Infrastructure at Karlsruhe Institute of Technology (KIT, www.kit.edu). We acknowledge support by the KIT-Publication Fund of the Karlsruhe Institute of Technology (KIT).

Institutional Review Board Statement

Not applicable.

Informed Consent Statement

Not applicable.

Data Availability Statement

The data presented in this study are available on request from the corresponding author and in the following appendix material.

Acknowledgments

The authors would like to thank the collaboration partners Matthias Weber, Bronislava Gorr and Hans-Jürgen Christ from Department of Mechanical Engineering of the University of Siegen, Germany, and Ronja Anton, Nadine Laska and Uwe Schulz from the Institute of Materials Research, German Aerospace Center (DLR) Köln, Germany.

Conflicts of Interest

The authors declare no conflict of interest.

Appendix A

Figure A1. XRD pattern of the investigated alloys A to C in as-cast condition. Bcc MoSS is highlighted by grey diamonds, hexagonal D88 (Ti,Mo)5Si3 by black triangles and tetragonal (Mo,Ti)5Si3 by orange squares.
Metals 11 00169 g0a1
Figure A2. Thermodynamic predicted volume fractions (hatched bars) in comparison to the experimentally determined volume fractions of the microstructural constituents (filled bars) in as-cast condition and after compressive creep strain of 5 and 40% attained at 1200 °C, 200 MPa for the alloys A to C.
Metals 11 00169 g0a2
Figure A3. Particle size distribution of MoSS (a) and (Mo,Ti)5Si3 (b) particles and their orientation (c,d) (particle shape approximated as ellipse) in the alloys A and C in as-cast condition and after compressive creep testing at 1200 °C, 200 MPa up to a true strain of 20 and 40% in comparison to heat-treated samples at 1200 °C for 100 h.
Metals 11 00169 g0a3aMetals 11 00169 g0a3b

References

  1. Fitzer, E. Heizleiter für hohe Temperaturen. In Hochschmelzende Metalle, 3. Plansee Seminar, De Re Metallica, Proceedings of the 3rd Plansee Seminar, Reutte/Tirol, Austria, 22–26 June 1958; Benesovsky, F., Ed.; Komission Springer: Vienna, Austria, 1959; pp. 175–202. [Google Scholar]
  2. Westbrook, J.H.; Wood, D.L. “PEST” degradation in beryllides, silicides, aluminides, and related compounds. J. Nucl. Mater. 1964, 12, 208–215. [Google Scholar] [CrossRef]
  3. Hatakeyama, T.; Ida, S.; Sekido, N.; Yoshimi, K. Significant improvement of the oxidation resistance of MoSiBTiC-based multiphase alloys by Ti enrichment. Corros. Sci. 2020, 176, 108937. [Google Scholar] [CrossRef]
  4. Obert, S.; Kauffmann, A.; Seils, S.; Boll, T.; Kauffmann-Weiß, S.; Chen, H.; Anton, R.; Heilmaier, M. Microstructural and Chemical Constitution of the Oxide Scale formed on a Pesting-Resistant Mo-Si-Ti Alloy. Corros. Sci. 2021, 178, 109081. [Google Scholar] [CrossRef]
  5. Obert, S.; Kauffmann, A.; Seils, S.; Schellert, S.; Weber, M.; Gorr, B.; Christ, H.-J.; Heilmaier, M. On the chemical and microstructural requirements for the pesting-resistance of Mo-Si-Ti alloys. JMR&T 2020, 9, 8556–8567. [Google Scholar] [CrossRef]
  6. Yanagihara, K.; Maruyama, T.; Nagata, K. Effect of third elements on the pesting suppression of Mo-Si-X intermetallics (X = Al, Ta, Ti, Zr and Y). Intermetallics 1996, 4, 133–S139. [Google Scholar] [CrossRef]
  7. Bewlay, B.P.; Jackson, M.R.; Subramanian, P.R.; Zhao, J.-C. A review of very-high-temperature Nb-silicide-based composites. Metall. Mater. Trans. A 2003, 34, 2043–2052. [Google Scholar] [CrossRef]
  8. Azim, M.A.; Schliephake, D.; Hochmuth, C.; Gorr, B.; Christ, H.-J.; Glatzel, U.; Heilmaier, M. Creep Resistance and Oxidation Behavior of Novel Mo-Si-B-Ti Alloys. JOM 2015, 67, 2621–2628. [Google Scholar] [CrossRef]
  9. Schliephake, D.; Azim, M.; von Klinski-Wetzel, K.; Gorr, B.; Christ, H.J.; Bei, H.; George, E.P.; Heilmaier, M. High-Temperature Creep and Oxidation Behavior of Mo-Si-B alloys with High Ti Contents. Metall. Mater. Trans. A 2014, 45, 1102–1111. [Google Scholar] [CrossRef]
  10. Obert, S.; Kauffmann, A.; Heilmaier, M. Characterisation of the oxidation and creep behaviour of novel Mo-Si-Ti alloys. Acta Mater. 2020, 184, 132–142. [Google Scholar] [CrossRef]
  11. Schliephake, D.; Kauffmann, A.; Cong, X.; Gombola, C.; Azim, M.A.; Gorr, B.; Christ, H.-J.; Heilmaier, M. Constitution, oxidation and creep of eutectic and eutectoid Mo-Si-Ti alloys. Intermetallics 2019, 104, 133–142. [Google Scholar] [CrossRef]
  12. Bondar, A.; Lukas, H.-L. Molybdenum—Silicon—Titanium. In Light Metal Systems, Part 4, 11A4 ed.; Springer: Berlin/Heidelberg, Germany, 2006; pp. 385–405. [Google Scholar]
  13. Yang, Y.; Chang, Y.A.; Tan, L.; Du, Y. Experimental investigation and thermodynamic descriptions of the Mo–Si–Ti system. Mater. Sci. Eng. A 2003, 361, 281–293. [Google Scholar] [CrossRef]
  14. Meyer, M.K.; Akinc, M. Oxidation Behavior of Boron-Modified Mo5Si3 at 800–1300 °C. J. Am. Ceram. Soc. 1996, 79, 938–944. [Google Scholar] [CrossRef]
  15. Azim, M.A.; Gorr, B.; Christ, H.-J.; Lenchuk, O.; Albe, K.; Schliephake, D.; Heilmaier, M. Effect of Ti content and nitrogen on the high-temperature oxidation behavior of (Mo,Ti)5Si3. Intermetallics 2017, 90, 103–112. [Google Scholar] [CrossRef]
  16. Burk, S.; Gorr, B.; Christ, H.-J.; Schliephake, D.; Heilmaier, M.; Hochmuth, C.; Glatzel, U. High-temperature oxidation behaviour of a single-phase (Mo, Ti)5Si3 (Mo–Si–Ti) alloy. Scr. Mater. 2012, 66, 223–226. [Google Scholar] [CrossRef]
  17. Predel, B. Mo-Ti (Molybdenum-Titanium). In Li-Mg–Nd-Zr. Zrandolt-Börnstein—Group IV Physical Chemistry, 5th ed.; Springer: Berlin/Heidelberg, Germany, 1997; pp. 1–3. ISBN 978-3-540-68538-8. [Google Scholar]
  18. Mughrabi, H. Revisiting “Steady-State” Monotonic and Cyclic Deformation: Emphasizing the Quasi-Stationary State of Deformation. Metall. Mater. Trans. A 2020, 51, 1441–1456. [Google Scholar] [CrossRef] [Green Version]
  19. Heilmaier, M.; Krüger, M.; Saage, H. Recent advances in the development of mechanically alloyed Mo silicide alloys. Mater. Sci. Forum 2009, 633–634, 549–558. [Google Scholar] [CrossRef]
Figure 1. Schematic illustration of the cyclic oxidation testing with different cycle durations of 1 (highlighted in dark grey), 5 (highlighted in blue) and 10 h (highlighted in orange).
Metals 11 00169 g001
Figure 2. Metal-rich portion of the liquidus projection of the ternary Mo-Si-Ti system with highlighted chemical compositions of the here investigated alloys (coloured symbols) in comparison to former presented alloys (black/white circular symbols). The region with a Si content of around 20 to 21 at.% is highlighted by a grey rectangle symbolising the region of former research in Refs. [5,10] on eutectic-eutectoid Mo-Si-Ti alloys by Obert et al.
Metals 11 00169 g002
Figure 3. BSE micrographs of the as-cast (ac) microstructures of the alloys A (a), B (b) and C (c). The microstructural constituents are highlighted in orange (globularly-shaped (Mo,Ti)5Si3), white (eutectic region) and black (eutectoid region). The transition between eutectic and eutectoid regions is displayed in the insets with higher magnification. In alloy C, a primarily solidified (Mo,Ti)5Si3 region is shown as well in the inset (c). Additionally, the experimentally determined volume fractions (solid bars) are compared to the thermodynamic predictions (hatched bars) (d).
Metals 11 00169 g003aMetals 11 00169 g003b
Figure 4. Specific mass change of alloys A to C during cyclic oxidation in laboratory air at 800 (a) and 1200 °C (b). *data of the eutectic and eutectic-eutectoid reference alloy are taken from [10], ** data of alloy A at 800 °C are taken from our previous article [5].
Metals 11 00169 g004
Figure 5. Cross-sectional BSE micrographs of the cyclically oxidized samples of alloy A (a) and C (b) at 800 °C after 100 h. Surface-near, characteristic regions below the oxide scale are labelled for the sake of clarity. Oxide scales formed after 100 h of cyclic oxidation at 1200 °C in air of alloy A (c) and C (d).
Metals 11 00169 g005
Figure 6. Compression creep testing at 1200 °C under vacuum: True creep strain vs. time for alloy A (a), creep rate vs. true strain for the alloys A (b), B (c) and C (d). The creep rate minima are highlighted by square markers.
Metals 11 00169 g006
Figure 7. Norton plot (a) and by the solidus temperature normalised Arrhenius plot (b) of the investigated alloys A to C (colored symbols) in comparison to previously investigated alloys (black/white circular symbols) (a). * Data of CMSX-4 taken from [19]. ** Some data of the eutectic alloy taken from [11] and all data on the eutectoid alloy taken from [11], *** and of the eutectic-eutectoid alloy from [10].
Metals 11 00169 g007
Figure 8. BSE micrographs of the microstructures of the alloys A to C (ac) after creep deformation at 1200 °C and 200 MPa up to 20% true compressive strain. The insets provide higher magnification images of regions with primarily solidified (Mo,Ti)5Si3 and the surrounding microstructural constituents. Precipitation of Mo-rich particles is observed within the (Mo,Ti)5Si3 regions (highlighted by white arrows), as well as of Mo-lean particles within MoSS regions (highlighted by grey arrows).
Metals 11 00169 g008aMetals 11 00169 g008b
Figure 9. Phase boundary fraction of alloys A to C in as-cast condition (black squares), after creep deformation of 20 and 40% (blue triangles and orange circles, respectively) and after heat treatment at 1200 °C for 100 h (green diamonds). The durations of the compression creep tests are included as well.
Metals 11 00169 g009
Figure 10. Particle size distribution of MoSS (a) and (Mo,Ti)5Si3 particles (b) and their orientation (c,d) (particle shape approximated as ellipse) in alloy B in as-cast condition and after compressive creep testing at 1200 °C, 200 MPa up to a true compressive strain of 20 and 40% in comparison to heat-treated samples at 1200 °C for 100 h.
Metals 11 00169 g010aMetals 11 00169 g010b
Table 1. Overview on the compositional, microstructural and physical features of the investigated alloys A to C in comparison to the eutectic-eutectoid reference alloy Mo-21Si-43.4Ti [10]. Calculated data are labelled by “calc.”; all other data were experimentally determined. The Mo/Ti ratio is calculated from the nominal alloy composition.
AlloyMo/Ti Ratio (calc.)/−vsilicides/vol.%Tsolidus/°C (calc.)Density ρ/g/cm3
Mo-21Si-43.4Ti [10] (eutectic-eutectoid)0.8252 ± 118856.49 ± 0.11 [10]
Mo-21.6Si-44.6Ti (A)0.7753 ± 318776.44 ± 0.14
Mo-26Si-40Ti (B)0.8574 ± 219476.42 ± 0.05
Mo-26Si-44Ti (C)0.6872 ± 419156.24 ± 0.08
Publisher’s Note: MDPI stays neutral with regard to jurisdictional claims in published maps and institutional affiliations.