Abstract
Fatigue life tests and fatigue crack growth rate (FCGR) tests in the air and water environment were conducted on X80 pipeline steel welded joints (welded by CO2 arc welding). Scanning electron microscope (SEM) and electron backscatter diffraction (EBSD) were utilized to investigate the internal influential mechanisms of the water environment during fatigue crack initiation and propagation stages, respectively. Results show that a great many oxide particles induced by the water environment gradually formed the fatigue crack initiation site and decreased fatigue life of welded joints. Meanwhile, the preferred grain orientation of <001>//ND and CSL boundaries of Σ3, Σ11, Σ13c, Σ17b, Σ25a, and Σ25b are both prone to fatigue propagation when loading in the water environment. In addition, a coalescence of the stress intensity factor (SIF) range and water environment accelerated FCGR by motivating secondary slip systems of {112}<111> and {123}<111> in bcc crystalline structures.
1. Introduction
Oil and gas pipelines have been experiencing severe security challenges brought about by complex environments and different stress states during their service periods. The corrosion failure and fatigue failure are the most serious and prominent failure forms among those of pipelines [1,2,3]. In fact, these two failure modes often occur at the same time, which refers to corrosion fatigue (CF), further shorting service life of pipelines. Worse still, inevitable defects such as slag inclusions, air holes, etc., produced during the welding process significantly threatened the security and integrity of pipelines, which has attracted much attention in recent years.
The degradation and failure of structures and materials caused by a corrosive environment are usually in the form of pits or notches of the effecting surface for these areas are often stress concentrated [4]. As a result, the periods for crack initiation are significantly compressed under the influence of corrosive environments and the byproducts produced in this process could further accelerate the fatigue propagation. It is widely accepted [1,5,6] that CF and stress corrosion cracking (SCC) are the dominant failure modes of environment-assisted cracking (EAC) depending on the loading scheme. Despite extensive and considerable research conducted on the inner mechanisms of SCC in pipeline steels [7,8,9], there are few papers focused on CF, especially for the less corrosive or critical environments. The former investigates the crack behavior in corrosive environments under constant loads and several classic features and modes have been characterized according to the crack morphologies and critical situations. On the one hand, SCC in a high-pH environment is often corresponding to the anode dissolution mechanism and the cracks are commonly propagated through an intergranular way [2]. On the other hand, SCC in a near-neutral pH environment exhibits a similar morphology as CF does [6] and the mechanism in this situation has been reported as a kind of hydrogen embrittlement for hydrogen and may ingress materials in the corrosive environment and dissolve the crack tip [5]. Therefore, the mechanism for SCC in the near-neutral pH environment is a combination of stress corrosion (SC) and EAC. Moreover, many studies even reported that SCC is only a special case of CF with the stress ratio being unity [6,10]. Instead of sufficient studies [2,4,9] showing that the transgranular fracture surface was observed in CF as SCC did in the near-neutral pH environment, indicating that CF and SCC may share similar cracking mechanisms [10], abundant essential questions pointing to the possibility, severity, and rate of CF propagation are still of necessity to further investigations, especially the problem of CF mechanism in the near-neutral pH environment.
There are several factors closely related to the corrosion fatigue crack propagation process of pipeline steel. It is generally believed that the corrosion fatigue crack growth rate accelerates by means of reducing loading frequency and increasing stress ratio [11]. As for the corrosion fatigue crack propagation mainly based on the mechanism of hydrogen embrittlement, international research emphasizes the importance of interaction between loading frequency and hydrogen [12]. It is universally believed that a low loading frequency (between 0.1 to 10 Hz) is beneficial to hydrogen diffusing to the crack tip, resulting in hydrogen embrittlement of metal around the crack tip for hydrogen atoms not able to keep up with the movement of crack tip and consequently do not have enough time to accumulate at the crack tip when loading with high frequencies, which, as a result, is of negligible effect compared with mechanical factors. However, these studies did not give a concrete explanation from the micro perspective and there is not enough practical evidence to support the idea that hydrogen is of no effect on the fatigue crack propagation under high-frequency loading. More intractably, the supersaturation of hydrogen is more likely to be achieved in welded joints for the easier accumulations of hydrogen in the defects such as micro gaps, pores, and slag inclusions inevitably produced by the metallurgical reaction and thermal cycle of the welding process, resulting in the dramatical increase of hydrogen embrittlement susceptibility of welded joints.
As a special case of a near-neutral pH environment, the water environment has attracted increasingly attention on its adverse effects both on the welding process in the technological stage and the joint operation during the service period of pipes. Compared with the relative extensive studies [13,14,15,16] subjected to the degradation of underwater wet welding in the welding process, the effect of water environment on the welded joints in the service life of pipes has been rarely reported to date.
In the present paper, the fatigue crack initiation process and fatigue crack propagation behavior of X80 pipeline welded joints have been researched more detailed with and without the presence of water, which is often the practical case for pipes in the service periods. SEM and EBSD analyses were necessarily operated to characterize the fracture surfaces and deformation structure of fatigue life testing specimens and fatigue crack growth rate testing specimens, respectively, so that the effect of the water environment on both fatigue crack initiation and fatigue crack propagation of X80 welded joints can be further understood.
2. Materials and Methods
2.1. Materials and Sampling Methods
The experimental materials included in this study are commercial X80 pipeline steel, whose detailed chemical compositions are shown in Table 1. The raw plates used for welding were mechanically processed into a three dimension of 150 mm × 220 mm × 10 mm from the longitudinal-transverse orientation of a pipe with a wall thickness of 22 mm and a diameter of 1422 mm as shown in Figure 1. In addition, the plates in the 220 mm direction were then milled to beveled surfaces with bevel angles being 22.5° and the height of the root face being 1 mm. A form of butted joint was then semi-automatically welded by means of CO2 arc welding (a method of gas metal arc welding (GMAW)) with the arc voltage and welding current of 18.8 V and 190 A. The AWS A5.29 standard [17] E91T1-GM flux-cored wire with a diameter of 1.2 mm was used as a filler metal, whose detailed chemical composition is presented in Table 1. The welding machine used in this experiment is “YD-350FR” produced by the Panasonic company (Osaka, Japan). The thickness of the welded plates was further milled to 7 mm to make sure that both the weld reinforcements and root notches (which are negative for the fatigue properties, as they are usually stress concentrated) were removed.

Table 1.
Chemical composition (wt.%) of X80 pipeline steel and flux-cored wire.
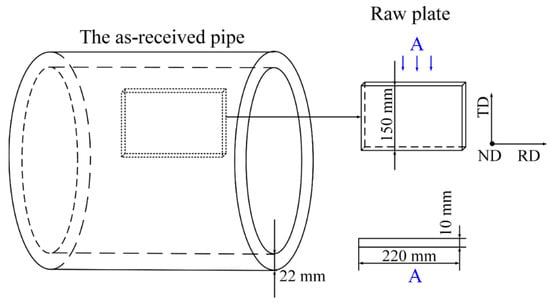
Figure 1.
Sampling methods and main dimensions of the raw plates.
A dimension of 20 mm × 7 mm in the cross section of the weld was processed by EDM and ground from 180 grit to 2000 grit SiC water proof papers and then polished with 1.0 μm diamond pastes. The macrograph and metallographic structures of the welded joint without reinforcement and root notches are shown in Figure 2. The X80 pipeline steel matrix structure is mainly ferrite along with a few martensite-austenite (M-A) islands (see Figure 2b), where the ferrite mainly consists of polygonal ferrites (PFs), with a small number of quasi-polygonal ferrites (QFs) and granular bainites (GBs). While the weld is mainly composed of acicular ferrites (AFs) formed in internal of columnar grains, with a small amount of Widmanstatten ferrites (WFs) and PFs nucleated along the columnar grain boundaries as shown in Figure 2d.
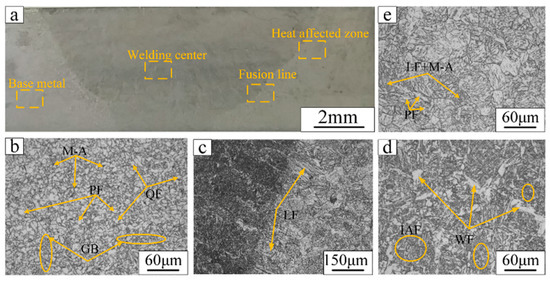
Figure 2.
Metallographic structures of X80 steel welded joint without weld reinforcement and root notch. (a) The macro morphology of the weld cross section; (b) base metal; (c) fusion line; (d) welding center; (e) heat affected zone.
2.2. Fatigue Tests
As shown in Figure 3, the smooth fatigue life specimen (Figure 3a) and compact tension specimen (Figure 3b) were processed in accordance with the dimensions recommended in ASTM E468 standard and ASTM E647 standard respectively [18,19]. Fatigue life testing was conducted on the smooth fatigue life specimens, which were processed by electron discharge machining method (EDM) from the raw plates.
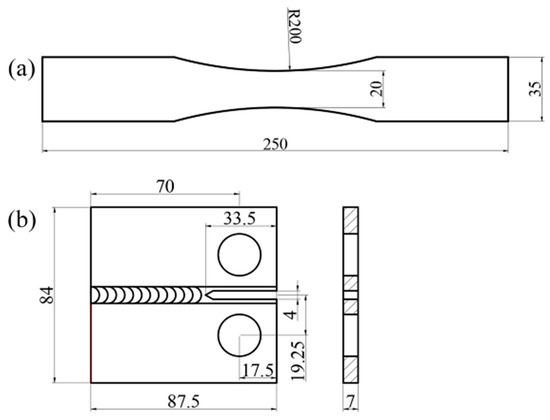
Figure 3.
Geometry and main dimensions of fatigue testing specimens. (a) Smooth fatigue life specimen; (b) compact tension specimen (unit: mm).
In order to illustrate the effect on fatigue life in the presence of water, the experiment was carried out under both water (unsalted tap water) and air conditions at room temperature. Specifically, the samples were in situ surrounded by water in application of a glass box as fatigue tests proceeded. As mentioned above, we wonder whether the degradation of X80 steel welded joint also occurs in the presence of water at high frequency loading, so the tests were experimented on high frequency fatigue machine of GPS-200 grade. The maximum stress of 300, 250, 220, 200, 180, and 170 MPa were applied to the specimens both in air and water environments to figure out fatigue limits. The cyclic times (N) were recorded after a fracture failure of each test (the specimen was evaluated failure when the loading frequency decreased by 5 Hz or the average loading force decreased by 3 kN). All tests were carried out at the same frequency and load ratio, i.e., f = 140 Hz and R = 0.1.
Fatigue crack growth rate testing was also carried out in the water environment and air condition at room temperature. Besides, the acting surfaces of specimens were worked by a grinding machine to achieve the desired roughness. Before experiments, CT specimens were fatigue pre-cracked according to the detailed procedure required in Ref [19]. First, a maximum loading force of 15 kN was applied to initiate the crack from the notch processed by EDM method. Then, a decrease of the maximum loading force of 5% was used stepwise until the target force of 12 kN was achieved. Finally, a 5% increase in the maximum force was adopted to minimize the effect of plastic deformation produced by the pre-cracking process. Generally, the pre-cracks were controlled to 4 mm after approximately 80,000 cycles in air condition and 50,000 cycles surrounded by water, respectively. In addition, the number of stress cycles was recorded for every stepwise 1 mm crack forward the crack propagation direction until the unstable propagation occurred. In addition, a constant load condition was applied to gain the fatigue crack growth rate data. The ΔK values are calculated by the following equation [19]:
where α is the normalized crack length defined by a/W (a: the crack length; W: the width of CT specimen).
2.3. Microscopic Morphology Observation
Fatigue fracture and fatigue crack propagation fracture morphologies were both observed under a scanning electron microscope of EVO-18 (Carl Zeiss, Oberkochen, German) to display the fracture features. The side surfaces of fractured CT specimens at different ΔK sites were processed into small pieces with dimensions of 5 mm × 5 mm × 2 mm by EDM method and finishing polished to release surface residual stress by a method of electrochemical polishing, with polishing voltage of 20 V, electrolyte being alcohol solution with 10 vol.% perchloric acid, and each of the polishing process continuing for about 20 s. All of the EBSD samples were then cleaned by ultrasonic cleaner for about 15 min in pure alcohol and stored in alcohol before testing. Electron back scatter diffraction test was carried out on the SEM equipped with an EBSD detector (Oxford Instruments, Shanghai, China) to determine deformation structures. The EBSD testing was conducted in a step size of 0.8 μm under the accelerating volage of 20 kV and the data were further analyzed by Aztec crystal software. Specifically, the loading direction for EBSD analysis is parallel to the transverse direction (TD) of the samples.
3. Results and Discussions
3.1. Fatigue Life Tests and Crack Initiation Analysis
In order to illustrate the influence of water on fatigue crack initiation process of X80 pipeline steel welded joints, fatigue tests were carried out on smooth fatigue specimens under air and water conditions. S-N curves under both air and water conditions are shown in Figure 4. Fatigue life of X80 pipeline steel welded joints was prolonged with the decrease of the maximum cyclic stress in both air and water environments. However, fatigue life in the water environment is obviously lower than that in air when the same stress was applied. For example, the number of cycles of welded joint was decreased from 1.3 million in air to 1.1 million in water condition under a stress load of 200 MPa, which indicates that the presence of water accelerates the crack initiation process.
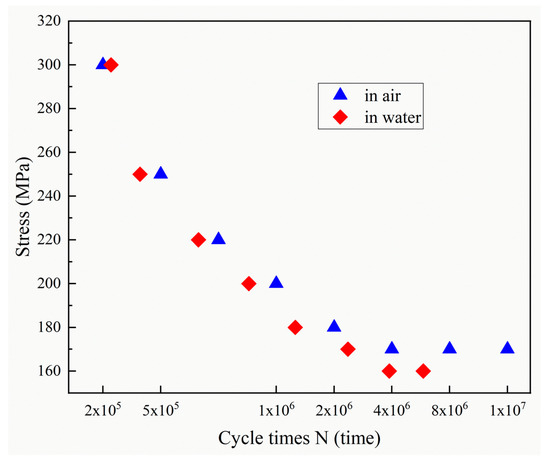
Figure 4.
S-N curves where the red scatters represent fatigue life in the water environment and the blue ones represent that in air condition.
To explain the acceleration mechanism of water on fatigue crack initiation, SEM was used to observe fracture surfaces of smooth fatigue specimens after fatigue tests in air and water environments. There are three different characterized morphologies applying for fatigue fractures: transgranular (TG), intergranular (IG), and quasi-cleavage (QC) [20]. Generally, TG is mostly featured as ductile fatigue striations instead of intergranular microcracks that correspond to IG. As for QC, typical minor facets and steps are widely observed and it may be accompanied by “river-marks” occasionally. Fatigue fractures obtained in air under a maximum loading stress of 250 MPa are shown in Figure 5. Fatigue fracture in air presents a great many radial fatigue striations and they are parallel to the crack growth direction. It should be noted that the crack initiated at the downside left corner of the fracture surface and then spread in all directions. Further observation of the crack initiation site showed a typical fracture mode of transgranular, which indicates that the fatigue crack began to initiate and expand after a large amount of plastic deformation.
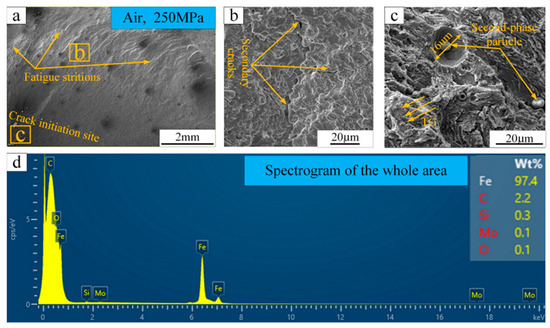
Figure 5.
Fracture surfaces of X80 steel welded joints in air. (a) The entire fracture surface; (b,c) the high magnifications of the boxed areas in (a); (d) the elements distribution of (c).
The fracture morphology in the presence of water is shown in Figure 6. The crack initiation site in this area was comprised of a great many micro-particles and the fracture mode transmitted to QC for a lot of minor facets and cleavage steps were observed and the ductile striation disappeared compared to the large proportions of that in air. In addition, the spectrogram showed a sharp increase on the weight percent of element “O”, i.e., percentage of 0.1 in air and 2.3 in water, from which we inferred that oxides in Figure 6c are hard and brittle iron oxidations such as Fe3O4 and Fe2O3 etc. The formation of oxides in the water environment dramatically increased the stress concentration and caused irreparable damages, which accelerated the initiation of corrosion fatigue cracks and thus reduced fatigue life. This is also consistent with the results found by Zhao et al. [21].
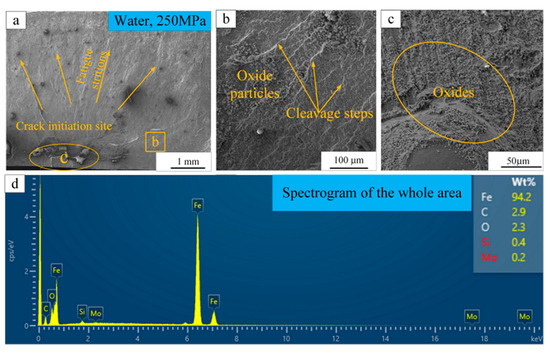
Figure 6.
Fracture surface of X80 steel welded joints in water environment. (a) The entire fracture surface; (b,c) the high magnifications of the boxed areas in (a); (d) the elements distribution of (c).
3.2. Fatigue Crack Growth Rate Tests and Acceleration Mechanism
Fatigue crack growth rate tests were performed on CT specimens of X80 steel welded joints under air and water conditions. The stable region of crack growth can be quantitatively described by Paris formula [22]:
where a is the crack length and N is the corresponding stress cyclic numbers. C and m are the constants related to the material and testing environments, while ΔK is the range of stress intensity factor experienced in the process of crack propagation. Herein, the total length is 20 mm from beginning of loading line to the end of pre-crack.
The results of fatigue crack growth rates in the air and water environment are shown in Figure 7. It can be seen that the crack growth rate in the water environment is obviously higher than that in air when the ΔK value exceeds 52 MPa·m1/2.
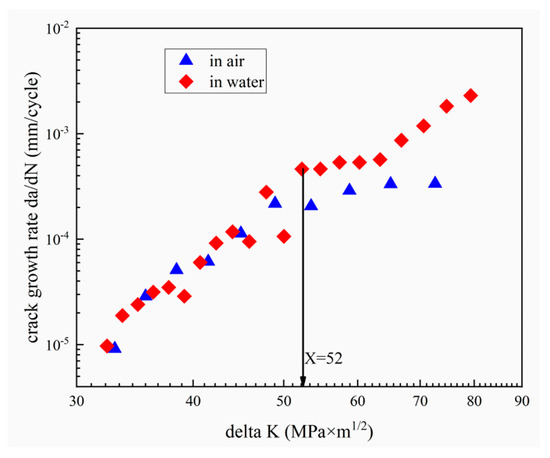
Figure 7.
The diagram of the fatigue crack growth rate of X80 steel welded joints in the air and water conditions.
As mentioned before, studies confirm that the mechanisms, which have generally been proposed to explain SCC, are also responsible for CF [10]. Therefore, the main mechanisms for a typical CF are subsequently considered to be HAC and SC of the metal at the crack tip, which has been well studied and practically applied by Cheng et al. [5]. Herein, we considered the water induced CF as SC and a combination of HAC and SC at the crack tip, when ΔK is below and exceeds 52 MPa·m1/2, respectively. It is worth noting that the ΔK being 52 MPa·m1/2 here could be regarded as the transition stress intensity factor, which interprets the corrosion fatigue crack growth behavior of pipeline carbon steel under HE mechanism and had been reported by Cheng et al. [6].
In order to investigate the microscopic influential mechanism of water on the crack growth rate of X80 steel welded joints, the fracture surfaces of CT specimens were observed by the usage of a scanning electron microscope, as is shown in Figure 8.
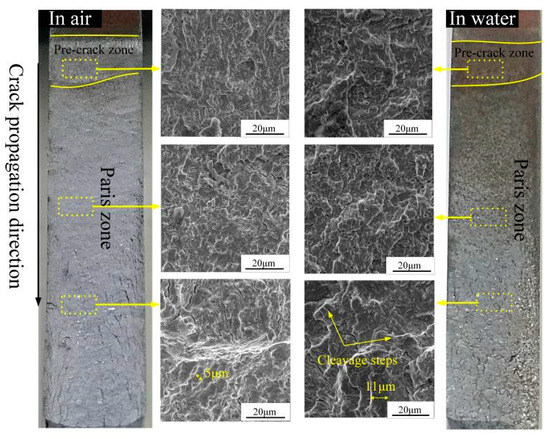
Figure 8.
Fracture morphology of fatigue crack growth specimens. The left is loading in the air and the right is loading in the water condition.
The fracture mechanism of fatigue crack propagation alternates from transgranular fracture in the stabilized region to cleavage fracture in the rapid propagation area in both air and water environments. A few cleavage steps are obviously recognized in the Paris region in the presence of water. In accordance with the results in Figure 7, there exists no difference between air and water environment when ΔK is below 52 MPa·m1/2. More importantly, the average width of the cleavage steps significantly increased from 5 μm in the air to about 11 μm in water environment when ΔK exceeds 52 MPa·m1/2, which indicates a slight deformation of the cracks loading in the water environment.
3.3. Crack Propagation Path and Deformation Structure Analysis
In order to investigate the influence of water on plastic deformation in the vicinity of the crack tip, OM structures of the side surfaces of CT specimens and EBSD testing areas are shown in Figure 9. The WFs are highlighted for their poor properties in the weld.
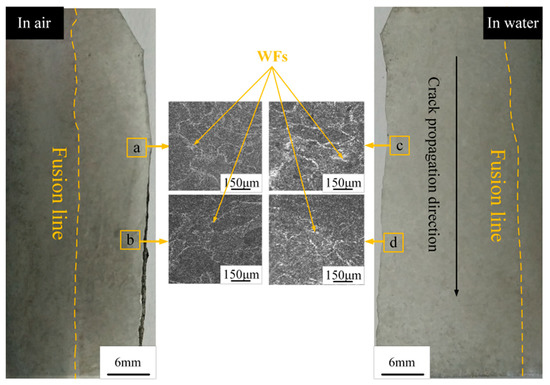
Figure 9.
Metallographic structures of the side surface near the crack path both in air and water; (a,b) are EBSD testing regions in air, where, the ΔK equals to 45 and 60 MPa·m1/2, respectively. (c,d) are EBSD testing regions in water, where, the ΔK equals to 45 and 60 MPa·m1/2, respectively.
The maps of inverse pole figures (IPF) of the RD-TD plane are presented in Figure 10, which reveals the orientation relationship between different grains. It is worth noting that the distributions of grain orientation do not vary much when ΔK is 45 MPa·m1/2 whether in an air or water environment (see Figure 10a,c), which implied that the effect of water is not activated in a relative low level of ΔK. In contrast, the non-negligible concentrations of a <001>//ND direction preference were both highlighted for the grain orientation when the loading environment alternates from air to water with ΔK being 60 MPa·m1/2 (see Figure 10b,d) and the stress level increases from 45 to 60 MPa·m1/2 with loading environment being water (see Figure 10c,d), from which we concluded that the effect of water on fatigue propagation starts from a certain level of stress level and the exact value of ΔK was figured out in Figure 7. Despite several studies [23,24,25] found that the CF cracks in near-neutral environment can also propagate along with grains oriented to or close to <101>//ND and <111>//ND directions and have no preferred path, Masoumi et al. [26] found that the cracks in pipeline steel subjected to hydrogen conditions were more likely to propagate in the direction of <001>//ND. Herein, we find the effect of water on the X80 pipeline steel welded joint may share a similar result as that exposed to the hydrogen environment.
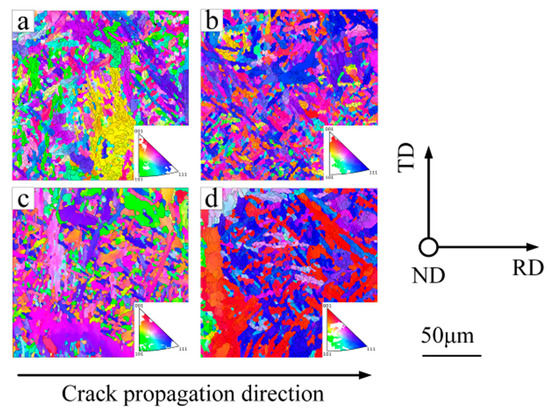
Figure 10.
IPF diagrams in X80 steel welded joints. (a) In air and ΔK. equals to 45 MPa·m1/2; (b) in air and ΔK. equals to 60 MPa·m1/2; (c) in water and ΔK. equals to 45 MPa·m1/2; (d) in water and ΔK. equals to 60 MPa·m1/2.
Figure 11 shows the distribution of grain boundary misorientations. The red lines are marked as grain boundaries with small angles (LAGBs), and the grain boundary misorientation is between 2° and 5°. The green lines are marked as the grain boundaries with medium angles (MAGBs), and the grain boundary misorientation is between 5° and 15°. The blue lines are marked as the grain boundaries with large angles, and the grain boundary misorientation is above 15°. It is well known that the distribution of grain boundaries in structural materials has a significant effect on mechanical properties for the extensive possibility of gathering for dislocations and defects in crystals [27,28]. The characterization of defects in materials such as voids can hardly be achieved by EBSD techniques though, it can accurately determine the grain orientation information. Different grain boundary angles show different stored energy under the motions of dislocations. Grain boundaries with small angles have more regular grain arrangement and lower energy storage because of their lower dislocation. On the one hand, grain boundary with large angles exhibit higher energy storage and are more likely to be deformed plasticly due to the accumulation of dislocations. On the other hand, the grain boundaries of large misorientations are often the initial site of the formation of cavities and microcracks for the high dislocation density [29]. Therefore, cracks are preferred to propagate through these crystal weak spots. After statistical analysis, the high fraction of HAGBs is observed in both air and water environments, and the fraction of LAGBs in the water environment in this study is almost the same as that in air, as shown in Figure 12, which indicates that the presence of water is of negligible effect on the energy barriers of boundaries.
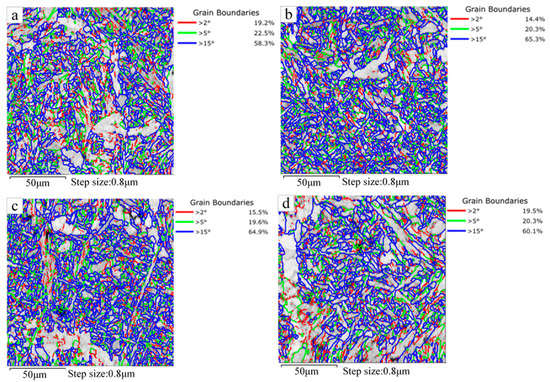
Figure 11.
Grain boundary types in X80 steel welded joints. (a) In air and ΔK, is 45 MPa·m1/2; (b) in air and ΔK, is 60 MPa·m1/2; (c) in water and ΔK, is 45 MPa·m1/2; (d) in water and is 60 MPa·m1/2.
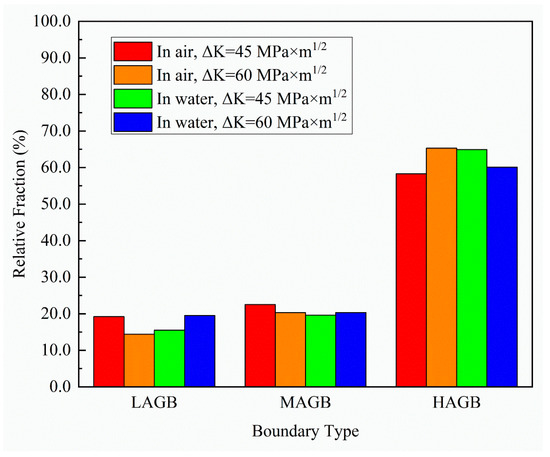
Figure 12.
Grain boundary types analysis in X80 steel welded joints.
Characterization of different coincident site lattice (CSL) boundaries is also matters for the investigation of material deformation. The CSL boundary is also the high misorientation boundary as large the angle grain boundary but it possesses unique properties. Shekhar et al. [30]. found that the CSL boundary near a specific plane plays an active role in the anti-cracking performance of materials by study of the strain field and energy of CSL boundaries. In order to figure out the influence of the water environment on the CSL boundary of the X80 steel welded joint, the detailed distribution of the CSL boundary characteristics obtained is shown in Figure 13. Herein, the discussion of the CSL boundary is limited to Σ29, for the properties of CSL boundaries are widely accepted to be similar to the random grain boundaries with large misorientation when they exceed Σ29 [31]. The relative frequency of CSL boundaries in both air and water environments of the micrographs is shown in Figure 14. It has been found that an increase in the relative frequency of low-Σ (CSL boundaries herein are mainly composed of Σ3, Σ11, Σ13c, Σ17b, Σ25a, and Σ25b) in the water environment, especially with ΔK being 60 MPa·m1/2, is relative to the degradation in crack resistance performance, which is also greatly in accordance with the results in Figure 7.
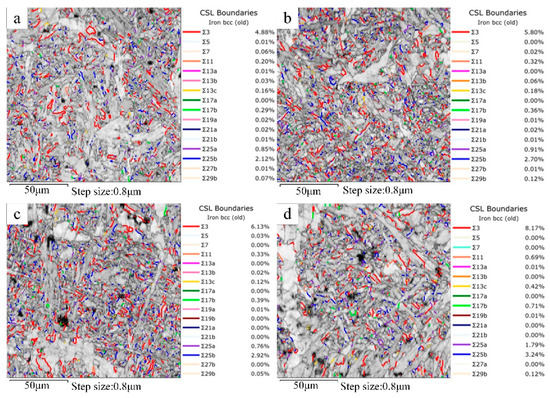
Figure 13.
The detailed CSL boundaries distributions of welded joints. (a) In air and ΔK, is 45 MPa·m1/2; (b) in air and ΔK, is 60 MPa·m1/2; (c) in water and ΔK, is 45 MPa·m1/2; (d) in water and ΔK, is 60 MPa·m1/2.
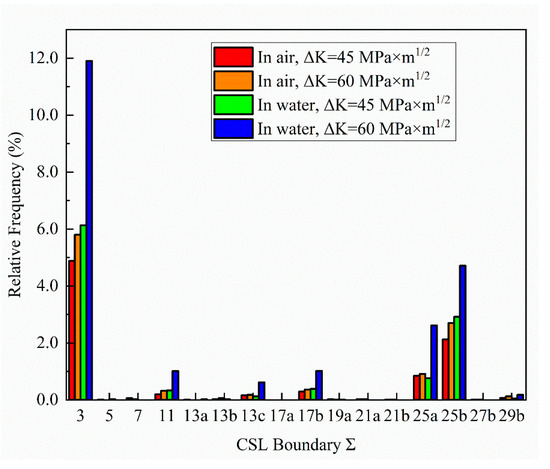
Figure 14.
CSL boundary distribution in X80 steel welded joints.
The kernel average misorientation (KAM) of the grains in the vicinity of the cracks plays a significant role in characterizing the fatigue crack propagation behavior, for the effect of KAM on engineering structural materials are mainly regarding to the plastic deformation [24]. KAM is qualified to display sufficient information about the misorientation of every grain in the detected area and more importantly, the plastic deformation of any single grain can be precisely calculated through this parameter [32,33]. In the present paper, KAM maps in different regions are shown in Figure 15. As is figured out, no matter whether in air or water environment, higher KAM valued regions are identified concentrating near the IAFs for their relatively large grain misorientations and high density of dislocations. In contrast, the KAM values at the interior of WFs exhibit much lower. In view of this uncertain situation, we illustrated the KAM distribution curves of the cracked areas in these four specimens, which are shown in Figure 16. Importantly, the detailed KAM distribution varies from air to water environment. The peak value of the curves refers to a misorientation angle of 0.75° both in air and water environments and it is worth mentioning that the KAM values rarely exceed 3.0°. Furthermore, the specimen subjected to water with ΔK. being 60 MPa·m1/2 exhibited the largest relative frequency of KAM values between 0° and 1°. As grains with low KAM values reflect a low dislocation density, the low KAM values of specimens subjected to the water environment draw a conclusion that the dislocation density is low in these areas, which indicates that cracks in the presence of water can also propagate without a large amount of plastic deformation.
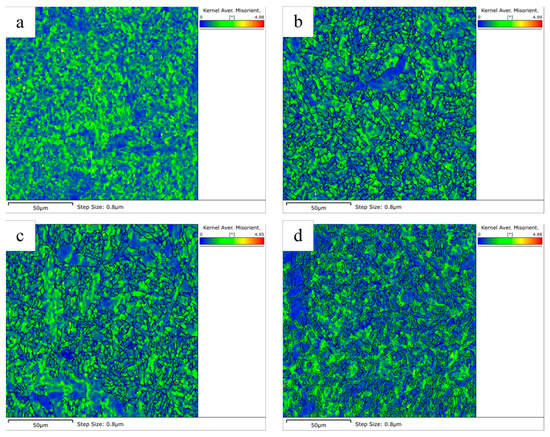
Figure 15.
Kernel average misorientation in air and water environments. (a) In air and ΔK, is 45 MPa·m1/2; (b) in air and ΔK, is 60 MPa·m1/2; (c) in water and ΔK, is 45 MPa·m1/2; (d) in water and ΔK, is 60 MPa·m1/2.
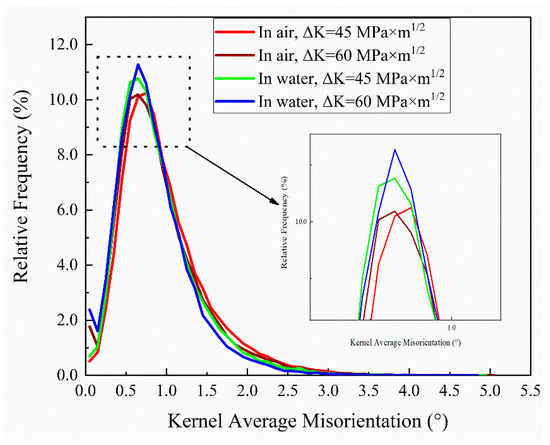
Figure 16.
KAM distributions in X80 steel welded joints.
Schmid factor have been widely used to explain the plastic performances of polycrystalline structures by applying for the classical plasticity theory [29,34] and it is closely related to the activation of slip systems. The higher the SF, the more easily the slip systems triggered for SF values reflect the level of shear stress loaded on the slip surface [35]. More importantly, the fatigue cracks of structural materials are widely reported to propagate through the direction of slip bands and they are mostly influenced by the motion of basic slip systems [36]. Therefore, it is representative and concerning to investigate the distribution and value of SF in explanation of fatigue behavior. The heat maps of calculated Schmid factors (SF) distribution with respect to primary ({110}<111>) and secondary ({112}<111>, {123}<111>) slip systems are shown in Figure 17, from where we can clearly identify higher proportions of SFs in {112}<111> and {123}<111> slip systems in the water environment compared with those in air, especially for the SIF range (ΔK) being 60 MPa·m1/2. However, SFs displayed pretty uniform in air whether on the alternation of the slip system or the change of ΔK. More importantly, as figured out in Figure 18, the Schmid factor values of the three slip systems subjected to the tested specimens in air and water environments with ΔK being 45 and 60 MPa·m1/2 differed significantly. {110}<111> slip system kept almost the same whether in air condition or in the presence of water, however, the Schmid factor of {112}< 111> and {123}< 111> in the water environment displayed the largest compared to that in air, which cogently indicates that fatigue cracks originated from grains with {112}<111> and {123}<111> slip systems and preferentially propagated through these two kinds of secondary slip systems. Similarly, the {123}<111> slip system was also found activated under fatigue cyclic loading by former studies [32,37]. Therefore, from the results above, we draw a conclusion that the water environment combined with ΔK does play an active role in driving the propagation of fatigue in X80 pipeline welded joint. The secondary slip systems of {112}<111> and {123}<111> in bcc structured X80 pipeline steel were activated by the coalescence of ΔK and water, which gives a prior contribution to the acceleration of crack propagation.
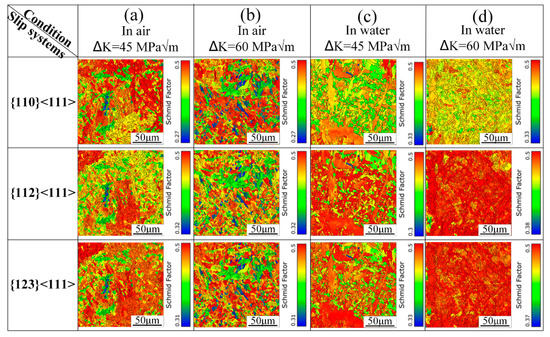
Figure 17.
Schmid factors distributions in X80 steel welded joints. (a) In air and ΔK, is 45 MPa·m1/2; (b) in air and ΔK, is 60 MPa·m1/2; (c) in water and ΔK, is 45 MPa·m1/2; (d) in water and ΔK, is 60 MPa·m1/2.
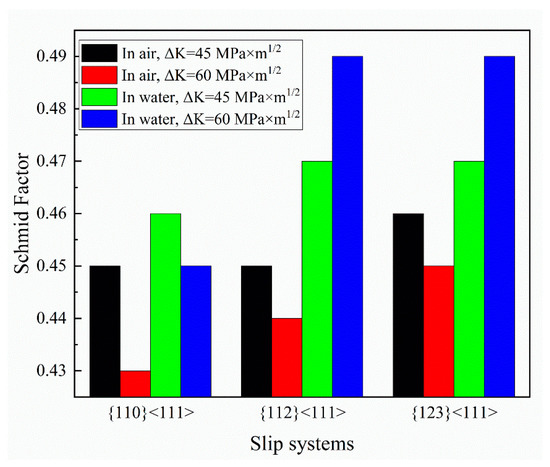
Figure 18.
Schmid factor analysis in X80 steel welded joints.
4. Conclusions
The aim of this work is to establish the mechanism during the entire fatigue process in the presence of water under a loading mode of high frequency. Fatigue life tests and fatigue crack growth rate tests were conducted to feature the effect of water on fatigue behavior. Fracture surface morphologies were investigated and deformation structures of X80 steel welded joints in air and water environments were discussed. The main conclusions are drawn as follows:
- Fatigue life of X80 steel welded joints in the water environment is typically lower than that in air when the same stress level was loaded.
- Oxide particles induced by the water environment gradually formed the fatigue crack initiation site and decreased the fatigue life of the X80 pipeline steel welded joint.
- Crack growth rate does not differ much in the water environment when the SIF range is limited within a certain level and it is much higher than that in air when the SIF range exceeds 52 MPa·m1/2.
- The preferred grain orientation of <001>//ND and CSL boundaries of Σ3, Σ11, Σ13c, Σ17b, Σ25a, and Σ25b are both prone to fatigue propagation when loading in the water environment.
- The coalescence of the SIF range and water plays an active role in accelerating FCGR by motivating secondary slip systems of {112}<111> and {123}<111> in bcc crystalline structures.
Author Contributions
Conceptualization, methodology and funding acquisition, X.Z.; validation, investigation and writing—original draft preparation, G.L.; formal analysis, date curation and project administration, D.X.; funding acquisition, visualization and writing—review and editing Y.L.; resources, funding acquisition, C.H. All authors have read and agreed to the published version of the manuscript.
Funding
This work was financially supported by the National Nature Science Foundation of China under Grant No. 51875246, the Natural Science Foundation of Jilin Province through Grant No. 20180101323JC, the Key Scientific and Technological Research and Development Projects of Jilin Provincial Science and Technology Department through Grant No. 20180201005GX, the “13th Five Year Plan” Science and Technology Research of the Education Department of Jilin Province through Grant No. JJKH20190143KJ, JJKH20200954KJ and JJKH20200973KJ.
Institutional Review Board Statement
Not applicable.
Informed Consent Statement
Not applicable.
Data Availability Statement
We claimed that our original research data was presented subjectively.
Conflicts of Interest
No conflict of interest exists in the submission of this manuscript, and the manuscript is approved by all authors for publication.
References
- Yu, M.S.; Xing, X.; Zhang, H.; Zhao, J.X.; Eadie, R.; Chen, W.X. Corrosion fatigue crack growth behavior of pipeline steel under underload-type variable amplitude loading schemes. Acta Mater. 2015, 96, 159–169. [Google Scholar] [CrossRef]
- Seifert, H.P.; Ritter, S.; Leber, H.J. Corrosion fatigue crack growth behaviour of austenitic stainless steels under light water reactor conditions. Corros. Sci. 2012, 55, 61–75. [Google Scholar] [CrossRef]
- Askari, M.; Aliofkhazraei, M.; Afroukhteh, S. A comprehensive review on internal corrosion and cracking of oil and gas pipelines. J. Nat. Gas Sci. Eng. 2019, 71, 102971. [Google Scholar] [CrossRef]
- Zhao, T.L.; Liu, Z.Y.; Du, C.W.; Dai, C.D.; Li, X.G.; Zhang, B.W. Corrosion fatigue crack initiation and initial propagation mechanism of E690 steel in simulated seawater. Mater. Sci. Eng. A 2017, 708, 181–192. [Google Scholar] [CrossRef]
- Cheng, A.K.; Chen, N.Z. Corrosion fatigue crack growth modelling for subsea pipeline steels. Ocean Eng. 2017, 142, 10–19. [Google Scholar] [CrossRef]
- Cheng, A.K.; Chen, N.Z. Fatigue crack growth modelling for pipeline carbon steels under gaseous hydrogen conditions. Int. J. Fatigue 2017, 96, 152–161. [Google Scholar] [CrossRef]
- Griggs, J.; Gamboa, E.; Lavigne, O. A review of modelling high pH stress corrosion cracking of high pressure gas pipelines. Mater. Corros. 2016, 67, 251–263. [Google Scholar] [CrossRef]
- Woodtli, J.; Kieselbach, R. Damage due to hydrogen embrittlement and stress corrosion cracking. Eng. Fail. Anal. 2000, 7, 427–450. [Google Scholar] [CrossRef]
- Fang, B.Y.; Atrens, A.; Wang, J.Q.; Han, E.H.; Zhu, Z.Y.; Ke, W. Review of stress corrosion cracking of pipeline steels in “low” and “high” pH solutions. J. Mater. Sci. 2003, 38, 127–132. [Google Scholar] [CrossRef]
- Shipilov, S.A. Mechanisms for corrosion fatigue crack propagation. Fatigue Fract. Eng. Mater. Struct. 2002, 25, 243–259. [Google Scholar] [CrossRef]
- Krenn, C.R.; Morris, J.W. The compatibility of crack closure and Kmax dependent models of fatigue crack growth. Int. J. Fatigue 1999, 21, 147–155. [Google Scholar] [CrossRef]
- Fassina, P.; Brunella, F.; Lazzari, L.; Re, G.; Vergani, L.; Sciuccati, A. Fatigue behavior of pipeline steel under hydrogen environment and low temperature. Procedia Eng. 2011, 10, 3345–3352. [Google Scholar] [CrossRef]
- Wang, J.; Ma, J.; Liu, Y.; Zhang, T.; Wu, S.; Sun, Q. Influence of Heat Input on Microstructure and Corrosion Resistance of Underwater Wet-Welded E40 Steel Joints. J. Mater. Eng. Perform. 2020, 29, 6987–6996. [Google Scholar] [CrossRef]
- Tomków, J.; Fydrych, D.; Rogalski, G. Dissimilar underwater wet welding of HSLA steels. Int. J. Adv. Manuf. Technol. 2020, 109, 717–725. [Google Scholar] [CrossRef]
- Moreno-Uribe, A.M.; Bracarense, A.Q.; Pessoa, E.C.P. The effect of polarity and hydrostatic pressure on operational characteristics of rutile electrode in underwater welding. Materials 2020, 13, 5001. [Google Scholar] [CrossRef] [PubMed]
- Tomków, J.; Janeczek, A.; Rogalski, G.; Wolski, A. Underwater local cavity welding of s460n steel. Materials 2020, 13, 5535. [Google Scholar] [CrossRef] [PubMed]
- American Welding Society (AWS). Specification for Low-Alloy. Steel Electrodes for Flux Cored Arc Welding (AWSA5.29/A5.29M:2005), 4th ed.; American Welding Society: Miami, FL, USA, 2005. [Google Scholar]
- ASTM E468–90. Standard Practice for Presentation of Constant Amplitude Fatigue Tests Results for Metallic Materials; American Society for Testing and Materials: West Conshohocken, PA, USA, 2004. [Google Scholar]
- ASTM International. Standard Test. Method for Measurement of Fatigue Crack Growth Rates, ASTM E647-15; ASTM International: West Conshohocken, PA, USA, 2011. [Google Scholar]
- Alvar, A.; Wan, D.; Olden, V.; Barnoush, A. Hydrogen enhanced fatigue crack growth rates in a ferritic Fe-3 wt%Si alloy and a X70 pipeline steel. Eng. Fract. Mech. 2019, 219, 106641. [Google Scholar] [CrossRef]
- Zhao, W.M.; Wang, Y.X.; Zhang, T.M.; Wang, Y. Study on the mechanism of high-cycle corrosion fatigue crack initiation in X80 steel. Corros. Sci. 2012, 57, 99–103. [Google Scholar] [CrossRef]
- Paris, P.; Erdogan, F. A critical analysis of crack propagation laws. J. Basic Eng. 1963, 85, 528–533. [Google Scholar] [CrossRef]
- Mohtadi-Bonab, M.A.; Szpunar, J.A.; Collins, L.; Stankievech, R. Evaluation of hydrogen induced cracking behavior of API X70 pipeline steel at different heat treatments. Int. J. Hydrog. Energy 2014, 39, 6076–6088. [Google Scholar] [CrossRef]
- Mohtadi-Bonab, M.A.; Eskandari, M.; Rahman, K.M.M.; Ouellet, R.; Szpunar, J.A. An extensive study of hydrogen-induced cracking susceptibility in an API X60 sour service pipeline steel. Int. J. Hydrog. Energy 2016, 41, 4185–4197. [Google Scholar] [CrossRef]
- Zhang, S.Q.; Fan, E.D.; Wan, J.F.; Liu, J.; Huang, Y.H.; Li, X.G. Effect of Nb on the hydrogen-induced cracking of high-strength low-alloy steel. Corros. Sci. 2018, 139, 83–96. [Google Scholar] [CrossRef]
- Masoumi, M.; Silva, C.C.; de Abreu, H.F.G. Effect of crystallographic orientations on the hydrogen-induced cracking resistance improvement of API 5L X70 pipeline steel under various thermomechanical processing. Corros. Sci. 2016, 111, 121–131. [Google Scholar] [CrossRef]
- Konijnenberg, P.J.; Zaefferer, S.; Raabe, D. Assessment of geometrically necessary dislocation levels derived by 3D EBSD. Acta Mater. 2015, 99, 402–414. [Google Scholar] [CrossRef]
- Maitland, T.; Sitzman, S. Backscattering Detector and EBSD in Nanomaterials Characterization. In Scanning Microscopy for Nanotechnology: Techniques and Applications; Springer: New York, NY, USA, 2006; pp. 41–75. [Google Scholar]
- Masoumi, M.; Santos, L.P.M.; Bastos, I.N.; Tavares, S.S.M.; da Silva, M.J.G.; de Abreu, H.F.G. Texture and grain boundary study in high strength Fe-18Ni-Co steel related to hydrogen embrittlement. Mater. Des. 2016, 91, 90–97. [Google Scholar] [CrossRef]
- Shekhar, S.; King, A.H. Strain fields and energies of grain boundary triple junctions. Acta Mater. 2008, 56, 5728–5736. [Google Scholar] [CrossRef]
- Eskandari, M.; Yadegari-Dehnavi, M.R.; Zarei-Hanzaki, A.; Mohtadi-Bonab, M.A.; Basu, R.; Szpunar, J.A. In-situ strain localization analysis in low density transformation-twinning induced plasticity steel using digital image correlation. Opt. Lasers Eng. 2015, 67, 1–16. [Google Scholar] [CrossRef]
- Cui, X.; Zhang, S.; Wang, C.; Zhang, C.H.; Chen, J.; Zhang, J.B. Microstructure and fatigue behavior of a laser additive manufactured 12CrNi2 low alloy steel. Mater. Sci. Eng. A 2020, 772, 138685. [Google Scholar] [CrossRef]
- Jiang, Y.B.; Li, C.N.; Di, X.J.; Wang, D.P.; Liu, J.C. EBSD analysis of microstructures and mechanical properties of softened zones in X60 reeled-pipeline welded joint after cyclic plastic deformation. Weld. World 2020, 64, 1213–1225. [Google Scholar] [CrossRef]
- Azar, A.S.; Svensson, L.E.; Nyhus, B. Effect of crystal orientation and texture on fatigue crack evolution in high strength steel welds. Int. J. Fatigue 2015, 77, 95–104. [Google Scholar] [CrossRef]
- Sasaoka, S.; Arakawa, J.; Akebono, H.; Sugeta, A.; Shirai, Y.; Nakayama, E. The effects of crystallographic orientation on fatigue crack initiation behavior in Ti-6Al-4V. Int. J. Fatigue 2018, 117, 371–383. [Google Scholar] [CrossRef]
- Birosca, S. The deformation behaviour of hard and soft grains in RR1000 nickel-based superalloy. IOP Conf. Ser. Mater. Sci. Eng. 2015, 82, 15–21. [Google Scholar] [CrossRef]
- Nakai, Y.; Saka, M.; Yoshida, H.; Asayama, K.; Kikuchi, S. Fatigue crack initiation site and propagation paths in high-cycle fatigue of magnesium alloy AZ31. Int. J. Fatigue 2019, 123, 248–254. [Google Scholar] [CrossRef]


Publisher’s Note: MDPI stays neutral with regard to jurisdictional claims in published maps and institutional affiliations. |
© 2021 by the authors. Licensee MDPI, Basel, Switzerland. This article is an open access article distributed under the terms and conditions of the Creative Commons Attribution (CC BY) license (http://creativecommons.org/licenses/by/4.0/).