Article

Kinetics of Arsenic Surface Segregation in Scrap-Based Silicon Electrical Steel

by
Darja Steiner Petrovič
Institute of Metals and Technology, Lepi pot 11, 1000 Ljubljana, Slovenia
Metals 2021, 11(1), 1; https://doi.org/10.3390/met11010001
Submission received: 26 November 2020 / Revised: 15 December 2020 / Accepted: 15 December 2020 / Published: 22 December 2020
(This article belongs to the Special Issue Segregation Phenomena in Alloys Systems)

Abstract

:
The segregation kinetics of surface-active, residual elements are investigated in an in situ study of annealing scrap-based silicon electrical steel sheet where the arsenic (As) surface segregation is highlighted. During annealing in the temperature range of 300–950 °C, different kinds of interactions between the segregated residual elements were observed. Attractive interactions between the segregands produced co-segregation, e.g., between Sn and Sb, whereas repulsive interactions resulted in site competition, e.g., between Sn and As. These competing interactions are strongly time dependent. In spite of there being twice as much Sn compared to As in the bulk material, the As prevailed in the surface enrichments of the polycrystalline silicon steel at 950 °C. The intensity of the As surface segregation in the temperature range 800–950 °C is proportional to the calculated amount of γ-austenite phase in the (α + γ) steel matrix. The detected phenomenon of the As versus Sn site competition could be valuable for the texture design and surface engineering of silicon steels with a thermodynamically stable two-phase (α + γ) region.

1. Introduction

There is an increasing need for highly power-efficient electrical machines for a wide range of applications in which silicon electrical steel is the core material. For an optimal design of the electromagnetic properties, the chemical composition, and the recrystallization annealing of the steel are the most important influencing parameters [1,2,3,4]. Because the interest will continue to grow for high-specific-power electrical machines, especially for various new and un-conventional applications, the development of new classes of high-specific-power electrical machines and drives is required [4].
Recent studies reveal that a properly controlled phase transformation from γ-austenite to α-ferrite provides a promising method to optimize the crystallographic texture of silicon steels [5,6]. It is well known that the phase transformations in an alloy system are set by the laws of thermodynamics. In Fe–Si alloys that are to be further processed into grain-oriented and non-oriented electrical steel sheets and coils, the metallurgy is relatively complex. When secondary-metallurgy routes are involved, the steel’s cleanliness is an important factor. Efforts must be focused on the overall chemical composition of the steel, and the control of the residual elements must be appropriate.
In the electric-arc-furnace (EAF) steelmaking process, the main raw material is ferrous scrap, and an inspection of its quality is the first crucial step in producing a clean steel.
Ferrous scrap is the most recycled material in the world, and through its utilization CO2 emissions can be significantly reduced. According to the comprehensive statistical data of The World Steel Association [7], the imports and exports of scrap rose globally to >200 million metric tonnes in total, and that value is still increasing. In Figure 1, the importance of the ferrous-scrap trade flow in the global economy is demonstrated by imports being greater than exports.
The scrap received by steel plants comes from the recycling industries and should be pre-processed in several steps, including collecting, sorting and mechanical preparation via magnetic separation, fragmentation, physical separation, etc. Currently, the steel industry uses predominantly visual inspection to specify the ferrous scrap and its quality. The concentration of impurities and residual elements is generally identified after the melting process, rather than before or during the selection of the scrap [8].
It is well known that routinely manufactured steel using recycled scrap leads to an overall increase in the impurity concentrations of Cu and Sn, in particular, though the presence of other impurities, like As and Sb, is not negligible [9,10,11,12]. Although there is a great deal of knowledge about residual Cu and Sn in steel, a shortage of recent studies on other, less common elements at residual levels has been identified [8].
Arsenic (As) can originate from several resources, such as complex iron ore, scrap steel, ferroalloys, and other furnace charges [9,10,11]. The effects of residual element As on the properties of steels are receiving more and more attention [9,11,12,13,14,15,16,17]. In a micro-alloyed steel resulting from a compact strip production (CSP) process, As was found to segregate at the grain boundaries when the steel was annealed in the temperature range 950–1100 °C [18,19]. Macroscopic segregation studies showed that As segregated in regions near the top and bottom surfaces of the strip [20]. Moreover, As was found to segregate to the interface between the matrix and the oxide scale of the micro-alloyed steel [21]. It was also reported [9] that As and (As + Cu) accelerate the oxidation of C–Mn steels and induce hot shortness. Surface cracking is most severe at 1050 °C. As promotes internal oxidation and facilitates the grain-boundary oxidation at temperatures above 1000 °C [9]. In Fe-0.3 wt % Cu alloys, the presence of up to 0.1 wt % As did not induce grain-boundary cracking [12].
A study of the literature [9,10,11,12,13,14,15,16,17,18,19,20,21,22,23,24,25] shows that the effects of As on the properties of iron alloys and steels have been studied for contents ranging from 0.002 to 10.0 wt % As, whereas surface-science investigations on As segregation behavior were predominantly focused on As contents ranging from 0.005 to 0.05 wt % As in polycrystalline samples and single crystals. High temperature annealing studies have shown that the segregation of S is highly favored over the segregation of As [23,24].
In the research field of silicon electrical steels, the search for the microstructure and texture optimization of electrical steels that can reduce magnetic losses is of great relevance.
Therefore, the aim of this study is to provide more accurate data on the temperature-time dependency of As surface segregation in the scrap-based silicon steel produced by secondary metallurgy. The results derive from a methodology using in situ Auger electron spectroscopy (AES) during isothermal annealing at temperatures from 300 °C up to 950 °C.

2. Material and Methodology

2.1. Material

In this study, a specimen of semi-processed, non-oriented silicon steel sheet with dimensions of 15.0 mm × 5.0 mm × 0.1 mm was used. The alloy’s chemical composition is given in Table 1.
The industrial steel-sheet production steps involved: processing in an electric arc furnace, as a highly efficient recycler of steel scrap, followed by de-slagging, vacuum-oxygen decarburization, ladle-furnace refining of the liquid steel melt, slab-casting, slab reheating, slab hot-rolling to 2.4 mm, and cold rolling to 0.5 mm. The final step in the preparation of the specimen was cold-rolling to a thickness of 0.1 mm, which is suitable for resistive heating.
The selected Fe-Si-Al alloy was produced in an industrial production process using secondary metallurgy. The values of carbon and oxygen provided in Table 1 are typical for the producer, and the steel grade. The sample was taken from semi-processed steel sheet, before decarburization and recrystallization annealing. In a continuous process of heat treatment, the steel sheet would then be decarburized in a humid H2O/H2 atmosphere, and then annealed for recrystallization and grain growth in a dry atmosphere, all at T > 800 °C.

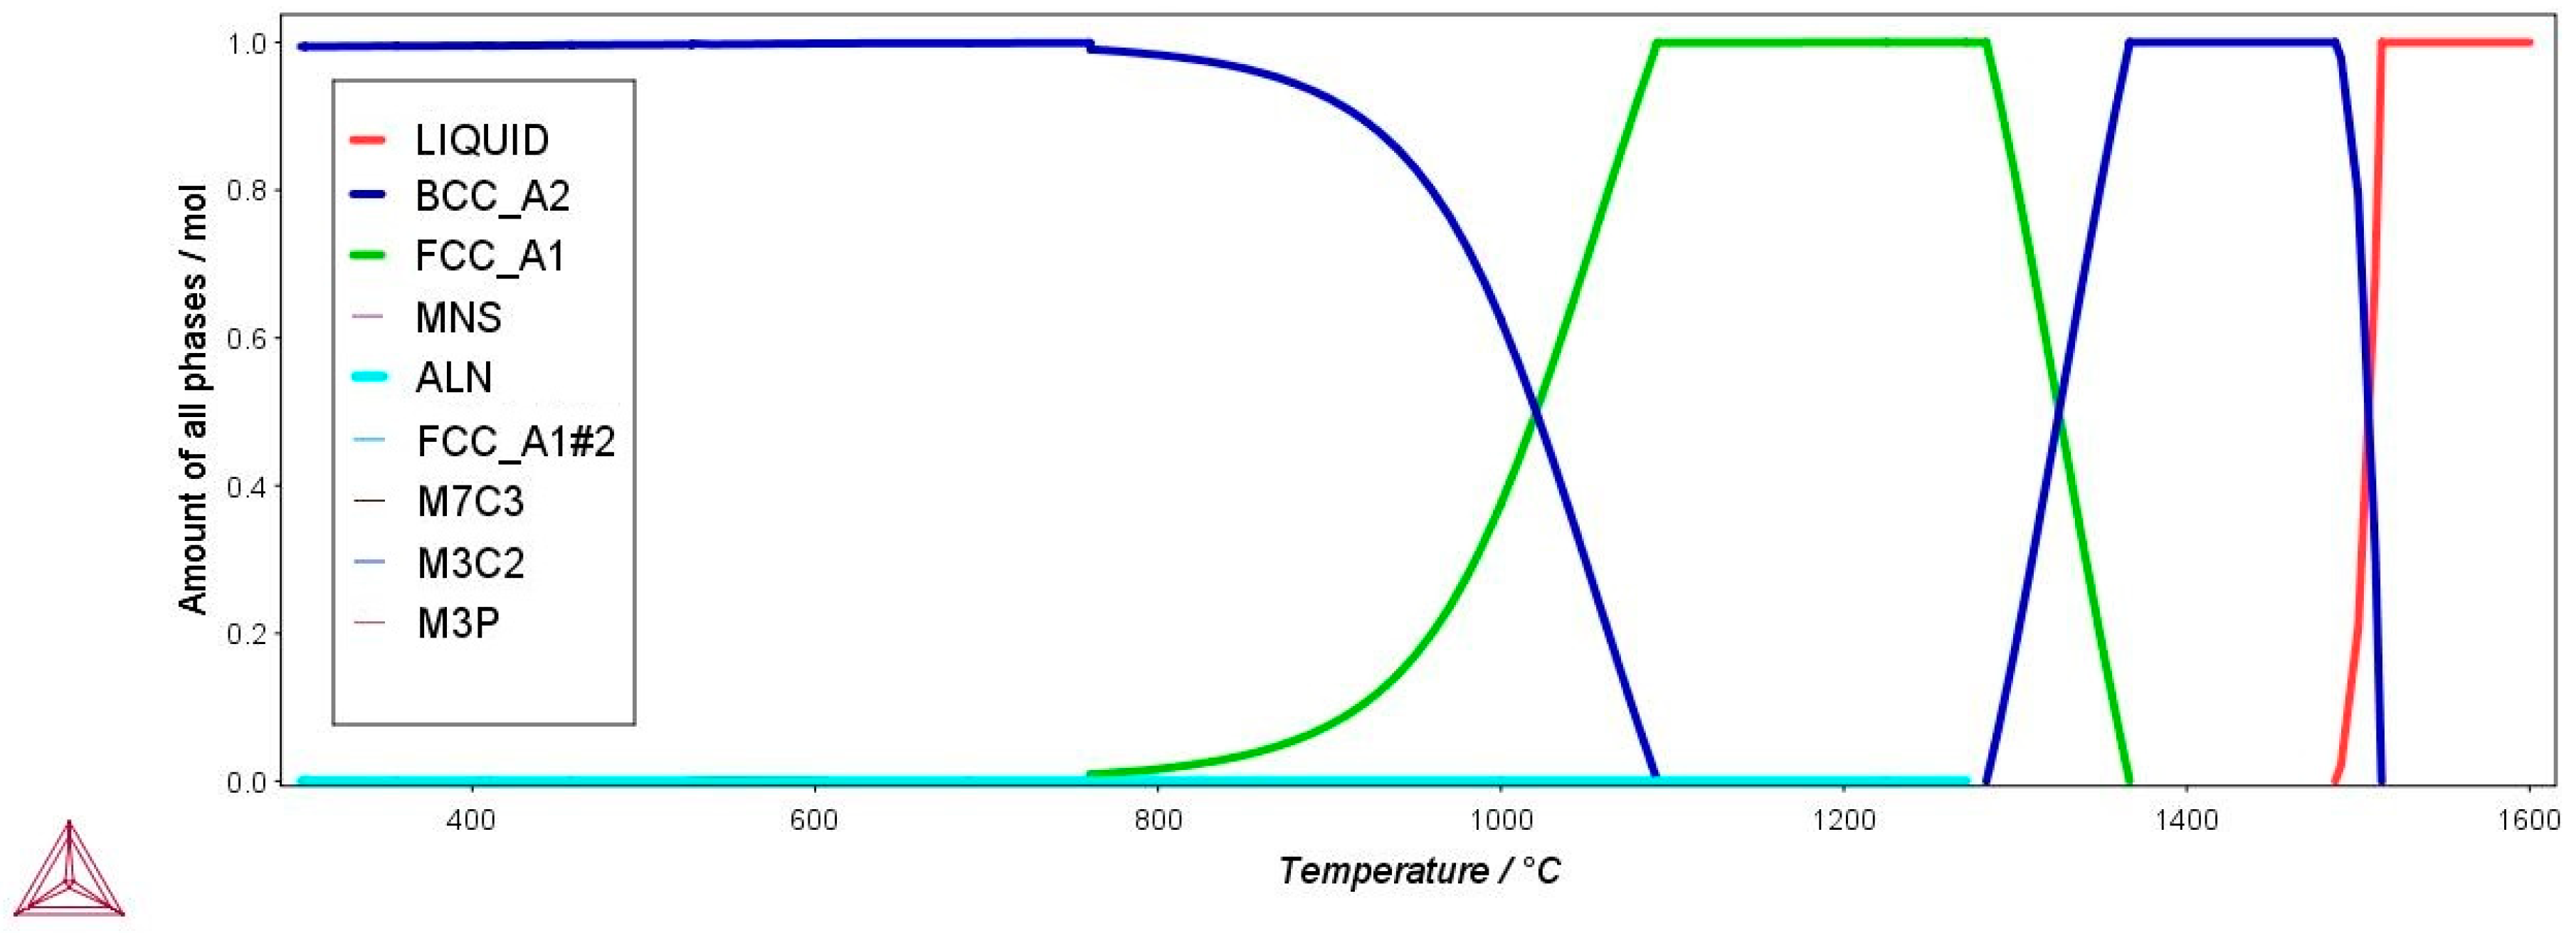
2.2. Thermodynamic Calculations

The thermodynamic equilibrium calculations were performed using the Thermo-Calc [26] Software package 2017a and the database TCFE8:Steels/Fe-Alloys v8.1. The phase equilibria in the selected alloy (Table 1) were calculated for the temperature range 300–1600 °C.

2.3. In Situ Study of Surface Segregations

For the in situ study of the segregation kinetics of surface active, residual elements in ultra-high vacuum (UHV) the specimen was resistively heated using an alternating current in the chamber of an Auger electron spectrometer (Microlab 310 F instrument, VG Scientific Ltd., East Grinstead, UK). The surface of the specimen metallographically prepared by grinding and polishing was subsequently cleaned using Ar-ion sputtering in order to obtain an appropriate surface. The temperature was monitored with a NiCr/Ni thermocouple that was attached to the specimen. The spectra were taken using a 10-kV electron-beam energy for the excitation of the Auger electrons and were recorded with a fixed retard ratio 4 of the analyzer. The spectrometer was mounted on an ion-pumped ultra-high-vacuum chamber. The typical pressure during the AES analysis was 10−7 Pa, which increased to 10−5 Pa during annealing at 950 °C. A Balzers QMS 200 quadrupole mass spectrometer (Balzers AG, Balzers, Principality of Liechtenstein) was used to analyze the residual gas during the experiments. Prior to the experiment at each annealing step, the specimen was cleaned by ion-etching. The AES measurements were performed after 5 min of annealing, in a 10-min sequence. The total time period for the isothermal annealing, with measurements, was 65 min.
The surface concentrations of the segregands were evaluated from differentiated AES spectra using the peak-to-peak ratios (of the segregand in comparison to that of iron). The spectra were acquired by Avantage V 3.41 data-acquisition and analysis software (version 3.41 VG Scientific Ltd., East Grinstead, UK) and processed by CasaXPS data-analysis software (Version 2.3.15, Casa Software Ltd., Teignmouth, UK) [27]. Assuming that the Auger peak-height ratio is proportional to the atomic concentration of the analyzed element, the surface concentrations were calculated as follows:
x i s u r f = k i · h i h F e ( 703 e V )
  • x i s u r f the surface concentration of the segregand
  • k i sensitivity factor related to the segregand and the spectrometer (see Table 2)
  • h i the peak height of the segregand.

3. Results and Discussion

Due to the temperature limits of the resistive heating in the UHV chamber of the Auger electron spectrometer, the surface segregation of As was monitored in the temperature range 300–950 °C.
According to the thermodynamic equilibrium calculations (Figure 2, Table 3), the alloy’s microstructure at room temperature is composed of an α-ferrite matrix (BCC_A2) and a small amount of precipitates, predominantly non-metallic inclusions of AlN, MnS, and various carbides (M7C3, M3C2) and phosphides (M3P).
The Thermo-Calc calculation is used for the detection of temperature of α→γ transformation. Up to 760 °C, the alloy is fully ferritic, then the phase transformation takes place and the precipitation of γ-austenite (FCC_A1) begins. At 950 °C, the equilibrium two-phase (α + γ) matrix consists of approximately 83% α-ferrite and 17% γ-austenite. The proportion of γ-austenite in the alloy increases with the increasing temperature up to 1090 °C, when it reaches 100%. Fully austenitic structure is stable to 1283 °C.
For the same purpose, differential scanning calorimetry (DSC, STA-449 C Jupiter, Netzsch, Selb, Germany) was used in one of our previous studies. The main limitations of the DSC method in comparison to the thermodynamic calculations have also been discussed [29]. In the temperature range where the thermodynamic calculations predict the existence of the two-phase (α + γ) region for the selected high-manganese Fe-Si-Al alloy, the DSC heating/melting curves exhibit weak thermal events only. It was concluded, that the small volume fraction of the phase to be transformed (when α→γ, or γ→α), and the dissolution response of the two-phase microstructure, which may occur over a range of temperatures, additionally contributed to the lower sensibility of the DSC method in the determination of the two-phase region in the selected alloy. On the other hand, the calorimetric method was effectively used for the determination of the alloy’s Curie temperature [29].
The experimental results revealed that the segregation processes in the alloy used for the fabrication of the non-oriented electrical steel are very complex. Surface segregations of C, O, and Si prevailed up to the 500 °C, while at 600 °C, segregated Sn, O, Cu, and Al were detected.
The segregation behavior of the segregands in the temperature range 650–950 °C is shown in Figure 3, Figure 4, Figure 5 and Figure 6. It should be pointed out that Si and Al are the main alloying elements. In any case, the surface segregation of the residual element As was not detected up to a temperature of 650 °C (Figure 3). At this temperature, repulsive interactions between Si and P are observed (Figure 3c).
The competing interactions are strongly time dependent: with an increasing duration of the annealing, the surface enrichment with Si decreases and the enrichments of P, Sn, Cu, and As simultaneously increase (Figure 3).
It is evident from Figure 4, Figure 5 and Figure 6 that in the temperature range 800–950 °C the most active surface segregands are Sn, Sb, and As.
Interestingly, the greater the proportion of γ-austenite in the matrix, the more intense was the segregation of As. At 950 °C and after 53 min of annealing, the surface concentration of As reached its maximum, i.e., 12.8 at.%, then the surface enrichments of As slightly decreased (Figure 6). It is assumed that the equilibrium elemental surface-segregations could not be established because of the desorption of segregated species from the surface.
Under equilibrium conditions, the segregation rate of a segregand depends heavily on the segregand with the higher segregation energy [30].
The preconditions for an equilibrium surface segregation are [31,32,33]: (i) that the segregation equilibrium, atoms (dissolved) = atoms (chemisorbed), is established quickly; (ii) that the desorption of the adsorbed species occurs only very slowly; (iii) that there is sufficient solubility of the adsorbate in the metal, so that segregation can occur without the depletion of solute atoms.
In polycrystalline samples an additional contribution due to grain-boundary diffusion is responsible for the significantly larger diffusion coefficient and consequently the segregation rate [34]. However, the theoretical description of the simultaneous interactions of several atomic species in multicomponent systems from experimental temperature-dependent segregation profiles constitutes a severe test for any modeling effort [35]. After Grabke [32], most elements that can be dissolved in an iron matrix, and have a lower surface energy than the initial iron surface, tend to enrich during elevated temperatures at the surface and interfaces according to their solubility:
X (dissolved) = X (segregated)
These preconditions are fulfilled in the case of As, Sn, and Sb surface segregations in the selected scrap-based silicon steel. Regarding the As solubility, and its diffusion coefficient in the steel matrix (Table 4), significant differences are observed at the temperatures of the two-phase (α + γ) stability.
When γ-austenite occupies a considerable portion, As surface enrichments prevail over those of Sn and Sb, which are conditioned upon the diffusivity of the elements as well.
Thermodynamic calculations show that the proportion of γ-austenite at 760–850 °C is very small (<3.5%), but later on, its content in the two-phase matrix increases from 7.6% at 900 °C to 17% at 950 °C (Table 3). This tendency of the As segregation behavior can be extrapolated to higher annealing temperatures and higher ratios of γ-austenite versus α-ferrite. According to the thermodynamic calculations, their respective ratio of 50:50 is reached at 1020 °C (Figure 2).
Based on the high tendency of the segregands to evaporate (Table 5), the process of As surface segregation during the annealing can be described by Equation (3) of a dynamic equilibrium:
As (dissolved) = As (segregated) → As (desorbed)
In Figure 5 and Figure 6 a strong site competition between the segregated species Sn, Sb and As can be seen as well. An obvious competition began at 900 °C (Figure 6c,d). In comparison, laboratory manufactured silicon steels with 0.025–0.1 wt % Sn, and without As and Sb additions [42], the surface segregation of Sn started at approximately 600 °C and increased to its maximum values at the highest experimental annealing temperature, i.e., 900 °C. In the present study it is assumed, therefore, that the segregated As inhibits the surface active elements Sn and also Sb in the specific temperature range of T > 800 °C (Figure 6).
There is an unexplored possibility of improving the magnetic properties of non-oriented electrical steels through texture control [43]. The final texture in non-oriented electrical steels is influenced by all textures developed during the processing steps [44]. Hot rolling and/or partial recrystallization of γ-austenite give rise to different types of transformed textures, thus affecting the final properties of the cold-rolled, and subsequently recrystallized sheets. Hot rolling conducted mainly in the austenite region leads to a heterogeneous final microstructure with a low magnetic induction whereas rolling in the two-phase region ensures improved magnetic properties [45,46,47]. The hot and cold rolling in combination with the thermal treatment and the variation of the composition of the alloy are the processing variables for achieving the required properties of the silicon steel sheets [43]. It is well known that above approximately 700 °C the very complex processes of recrystallization and texture evolution in silicon steels take place. This occurs during/after plastic deformation, i.e., hot and cold rolling [43,44,45,46,47].
In order to engineer magnetic properties of electrical steels through controlled surface modification, controlled segregation of the bulk constituents could be carried out in the two-phase (α + γ) region. However, further experiments are needed to show how the arsenic segregation affects the cubic texture evolution. Several studies report that segregations of the surface-active Sn and Sb selectively change the surface energy of some grains during recrystallization annealing. Sn and Sb possess the required energy to promote the selective growth of recrystallized grains, thus improving the texture [42,48,49,50].
In addition to this, some recent studies show that if the phase transformation from γ-austenite to α-ferrite is properly controlled in silicon steels, the required cubic texture formation is enhanced [5,6].
Therefore, the finding that As can actively change the segregation behavior of surface-active elements in the region of the (α-ferrite + γ-austenite) stability can be of great importance for the texture control of silicon steels and surface engineering.

4. Conclusions

The segregation kinetics of surface-active, residual elements was investigated in an in situ study of annealing scrap-based, silicon electrical steel sheet.
Arsenic (As) surface segregation was monitored in more detail. Based on a kinetic study it was shown that As segregates to the silicon steel’s surface upon annealing at T > 600 °C.
The most important results of the study are related to the different kinds of interactions between the segregated residual elements.
Attractive interactions produced co-segregation, as was the case between the residual elements Sn and Sb. Strong repulsive interactions between the residual elements Sn and As resulted in an intensive site competition between the two at the highest experimental temperature, i.e., 950 °C.
As inhibits the segregation of the surface-active elements Sn and Sb in silicon steel fabricated from ferrous scrap at the temperatures of recrystallization processes for silicon steels.
The intensity of As surface segregation in the temperature range 800–950 °C is proportional to the calculated amount of γ-austenite in the two-phase (α + γ) matrix.

Funding

This study was performed at the public research institute Institute of Metals and Technology (IMT), Ljubljana, Slovenia, in the frame of research program No. P2-0132. The Slovenian Research Agency is acknowledged for its financial support of the research core funding of P2-0132.

Acknowledgments

The author is very grateful to the research staff of the Laboratory of Surface Engineering and Applied Surface Science, especially to Miroslav Pečar for his direct technical assistance.

Conflicts of Interest

The author declares no conflict of interest.

References

  1. Moses, A.J. Energy efficient electrical steels: Magnetic performance prediction and optimization. Scr. Mater. 2012, 67, 560–565. [Google Scholar] [CrossRef]
  2. Petryshynets, I.; Kováč, F.; Petrov, B.; Falat, L.; Puchý, V. Improving the Magnetic Properties of Non-Oriented Electrical Steels by Secondary Recrystallization Using Dynamic Heating Conditions. Materials 2019, 12, 1914. [Google Scholar] [CrossRef] [PubMed] [Green Version]
  3. Duarte, L.M.; Santos, J.D.D.A.; Freitas, F.N.C.; Filho, P.P.R.; De Abreu, H.F.G. A novel approach based on pattern recognition techniques to evaluate magnetic properties of a non-grain oriented electrical steel in the secondary recrystallization process. Measurement 2021, 167, 108135. [Google Scholar] [CrossRef]
  4. El-Refaie, A.; Osama, M. High specific power electrical machines: A system perspective. China Electrotech. Soc. Trans. Electr. Mach. Syst. 2019, 3, 88–93. [Google Scholar] [CrossRef]
  5. Ahn, Y.-K.; Jeong, Y.-K.; Kim, T.-Y.; Cho, J.-U.; Hwang, N.-M. Texture evolution of non-oriented electrical steel analyzed by EBSD and in-situ XRD during the phase transformation from γ to α. Mater. Today Commun. 2020, 25, 101307. [Google Scholar] [CrossRef]
  6. Kwon, S.B.; Ahn, Y.K.; Jeong, Y.K.; Kim, T.Y.; Park, J.T.; Han, H.N.; Hwang, N.M. Evolution of cube-on-face texture in Fe-1%Si steel induced by physical contact during the phase transformation from γ to α. Mater. Charact. 2020, 165, 110380. [Google Scholar] [CrossRef]
  7. Steel Statistical Yearbook 2018. The World Steel Association: Brussels, Belgium, 2019. Available online: https://www.worldsteel.org/en/dam/jcr:e5a8eda5-4b46-4892-856b-00908b5ab492/SSY_2018.pdf (accessed on 30 October 2020).
  8. Miranda, A.M.; Assis, P.S.; Brooks, G.A.; Rhamdhani, M.A.; Fontana, A.; King, A.; Sanders, G.; Moreira, G.P.D.C. Monitoring of less-common residual elements in scrap feeds for EAF steelmaking. Ironmak. Steelmak. 2019, 46, 598–608. [Google Scholar] [CrossRef]
  9. Xin, W.; Song, B.; Yang, Z.; Yang, Y.; Li, L. Effect of Arsenic and Copper+Arsenic on High Temperature Oxidation and Hot Shortness Behavior of C–Mn Steel. ISIJ Int. 2016, 56, 1232–1240. [Google Scholar] [CrossRef] [Green Version]
  10. Sipola, T.; Alatarvas, T.; Fabritius, T.; Perämäki, P. Determination of Alloying and Impurity Elements from Matrix and Inclusions from a Process Sample of a Double Stabilized Stainless Steel. ISIJ Int. 2016, 56, 1445–1451. [Google Scholar] [CrossRef] [Green Version]
  11. Xin, W.-B.; Song, B.; Huang, C.-G.; Song, M.-M.; Song, G.-Y. Effect of arsenic content and quenching temperature on solidification microstructure and arsenic distribution in iron-arsenic alloys. Int. J. Miner. Met. Mater. 2015, 22, 704–713. [Google Scholar] [CrossRef]
  12. Yin, L.; Sridhar, S. Effects of Residual Elements Arsenic, Antimony, and Tin on Surface Hot Shortness. Met. Mater. Trans. A 2011, 42, 1031–1043. [Google Scholar] [CrossRef]
  13. Song, C.; Yu, H.; Zhou, H.; Wang, T. Competitive mechanism between cementite and grain boundaries of arsenic segregation. Mater. Lett. 2015, 138, 151–153. [Google Scholar] [CrossRef]
  14. Xin, W.; Zhang, J.; Jiang, Y.; Deng, Y.; Meng, Q.; Song, B. Effect of rare earth Ce on the isothermal oxidation behavior in air of arsenic bearing steels. Met. Res. Technol. 2019, 116, 415. [Google Scholar] [CrossRef]
  15. Wang, H.; Jiang, S.; Yu, P.; Bai, B.; Sun, L.-F.; Wang, Y. Distribution of Arsenic Inclusions in Rare Earth Steel Ingots. Metals 2020, 10, 146. [Google Scholar] [CrossRef] [Green Version]
  16. Wang, H.; Yu, P.; Jiang, S.; Bai, B.; Sun, L.-F.; Wang, Y. Evolution of Inclusions in Steelmaking Process of Rare Earth Steels Containing Arsenic with Alumina Crucibles. Metals 2020, 10, 275. [Google Scholar] [CrossRef] [Green Version]
  17. Wang, H.; Jiang, S.; Yu, P.; Sun, L.; Wang, Y. Effect of Steel-refractory Reactions on Removal of Arsenic from Molten Steel with Lanthanum Additions. ISIJ Int. 2020, 60, 2316–2324. [Google Scholar] [CrossRef]
  18. Zhu, Y.; Li, B.; Liu, P. Effect of Annealing and Hot Rolling on Grain Boundary Segregation of Arsenic in an Mn-Steel Microalloyed by Ti, Cr and Nb. J. Iron Steel Res. Int. 2013, 20, 67–72. [Google Scholar] [CrossRef]
  19. Zhu, Y.-Z.; Zhu, Z.; Xu, J.-P. Grain boundary segregation of minor arsenic and nitrogen at elevated temperatures in a microalloyed steel. Int. J. Miner. Met. Mater. 2012, 19, 399–403. [Google Scholar] [CrossRef]
  20. Zhu, Y.; Li, J.; Xu, J. Macroscopic Distribution of Residual Elements As, S, and P in Steel Strips Produced by Compact Strip Production (CSP) Process. Met. Mater. Trans. A 2012, 43, 2509–2513. [Google Scholar] [CrossRef]
  21. Zhu, Y.; Li, J.; Liang, D.; Liu, P. Distribution of arsenic on micro-interfaces in a kind of Cr, Nb and Ti microalloyed low carbon steel produced by a compact strip production process. Mater. Chem. Phys. 2011, 130, 524–530. [Google Scholar] [CrossRef]
  22. Costa, D.; Carraretto, A.; Godowski, P.J.; Marcus, P. Evidence of arsenic segregation in iron. J. Mater. Sci. Lett. 1993, 12, 135–137. [Google Scholar] [CrossRef]
  23. Godowski, P.J.; Costa, D.; Marcus, P. Surface segregation of arsenic in iron. J. Mater. Sci. 1995, 30, 5166–5172. [Google Scholar] [CrossRef]
  24. Busch, B.W.; Gustafsson, T.; Viefhaus, H.; Uebing, C. Medium-energy ion scattering study of arsenic and sulphur segregation to the Fe-9%W(100) surface. Surf. Sci. 2000, 463, 145–155. [Google Scholar] [CrossRef]
  25. Steiner Petrovič, D.; Jenko, M.; Jeram, M.; Marinšek, F.; Prešern, V. The surface segregation of impurity elements in non-oriented electrical steels. Strojarstvo 2006, 48, 45–49. [Google Scholar]
  26. ThermoCalc Software. Available online: https://thermocalc.com/ (accessed on 1 October 2020).
  27. CasaXPS Processing Software. Available online: http://www.casaxps.com/ (accessed on 1 October 2020).
  28. Microlab 310-F, Operators Manual; VG Scientific Ltd.: East Grinstead, UK, 2004; pp. 1–191.
  29. Klančnik, G.; Medved, J.; Nagode, A.; Novak, G.; Steiner Petrovič, D. Influence of Mn on the solidification of Fe-Si-Al Alloy for Non-Oriented Electrical Steel. J. Therm. Anal. Calorim. 2014, 116, 295–302. [Google Scholar] [CrossRef]
  30. Uebing, C. Surface Segregation of Nonmetallic Solutes on Metals and Alloys. Heterog. Chem. Rev. 1996, 3, 351–388. [Google Scholar] [CrossRef]
  31. Grabke, H.J.; Tauber, G.; Viefhaus, H. Equilibrium surface segregation of carbon on iron (100) faces. Scripta Metall. Mater. 1975, 9, 1181–1184. [Google Scholar] [CrossRef]
  32. Grabke, H.J. Segregation at Interfaces. In Chemistry and Physics of Fracture; Latanision, R.M., Jones, R.H., Eds.; Springer: Dordrecht, The Netherlands, 1987; Volume 130, pp. 388–415. [Google Scholar]
  33. Grabke, H. Adsorption, segregation and reactions of non-metal atoms on iron surfaces. Mater. Sci. Eng. 1980, 42, 91–99. [Google Scholar] [CrossRef]
  34. Reichl, B.; Eisl, M.; Weiß, T.; Störi, H. Investigation of the diffusion properties of impurities in polycrystalline α-iron by means of AES. Surf. Sci. 1995, 331, 243–248. [Google Scholar] [CrossRef]
  35. Swart, H.C.; Roos, W.D.; Terblans, J.J. Surface segregating kinetics in a ternary system. Surf. Interface Anal. 2004, 36, 285–289. [Google Scholar] [CrossRef]
  36. Massalski, T.B. Binary Alloy Phase Diagrams, 2nd ed.; ASM: Materials Park, OH, USA, 1990; pp. 1766–1775. [Google Scholar]
  37. Bakker, H.; Bonzel, H.P.; Bruff, C.M.; Dayananda, M.A.; Gust, W.; Horvath, J.; Kaur, I.; Kidson, G.V.; Le Claire, A.D.; Mehrer, H.; et al. Landolt-Börnstein: Numerical Data and Functional Relationships in Science and Technology. Group III: Crystal and Solid State Physics; Mehrer, H., Ed.; Springer: Heidelberg, Germany, 1990; Volume 26, pp. 129–130. [Google Scholar]
  38. Pavlinov, L.V. Impurity Diffusion in Iron and Steels: Antimony Diffusion; Report No. FEI-1411; State Committee on the Utilization of Atomic Energy: Moscow, Russia, 1983; pp. 1–8. [Google Scholar]
  39. Celmer, R.; Yamamoto, M.; Toguri, J.M. Vapour pressure of Arsenic. Can. Metall. Q. 1984, 23, 169–172. [Google Scholar] [CrossRef]
  40. CRC Press. Handbook of Chemistry and Physics, 84th ed.; Lide, D.R., Ed.; CRC Press: Boca Raton, FL, USA, 2003; p. 2616. [Google Scholar]
  41. NIST Chemistry WebBook, SRD 69. Available online: https://webbook.nist.gov/cgi/inchi?ID=C7440360&Mask=4 (accessed on 13 December 2020).
  42. Godec, M.; Jenko, M.; Mast, R.; Grabke, H.J. Texture measurements on electrical steels alloyed with tin. Vaccum 2001, 61, 151–155. [Google Scholar] [CrossRef]
  43. Steiner Petrovič, D. Non-oriented electrical steel sheets. Mater. Tehnol. 2010, 44, 317–325. [Google Scholar]
  44. Park, J.T.; Kim, J.K.; Szpunar, J.A. Recrystallisation, Grain Growth and Texture Evolution in Nonoriented Electrical Steels. Mater. Sci. Forum 2007, 2007, 657–664. [Google Scholar] [CrossRef]
  45. Sidor, J.J.; Verbeken, K.; Gomes, E.; Schneider, J.; Calvillo, P.R.; Kestens, L. Through process texture evolution and magnetic properties of high Si non-oriented electrical steels. Mater. Charact. 2012, 71, 49–57. [Google Scholar] [CrossRef]
  46. Huňady, J.; Černik, M.; Hilinski, E.; Predmerský, M.; Magurová, A. Influence of chemistry and hot rolling conditions on high permeability non-grain oriented silicon steel. J. Magn. Magn. Mater. 2006, 304, e620–e623. [Google Scholar] [CrossRef]
  47. Fischer, O.; Schneider, J. Influence of deformation process on the improvement of non-oriented electrical steel. J. Magn. Magn. Mater. 2003, 254, 302–306. [Google Scholar] [CrossRef]
  48. Chang, S.K. Magnetic Anisotropies and Textures in High-alloyed Non-oriented Electrical Steels. ISIJ Int. 2007, 47, 466–471. [Google Scholar] [CrossRef] [Green Version]
  49. Rodrigues, M.F.; Da Cunha, M.A.; Paolinelli, S.D.C.; Cota, A.B. Texture and magnetic propetries improvement of a 3% Si non-oriented electrical steel by Sb addition. J. Magn. Magn. Mater. 2013, 331, 24–27. [Google Scholar] [CrossRef] [Green Version]
  50. Sahoo, G.; Singh, C.D.; Deepa, M.; Dhua, S.K.; Saxena, A. Recrystallization behavior and texture of non-oriented electrical steels. Mater. Sci. Eng. A 2018, 734, 229–243. [Google Scholar] [CrossRef]
Figure 1. Trade flow of ferrous scrap in the global economy, data from [7].
Metals 11 00001 g001
Figure 2. Equilibrium phases of the alloy as a function of temperature.
Metals 11 00001 g002
Figure 3. Segregation behavior of elements at 650 °C and 750 °C: (a,b,d) the surface segregation of As is detected; (c) site competition between Si and P at 650 °C.
Metals 11 00001 g003
Figure 4. Segregation behavior of elements at temperatures of 800 °C and 900 °C: (a,b) AES survey spectra; (c) the segregation intensity of Sn and Sb during the annealing at 800 °C; (d) the segregation intensity of Sn and Sb during the annealing at 900 °C.
Metals 11 00001 g004
Figure 5. Site competition of Sn and As at 950 °C: (a) AES survey spectra during the isothermal annealing; (b) Sn AES peaks; (c) evolution of the As AES peaks.
Metals 11 00001 g005
Figure 6. Segregation of the most surface-active elements Sn, Sb, and As in the temperature range 800–950 °C: (ac) Sn prevails over Sb and As; (d) intensive site competition between Sn and As at 950 °C.
Metals 11 00001 g006
Table 1. Chemical composition of the scrap-based silicon steel (wt %).
FeCSiAlMnPSNOCuSbCrNiSnAs
Bal.0.0231.680.240.240.0100.0020.003<0.010.330.0050.130.150.0190.010
Table 2. Relative sensitivity factors (ki) for the segregands and the spectrometer [28].
SegregandAlAsCCuFeNOPSSbSiSn
Ek139612292709186543895101231534581621432
ki0.2630.3340.2240.6750.3630.0660.4130.650.710.8310.1930.502
Ek kinetic energy of Auger electrons (eV).
Table 3. Mole-fraction of equilibrium phases at selected temperature.
TemperatureEquilibrium Phases/mol
T/°Cα-Ferriteγ-Austenite
10000.6240.375
9500.8290.170
9000.9230.076
8500.9640.035
8000.9830.016
760.60.9900.009
Table 4. Solubility (data from [26,36]) and diffusion coefficients of solutes in polycrystalline iron (data from [37,38]).
Segregand/TemperatureSolubilityDiffusion Coefficient D0/10−4·m2·s−1
/wt. %
-α-Feγ-Feα-f-Feα-p-Feγ-Fe
As12.42.04.3 *n.a.0.58
T/°C8451130950–1380-1050–1300
Sn17.71.75.42.49 × 10−4–0.845
T/°C9101130700–760800–9101027–1380
Sb10.32.37804402.25 × 10−11–7.43 × 10⁻⁹
T/°C9961150500–600767–900950–1350
α-f-Fe—ferromagnetic bcc iron; α-p-Fe—paramagnetic bcc iron; * α-stabilized, n.a.—not available.
Table 5. Equilibrium vapor pressure of the selected elements (data from [39,40,41]).
SegregandEquation for the Vapor Pressure UnitTrange/K
Aslog p = 13.674 − 7710/TPa675–730
Snlog p = 5.006 + 6.036 − 15710/TPa298–m.p.
Sblog p = 2.26041 − (4475.449/ (T − 152.352))bar1058–1373
m.p.—melting point.
Publisher’s Note: MDPI stays neutral with regard to jurisdictional claims in published maps and institutional affiliations.

