Article

Effect of the Microsegregation on Martensitic and Bainitic Reactions in a High Carbon-High Silicon Cast Steel

by
Alejandro Daniel Basso
1,*,
Isaac Toda-Caraballo
2,
Adriana Eres-Castellanos
2,
David San-Martin
2,
José Antonio Jimenez
2 and
Francisca G. Caballero
2,*
1
Department of Metallurgy, INTEMA-CONICET, University of Mar del Plata, Av. Juan B Justo 4302, 7600 Mar del Plata, Argentina
2
MATERALIA ResearchGroup, Department of PhysicalMetallurgy, Centro Nacional de investigacionesMetalúrgicas (CENIM-CSIC), Av. Gregorio del Amo 8, 28040 Madrid, Spain
*
Authors to whom correspondence should be addressed.
Metals 2020, 10(5), 574; https://doi.org/10.3390/met10050574
Submission received: 8 April 2020 / Revised: 24 April 2020 / Accepted: 24 April 2020 / Published: 28 April 2020
(This article belongs to the Special Issue Segregation Phenomena in Alloys Systems)

Abstract

:
Casting processes show some weaknesses. A particular problem is presented when the workpiece needs to be subjected to heat treatments to achieve a desired microstructure. This problem arises from the microsegregation phenomena typically present in cast parts. The effect of the microsegregation on the martensitic and bainitic transformations has been investigated in a high carbon-high silicon cast steel, with the approximate composition Fe-0.8C-2Si-1Mn-1Cr (in wt. %), which was poured into 25 mm keel block-shaped sand molds. The microsegregation maps of Cr, Si, and Mn characterized by electron probe microanalysis (EPMA) show that interdendritic regions are enriched while dendrites are impoverished in these elements, implying that their partition coefficients are lower that the unity (k < 1). As-quenched martensitic and austempered bainitic microstructures (at 230 °C) were obtained and analyzed after applying an austenitization heat treatment at 920 °C (holding for 60 min). The thermal etching method used to reveal the prior austenite grain size showed a bimodal grain size distribution, with larger grains in the dendritic regions (≈22.4 µm) than in the interdendritic ones (≈6.4 µm). This is likely due to both the microsegregation and the presence of small undissolved cementite precipitates. Electron Backscatter Diffraction (EBSD) analysis carried out on the martensitic microstructure do not unveil any differences in misorientation distribution frequency and block size between the dendritic and interdendritic zones related to the microsegregation and bimodality of the austenite grain size. On the contrary, the bainitic transformation starts earlier (incubation time of 80 min), proceeds faster and bainitic ferrite plates are longer in the dendritic zones, were prior austenite grains are larger and impoverish in solute. The presence of these microsegregation pattern leads to the non-uniform development of the bainitic reaction in cast parts, modifying its kinetics and the resulting microstructures, which would probably have a major impact on the mechanical properties.

1. Introduction

Casting is a manufacturing process widely used to produce many steel parts in a wide range of applications. It is most often used for making complex or intricate shapes that would be otherwise difficult or uneconomical to make by other methods [1]. Cast products are found in a wide range of applications, including automotive components, aerospace parts, electronics, mechanical devices, and construction supplies. This process enjoys certain advantages in respect to other shaping processes such as forging, welding, stamping, rolling, extruding, etc. The reason for the success of the casting process is its flexibility to the requirements of mass production. Large numbers of a given casting can be produced quickly. For example, in the automotive industry there is massive production of cast engine blocks and transmission cases [2]. On the other hand, some metals can only be cast since they cannot be re-modeled into bars, rods, plates, or other shapes. In addition, certain high strength alloys can be produced only as castings [3].
However, casting processes show some weaknesses. During solidification, shrinkage porosity, cracks, or hot tearing may occur [1,2,3]. A particular problem is presented in cast parts when the workpiece needs to be subjected to heat treatments to achieve a desired microstructure. This problem arises from the microsegregation phenomena present typically in cast parts. Microsegregation is a fundamental phenomenon taking place during solidification at the scale of dendrites. When an alloy is solidifying, the liquid concentration follows the liquidus line in the phase (equilibrium) diagrams and solid concentration follows the solidus line. In steels, as the solidification process occurs, the melt composition is usually enriched in solute and the solid dendrite tip has a lower concentration, but it increases when the solidification continues. Ideally, under an infinite diffusion scenario, the concentration at the solidus is homogenous and the composition is equal to the nominal composition when all the melt has been solidified. In reality, the diffusion is not infinite and so some compositional gradients normally exist in the microstructure after the solidification [4]. If the microsegregation is prominent, it can lead to hot cracking and the formation of inclusions, etc. [5,6,7,8,9,10,11]. In addition, when castings are subjected to heat treatments in the presence of microsegregation, these chemical gradients could generate microstructures in which the matrix phases formed during cooling are distributed heterogeneously [7,8,9,10,11,12,13,14,15,16,17,18,19,20,21]. For example, this microsegregation often promotes, in wrought steel parts, after rolling, microstructures displaying a banded appearance with the alternating bands consisting of planar arrays of two or more pairs of the main room temperature phases found in steels: ferrite, pearlite, bainite and/or martensite. [7,14,17,18,19]. There have been several studies concerned with the effect of banding on mechanical properties [13,15,17,20,21]. These studies have found that the banding has a significant effect on the anisotropy of tensile and fracture properties. The extent of banding, derived from the aligned residual interdendritic segregation, is very much alloy, section size, and mill processing dependent, and dramatic variations in the effects of banding can develop depending on banding severity and heat treatments conditions. The effects of banding may or may not be detrimental to finished steel products or to their production, and if questions arise, banding and its effects merit appropriate evaluation.
The above-mentioned introduction allow the suggestion that microsegregation can be an important limitation in the development of cast parts of high-carbon high-silicon steels (HC-HSi steel) with martensitic or bainitic microstructures. Microstructures, composed by a mixture of bainitic ferrite and retained austenite and obtained by applying an austempering thermal cycle at low temperature, provide the steel with excellent mechanical properties compared with other steels [22,23,24,25,26,27,28,29,30]. Their chemical composition includes the use of inexpensive alloying elements, such as Si (≈1.5–2.0 wt. %), that inhibits the precipitation of cementite from austenite during bainite reaction, and stabilizes the austenite at room temperature by increasing its carbon content. Several alloying elements such as Mn, Cr, and Ni are also present in the chemical composition of these steels. Typically, these elements are added in certain percentages (≤2 wt. %) to improve hardenability and mechanical properties.
In a previous research, the authors have investigated in detail the macro- and microsegregation patters obtained in a HC-HSi steel, which have been casted using different keel block sizes [31]. The presence of microsegregation, would alter the distribution of elements like Si, Mn, and Cr, influencing the formation of martensite after quenching as well as the nucleation and growth of the bainite during austempering treatments. Therefore, castings with heterogeneous microstructures in terms of the amount and morphology of bainitic ferrite/austenite and martensite, if present, would be obtained. These microstructural heterogeneities, which should be avoided, would surely deteriorate the mechanical properties and wear resistance. Thus, keeping the austenitization conditions constant, this research has focused on the influence of microsegregation on as-quenched martensitic and bainitic microstructures austempered up to 6 h, at 230 °C, in this type of HC-HSi steel.

2. Materials and Methods

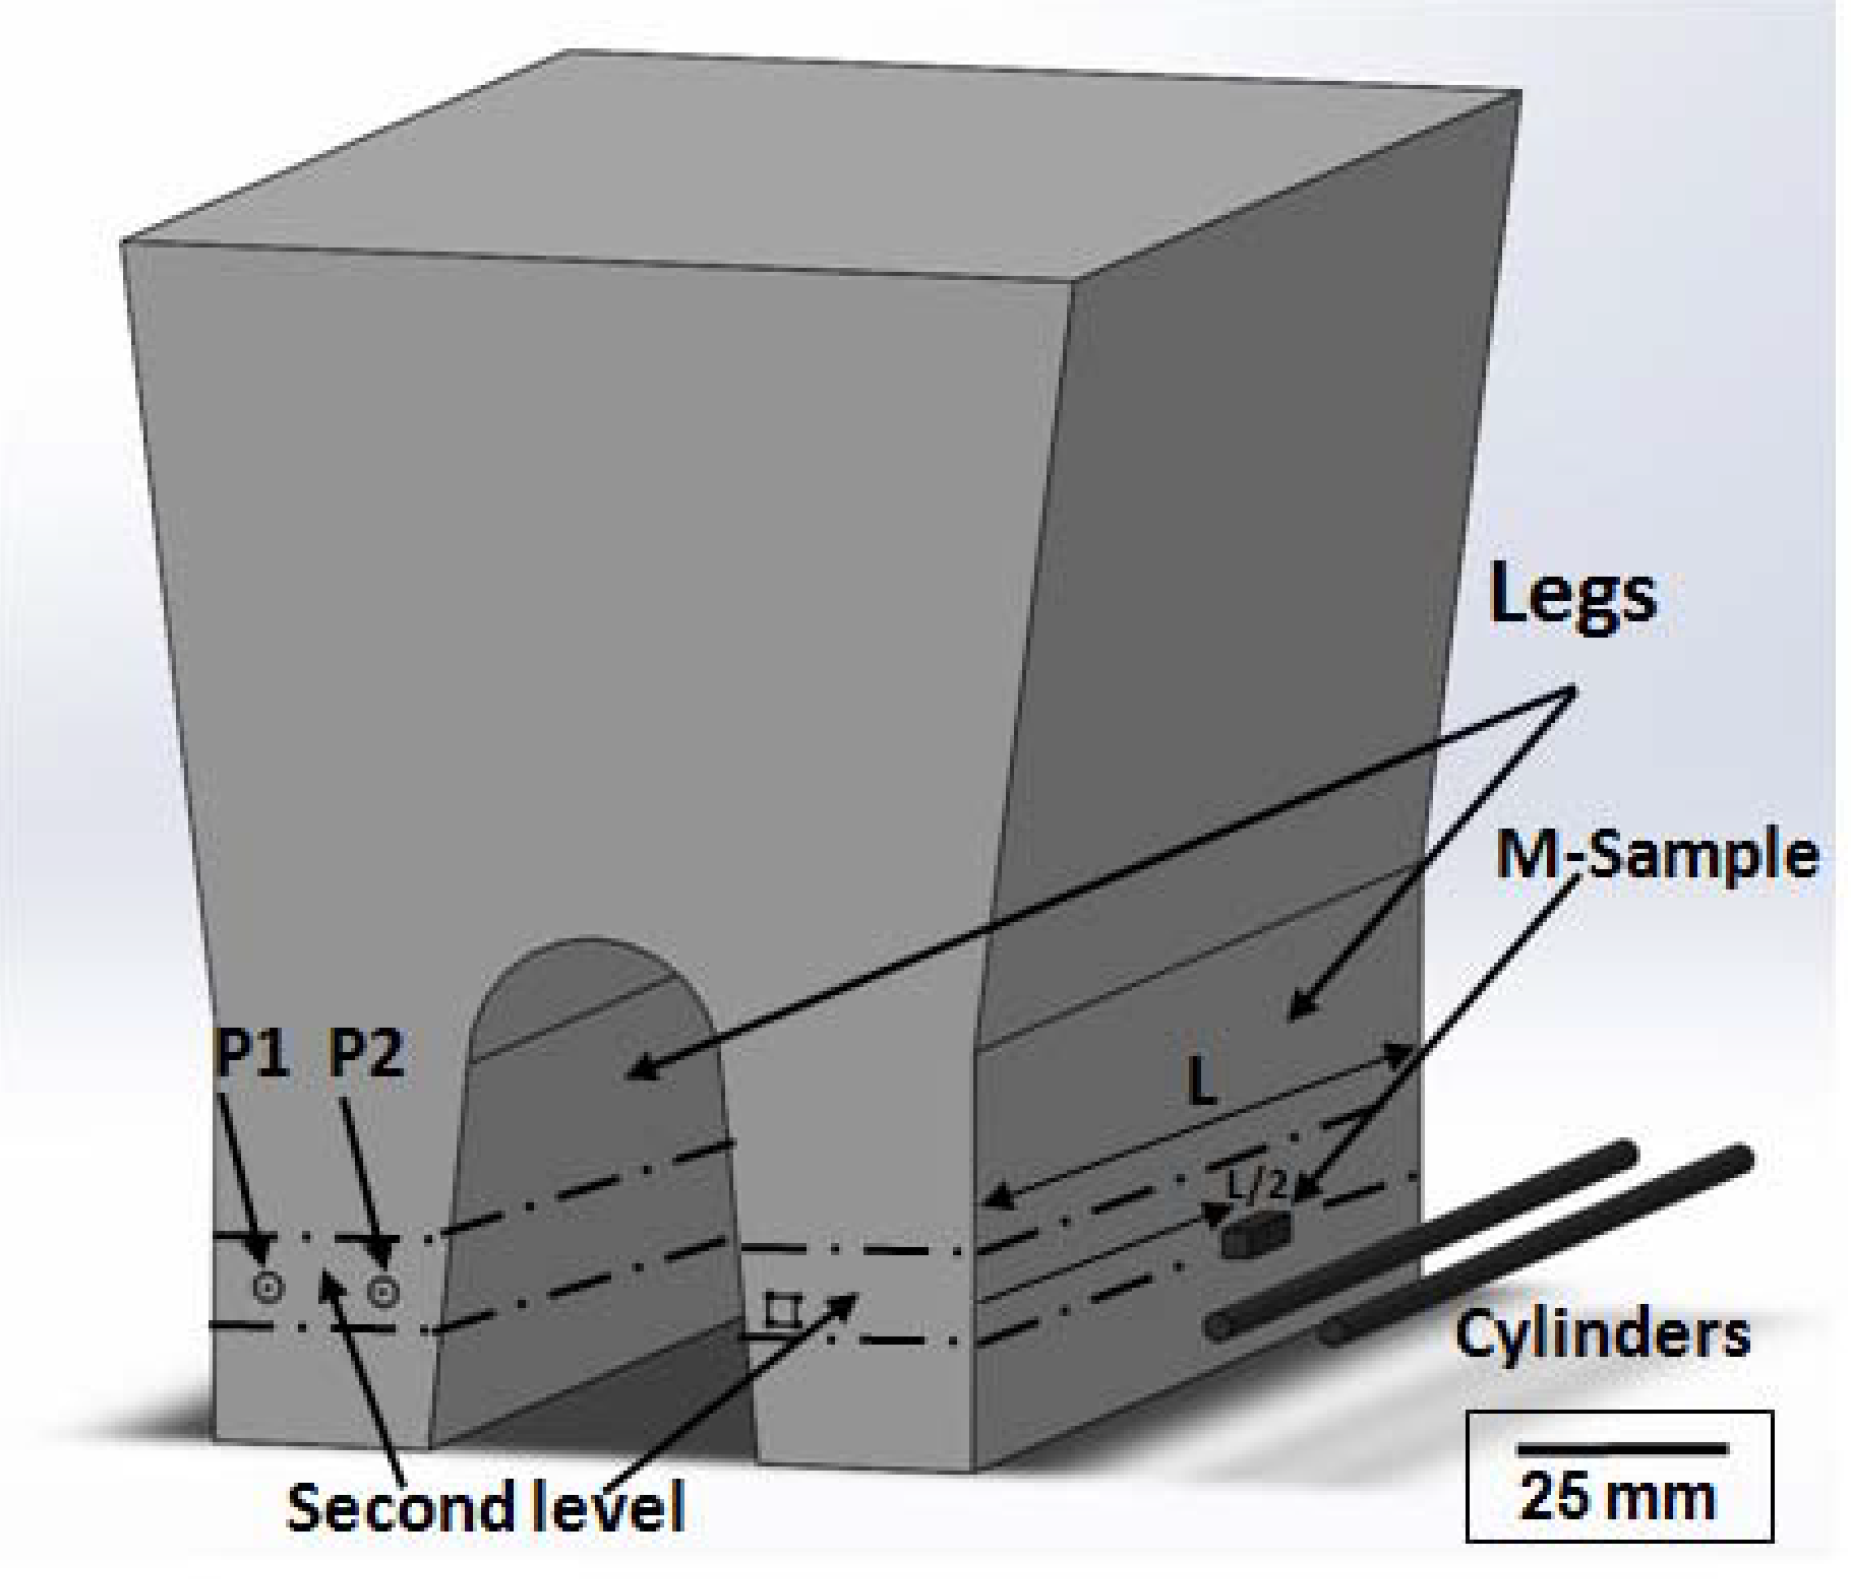
2.1. Material and Casting Procedure

A Fe-0.8C-2Si-1Mn-1Cr (in wt. %) alloy has been selected based on its low transformation temperatures to bainite as reported in the literature [29,30,31,32,33,34,35,36,37,38]. The C content has been fixed near 0.8 wt. % to ensure bainite formation at low temperatures (220–250 °C) [29,30,33,34]. The Si content has been set to ≈2.2 wt. %, to avoid cementite precipitation from the austenite during the bainite reaction. Cr and Mn have been added to control the hardenability [26,27,28,29,30,32,33]. The steel has been manufactured in an industrial foundry using a high frequency induction furnace of 120 kg capacity. The melts were poured into the 25 mm keel block-shaped sand molds. The chemical composition of the manufactured steel was determined by spark emission spectrometry using a Baird DV6 spectrometer (Baird Corporation, Bedford, MA, USA), according to ASTM D350 standard. The complete chemical composition of the steel is shown in Table 1.

2.2. As-Cast Structures: Matrix Phases and Microsegregation Characterization by Electron Probe Micro-Analysis (EPMA)

Samples used in this work were machined from the keel block legs as shown in Figure 1. The as-cast microstructure and the microsegregation patterns have been characterized from a sample (named “M-Sample”) obtained from a region located in the second level of the keel block legs, approximately in the middle length (L/2). This region was selected following the criteria of the middle point of the leg, which is the point with a lower thermal influence exerted by the feeder, and the bottom and extreme of the legs. M-sample has a cubic geometry of about 5 mm per side.
To visualize the phases present in the as-cast microstructure, metallographic samples have been prepared by standard methods that included gridding and polishing, finishing with a 1 μm diamond paste. The microstructures have been revealed after etching with Nital 2%. Several micrographs, at different magnifications, have been taken using light optical (LOM) and field emission gun scanning electron microscopy (FEG-SEM) by means of a Nikon Epiphot 200 (Nikon Instrucments, Inc., Melville, NY, USA) and a Hitachi S 4800 microscope (15.0 Kv) (Hitachi Ltd., Chiyoda, Tokyo, Japan), respectively. To characterize the type of inclusions present in the microstructure of the steel, microanalysis have been carried out in M-sample using energy-dispersive X-ray spectroscopy (EDS) using a voltage of 15 Kv.
Microsegregation patterns of Cr, Si and Mn have been characterized by acquiring 2D maps using electron probe microanalysis (EPMA). This analysis was complemented by using micro X-Ray fluorescence spectrometry (µ-XRF) and color etching metallographic techniques. The methodology employed has been the following. First of all, the M-sample has been re-polished, using a 1 μm diamond paste. Then, the local chemical composition of the M-sample was determined. A semi-quantitative analysis of Si, Cr and Mn has been performed by µ-XRF using a FISCHERSCOPE X-ray extreme ultraviolet (model XUV 773) spectrometer (Helmut Fischer GmbH, Sindelfingen, Germany). Later, in the same region, color etching was applied on the re-polished sample surface, to reveal the solidification dendritic structure (size and distribution), trying to identify the dendritic and interdendritic regions. The color etchant was composed of 10 g NaOH, 40 g KOH, 10 g picric acid and 50 mL of distilled water. The etching process has been carried out at 120 °C for 40 s approximately. This reagent colors the steel surface according to the local Si concentration and is useful to reveal the solidification structure of high silicon cast steels [39]. After color etching, a square area of approximately 1.5 mm × 1.5 mm has been selected and delimited with micro-hardness indentations to be used afterwards as a reference. Subsequently, the surfaces were lightly re-polished using again 1 µm diamond paste to remove the oxide layers deposited after color etching but keeping the indentations intact. Finally, the area delimited by indentations has been analyzed by EPMA. This allowed comparing and linking the dendritic solidification structure obtained by color etching, with the segregation maps obtained by EPMA. Concentration maps of Si, Mn and Cr have been obtained using a JEOL JXA 8900 M (JEOL Ltd., Tokyo, Japan) microprobe with a wavelength dispersive spectrometer (WDS), which provides an error of 3% in the value of the measured composition. Two-dimensional (2D) EPMA intensity maps were recorded using a step size of 2 μm. The intensity recorded is related to the amount of each element at the location analyzed.

2.3. The Bainitic Transformation

To evaluate the influence of the microsegregation on the bainitic transformation, several isothermal heat treatments have been performed using high resolution dilatometry. The kinetics of the bainitic transformation has been characterized at the fixed transformation temperature of 230 °C for different holding times after an austenitization heat treatment at 920 °C for 60 min. An as-quenched sample austenitized under the same conditions has also been characterized. The microstructures obtained have been analyzed by LOM, FEG-SEM, X-ray diffraction, hardness and Electron Backscatter Diffraction (EBSD).

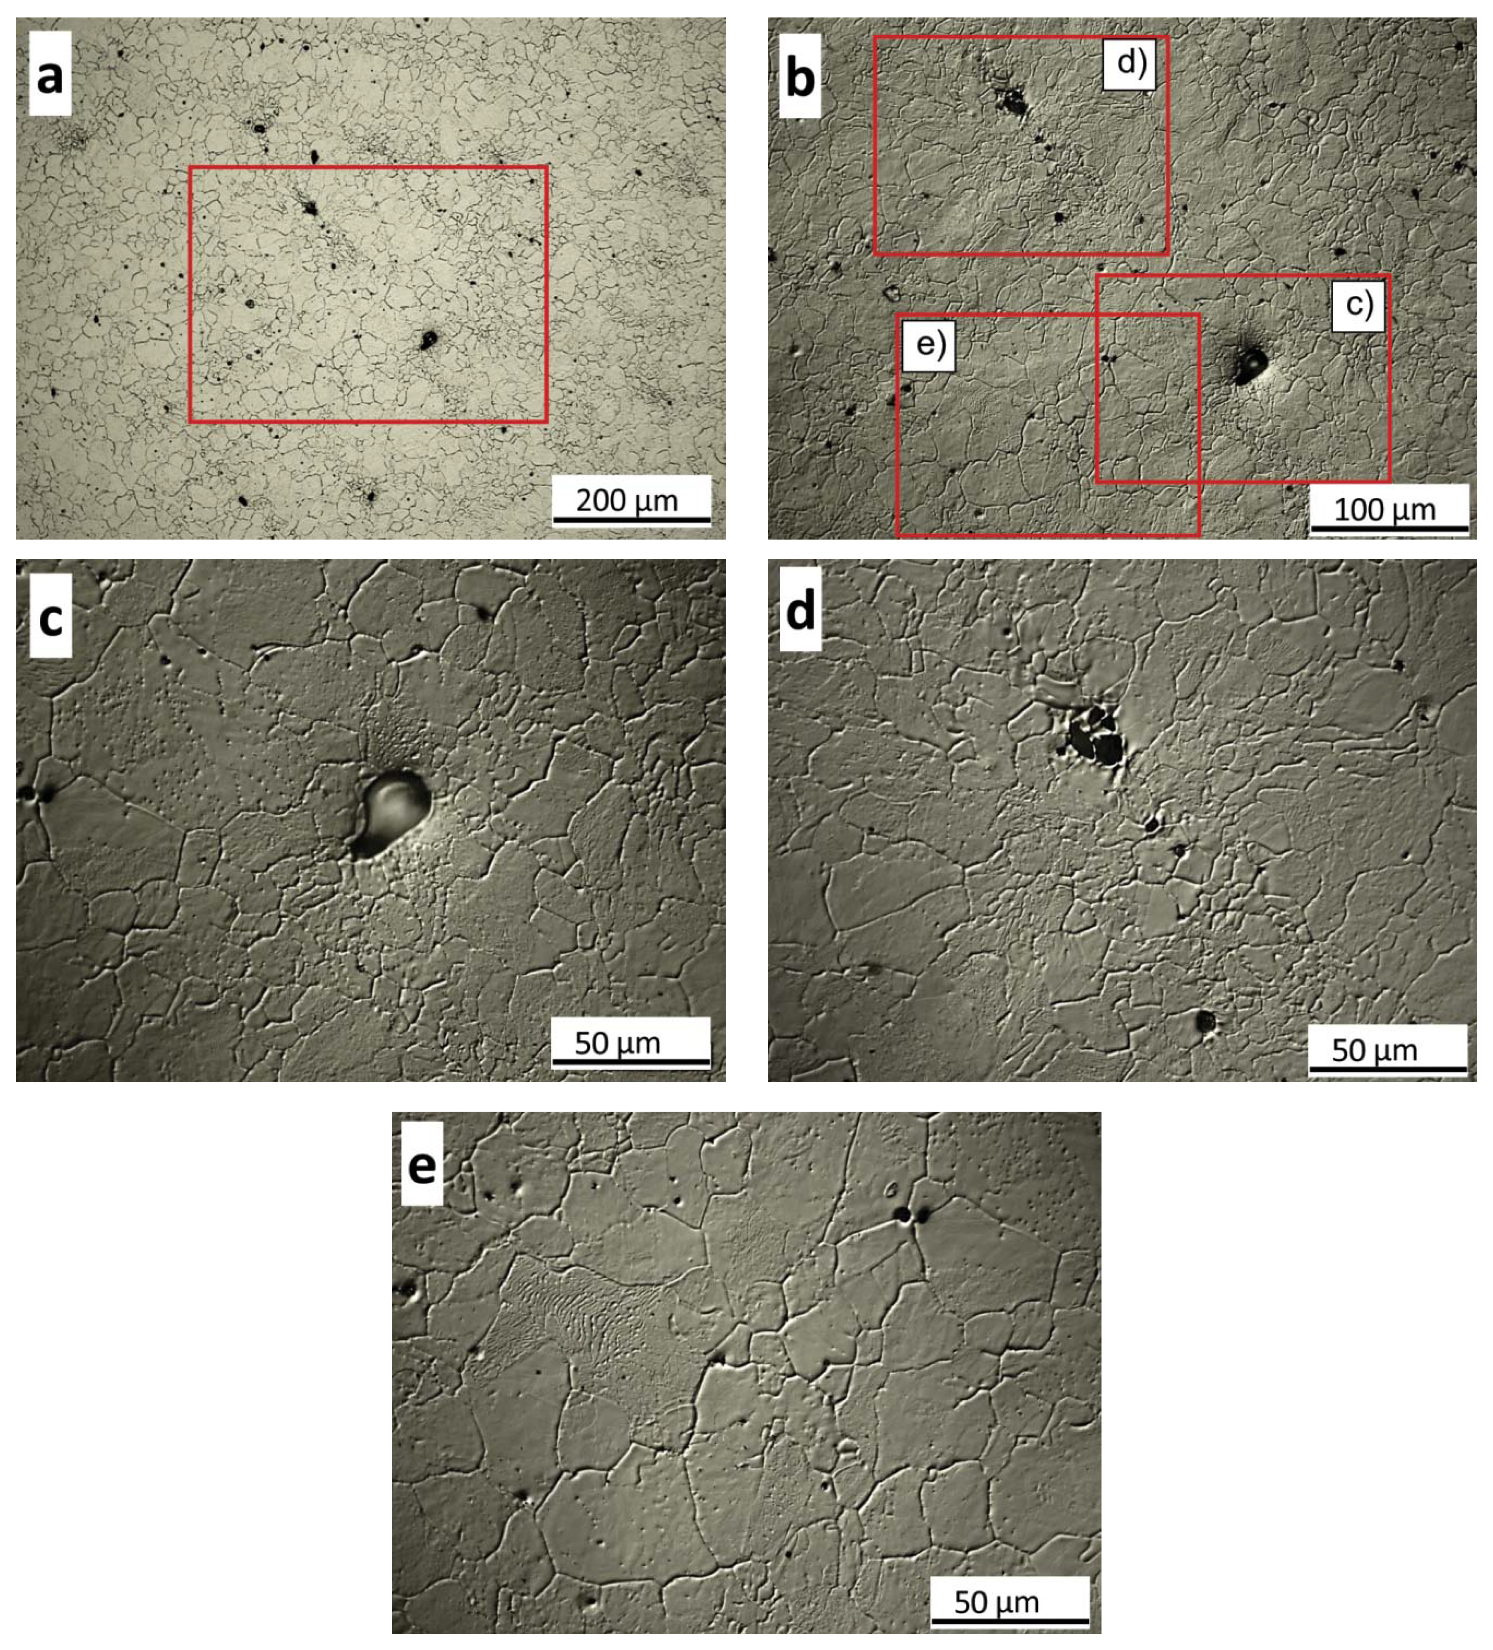
2.3.1. Determination of the Prior Austenite Grain Size by Thermal Etching

The prior austenite grain boundaries have been revealed by the thermal etching technique. Previous reports by some of the authors have demonstrated that this technique is a powerful tool to unveil the prior austenite grain boundaries [40,41,42,43]. In this method, the metallographic preparation of the samples has to be carried out prior to the application of the heat treatments. In this regard, cylindrical dilatometry samples of 4 mm diameter and 10 mm length (similar to those employed to study the bainitic transformation-see Section 2.3.2) obtained from P1 and P2 position of the keel block (Figure 1), were mounted in bakelite. Afterwards, a finely polished surface of 2–3 mm wide was prepared parallel to the main axis of the cylinder following the procedure described before, using standard metallographic techniques, finishing with 1 µm diamond paste. Then, the sample was carefully unmounted avoiding damaging the polished surface.
The samples were heat treated using the DIL Bahr 805A/D quenching dilatometer (TA Instruments, New Castle, DE, USA). The heat treatments were done under high vacuum conditions, ensuring an inert environment throughout the test to prevent the oxidation (darkening) of the polished surface. During heating up of the sample (5 °C/s), up to the austenitization temperature (920 °C, 60 min), grooves form at the intersection of the austenite grain boundaries with the polished surface by surface tension effects and matter transport mechanisms (evaporation–condensation, volume diffusion, and surface diffusion) [43,44,45,46]. After the austenitization has ended, samples were cooled down to room temperature under the high vacuum conditions at an average cooling rate of 15 °C/s. The grooves formed at high temperatures remain visible at room temperature.
The grain size was determined by manually tracing the grain boundaries on different micrographs using an image-editing software to create a skeleton outline. Approximately 90 prior austenite grains were analyzed for this condition using the software Image J (version 1.47s, NIH, Stapleton, NY, USA, 2013). The freeware program allows determining automatically the area and Feret diameter of the grains. With these results, the austenite grain size distribution has been represented.

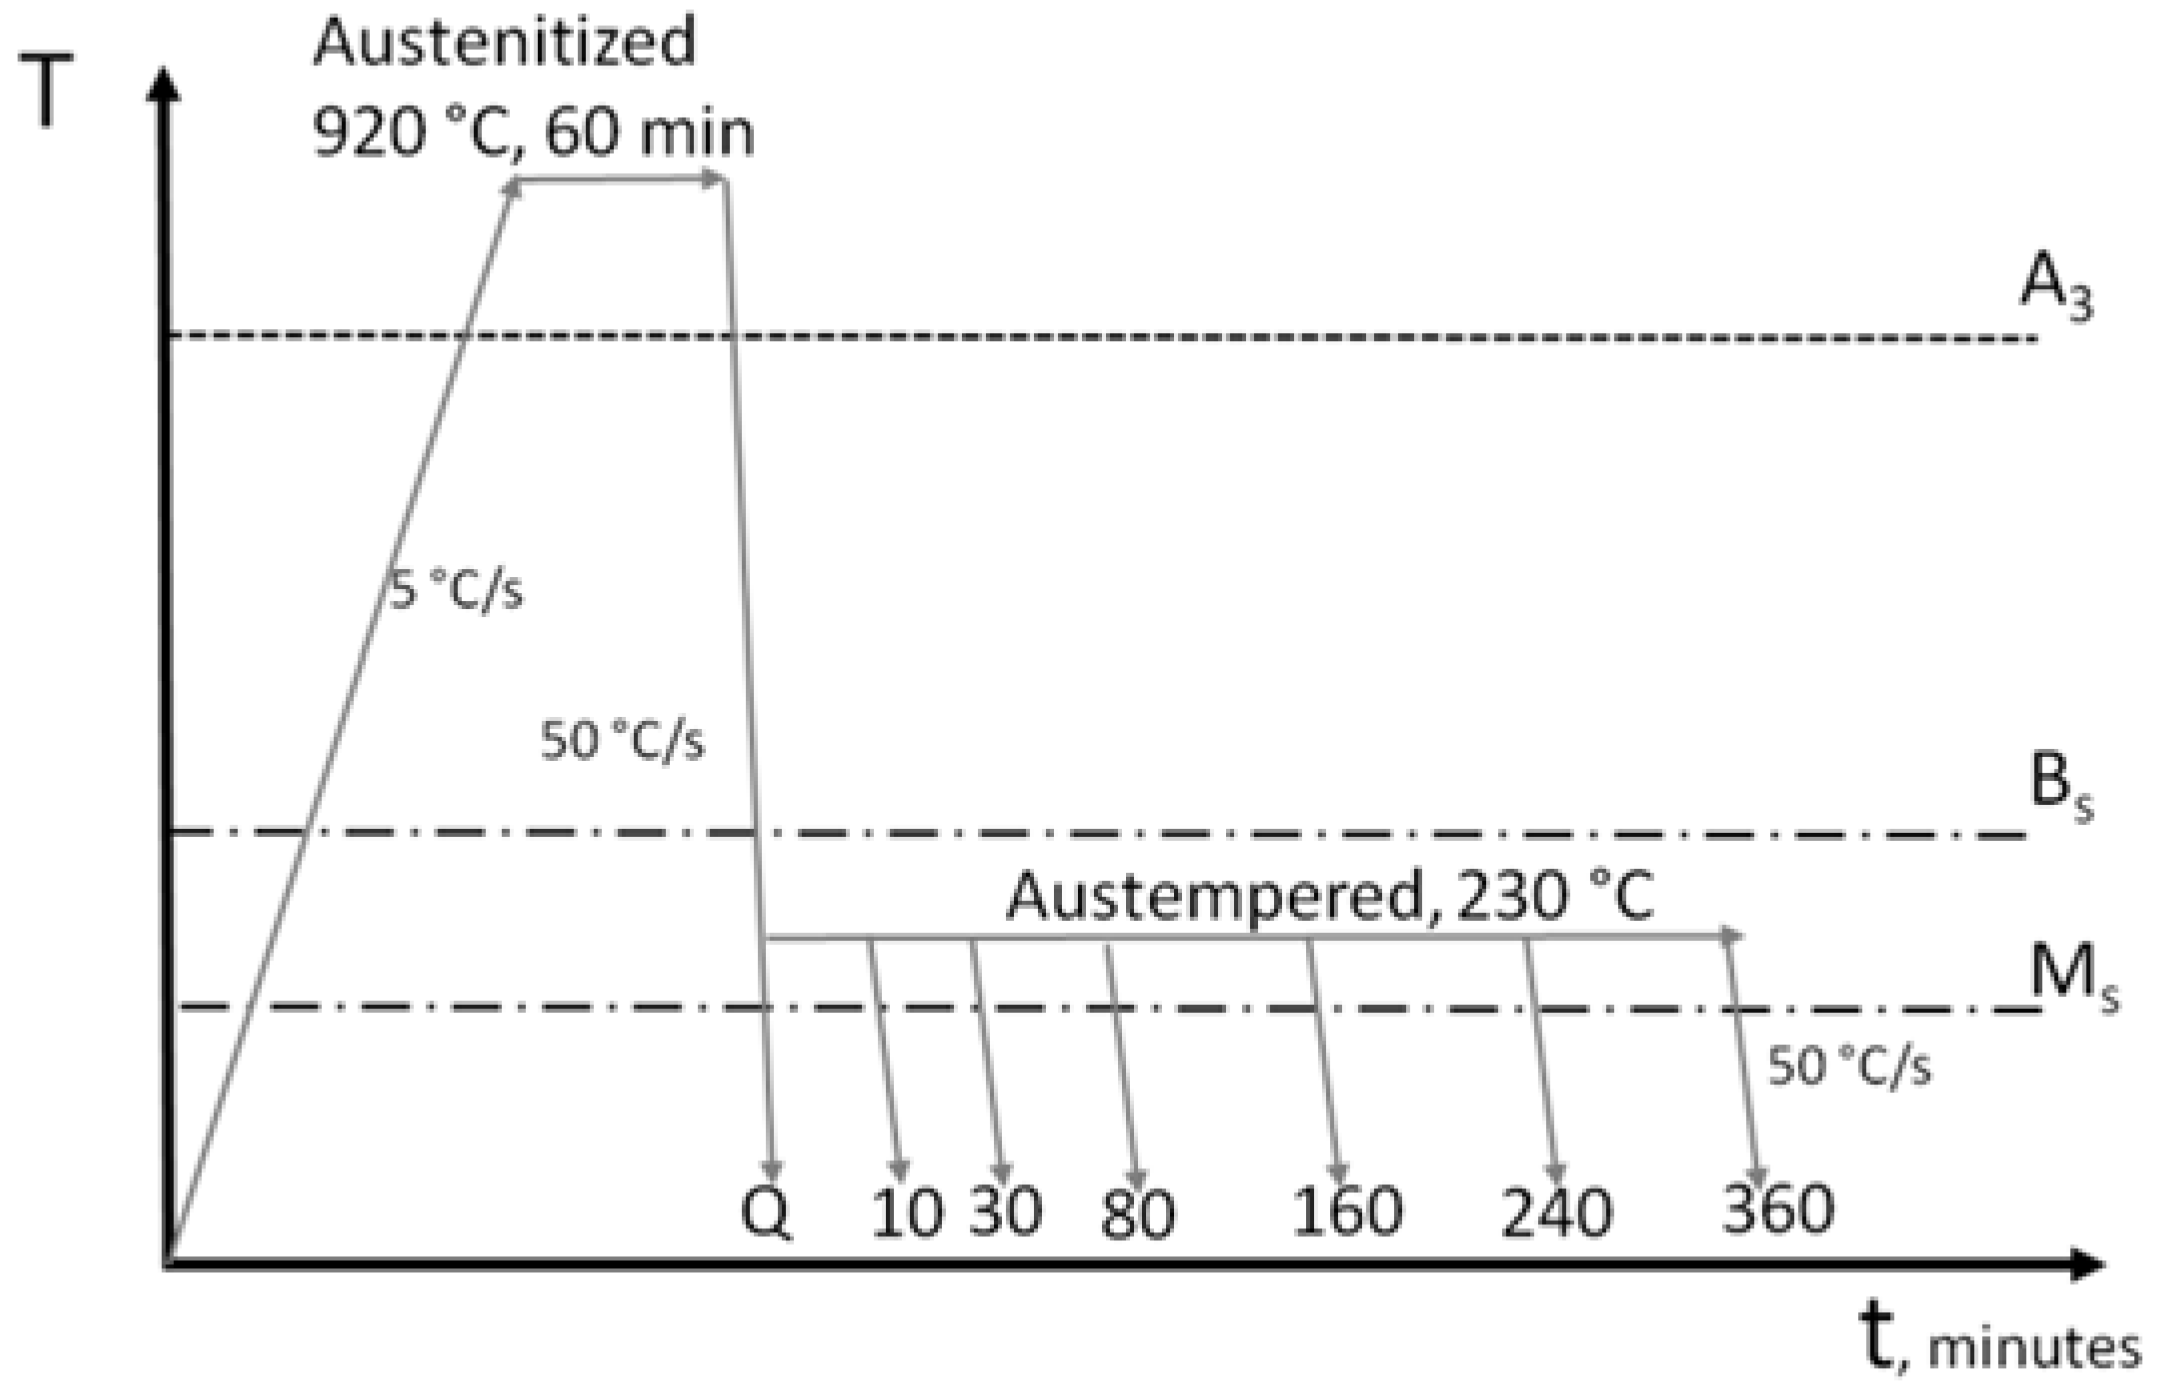
2.3.2. High Resolution Dilatometry: Isothermal Austempering Heat Treatments

Cylindrical specimens of 4 mm diameter and 10 mm length have been used for the dilatometry experiments. These specimens were machined as it is showed in Figure 1, from P1 y P2 positions of the poured keel blocks. The heat treatments have been performed using the DIL Bahr 805A/D quenching dilatometer mentioned above. Heating was carried out using induction and cooling was assisted by controlling a helium gas flow. The thermal cycle consisted of a full austenitization at a temperature of 920 °C for 60 min (heating at a rate of 5 °C/s), followed by quenching (50 °C/s) down to the austempering temperature (230 °C), above the Ms temperature, at which samples were held for different times: 10, 30, 80, 160, 240 y 360 min. The Ms temperature was estimated using dilatometry after quenching at 50 °C/s to room temperature from the austenitization temperature. After the austempering step, the samples were quenched to room temperature. On the other hand, one sample (named Q-sample) was subjected to a conventional quenching heat treatment, after the austenitization (920 °C, 60 min), to obtain a fully martensitic microstructure. Figure 2 provides a scheme of the heat treatments carried out in this work.
The cooling rate was always 50 °C/s, as this was shown to be sufficient to avoid pearlite formation during cooling after the austenitization step. On the other hand, during the isothermal holding corresponding to the austenitizing or austempering steps, the dilatometer chamber was kept under high vacuum (10−4 mbar) conditions.

2.3.3. Microstructural Characterization by Light Optical and Electron Microscopy

The metallographic preparation and microstructural observation of as-quenched and austempered samples has been performed using the same methodology as for as-cast microstructures (please read Section 2.2). However, in this case, the martensitic microstructures have been revealed with Vilella’s regent in addition to Nital 2% prior to their observation using LOM and FEG-SEM.

2.3.4. X-Ray Diffraction

X-ray diffraction (XRD) analyses were used to estimate the amount of retained austenite present in the microstructures of quenched and austempered samples. For these experiments, samples were ground and polished with 1 µm diamond paste, and then subjected to several cycles of etching and polishing to minimize the amount of deformation introduced in the surface by mechanical polishing. Then, the final polishing of the samples was carried out with a colloidal silica solution. XRD measurements were carried out with a Bruker AXS D8 Discover diffractometer (Bruker AXDS GmbH, Karlsruhe, Germany) equipped with a Co X-ray tube, Goebel mirror optics and a LynxEye Linear Position Sensitive detector (Bruker AXS GmbH, Karlsruhe, Germany). XRD data were collected over a 2θ range of 35 to 135° with a step size of 0.015°. For the Rietveld refinement of the diffractograms, the program DIFFRACplus Topas Version 4.2 (Bruker AXS GmbH, Karlsruhe, Germany, 2009) has been used and the crystallographic information of the phase was obtained from Pearson´s Crystal Structure Database for Inorganic Compounds.

2.3.5. Hardness Tests

Hardness measurements were carried out using Vickers indentation under 5 kg load, according to the standard ASTM E10. The values reported for each microstructure correspond to the average of five independent measurements.

2.3.6. Electron Backscatter Diffraction (EBSD) Analysis

In addition to the characterization of the bainitic microstructures, the influence of the microsegregation on the martensitic microstructure of the as-quenched sample (Q-sample) has been analyzed by EBSD. After etching with Nital 2%, two square regions of 40 × 40 µm2 corresponding to dendritic and interdendritic areas (with low and high percentages of alloying elements Cr, Mn, and Si), were selected. These regions were delimited with hardness indentations. Later, the surfaces were lightly re-polished to remove the etched superficial layers with a 1 µm diamond cloth, but preserving the indentations. Finally, the sample was carefully polished with 50 nm colloidal silica suspension in the final stage of metallographic preparation.
EBSD analyses were performed using a FEG-SEM JEOL JSM 6500F (JEOL Ltd., Tokyo, Japan) coupled to a Channel 5 detector (HKL Technology-JEOL Ltd., Tokyo, Japan), operating at 15 kV. The indexation of the Kikuchi lines and the determination of the orientations were done with software also developed by HKL Technology. The maps were acquired using a step size of 0.15 μm.

3. Results and Discussion

3.1. As-Cast Microstructure

3.1.1. Matrix Phases

Figure 3 shows representative LOM micrographs (Figure 3a,b) and secondary electron microscopy images (Figure 3c,d) of the as-cast microstructures (M-Sample) after etching with Nital 2%. The microstructure is composed of a fully pearlitic structure. The presence of some non-metallic inclusions has been labeled and highlighted by arrows in Figure 3d. Microanalysis carried out using energy-dispersive X-ray spectroscopy (EDS) in the M-sample indicate that these are of the type: SiO2, CaO, and MnS.

3.1.2. Microsegregation Analysis

Figure 4 shows a color LOM Figure 4a and EPMA solute concentration maps (b-c-d) for Si, Mn, and Cr. In Figure 4a color etching is able to display already the dendritic solidification structure. For this type of steels, having an average carbon content of ≈0.8 wt. %, the peritectic transformation does not occur and the solidification process starts with the formation of austenite (γ) with a dendritic morphology. In Figure 4a, dendrites of the prior austenite can be clearly observed. Dendrite arms, corresponding to first to freeze zones (or FTF zones), appear as yellow areas, while interdendritic or last to freeze (LTF) zones are the areas with a mix of red, green and blue colors. Figure 4b–d show EPMA maps for Si, Mn, and Cr, respectively. [X] is the average concentration value obtained from EPMA maps for each element “X” (=Si, Mn or Cr).
Comparing the color micrograph with the EPMA maps, it is clear that for all the elements, areas with the highest concentration values (darker color) match with interdendritic ones (or LTF zones), while areas with lowest concentration values match with dendritic ones (or FTF zones-yellow color). This means that Si, Mn, and Cr are rejected to the liquid remaining during the solidification, which determines that the last solidifying liquid is richer in these elements.
As it was mentioned above, microsegregation must be taken into account when the aim is to produce parts with bainitic structures. The chemical heterogeneities (Figure 4) may affect the distribution of phases (bainitic ferrite/retained austenite/cementite/martensite) in the microstructure of bainitic steels through the modification of the amount and its morphology. Cementite precipitation from austenite can be suppressed during bainite reaction for Si concentrations higher than approximately 1.5 wt. %, and the hardenability depends on the content of alloying elements, such as Mn and Cr. Therefore, it is important to determine the maximum and minimum concentration values for the main alloying elements (Si, Mn, Cr) in the dendritic and interdendritic zones. The maximum and minimum concentration values have been determined by analyzing the frequency at which every concentration value appears in the EPMA chemical maps. In this way, frequency histograms were represented for each chemical element. In these histograms, [X] −σ has been considered as the minimum value, where [X] is the average value obtained from the EPMA maps, and σ is the dispersion value obtained after fitting the frequency histogram to a normal distribution. Similarly, [X] + σ has been considered as the maximum value. Table 2 shows these values for each element, and the content determined by X-ray fluorescence (XRF) spectrometry. The experimental error in the reported values is approximately ±3%. It is also noteworthy that the values reported agree reasonably well with the average chemical composition of the steel obtained by spark emission spectrometry (Table 1) and the average value obtained from EPMA maps.
For the elements under study, the Si concentration varies between 1.6 and 2.6 wt. % (which corresponds to a variation of ± 24% in the nominal value). Mn concentration varies from 0.8 to 1.6 wt. % approximately (a variation of ± 33% in the nominal value), and Cr concentration varies from 0.7 to 1.3 wt. % (which corresponds to a variation of ± 30% in the nominal value).

3.2. Austenitization of As-Cast Microstructures. Prior Austenitic Grain Size (PAGS)

To obtain bainitic or martensitic structures, pearlite in the as-cast structure (Figure 3) has to be austenized prior to the austempering heat treatment or the quenching to room temperature. During the austenitization process, pearlite transforms to austenite. It is well-known that the prior austenite grain size (PAGS) has a significant influence on the microstructure-property relationships in steels. The PAGS plays an important role in defining the type, size and distribution of the low-temperature phases formed during cooling/austempering/quenching and the resultant mechanical properties (e.g., strength, ductility, fracture toughness, etc.) of steels in the final product [26,27,28,34,35,36]. Moreover, several investigations carried out on fracture surfaces have unveiled that cracks may propagate along the prior austenite grain boundaries (PAGBs) when brittle fracture takes place [47,48,49,50]. For these reasons, the accurate determination of the PAGS of materials becomes of the greatest importance in metallurgical studies.
Figure 5a–e, show LOM micrographs of the prior austenite grain boundaries revealed by thermal etching after austenizing at 920 °C for 60 min and cooling to room temperature. Figure 5b is a micrograph corresponding to the red square drawn in the optical image shown in Figure 5a, which has been taken using Nomarski microscopy (also known as Differential interference contrast, DIC, microscopy; Nikon Epiphot 200 microscope, Nikon Instrucments, Inc., Melville, NY, USA). In this image, three additional square areas, identified as (c), (d) and (e) have been highlighted. Area (c) and (d) contain non-metallic inclusions and microshrinkages, which are associated to the LTF or interdendritic zones; while image (e) corresponds to an area free of these defects, and it is associated with a dendritic region. It is clear the difference in the PAGS in the microstructure. Images in Figure 5c,d display smaller grains located in the interdendritic zones (richer in solute), while Figure 5e displays a detail of a dendritic zone (poor in solute) showing the presence of bigger grains in these zones. These images have also been captured using Nomarski microscopy to reveal more clearly the micro-topography (grooves) of the microstructure.
Figure 6 shows the prior austenite grain size distribution of the microstructure shown in Figure 5. As it would be expected, the results depict a clear bi-modal distribution due to the different grain sizes observed in the interdendritic and dendritic regions. According to these results, the approximate average PAGS measured in the dendritic region was 22.4 ± 8.1 µm, while a PAGS of 6.4 ± 2.6 µm was observed in the interdendritic zones.
The origin of the smaller grains present close to the non-metallic inclusions and microshrinkage regions is not clear, but it seems to be linked to the microsegregation patterns, as these small grains are only present in the interdendritic zones. Similar results have been reported in the literature [7,13,51]. To explain this phenomenon, the evolution of the phases ferrite (α), cementite (θ) and austenite (γ) as a function of the temperature in the range 700–920 °C was simulated using ThermoCalc® software (based on CALPHAD-Computer Coupling of Phase Diagrams and Thermo-chemistry- and using the TCFE9 database, version 9). These simulations have been performed for the three different compositions estimated using EPMA: (1) the maximum value corresponding to the interdendritic zone, (2) the minimum one corresponding to the dendritic zone, and (3) the average value corresponding to the nominal composition of the steel (Table 2).
It is important to emphasize that, for the three compositions, the C content was considered as constant and equal to 0.8 wt. %. To support this assumption, the expected variation in the C concentration in the austenite phase ∆Cc was calculated as a result of the Mn, Si, and Cr segregation using the method developed by Brown and Kirkaldy [52] and the microsegregation concentration values measured in this work (see Table 2). The differences between the maximum and minimum in Mn-∆CMn−, Si-∆CSi-, and Cr-∆CCr- concentration (in wt. %) result in:
∆Cc ≈ 0.061∆CMn − 0.138 ∆CSi + 0.156 ∆CCr
For this case, ∆Cc ≈ 0.0068 wt. %, being this value negligible with respect to the nominal C concentration. The influence of the Mn and Cr segregation on the variation of the C concentration in the austenite is partially cancelled by the opposite effect of Si segregation for the given composition. The segregation of carbon is influenced by its diffusion coefficient in the austenite. It is well known that the diffusion of carbon in the austenite lattice is affected by the presence of other alloying elements in solid solution [53,54,55,56]. In this regard, Lee et al. [53] and Babu&Bhadeshia [56] have proposed empirical equations that give accurate predictions for carbon diffusion in alloyed steels, accounting for the influence of elements such as Mn, Cr, Mo, Si, or Ni. Existing surveys on the matter have concluded that Si and Ni increase carbon diffusivity [55] while Cr, Mn, and Mo, which are carbide forming elements, attract C and decrease its diffusivity [54,56]. These studies support the role predicted by Equation (1) for Si in the sense that this element reduces carbon segregation by increasing is diffusion rate while Mn and Cr exert an opposite effect, anticipating an overall negligible carbon segregation pattern.
Figure 7 shows the temperature evolution of the mass fraction of the ferrite (α), cementite (θ) and austenite (γ) phases for the nominal composition. In this figure, A1-lower and A1-upper are the critical temperatures that delimit the three-phase region α + θ + γ. Assuming quasi-equilibrium heating, these two temperatures set the start and end of the ferrite into austenite phase transformation in alloyed hypereutectoid steels. ACM sets the temperature at which cementite dissolution is complete and a fully austenitic microstructure is obtained. The inset in this figure highlights the location of the A1-lower, A1-upper, and ACM temperatures for the three compositions.
The inset in Figure 7 shows that the critical temperature A1-lower (start temperature for austenite formation during quasi-equilibrium heating) remains practically constant with small variations. Therefore, austenite nucleation is expected to occur in the entire microstructure almost simultaneously regardless of the microsegregation. However, there is a difference of approximately 15 °C among the A1-upper temperatures corresponding to the solute rich zones (780 °C) with respect to the solute poor zones (765 °C). Thus, for the selected austenitizing temperature (920 °C in this study), the austenite that has nucleated and grown in the solute-rich zones (last austenite to be formed) has a smaller grain size due to having a smaller ΔT (= Tγ-A1-upper; with Tγ = 920 °C). In zones with a smaller ΔT, austenite grains would have less heating time to grow and would remain smaller. This hypothesis would explain the experimental results obtained.
Regarding temperature ACM, it increases progressively (833 °C → 854 °C → 873 °C) as the local composition of the microstructure enriches in solute. Thus, there is a difference of 40 °C in the ACM value between the interdendritic and dendritic regions. This suggests that cementite is more stable in the interdendritic zones. The higher stability of the cementite could be attributed to this phase having higher levels of Cr and Mn in the composition. Moreover, when present in solid solution, both elements increase the ACM temperature in hypereutectoid steels, especially Cr, expanding the phase field at which this phase is stable [57]. In this work, based on these thermodynamic calculations, the austenization temperature was selected to obtain a fully austenitic microstructure. However, despite not being predicted by the ThermoCalc®, LOM, and FEG-SEM micrographs in Figure 8 show the presence of undissolved cementite in the interdendritic regions (see small black dots in white circle of Figure 8a). To reveal the presence of undissolved cementite precipitates more effectively, the as-quenched martensitic microstructures were etched with Vilella reagent. This is a popular etchant in martensitic stainless steels and tool steels to reveal the presence of carbides. It is also used to reveal the prior austenite grain boundaries and carbides in low alloyed martensitic and bainitic steels [58,59]. According to the ThermoCalc® the austenitization temperature (920 °C) is almost 50 °C above the ACM, which is high enough to dissolve all cementite particles after holding for 60 min. Therefore, thermodynamic simulations do not correlate well with the experimental observations and the reason is unclear. Nevertheless, the presence of these cementite precipitates, all of which have a submicron or nanometer size (white/light grey spherical particles in Figure 8b) could inhibit or delay the austenite grain growth via pinning the grain boundaries.
A third factor that may be favoring having a bimodal distribution is the so-called solute drag effect [60,61,62]. It is well-known that solute atoms (impurities or alloying elements) segregated to the austenite grain boundaries can reduce their mobility and exert a drag force that retards the kinetics. In this case, the higher levels of alloying elements (Cr, Mn, and Si) present in interdendritic regions could be favoring the solute drag effect in these regions.
Therefore, in summary, the difference in the austenite grain size between interdendritic and dendritic regions and the origin of the bimodal distribution (Figure 5 and Figure 6) could be due to three interrelated factors. Solute (interdendritic) rich zones, with higher Si, Mn, and Cr concentration, would possess a smaller ΔT (less thermal energy to grow), promote solute drag effect and contain a greater amount of submicrometer size cementite undissolved precipitates, that would pin the grain boundaries, factors contributing to having a smaller austenite grain size. As both the composition and austenite grain size may influence the bainitic and martensitic transformations [26,27,28,34,35,36,63,64,65], it should be expected that the microsegregation and the inhomogeneous grain size distribution will affect these transformations.

3.3. Martensitic Transformation

3.3.1. Determination of Ms Temperature

Prior to the selection of the austempering temperature, the determination of the Ms temperature of the steel (corresponding to the start of the austenite, α, to martensite, α’, phase transformation) becomes essential. Figure 9 provides a characteristic high-resolution dilatometry plot obtained during quenching at 50 °C/s after austenitizing at 920 °C (for 60 min). The temperature evolution of the relative change in length during quenching was recorded. The Ms temperature can be defined as the temperature where, due to the formation of the martensite, the length change of the sample deviates (expands) from that expected quasi-linear austenite contraction behavior [66]. The martensite phase has a specific volume which is larger than that of austenite, reason why an expansion is observed [37,38,66]. In this work, an offset corresponding to a strain of 0.02% generated by the formation of martensite was adopted. Following this methodology, the overage Ms temperature was estimated to be 138 ± 10 °C after performing three independent experiments.
According to the seminal work of Andrews [67] and many others that have followed afterwards [68,69,70,71] different local Ms temperatures could be expected as a result of the microsegregation and this could also affect the kinetics of this transformation. In steels having an inhomogeneous distribution of alloying elements in the matrix, a splitting in the Ms or a gradual instead of sudden change in the slope below the Ms has been observed [63,64,65,72]. It is also well-known that the austenite grain size affects the stability of the austenite and its transformation to martensite as discussed by several authors [37,73,74] and this could also affect the onset and progress of the transformation. However, despite having microsegregation and a dual prior austenite grain size distribution in the microstructure, no clear effect was observed in the dilatometry signal (Figure 9) contrary to previous works. Finally, this dilatometry plot shows that the austenite does not fully transform to martensite (an asymptotic behavior is not reached) and some retained austenite should be expected in the microstructure.

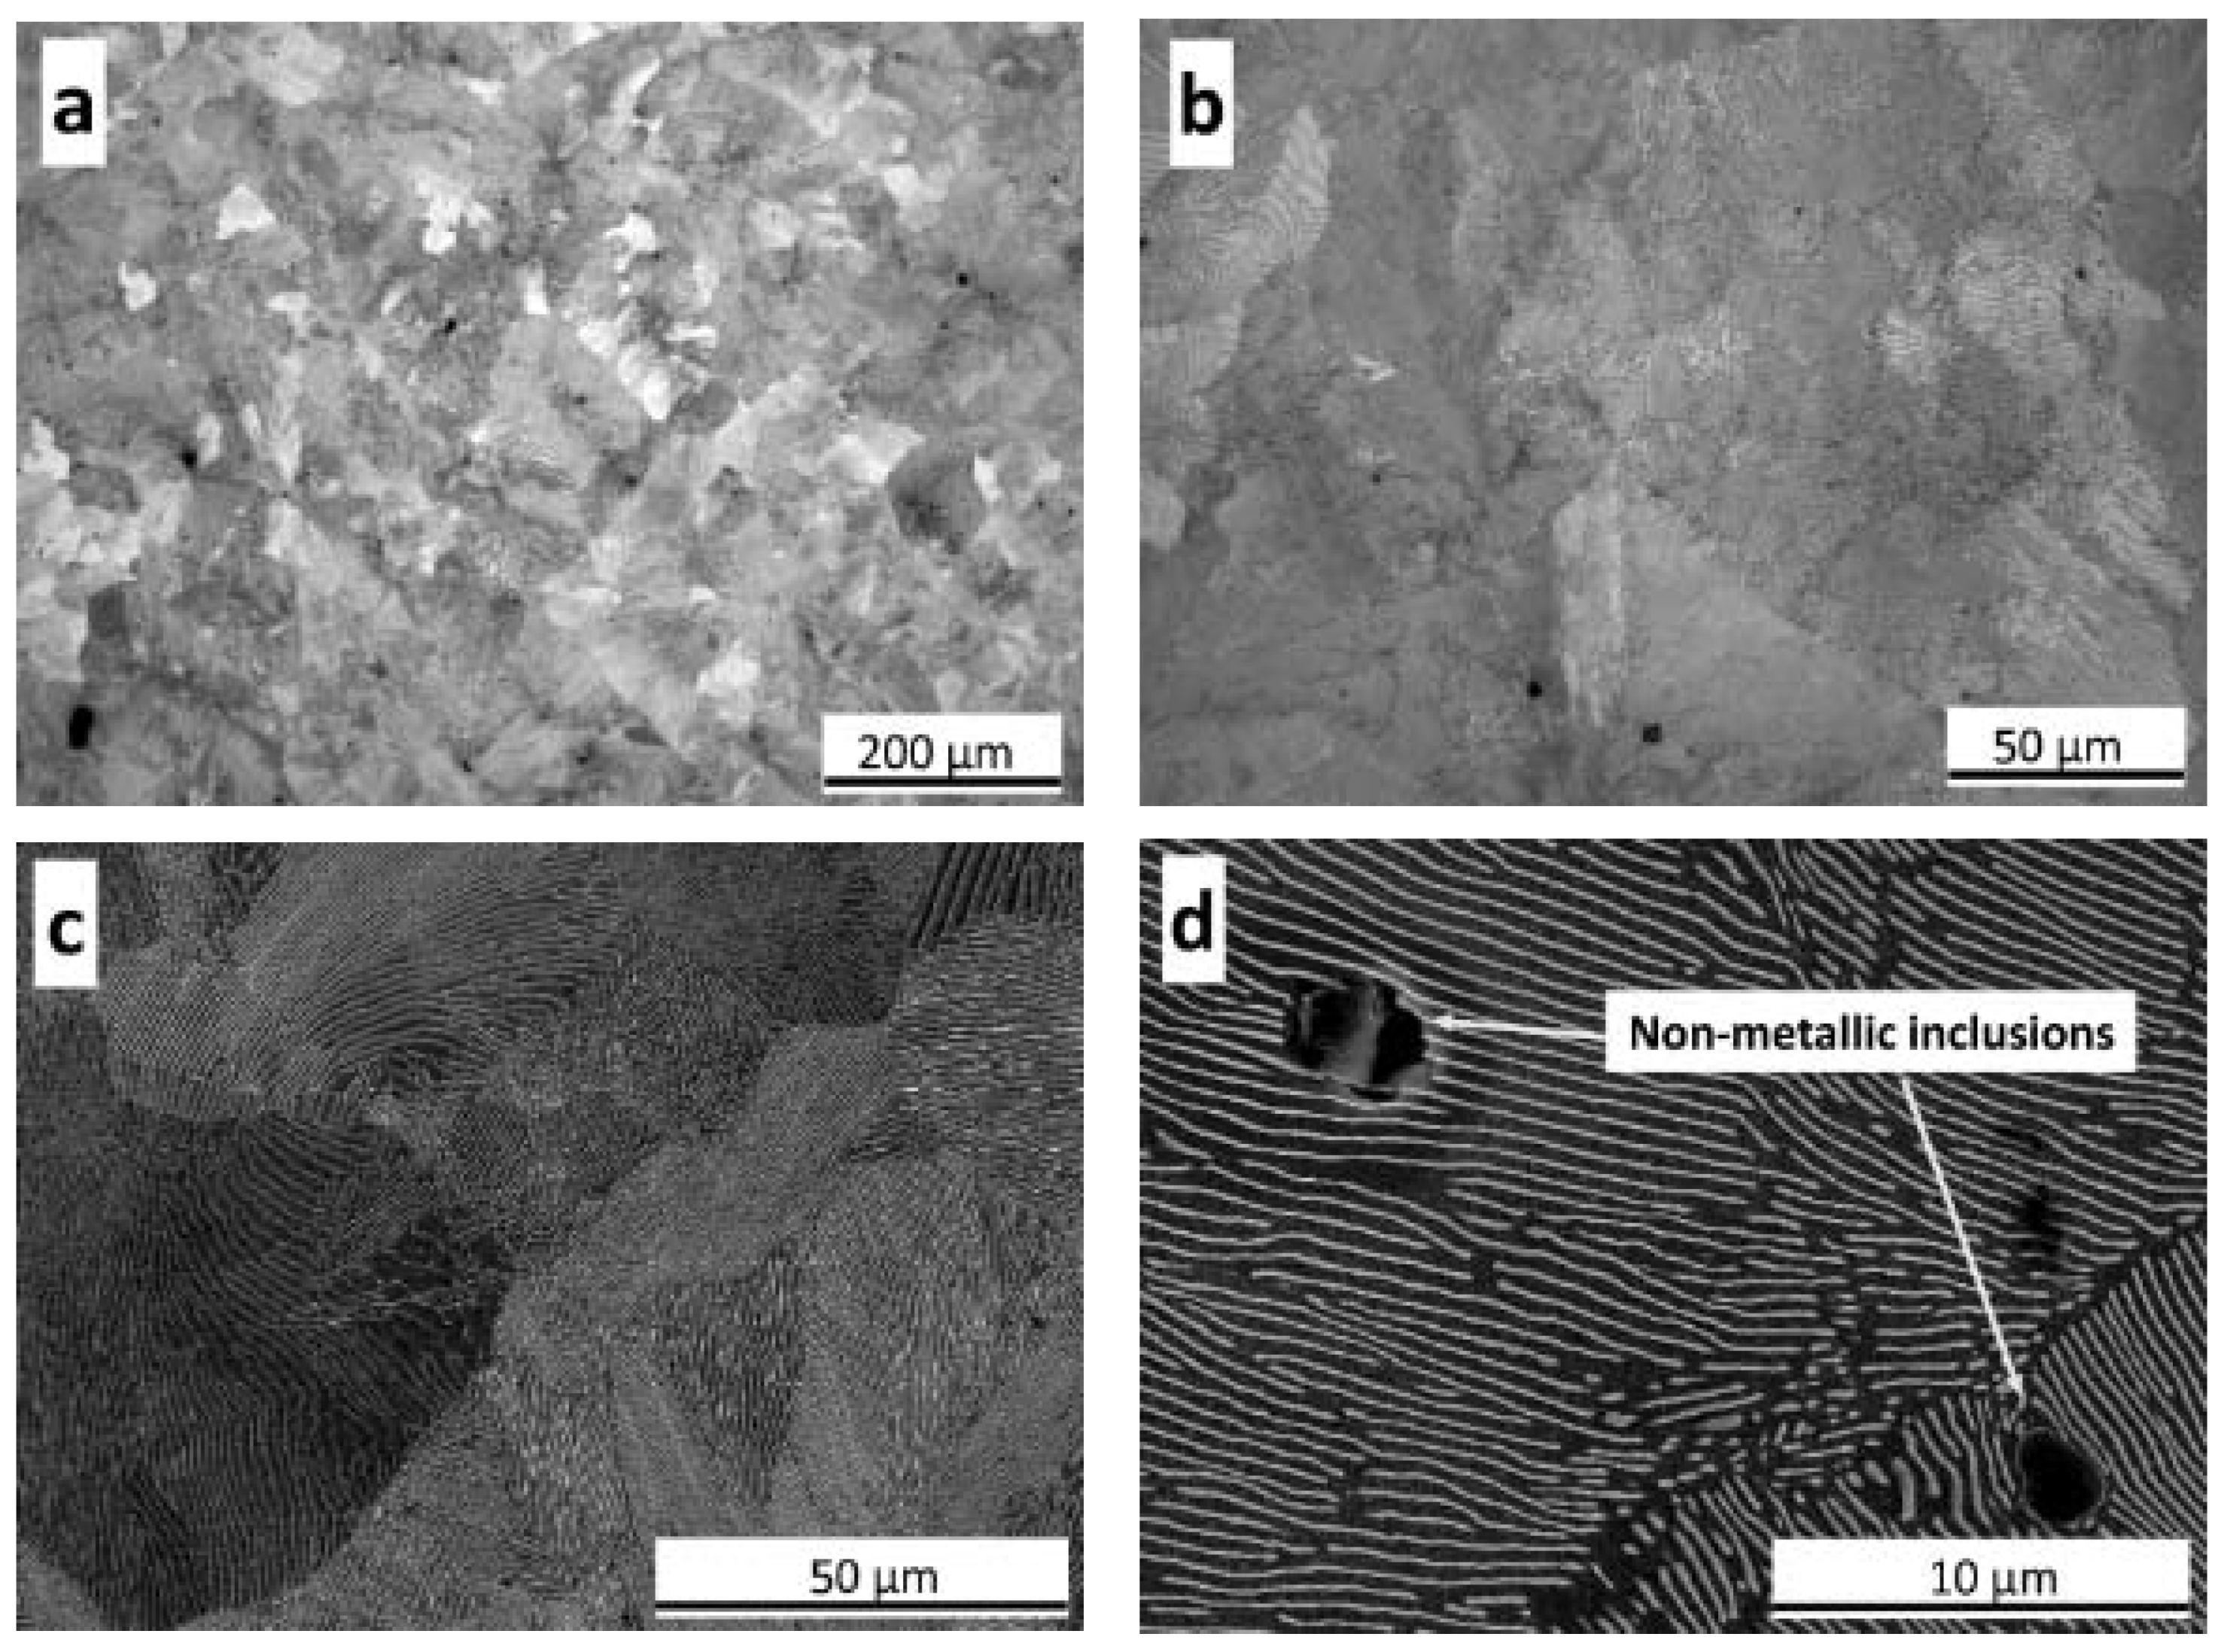
3.3.2. As-Quenched Microstructure

Figure 10 shows representative LOM micrographs of the martensitic microstructure, obtained after the austenitization (920 °C) followed by quenching (50 °C/s), at two different magnifications and disclosed using Nital 2% etching solution. The XRD measurements confirm that the microstructure is composed of austenite and martensite. The volume fraction retained austenite content measured with this technique is 0.23 ± 0.02 (the amount of martensite ~0.77 ± 0.02). The hardness value of this microstructure is 930 ± 10 HV5.
The etching with Nital 2% is also able to reveal the dendritic solidification pattern; the lighter zones in Figure 10 correspond to the interdendritic zones (richer in solute) while the darker/grey regions correspond to the dendritic zone (poorer in solute). As can be observed, larger non-metallic inclusions and voids (black dots) are located mainly in the interdendritic regions, which are the last zones to solidify.
Contrary to what was observed in other publications, and as discussed in the previous section, the expansion of the sample recorded by dilatometry during the martensitic transformation was no influenced by the microstructural inhomogeneities present in the microstructure. In this section, the influence of the microsegregation (Figure 4) on the as-quenched martensitic microstructure has been analyzed using the EBSD technique, considering only FCC (austenite) and BCC (martensite) for automated phase indexing. Two areas of 39.7 μm × 29.92 μm were scanned using a step size of 0.15 μm and an acceleration voltage of 15 kV.
The area fractions of each of those phases, in addition to the fraction of non-indexed pixels, for dendritic and interdendritic regions can be found in Table 3. As it can be observed, a poor indexation rate, i.e., the fraction of indexed points, has been reached, as only 78% and 73% of the pixels were indexed in the dendritic and the interdendritic areas, respectively. In order to test the reliability of the indexation, the prior austenite was reconstructed using the software developed by Nyyssönen et al. [75]. It has been observed that many points were wrongly indexed as austenite, as their indexed orientation was highly misoriented, i.e., more than 30°, with respect to the orientation obtained by the reconstruction. Moreover, those wrongly indexed points are not homogeneously distributed along the EBSD area, but are located only along some of the ferrite blocks (defined as the smallest areas with misorientations below 7.5°, as later explained), which suggests that the similarity of the Kikuchi patterns along those blocks has led the equipment not to be successful at identifying the phase and, in turn, the crystallographic orientation of those points.
A post-processing in which those pixels were removed was carried out and the recalculated area fractions can be found in Table 3. Note that the mentioned pixels have been assumed to be martensitic when calculating the area fractions, although they will not be considered in latter analyses as their orientation is wrong. It can be seen that, after post processing, the martensite area fractions (0.73–0.76) are closer to the volume fractions estimated by XRD (0.77), although still lower, most likely because of the poor indexation rate surrounding the ferrite boundaries, where patterns from two BCC blocks or from two BCC blocks and one FCC thin film overlap [76]. Regarding the austenite area fractions, they are far from the values estimated by XRD, behavior that was previously observed in EBSD analyses performed to similar microstructures by Thomas et al. [77]. In the mentioned work, a quenched and partitioned microstructure was scanned by EBSD, also only allowing austenite and ferrite to be considered; although, in that case, the selected step size was far lower than the one selected for this work, i.e., 10–50 nm. Differences were found by these authors between the austenite area fraction detected by EBSD (0.09) and the austenite volume fraction detected by XRD (0.13) and those differences were explained by the following arguments, also shared by the current study: (a) the area might have not been representative of the bulk; (b) the step size has not been low enough to reveal the thin films of austenite and, in our study, probably also some of the smallest austenite blocks; and (c) the sample preparation could have not been good enough and some fractions of austenite could have transformed to martensite by the transformation induced plasticity (TRIP) effect during the polishing.
Therefore, as the austenite area fractions were shown not to be reliable, the subsequent study was focused on finding differences between the martensitic microstructure in the dendritic and interdendritic regions. First, the regions were compared in terms of the PAGS, which were estimated from the reconstructed austenite. With that aim, the prior austenite grains were defined as the smallest areas with misorientations below 10 °. All boundaries whose misorientations lie between 58 and 61° have not been considered as prior austenite grain boundaries because they correspond to annealing twins, characterized by a 60° misorientation about the <1 1 1> axis, as first reported by Carpenter and Tamura [78]. Figure 11a,b shows the bcc (martensite) IPFZ map, for dendritic and the interdendritic regions, respectively. In the figures, two types of boundaries were drawn. Prior austenite grain boundaries are represented by black lines, whereas the red lines are the twin boundaries. The PAGS estimated from the dendritic and the interdendritic regions are 14.3 ± 7.7 and 10.9 ± 6.0 μm, respectively. The trend in the results is the same that one found measured by Thermal Etching, nevertheless the difference in the PAGS measured by EBSD between both zones is lower. On the one hand, it is important to keep in mind that the evaluated regions were much larger in the previous studies (thermal etching, Section 3.2) and that those statistics are thus more reliable than the ones obtained from the analyzed EBSD area.
Finally, the regions were compared in terms of the martensitic boundary misorientations frequency and ferrite (martensite) block sizes. To do so, it has been assumed that the OR remains constant along the steel of study, i.e., <0.14 0.17 0.98> 44.08° using the axis/angle pair convention. This OR is intermediate between Nishiyama–Wassermann’s (N-W), i.e., < 0.2 0.08 0.98> 45.98° [79] and Kurdjumov-Sachs’, i.e., < 0.18 0.18 0.97> 42.85° [80], differing form them by 3.4 and 2.1°, respectively, in good agreement with OR of similar composition steels [81,82]. For this given OR, the ideal misorientation angles set of the martensitic boundaries can be calculated and the misorientation ranges characteristic of the martensitic features, i.e., sub-blocks, blocks and packets, can be defined according to them. Lower misorientations than 3.5° were not considered as they correspond to local misorientations, i.e., small misorientations due to deformation within the same crystallographic sub-block. In this manner, all misorientations in between 3.5 and 7.5° will be considered to be to sub-block boundaries, the ones higher than 52.5° will be assumed to belong to blocks and the ones in the ranges 7.5–22.5° and 47.5–52.5° will be considered to be low and high angle packets boundaries, respectively. These misorientation ranges are in concordance with other ones assumed or reported in the literature [82,83,84,85,86]. Figure 11c,d show the misorientation maps for dendritic and interdendritic regions, respectively, while Figure 11e shows the frequency of the three type of defined boundaries for both regions. The equivalent diameters of the ferrite blocks, defined as the smallest areas with misorientations always below 7.5°, as already anticipated, were calculated and their histogram can be found in Figure 11f. Subfigures indicate that there are no significant changes between the dendritic and the interdendritic regions, both in terms of misorientation boundaries frequency and block size. Based in results reported in the literature, it should be expected that different PAGS and variation in the chemical composition led to different block sizes [85,86,87]. It is possible that the mapped areas have not been large enough to capture such an effect, as a larger amount of data would be required to have reliable statistics.

3.4. Bainitic Transformation

Figure 12 shows a representative plot of the time evolution of the relative change in length recorded after austempering at 230 °C for 360 min after the austenitization heat treatment (920 °C-60 min). It can be observed in this figure that the relative length of the samples increases after about 80–90 min. Since the specific volume of bainitic ferrite is larger than of austenite, this dilatation was attributed to the nucleation and growth of this phase. The bainitic reaction evolution with the holding time follows a characteristic sinusoidal behavior [88,89,90,91,92], but this transformation has not ended after 360 min. Although the relative change in length curve usually shows an asymptotic behavior at the end of the transformation, a fully bainitic microstructure is not always obtained, and the maximum amount of bainitic ferrite that can be present in the microstructure depends on the alloy composition and the isothermal temperature used [93].
The progress of the bainite reaction was followed by interrupted austempering treatments after holding for 10, 30, 80, 160, 240, and 360 min at 230 °C followed by quenching to room temperature. During the progress of the transformation, the untransformed austenite enriches in carbon, increasing its thermal stability. The longer the time, the higher the enrichment and the more stable the untransformed austenite will be. On the contrary, atom probe experiments have confirmed that in high C, high Si steels, there is no appreciable redistribution of substitutional alloying elements such as Mn, Cr or Si during this transformation [94]. Additional parameters that may influence the austenite stability are the grain size and morphology. Small grains with a film like morphology are expected to be more stable compared with coarse blocky ones. Thus, depending on the stability of the untransformed austenite the microstructure after quenching to room temperature will be a mixture of bainitic ferrite and possibly martensite and/or retained austenite.
Figure 13 shows LOM and FEG-SEM images corresponding to a sample austempered for 80 min and then quenched to room temperature. Figure 13a has been taken at low magnification to show the microsegregation pattern. Figure 13b–d are higher magnification images showing, in Figure 13b: dual dendritic/interdendritic zones and, in Figure 13c,d: only dendritic zones. Finally, Figure 13e,f are high magnification FEG-SEM images where the nucleation of bainitic ferrite on inclusions was observed.
Although the initiation of the bainite nucleation was undoubtedly not detected with high-resolution dilatometry after holding for 80 min (Figure 12), the nucleation and growth of the first plates of bainitic ferrite could be clearly observed in these micrographs (symbol αb stands for bainitic ferrite). After quenching, the microstructure is mainly composed of martensite, some retained austenite and a few plates of bainite (highlighted by arrows). Differentiating between martensite and bainite is not always easy. However, Vilella etching solution (c–d) seems to provide a better contrast than Nital 2%.
The images in Figure 13 show that the bainitic transformation starts preferentially in the dendritic zones (darker regions in Figure 13a), which are poorer in substitutional solutes (Cr, Si and Mn) and possess the lowest hardenability (see Figure 13a,b). Other reports focused on the influence of microsegregation of phase transformations have shown that in medium carbon steels with banded ferrite/pearlite structures, low Mn/Cr regions promoted the formation of ferrite [14], while in banded austenite/martensite structures of metastable stainless steels, low Ni/Cu combined with high Cr regions promoted the earlier nucleation of martensite plates [95].
On the other hand, it was observed that the nucleation of the bainitic ferrite plates occurs preferentially at the PAGBs (Figure 13c,d) and non-metallic inclusions (Figure 13e,f), because these regions are high-energy sites. In these micrographs, some bainitic ferrite plates (αb) have been marked with arrows. The length of the initially formed bainitic ferrite plates matches the characteristic size of the prior austenitic grains located in dendritic regions. These first plates seem to cross the whole austenite grain from: (i) grain boundary to grain boundary or (ii) from inclusion to the nearest grain boundary depending on the growth direction followed by the bainitic ferrite plate.
Figure 14 shows, at different magnifications, the microstructures corresponding to 160 (Figure 14a,b), 240 (Figure 14c,d) and 360 (Figure 14e,f) minutes of austempering times, at 230 °C. It can be seen how the bainitic transformation progresses first in the dendritic zones, while the interdendritic zones have a slower transformation kinetics (lower volume fraction of bainite is observed) due to the higher content of alloying elements, mainly Mn, which is an austenite stabilizing element. For samples austempered for 360 min, it has been observed that the bainitic transformation has also begun in the interdendritic zones, as shown in Figure 14e,f. However, it is possible to appreciate that the length of the bainitic ferrite plates is smaller due to the smaller prior austenite grain size of these regions compared to the dendritic ones (see Figure 5). It has been reported that a smaller PAGS would accelerate the transformation compared to a coarser one [33,36,96,97]. However, in this case, the microsegregation pattern present in the microstructure has overcome the influence of the grain size and reverted this tendency.
To complement the results shown in Figure 14, Figure 15 shows micrographs obtained by FEG-SEM(a) and LOM (b), where a clear difference in the spatial distribution and sizes of bainitic ferrite plates between dendritic (larger PAGS) and interdendritic zones (smaller PAGS) was observed; in the latter region plates are shorter in length. Figure 15b also shows that the length of bainitic ferrite plates around a microshrinkage, in the interdendritic zone, is smaller. On the other hand, for this austempering time, the presence of martensite in dendritic zones was not observed (see Figure 16a), while in interdendritic zones, where the kinetics of bainitic transformation is slower, high percentages of martensite (formed upon quenching to room temperature) were observed (see Figure 16b). As it was explained before, austenite enriches in carbon during the transformation due to the rejection of carbon from the low carbon bainitic ferrite to the austenite. Thus, the more bainitic ferrite present in the microstructure, the higher the carbon content of austenite and the smaller its average size is, which contributes to enhancing its stability. These micrographs prove the difference in the kinetics of the bainitic transformation for different segregation levels present in the microstructure.
The volume fraction of retained austenite as measured with X-ray diffraction and hardness values for samples austempered for 80, 160, 240, and 360 min are shown in Table 4. These results can be explained by understanding the sequence of the bainitic transformation in high silicon steels [26,27,28,89,91,96], which was mentioned previously. As the transformation progresses, the carbon rejected by the ferrite enriches the austenite, decreases its local Ms temperature and stabilizes this phase at room temperature. As the austempering time increases, the formation of bainitic ferrite will promote the increase of the amount of austenite retained in the microstructure after quenching to room temperature, decreasing the fraction of martensite (harder phase). For this reason, the hardness values decrease with an increase in austempering time.
Table 4 shows the lattice parameter values for BCC/BCT and FCC structures. It can be observed that the tetragonality of the ferritic structure has a tendency to decrease with the formation of bainitic ferrite (as increase the austempering time). As mentioned, the formation of new bainitic ferrite plates generates a rejection of carbon towards the austenite, lowering its c/a lattice parameter values. On the other hand, the austenite is enriched in carbon, which produces an increase in the austenite lattice parameter, as illustrated in Table 4.
The results reported in this work allow concluding that the presence of the microsegregation patterns affects both the prior austenite grain size distribution during the austenitization and phase transformations during the subsequent austempering and quenching heat treatments (type, morphology, and distribution of phases), anticipating that it will also have a profound impact on the mechanical behavior of cast parts. Contrary to the dendritic regions, interdendritic ones show smaller prior austenite grain sizes, smaller bainitic plates, and coarser blocky austenite islands in between bainitic units. These areas also show a larger fraction of martensite transformed after quenching. The presence of fresh untempered martensite after quenching will make the microstructure very brittle. Further, the coarse blocky austenite islands, contrary to smaller thin retained austenite ones, will be more unstable and transform easily to martensite during straining. This will reduce the work-hardening, lower the UTS and provide additional fresh and brittle martensite islands that will likely result in having a poor ductility and premature fracture of the sample. Other properties like the fatigue limit or fracture toughness will also deteriorate abruptly. In summary, microsegregation will have a profound detrimental impact on the mechanical properties and should be minimized as much as possible in cast parts.

4. Conclusions

The effect of the microsegregation on the martensitic and bainitic transformation in Fe-0.8C-2.25Si-1.05Mn-1.1Cr (in wt. %) cast steel has been investigated.
  • Segregation of Cr, Si, and Mn during solidification causes the dendritic areas to have a lower concentration of alloying elements.
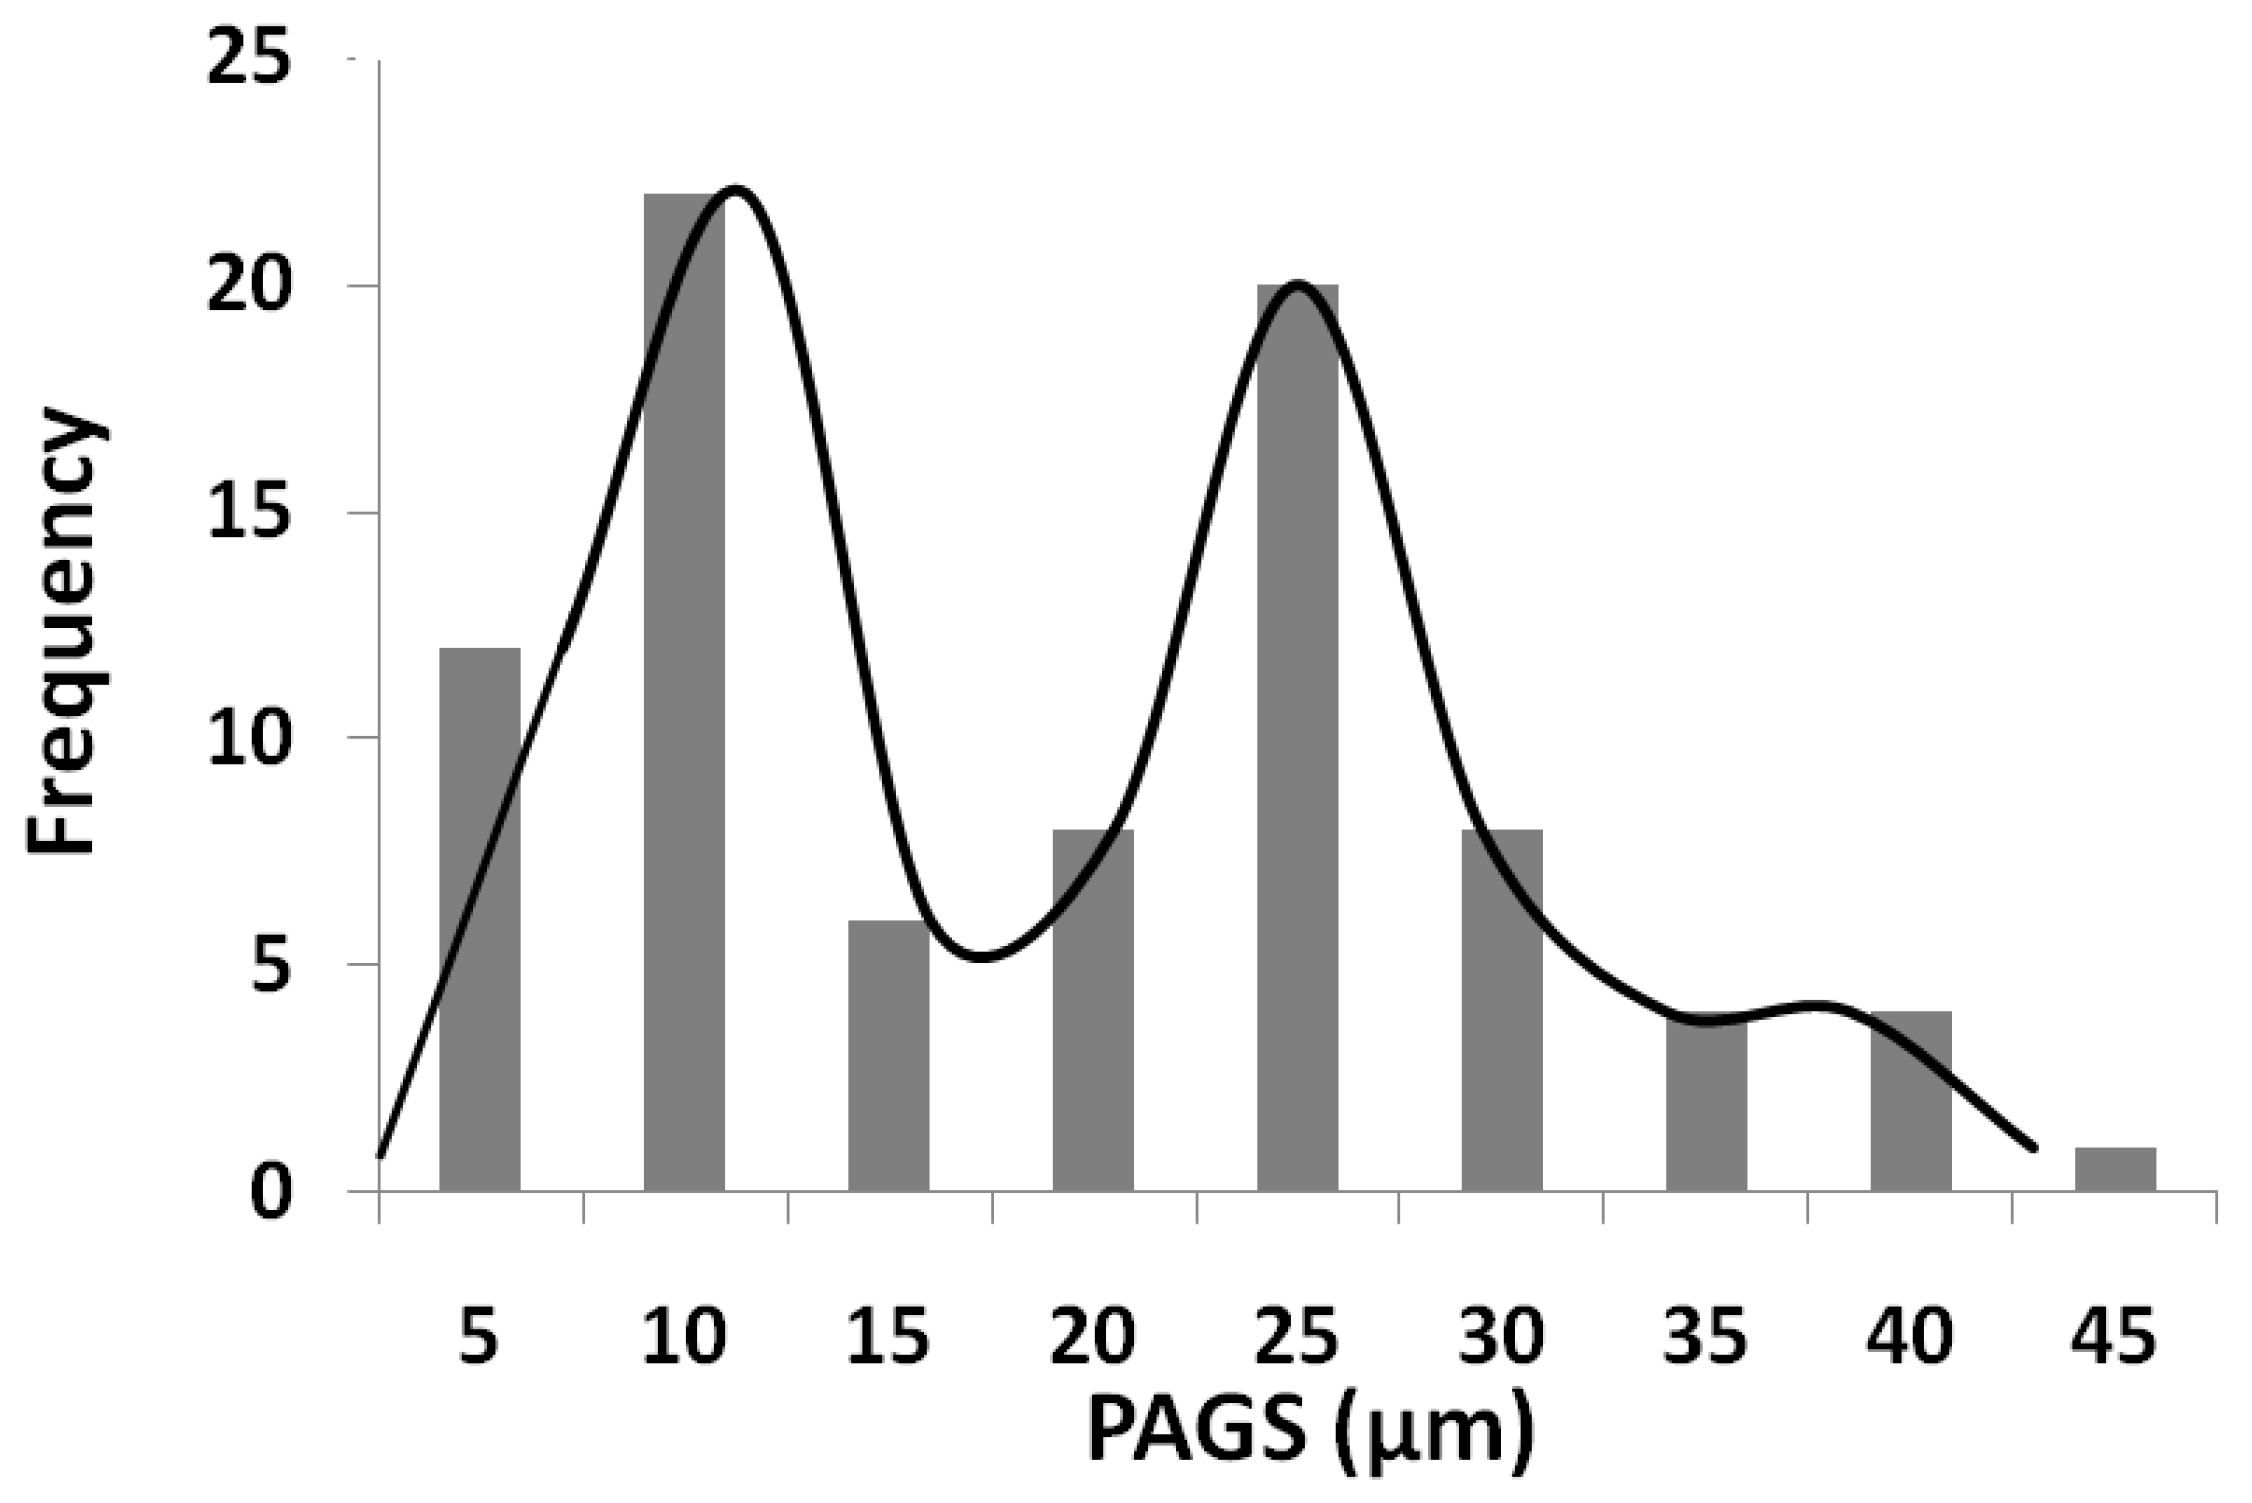
  • Prior austenitic grain size shows a bimodal distribution associate to segregation of alloying elements. Dendritic regions, which have the lower concentration in solute, showed a larger average prior grain size than interdendritic areas (22.4 ± 8.1 µm and 6.4 ± 2.6 µm, respectively). This difference in grain size is attributed to the combined influence of the following. (1) The presence of undissolved cementite observed in segregated areas would pin the grain boundaries, inhibiting grain growth. (2) The Si, Mn, and Cr rich zones are the regions where the last austenite grains are formed during the heating cycle. This generates a smaller austenite grain size in the areas rich in solute with respect to areas poor in solute. (3) Moreover, in the enriched regions, solute drag could be lowering the mobility of the austenite grain boundaries, hampering their movement and refining the grain size.
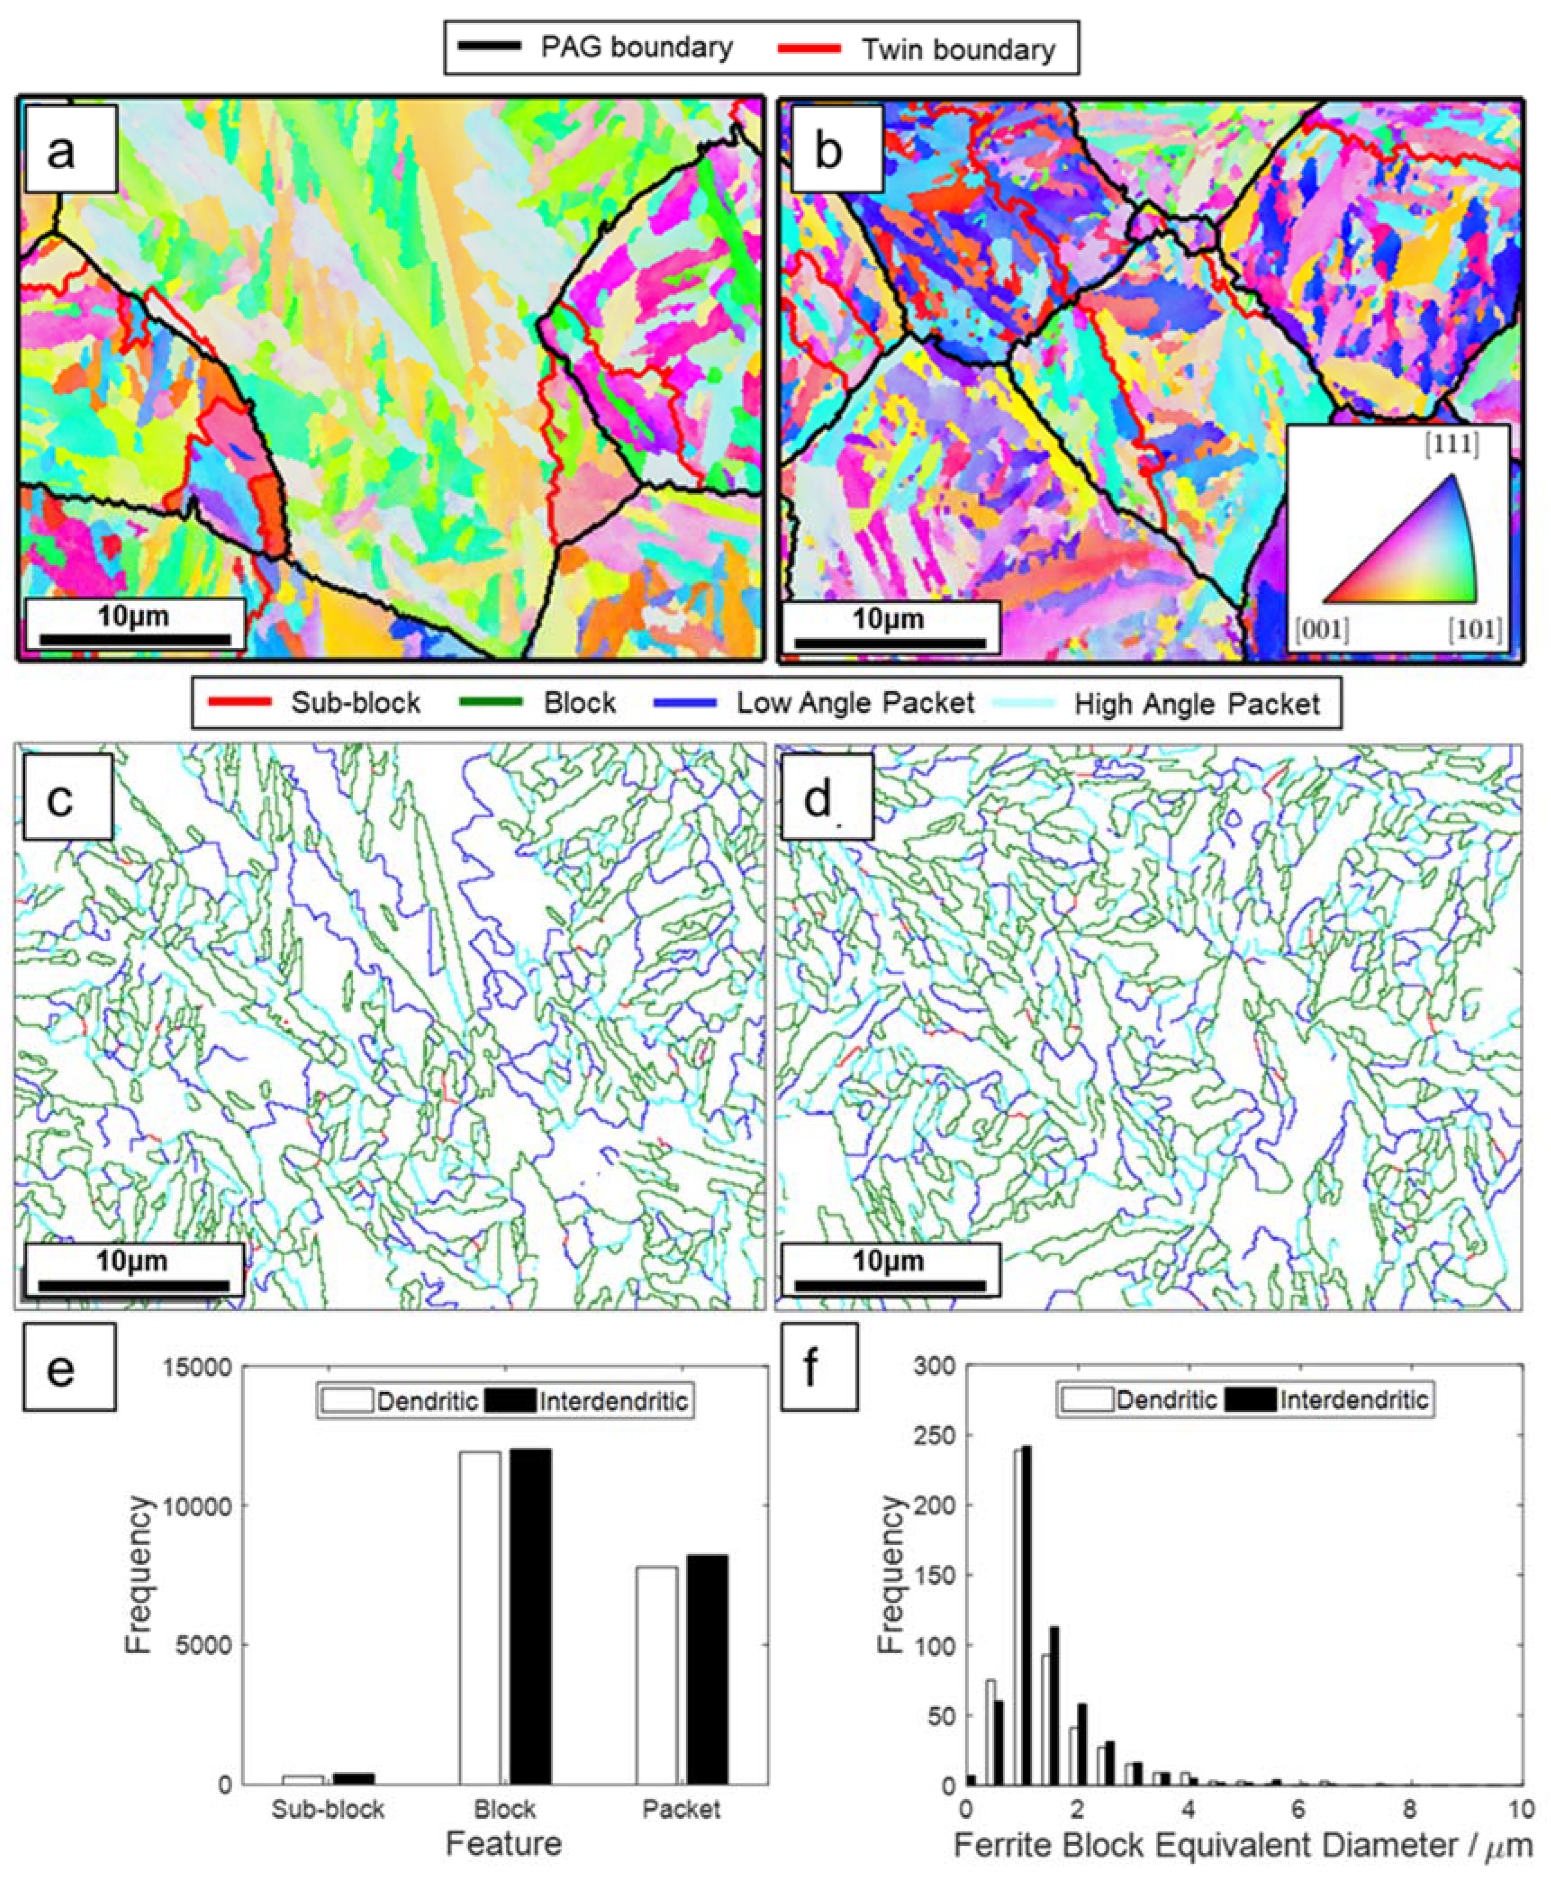
  • The microstructural inhomogeneities (microsegregation, bimodal grain size distribution) do not affect the nucleation and progress of the martensitic transformation as recorded by dilatometry contrary to other investigations. The EBSD analysis of the as-quenched microstructure shows a small difference in the PAGS measured in dendritic and interdendritic regions contrary to the thermal etching results. Further, no difference in the misorientation boundaries frequency and block size was observed between these two regions.
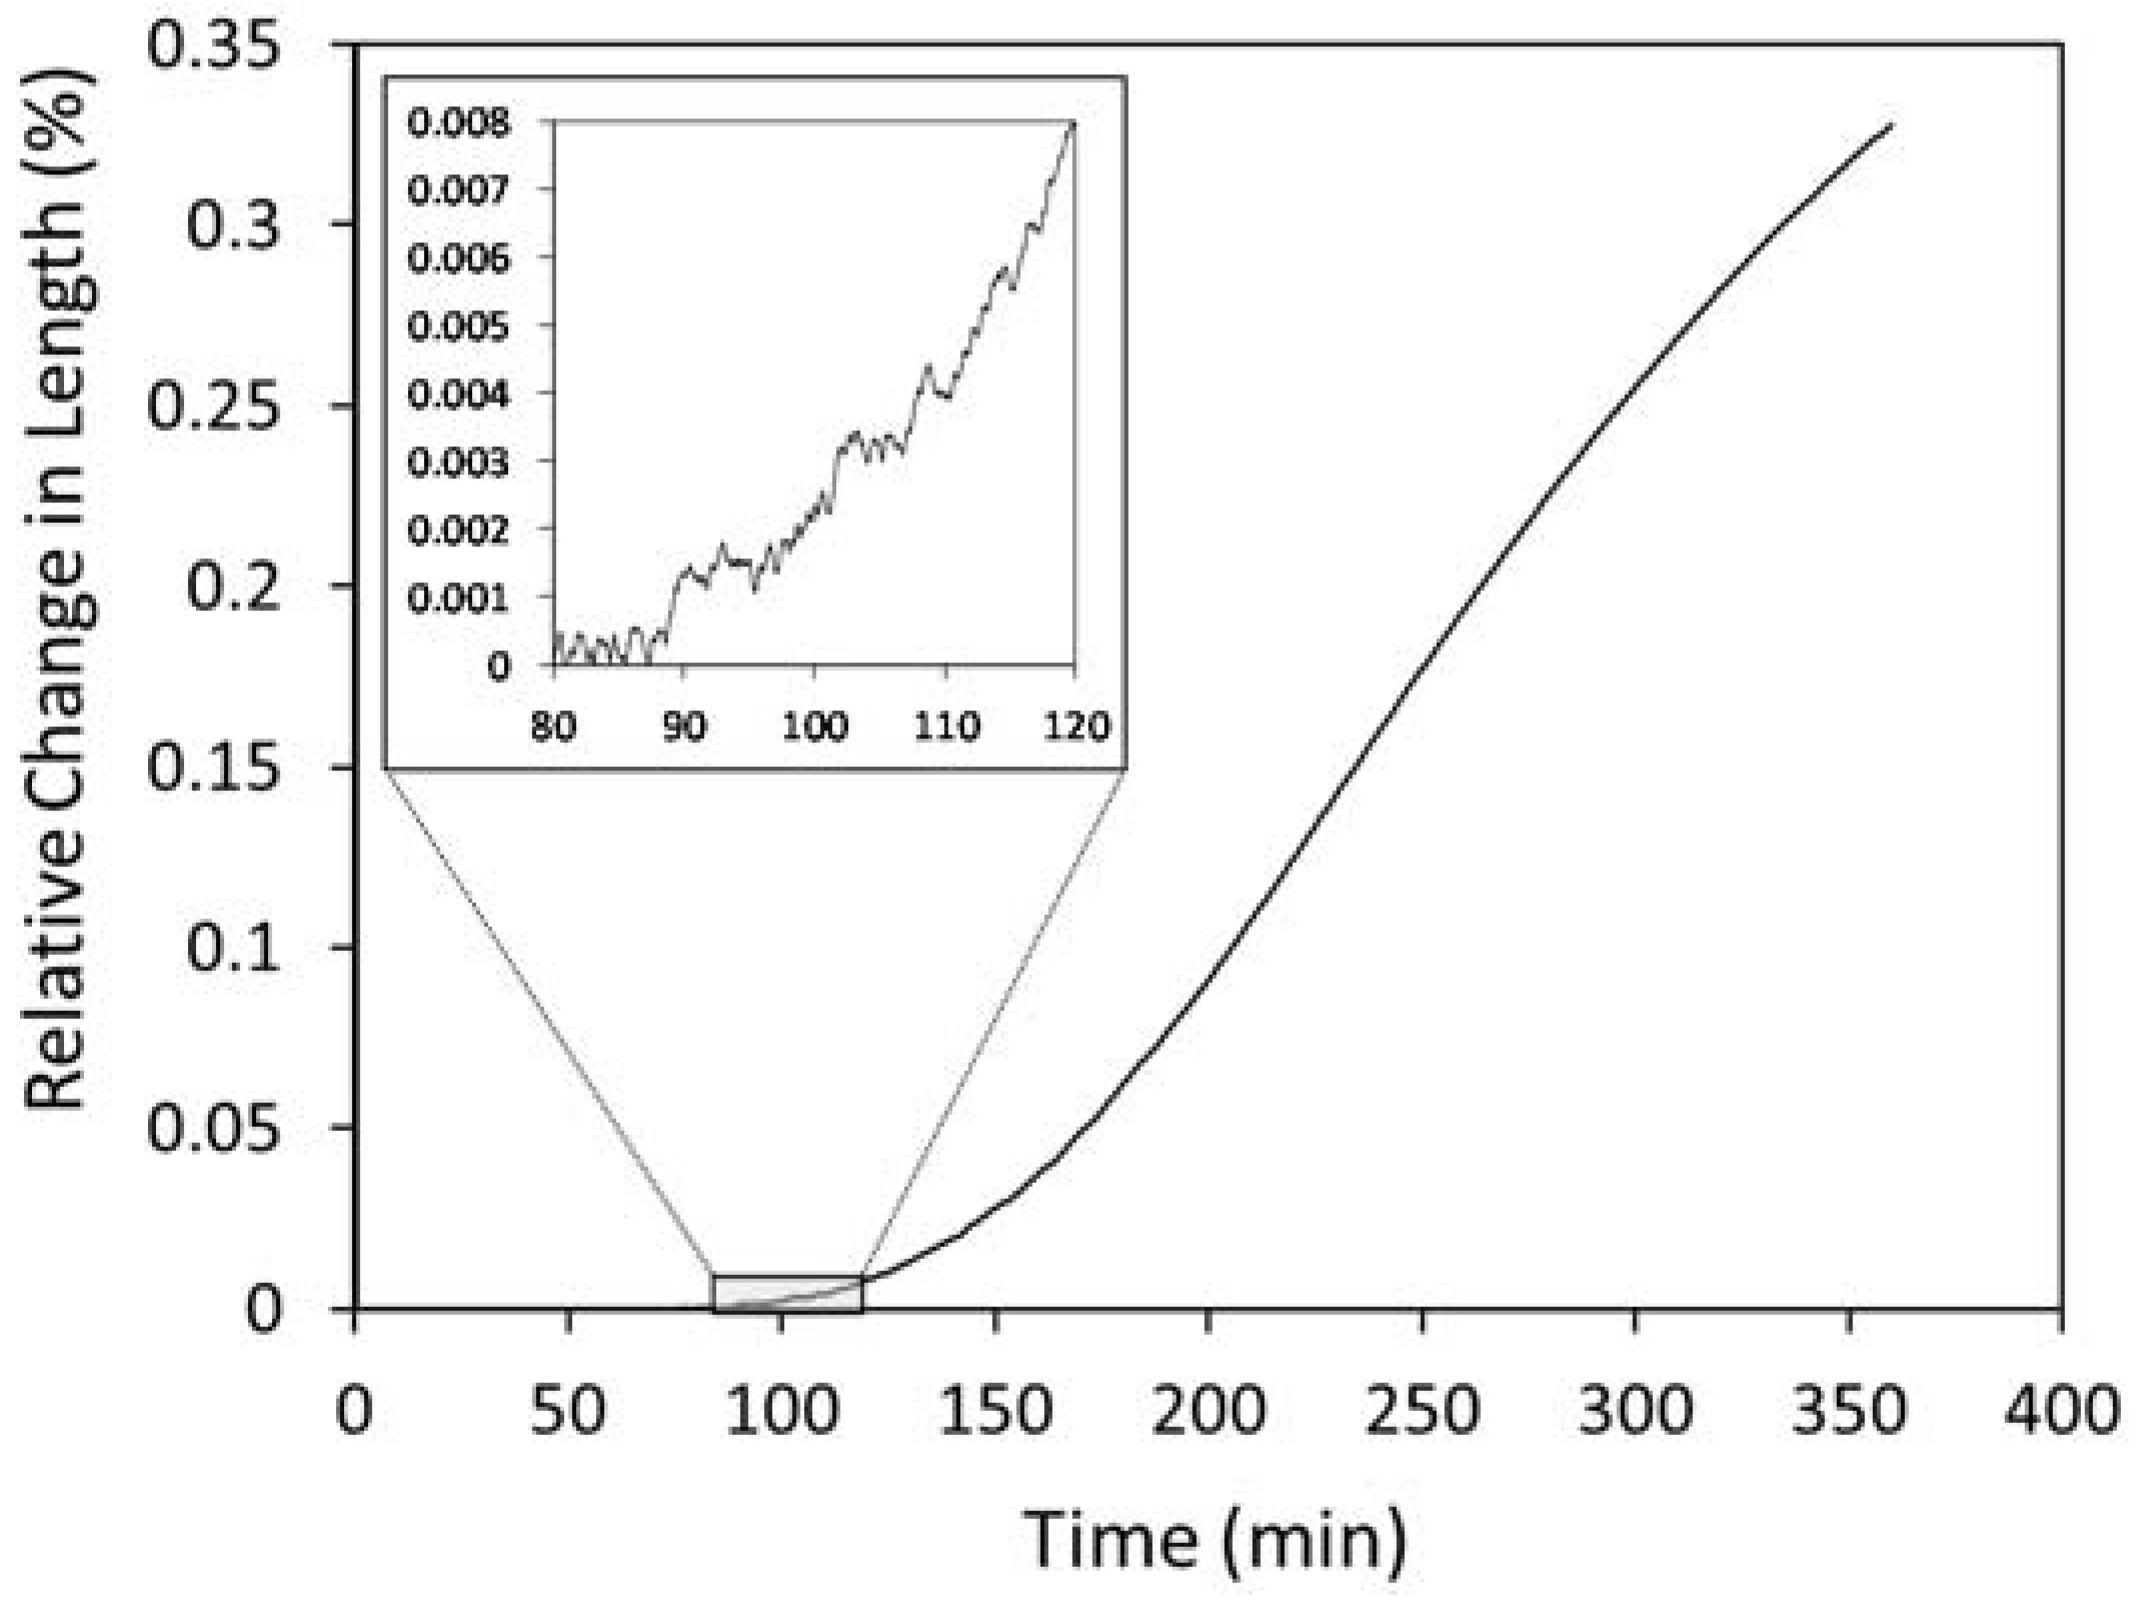
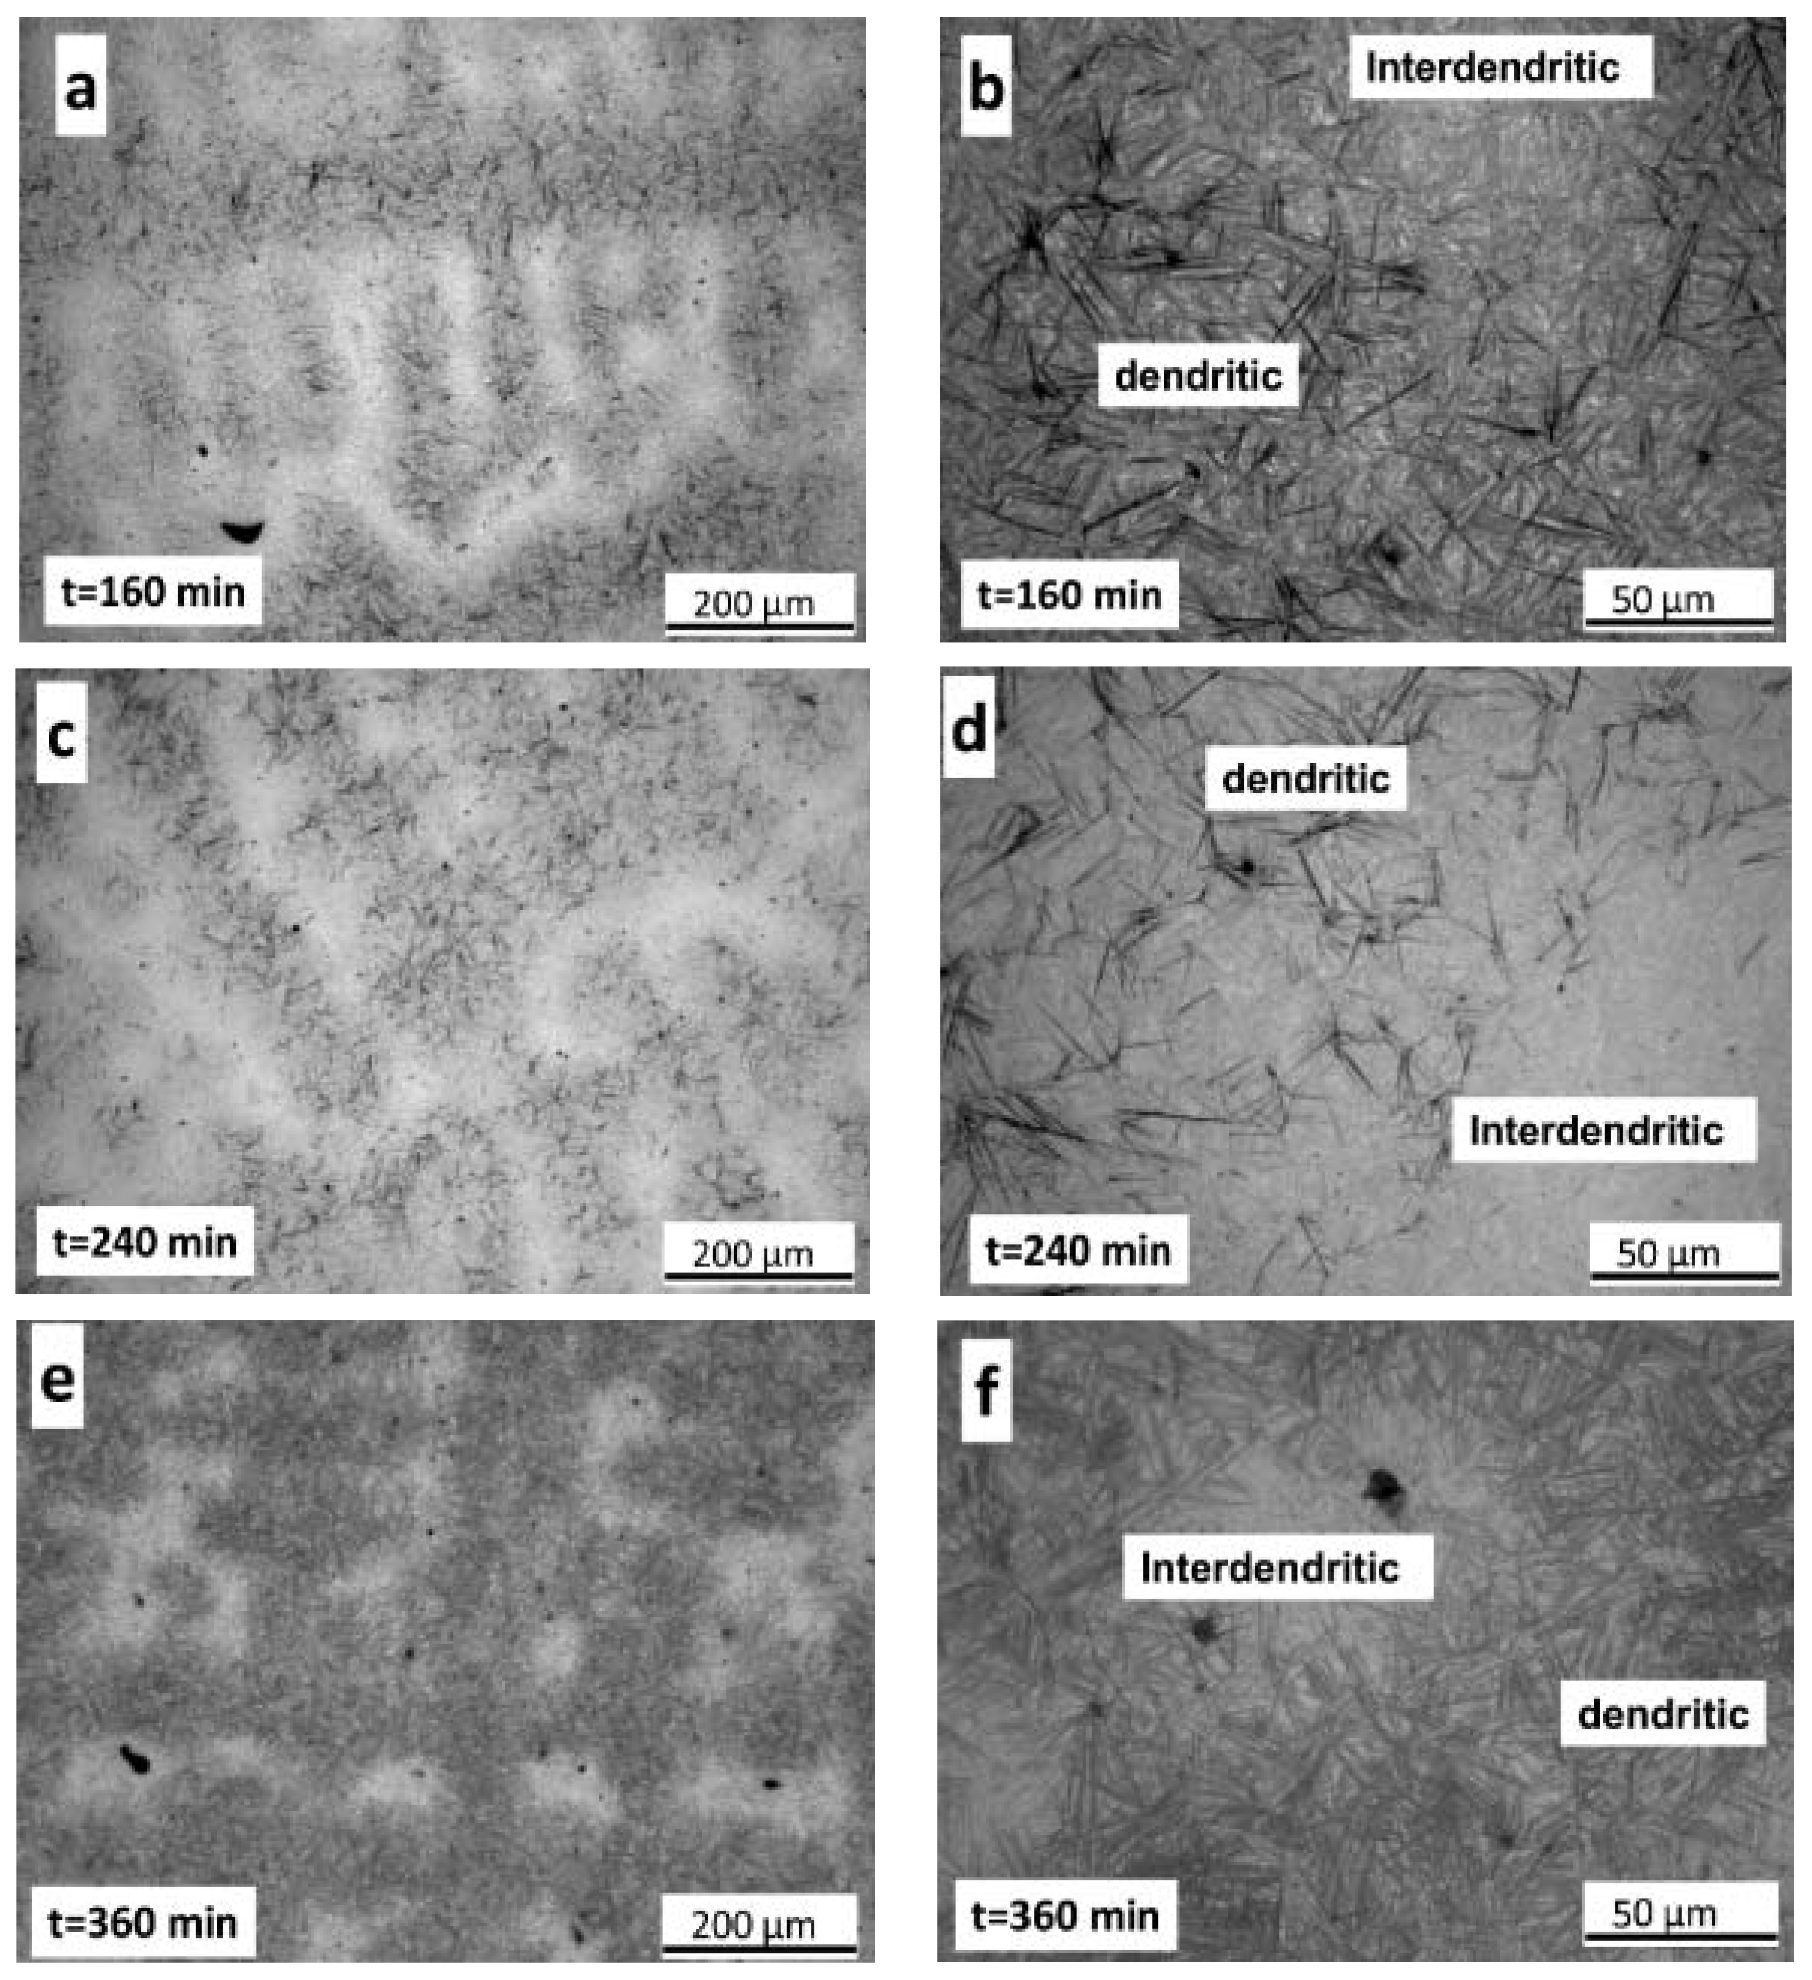
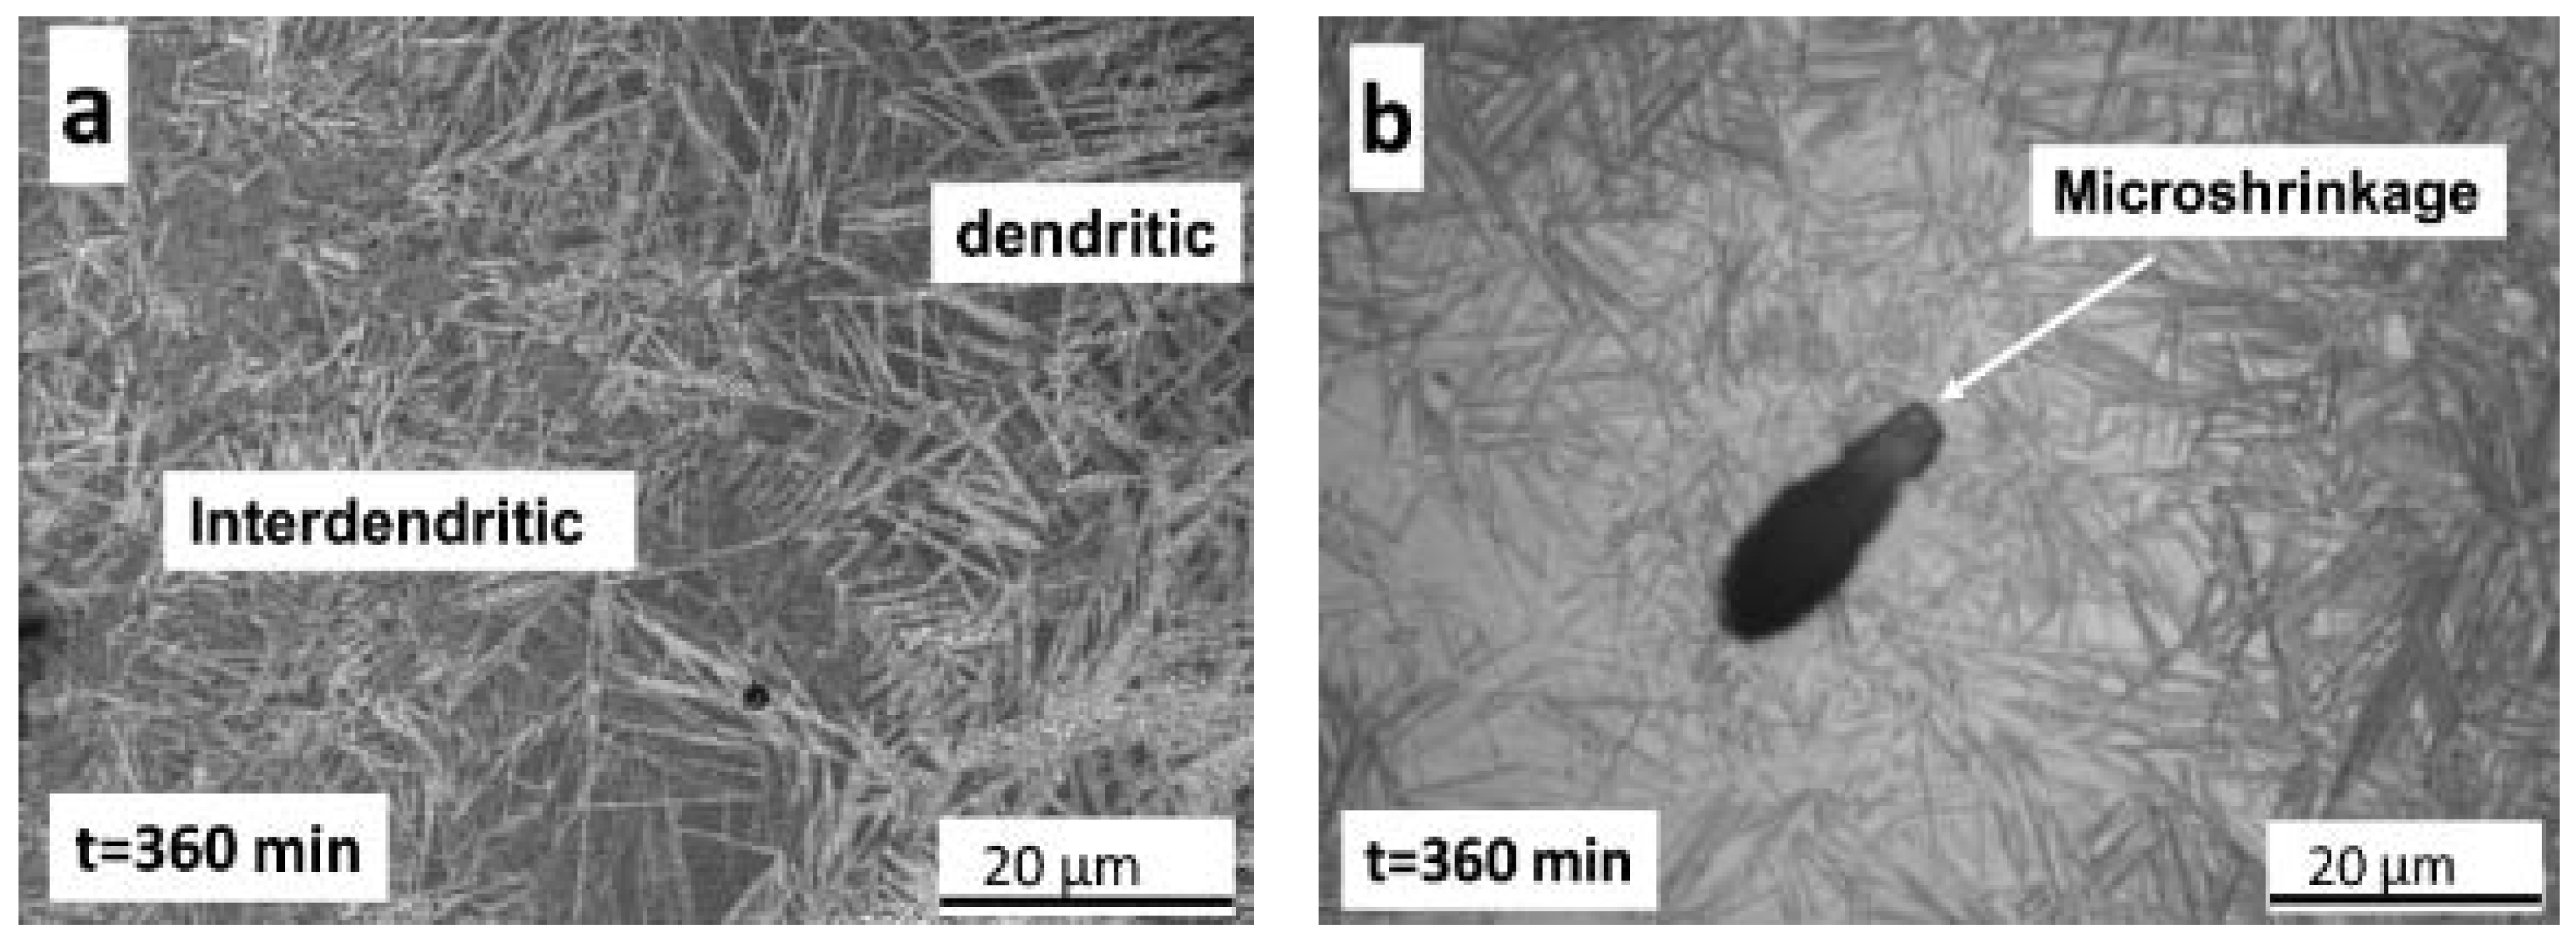
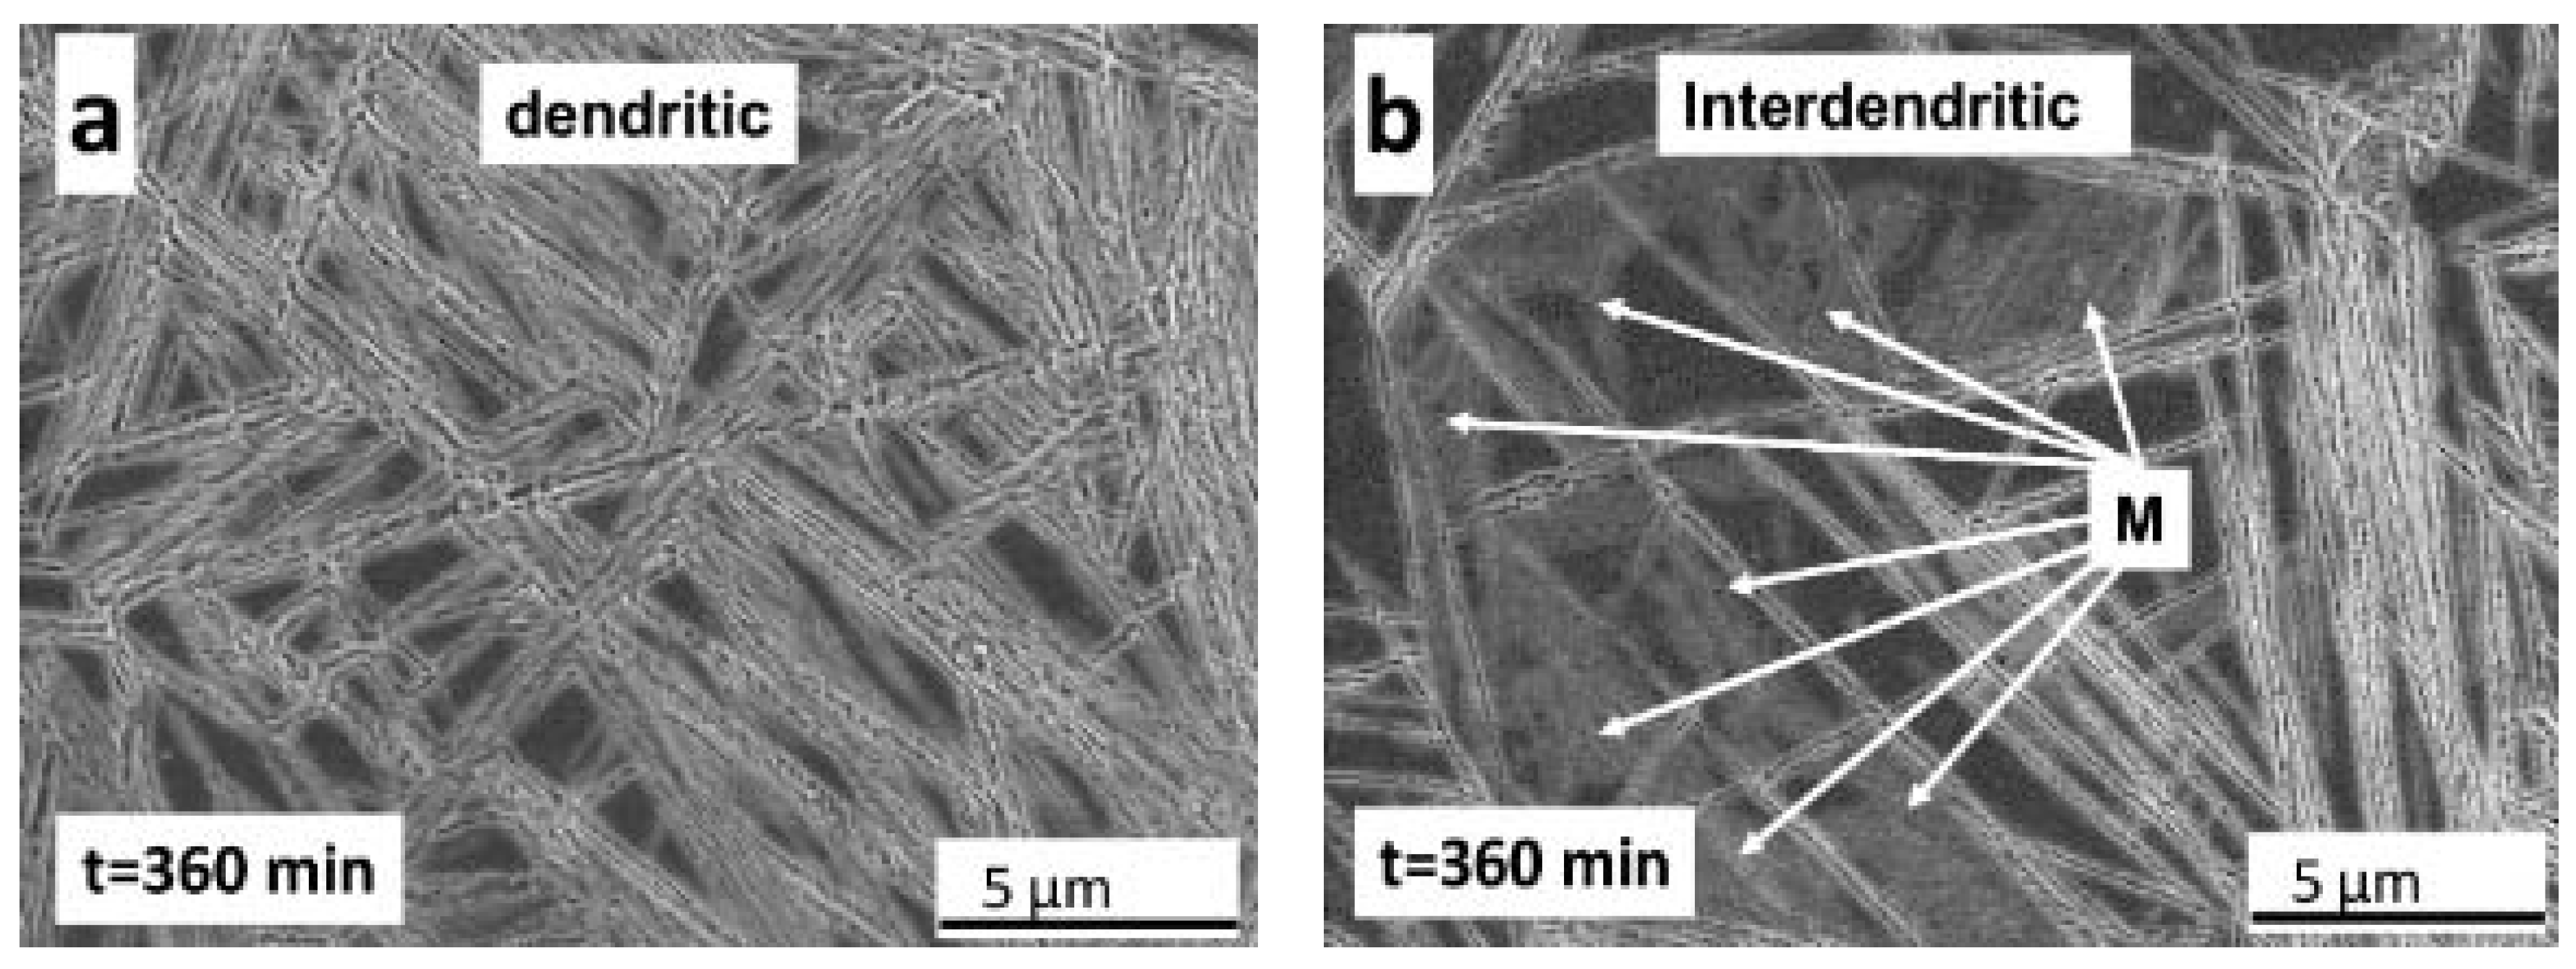
  • Metallographic observations showed that the bainitic transformation from the austenite at 230°C starts after about 80 min, in reasonable correlation with dilatometric results. Differences in transformation rate between dendritic and interdendritic areas were related to the relationship between segregation and the influence of alloying elements on the transformation. In the interdendritic areas, the high Mn content reduced the transformation rate, and thus bainitic ferrite nucleates first, and grows faster in the dendritic zones. Further, it is possible to appreciate that the length of the bainitic ferrite plates is smaller in interdendritic regions, likely due to the presence of smaller austenite grains in these regions of the microstructure compared to dendritic ones.

Author Contributions

Conceptualization, A.D.B., F.G.C. and D.S.-M.; methodology A.D.B., D.S.-M. and F.G.C.; software, A.E.-C., I.T.-C.; validation, A.D.B., D.S.-M. and F.G.C.; formal analysis, A.E.-C., I.T.C.; investigation, A.D.B., A.E.-C., D.S.-M., I.T.-C., J.A.J., and F.G.C.; writing—original draft preparation, A.D.B., D.S.-M. and F.G.C.; writing—review and editing, A.D.B., A.E.-C., D.S.-M., I.T.-C., J.A.J., and F.G.C.; visualization, A.D.B., A.E.-C., D.S.-M., I.T.-C.; supervision, F.G.C. and D.S.M.; project administration, A.D.B., D.S.-M. and F.G.C. All authors have read and agreed to the published version of the manuscript.

Funding

This work has been supported by CONICET, ANPCyT and MINCyT of Argentina [Project PICT 12-1146]. Some of the authors (ITC, DSM, FGC) also acknowledge financial support from the Ministerio de Economia y Competitividad (MINECO) in the form of a Coordinate Project (MAT2016-80875-C3-1-R) and to the Comunidad de Madrid through P2018/NMT4381project. ITC is also grateful for financial support in the form of a fellowship 2016-T2/IND-1693, from the Programme Atracción de Talento Investigador (Conserjería de Educación, Juventud y Deporte, Comunidad de Madrid).

Acknowledgments

Authors are also grateful to Carmen Peña (Mechanical testing lab) for the experimental support with the hardness tests, the Phase Transformations and Microscopy labs from CENIM-CSIC, and the ICTS Centro Nacional de Microscopía Electrónica (CNME) located at the Complutense University of Madrid, for the provision of laboratory facilities (EMPA) and technical support.

Conflicts of Interest

The authors declare no conflict of interest.

References

  1. Degarmo, E.P.; Black, J.T.; Kohser, R.A. Materials and Processes in Manufacturing, 9th ed.; Wiley: Hoboken, NJ, USA, 2003; p. 277. ISBN 0-471-65653-4. [Google Scholar]
  2. ASM Metals Handbook. Casting, Chapter: Casting Advantages. In Applications, and Market Size, 9th ed.; ASM International: Materials Park, OH, USA, 2005; Volume 15, pp. 54–71. [Google Scholar]
  3. The Metalcasting. Available online: http://www.themetalcasting.com/casting-process-advantages.html (accessed on 24 April 2020).
  4. Seppo, L. Treatise on Process Metallurgy. In Industrial Processes; Chapter 1.8—Continuous Casting of Steel; Elsevier Science: Edinburgh, UK, 2014; Volume 3, pp. 373–434. [Google Scholar]
  5. Brown, I. The role of microsegregation in centreline cold cracking of high strength low alloy steel weldments. Scr. Mater. 2006, 54, 489–492. [Google Scholar] [CrossRef]
  6. Won, Y.M.; Yeo, T.J.; Seol, D.J.; Oh, K.H. A new criterion for internal crack formation in continuously cast steels. Metall. Mater. Trans. B 2000, 31, 779–794. [Google Scholar] [CrossRef]
  7. Yansen, H.; Liu, W.; Li, J.; Nie, B.; Zhang, W.; Lui, Z. Microstructural bandings evolution behavior and their effects on microstructure and mechanical property of super-austenitic stainless steel. Mat. Sci. Eng. A 2018, 736, 258–268. [Google Scholar] [CrossRef]
  8. ÅStröm, H.; Loberg, B.; Bengtsson, B.; Easterling, K.E. Hot cracking and micro-segregation in 18–10 stainless steel welds. Met. Sci. 2013, 225–234. [Google Scholar] [CrossRef]
  9. Chojeckia, A.; Telejkoa, I.; Bogaczb, T. Influence of chemical composition on the hot tearing formation of cast steel. Theor. Appl. Frac. Mec. 1997, 27, 99–105. [Google Scholar] [CrossRef]
  10. Katayama, S.; Fujimoto, T.; Matsunawa, A. Correlation among solidification process, microstructure microsegregation and solidification cracking susceptibility in stainless steel weld metals. Trans. JWRI 1985, 14, 123–138. [Google Scholar]
  11. Lippold, J.; Savage, F. Solidification of austenitic stainless steel weldments: Part III-effect of solidification behaviour on hot cracking susceptibility. Weld Res. Suppl. 1982, 12, 288–296. [Google Scholar]
  12. Ennis, B.; Jimenez-Melero, E.; Mostert, R.; Santillana, B.; Lee, P. The role of aluminium in chemical and phase segregation in a TRIP assisted dual phase steel. Acta Mater. 2016, 115, 132–142. [Google Scholar] [CrossRef]
  13. Ahmed, M.; Salam, I.; Hashmi, F.; Khan, A. Influence of banded structure on the mechanical properties of a high-strength maraging steel. J. Mater. Eng. Perform. 1997, 6, 165–171. [Google Scholar] [CrossRef]
  14. Offerman, S.; Van Dijk, N.; Reckveldt, M.; Van der Swaag, S. Ferrite/pearlite band formation in hot rolled medium carbon steel. Mater. Sci. Technol. 2002, 18, 297–303. [Google Scholar] [CrossRef]
  15. Stauffer, A.; Koss, D.; Mc Kirgan, J. Microstructural banding and failure of a stainless steel. Metall. Mater. Trans. A 2004, 35, 1317–1324. [Google Scholar] [CrossRef]
  16. Caballero, F.; Capdevila, C.; García-Junqueda, A.; García de Andrés, C. Evolution of Microstructural Banding during the Manufacturing Process of Dual Phase Steels. Mater. Trans. 2006, 47, 2269–2276. [Google Scholar] [CrossRef] [Green Version]
  17. Ramanzani, A.; Queade, H.; Abbasi, M.; Prahl, H. The effect of martensite banding on the mechanical properties and formability of TRIP steels. Mater. Sci. Eng. A 2016, 651, 160–164. [Google Scholar] [CrossRef]
  18. Penha, R.; Vatavuk, J.; Couto, A.; Pereira, S.; Sousa, S.; Canale, L. Effect of chemical banding on the local hardenability in AISI 4340 steel bar. Eng. Fail. 2015, 53, 59–68. [Google Scholar] [CrossRef]
  19. Verhoeven, J. A Review of Microsegregation Induced Banding Phenomena in Steels. J. Mater. Eng. Perform. 2000, 9, 286–296. [Google Scholar] [CrossRef]
  20. Krauss, G. Solidification, Segregation, and Banding in Carbonand Alloy Steels. Metall. Mater. Trans. B 2003, 34, 781–792. [Google Scholar] [CrossRef]
  21. Tasan, C.; Hoefnagelsb, J.; Geersb, M. Microstructural banding effects clarified through micrographic digital image correlation. Scr. Mater. 2010, 62, 835–838. [Google Scholar] [CrossRef]
  22. Caballero, F.G.; Chao, J.; Cornide, J.; García-Mateo, C.; Santofimia, M.J.; Capdevila, C. Toughness of Advanced High Strength Bainitic Steels. Mater. Sci. Forum. 2010, 638, 118–123. [Google Scholar] [CrossRef]
  23. Edmonds, D.V. Advanced bainitic and martensitic steels with carbide-free microstructures containing retained austenite. Mater. Sci. Forum. 2010, 638, 110–117. [Google Scholar] [CrossRef]
  24. De Moor, E.; Speer, J.G. Bainitic and Quenching and Partitioning Steels. In Automotive Steels; Woodhead Publishing-Elsevier: Cambridge, UK, 2017; Chapter 10; pp. 298–316. [Google Scholar] [CrossRef]
  25. Bhadeshia, H.K.D.H. Modern Bainitic Alloys. In Bainite in Steels-Transformations, Microstructure and Properties, 2nd ed.; IOM Communications Ltd.: London, UK, 2001; Chapter 13; pp. 373–377. [Google Scholar] [CrossRef]
  26. Caballero, F.G.; Bhadeshia, H.K.D.H.; Mawella, K.J.A.; Jones, D.G.; Brown, P. Design of novel high strength bainiticsteels: Part 1. J. Mater. Sci. Technol. 2001, 17, 512–516. [Google Scholar] [CrossRef]
  27. Caballero, F.G.; Bhadeshia, H.K.D.H.; Mawella, K.J.A.; Jones, D.G.; Brown, P. Design of novel high strength bainiticsteels: Part 2. J. Mater. Sci. Technol. 2001, 17, 517–522. [Google Scholar] [CrossRef] [Green Version]
  28. Caballero, F.G.; Bhadeshia, H.K.D.H.; Mawella, K.J.A.; Jones, D.G.; Brown, P. Very strong low temperature bainite. J. Mater. Sci. Technol. 2001, 18, 279–284. [Google Scholar] [CrossRef] [Green Version]
  29. Carmo, D.J.; Días, J.; Santos, D. High cycle rotating bending fatigue property in high strength casting Steel with carbide free bainite. J. Mater. Sci. Technol. 2012, 28, 991–993. [Google Scholar] [CrossRef]
  30. Yoozbashi, M.; Wang, T. Design of a new nanostructures, high-Si bainitic steel with lower cost production. Mater. Des. 2011, 32, 3248–3253. [Google Scholar] [CrossRef]
  31. Basso, A.; Toda-Caraballo, I.; San-Martín, D.; Caballero, F.G. Influence of cast part size on macro- and microsegregation patterns in a high carbon high silicon steel. J. Mater. Sci. Technol. 2020, in press. [Google Scholar] [CrossRef]
  32. Tenaglia, N.; Boeri, R.; Massone, J.; Basso, A. Assessment of the austemperability of high-silicon cast steels through Jominy hardenability tests. J. Mater. Sci. Technol. 2018, 34, 1990–2000. [Google Scholar] [CrossRef]
  33. Garcia-Mateo, C.; Caballero, F.G.; Bhadeshia, H.K.D.H. Acceleration of Low-temperature Bainite. ISIJ Int. 2003, 43, 1821–1825. [Google Scholar] [CrossRef] [Green Version]
  34. Caballero, F.G.; Bhadeshia, H.K.D.H. Very strong bainite. Curr. Opin. Solid State Mater. Sci. 2004, 8, 251–257. [Google Scholar] [CrossRef] [Green Version]
  35. Singh, K.; Singh, A.; Kumar, A. Effect of Prior Austenite Grain Size on the Morphology of Nano-Bainitic Steels. Metall. Mater. Trans. A 2018, 49, 1348–1354. [Google Scholar] [CrossRef]
  36. Lan, L.Y.; Qiu, C.L.W.; Zhao, D.; Gao, X.H.; Du, L.X. Effect of austenite grain size on isothermal bainite transformation in low carbon microalloyed steel. J. Mater. Sci. Technol. 2011, 11, 1657–1663. [Google Scholar] [CrossRef]
  37. Yang, H.S.; Bhadeshia, H.K.D.H. Austenite grain size and the martensite-start temperature. Scr. Mater. 2009, 60, 493–495. [Google Scholar] [CrossRef]
  38. Sourmail, T.; Smanio, V. Determination of Mstemperature: Methods, meaning and influence of ‘slow start’ phenomenon. J. Mater. Sci. Technol. 2013, 29, 883–888. [Google Scholar] [CrossRef]
  39. Tenaglia, N.; Boeri, R.; Basso, A.; Massone, J. Macro and microstructural characterisation of high Si cast steels—Study of microsegregation patterns. Int. J. Cast Metals Res. 2017, 30, 103–111. [Google Scholar] [CrossRef]
  40. García de Andrés, C.; Bartolomé, M.J.; Capdevila, C.; San Martín, D.; Caballero, F.; López, V. Metallographic techniques for the determination of the austenite grain size in medium-carbon microalloyed steels. Mater. Charact. 2001, 46, 389–398. [Google Scholar] [CrossRef] [Green Version]
  41. San Martín, D.; Palizdar, Y.; Cochrane, R.; Brydson, R.; Scott, A. Application of Nomarski differential interference contrast microscopy to highlight the prior austenite grain boundaries revealed by thermal etching. Mater. Charact. 2010, 61, 584–588. [Google Scholar] [CrossRef] [Green Version]
  42. García de Andrés, C.F.; Capdevila, C.; San Martín, D. Revealing austenite grain boundaries by thermal etching: Advantages and disadvantages. Mater. Charact. 2003, 49, 121–127. [Google Scholar] [CrossRef] [Green Version]
  43. Palizdar, Y.; San Martin, D.; Ward, M.; Cochrane, R.C.; Brydson, R.; Scott, A.J. Observation of thermally etched grain boundarieswith the FIB/TEM technique. Mater. Charact. 2013, 83, 28–33. [Google Scholar] [CrossRef] [Green Version]
  44. Mullins, W. Theory of thermal grooving. Int. J. Appl. 1957, 28, 333–339. [Google Scholar] [CrossRef]
  45. Mullins, W. The effect of thermal grooving on grain boundary motion. Acta Metall. 1958, 6, 414–427. [Google Scholar] [CrossRef]
  46. Srinivasan, S.; Trivedi, R. Theory of grain boundary grooving under the combined action of the surface and volume diffusion mechanisms. Acta Metall. 1973, 21, 611–620. [Google Scholar] [CrossRef]
  47. Ohtani, H.; McMahon, J. Modes of fracture in temper embrittled steels. Acta Metall. 1975, 23, 377–386. [Google Scholar] [CrossRef]
  48. Han, J.; Da Silva, A.; Ponge, D.; Raabe, D.; Sang-Min, L.; Young-Kook, L.; Sang-In, L.; Hwang, B. The effects of prior austenite grain boundaries and microstructural morphology on the impact toughness of intercritically annealed medium Mn steel. Acta Mater. 2017, 122, 199–206. [Google Scholar] [CrossRef]
  49. Zhang, X.; Knott, J. Cleavage fracture in bainitic and martensitic microstructures. Acta Mater. 1999, 47, 3483–3495. [Google Scholar] [CrossRef]
  50. Archie, F.; Zaefferer, S. Micro-damage initiation in ferrite-martensite DP microstructures: Astatistical characterization of crystallographic and chemical parameters. J. Mater. Sci. Eng. A 2017, 701, 302–313. [Google Scholar] [CrossRef]
  51. Lianga, J.; Zhaoa, Z.; Di, T.; Nan, Y.; Yang, S.; Liu, W. Improved microstructural homogeneity and mechanical property of medium manganese steel with Mn segregation banding by alternating lath matrix. J. Mater. Sci. Eng. A 2018, 711, 175–181. [Google Scholar] [CrossRef]
  52. Brown, L.; Kirkaldy, J. Carbon diffusion in dilute ternary austenites. Trans. Metall. Soc. AIME 1964, 230, 223–230. [Google Scholar] [CrossRef]
  53. LEE, S.J.; Matlock, D.; Van, T. An Empirical Model for Carbon Diffusion in Austenite Incorporating Alloying Element Effects. ISIJ Int. 2011, 51, 1903–1911. [Google Scholar] [CrossRef] [Green Version]
  54. Zhukov, A.A.; Krishtal, M.A. Thermodynamic activity of alloy components. Met. Sci. Heat Treat. 1975, 17, 626–633. [Google Scholar] [CrossRef]
  55. Rowan, O.K.; Sisson, R.D. Effect of Alloy Composition on Carburizing Performance of Steel. J. Phase Equilib. Diffus. 2009, 30, 235–241. [Google Scholar] [CrossRef]
  56. Babu, S.S.; Bhadeshia, H.K.D.H. Diffusion of carbon in substitutionally alloyed austenite. J. Mater. Sci. Lett. 1995, 14, 314–316. [Google Scholar] [CrossRef] [Green Version]
  57. Bain, E.C. Alloying Elements in Unhardened Steels. In Alloying Elements in Steels; ASM: Cleveland, OH, USA, 1939; Chapter 3; pp. 59–99. [Google Scholar]
  58. Pace Technologies. Available online: https://www.metallographic.com/Metallographic-Etchants/Metallography-Etchants.htm (accessed on 26 April 2020).
  59. ASM Metals Handbook. Metallographic Techniques. In Metallography and Microstructures; Vander Voort, G.F., Ed.; ASM International: Novelty, OH, USA, 1992; Volume 9, p. 533. [Google Scholar]
  60. Cahn, J. The impurity-drag effect in grain boundary motion. Acta Metall. Mater. 1962, 10, 789–798. [Google Scholar] [CrossRef]
  61. Hillert, M. Solute drag, solute trapping and diffusional dissipation of Gibbs energy. Acta Mater. 1999, 47, 4481–4505. [Google Scholar] [CrossRef]
  62. Fujiyama, N.; Nishibata, T.; Seki, A.; Hirata, H.; Kojima, K.; Ogawa, K. Austenite grain growth simulation considering the solute-drag effect and pinning effect. Sci. Technol. Adv. Mater. 2017, 18, 88–95. [Google Scholar] [CrossRef]
  63. Babu, S.; Ivanov, D.; Porter, D. Influence of Microsegregation on the Onset of the Martensitic Transformation. ISIJ Int. 2019, 59, 169–175. [Google Scholar] [CrossRef]
  64. Van gen Hassend, F.; Weber, S. Influence of Chemical Inhomogeneities on Local Phase Stabilities and Material Properties in Cast Martensitic Stainless Steel. Steel Res. Int. 2019, 1900481. [Google Scholar] [CrossRef] [Green Version]
  65. Huang, Q.; Volkova, O.; Biermann, H.; Mola, J. Dilatometry Analysis of Dissolution of Cr-Rich Carbides in Martensitic Stainless Steels. Metall. Mater. Trans. A 2017, 48, 5771–5777. [Google Scholar] [CrossRef]
  66. Van Bohemen, S.M.C. The nonlinear lattice expansion of iron alloys in the range100–1600 K. Scr. Mater. 2013, 69, 315–318. [Google Scholar] [CrossRef]
  67. Andrews, K.W. Empirical formulae for calculation of some trans-formation temperatures. J. Iron Steel Inst. 1965, 203, 721–727. [Google Scholar]
  68. Kung, C.Y.; Rayment, J. An examination of the validity of existing empirical formulae for the calculation of Mstemperature. Metall. Mater. Trans. A 1982, 13, 328–331. [Google Scholar] [CrossRef] [Green Version]
  69. Sourmail, T.; Garcia-Mateo, C. Critical assessment of models for predicting the Mstemperature of steels. Comput. Mater. Sci. 2005, 34, 323–334. [Google Scholar] [CrossRef] [Green Version]
  70. Capdevilla, C.; Caballero, F.G.; Garcia de Andrés, C. Determination of ms temperature in steels: A bayesian neural network model. ISIJ Int. 2002, 42, 894–902. [Google Scholar] [CrossRef] [Green Version]
  71. Van Bohemen, S. Bainite and martensite start temperaturecalculated with exponential carbon dependence. J. Mater. Sci. Technol. 2012, 28, 487–495. [Google Scholar] [CrossRef]
  72. Caballero, F.G.; Álvarez, L.F.; Capdevila, C.; García de Andrés, C. The origin of splitting phenomena in the martensitic transformation of stainless steels. Scr. Mater. 2003, 49, 315–320. [Google Scholar] [CrossRef] [Green Version]
  73. Guimaraes, J.; Gomes, J. A metallographic study of the influence of the austenite grain size on martensite kinetics in Fe-31.9Ni-0.02C. Acta Metall. 1978, 26, 1571–1596. [Google Scholar] [CrossRef]
  74. García-Junceda, A.; Capdevila, C.; Caballero, F.G.; García de Andrés, C. Dependence of martensite start temperature on fine austenite grain size. Scr. Mater. 2008, 58, 134–137. [Google Scholar] [CrossRef] [Green Version]
  75. Nyyssönen, T.; Peura, P.; Kuokkala, V.T. Crystallography, morphology, and martensite transformation of prior austenite in intercritically annealed high-aluminum steel. Metall. Mater. Trans. A 2018, 49, 6426–6441. [Google Scholar] [CrossRef]
  76. Humphreys, F. Review grain and subgraincharacterization by electron backscatter diffraction. J. Mater. Sci. 2001, 36, 3833–3854. [Google Scholar] [CrossRef]
  77. Thomas, G.; Speer, J.; Matlock, D.; Michael, J. Application of electron backscatter diffraction techniques to quenched and partitioned steels. Microsc. Microanal. 2011, 17, 368–373. [Google Scholar] [CrossRef]
  78. Carpenter, H.C.H.; Tamura, S. Experiments on the production of large copper crystals. Proc. R. Soc. Lond. Ser. AContain. Papers Math.Phys. Charact. 1926, 13, 28–43. [Google Scholar] [CrossRef]
  79. Nishiyama, Z. Martensitic Transformation, 1st ed.; Academic Press: Cambridge, MA, USA, 1978; ISBN 9780323148818. [Google Scholar]
  80. Kurdjumow, G.; Sachs, G. Über den mechanismus der stahlhärtung. Z. Phys. 1930, 64, 325–343. [Google Scholar] [CrossRef]
  81. Pham, A.; Ohba, T.; Morito, S.; Hayashi, T. Effect of Chemical Composition on Average γ/α’Orientation Relationship in Carbon and Low Alloy Steels. Appl. Mater. Today 2015, 2, S663–S666. [Google Scholar] [CrossRef]
  82. Smallman, R.E.; Ngan, A.H.W. Steel Transformations. In Modern Physical Metallurgy; Smallman, R.E., Ngan, A.H.W., Eds.; Butterworth-Heinemann: Oxford, UK, 2014; Chapter 12; pp. 473–498. ISBN 9780080982236. [Google Scholar]
  83. Du, C.; Hoefnagels, J.; Vaes, R.; Geers, M. Block and sub-block boundary strengthening in lath martensite. Scr. Mater. 2016, 116, 117–121. [Google Scholar] [CrossRef] [Green Version]
  84. Karthikeyan, T.; Manmath, K.D.; Vijayalakshmi, M. Estimation of martensite feature size in a low-carbon alloy steel by microtexture analysis of boundaries. Micron 2015, 68, 77–90. [Google Scholar] [CrossRef]
  85. Hidalgo, J.; Santofimia, M.J. Effect of prior austenite grain size refinement by thermal cycling on the microstructural features of as-quenched lath martensite. Metall. Mater. Trans. A 2016, 47, 5288–5301. [Google Scholar] [CrossRef] [Green Version]
  86. Gyhlesten Back, J.; Engberg, G. Investigation of parent austenite grains from martensite structure using EBSD in a wear resistant steel. J. Mater. Sci. 2017, 10, 453. [Google Scholar] [CrossRef]
  87. Morito, S.; Saito, H.; Ogawa, T.; Furuhara, T.; Maki, T. Effect of austenite grain size on the morphology and crystallography of lath martensite in low carbon steels. ISIJ Int. 2005, 45, 91–94. [Google Scholar] [CrossRef] [Green Version]
  88. Bhadeshia, H.K.D.H. Thermodynamics. In Bainite in Steels-Transformations, Microstructure and Properties, 2nd ed.; IOM Communications Ltd.: London, UK, 2001; Chapter 5; pp. 122–128. [Google Scholar] [CrossRef]
  89. Bhadeshia, H.K.D.H. Bainite: The Incomplete-Reaction phenomenon and the approach to equilibrium. In International Solid-Solid Phase Transformations Conference; The Metallurgical Society of the AIME: Warrendale, PA, USA, 1981; pp. 1041–1048. [Google Scholar]
  90. Garcia-Mateo, C.; Caballero, F.; Capdevila, C.; Garcia de Andres, C. Estimation of dislocation density in bainitic microstructures using high-resolution dilatometry. Scr. Mater. 2009, 61, 855–858. [Google Scholar] [CrossRef] [Green Version]
  91. Caballero, F.G.; Garcia-Mateo, C.; Santofimia, M.; Garcia de Andres, C. Time-Temperature-Transformation Diagram within the Bainitic Temperature Range in a Medium Carbon Steel. Mater. Trans. 2004, 12, 3272–3281. [Google Scholar] [CrossRef] [Green Version]
  92. Eres-Castellanos, A.; Morales-Rivas, L.; Latz, A.; Caballero, F.; Garcia-Mateo, C. Effect of ausforming on the anisotropy of low temperature bainitic transformation. Mater. Charact. 2018, 145, 371–380. [Google Scholar] [CrossRef]
  93. Bhadeshia, H.K.D.H. Bainite in Steels: Theory and Practice, 3rd ed.; CRC Press: Boca Raton, FL, USA, 2015; pp. 117–131. [Google Scholar] [CrossRef]
  94. Rementeria, R.; Jimenez, J.A.; Allain, S.; Poplawasky, J.D.; Guo, W.; Urones-Garrote, E.; Garcia-Mateo, C.; Caballero, F.G. Quantitative assessment of carbon allocation anomalies in low temperature bainite. Acta Mater. 2017, 133, 333–345. [Google Scholar] [CrossRef]
  95. CeladaCasero, C.; San-Martin, D. Austenite Formation in a Cold-Rolled Semi-austenitic Stainless Steel. Metall. Mater. Trans. A 2014, 45, 1767–1777. [Google Scholar] [CrossRef] [Green Version]
  96. Bhadeshia, H.K.D.H. Introduction. In Bainite in Steels-Transformations, Microstructure and Properties, 2nd ed.; IOM Communications Ltd.: London, UK, 2001; Chapter 1; pp. 2–16. [Google Scholar] [CrossRef]
  97. Jiang, T.; Liu, H.; Guo, J.; Liu, Y. Effect of austenite grain size on transformation of nanobainite and its mechanical properties. Mater. Sci. Eng. A 2016, 666, 207–213. [Google Scholar] [CrossRef]
Figure 1. Drawing of a poured keel block. Dilatometry cylindrical samples have been obtained from second level of the keel block legs (P1 and P2 positions). The location of the M-Sample used to characterize the microsegregation and solidification structure has been pinpointed by an arrow.
Metals 10 00574 g001
Figure 2. Schematic view of the heat treatments schedules (temperature vs time) used in this work.
Metals 10 00574 g002
Figure 3. (a,b) LOM and (c,d) FEG-SEM micrographs of the as-cast microstructures obtained at different magnifications, showing a fully pearlitic structure. Black areas in (d), pinpointed by arrows are non-metallic inclusions. Microstructure etched with Nital 2%.
Metals 10 00574 g003
Figure 4. Solidification structure. Image (a) is a color micrograph corresponding to the zone under study; (b), (c) and (d) are the EPMA maps of the same zone for Si, Mn and Cr, respectively.
Metals 10 00574 g004
Figure 5. LOM micrographs of the prior austenite grain boundaries revealed by thermal etching. (a) Bright field image of the microstructure at a low magnification; (b) Micrograph corresponding to the red-square in image (a), using Nomarski microscopy (DIC); (c,d) images of interdendritic zones (richer in solute) where non-metallic inclusions and microshrinkage are present and smaller grains can be observed. (e) Image of a dendritic zone (poorer in solute) showing bigger grains.
Metals 10 00574 g005
Figure 6. Prior austenite grain size (PAGS) distribution.
Metals 10 00574 g006
Figure 7. Temperature evolution of the mass fraction of the ferrite (α), austenite (γ) and cementite (θ) phases for the nominal composition. Simulations performed using the Thermocalc® software. Assuming quasi-equilibrium heating conditions A1-lower and A1-upper would set the start and end of ferrite into austenite transformation. ACM sets the temperature at which cementite dissolution is complete and a fully austenitic microstructure is obtained. The inset provides a table with the transformation temperatures for the three EMPA compositions (Table 2).
Metals 10 00574 g007
Figure 8. Micrographs of the as-quenched microstructure: (a) LOM and (b) FEG-SEM. Microstructures have been etched with Vilella reagent. The presence of undissolved cementite in the interdendritic regions (small black points in white circle in Figure 8a and light white/grey ellipsoidal particles in Figure 8b) can be observed.
Metals 10 00574 g008
Figure 9. Characteristic dilatometry plot showing the temperature evolution of the relative change in length, during quenching at 50 °C/s, for the steel under investigation. The approximate location of the Ms temperature (138 °C) has been pinpointed by an arrow. In this plot symbols α and α’ stand for austenite and martensite, respectively.
Metals 10 00574 g009
Figure 10. (a) Representative LOM micrographs of the as-quenched microstructure etched with Nital 2%; (b) higher magnification micrograph showing the dendritic (dark) and the interdendritic (lighter) zones. Non-metallic inclusions appear as dark round spots.
Metals 10 00574 g010
Figure 11. (a,b) Ferrite IPFZ maps for dendritic and interdendritic regions, respectively, where the prior austenite grains boundaries (PAGB) are represented by black lines, and the red lines are the twin boundaries. Note that all pixels seem to be ferritic as the data has been subjected to noise reduction techniques for a cleaner representation. (c,d) EBSD misorientation maps for dendritic and interdendritic regions, respectively; (e) Frequency chart showing the frequency of the different types of boundaries characteristic of sub-blocks, blocks and packets; (f) Frequency histogram showing the ferrite block equivalent diameter frequency for both dendritic and interdendritic areas.
Metals 10 00574 g011
Figure 12. Time dependent evolution of the relative change in length during an austempering treatment at 230 °C for 360 min.
Metals 10 00574 g012
Figure 13. LOM and FEG-SEM micrographs corresponding to a sample austempered at 230 °C for 80 min. (a), (b), (e), (f): etched with Nital 2%. (c), (d): corresponding to dendritic regions, etched with Vilella’s regent. Symbol αb stands for bainitic ferrite. A few plates of bainite, martensite and retained austenite compose the microstructure.
Metals 10 00574 g013
Figure 14. LOM micrographs corresponding to a sample austempered at 230 °C for 160 (a,b), 240 (c,d) and 360 (e,f) min. Microstructures etched with Nital 2%.
Metals 10 00574 g014
Figure 15. (a) FEG-SEM and (b) LOM micrographs corresponding to a sample austempered at 230 °C for 360 min. Etched with Nital 2% showing bainitic ferrite plates with different lengths.
Metals 10 00574 g015
Figure 16. FEG-SEM micrographs corresponding to sample austempered at 230 °C for 360 min. (a) Dendritic region, (b)Interdendritic region. M symbol stands for the martensitic phase. Microstructure etched with Nital 2%.
Metals 10 00574 g016
Table 1. Chemical composition of the manufactured steel (wt. %).
CSiMnCrSPFe
0.82.251.051.10.010.013Balance
Table 2. Maximum and minimum concentration values (wt. %) of each element obtained from EPMA maps.
ElementSiMnCr
Concentration (wt. %)
Minimum value (Dendritic/FTF region)-Poor zone1.60.80.7
Maximum value (Interdendritic/LTF region)-Rich zone2.61.61.3
[X] (average or nominal value-EPMA)2.11.21.0
Variation regarding average value±24%±33%±30%
Overall value measured by X-Ray Fluorescence spectrometry2.21.21.0
Table 3. Area fractions obtained for dendritic and interdendritic regions by EBSD analysis. Area fractions obtained after data post-processing (by removing data points which had been wrongly indexed), is added.
EBSD Area FractionsNon-IndexedAusteniteMartensite
Dendritic regionAs-scanned0.220.080.70
After post-processing0.220.020.76
Interdendritic regionAs-scanned0.260.070.67
After post-processing0.260.020.73
Table 4. Contents of retained austenite, c/a ratio and lattice parameter values for BCC/BCT and FCC structures, and hardness values for samples austempered for 80, 160, 240 and 360 min.
Austempering Time (min)80160240360
Retained austenite content0.29 ± 0.020.30 ± 0.020.29 ± 0.020.40 ± 0.02
a lattice parameter for BCC/BCT (nm)0.2861230.2857550.2862750.285096
c lattice parameter for BCT (nm)0.2896920.2884650.2887570.287541
c/a ratio for BCC/BCT structure1.0124731.0094831.0086691.008576
a lattice parameter for FCC (nm)0.3598590.3599270.3601730.360072
Hardness (HV5)830 ± 8815 ± 8807 ± 8627 ± 6

