Article

Numerical Simulation and Multi-Objective Optimization of Partition Cooling in Hot Stamping of the Automotive B-Pillar Based on RSM and NSGA-II

1
School of Material Science and Engineering, Lanzhou University of Technology, Lanzhou 730050, China
2
School of Materials Science and Technology, Jiangsu University, Zhenjiang 212013, China
*
Author to whom correspondence should be addressed.
Both authors contributed equally to this work.
Metals 2020, 10(9), 1264; https://doi.org/10.3390/met10091264
Submission received: 25 August 2020 / Revised: 15 September 2020 / Accepted: 15 September 2020 / Published: 18 September 2020

Abstract

:
In this study, the simulation and optimization of the partition cooling in the hot stamping process was carried out for an automotive B-pillar through minimizing the maximum thickening rate and the maximum thinning rate located in the rapid and slow cooling zones. The optimization was implemented by investigating the process parameters such as friction coefficient, sheet austenitizing temperature, holding time, heating zone temperature, the upper binder force and the lower binder force. The optimal Latin hypercube design (OLHD), the response surface methodology (RSM) and the non-dominated sorting genetic algorithm (NSGA-II) were combined to establish the relationship between process parameters and form quality objectives. After multi-objective optimization, the maximum thickening rate and the maximum thinning rate of the slow cooling zone and rapid cooling zone were 11.1% and 12.4%, 4.7% and 7.1%, respectively. Afterwards, the simulation was performed according to the optimized parameter combinations to analyze the temperature field, microstructure, tensile strength, hardness, thickening rate and thinning rate, and forming quality. Moreover, the hot stamping test and experimental results showed that the microstructure of the ferrite and pearlite structure was uniformly distributed in the slow cooling zone, and its tensile strength reached 680 MPa, the elongation was 11.4% and the hardness was 230.56 HV, while the lath martensite structure was obtained in the rapid cooling zone, with tensile strength of up to 1390 MPa, elongation of about 7.0% and hardness reaching 478.78 HV. The results of thickness, microstructure, tensile strength and the hardness test correspond well with the simulation results.

1. Introduction

Studies have shown that the energy consumption of the automotive body is reduced by 6–8% for every 10% reduction in vehicle body quality [1,2,3]. Therefore, reducing the weight of the vehicle without reducing the overall performance can effectively reduce fuel consumption and pollution emissions. Ultra-high strength steel met the requirements of automobile safety performance and lightweight development in recent years, which has been widely used in automobile parts manufacturing [4,5]. However, the deformation ability of ultra-high strength steel at room temperature is very poor, and it is easy to produce forming quality defects such as cracking and springback [6,7]. Meanwhile, new challenges have been encountered in the design of key collision structures for automobiles: different yield strength needs to be designed in different positions, such as the A-pillar, B-pillar and C-pillar, to withstand the pressure of the roof, high strength and rigidity in the upper side, while to protect the safety of the occupants when the car is in a side collision, high shaping and toughness are required in the lower side [8]. This means the automotive industry urgently needs to design parts with performance gradients to meet the requirements of lightweight and partition performance at the same time [9,10].
Currently, the main forming technologies for designing stamped parts with partition performance include tailor rolling blank (TRB) technology, tailor welded Blank (TWB) technology, tailor patch blank (TPB) technology, tailor tempering process (TTP) technology, tailor heating process (THP) technology and tailor cooling process (TCP) technology [11].
TCP has become a hot research topic and has received increasing attention for its simple technology and wide applicability. TCP is a new forming technology that combines hot stamping and heat treatment technology to form stamped parts with partition property. The process is the heating of the non-plastically deformed sheet material (direct hot stamping) or cold-formed parts (indirect hot stamping) to above the austenitizing temperature, holding it for a long time to ensure that the austenite is completely uniform, and then quickly completing the stamping. Finally, the stamped parts are cooled at different cooling rates in different zones to obtain parts with different structures and properties [12,13].
A great deal of research has been carried out around TCP in recent years. Mori et al. [14] changed the contact condition between the local area of sheet metal and the die, and high strength occurred in the contacted part due to being quenched, while the non-contacted part was low strength because it was not quenched. Mori et al. [15] also developed local heating of bypass resistance during hot stamping, where the sheet metal was partially heated by a bypass resistor, and then hot stamped. There was no martensitic transformation in the local heating area, allowing for the obtention of partially softened tissue. George et al. [16] designed segmented dies with partial heating and cooling zones to control sheet metal cooling at different cooling rates after hot stamping to obtain a B-pillar with partition properties. The Vickers hardness was 488 HV and 234 HV in the cooling and heating areas after hot stamping, respectively. The tensile strength of the rapid cooling zone was reduced by 49%, and the tensile strength of the slow cooling zone was increased by 84%, which proved the purpose of partition performance. Ota et al. [17] set up an air compression cooling device in the mold in order to solve the problem of cracking in the hot stamping process of hat-shaped parts. The local formability was improved by adjusting process parameters, and they produced trial parts with improved local performance. Wang et al. [18] selected 22MnB5 of ultra-high-strength steel as their research object to study the influence of mold temperature and process parameters on the cooling rate and mechanical properties of sheet metal. Then, the samples were tested for performance and microstructure analysis. The results showed that the temperature difference between die and sheet metal was reduced by increasing the die temperature, resulting in a reduction in the sheet metal cooling rate. Furthermore, the martensite transformation was avoided, and more bainite structures were obtained, which make the extension performance better, while the tensile strength and hardness were reduced. Yang et al. [19] analyzed the non-uniform temperature field and hot forming process by the simulation method. Based on the metallographic test and tensile test, it was concluded that the martensite structure was obtained in the rapid cooling area, in which tensile strength can reach 1500 MPa, and the elongation is about 7.0%. However, while the tensile strength of ferrite and pearlite is only 680 MPa, the elongation is 11.2%. It was proved that the method of selective cooling can realize the regional distribution of materials and the different microstructure of materials, and reflect different properties. Mu et al. [20] studied the influence of process parameters on the tensile strength and elongation of the forming parts in hot stamping process. Combined with finite element simulation and the non-dominated sorting genetic algorithm (NSGA)-II optimization algorithm, the forming quality in the process of hot stamping was optimized, and the stamped parts with partition properties were produced. Wang et al. [21] studied the influence of influencing factors on the crashworthiness of the front longitudinal beam and optimized it by NSGA-II. The results showed that the method significantly improved the formability and crashworthiness.
To sum up, the forming quality, such as microstructure, mechanical properties etc. of stamped parts with partition properties is controlled by many factors. However, the influence of influencing factors on specific forming parts is different, and the research-oriented to specific products on multi-objective optimization of partition cooling in hot stamping is just beginning. It is necessary to study the forming quality influencing factors and multi-objective optimization of partition cooling in the hot stamping process.
Therefore, in order to realize the partition performance of the automotive B-pillar, the partition cooling after hot stamping is adopted. Although the springback of the B-pillar is small after hot stamping, the thickness change has further optimization space. The method of “finite element simulation + optimal Latin hypercube design (OLHD) + the response surface methodology (RSM) + multi-objective optimization” is used to optimize the influencing factors of thickening and thinning, and the influence of influencing factors on forming quality is analyzed to verify the validity of the approximate model and the accuracy of multi-objective optimization. Afterwards, the simulation is performed according to the optimized parameter combinations to analyze the temperature field, microstructure, tensile strength, hardness, thickening rate and thinning rate, and its quality. Finally, the hot stamping test of the B-pillar and the mechanical properties and microstructure test are performed, which correspond well with the optimized simulation results and verify the feasibility of preparing the parts with performance gradient by regional hot stamping.

2. Materials and Methods
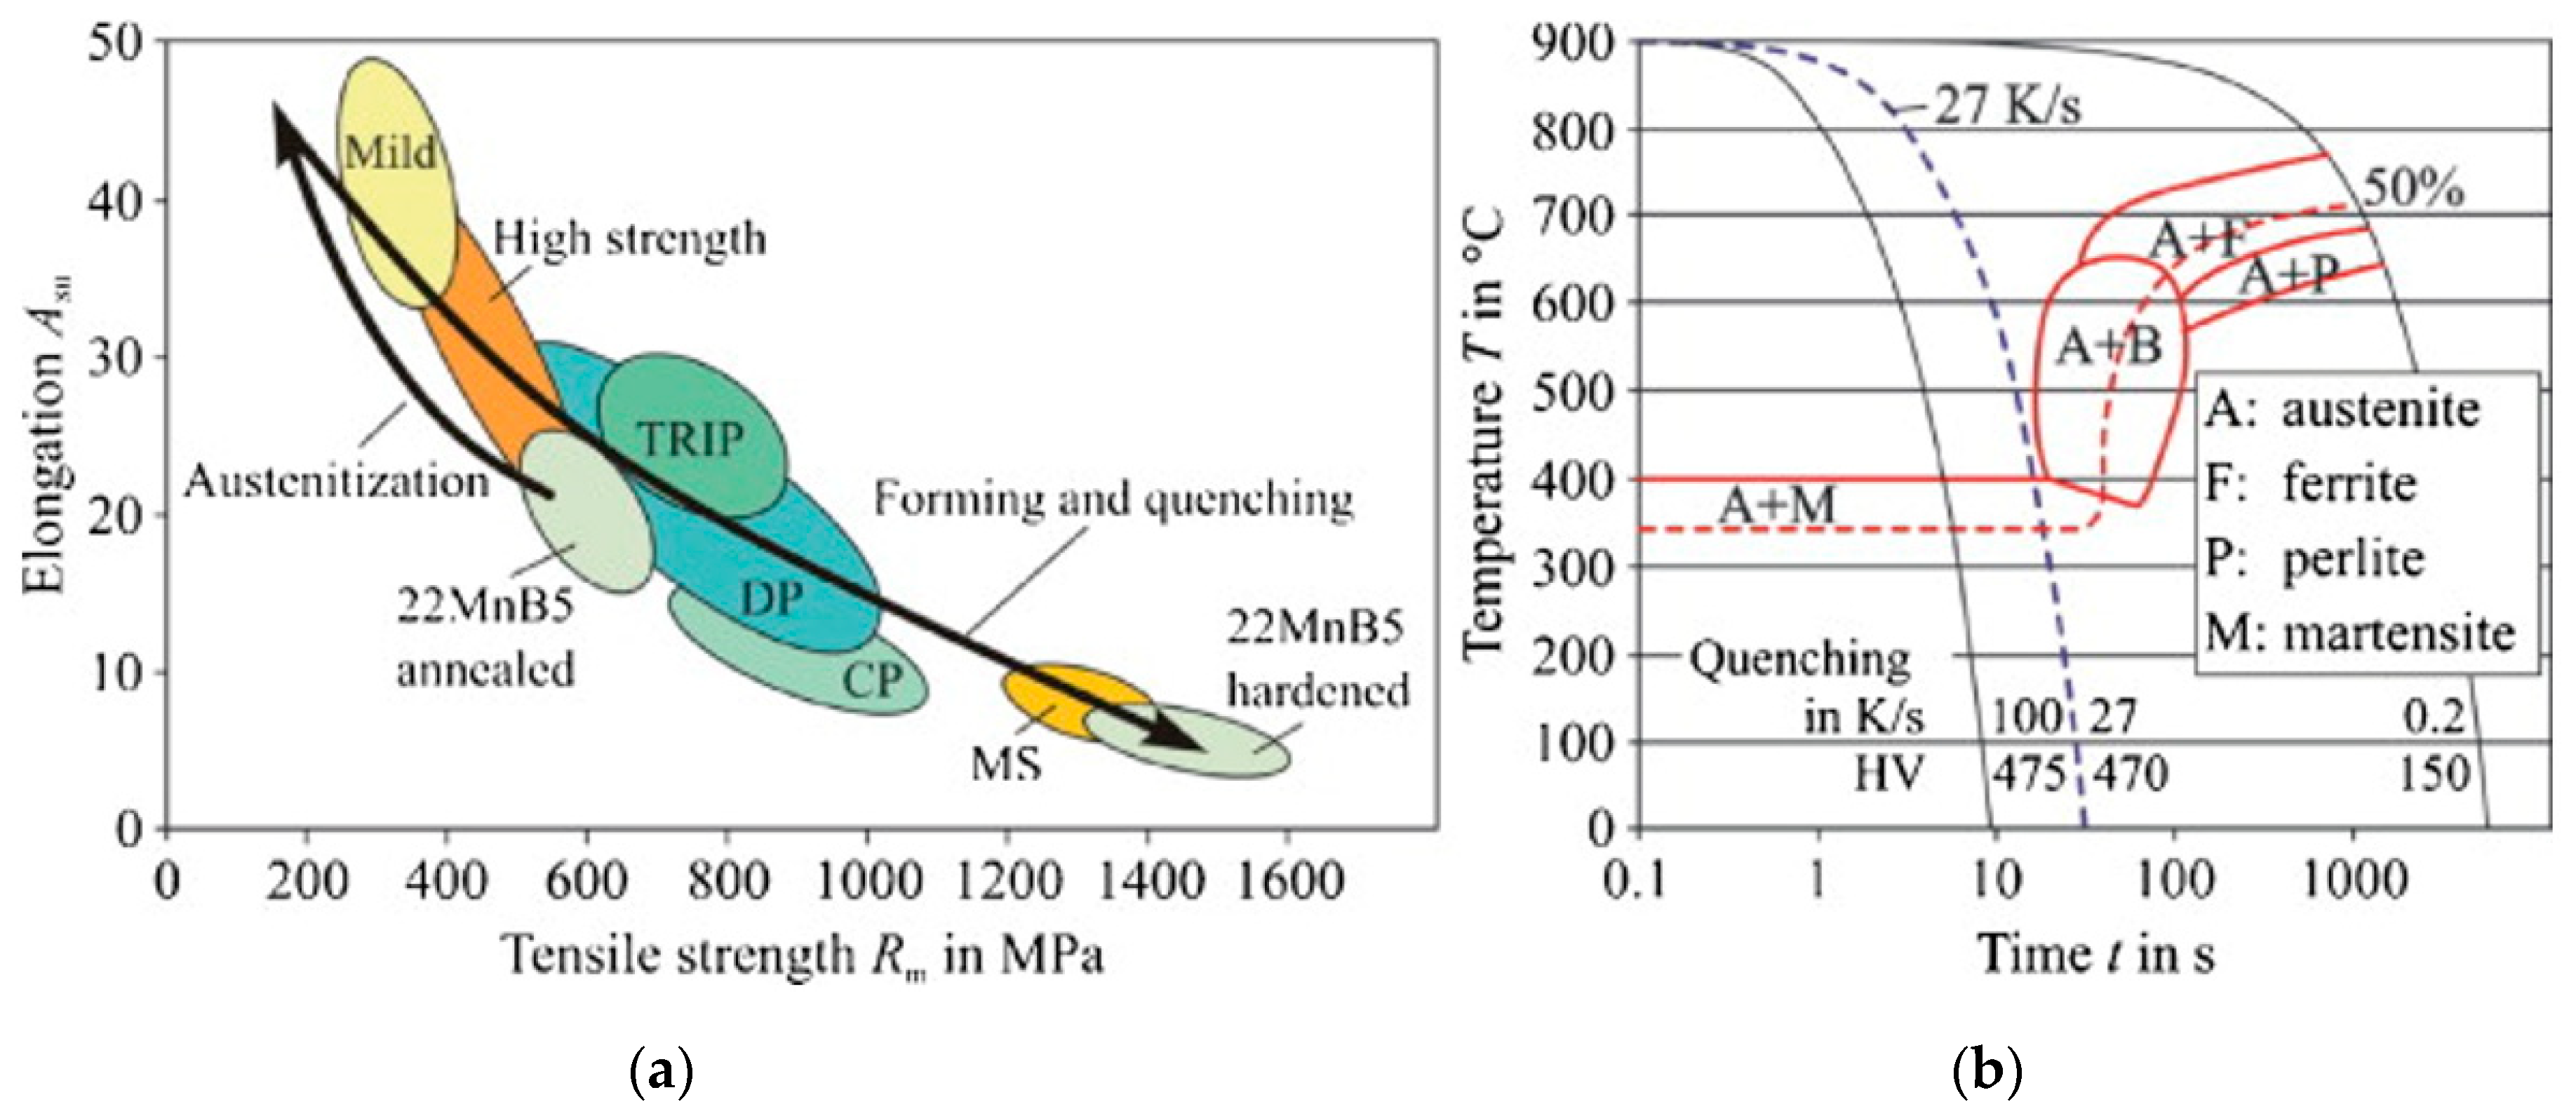
2.1. Materials

The material of the B-pillar is the widely used ultra-high strength steel 22MnB5. The initial thickness is 1.5 mm, the chemical composition is shown in Table 1, and the physical properties at different temperatures are shown in Table 2 [22].

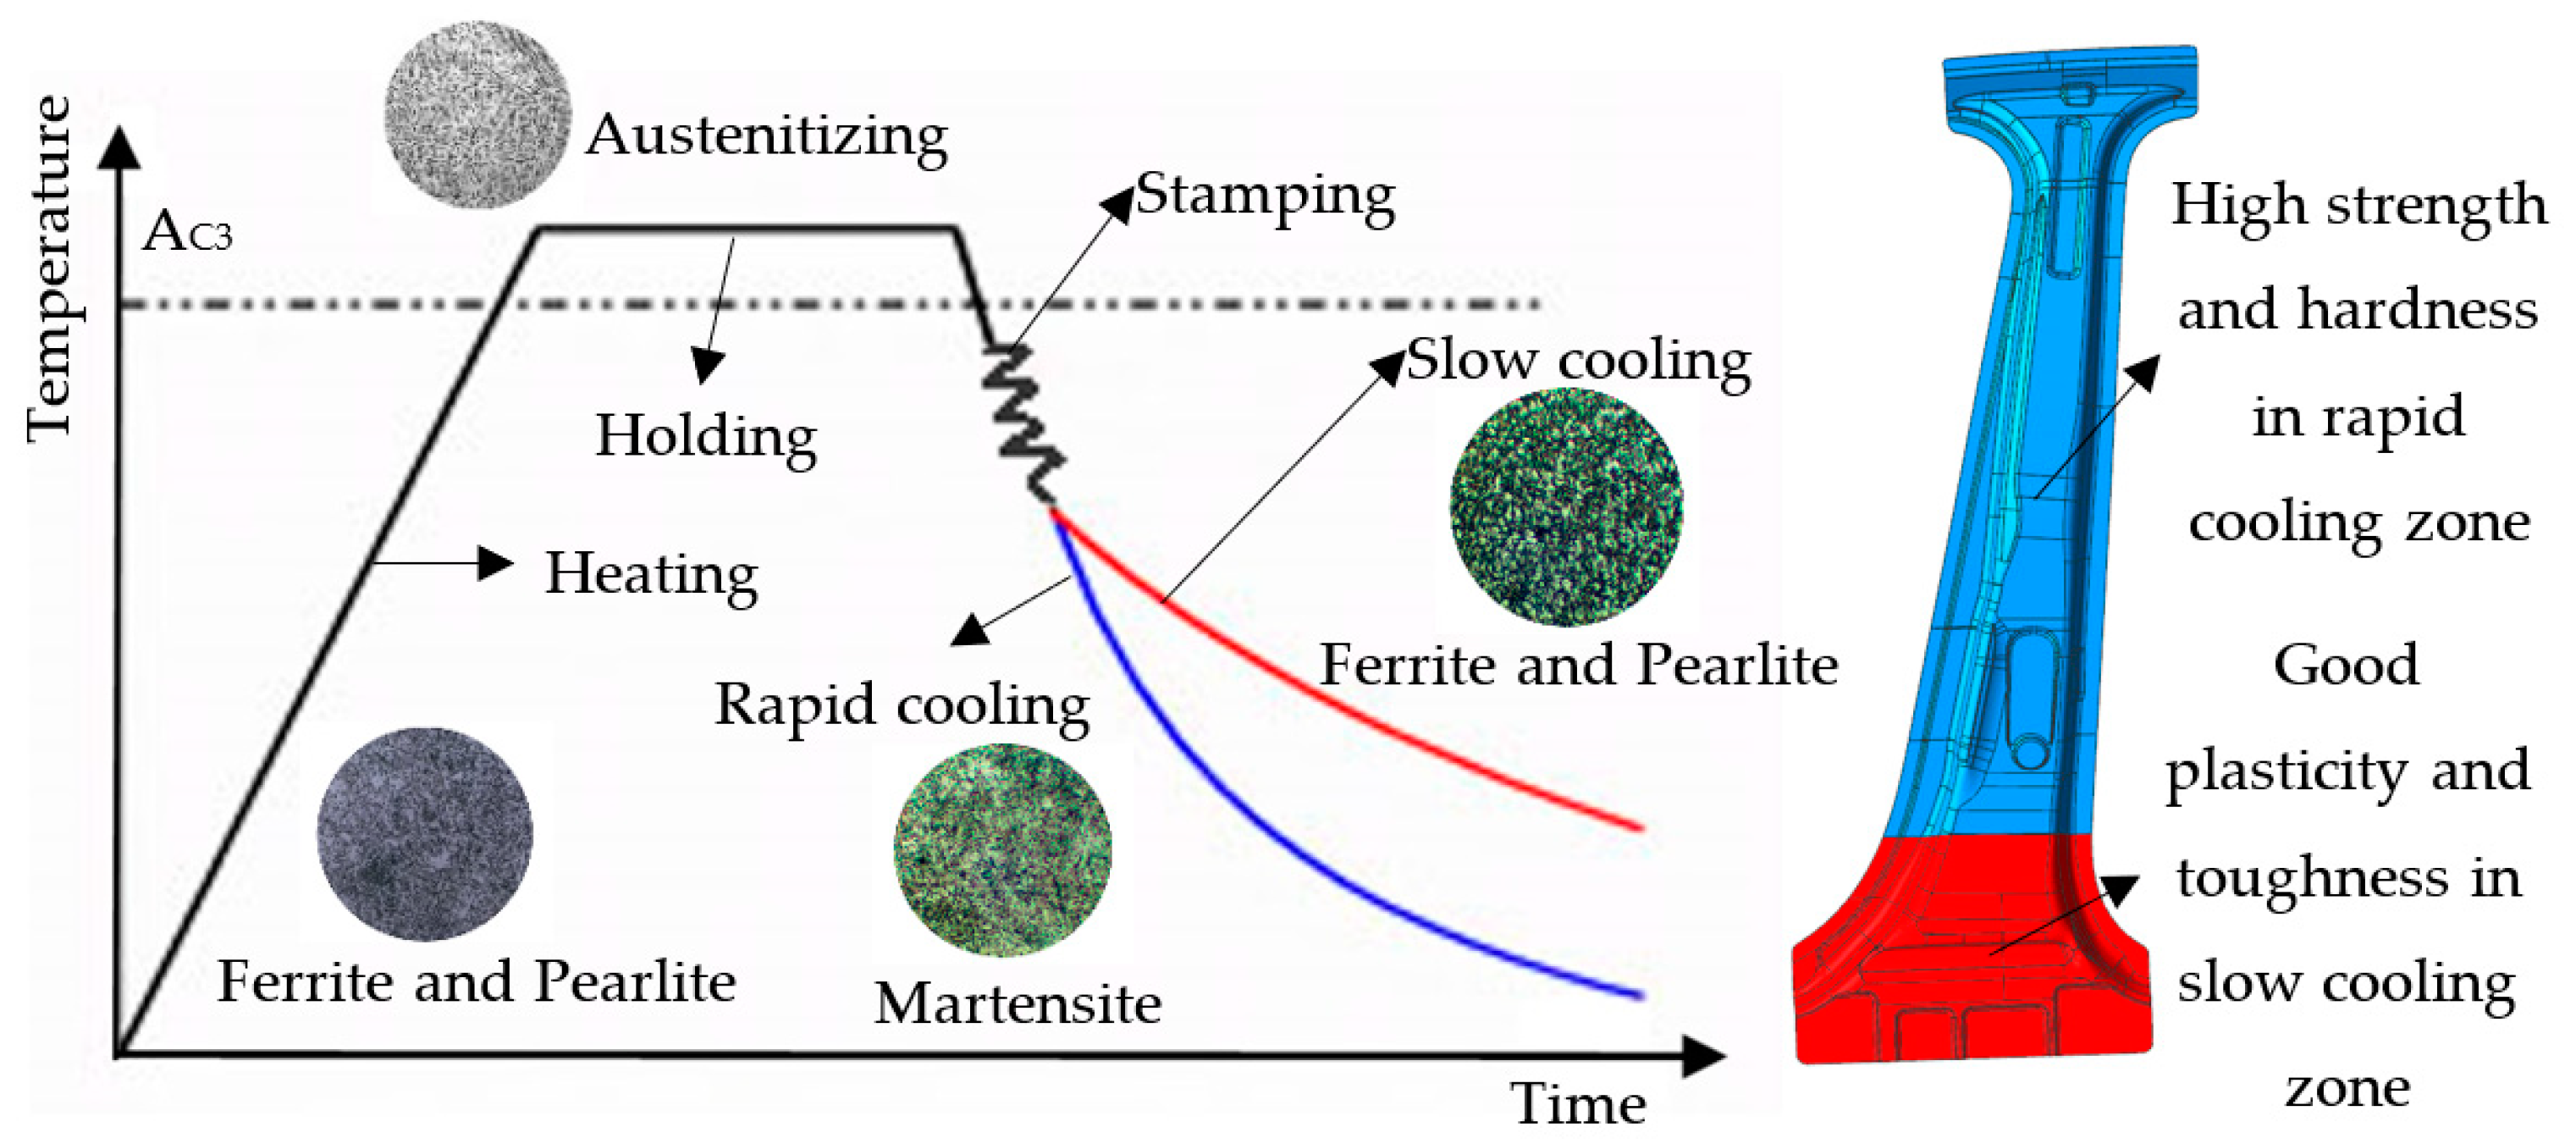
2.2. The Principle and Process of Partition Cooling in Hot Stamping

The continuous cooling transition (CCT) curve and mechanical properties of ultra-high strength steel 22MnB5 during hot stamping are shown in Figure 1 [12]. In order to obtain the partition properties parts, the specific phase transition can be realized by changing the conditions in the heating or cooling process, and the specific microstructure and specific performance can be obtained. Initially, the microstructure of the unheated high strength steel plate is ferrite and pearlite structure, which tensile strength is about 600 MPa. After that, the sheet metal is heated to about 950 °C (above the complete austenitizing temperature), and kept for at least 5 min to ensure complete homogenization of austenite. Then, the part is stamped. Finally, partition-cooling treatment is immediately performed after stamping, that is, after high-temperature sheet metal stamping, in the area of the cooling pipe installed on the die, rapid cooling occurs, subsequently causing non-diffusion martensitic transformation. The cooling rate exceeds the critical cooling rate of 27 K/s to obtain the martensite structure, and the tensile strength is able reach 1500 MPa. In contrast, in slow cooling with the heating device installed on the device on the die, the cooling rate of the slow cooling area is less than 6 K/s, allowing for the obtention of the pearlite and ferrite structure, and its tensile strength is about 600 MPa.
Based on this principle, a cooling device and a heating device are designed inside different areas of the stamping die, which can keep the parts cool at different cooling rates, and finally obtain different structures in different areas to reflect different performance of the stamped parts. The principle and process of partition cooling in hot stamping of the B-pillar are shown in Figure 2.

2.3. Simulation of Partition Cooling in Hot Stamping

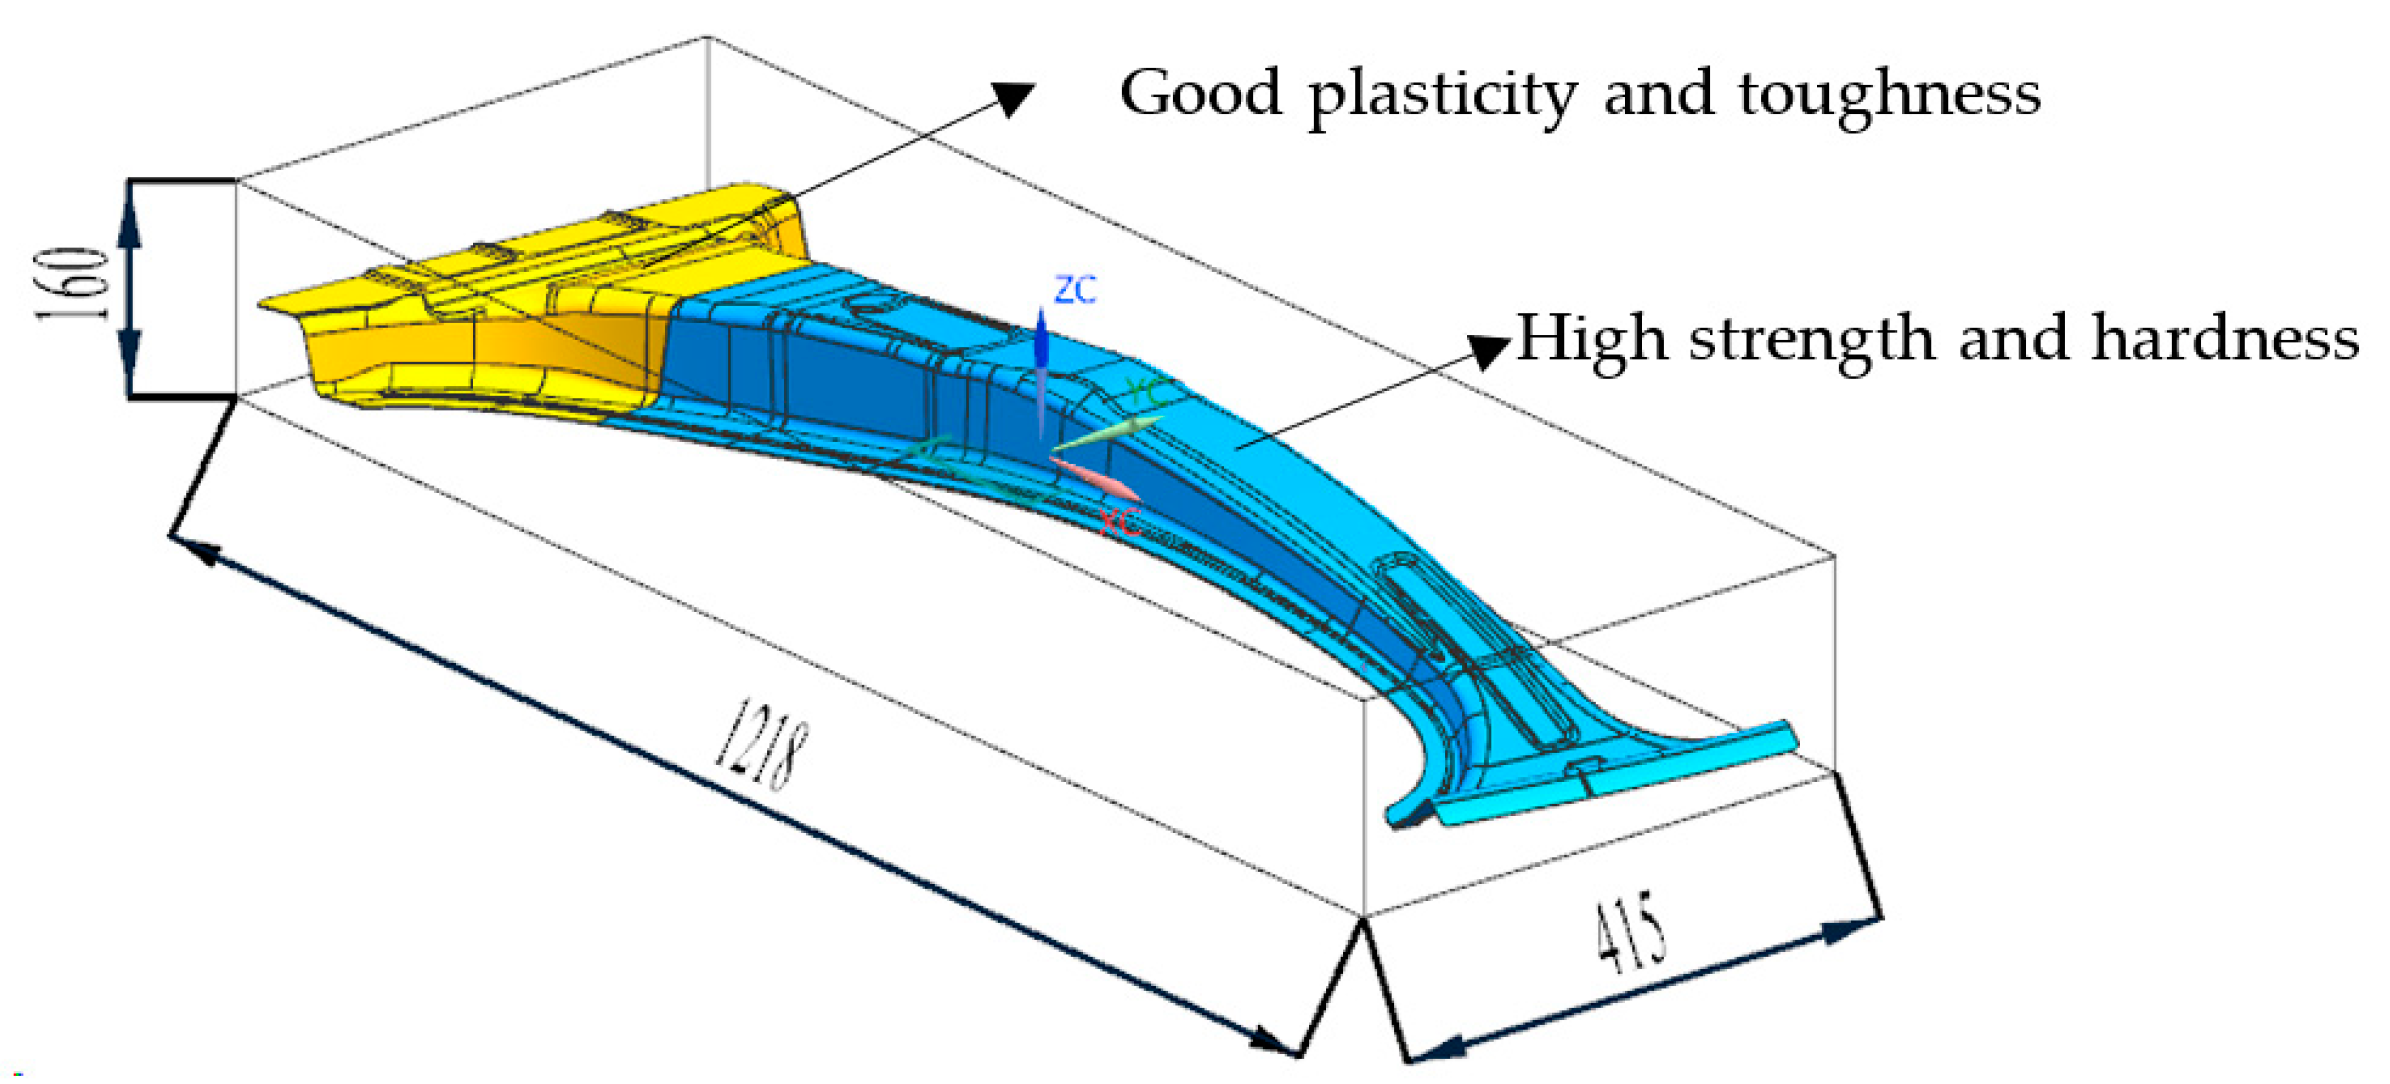
2.3.1. Part Analysis

The 3D model of the B-pillar is established in UG software (NX 10.0, Siemens PLM Software, Plano, USA). As shown in Figure 3, its three-dimensional size is about 1218 mm × 415 mm × 160 mm, and it is of a “dog bone shape”, with many small surfaces, a large drawing depth, a reverse drawing area and a complex assembly relationship. Higher strength and hardness need to be designed in the upper side of the B-pillar to bear the top cover pressure, while higher ductility and toughness should be designed in the lower side to meet the side impact energy absorption of the vehicle in order to protect the safety of the personnel inside the vehicle.

2.3.2. Numerical Simulation

There are many factors affecting the forming quality of partition cooling in hot stamping [23]. Before finite element simulation, the main influencing factors should be selected first, because it will lead to poor surface quality, performance reduction and even wrinkling and cracking risk if the selected influencing factors are unreasonable. The main factors affecting the forming quality of partition cooling in hot stamping are the friction coefficient, austenite temperature of the sheet metal, the temperature of the heating zone, pressing force and holding time. In addition, the rolling direction of the sheet metal, the shape of the sheet metal and the transfer time from the heating furnace to the die all affect the forming parts [24].
The simulation model with the pressing core for partition hot stamping is shown in Figure 4. The pressing core is suitable for local pressing in parts of a complex curved surface, which can make up for the deficiency of the traditional edge-pressing ring. The main parameters of the finite element simulation are as follows: the friction coefficient is 0.45, the initial temperature of the sheet metal is 950 °C, the die temperature of the rapid cooling zone is 75 °C, the die temperature of the slow cooling zone is 600 °C, the upper binder force is 1.5 MPa, the lower binder force is 3 MPa and the holding time is 8 s.

2.4. Optimal Latin Hypercube Design

2.4.1. Selection of Design Variables and Optimization Objectives

Thickening, wrinkling, thinning and cracking are the main defects in the hot stamping process of the B-pillar. Consequently, the friction coefficient (A), the austenitizing temperature (B), the holding time (C), the heating zone temperature (D), the upper binder force (E) and the lower binder force (F) were selected as variables. In order to further optimize the thickening and thinning of the middle column, the maximum thickening rate (Y1), the maximum thinning rate (Y2), the maximum thickening rate (Z1) and the maximum thinning rate (Z2) in the slow cooling area were selected as the response values.

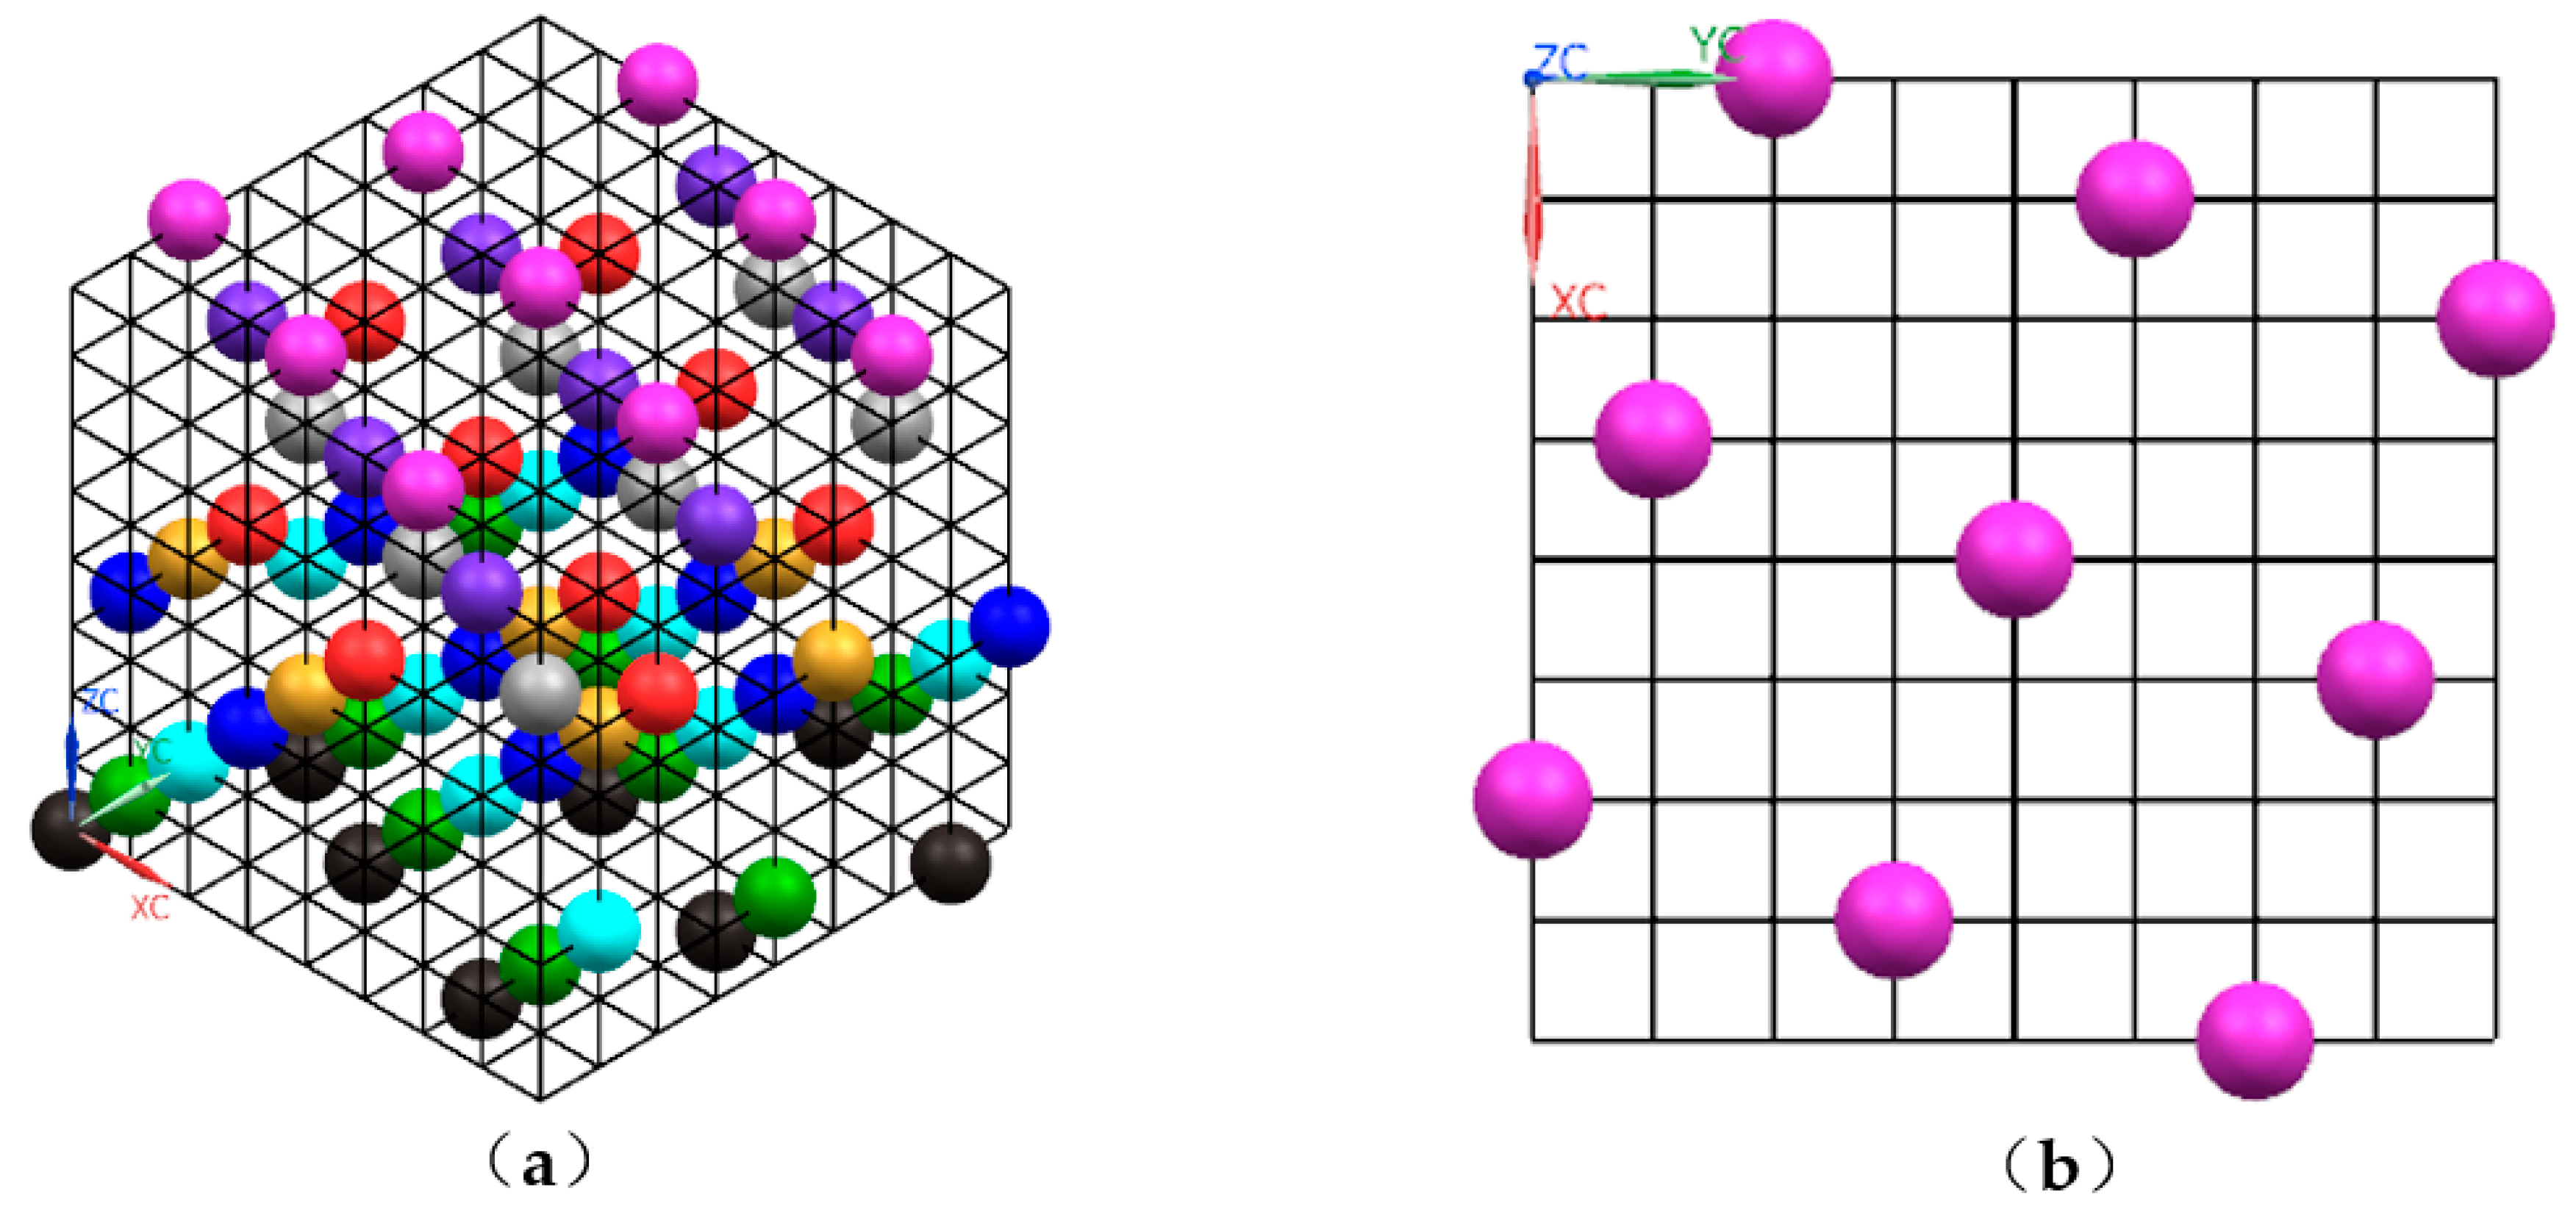
2.4.2. Optimal Latin Hypercube Design

The OLHD were chosen to design the test schemes by Isight software (Isight 5.8, Dassault Systemes, Vélizy-Villacoublay, France). Based on the LHD, the OLHD is improved to make the sample points more evenly distributed in space, with excellent spatial filling and equalization, and more realistic response factors and responses accuracy [25]. The distribution of the test points for OLHD is shown in Figure 5.
The OLHD is an n dimensional space composed of n variables, in which the coordinate interval of each dimension is [ x k m i n , x k m a x ] ,   k [ 1 , n ] , which is evenly divided into m intervals, each of which is recorded as [ x k i 1 , x k i ] , i [ 1 , n ] . There are m points randomly distributing to ensure that each level of a variable is selected only once, and to ensure that the selected sample points are uniformly distributed in the n dimension space.
In order to ensure the accuracy of the approximate model, 45 groups of test schemes are selected by OLHD. The selected factors and their ranges are shown in Table 3.

3. Results and Discussion

3.1. Results of Simulations and Response Surface Methodology (RSM) Approximation Model

3.1.1. Results of Simulations

According to the test schemes, the B-pillar thickening and thinning are simulated and analyzed, and the simulation results are shown in Table 4.

3.1.2. Establishment of the RSM Approximation Model

Compared with general optimization simulation, the establishment of approximate models has advantages in studying engineering optimization problems: (1) empirical formula can be established to quantify the relationship between input variables and output variables, which is easy to understand; (2) time consumption and efficiency can be greatly reduced; (3) the global optimal value can be converged faster by smoothing the response function relationship. Meanwhile, because the OLHD samples are robust to the change of the model, the combination of the OLHD and the RSM approximation model can make the established model accurate, systematic, stable, practical and visual. Therefore, the RSM model is adopted.
The functional relationship between the selected six influencing factors and the four forming quality evaluation indexes are nonlinear. Thus, in order to fit the relationship between the influencing factors and the target value more accurately, the third order response surface approximation model is adopted. Based on the simulation results, the interaction terms of linear, interactive, square and cubic are considered synthetically. The minimum number of experimental groups required to establish the third order response surface is: (M + 1) × (M + 2)/2 + M, and M is the number of variables. The third order response surface approximation model is shown in Equation:
y = σ 0 + i = 1 n σ i x i + i = 1 n β i x i 2 + i = 1 n γ i x i 3 + i j λ i j x i x j
where y represents the predicted response value; xi and xj represent the factor variables; n represents the number of variables; and σ0, σi, βi, γi and λij refer to the offset term, the linear effect, the quadratic effect, the cubic effect and the linear interaction coefficient, respectively.
In the process of establishing the mathematical model of the third response surface, not all the coefficient terms of polynomial equations need to be solved, and some items can be omitted to fit the correct polynomial, thus ensuring the accuracy of the model. Therefore, the significance test method is used to check the key term retention of the polynomial coefficient, the minimum value of the residual sum of squares (RSS) is taken as the inspection standard (RSS < 0.05), and the calculation formula is R S S = i = 1 n ( y i y i ˜ ) 2 , where y i is the actual value, y i ˜ is the approximate value, and n is the number of samples. The third order response surface mathematical models of the maximum thickening rate in the slow cooling zone (Y1), the maximum thinning rate in the slow cooling zone (Y2), the maximum thickening rate in the rapid cooling zone (Z1) and the maximum thinning rate in the rapid cooling zone (Z2) after the hot stamping of the B-pillar are established as shown in Equations (2)–(5), respectively.
Y 1 ( % ) = 142.8955 + 0.3713 B + 3.6332 C 16.6206 E 0.0001 B 2 + 6.3009 D 2             + 0.0499 A B 18.2317 A E + 3.5899 A F 0.0035 B C 0.0001 B D             + 0.0221 B E 0.2579 C E + 0.0151 D E 59.7417 A 3 0.5063 E 3             0.0414 F 3
Y 2 ( % ) = 6.9980 47.5114 A + 0.0625 B + 31.7992 A 2 + 0.0001 D 2 + 0.0222 A B             + 0.7804 A C 2.0620 A E + 2.3021 A F 0.0001 B D + 0.0053 A E             0.0015 C D + 0.2149 C E 0.0088 D E 0.0028 D F + 0.0013 C 3             + 0.0282 F 3
Z 1 ( % ) = 20.2254 1.1786 C + 0.0653 D + 2.5670 E + 4.5328 B 2 + 0.5946 A C             0.0222 A D 5.1478 A E + 2.6383 A F + 0.0019 B C 4.3580 B D             0.0013 D F 0.2028 E F + 14.3602 A 3 3.0965 B 3 + 0.0186 F 3
Z 2 ( % ) = 36.5908 + 0.1147 B 1.7275 F 6.4407 A 2 7.4682 B 2 7.8255 D 2             + 0.6072 E 2 0.2877 A C + 0.0146 A D 1.0432 A E + 0.5817 A F             + 2.8422 B D + 0.0018 B F 0.1369 C E 0.1487 E F + 0.0017 C 3             + 5.8382 D 3

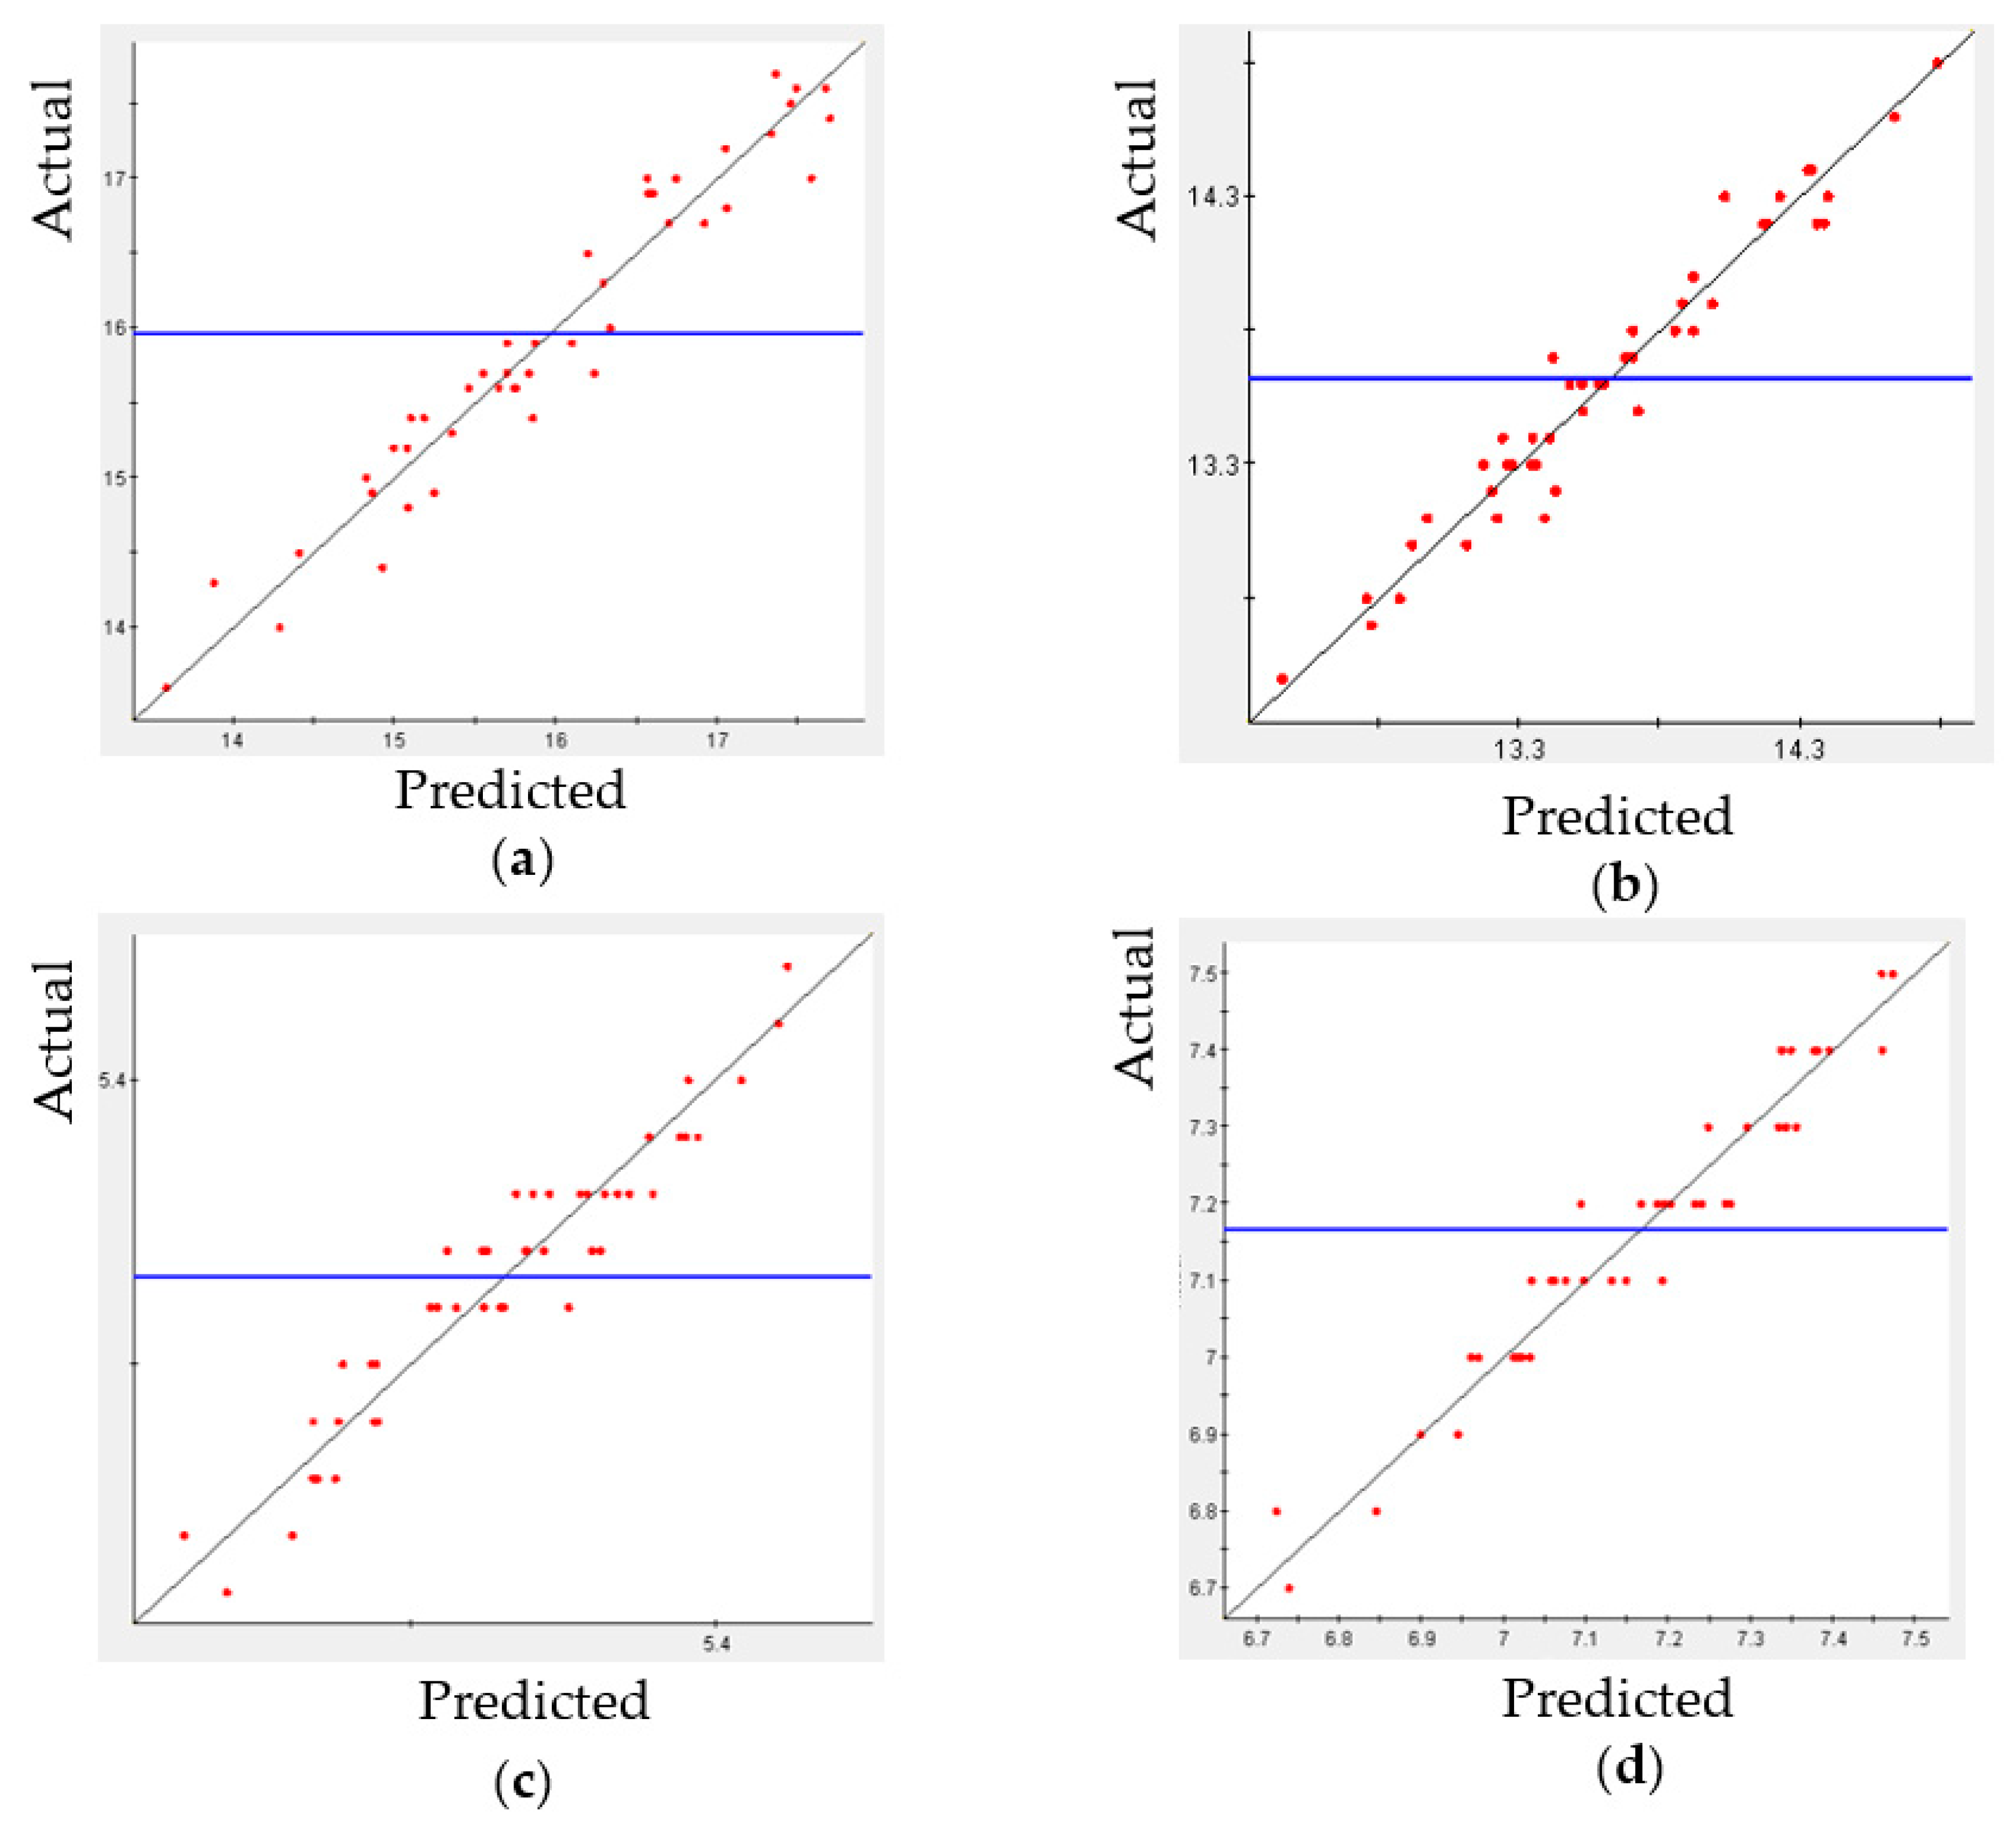
3.1.3. Precision Test of RSM Approximation Model

The accuracy of the response surface approximation model is an important basis for judging the reliability and accuracy of the subsequent optimization results, so the accuracy of each response approximation model established must be tested. Evaluation parameters of the response surface model error analysis, namely, maximum absolute error (MAE), average absolute value error (AMAE), root mean square error (RMSE), decision coefficient (R2) and sample correction decision coefficient (Radj2), are used to check the accuracy of the RSM approximation model; the mathematical formulas for each evaluation parameter are as follows:
M A E = M a x | y i y i ^ |
A M E A = 1 n t e s t | i = 1 n t e s t y i y i ^ |
R M S E = 1 n t e s t i = 1 n t e s t ( y i y i ^ ) 2
R 2 = S S R S S T = 1 S S E S S T
S S T = y T y ( i = 1 K y i ) 2 = i = 1 K ( y i y i ¯ ) 2 = i = 1 K ( y i i K y i k ) 2
S S E = y T y β T X T y = i = 1 k ( y i y i ^ ) 2
S S R = β T X T y ( i = 1 k y i ) 2 / K = i = 1 k ( y i ¯ y i ^ ) 2
R a d j 2 = 1 S S E / ( k s 1 ) S S T / ( k 1 ) = 1 k 1 k s 1 ( 1 R 2 )
where the y i is the simulation value of the test scheme,   y i ^ is the predicted value of the approximate model,   y i ¯ is the mean value of the simulation value of the test scheme, n t e s t is the number of the test scheme, k is the number of test points and s is the number of coefficients in the regression equation.
To ensure the accuracy of the mathematical formula model of response surface, MAE is less than 0.3, AMAE is less than 0.2, RMSE is less than or equal to 0.2; and R2 is greater than or equal to 0.95. The accuracy is higher if the model R2 is closer to 1. In order to avoid the prediction distortion of the response surface approximation model, Radj2 is used to assess the effect of differences in design variables on the approximation of regression equations, improving the fitting accuracy of the response surface mathematical model.
Based on Equations (2)–(5), the fitness diagram of the four response approximation models is obtained and is shown in Figure 6. The simulated values are uniformly distributed around the diagonal lines, which indicates that the established response surface mathematical model has high accuracy and can be used instead of finite element simulation for predictions.
Meanwhile, the error evaluation parameters of the four response approximation models are shown in Table 5; all values are greater than 0.95 for R2 and Radj2, all MEA values are less than 0.3, all RMSE values are less than 0.2, and all AMEA values are less than 0.2. Therefore, the accuracy of the four response surface approximate mathematical models is higher, and thus can be used to replace the finite element model calculation.

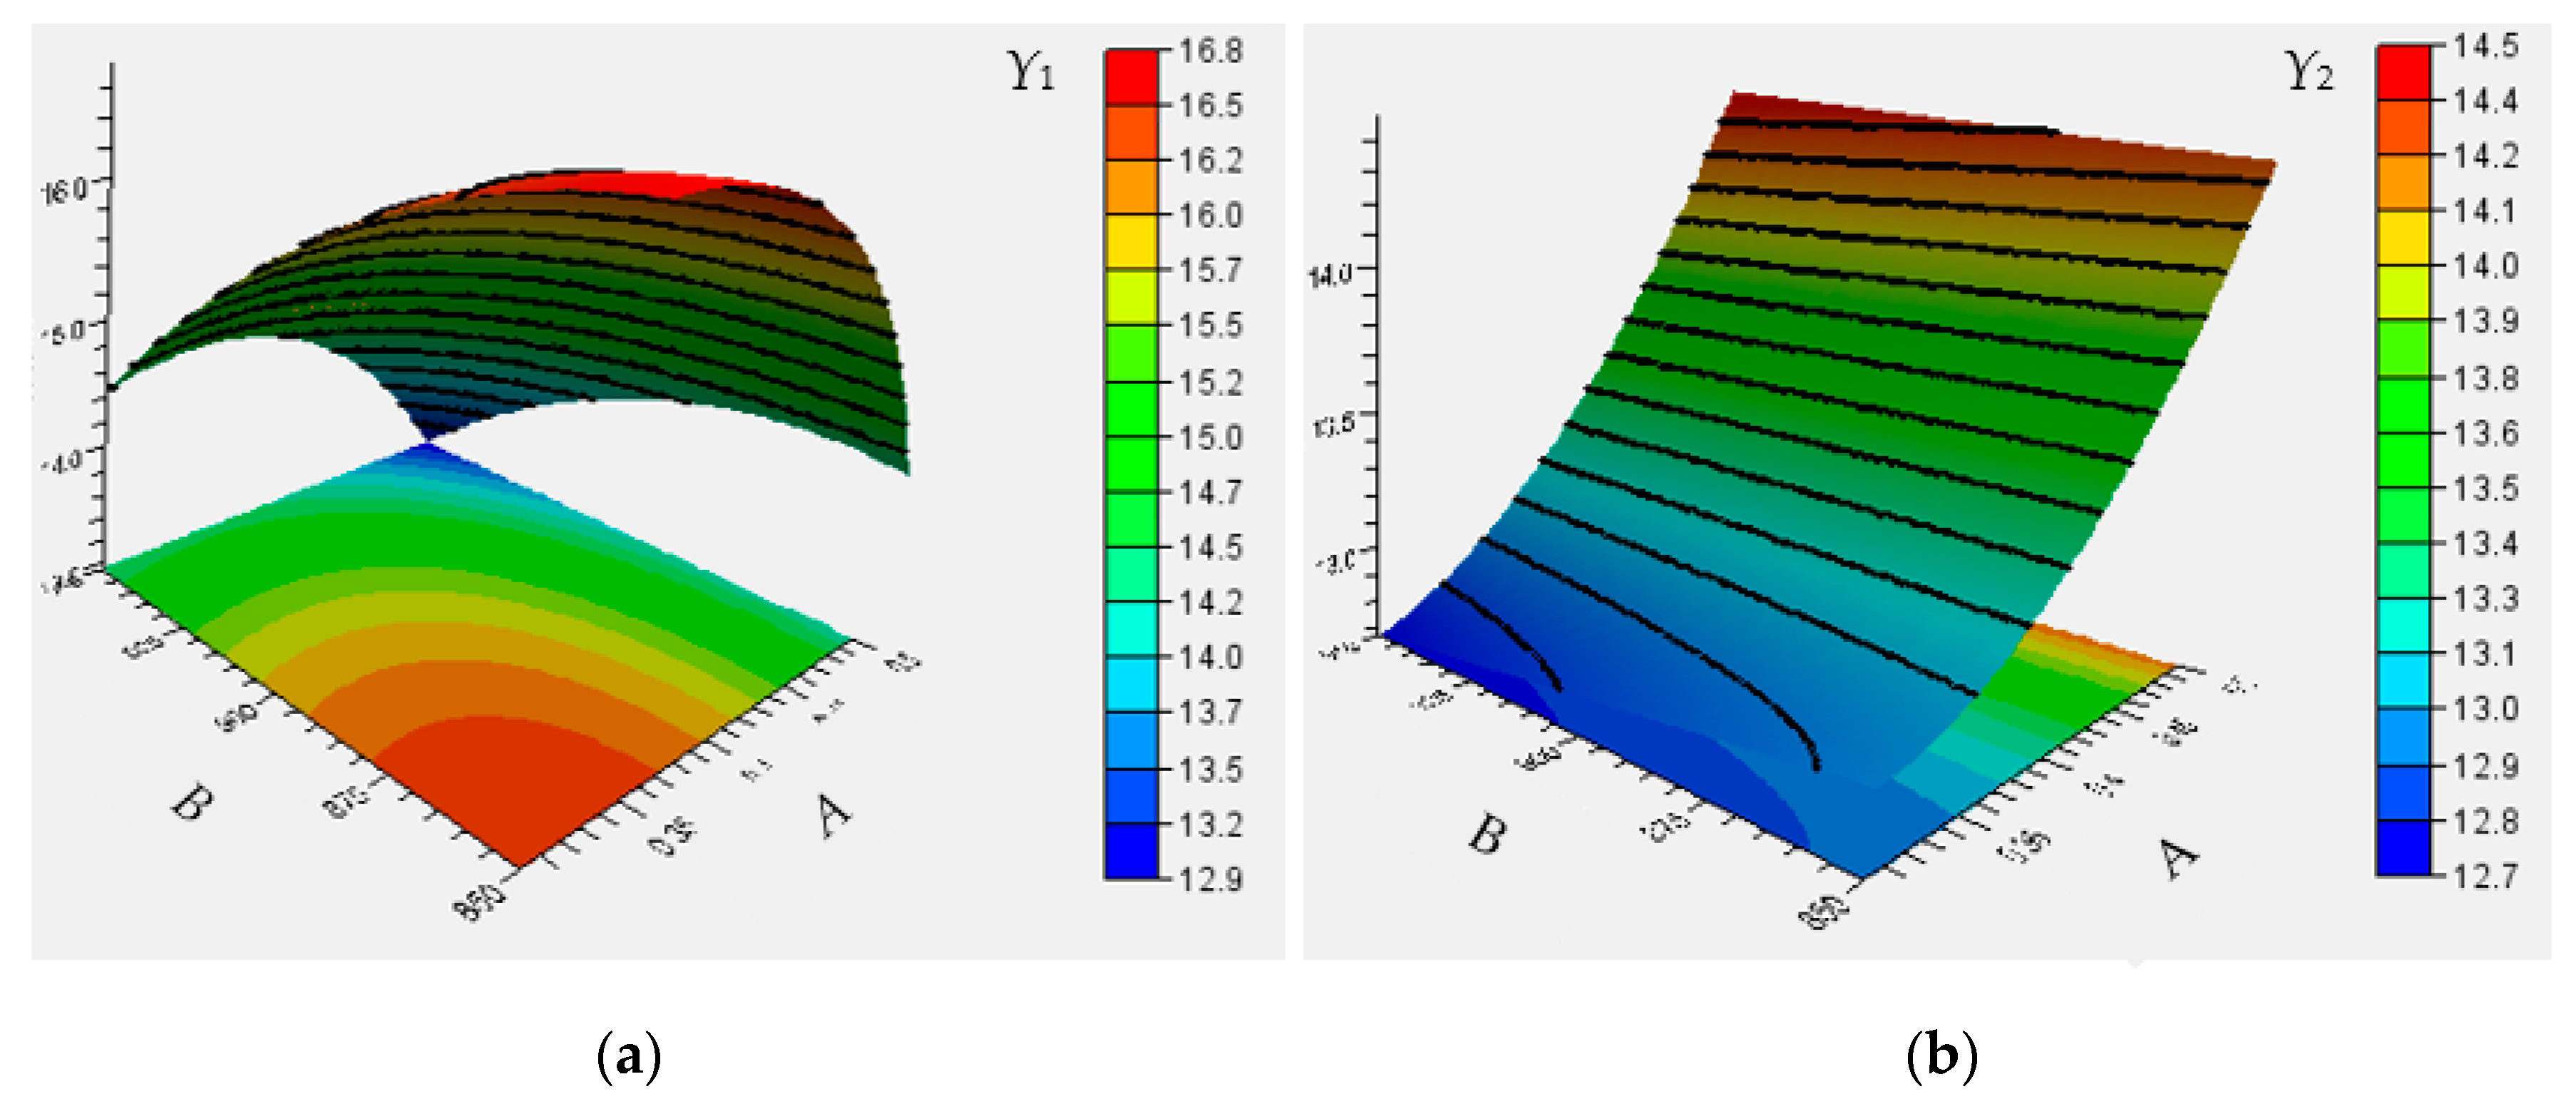
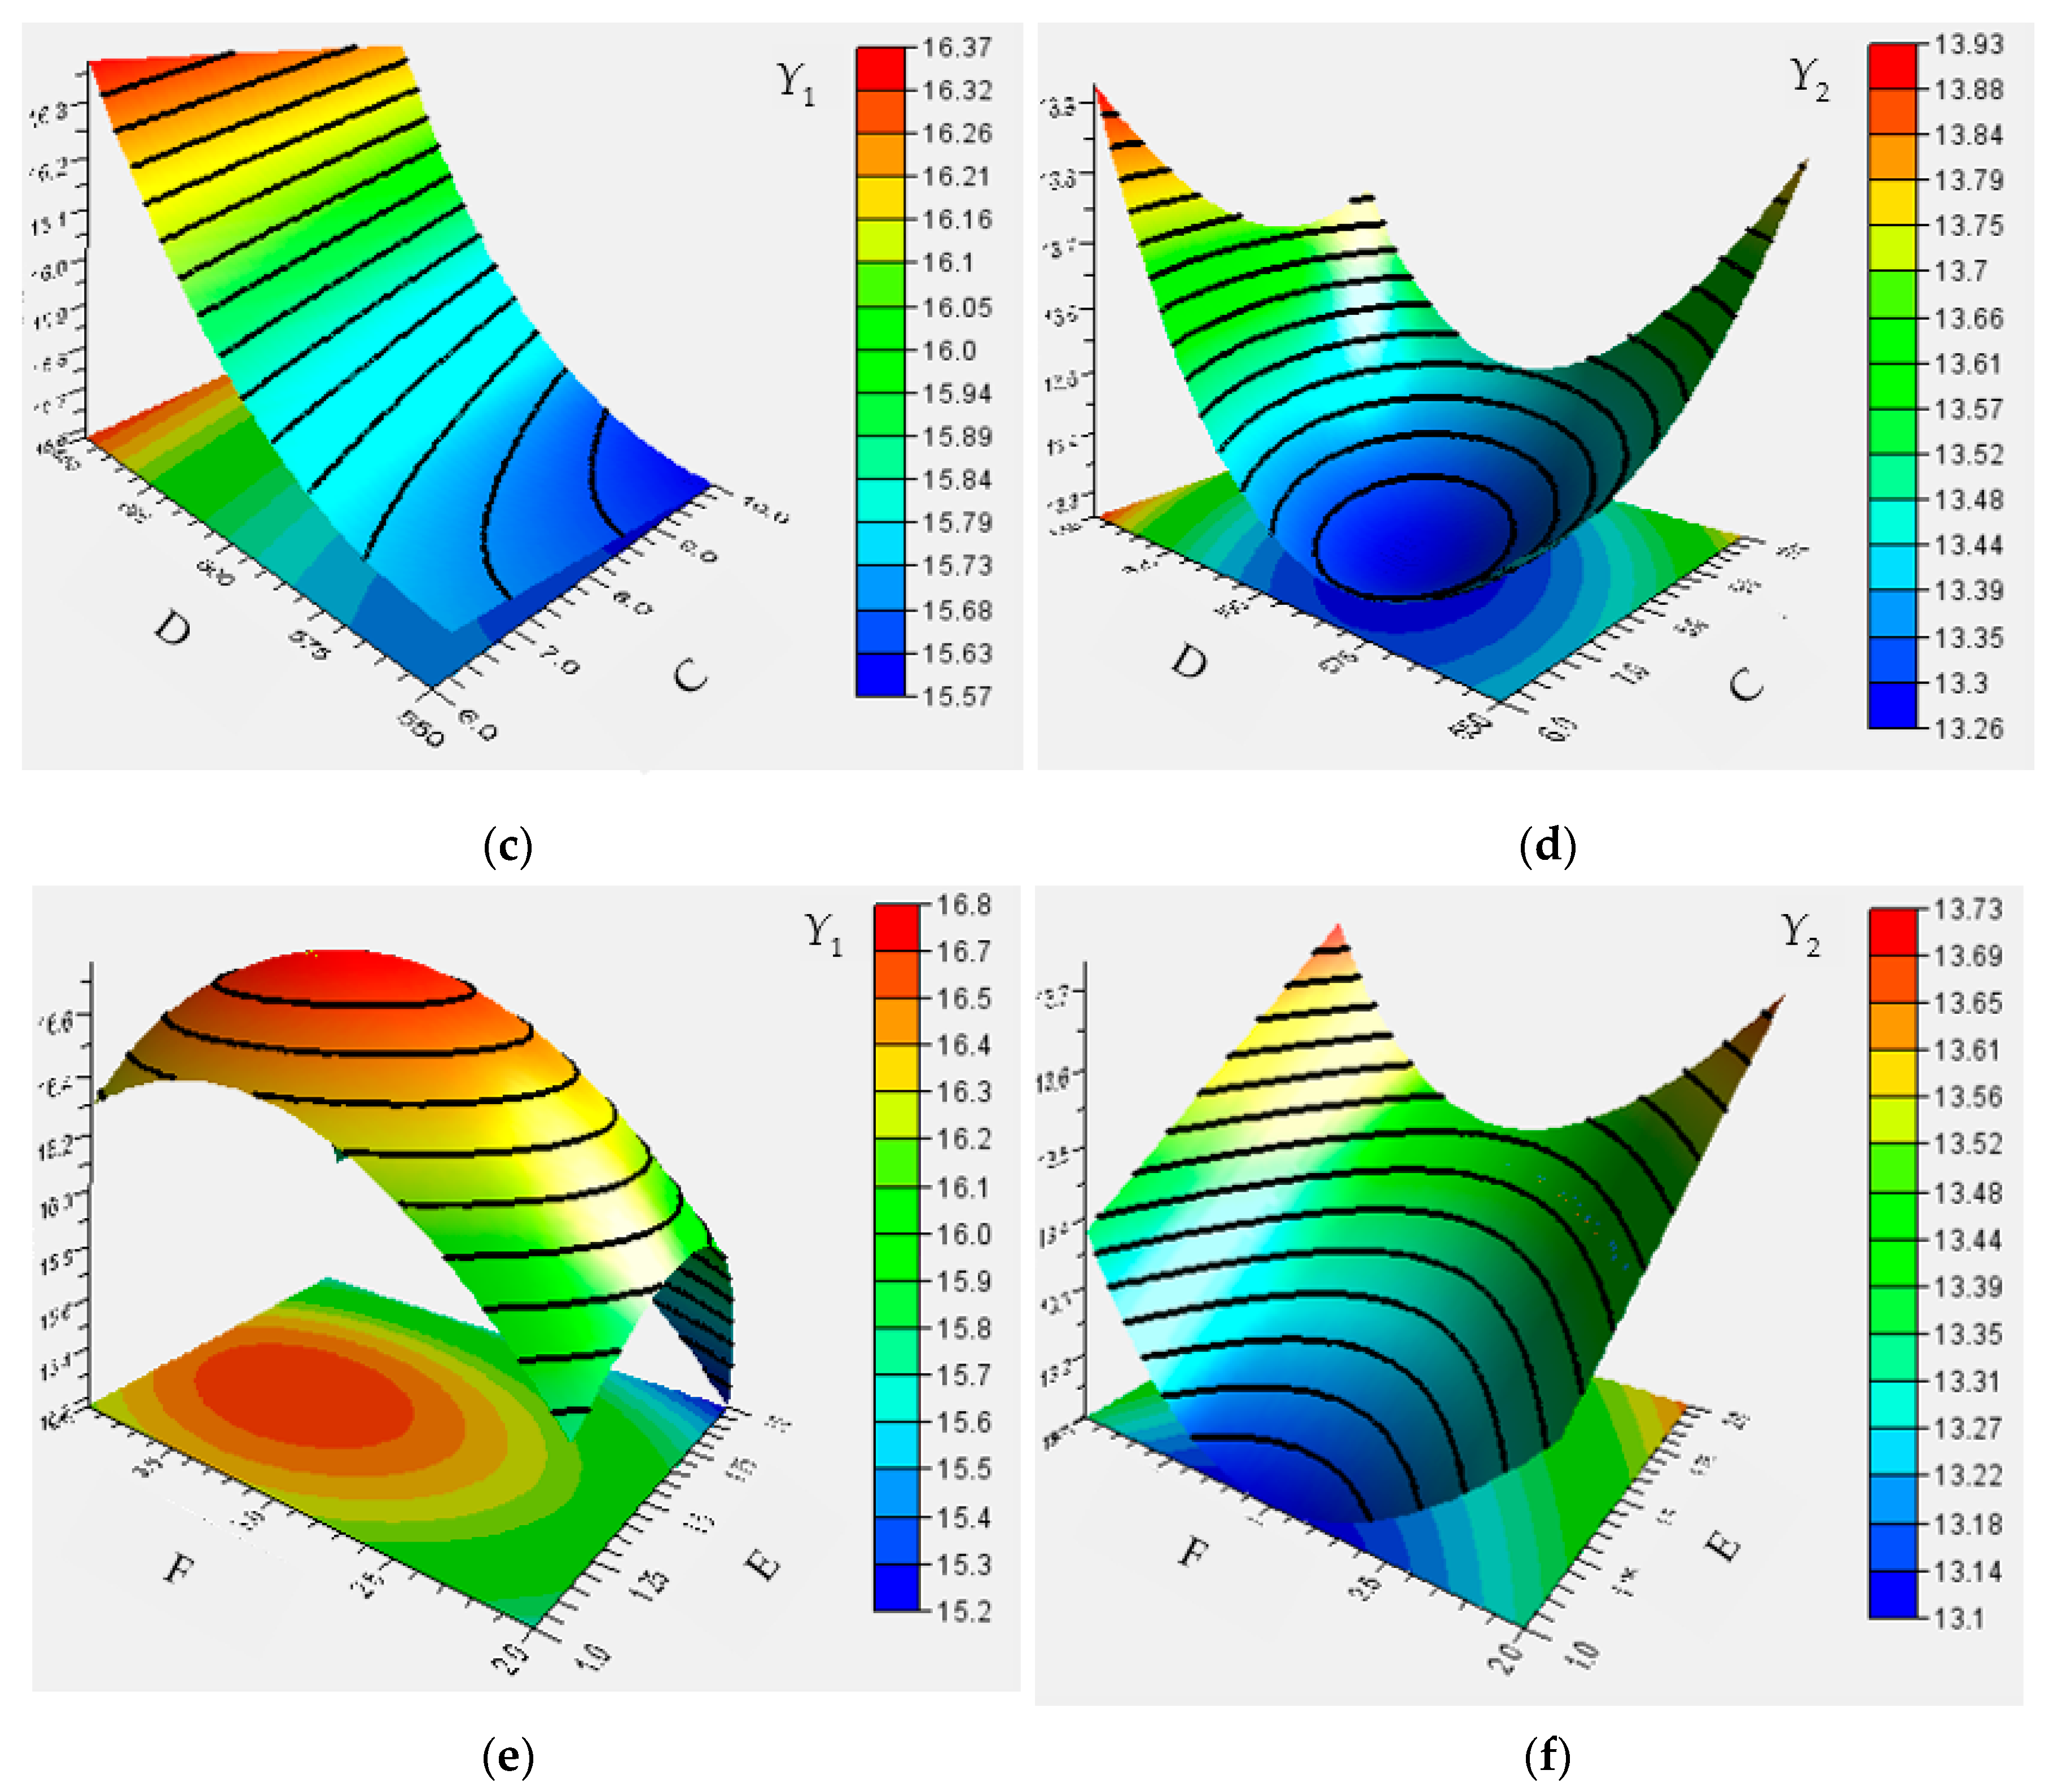
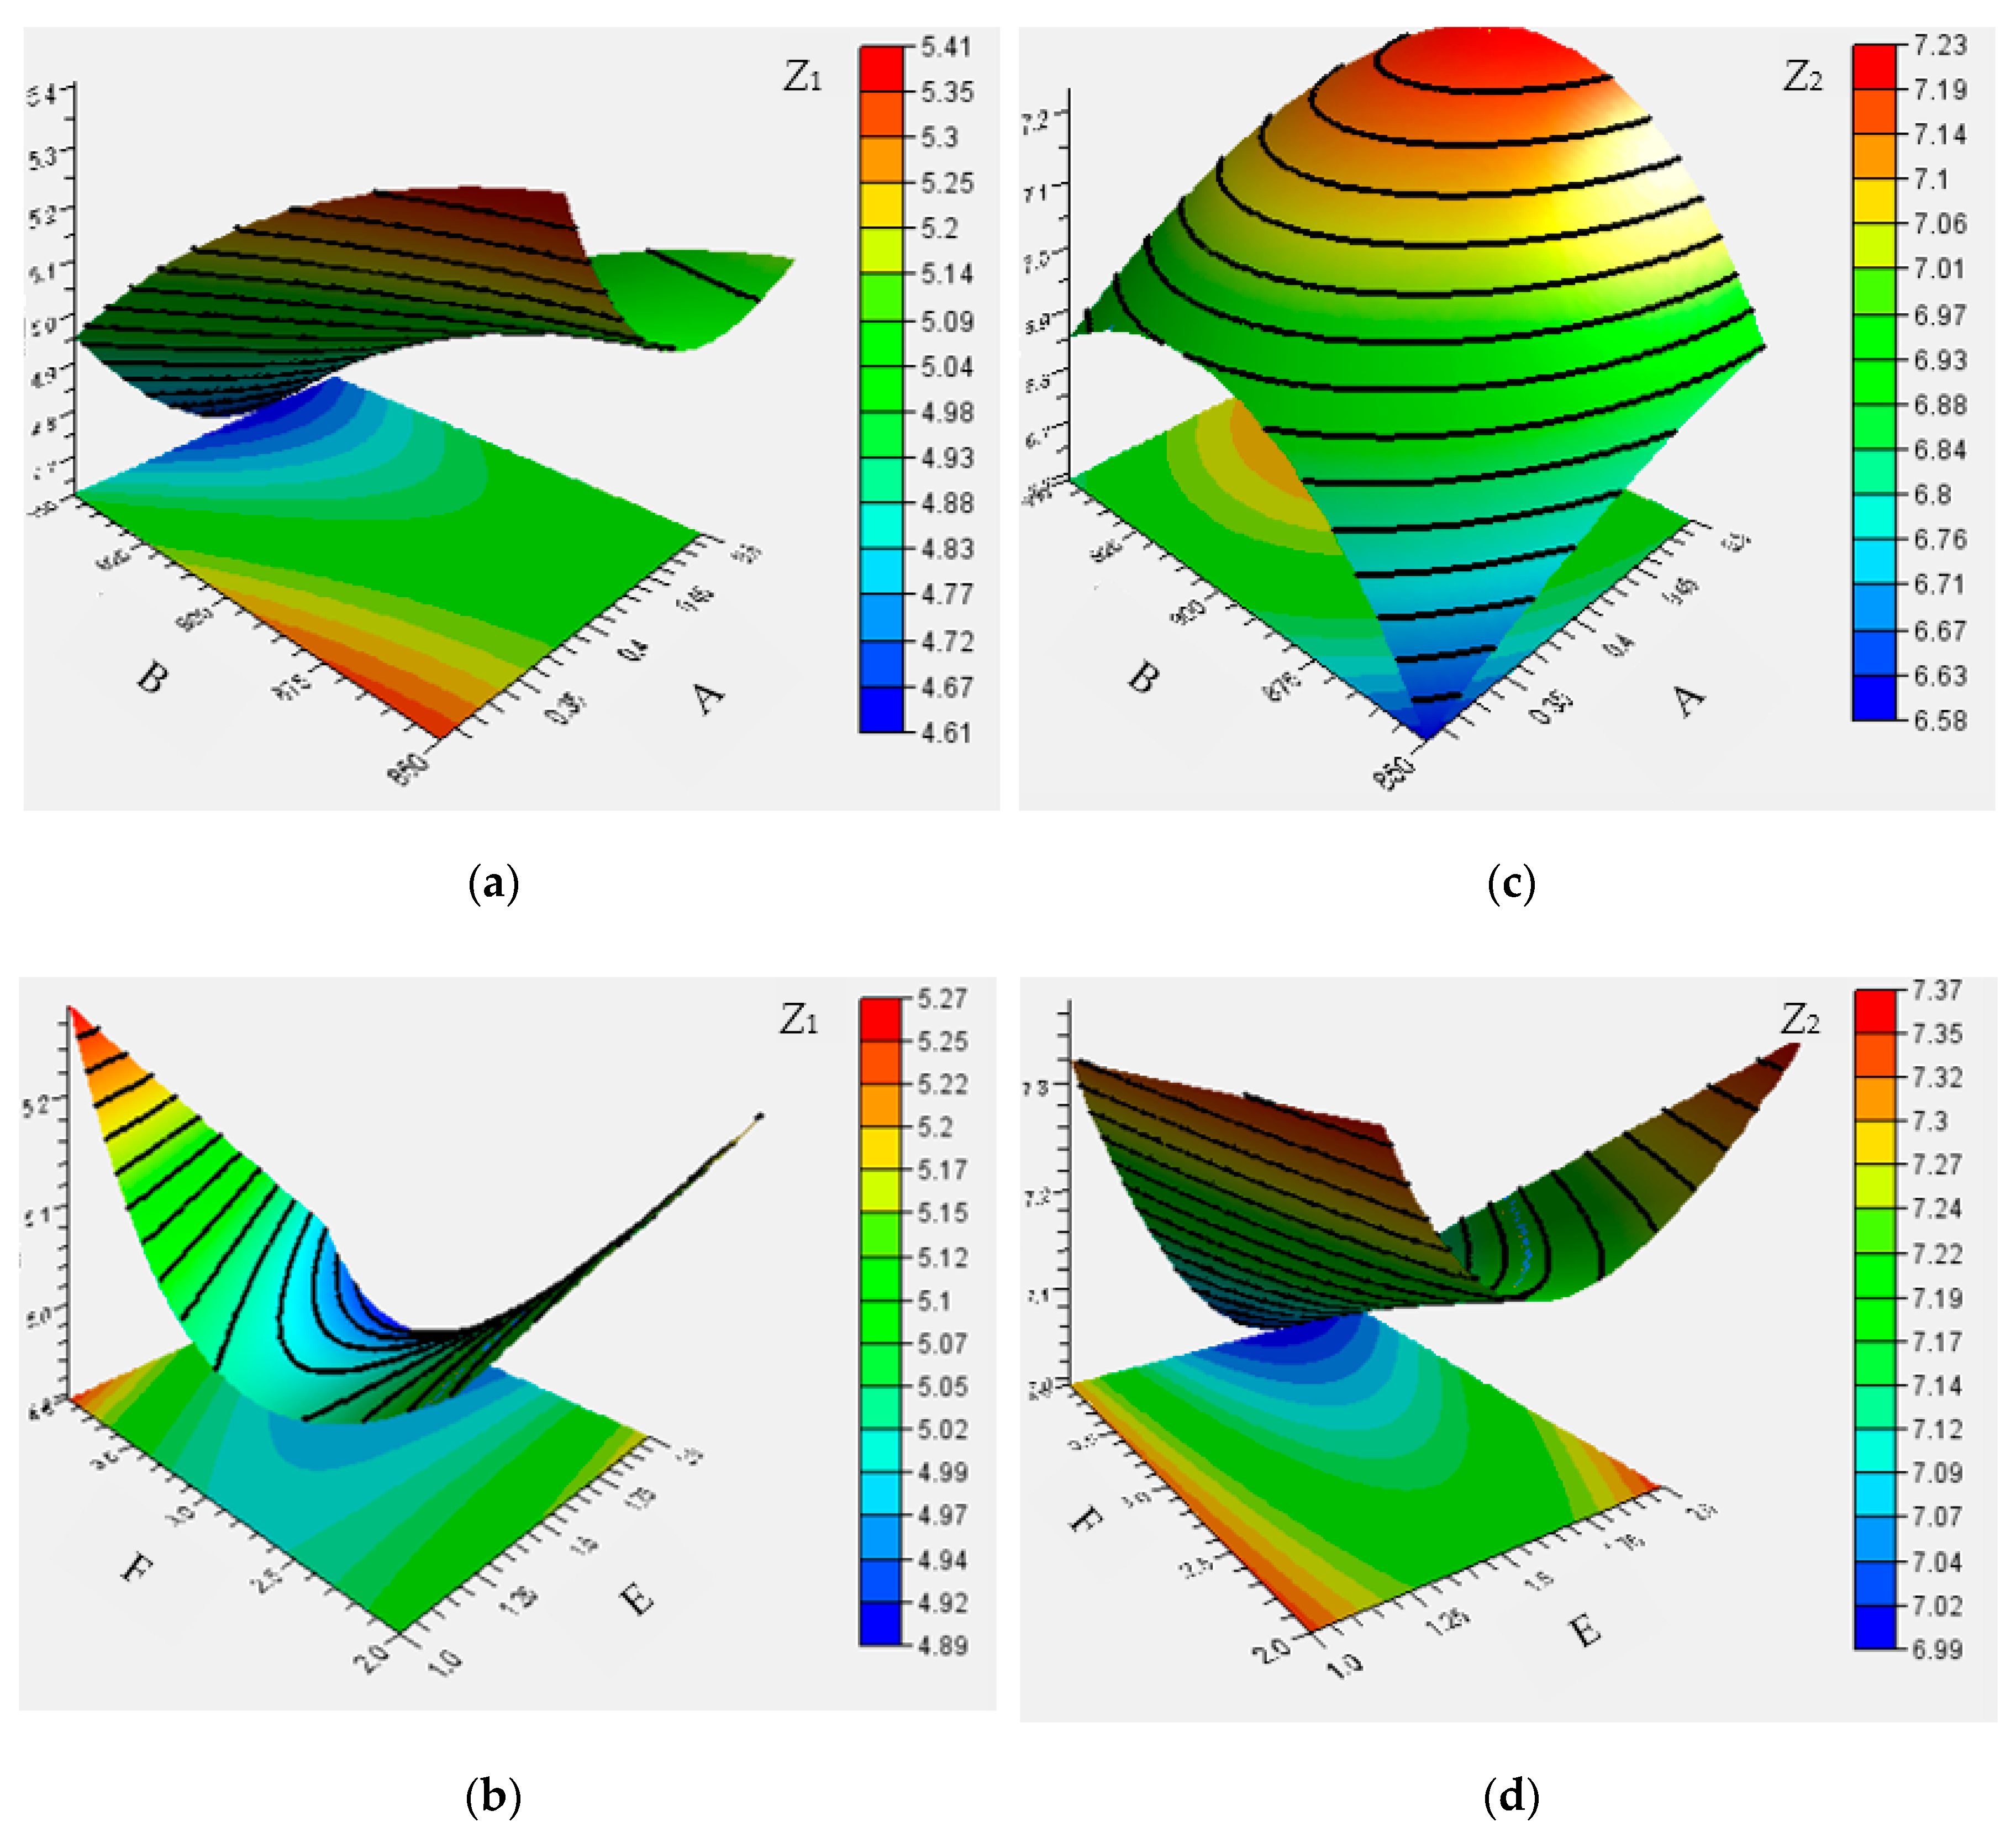
3.2. Interaction Effect of Process Parameters on Thickness

In order to study the influence of process parameters on the maximum thickening rate and the maximum thinning rate of the B-pillar and to prepare for the subsequent optimization of process parameters, it is necessary to explore the influence law affecting the interaction between processes parameters. Therefore, based on the established three-order response surface mathematical model of the four target values, the following parameters are observed: the friction coefficient (A), austenitizing temperature (B), holding time (C), heating zone temperature (D), upper binder force (E) and lower binder force (F) on the maximum thickening rate of the slow cooling zone (Y1), the maximum thinning rate of the slow cooling zone (Y2), the maximum thickening rate of the rapid cooling zone (Z1) and the maximum thinning rate of the rapid cooling zone (Z2).
Figure 7 and Figure 8 show the effect of each parameter on the maximum thickening rate and the maximum thinning rate. Each graph shows the interactive effect laws between two variables in the scope of the experimental study when the other variables are fixed values. The experimental results show that the maximum thickening rate in the slow cooling zone decreases significantly with the increase in the friction coefficient and austenitizing temperature, it decreases with the increase in holding time, and it increases with the increase in the heating zone temperature. With the increase in the upper binder force and lower binder force, the trend of first increasing and then decreasing appears.
When the friction coefficient increases, the flow resistance of the sheet metal increases, resulting in a gradual decrease in the thickening rate. When the austenitizing temperature increases, the fluidity of sheet metal increases, the deformation ability of sheet metal increases at high temperature, and the thickening trend is inhibited. The prolongation of the holding time inhibits the springback degree of the sheet metal and decreases the thickening trend. The increase in the temperature in the heating area makes the cooling rate of the high-temperature parts slow and increases the probability of the springback phenomenon, which leads to an increase in the thickening rate. When the binder force cannot press the sheet, it does not play a major role in the thickening rate. When the binder force is large enough, the flow capacity of the sheet becomes worse, and the thickening trend is inhibited.
The maximum thinning rate in the slow cooling zone increases significantly with the increase in the friction coefficient and decreases slightly with the increase in the austenitizing temperature, and it gradually increases with the extension of the dwell time, and decreases first and then increases as the temperature of the heating zone increases. With the increase in the binder force of the upper die, the binder force increases significantly, and with the increase in the fine mesh binder force, it shows a trend of first decreasing and then growing.
This is because the increase in the friction coefficient can hinder the sheet metal flow and increase the thinning degree. The increase in the austenitizing temperature is beneficial to the sheet metal flow. With the increase in the upper binder force, a trend of first decreasing and then increasing with the increase in the detail pressing force is observed. The prolongation of the holding time can effectively inhibit the springback trend of the thinned material and increase the thinning rate. When the temperature in the heating area sufficiently increases, the cooling rate of the high temperature parts becomes slower and the probability of the springback phenomenon is increased. Thus, the thinned place is thickened.
The maximum thickening rate in the rapid cooling zone decreases first and then increases with the increase in the friction coefficient, and gradually decreases with the increase in the austenitizing temperature. With the increase in the upper binder force and the lower binder force, a trend of first decreasing and then increasing is observed. With the increase in the friction coefficient and austenitizing temperature, the maximum thinning rate increases the friction coefficient and austenitizing temperature. With the increase in the upper binder force, a trend of first decreasing and then increasing is observed, but the change in the lower binder force is not obvious.
Therefore, the change in column thickness can be effectively controlled by reasonable control of process parameters in the optimization process.

3.3. Multi-Objective Optimization

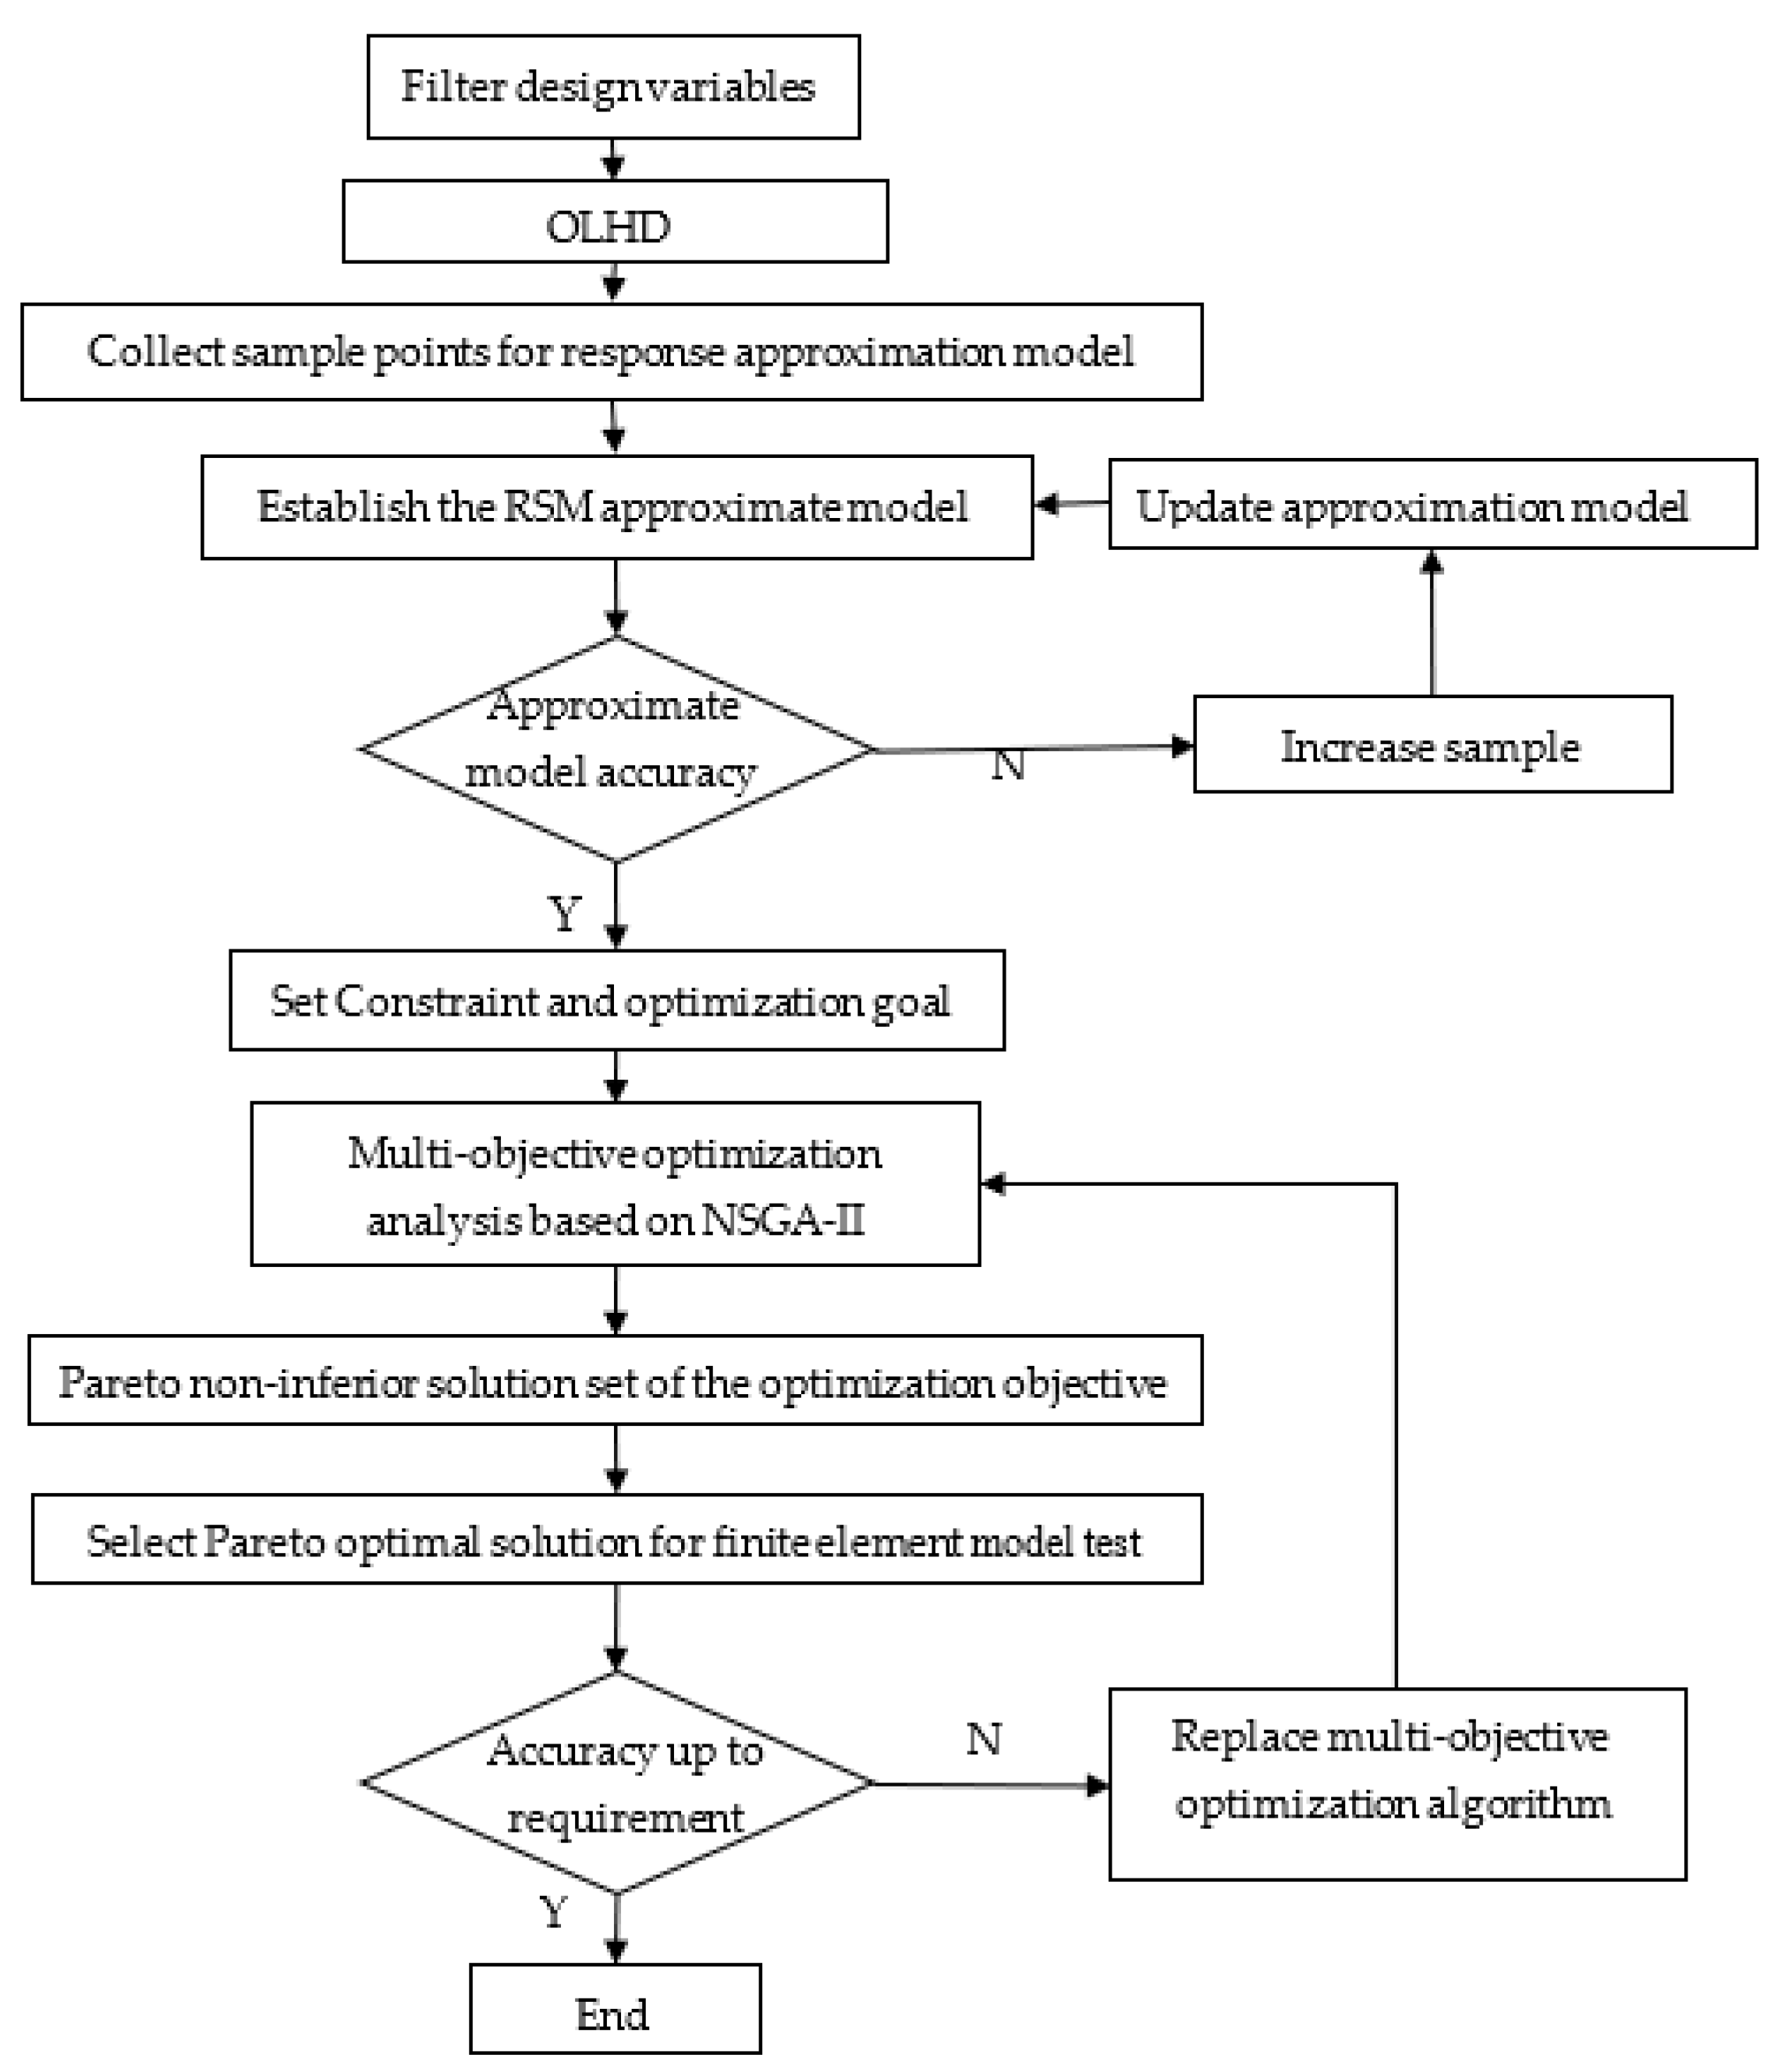
3.3.1. Procedure of Multi-Objective Optimization Based on RSM and NSGA-II

The thickness optimization of the B-pillar is a typical multi-objective optimization problem, where the four objectives are contradictory to each other (thinning without thickness and thickening without thinness). Therefore, it is necessary to weigh and compromise each objective, and to consider the efficiency and comprehensiveness of the optimizations. Hence, the NSGA-II multi-objective optimization method is selected for further optimization. Based on the non-dominated sorting genetic algorithm (NSGA), K. Ded, and S. Agrawal optimized Pareto advance ability and proposed NSGA-II [26,27]. By calculating the whole Pareto front, the algorithm approximates the optimal solution in the solution domain. The NSGA-II multi-objective optimization process based on OLHD and RSM is shown in Figure 9.

3.3.2. Parameter Configuration of NSGA-II

Based on the established response surface model, the constraint conditions of NSGA-II can be expressed as Equation (14).
    { F ( x ) = m i n [ Y 1 ( % ) , Y 2 ( % ) , Z 1 ( % ) , Z 2 ( % ) ] s . t . { 0.30 A 0.40 850 B 950 6 C 10 550 D 650 1 E 2 2 F 4
where Y1(%), Y2(%), Z1(%) and Z2(%) represent the third-order response surface mathematical model of the maximum thickening rate of the slow cooling zone, the maximum thinning rate of the slow cooling zone, the maximum thickening rate of the rapid cooling zone, and the maximum thinning rate of the rapid cooling zone, respectively. A, B, C, D, E, and F are the friction coefficient, the sheet austenitizing temperature, the holding time, the heating zone temperature, the upper binder force, and the lower binder force, respectively.
NSGA-II algorithm parameter configuration: the cross distribution index is 10, cross probability is 0.9, the target value of operation failure is 1030, the threshold of operation failure is 1030, the maximum number of convergence steps is 5, the mutation distribution index is 20, the parent population is set to 100, and the number of evolutions is 200.

3.3.3. Analysis of Results after NSGA-II Optimization

The Pareto frontier of the maximum thickening rate and maximum thinning rate in the slow and rapid cooling zone of the B-pillar are obtained after 20,001 iterations. Each target iterative process diagram is shown in Figure 10, where the black points represent non-Pareto forward solutions that do not exceed the constraints, the blue points represent Pareto forward solutions, and the green points represent the optimal solutions after NSGA-II optimization of the global optimization algorithm.
In Figure 10, it is observed that the optimal solution appears at the 17,473 iteration, which is selected as the final optimization result. The maximum thickening rate in the slow cooling zone, the maximum thinning rate in the slow cooling zone, the maximum thickening rate in the rapid cooling zone and the maximum thinning rate in the rapid cooling zone are 11.1%, 12.4%, 4.7% and 7.1%, respectively. The optimized process parameters are as follows: the friction coefficient is 0.3, the sheet metal austenitizing temperature is 950 °C, the holding time is 8 s, the heating zone temperature is 646 °C, the upper binder force is 1 MPa and the lower binder force is 4 MPa.

3.4. Analysis of Simulation Results after Multi-Objective Optimization

The temperature change in the forming parts plays an important role in the microstructure, mechanical properties and forming quality. Hence, the simulation is performed according to the parameter combination in NSGA-II multi-objective optimization to analyze the temperature field, tissue transformation, tensile strength, hardness, thickening rate, thinning rate, and its quality.

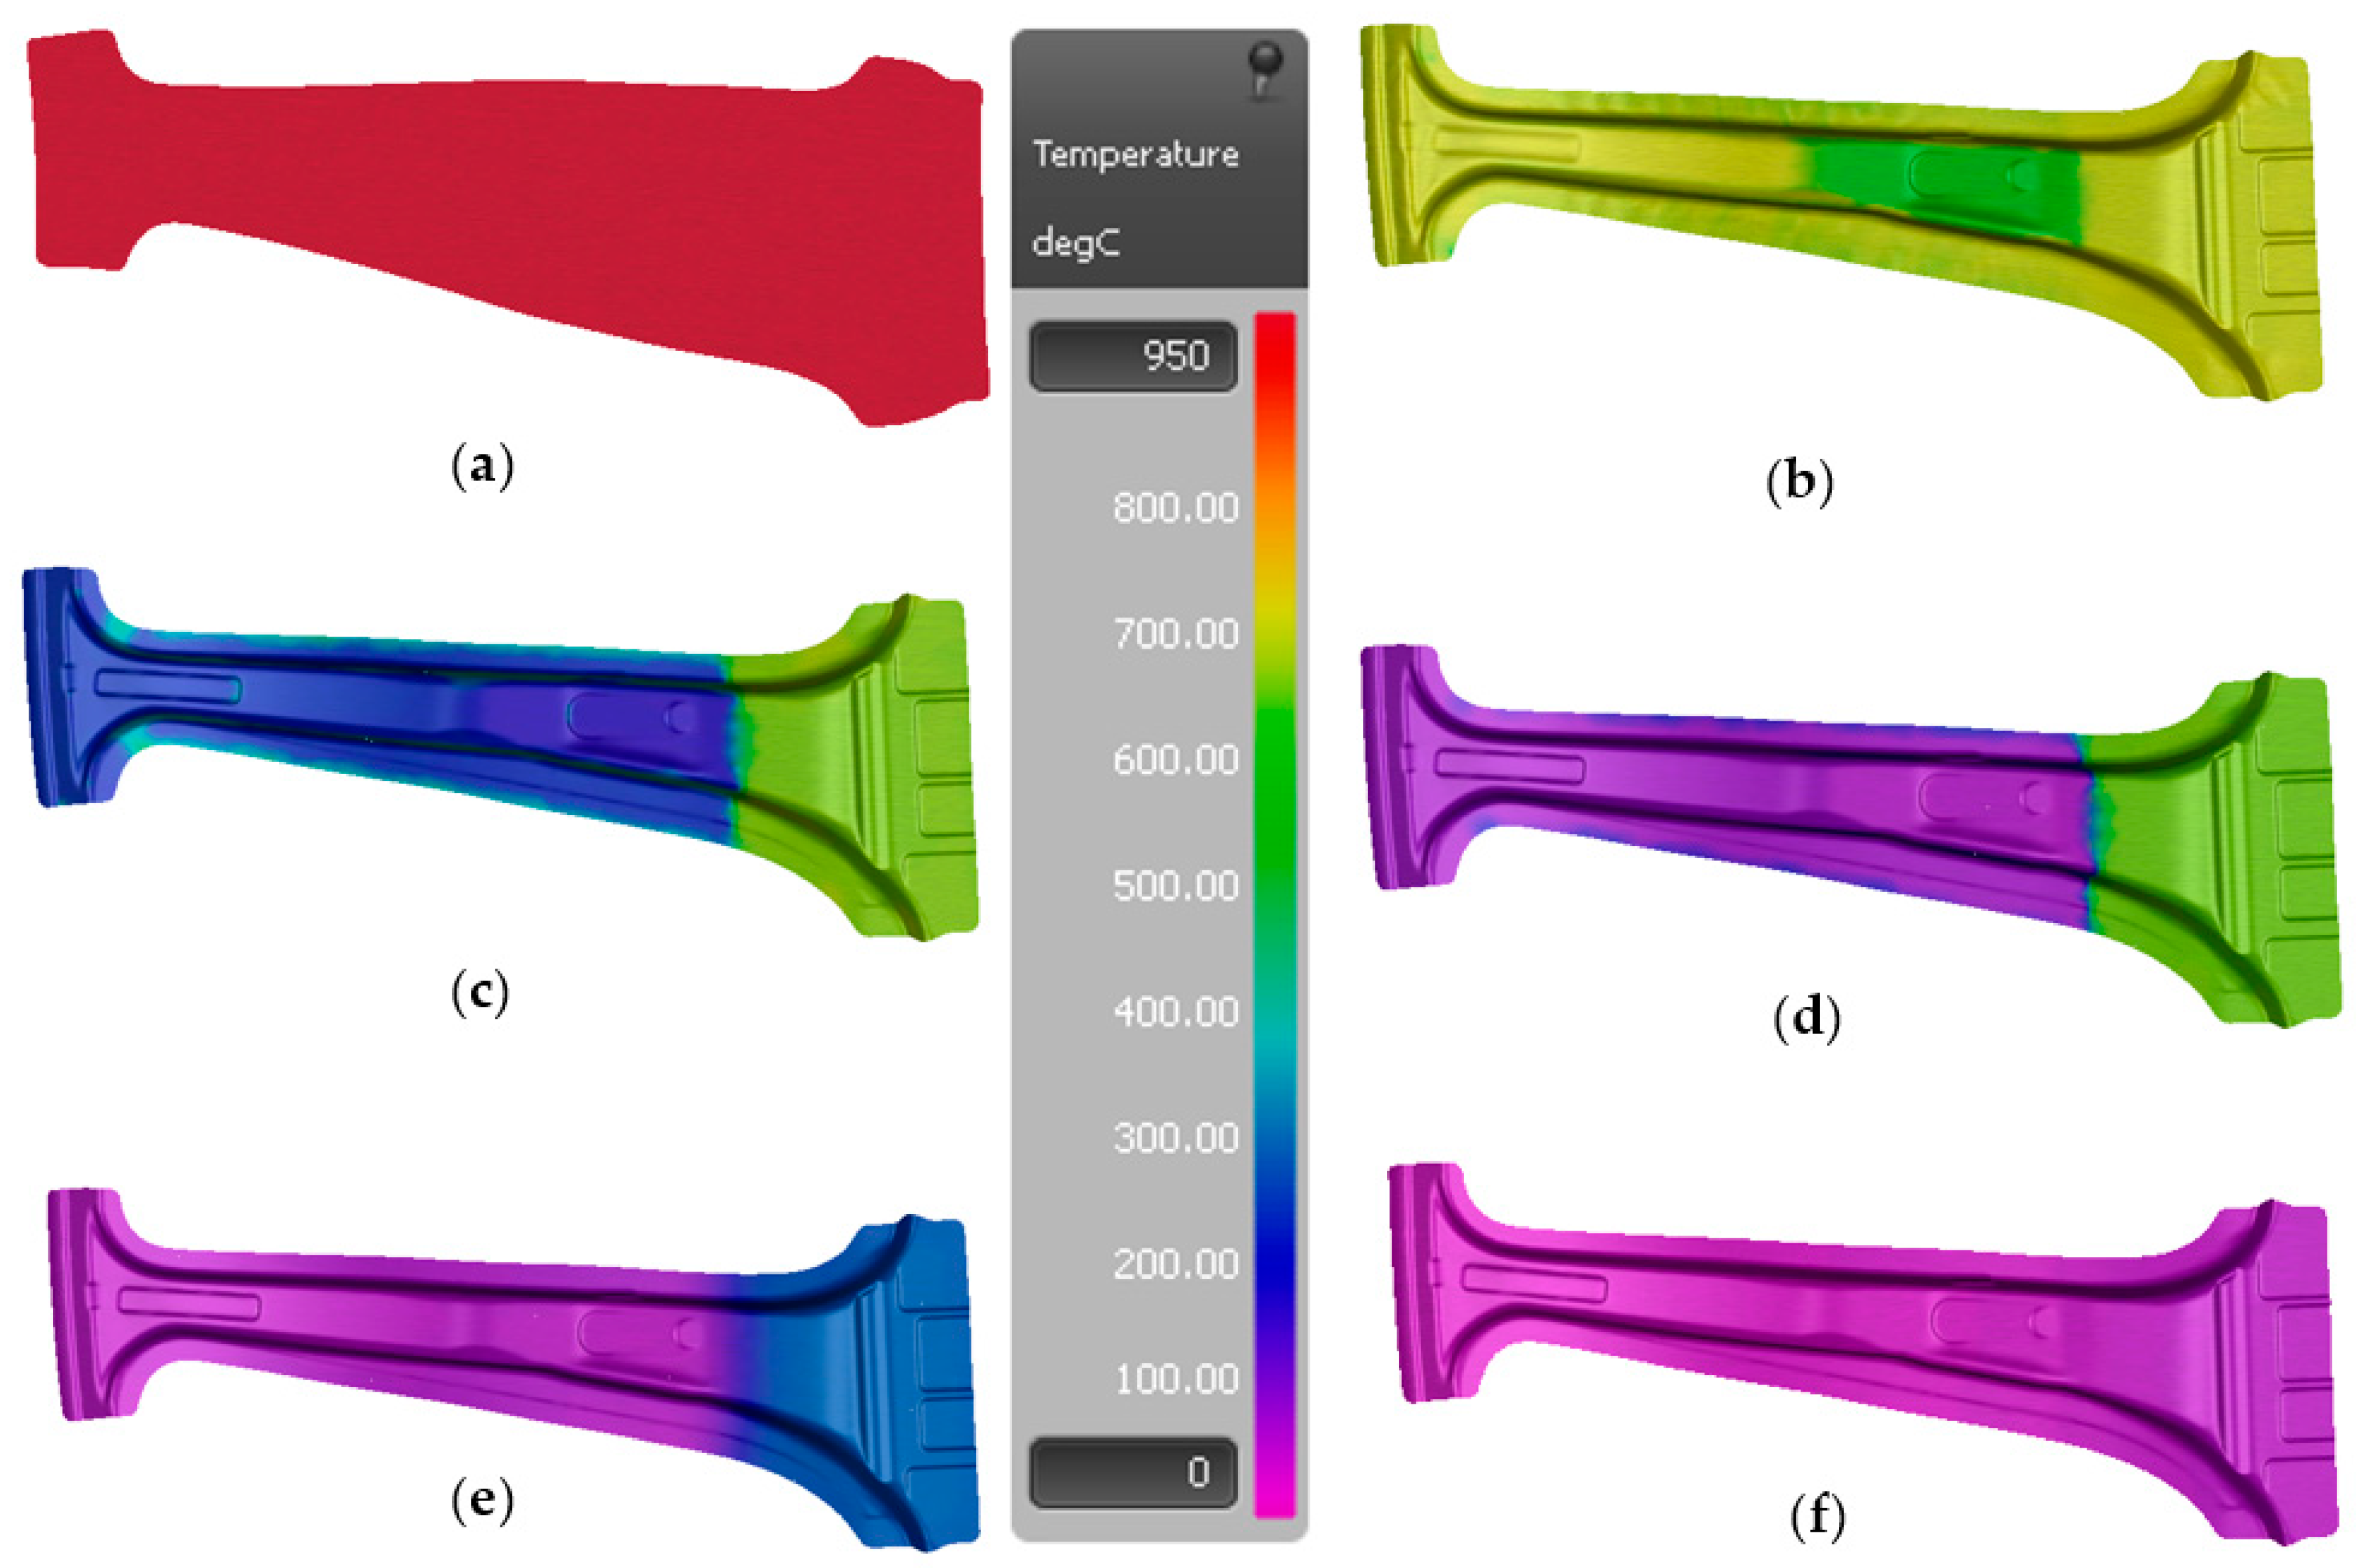
3.4.1. Analysis of the Temperature Field

Figure 11 shows the temperature change during the stamping of the B-pillar. At the beginning, the temperature of the contact area between the sheet metal and the press core decreases faster. Due to the different temperatures in different zones of the mold, the mold temperature in the rapid cooling zone is 75 °C, where the temperature difference between the mold and the high-temperature part is larger, which results in the part temperature decreasing faster; in contrast, the mold temperature in the slow cooling zone is 600 °C, where the temperature difference between the mold and the high-temperature part is smaller, resulting in the part temperature decreasing slower. Meanwhile, it can be observed that the temperature reduction rate of the flange area is faster than that of the fillet area. On the one hand, a large amount of heat is taken away due to the close contact between the sheet metal and the press core; on the other hand, the temperature difference between the die and the sheet metal is large. In addition, the overall temperature of the B-pillar is relatively uniform, and there is no high or low temperature phenomenon in the special parts.

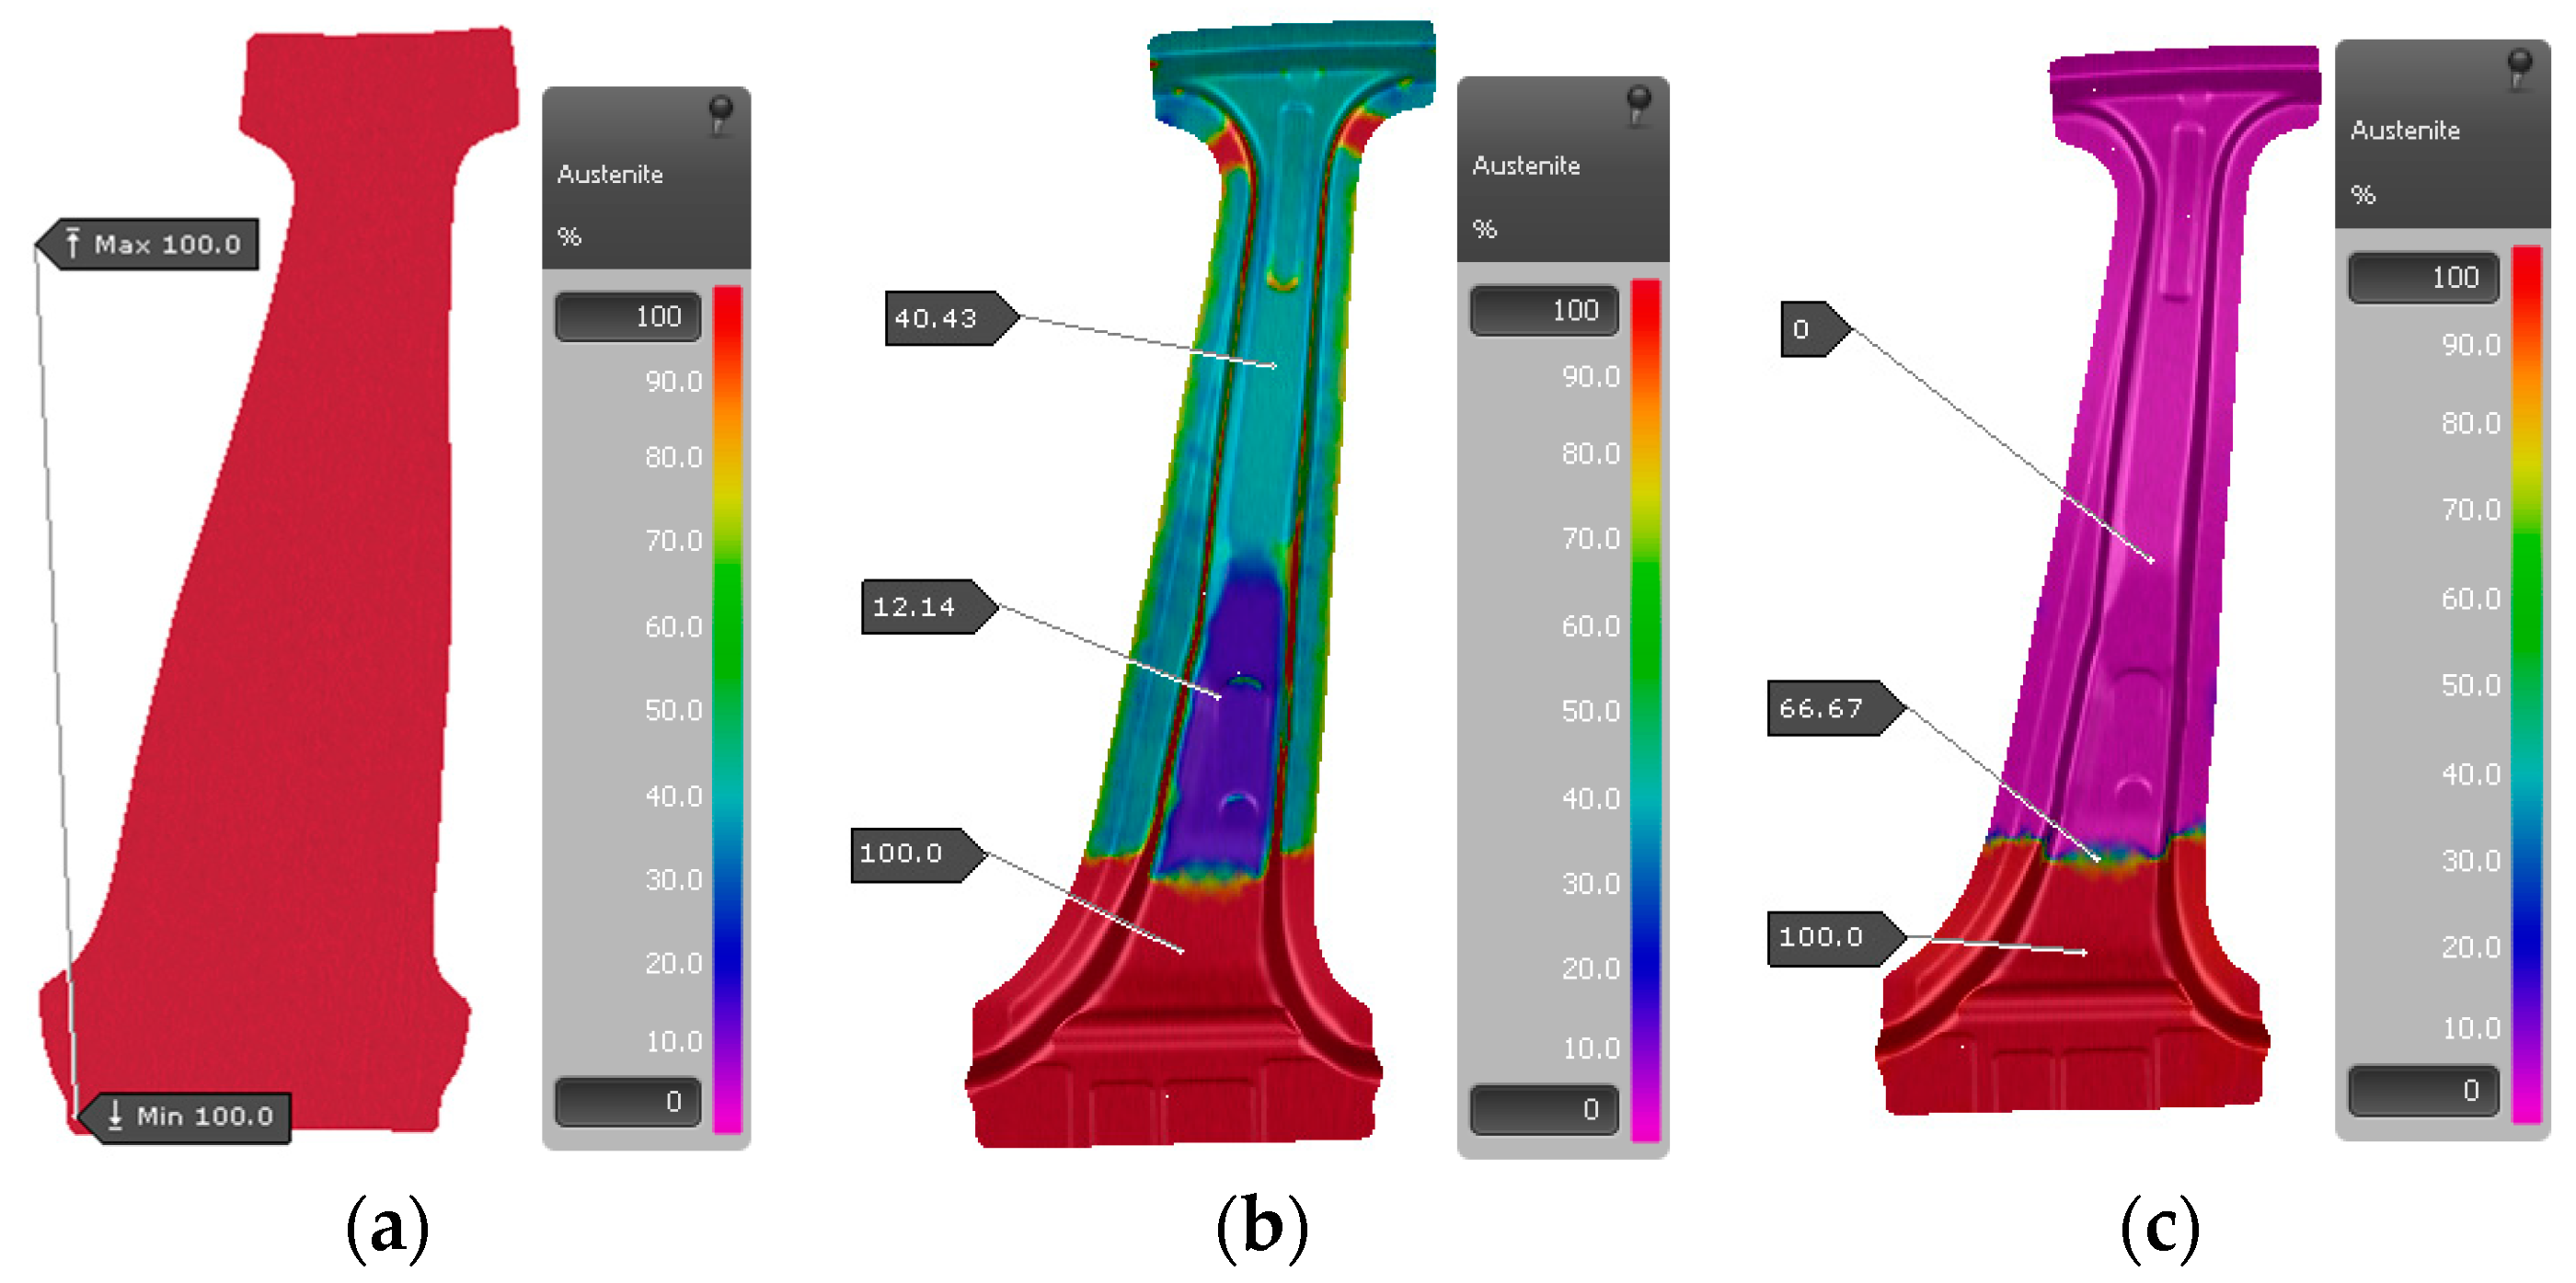
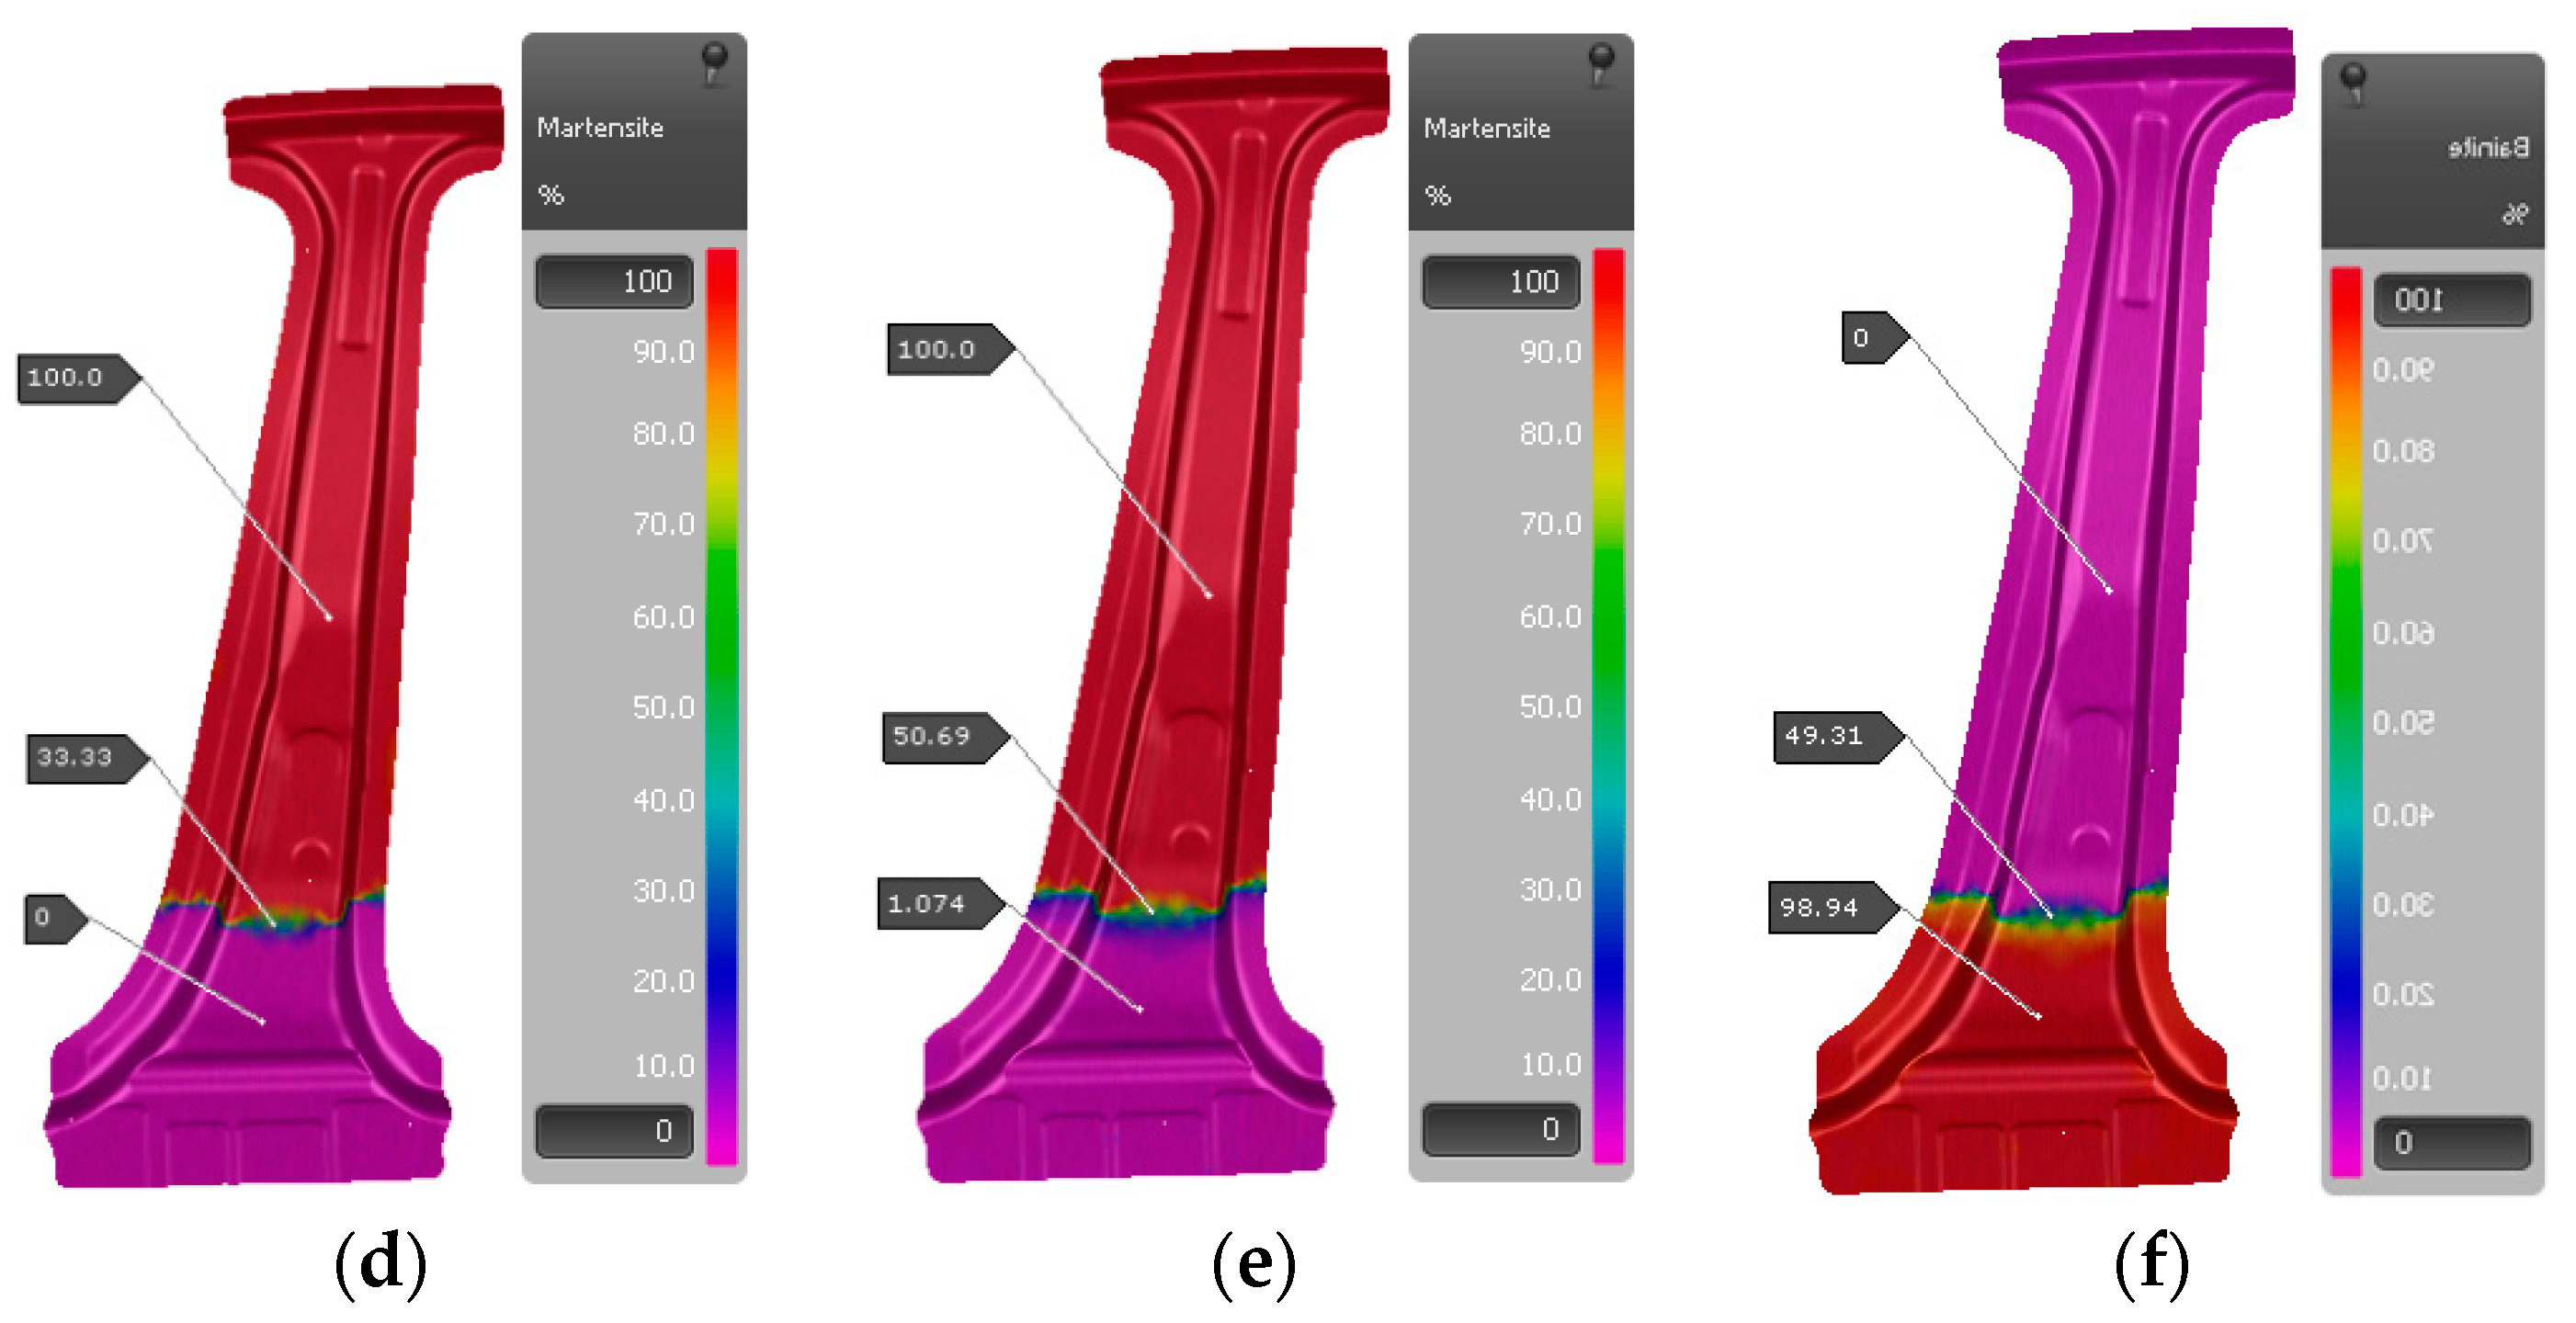
3.4.2. Analysis of the Microstructure

Figure 12 shows the microstructure distribution of the B-pillar at different times. The sheet metal is completely austenitic before stamping; as stamping proceeds, the austenite changes to a martensite structure faster because the temperature of the zone in which the die is in contact with the sheet metal in the rapid cooling zone decreases faster, while the temperature in the slow cooling zone decreases slower, and while some austenite changes to the bainite structure occur, the proportion is only about 10%. After stamping, almost all the austenite in the rapid cooling zone is transformed into a martensite structure, while the slow cooling zone mainly contains an austenite and bainite structure, in which the austenite structure is about 95%. After cooling, the rapid cooling zone is almost all of the martensite structure, and the slow cooling zone is almost all of the bainite structure. The transition zone contains martensite, bainite and a small amount of residual austenite structure.

3.4.3. Analysis of Tensile Strength and Hardness

The tensile strength and hardness distribution of the B-pillar are obtained by simulation as shown in Figure 13. The tensile strength of the rapid cooling zone is about 1476 MPa, while the tensile strength of the slow cooling zone is about 680 MPa. The average Vickers hardness in the rapid cooling zone is about 486 HV, compared with 224 HV in the slow cooling zone.

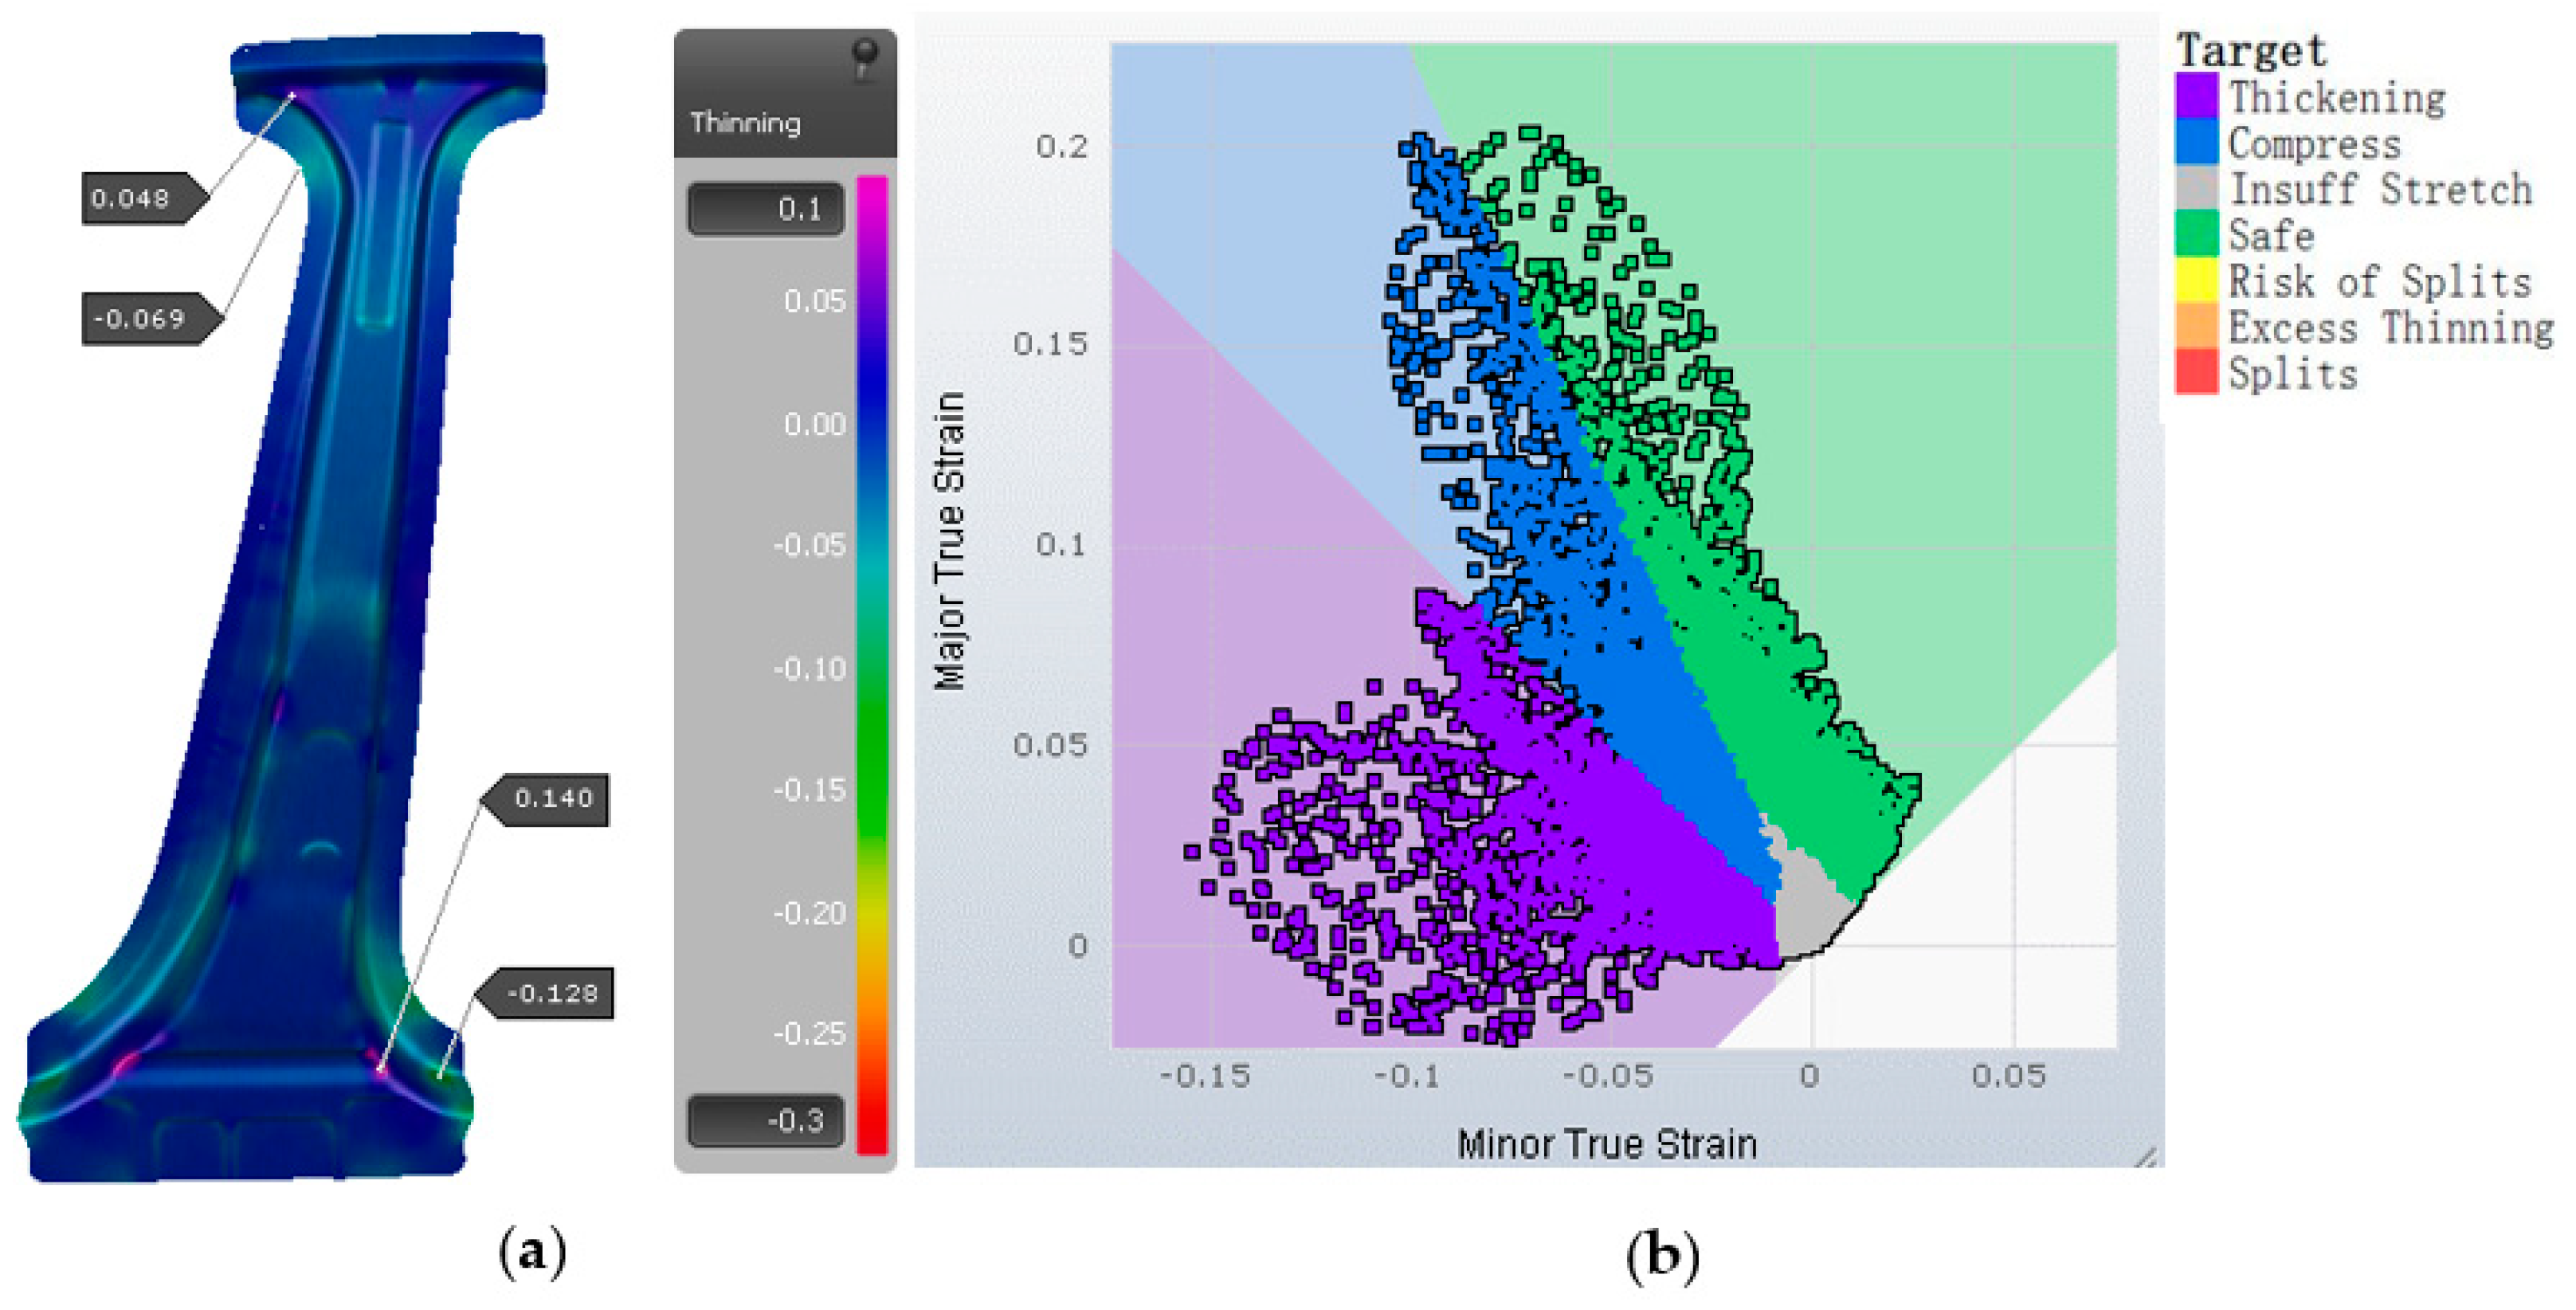
3.4.4. Analysis of the Thickness and Forming Limit Diagram

Figure 14 shows the thickness distribution and forming limit diagram of the B-pillar. The thinning rate of the parts is uniform, and there is no excessive thinning or thickening area. The stress and strain of each point on the part are in a safe state, and there is no phenomenon of a large range of stress concentration, wrinkling or even cracking. The phenomenon of small range thickening and thinning is within a reasonable range and will not have adverse effects on forming quality such as excessive thinning or even cracking, excessive thickening or folding.
The optimization results are evaluated by finite element simulation according to the optimized parameter combination. The optimization results and simulation results are shown in Table 6; the difference in the maximum thickening rate in the slow cooling zone between the optimized value and the simulated value is 2.9%, the error of the maximum thinning rate in the slow cooling zone between the optimized value and the simulated value is 3.1%, the error of the maximum thinning rate in the rapid cooling zone between the optimized value and the simulated value is 2.1%, and the error of the maximum thinning rate in the rapid cooling zone between the optimized value and the simulated value is 2.9%, which fully verify the accuracy of NSGA-II multi-objective optimization.

3.5. Hot Stamping and Mechanical Properties Test

In order to verify the accuracy of parameter selection after optimization of the NSGA-II multi-objective optimization based on the RSM, the hot stamping test is first carried out according to the optimized process parameter combination. Then, it is necessary to further test the microstructure and mechanical properties of different zones of the B-pillar to verify the applicability of the partition cooling in the hot stamping process in order to prepare parts with partition properties. Therefore, the thickness, microstructure, tensile strength and hardness of the B-pillar should be tested. The sampling positions of each test are shown in Figure 15.

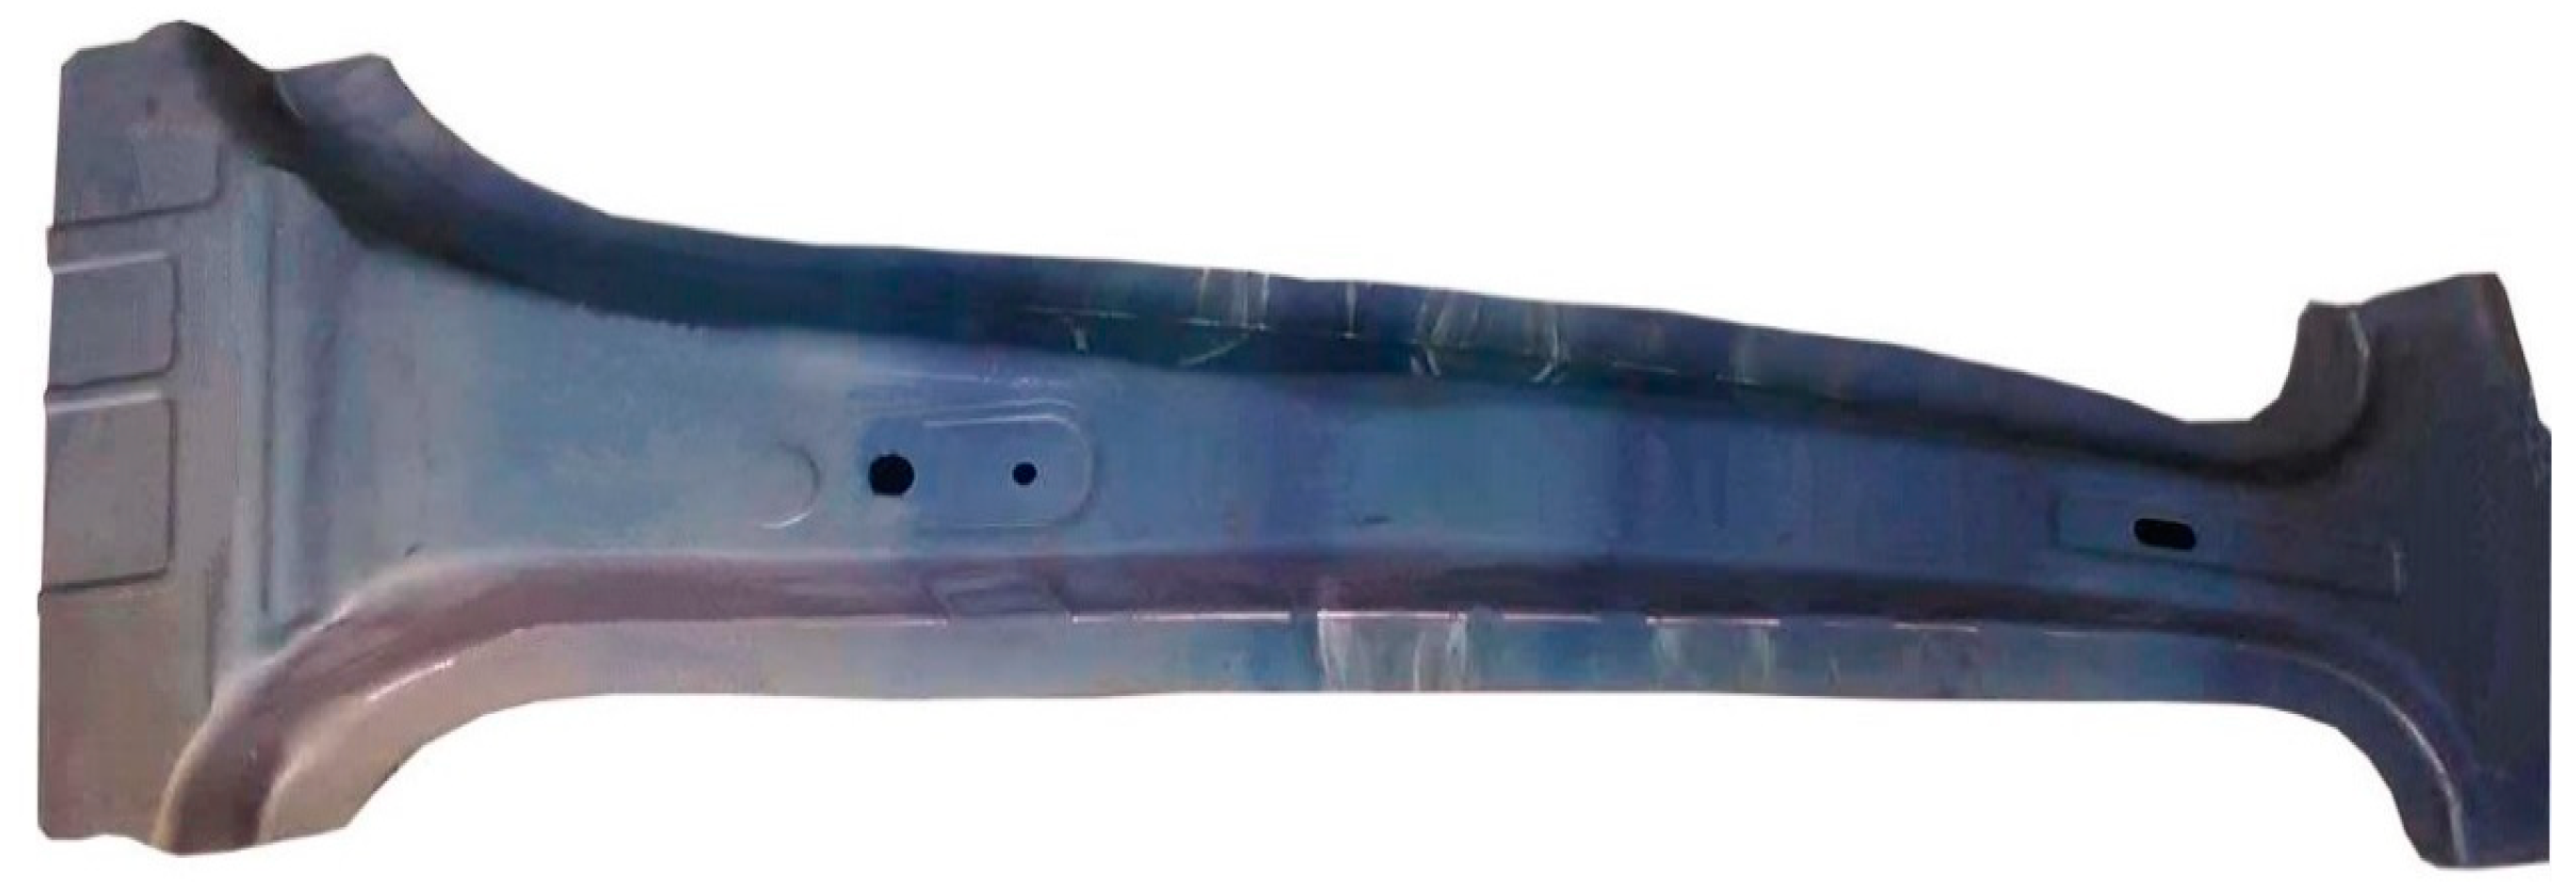
3.5.1. Hot Stamping Testing

The optimized process parameters are selected for the hot stamping test. The blank is first heated to 950 °C in the heating furnace and maintained for 10 min; then, the high temperature blank is quickly transferred to the die to fix and complete the stamping process quickly. Following this, the installation of water pipes inside the zone of the rapid cooling to ensure rapid cooling is carried out, and the power of the heating rod installed in the slow cooling area is adjusted to keep the die temperature at around 600 °C. When the overall temperature of the B-pillar is reduced below 200 °C, the die is opened and removed; the trimming and hole cutting are completed on the laser cutting equipment. Finally, shot peening treatment is carried out to remove the oxide skin on the surface of the parts. The hot-stamped B-pillar with partition cooling is shown in Figure 16, and its surface is smooth and free of obvious cracking.

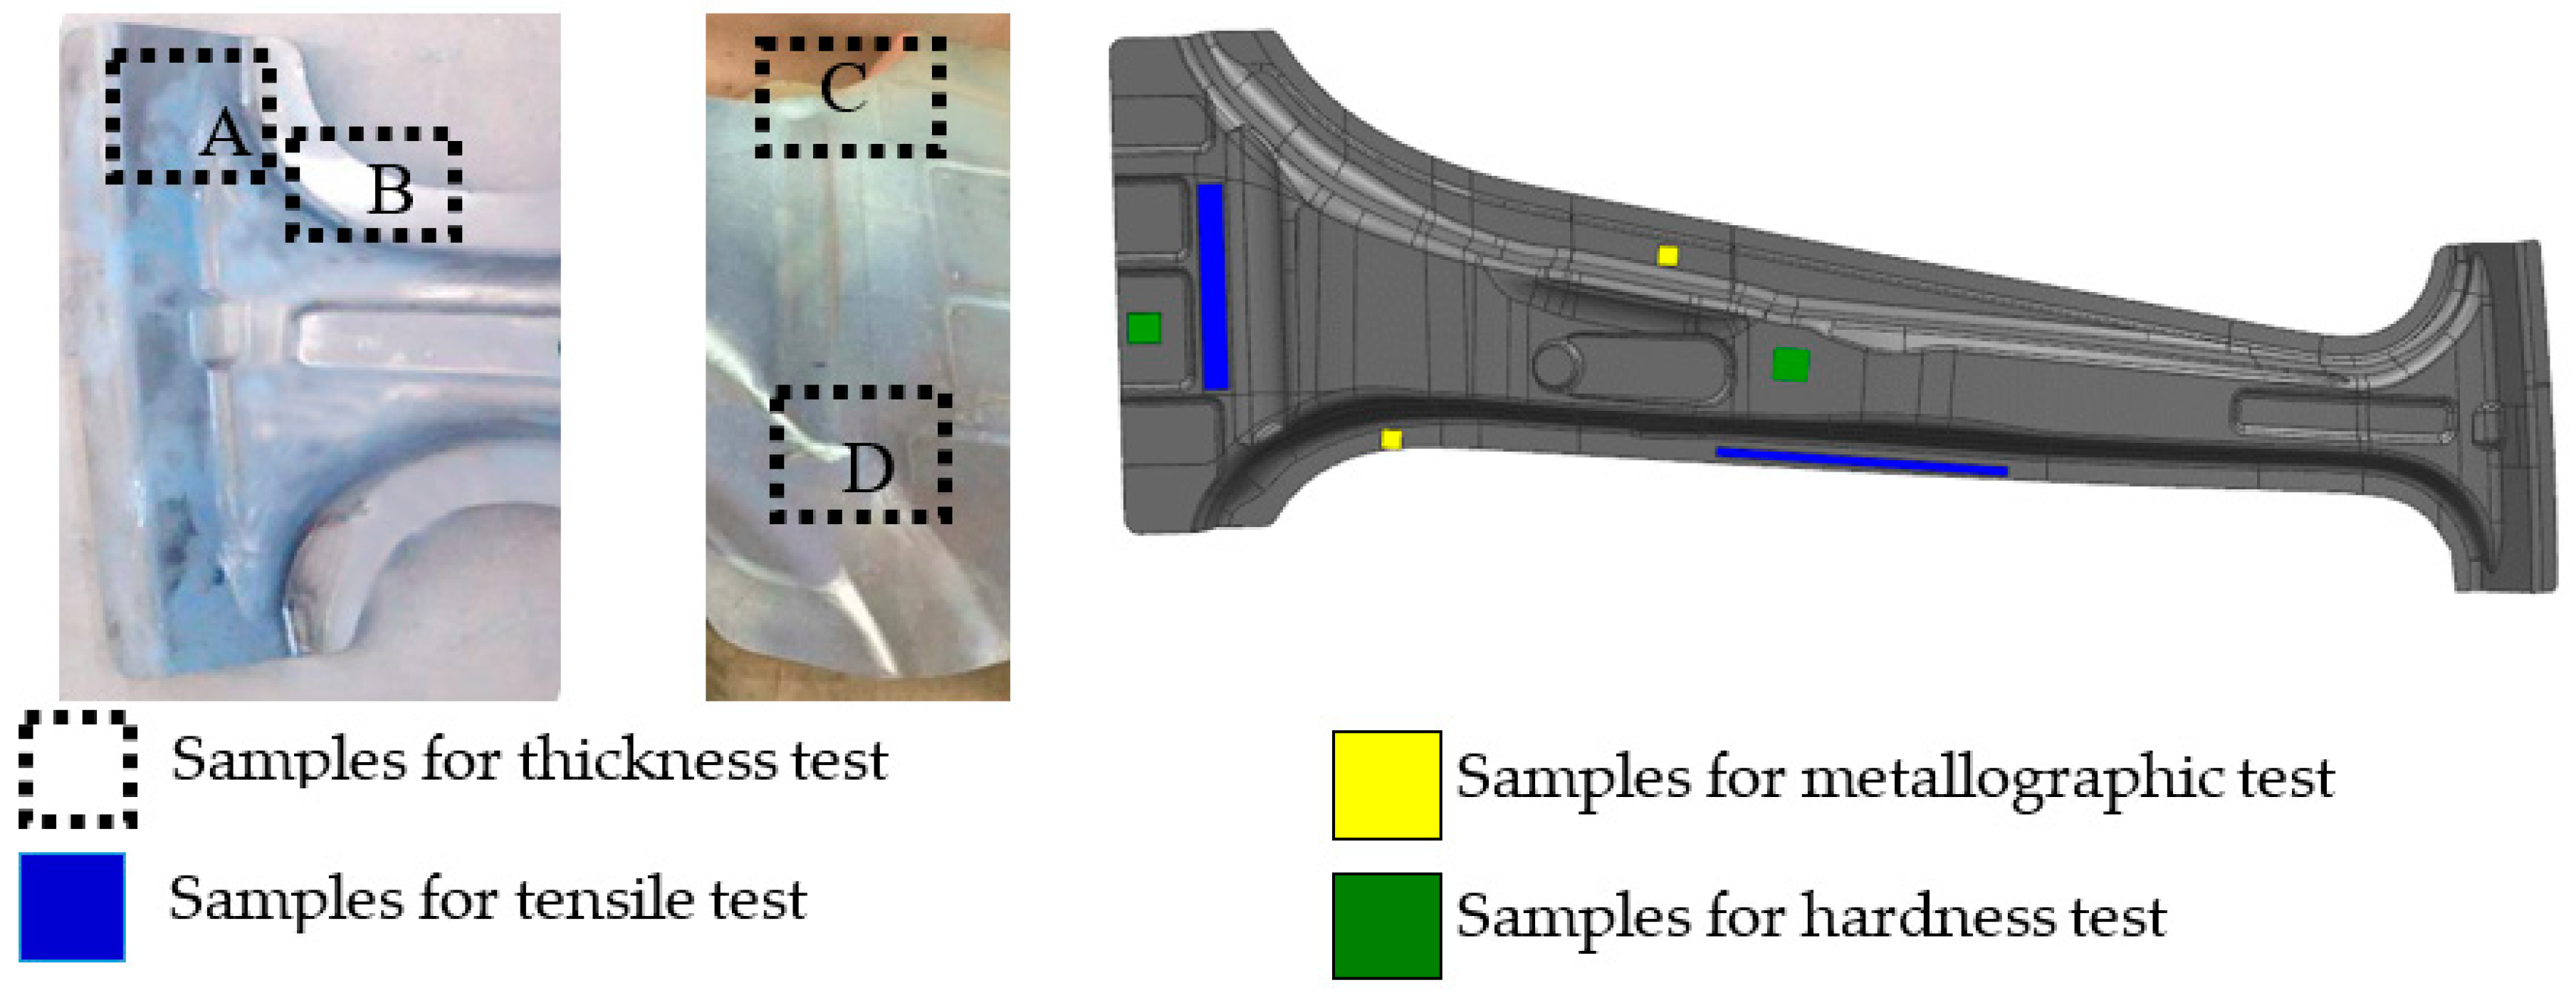
3.5.2. Thickness Test

The average thickness is measured five times after cutting due to the large size of the B-pillar. The average thicknesses measured at A, B, C and D are about 1.57 mm, 1.40 mm,1.31 mm, and 1.72 mm, respectively. Because there are many factors affecting thickness in actual production, there is a certain error between the average thickness at the sampling site and the simulated value, but the measured thickness meets the production requirements.

3.5.3. Microstructure

A sample is taken from the rapid cooling and slow cooling zones, cut into 5 mm × 5 mm, and then inlaid. After polishing, it is corroded with 5% nitric acid alcohol solution. The microstructure is observed by a TMR1700 metallographic microscope (Beijing Time High Technology Co., Ltd., Beijing, China). Figure 17a is a metallographic photograph of the microstructure in the slow cooling zone, where the pearlite particles are uniformly distributed on a ferrite matrix, and Figure 17b is a metallographic photograph of the microstructure in the rapid cooling zone, where there is almost parallel and isometric lath martensite. The difference in metallographic microstructure proves that partition cooling can control the cooling and deformation of sheet metal in a non-uniform temperature field.

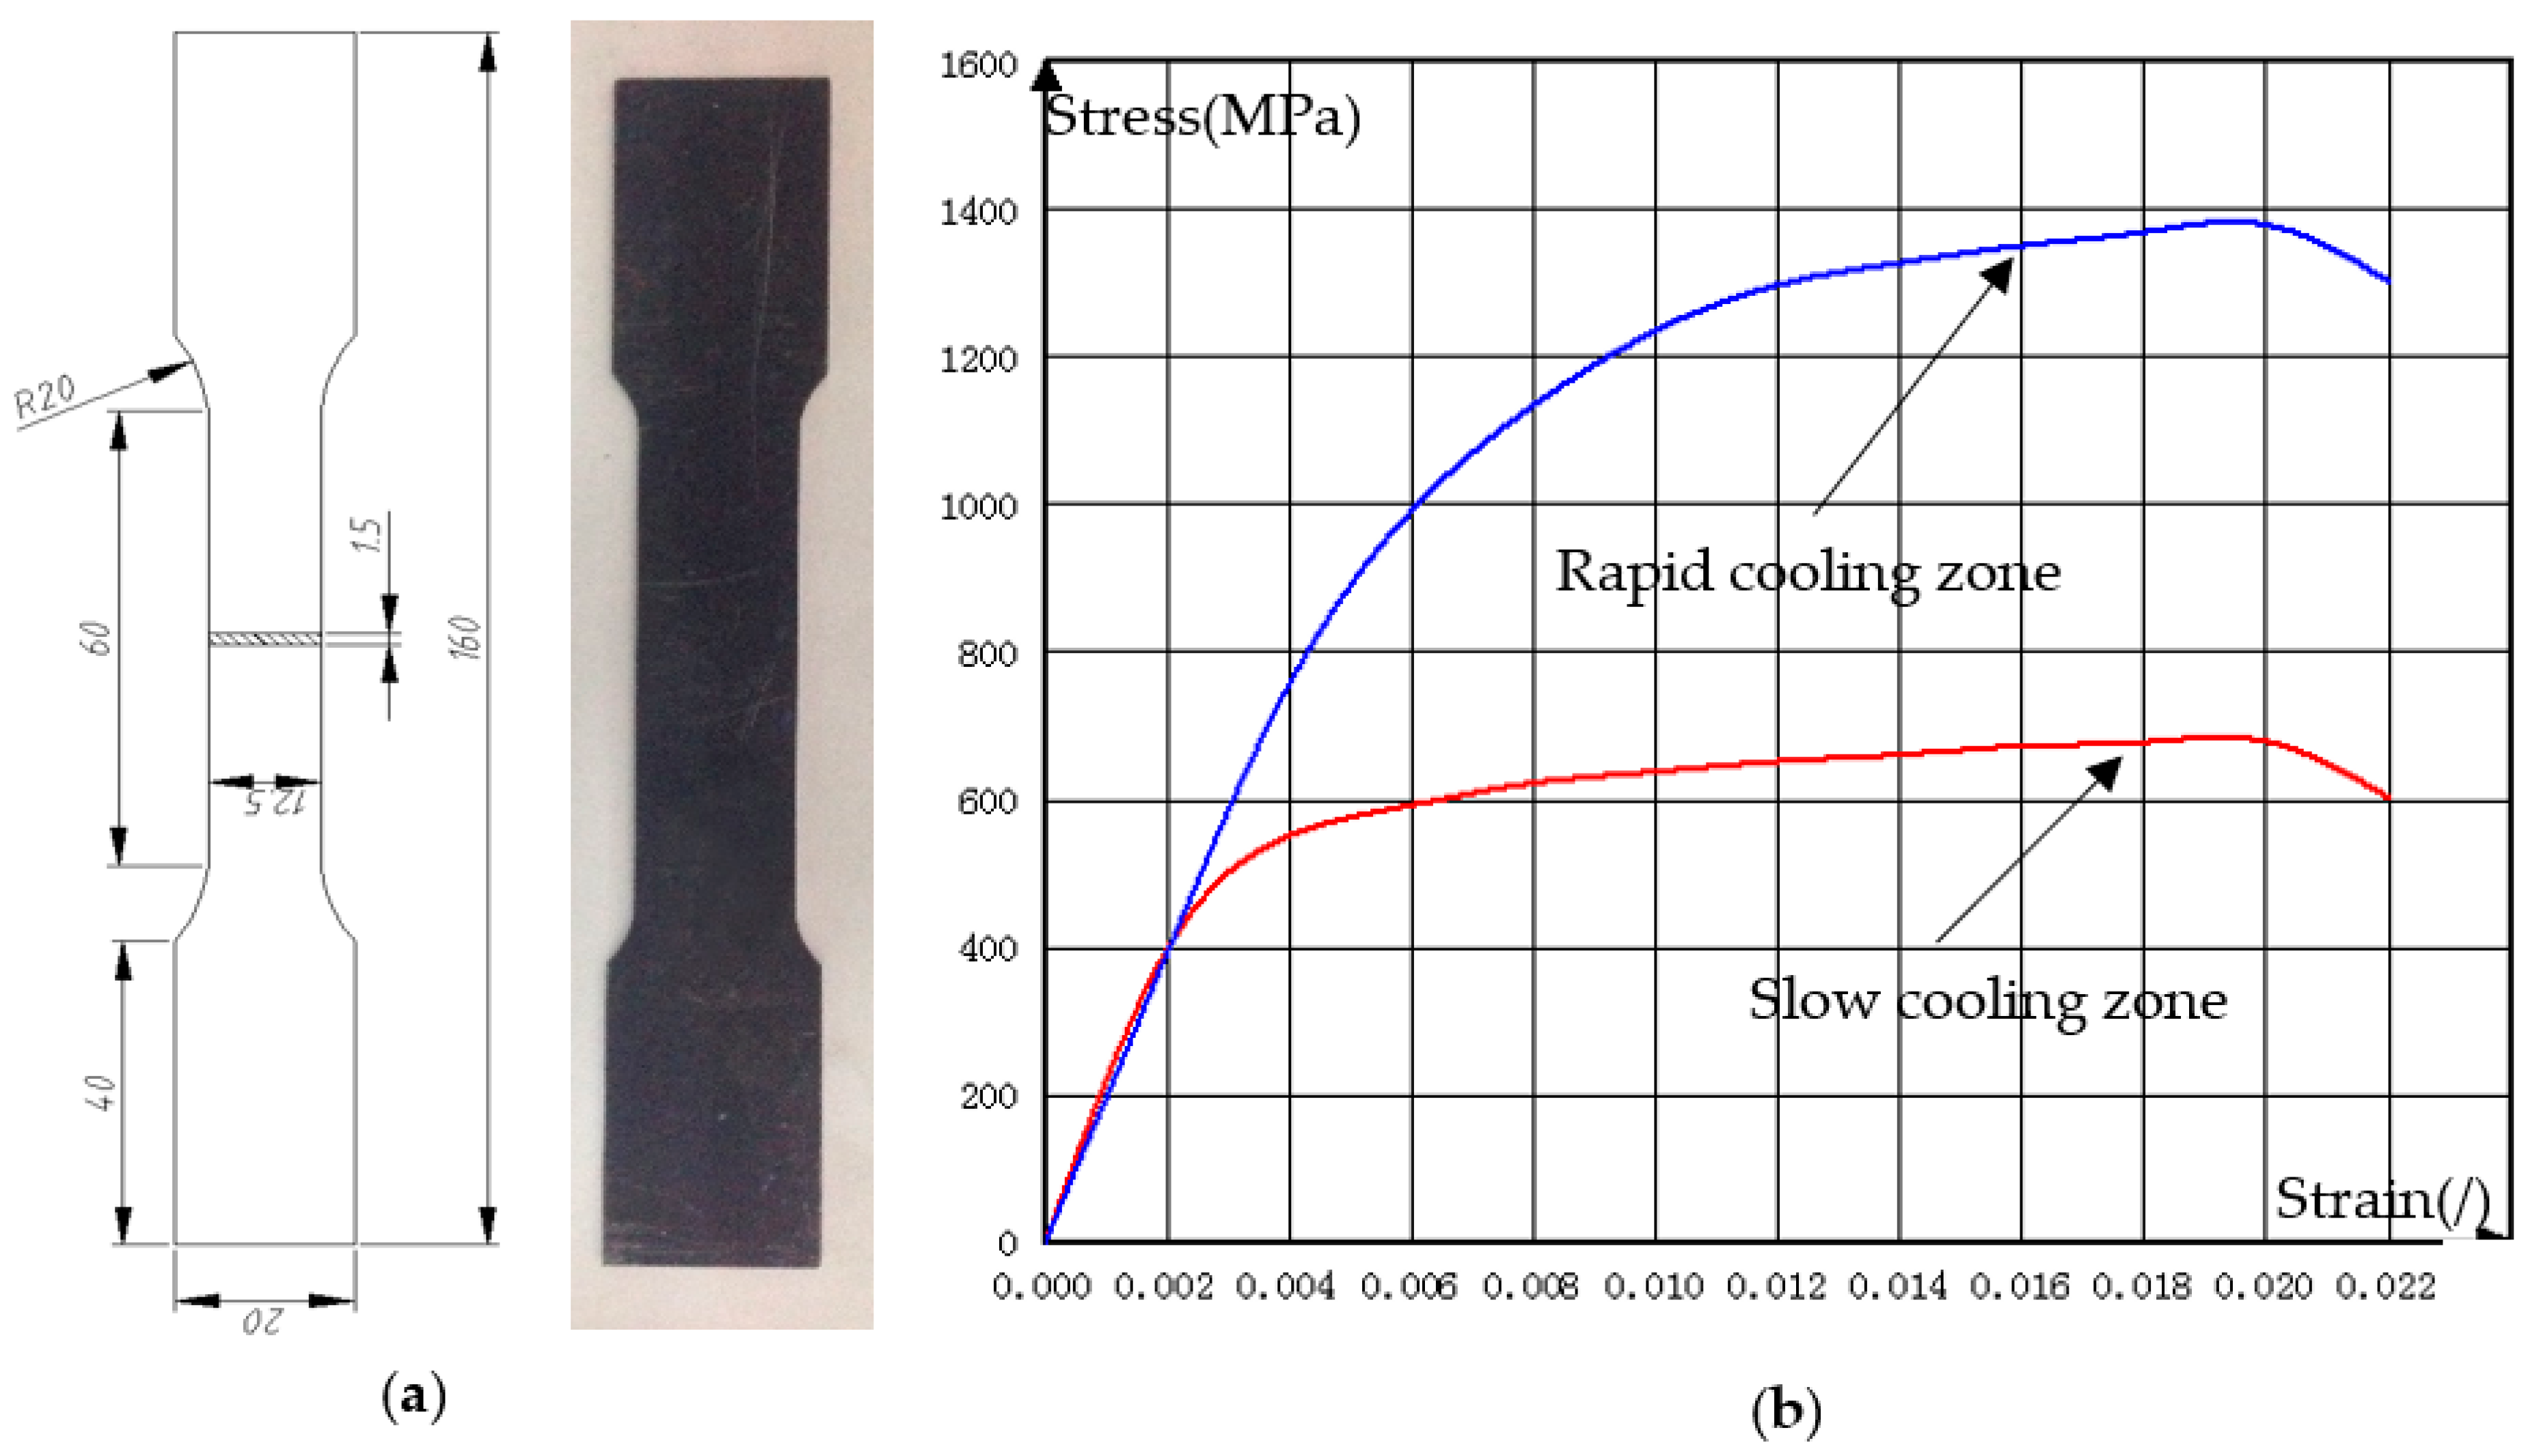
3.5.4. Tensile and Hardness Test

Tensile specimens were prepared, and tensile tests were carried out using a DDL100 electronic universal tensile testing machine (Changchun Research Institute for Mechanical Science Co., Ltd., Changchun, China) with a maximum tensile force of 200 kN. The martensite has high tensile strength and low elongation, while the mechanical properties of pearlite and ferrite are opposite. Figure 18 shows the tensile testing specimen and the tensile strength curves measured in different regions. The blue curve is the tensile strength curve obtained from the rapid cooling area, which has a value of up to 1390 MPa. The red curve is the tensile strength curve obtained from the slow cooling region, which has value of about 680 MPa. The results of the tensile test correspond well to the simulation results. According to Table 7, The elongation of the rapid cooling zone is as low as 7%, while the elongation in the slow cooling region is 11.4%.
The hardness was measured by a HVS-1000Z microhardness meter (Jinan Victory Instrument Co., Ltd., Jinan, China). with a load of 1 kgf, holding pressure for 10 s. Take the average of the hardness values measured three times in different areas of the part. The hardness of the rapid cooling zone can reach 478.78 HV, and the hardness of the slow cooling zone is 230.56 HV. The distribution trend of hardness is consistent with that of strength, but opposite to that of plastic distribution. The results of the hardness test correspond well with the simulation results.

4. Conclusions

(1)
The obtained four simulation values are extremely consistent with the multi-objective optimization values. The error between the optimized value, the simulated value of the maximum thickening rate in the slow cooling zone, the maximum thinning rate in the slow cooling zone, the maximum thickening rate in the rapid cooling zone, and the maximum thinning rate in the rapid cooling zone is 2.9%, 3.1%, 2.1%, 2.9%, respectively, which fully validates the accuracy of the method of multi-objective optimization based on RSM and NSGA-II.
(2)
The combination of the optimized parameters can be used to produce a partition-cooling hot-stamping B-pillar. The results of the thickness, microstructure, tensile strength and hardness test correspond well with the simulation results.
(3)
The microstructure of the ferrite and pearlite structure is uniformly distributed in the slow cooling zone, and its tensile strength reaches 680 MPa, its elongation is 11.4% and its hardness is 230.56 HV. In contrast, the lath martensite structure is obtained in the rapid cooling zone, and its tensile strength is up to 1390 MPa, its elongation is about 7.0% and its hardness can reach 478.78 HV.

Author Contributions

Methodology, investigation, validation, investigation, software, data collection, data analysis, data interpretation, writing—original draft and writing—review &editing, M.C. and Z.W.; Both authors contributed equally to this work. conceptualization, supervision, funding acquisition, resources; and writing—review and editing, L.W.; conceptualization, supervision, and resources, Y.H.; All authors have read and agreed to the published version of the manuscript.

Funding

This work was financially supported by National Natural Science Foundation of PR China (Grant No. 51775249).

Conflicts of Interest

The authors have no conflict of interest to declare.

References

  1. Chu, Y.T.; Sun, L.Y.; Li, L.J. Lightweight scheme selection for automotive safety structures using a quantifiable multi-objective approach. J. Clean. Prod. 2019, 241, 118316. [Google Scholar] [CrossRef]
  2. Dama, K.K.; Babu, V.S.; Rao, R.N. State of the art on automotive lightweight body-in-white design. Mater. Today 2018, 5, 20966–20971. [Google Scholar]
  3. Heggemann, T.; Homberg, W. Deep drawing of fiber metal laminates for automotive lightweight structures. Compos. Struct. 2019, 216, 53–57. [Google Scholar] [CrossRef]
  4. Song, H.J.; Yoo, J.S.; Kim, S.-H. Novel ultra-high-strength Cu-containing medium-Mn duplex lightweight steels. Acta Mater. 2017, 135, 215–225. [Google Scholar] [CrossRef]
  5. Rana, R.; Liu, C.; Ray, R.K. Evolution of microstructure and mechanical properties during thermomechanical processing of a low-density multiphase steel for automotive application. Acta Mater. 2014, 75, 227–245. [Google Scholar] [CrossRef]
  6. Liu, X.L.; Cao, J.G.; Chai, X.T. Investigation of forming parameters on springback for ultra high strength steel considering Young’s modulus variation in cold roll forming. J. Manuf. Process. 2017, 29, 289–297. [Google Scholar] [CrossRef]
  7. Song, J.H.; Jang, I.; Gwak, S.Y. Effect of pulsed currents on the springback reduction of ultra-high strength steels. J. Manuf. Process. 2017, 207, 359–364. [Google Scholar] [CrossRef]
  8. Kong, H.; Chao, Q.; Rolfe, B. One-step quenching and partitioning treatment of a tailor welded blank of boron and TRIP steels for automotive applications. Mater. Des. 2019, 174, 107799. [Google Scholar] [CrossRef]
  9. Marion, M.; Maren, J.; Michael, L. A review on tailored blanks—Production, applications and evaluation. J. Mater. Process. Tech. 2014, 214, 151–164. [Google Scholar]
  10. Zhu, B.; Zhu, J.; Wang, Y.N. Combined hot stamping and Q&P processing with a hot air partitioning device. J. Mater. Process. Technol. 2018, 262, 392–402. [Google Scholar]
  11. Mu, Y.H.; Zhou, J.; Wang, B.Y. Numerical simulation of hot stamping by partition heating based on advanced constitutive modelling of 22MnB5 behaviour. Finite Elem. Anal. Des. 2018, 147, 34–44. [Google Scholar] [CrossRef]
  12. Karbasian, H.; Ekkaya, A.E. A review on hot stamping. J. Mater. Process. Technol. 2010, 210, 2103–2118. [Google Scholar] [CrossRef]
  13. Nakagawa, Y.; Mori, K.; Suzuki, Y. Tailored tempering without die heating in hot stamping of ultra-high strength steel parts. Mater. Des. 2020, 192, 108704. [Google Scholar] [CrossRef]
  14. Mori, K.; Okuda, Y. Tailor die quenching in hot stamping for producing ultra-high strength steel formed parts having strength distribution. CIRP Ann. 2010, 59, 291–294. [Google Scholar] [CrossRef]
  15. Mori, K.; Maeno, T.; Mongkolkaji, K. Tailored die quenching of steel parts having strength distribution using bypass resistance heating in hot stamping. J. Mater. Process. Technol. 2013, 21, 508–514. [Google Scholar] [CrossRef]
  16. George, R.; Bardelcik, A.; Worswick, M.J. Hot forming of boron steels using heated and cooled tooling for tailored properties. J. Mater. Process. Technol. 2012, 212, 2386–2399. [Google Scholar] [CrossRef]
  17. Ota, E.; Yogo, Y.; Iwata, N. CAE-based process design for improving formability in hot stamping with partial cooling. J. Mater. Process. Technol. 2019, 263, 198–206. [Google Scholar] [CrossRef]
  18. Wang, Y.J. Research of the Mechanical Properties of Parts of HSS Tailored Tempering. Master’s Thesis, Huazhong University of Science and Technology, Wuhan, China, 2015. [Google Scholar]
  19. Yang, S.N.; Wang, L.G. Study on selective cooling of ultra high strength steel car body in hot forming. Int. J. Adv. Manuf. Tech. 2018, 97, 1583–1590. [Google Scholar] [CrossRef]
  20. Mu, Y.H. Study on Hot Stamping of Boron Steel by Partition Heating: Modelling and Simulation Coupling Thermal-Force-Phase Transformation. Master’s Thesis, Beijing University of Science and Technology, Beijing, China, 2019. [Google Scholar]
  21. Wang, H.Y.; Xie, H.; Cheng, W. Multi-objective optimisation on crashworthiness of front longitudinal beam (FLB) coupled with sheet metal stamping process. Thin Wall Struct. 2018, 132, 36–47. [Google Scholar] [CrossRef]
  22. Zhang, W.W.; Han, C.; Yuan, S. Hot forming processing simulation of torsion beam of high strength steel 22MnB5. Mater. Sci. Tech-Lond. 2014, 22, 16–22. [Google Scholar]
  23. Wang, Z.W.; Wang, K.; Liu, Y.; Zhu, B.; Zhang, Y.S.; Li, S.Q. Multi-scale simulation for hot stamping quenching & partitioning process of high-strength steel. J. Mater. Process. Technol. 2019, 269, 150–162. [Google Scholar]
  24. Abdulhay, B.; Bourouga, B.; Dessain, C. Experimental and theoretical study of thermal aspects of the hot stamping process. Appl. Therm. Eng. 2011, 31, 674–685. [Google Scholar] [CrossRef]
  25. Fuerle, F.; Sienz, J. Decomposed surrogate-based optimization of carbon-fiber bicycle frames using Optimum Latin Hypercubes for constrained design spaces. Comput. Struct. 2013, 119, 48–59. [Google Scholar] [CrossRef]
  26. Cheng, W.; Zhang, H.L.; Fu, S. A process-performance coupled design method for hot-stamped tailor rolled blank structure. Thin Wall Struct. 2019, 140, 132–143. [Google Scholar] [CrossRef]
  27. Xiao, X.; Kim, J.J.; Hong, M.P.; Yang, S.; Kim, Y.S. RSM and BPNN modeling in incremental sheet forming process for AA5052 sheet: Multi-objective optimization using genetic algorithm. Metals 2020, 10, 1003. [Google Scholar] [CrossRef]
Figure 1. (a) Mechanical properties of 22MnB5; (b) CCT curve [12], with permission from Elsevier, 2020.
Metals 10 01264 g001
Figure 2. The principle and procedures of the hot stamping process.
Metals 10 01264 g002
Figure 3. 3D model of the B-pillar.
Metals 10 01264 g003
Figure 4. Simulation model.
Metals 10 01264 g004
Figure 5. The distribution of test points: (a) optimal Latin hypercube design (OLHD) in a 3D space; (b) OLHD in a 2D space.
Metals 10 01264 g005
Figure 6. Fit graphs of response values of (a) maximum thickening rate in the slow cooling zone; (b) maximum thinning rate in the slow cooling zone; (c) maximum thickening rate in the rapid cooling zone; and (d) maximum thinning rate in the rapid cooling zone.
Metals 10 01264 g006
Figure 7. Interactive effect of process parameters on thickness in slow cooling zone, (a) A and B on Y1, (b) A and B on Y2, (c) C and D on Y1, (d) C and D on Y2, (e) E and F on Y1, (f) E and F on Y2.
Metals 10 01264 g007aMetals 10 01264 g007b
Figure 8. Interactive effect of process parameters on thickness in the rapid cooling zone, (a) A and B on Z1, (b) A and B on Z2, (c) E and F on Z1, (d) E and F on Z2.
Metals 10 01264 g008
Figure 9. Multi-objective optimization of the thickness in B-pillar based on the response surface methodology (RSM) and the non-dominated sorting genetic algorithm (NSGA-II).
Metals 10 01264 g009
Figure 10. NSGA-II optimization process for all objectives.
Metals 10 01264 g010aMetals 10 01264 g010b
Figure 11. The change in temperature during the partition cooling in hot stamping: (a) before stamping; (b) stamping for 3 s; (c) stamping for 5 s; (d) stamping completed; (e) cooling; and (f) cooled.
Metals 10 01264 g011
Figure 12. Microstructure distribution at different times: (a) before stamping; (b) stamping for 4 s; (c) austenite distribution after stamping; (d) martensite distribution after stamping; (e) martensite distribution after being cooled; and (f) martensite distribution after being cooled.
Metals 10 01264 g012aMetals 10 01264 g012b
Figure 13. Distribution of (a) tensile strength; (b) Vickers hardness.
Metals 10 01264 g013
Figure 14. (a) Thickness distribution; (b) forming limit diagram of the B-pillar.
Metals 10 01264 g014
Figure 15. Test sampling location.
Metals 10 01264 g015
Figure 16. Hot stamping parts of the B-pillar.
Metals 10 01264 g016
Figure 17. Microstructure of B-pillar: (a) Slow cooling zone; (b) Rapid cooling zone.
Metals 10 01264 g017
Figure 18. (a) Tensile testing specimens and (b) tensile strength curves of the B-pillar.
Metals 10 01264 g018
Table 1. Chemical composition of ultrahigh-strength steel 22MnB5 (wt%).
CMnCrSiBPSAlFe
0.2251.240.1630.2560.0030.0130.0030.031Balance
Table 2. Main mechanical properties of ultrahigh-strength steel 22MnB5.
Temperature
(°C)
Young’s Modulus (Gpa)Poisson Ratio/10−5Coefficient of Thermal ExpansionThermal Conductivity (W/m·K)Specific Heat (J/kg·K)
22MnB5202120.2841.0031.0450
2001990.2891.0034.0460
4001660.2981.2040.0472
6001500.3111.3042.0703
8001340.3251.4043.0912
9001260.3341.4543.51018
10001180.3431.5044.01094
Table 3. Experimental factors and range of the optimal Latin hypercube.
FactorsLower BoundaryUpper Boundary
A0.30.5
B/°C850950
C/s610
D/°C550650
E/MPa12
F/MPa24
Table 4. The schemes and simulation results.
Exp. NoA/-B/°CC/sD/°CE/MPaF/MPaY1/%Y2/%Z1/%Z2/%
10.389259.86481.362.9615.713.34.97.4
20.409419.46111.983.2714.413.74.77.1
30.438916.56501.273.0016.714.35.17.4
40.429168.35591.092.2715.913.45.07.3
⋮⋮⋮⋮⋮⋮⋮⋮⋮⋮⋮⋮⋮⋮⋮⋮⋮⋮⋮⋮⋮⋮
410.328899.56201.822.5016.913.35.57.1
420.458598.96431.662.4116.814.45.17.1
430.358988.06301.212.0015.613.55.47.2
440.459169.95951.592.1415.414.35.07.3
450.368646.56161.752.4616.713.45.67.1
Table 5. The value of error evaluation index of each response approximate model.
ObjectivesError Evaluation Parameters
R2Radj2MAERMSEAMEA
Y10.9760.9620.141110.06390.5222
Y20.9810.9690.125480.050450.03844
Z10.9680.9500.142880.064050.05451
Z20.9770.9640.13290.056270.0477
Table 6. Comparison of NSGA-II optimization results and simulation results.
ParameterAB/°CC/sD/°CE/MPaF/MPaNSGA-II Optimization ResultsSimulation Results
Y1/%Y2/%Z1/%Z2/%Y1/%Y2/%Z1/%Z2/%
Value0.3950864613.911.112.44.77.114.012.84.86.9
Table 7. Mechanical properties of the B-pillar in different regions.
Cooling ZoneOriginal Length (mm)Fracture Length (mm)Elongation (%)Tensile Strength (MPa)
Rapid5053.061390
Slow5055.711.4680

