Article

Electrochemical Noise Measurements of Advanced High-Strength Steels in Different Solutions

by
Marvin Montoya-Rangel
1,
Nelson Garza-Montes de Oca
1,
Citlalli Gaona-Tiburcio
1,
Rafael Colás
1,
José Cabral-Miramontes
1,
Demetrio Nieves-Mendoza
2,
Erick Maldonado-Bandala
2,
José Chacón-Nava
3 and
Facundo Almeraya-Calderón
1,*
1
Universidad Autonoma de Nuevo Leon, FIME-Centro de Investigación e Innovación en ingeniería Aeronáutica (CIIIA), Av. Universidad s/n, Ciudad Universitaria, San Nicolás de los Garza, Nuevo León 66455, Mexico
2
Facultad de Ingeniería Civil, Universidad Veracruzana, Xalapa 91000, Mexico
3
Centro de Investigación en Materiales Avanzados, Miguel de Cervantes 120, Complejo Industrial Chihuahua, Chihuahua 31136, Mexico
*
Author to whom correspondence should be addressed.
Metals 2020, 10(9), 1232; https://doi.org/10.3390/met10091232
Submission received: 10 August 2020 / Revised: 7 September 2020 / Accepted: 8 September 2020 / Published: 13 September 2020
(This article belongs to the Special Issue Localized Corrosion of Metals and Alloys)

Abstract

:
Advanced high-strength steels (AHSS), are commonly used in the manufacture of car bodies, as well as in front and rear rails, and safety posts. These components can be exposed to corrosive environments for instance, in countries where de-icing salts are used. In this work, the corrosion behavior of four AHSS steels with dual-phase [ferrite-martensite (DP) and ferrite-bainite (FB)] steels were studied by means of electrochemical noise (EN) measurements according to the ASTM G199-09 standard in NaCl, CaCl2 and MgCl2 aqueous solutions at room temperature. The direct current (DC) trend data from EN were removed by a polynomial method of statistical and spectral analysis. According to the noise resistance (Rn) values obtained for the DP and FB dual-phase steels, both the martensite/bainite content and morphology of the phase constituents have an important effect on the corrosion behavior of these steels. The L.I. (localization index) (0.00054 to 0.15431), skewness (−6.18 to 7.35) and kurtosis (high values 37.15, 74.84 and 106.52) were calculated. In general, the results indicated that the main corrosion process is related to uniform corrosion. Corrosion behavior of AHSS steels exposed in NaCl solution could be related to the morphology of the phase constituents exposed in NaCl, CaCl2 and MgCl2 solutions.

Graphical Abstract

1. Introduction

Advanced high-strength steels (AHSS) can be defined as two- or more phase alloys which provide a strength-ductility balance superior to that of single-phase steels, such as conventional high-strength steels (HSS) and high strength low alloy steels (HSLA) [1]. The AHSS have been implemented in the automotive industry for decades as different types of steels such as transformation-induced plasticity (TRIP), dual-phase steels (DP)/ferrite-bainite (FB), complex phase steels (CP), among others [2].
Dual-phase steels usually consist of some specific volume fraction of high-strength phase, such as martensite or bainite, embedded in a softer matrix, ferrite. Intercritical heat treatment is the way to enhance low alloy (carbon content less than 0.2%) steels to DP (ferrite + martensite) microstructure. In this treatment, a two-stage thermal cycle is used consisting of an intercritical annealing followed by fast cooling to promote the transformation of the intercritical austenite to martensite [3]. In fact, by increasing the intercritical quenching temperature from 740 to 820 °C a higher content of martensite was obtained and, therefore, a change in hardness from 228 to 317 HV was measured, respectively [4].
FB steels consists of a ferrite matrix and bainite microstructure which was introduced as a result of austenitizing the steel at 1100 °C for 20–60 min, followed by air cooling for different time duration, soaking in a salt bath at 500–800 °C for 1 h, and finally quenching in water [5,6,7]. In reference [6] the influence of bainite/martensite-content on the tensile properties of low carbon dual-phase steels was studied, and it was determined that the minimum elongation of FB steels is about 22% while that in DP steels is about 8%. The strength of FB steels is caused by grain refinement, precipitation strengthening due to microalloying elements and the inherent high dislocation density of the bainite phase [8]. In this way, dual-phase steels will allow lighter automobile production; however, the use of thinner gauge strip means that corrosion resistance becomes of prime importance [9].
The corrosion resistance of the DP steel increases with intercritical annealing tempering heat treatment. In addition, it has been reported that the dua-phase steel tempered at higher temperature of 800 °C (martensite island morphology in the ferrite matrix), had better corrosion resistance properties than the dual-phase steel tempered at lower temperature of 730 °C, which consists of fibrous ferrite and martensite [10]. Abedini et al. [11] mentioned that an increase in martensite amount does not favor the corrosion rate of DP steels. However, DP steel exhibited high corrosion resistance compared to ferrite-pearlite steel, due to the fact that the galvanic couple between ferrite and martensite is weaker than that between ferrite and pearlite. In fact, the corrosion current density Icorr (µA·cm−2), in DP steel increases with increasing the amount of martensite [12]. However, there is little information in the literature on the mechanism and corrosion kinetics for FB steels. The ferritic + bainitic dua-phase steel easily led to a creation of a galvanic effect between the ferrite and bainite phases increasing the risk of corrosion [13]. The refinement of grain size has great effects on the corrosion behavior in ultra-low carbon bainitic steel, including certain improvements in the intergranular and pitting corrosion resistance. The corrosion attack is more homogeneous and smoother in the fine-grained structure compared to the attack in the coarse-grained microstructure. In addition, it has been confirmed that manganese has no significant contribution to enhance the corrosion resistance because of the absence of manganese in the rust layers; instead, silicon should help to increase the corrosion resistance [14].
Different conventional electrochemical techniques such as linear polarization resistance (LPR), potentiodynamic polarization and electrochemical impedance spectroscopy (EIS) have been implemented to determine corrosion and kinetic mechanisms of the reactions; however, these techniques can alter the electrochemical system with external signals, so it could alter the same electrochemical measurements. On the other hand, the electrochemical noise (EN) technique is carried out without external interference to the electrochemical system, so it could provide useful information on the mechanisms and kinetics of corrosion without altering some features of the electrochemical system under study [15]. The term EN is a general term which refers to spontaneous current and potential fluctuations that occur on the surface of the electrode by corrosion processes [16]. Transients are linked to anodic and cathodic reactions as a result of stochastic processes (rupture and re-passivation of the passive film) and deterministic processes (formation and propagation of pitting) [17]. Potential and/or current transients in time series are associated with the initiation and re-passivation of metastable pitting, which provides useful information on the initial process of localized corrosion [18].
The EN data can be analyzed by several methods. Perhaps the most commonly used are those related to frequency domain (power spectral density), time domain (statistical methods as skewness, kurtosis, localization index (L.I.), and the variation of signal amplitude with time) and time-frequency domains [19,20].
L.I., skewness and kurtosis values have been reported as values related to different types of corrosion and values referring to the asymmetry of the probability distribution and shape of EN data [21].
The corrosion rate obtained from potentiodynamic polarization tests in 3.5% NaCl solution at 25 °C showed that the corrosion rate of DP steels is lower than ferrite-pearlite microstructure. This is because of the weaker galvanic couple between ferrite and martensite compared to that between ferrite and pearlite. In addition, an increasing volume fraction of martensite increases the corrosion rate [11]. The previous results are supported in reference [22] where similar behavior was found for different DP steels in a solution containing chloride ions. Another investigation shows that DP steel has a corrosion potential between carbon steel and martensitic steel. Galvanic action between the ferrite and martensite phases leads to selective corrosion of the ferrite phase in NaCl solution [23]. It has been reported that galvanic corrosion in DP steel occurs because martensite is structurally and compositionally closer to ferritic matrix, therefore, the galvanic couple formed between ferrite-martensite is weaker compared to the galvanic couple between ferrite and cementite. The above implies that corrosion of DP steel is driven by not only galvanic coupling of ferrite and martensite phases but also other phases. Competition of the ferrite self-corrosion and the galvanic corrosion between ferrite and martensite contribute to the corrosion of this type of steel [24].
On the other hand, a study of the corrosion behavior of DP600 and DP800 steels in 3.5% NaCl solution indicated that the corrosion resistance of DP800 steel was higher than that of the DP600 steel in 3.5 wt.% NaCl solution based of Nyquist diagrams, moreover, potentiodynamic curves showed similar corrosion behavior and corrosion currents densities of 12 µA/cm2 and 17 µA/cm2 to DP800 and DP600, respectively [25]. In [26,27] it was reported that DP steel with single MnS inclusions had the worst resistance to pitting corrosion in NaCl solution.
The aim of this work was to study the corrosion behavior of four AHSS [DP (ferrite-martensite) and FB (ferrite-bainite) microstructures] steels immersed in three solutions 3.5 wt.% NaCl, 2 wt.% CaCl2 and 2 wt.% MgCl2. The electrochemical properties of the AHSS have been studied using the electrochemical noise technique.

2. Materials and Methods

2.1. Materials

The dual-phase (DP) and ferritic-bainitic (FB) steels are the prevalent AHSS grades that are currently in commercial use, were designated as DP590 (Rm = 590 MPa) and DP780 (Rm = 780 MPa) for ferrite/martensite microstructure and FB590 (Rm = 590 MPa) and FB780 (Rm = 780 MPa) for ferrite/bainite microstructure. Table 1 presents the chemical compositions (obtained by X-ray fluorescence) (Olympus DELTA XRF, Webster, TX, USA) of DP and FB AHSS steels used in this work.

2.2. Microstructural Characterization and Hardness Test

The AHSS surfaces were ground up to 4000 grit size and subsequently a final polishing was undertaken with velvet cloth using 0.1 µm alumina suspension in water to obtain a mirror-like surface. The etching of the polished samples was undertaken by using 5 wt.% Nital solution. The microstructure of specimens was examined by scanning electron microscopy (SEM, JEOL-JSM-5610LV, Tokyo, Japan) at a magnification of 2000×. For corrosion tests, AHSS samples were ground to 800 grit SiC paper.
Vickers hardness (Vickers durometer, Wilson 402 MVD, Aachen, Deutschland) of all AHSS was taken at 5 kgf load with a loading duration of 15 s in all cases.

2.3. Electrochemical Technique

The EN technique was used to evaluate the corrosion behavior of different advanced high-strength steels in 3.5% NaCl, 2% CaCl2 and 2% MgCl2 solutions. EN measurements were carried out according to ASTM G199-09 standard [28], which allows the noise resistance (Rn) and corrosion rate evaluation to be determined in a corrosive medium. For each experiment, two nominally identical specimens were used as the working electrodes (WE1 and WE2) and a saturated calomel electrode as the reference electrode (RE), respectively. Electrochemical current noise (ECN) was measured as the galvanic coupling current between the two identical working electrodes; simultaneously, the electrochemical potential noise (EPN) was measured between one of the working electrodes and the reference electrode. The current and potential electrochemical noise was monitored with respect to time for each particular electrode-electrolyte combination, under open-circuit condition. EN measurements were carried out one hour after having obtained the stabilization potential in open circuit. For each set of EN measurements, 1024 data points were obtained with a scanning rate of 1 data/s. The current and potential time series were visually analyzed to interpret the signal transients and define the behavior of the frequency and amplitude of the fluctuations as a function of time. The electrochemical noise measurements were recorded simultaneously using a Gill-AC potentiostat/galvanostat/ZRA (Zero Resistance Ammeter) from ACM Instruments (Manchester, UK).
After direct current (DC) trend removal by polynomial method, the EN data were analyzed. A Hann window was applied before computing the PSD (power spectral density) plots. The EN data were transformed into frequency domain by using the fast Fourier transformation (FFT) method to study the PSD. The calculations were performed by MATLAB 2014a software (MathWorks, Natick, MA, USA).

3. Results

3.1. Microstructure

A typical morphology of the microstructure of dua-phase was observed in DP and FB steels, Figure 1. No pearlite, i.e., lamellar eutectic microstructure of ferrite and cementite, was observed next to martensite or in ferrite phases, which could relate to a rapid transformation from the austenite phase.
Steel microstructure was defined as a result of observation of metallographic specimen, etched in Nital 5 wt.% with the scanning electron microscope. The microstructure of DP590 and DP780 steels typically consists of a soft ferrite phase (dark grains) and islands of martensite (bulk martensite) with different relative volume of martensite islands on ferrite matrix i.e., 40% and 55% for DP590 and DP780, respectively [29,30,31,32], according to their theoretical tensile strength, (Figure 1a,b). The martensite island revealed an average size of about 5 and 2 µm in DP590 and DP780 steels, respectively. Similarly, the FB590 and FB780 steels have a mixed microstructure composed of soft ferrite (dark grains) and harder bainite (bright grains), Figure 1c,d [1,29,30,31,32,33,34]. The ferrite-bainite microstructure is finer than ferrite-martensite microstructure for the typical DP steel microstructure. Microstructural features which allow higher elongation and impact energy than DP steels can be related to the coarse plates of martensite in this microstructure [35]. The microstructure of FB steels consists of about 30% and 45% bainite and a ductile ferrite matrix with an average grain size of about 4 and 2 µm, in FB590 and FB780 steels, respectively.

3.2. Electrochemical Noise

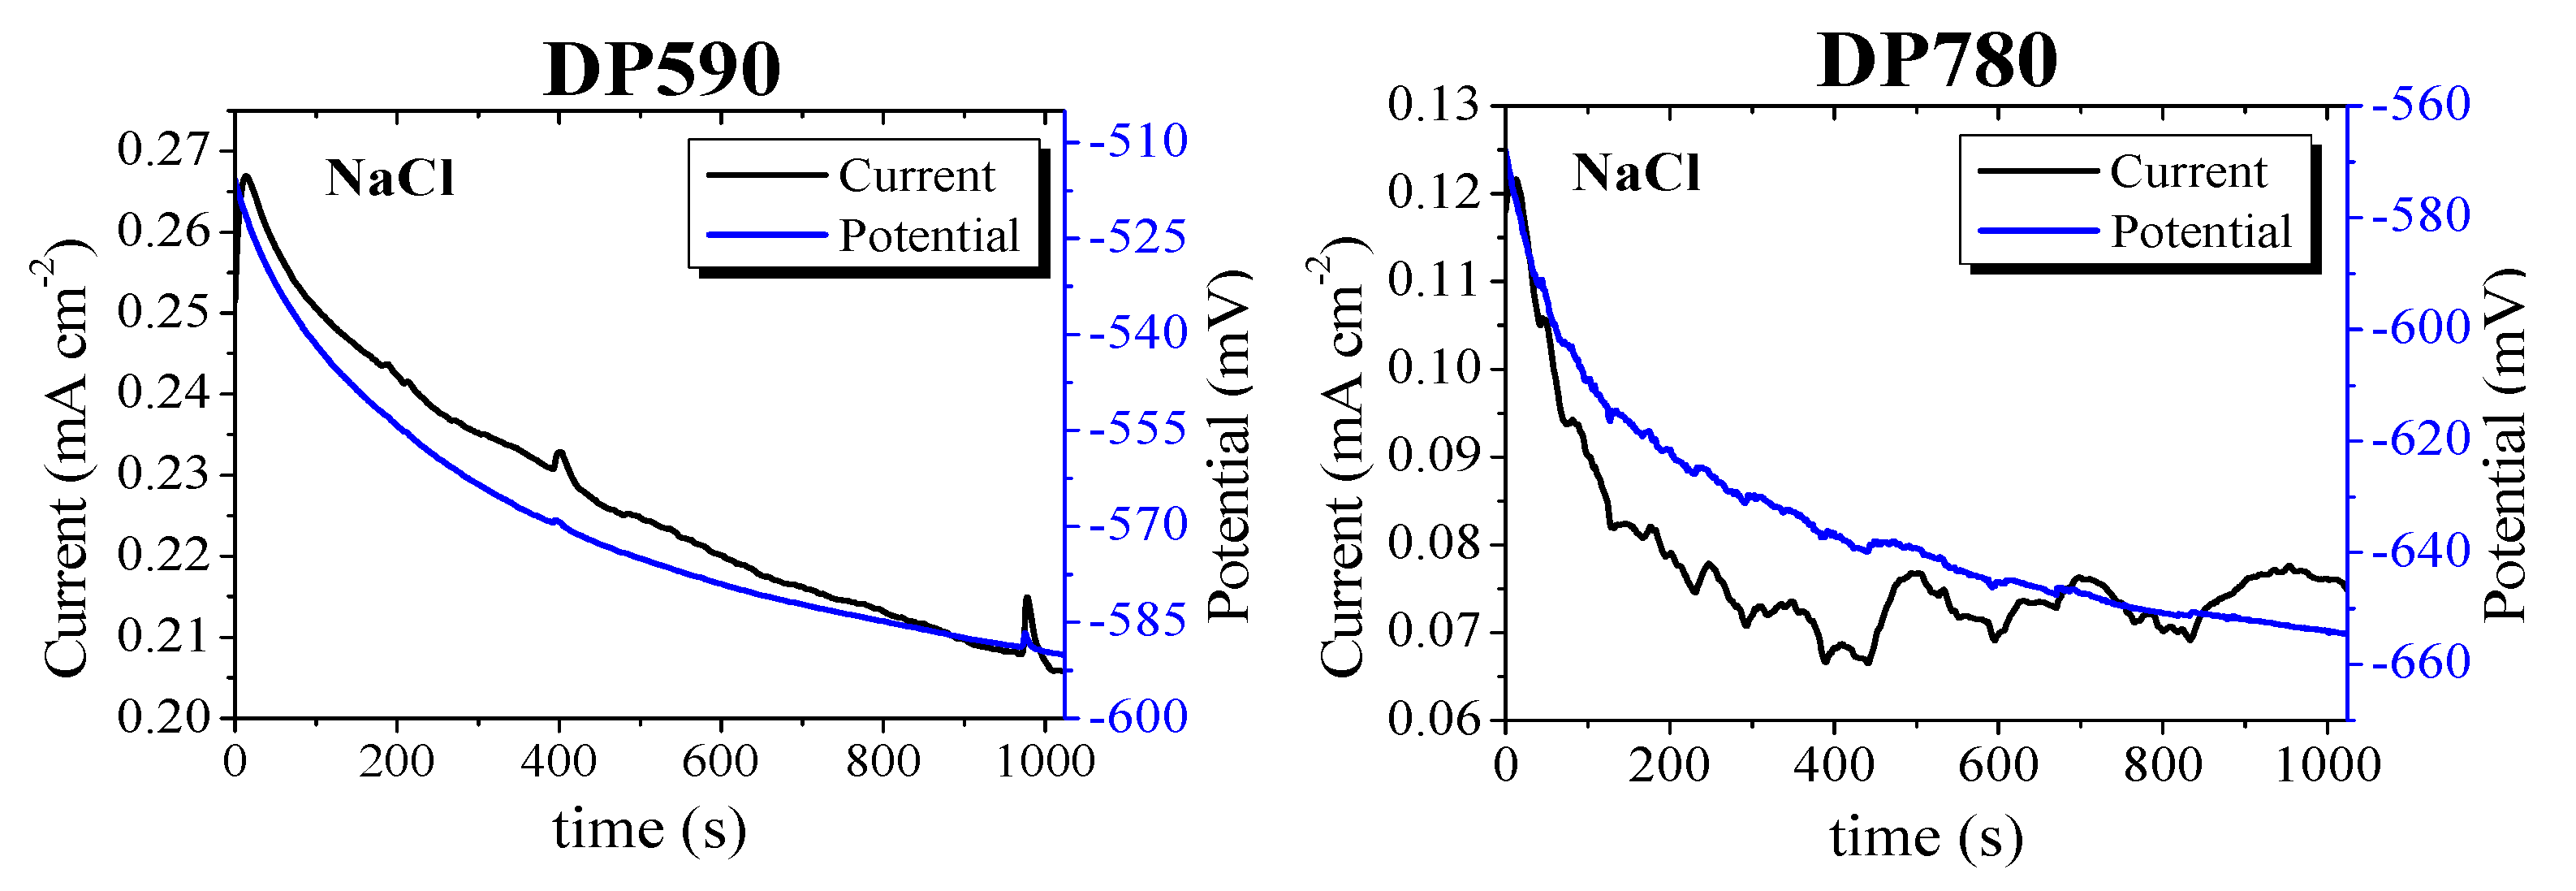
Figure 2 shows the DC trend for current and potential noise data as a function of time of DP590 and DP780 steels immersed into the 3.5% NaCl solution. The DC trend for current and potential signals for the other steels (FB590 and FB780) in the different solutions (CaCl2 and MgCl2 solutions) was similar. The current and potential noise time series presented a considerable trend as the time increases as follows: The potential noise decreases exponentially to active potentials until the electrochemical system reaches stability and the current noise decreases.
The DC trend is defined as the variation of the mean current or potential divided by time. If the two electrodes are nominally identical electrodes in the measurement of electrochemical noise, the mean value of the difference of potential and current flowing between them would be expected to be zero [35]. The EN signals should appear as quasi-random fluctuations around zero. However, this was not the case for the AHSS steels in the present investigation. Thus, a method is proposed to eliminate the trend and subsequently study the transients of each signal.
A time series model x(t), as depicted in Figure 2, can be described as an additive component representing different process as:
x ( t ) = m t + s t + Y t
where mt is a slowly changing function (trend component), st is a function with known period d referred to as a seasonal component and finally Yt component which is related with to random noise [19].
In fact, in a time series of EN measurement the trend component is concerned with the DC trend, which the DC component can affect the statistical result of electrochemical noise tests due to instability of the tested electrode during the measurement period [36,37,38,39,40]. Polynomial detrending is a method of high-pass filtering commonly used for DC trend removal in order to avoid the large distortions in the later processing of noise data. Let us consider a signal:
y n   ~   x ( t ) = x n i = 0 p 0 a i n i
where ai is the i-th coefficient of the trend approximating the polynomial evaluated for a discrete time n. Trend removal by polynomial approximation is based in the approximation of the trend by a polynomial of a given order p0. The approximated trend is fitted to the analyzed time record. The polynomial is subtracted from the acquired data xn to determine the signal yn [41,42]. The DC trend data EN were removed by using 9-order polynomial (p0 = 9). A large DC trend in yn was noted for lower polynomial degrees (p0 < 9).
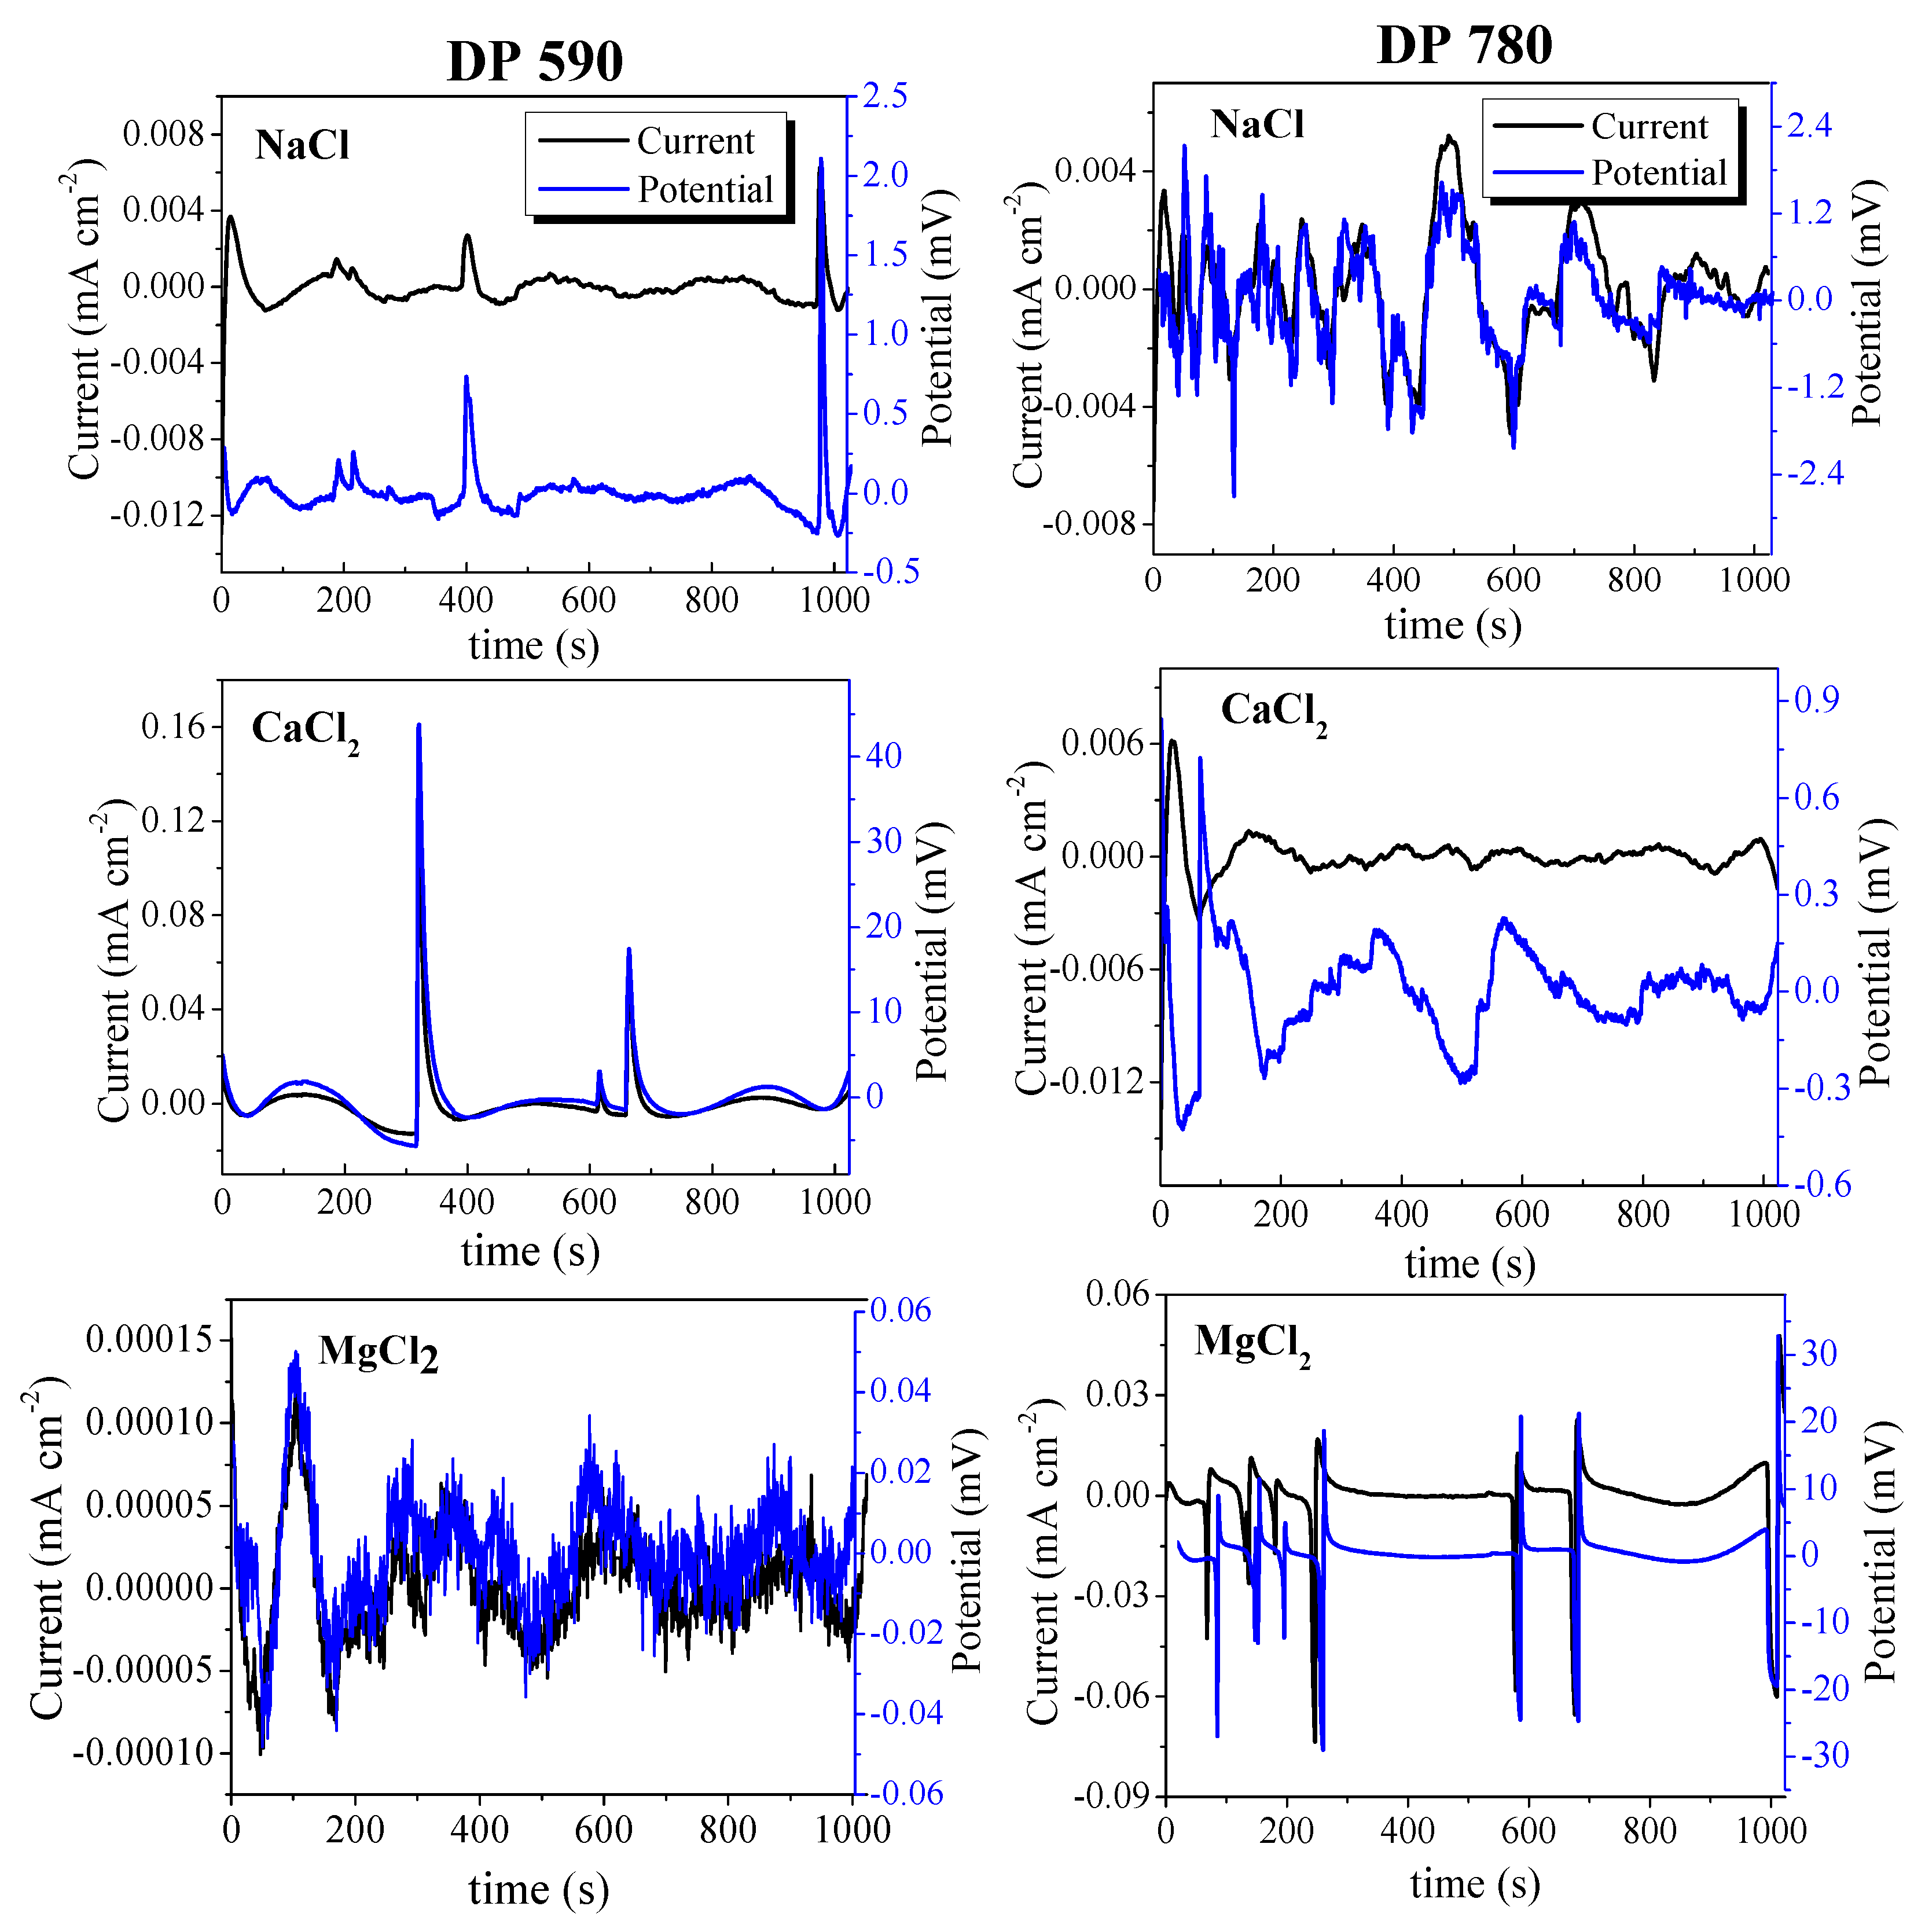
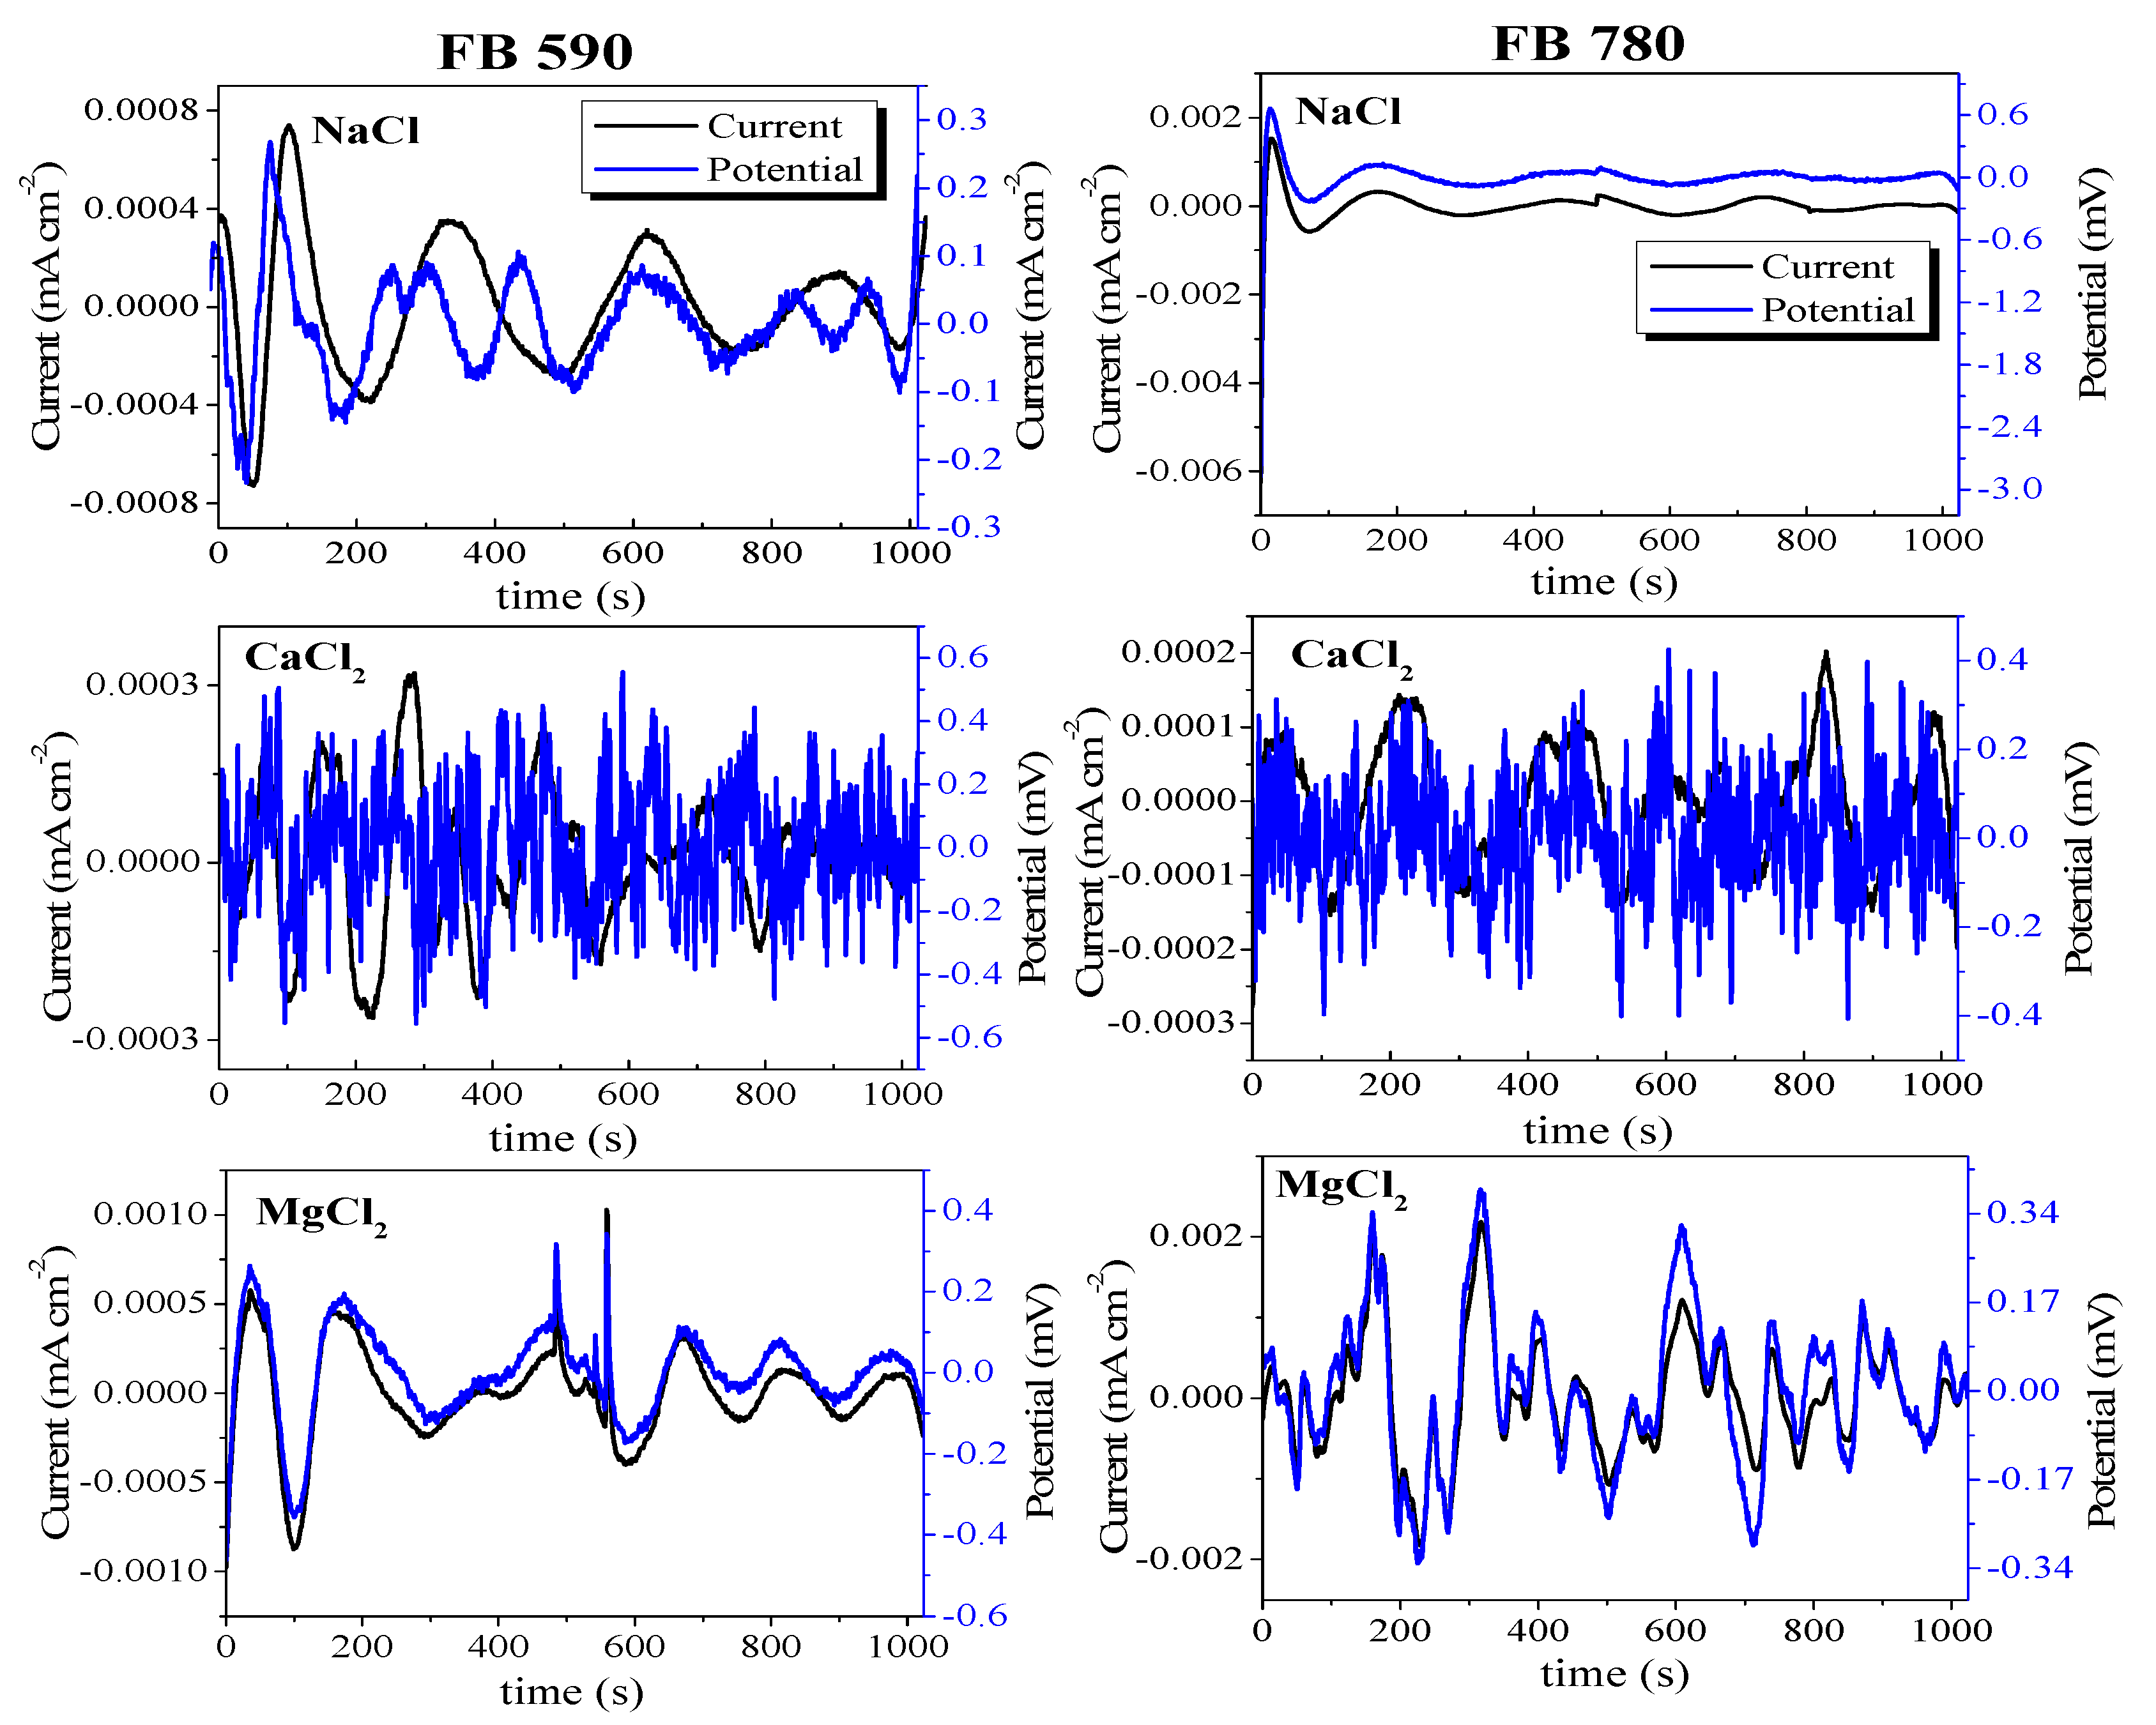
DC removal noise data of DP and FB steels in different solutions are shown in Figure 3 and Figure 4. The current and potential time series for electrochemical noise signals show different behaviors for different corrosion systems. High-frequency fluctuations in a short period of time were observed for DP590 steel in MgCl2 solution and DP780 steel in NaCl solution. In the case of FB steels, the same EN behavior occurred in FB590 and FB780 in CaCl2 solution. Physically, these fluctuations can be associated with the superposition of multiple anodic and cathodic events, whereby a small variation under an anode process is compensated by a cathodic event, which prevents a sudden change in current, and it gives as result on the surface of advanced steels DP various points that are associated with generalized corrosion. A low and constant amplitude in potential and current signal was characteristic for FB590 and FB780 steels.
For DP590 samples in NaCl solution, transients showed an extremely sharp rise in current and voltage followed by an equally sharp fall back to the mean value. These types of transitory event were characterized as the smallest of the transients and identified readily. In addition, other type of transients were presented in this corrosion system i.e., current transients with very sharp initial rise and subsequent decay. In this time range the current proceeded to rise further for several seconds, before reaching an anodic maximum, and transients of one or perhaps two or three anodic peaks maximum. Other type of anodic transient was observed in DP780 steel in CaCl2 solution. This type of transitory was characterized by a very sharp increase in current and high recovery time to mean value (lasting up to several seconds). The DP780 steel in MgCl2 solution showed high-amplitude and low-frequency anodic-cathodic transients with a small recovery in their original value. In any case, the voltage and current fluctuations often occurred simultaneously.
The noise resistance, Rn [38] was calculated from the data after removing the DC trend in the time domain, as the ratio of the potential noise standard deviation, σ v , and the current noise standard deviation, σ i , depending on the exposed area a (Figure 5).
R n = σ v σ i a
An inverse relationship between the reciprocal of noise resistance value, 1/Rn, and mechanical strengths of both DP and FB steels was presented in NaCl solution. In effect, a higher value of 1/Rn for DP590 steel and subsequently a low value for DP780 steel. Similar behavior was presented for ferritic-bainitic steels in this solution. In contrast, a reverse behavior took place for the AHSS steels when exposed in CaCl2 solution (a higher 1/Rn value in DP780 and FB780 steels than in DP590 and FB590 steels). An average value of Rn after 1024 s of immersion in MgCl2 solution was 0.00237 Ω·cm2 for DP90, DP780 and FB590 steels (Table 2, and Figure 5).
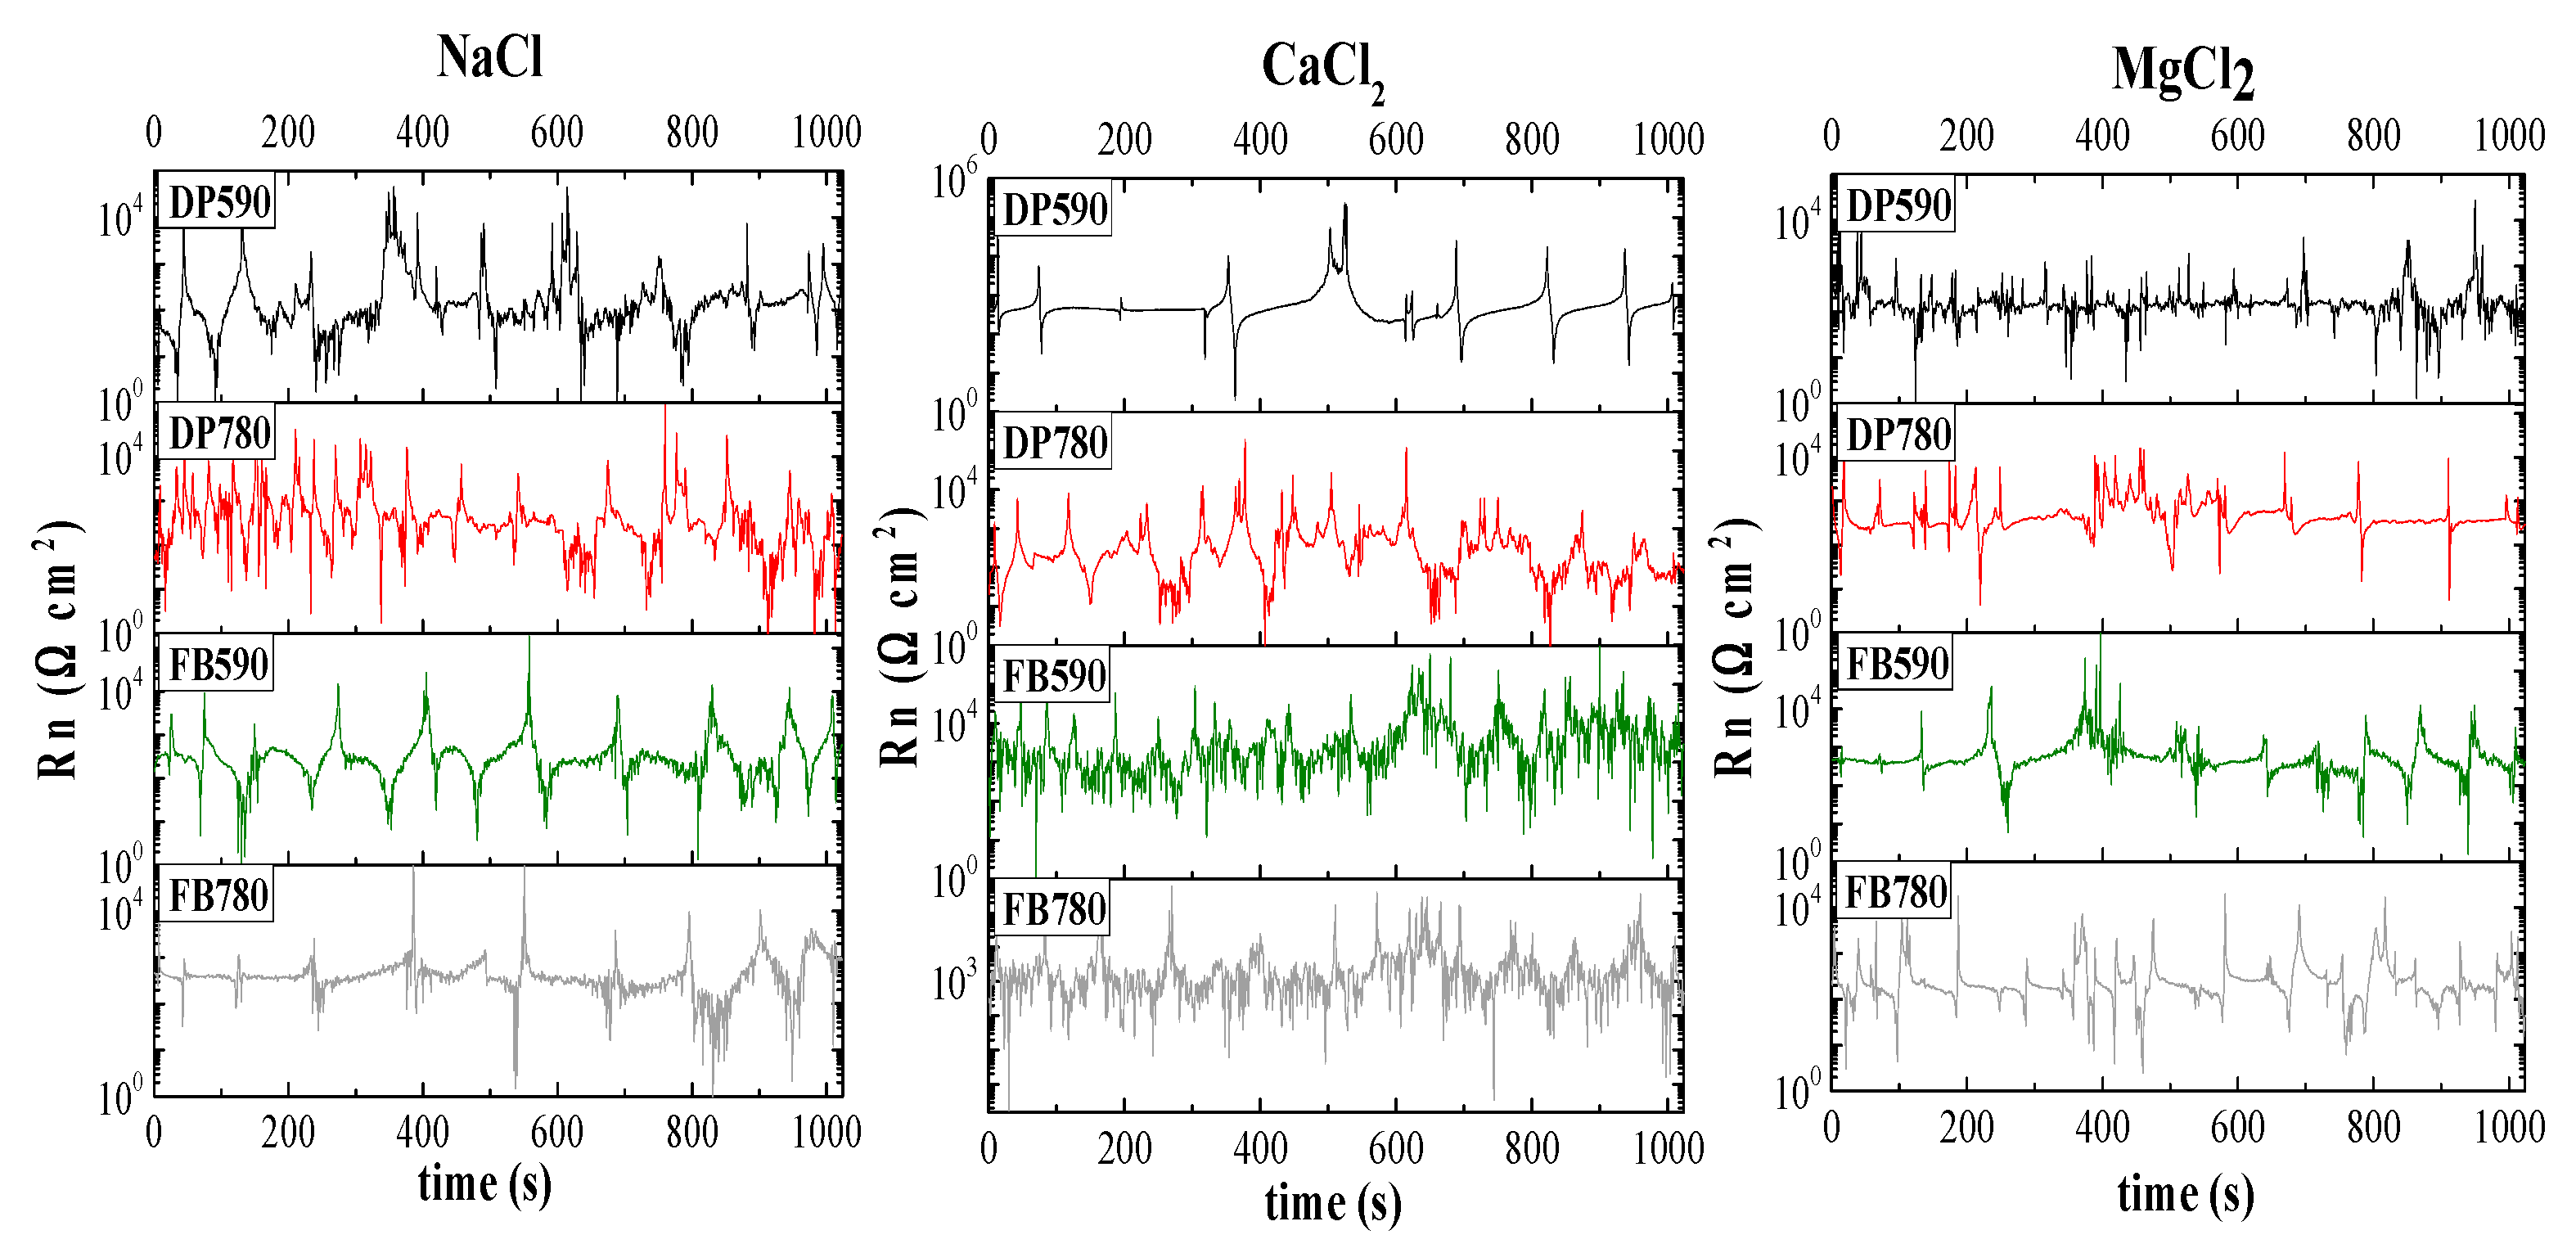
The noise resistance time series (Rn(t)) are presented in Figure 6. Rn(t) data indicated that transients were present. Different density of transients including different amplitudes at the time of the test was evidenced for all corrosion systems (e.g., high-frequency and amplitude transients in FB590 and FB780 steels in CaCl2 solution, low-frequency and high amplitude transients in FB780 in NaCl solution).
This type of transients are related to the susceptibility and corrosion type according to L.I., skewness and kurtosis statistical measurements [43].
L . I . = σ i i r m s
s k e w n e s s = 1 N i = 1 N ( x i x ¯ ) 3 σ 3
k u r t o s i s =   1 N i = 1 N ( x i x ¯ ) 4 σ 4
where σ i and x ¯ values are standard deviation of current noise and mean data noise of the no trend noise data, respectively, and i r m s value is root mean square current noise of the detrended noise data. Table 2 shows the Rn, L.I., skewness, kurtosis values and current (mi) and potential (mv) roll-off slope from PSD plot.
Values of the L.I. parameter from 0.00054 to 0.15431 were calculated for the different corrosion systems. Skewness values from −6.18 to 7.35 were calculated from detrended current noise data. High values of kurtosis were calculated for DP590 in NaCl and CaCl2 solutions, DP780 in CaCl2 solution and FB780 in NaCl solution. Current skewness and kurtosis values were calculated from Equations (5) and (6) for the different AHSS steels in the different test solutions as can be seen in Table 2.
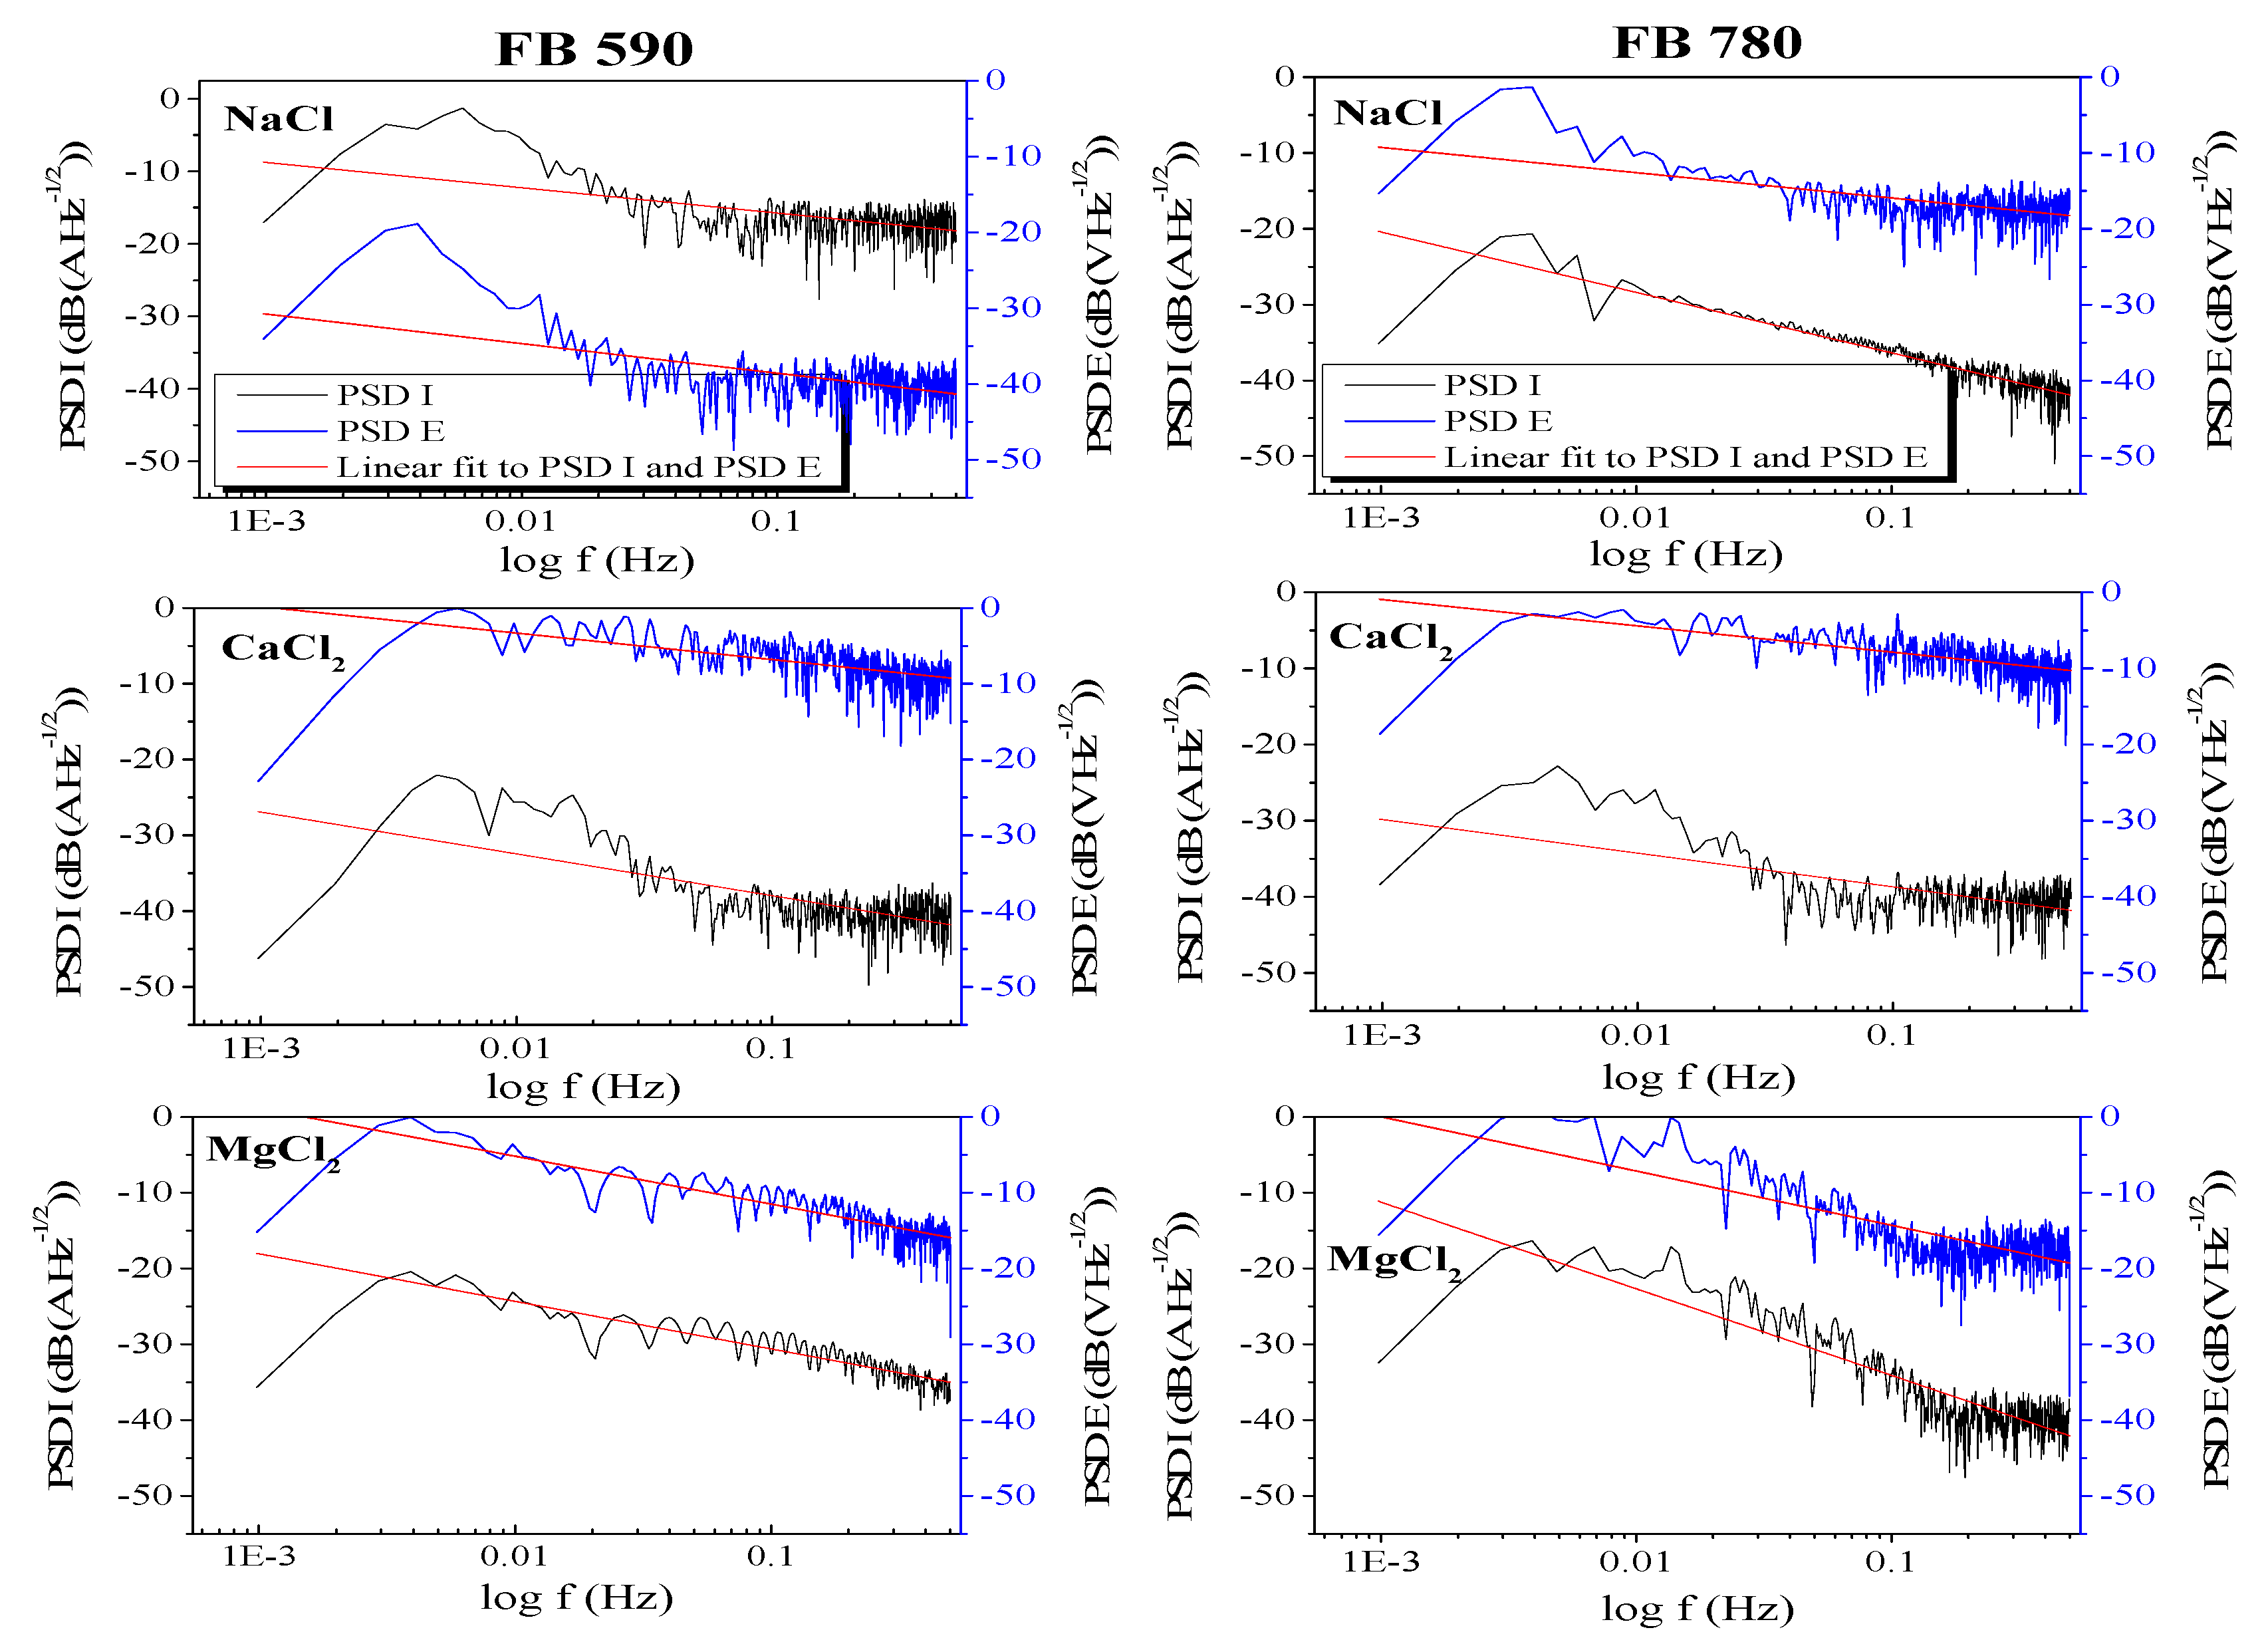
Values close to zero were calculated for skewness and close to 3 for kurtosis, however, high values for DP590 steel in CaCl2 solution and DP780 steel in MgCl2 solution were calculated. Here, a relationship can be observed: high skewness and kurtosis values correspond to high values of L.I. Typical PSD plots of current (black line) and potential (blue line) noise for DP and FB steels are shown in Figure 7 and Figure 8, respectively. The PSD exhibited a non-dependence on frequency in the lower frequency range, while at high frequencies varied according to fn. The roll-off slope is represented as a red line over PSD behavior for each electrochemical system. The PSD current and potential slopes were in a range between −2.85 and −5.42 in the entire frequency range for FB590 steel in NaCl, CaCl2 and MgCl2 solutions. However, Table 2 shows that higher PSD current and potential slopes were obtained for corrosion systems involving DP590, DP780 and FB780 steels.

4. Discussion

4.1. Microstructure

In order to obtain the tensile strength required, the volume fraction of martensite/ferrite, bainite/ferrite and processing parameters must be adjusted to achieve the required mechanical properties [4,43,44]. In fact, the variation of hardness, yield strength, uniform elongation as a function to austempering temperature was reported to obtain ferrite bainite microstructures [45]. After brine quenching from 730 to 816 °C the martensite percentage increases in the ferrite matrix with increasing quenching temperature, therefore, a better response in tensile strength was obtained from stress-strain curves [46]. An increase in the intercritical annealing temperature and cooling rates on martensite volume fraction in ferrite plus martensite microstructure allowed an increase in hardness number and the tensile properties [47]. The predicted tensile strength was calculated using a modified relationship proposed by Davis as a function of hardness number [48].
Ultimate   tensile   strength ,   U T S ( M P a ) = 0.0017 ( V H N ) 2 + 2.2494 ( V H N ) + 123.31
From Equation (7), Table 3 shows the predicted tensile strength values according to the hardness measured in the AHSS dual-phase steels used in the present work. The evolution of bulk hardness of both steels answered proportionally according to martensite and bainite volume fraction and theoretical tensile strength. The predicted tensile strength for DP590 and FB590 steels were similar to theoretical value; however, the predicted tensile strength to DP780 and FB780 steels were higher than the theoretical values. The high hardness value and, therefore, the predicted higher strength value can be attributed to the higher phase fraction of the hard second phase obtained from the intercritical quenching and austempering temperature. [48]. The average hardness in the ferrite + bainitic microstructure (FB590 steel) is similar to the average hardness of ferrite + martensite microstructure [49]. According to Table 3, the predicted tensile strength value for DP780 steel results from the microstructure obtained by the high intercritical temperature conditions used (at least 800 °C for 60 min) [50,51].

4.2. Corrosion Analysis

The corrosion reactions at the interface are related to the diffusion of ions such as dissolved oxygen, Cl, Na+, Ca+, Mg+ or H+ that could diffuse through the electrolyte [52]. This adsorption of reactive anions on the oxide-covered or passivated metal surfaces can lead the chemical reaction of the anions with the metal ions in the oxide lattice, including the nucleation or initiation and repassivation of pits. The thinning of the oxide film by dissolution, including the propagation or development of direct attack and subsequently exposed metal can occur. At this stage, the voltage and current transients can be attributed to the collapsing/healing or activation/passivation transients of the passivated film on the metal surface [53]. In fact, potential fluctuation during passive film breakdown and repair could be broken down into four fundamental steps, (i) pit nucleation, (ii) pit growth, (iii) growth termination and (iv) repassivation [54]. Therefore, the current and potential transients in Figure 3 and Figure 4 can be related to electrochemical phenomena. It has been reported that the coverage of the metallic surface by a pre-passive hydrous Fe(OH)2 layer leads to a decrease in the dissolution rate of carbon steel as a result of inhibition of the current increase rate [55], therefore, the continuously decaying of current, as show in Figure 2, can be associated with the formation of a passive layer by ferrous species. A decrease in potential signal with lower amplitude and higher frequency transients as time increases could indicate a passive state, in effect, these trends appear because passive systems are highly polarizable, therefore small changes in current produce high changes in the potential signal. Another possible reason to explain this trend is the development of metastable pits which can be formed below the pitting potential [56].
Three possible typical forms of electrochemical noise transients by different types of corrosion processes have been reported: (i) Type I (Pitting) consists of transients of high intensity with a high repetition rate, (ii) Type II (Mixed) is a combination of transients of type I and oscillations of short amplitude, and (iii) Type III (Uniform) in which the pattern noise is formed by oscillations of low amplitude [57]. Therefore, the anodic current transients shown in DP590 steel in CaCl2 solution can be due to localized breakdown of the passivity state, with these current transients indicating the nucleation of corrosion pits. Afterwards, a continuous decay in current could be associated with repassivation kinetics; however, once an activation and passivation process has occurred, the possibility of a small amount of dissolution from these nucleated sites cannot be precluded entirely; such dissolution could lead to a new activation and passivation reaction on the surface and lead to uniform corrosion as shown in the FB590 and FB780 steels in CaCl2 solution. This behavior was characterized by a sudden fall and a sudden exponential rise, and the current transients showed a sudden rise and fall [58]. This type of behavior can be physically explained as follows: during initiation and propagation of pitting corrosion, an electron flow occurs from the pit site to the external metal surface which get stored within the passive film and double-layer capacitors and this cathodic consumption occurs over the entire surface giving rise to the exponential recovery both potential and current signals [19]. Generally, Cl ions have stronger mobility than OH and CO 3 2 ions. Therefore, Cl ions can diffuse readily into the cavity acidifying the local chemistry, resulting in accelerating pit growth [59]. In a study of the corrosion behavior of a dual-phase steel in acid media, two type of transients were reported: (i) one type of transients of low amplitude and small frequency and (ii) a type of transients of high amplitude with a small recovery time and very low frequency. It was mentioned that the first type of transient can be related to low corrosion rates because the steel could be covered by corrosion products film [60].

4.2.1. Noise Resistance

It has been determined that Rn is indeed equivalent to the polarization resistance [60], therefore, the 1/Rn values shown in Figure 5 are strictly proportional to the corrosion rate according to Ohm’s law and the Stern-Geary equation [61,62,63,64]. A higher value of 1/Rn for DP590 and FB590 steels and subsequently a low 1/Rn value for DP780 and FB780 steels in NaCl solution is related to a low electrochemical activity in advanced steels with lower mechanical resistance. Corrosion of DP steels can be due to: (i) chemical composition, (ii) the volume fraction of martensite phase (due to the large amount of microgalvanic corrosion cells due to the interconnection between the martensite and ferrite phases), (iii) the presence of epitaxial ferrite, and (iv) the presence of stresses [65].
The addition of Cr, Ni and Si can improve the corrosion resistance and oxidation resistance at high temperatures [66,67,68]. In the present investigation, a higher Si and Cr content in DP780 and FB780 steels, respectively, compared to steels with lower mechanical resistance was presented. To some extent, this could explain a lower electrochemical behavior of steels with higher mechanical resistance in NaCl solution. On other hand, in [69] the electrochemical corrosion behavior of advanced dual-phase steels in 3.5% NaCl solution was investigated and it was concluded that an increase in martensite content to increase mechanical properties bears an adverse effect in corrosion resistance. However, a morphology made up of islands of martensite in continuous ferrite matrix proves to be more corrosion-resistant compared to morphologies such as ferrite-chain martensite, uniform fine fibrous ferrite-martensite and uniform fibrous ferrite-martensite with an almost similar amount of martensite in the structure. The corrosion resistance of dual-phase steel increases depending upon the increase in the volume fraction of martensite, and in particular of its morphological features [10]. In this reference, it is reported that the corrosion resistance of the DP steel increases with intercritical annealing tempering heat treatment. In addition, it is reported that the dual-phase steel tempered at a temperature of 800 °C (martensite island morphology in the ferrite matrix), had a better corrosion resistance property than the dua-phase steel tempered at a lower temperature of 730 °C, which consists of fibrous ferrite and martensite.
The presence of two phases in the dual-phase steel more martensite introduces galvanic coupling in the microstructure. Thus, an increase in martensite contents can involve ferrite dissolution which is electrochemically anodic to both. A refinement in the microstructure promotes a large interface area between the ferrite and martensite, that would lead to an increase of corrosion rate [70]. In the present investigation, the 1/Rn value for all AHSS in CaCl2 solution was measured and compared to the behavior in the NaCl solution. This behavior could be associated with favoring the martensite volume fraction over the type of martensite morphology. Indeed, from an electrochemical point of view, a martensitic region is expected to have a nobler corrosion potential than the ferritic matrix due to its carbon content, but the martensite content and finer grain in steel decreases its corrosion resistance as reported [71]. In MgCl2 solution the corrosion rate of different AHSS steels was similar.
In the case of corrosion behavior of ferrite-bainite dual-phase steel, a high bainite content and fine structure leads to both, a decrease in current and potential and an increase of penetration resistance of Cl ions with coarse grains structure even with the same bainite content due to a lower grain boundaries reaction. It has been reported that the bainite phase is the galvanic cathode and ferrite phase is the galvanic anode; further, the ferrite phase has higher dissolution rate than bainite phase when the FB steel is immersed in 3.5 wt.% NaCl solution [72,73]. In the present investigation, an increase in bainite percentage from about 30 to 45% and a decrease in grain size of about 4 to 2 µm, to some extent could favor the corrosion resistance of FB780 steel exposed in NaCl solution. However, the higher electrochemical activity in FB780 steel in CaCl2 and MgCl2 solutions could be linked possibly to the fact that the grain size strongly prevailed over the bainite content on the steel surface despite the high content of Cr. The FB steel with bainite content of about 40% (area ratio) can promote a large number of microgalvanic cells between the bainite phase (anode) and the ferrite phase (cathode), promoting prior breakdown of the passive film on the bainite phase, which causes localized corrosion initiation in Cr-Mo alloyed steels [74].
The DC trend removal is important in the calculation of noise resistance Rn since it has shown consistency with calculations from EIS measurements [3]. Surface degradation may not necessarily be accompanied by both a decrease of σ i and an increase of σ v but it is the ratio between the two that is decisive [75]. Therefore, an increase of Rn can be directly related to a decrease of σ i because of film formation on the surface on the advanced steel. In fact, as shown in Figure 6 and according to Equation (3), the fluctuations are in terms of σ i and σ v . Fluctuations up to 1 × 10⁶ Ω·cm2 occurred in different steels, and this could be related to the time where the breakdown of the passive layer takes place. An increase in Rn value corresponds to a repassivation state, whereas a decrease corresponds to an activation state. Therefore, changes in excess in the value of Rn could be linked to film rupture/repassivation events [76]. This also could be linked to the high-intensity and low-frequency behavior in the transients presented in the DP590, DP780 and FB780 steels in CaCl2, MgCl2 and NaCl solutions, respectively, in relation to their tendency to localized corrosion. The high intensity and frequency transients in ferritic-bainitic steel in CaCl2 solution in relation to its tendency to uniform corrosion.

4.2.2. Localization Index

The localization index is a parameter defined as the ratio of the current standard deviation and the root square mean (rms) of current fluctuations, with values between 0 and 1 [77]. It has been argued in the literature that the L.I., can be used to determine the nature of the corrosion type with values approaching 1 being characteristic of localized corrosion [78]. The Iskew, Ikurt and L.I. values were calculated for different alloys; however, values of 0 and 1 for L.I. were calculated for mild steel and Ti alloy which presented uniform corrosion and a passive state, respectively [79]. From Equation (3), it can be deduced that L.I. 1.0 is observed for systems for which the current data show high deviations from the mean value x ¯ , which could not be related to a passive behavior in Ti alloy. Therefore, the L.I. value can be considered as a measure of the distribution of experimental EN data around their mean values and not as an indicator of corrosion mechanisms.
A comparison of the analysis of the raw EN data and the data obtained after trend removal was reported [80]. The σ i , σ v and i r m s values were also changed by the trend removal, however little change was observed in the Rn value. The L.I. value after trend removal was 1.0, this being a reason for which L.I. cannot be used as an indicator of the prevailing corrosion mechanism if the calculation is i r m s after removing the DC trend. Similarly, in [39,79,81] references, values of 1.0 in L.I. after eliminating the trend were reported in these studies since the mean value of the current fluctuations was now close to zero. The standard deviation only measures the alternating current (AC) portions of a signal, while the rms value measures both the AC and DC components. If a signal has no DC component, the rms value is identical to its standard deviation [79,80] then, L.I. will have a value of 1.0.
In the present investigation L.I. values were different from 1, as shown in Table 2. The calculation of L.I. was considered as the ratio of the σ i detrended and i r m s calculated from coupling current Icoup (current raw data). L.I. values of 0.00054 and 0.15431 for DP590 in MgCl2 and CaCl2 solutions were calculated, respectively. According to the fluctuations presented in Figure 3, it has been assumed that L.I. values close to zero suggests general corrosion, while L.I. values greater than 0.1 are related to localized corrosion behavior [82]. Therefore, the values obtained in the presented study indicate that the L.I., can be used to differentiate between different types of corrosion, as reported in [54] where transients observed were related to localized corrosion with L.I. values greater than 0.1.

4.2.3. Skewness and Kurtosis Measurements

In corrosion studies, the skewness value describes the degree of distortion from the symmetrical bell curve or the normal distribution and kurtosis value measure of outliers present in the distribution probability of EN data. In fact, values between −1 and 1 for skewness were presented for most of both DP and FB steels in the NaCl, CaCl2 and MgCl2 solutions. Similarly, three-tending values were calculated for the kurtosis parameter. In the case of skewness, the range would indicate that the data distribution is moderately skewed and in case of kurtosis it would indicate a Gaussian or normal distribution [56]. In the same reference it was associated that uniform corrosion follows a Gaussian distribution. Statistically this can be understood in terms of measures of central tendency, so that in a normal distribution both the mean, media, and mode measurements are similar. In fact, since the measurements of the mean, media, and mode are similar, it is possible to assume that there are no measurements of outliers of current that could be associated with high current consumption. Therefore, a localized form of corrosion can be associated with outliers of x i current data regarding the mode of measurement of the probability distribution. In the present work, the average skewness in DP780, FB590 and FB780 steels in different solutions was negative. This could indicate that many current data x i were below the mean value and relate the above to a small trend of transients in the negative current direction. High kurtosis in a data set is an indicator that data has heavy tails or outliers; however, the high kurtosis value obtained in the FB780 steel in the NaCl solution did not provide information that could be related to skewness and L.I. values. In a study [49] it has been reported that skewness value gives an indication to the direction and width of the transients in a set of data. It is mentioned that that if the data contain a few short, sharp peaks, the data are skewed in the direction opposite to the peaks. If the peaks last longer, the mean of the data is shifted towards the top of the peaks and as a result, the data are less skewed, i.e., more symmetrical. In fact, the current skewness and kurtosis were found to be sensitive indicators in the corrosion processes. However, in [40] it was concluded that both kurtosis and skewness only could be used as an indicative of normal distribution of EN data, but should not be used to suggest corrosion mechanisms.

4.2.4. Power Spectral Density (PSD) Analysis

A relationship could exist in relation between the different PSD slopes and the L.I., skewness and kurtosis values; however, some care must be taken to relate such values because these statistical values must be in accordance with the transients presented in Figure 3 and Figure 4. In general, L.I. values for DP590 steel exposed in the NaCl solution indicated a uniform corrosion mechanism, even though some high signal intensity transits during the exposure in the solution were observed, and high skewness and kurtosis values were calculated for the same electrochemical system. This could be related to an inconsistency between L.I. values and the shape of the probability distributions. Slopes of −10.79 dB[A]·decade−1 and −7.18 dB[V]·decade−1 in the frequency spectrum could be related to localized corrosion behavior. In a study of the corrosion behavior of mild steel, stainless steel and pure aluminum [83,84] it has been reported that the slope of the PSD values estimated after linear-trend removal of measured signals was recognized as the most significant parameter to distinguish between uniform and local corrosion (Table 4) [85].
In [86] a study about the electrochemical noise measurements in stainless steel reported that for uniform corrosion the slope of the voltage power-spectrum density range is −2 to 7 dB[V]·decade−1, while localized corrosion responds more strongly because the slope is in the range of 20–30 dB[V]·decade−1. In the case of mixed corrosion, the value of the slope parameter a is intermediate (from 10 to 15 dB[V]·decade−1). Similarly, the roll-off slope becomes more negative with the addition of Cl ions. A gradual decrease of roll-off slope with time in Cl containing solution is observed, and many small pit nuclei are generated [87]. The slopes of the power spectral density plots of current and potential noises were associated with the nature of corrosion attack on duplex stainless steel 2101 [88]. In the case of DP780 steel in NaCl solution, a L.I. value related to uniform corrosion was calculated; however, no high-frequency fluctuations were present in Figure 3, but there were high skewness and kurtosis values. This non-normal behavior in statistical calculations may be due to the fact that most of the current values tended to zero, very close to the mean value of the data. Any variation of x i in Equations (5) and (6) could give a high skewness and distribution tails as measured with kurtosis. Nevertheless, this could be related to a passive state.
It has been reported that an excellent balance of strength-ductility expansion ratio can be achieved in FB steel by chemical design of low carbon and Nb + Ti microalloying. However, higher carbon content of steel tends to be detrimental to flangeability, due to much carbide precipitation at ferrite boundaries [37]. Now, in [88] it was reported that the Charpy impact energy in a ferrite-bainite microstructure was about 46% higher than full bainite and 71% higher than ferrite-martensite microstructures. Nevertheless, tensile tests results showed that the FB steel microstructure has greater ductility than ferrite-martensite and bainitic microstructures due to the amount of strain hardening in DP microstructure steel, which is greater than that for the FB microstructure. The absence of physical discontinuous yield strength reported in [89] was attributed to the generation of mobile dislocations in the ferrite phase adjacent to the martensite or bainite at the time of the austenite to martensite transformation during water quenching. In addition, an increase in both yield strength and tensile strength (and therefore impact toughness) is attributed to grain refinement as reported in [90]. In this way, differences in microstructures affect the mechanical and corrosion behavior.

5. Conclusions

  • This work presents a study on the corrosion behavior of four important types of AHSS steels i.e., DP (590 and 7890 MPa) and FB (590 and 780 MPa) steels exposed to 3.5 wt.% NaCl, 2 wt.% CaCl2 and 2wt.% MgCl2 solutions. These chemical compounds are the basis of de-icing salts commonly used in highways particularly in winter time. As a first approach, electrochemical noise technique was used.
  • The current and potential time series show different behavior for each electrolyte. High-frequency fluctuations for short periods of time were observed for DP590 steel in MgCl2 solution and DP780 steel in NaCl solution. In the case of FB steels, the same behavior occurred in FB590 and FB780 in CaCl2 solution. In general, the current tan potential fluctuations can be associated with a general a corrosion process.
  • From the Rn data obtained, an inverse relationship between the reciprocal of noise resistance value, 1/Rn, and mechanical strength of both DP and FB steels was found in NaCl solution. By contrast, the behavior in CaCl2 solution did not show any relationship from Rn and mechanical strength. Here, a higher 1/Rn value for DP780 (0.00271 Ω·cm−2) and FB780 (0.00509 Ω·cm−2) steels compared to that for DP590 (0.00286 Ω·cm−2) and FB590 (0.000592 Ω·cm−2) steels was noted. Immersion in MgCl2 solution gave very similar 1/Rn values for DP90 (0.00237 Ω·cm−2), DP780 (0.00237 Ω·cm−2) and FB590 (0.00252 Ω·cm−2) steels, with the 1/Rn values being somewhat higher for the FB780 (0.00509 Ω·cm−2) steel.
  • Current and potential transients can be related to the corrosion type occurring according to statistical parameters such as the localization index [(L.I.) from 0.00054 to 0.15431 were calculated], skewness (values from −6.18 to 7.35 were calculated) and kurtosis (high values 37.15, 74.84 and 106.52). In general, the results indicated that the main corrosion process is related to one of uniform corrosion.
  • The PSD current and potential slopes obtained were in the range from −2.85 to −5.42 in the entire frequency range for the FB590 steel in NaCl, CaCl2 and MgCl2 solutions, whereas somewhat higher PSD current and potential slopes were obtained for DP590, DP780 and FB780 steels exposed in all electrolytes.
  • Corrosion behavior of AHSS steels exposed in NaCl solution could be related to the morphology of the phase constituents. However, under exposure in CaCl2 and MgCl2 solutions, an increase in martensite/bainite content or an increased refinement of phase constituents controls the corrosion behavior.
  • Given the enormous industrial importance of this type of AHSS steels, and in order to obtain a better understanding of their corrosion behavior, it is recognized that the use of powerful techniques such as electrochemical impedance spectroscopy (EIS) would be of great benefit.

Author Contributions

Conceptualization, F.A.-C., N.G.-M.d.O. and C.G.-T.; methodology, J.C.-M., M.M.-R. and C.G.-T.; data curation, F.A.-C., E.M.-B., D.N.-M., M.M.-R. and J.C.-N.; formal analysis, M.M.-R., N.G.-M.d.O., R.C., J.C.-N. and F.A.-C.; writing, review and editing, J.C.-N., M.M.-R. and F.A.-C. All authors have read and agreed to the published version of the manuscript.

Funding

This research was funded by the Mexican National Council for Science and Technology (CONACYT) of the projects CB 253272, A1-S-8882 and the Universidad Autónoma de Nuevo León (UANL).

Acknowledgments

The authors acknowledge The Academic Body UANL—CA-316 “Deterioration and integrity of composite materials”.

Conflicts of Interest

The authors declare no conflict of interest.

References

  1. Tamarelli, C.M. AHSS 101: The evolving use of advanced high-strength steel for automotive applications. Steel Mark. Dev. Inst. 2011, 1, 42. [Google Scholar]
  2. Keeler, S.; Kimchi, M. Advanced High-Strength Steels Application Guidelines Version 5.0. WorldAutoSteel 2014, 511. [Google Scholar] [CrossRef]
  3. Galán, J.; Samek, L.; Verleysen, P.; Verbeken, K.; Houbaert, Y. Advanced high strength steels for automotive industry. Rev. Metal. 2012, 48, 118–131. [Google Scholar] [CrossRef]
  4. Maffei, B.; Salvatore, W.; Valentini, R. Dual-phase steel rebars for high-ductile r.c. structures, Part 1: Microstructural and mechanical characterization of steel rebars. Eng. Struct. 2007, 29, 3325–3332. [Google Scholar] [CrossRef]
  5. Khan, A.S.; Baig, M.; Choi, S.H.; Yang, H.S.; Sun, X. Quasi-static and dynamic responses of advanced high strength steels: Experiments and modeling. Int. J. Plast. 2012, 30–31, 1–17. [Google Scholar] [CrossRef]
  6. Kumar, A.; Singh, S.B.; Ray, K.K. Influence of bainite/martensite-content on the tensile properties of low carbon dual-phase steels. Mater. Sci. Eng. A 2008, 474, 270–282. [Google Scholar] [CrossRef]
  7. Qu, S.; Zhang, Y.; Pang, X.; Gao, K. Influence of temperature field on the microstructure of low carbon microalloyed ferrite-bainite dual-phase steel during heat treatment. Mater. Sci. Eng. A 2012, 536, 136–142. [Google Scholar] [CrossRef]
  8. Lesch, C.; Kwiaton, N.; Klose, F.B. Advanced High Strength Steels (AHSS) for Automotive Applications −Tailored Properties by Smart Microstructural Adjustments. Steel Res. Int. 2017, 88, 1–21. [Google Scholar] [CrossRef]
  9. Mintz, B. Hot dip galvanising of transformation induced plasticity and other intercritically annealed steels. Int. Mater. Rev. 2001, 46, 169–197. [Google Scholar] [CrossRef]
  10. Uzun, H.; Önal, E. Mechanical Properties and Corrosion Behaviors in 3.5% NaCl Solution of Grade-A and Dual-Phase Steels Welded by FCAW. Period. Eng. Nat. Sci. 2013, 1. [Google Scholar] [CrossRef]
  11. Abedini, O.; Behroozi, M.; Marashi, P.; Ranjbarnodeh, E.; Pouranvari, M. Intercritical heat treatment temperature dependence of mechanical properties and corrosion resistance of dua-phase steel. Mater. Res. 2019, 22, 1–10. [Google Scholar] [CrossRef] [Green Version]
  12. Keleştemur, O.; Yildiz, S. Effect of various dual-phase heat treatments on the corrosion behavior of reinforcing steel used in the reinforced concrete structures. Constr. Build. Mater. 2009, 23, 78–84. [Google Scholar] [CrossRef] [Green Version]
  13. Wang, Y.; Zuo, X.; Li, J. Corrosion Resistance of the Welded Joint of Submarine Pipeline Steel with Ferrite Plus Bainite Dual-Phase Microstructure. Steel Res. Int. 2015, 86, 1260–1270. [Google Scholar] [CrossRef]
  14. Wang, Z.F.; Li, P.H.; Guan, Y.; Chen, Q.F.; Pu, S.K. The corrosion resistance of ultra-low carbon bainitic steel. Corros. Sci. 2009, 51, 954–961. [Google Scholar] [CrossRef]
  15. Mehdipour, M.; Naderi, R.; Markhali, B.P. Electrochemical study of effect of the concentration of azole derivatives on corrosion behavior of stainless steel in H2SO4. Prog. Org. Coat. 2014, 77, 1761–1767. [Google Scholar] [CrossRef]
  16. Xia, D.; Song, S.; Wang, J.; Shi, J.; Bi, H.; Gao, Z. Determination of corrosion types from electrochemical noise by phase space reconstruction theory. Electrochem. Commun. 2012, 15, 88–92. [Google Scholar] [CrossRef]
  17. Monticelli, C. Evaluation of Corrosion Inhibitors by Electrochemical Noise Analysis. J. Electrochem. Soc. 1992, 139, 706. [Google Scholar] [CrossRef]
  18. Park, C.J.; Kwon, H.S. Electrochemical noise analysis of localized corrosion of duplex stainless steel aged at 475 °C. Mater. Chem. Phys. 2005, 91, 355–360. [Google Scholar] [CrossRef]
  19. Suresh, G.U.; Kamachi, M.S. Electrochemical Noise Analysis of Pitting Corrosion of Type 304L Stainless Steel. Corrosion 2014, 70, 283–293. [Google Scholar] [CrossRef]
  20. Homborg, A.M.; Cottis, R.A.; Mol, J.M.C. An integrated approach in the time, frequency and time-frequency domain for the identification of corrosion using electrochemical noise. Electrochim. Acta 2016, 222, 627–640. [Google Scholar] [CrossRef]
  21. Nagiub, A.M. Electrochemical Noise Analysis for Different Green Corrosion Inhibitors for Copper Exposed to Chloride Media. Corros. Sci. 2017, 35, 201–210. [Google Scholar] [CrossRef]
  22. Ikpeseni, S.C.; Ameh, E.S. Effect of Temperature and Microstructure on the Corrosion Behaviour of a low Carbon dua-phase Steel. Am J Eng. Res. 2017, 6, 1–7. [Google Scholar]
  23. Si, Y. Investigation of Galvanic Corrosion Behavior of dua-phase Steel. ECS Trans. 2016, 72, 13. [Google Scholar] [CrossRef]
  24. Fushimi, K.; Yanagisawa, K.; Nakanishi, T.; Hasegawa, Y.; Kawano, T.; Kimura, M. Microelectrochemistry of dual-phase steel corroding in 0.1 M sulfuric acid. Electrochim. Acta 2013, 114, 83–87. [Google Scholar] [CrossRef]
  25. Gerengi, H.; Sen, N.; Uygur, I.; Kaya, E. Corrosion behavior of dua-phase 600 and 800 steels in 3.5 wt.% NaCl environment. J. Adhes. Sci. Technol. 2020, 34, 903–915. [Google Scholar] [CrossRef]
  26. Park, I.J.; Kim, S.T.; Lee, I.S.; Park, Y.S.; Moon, M.B. A study on corrosion behavior of DP-type and TRIP-type cold rolled steel sheet. Mater. Trans. 2009, 50, 1440–1447. [Google Scholar] [CrossRef] [Green Version]
  27. Park, I.J.; Lee, S.M.; Kang, M.; Lee, S.; Lee, Y.K. Pitting corrosion behavior in advanced high strength steels. J. Alloys Compd. 2015, 619, 205–210. [Google Scholar] [CrossRef]
  28. ASTM G199-09. Standard Guide for Electrochemical Noise Measurement; ASTM International: West Conshohocken, PA, USA, 2014. [Google Scholar]
  29. Thewlis, G. Classification and quantification of microstructures in steels. J. Mater. Sci. Technol. 2004, 20, 143–160. [Google Scholar] [CrossRef]
  30. Kang, Y.; Han, Q.; Zhao, X.; Cai, M. Influence of nanoparticle reinforcements on the strengthening mechanisms of an ultrafine-grained dua-phase steel containing titanium. Mater. Des. 2013, 44, 331–339. [Google Scholar] [CrossRef]
  31. Schmitta, J.-H.; Iungb, T. New developments of advanced high-strength steels for automotive applications. Comptes Rendus Phys. 2018, 19, 641–656. [Google Scholar] [CrossRef]
  32. Hilditch, T.B.; de Souza, T.; Hodgson, P.D. Properties and automotive applications of advanced high-strength steels (AHSS). In Welding and Joining of Advanced High Strength Steels (AHSS), 1st ed.; Shome, M., Tumuluru, M., Eds.; Woodhead Publishing: Philadelphia, PA, USA, 2015; pp. 9–28. [Google Scholar]
  33. Kwon, O.; Lee, K.; Kim, G.; Chin, K.-G. New Trends in Advanced High Strength Steel Developments For Automotive Application. Mat. Sci. Forum. 2010, 638–642, 136–141. [Google Scholar] [CrossRef]
  34. Aydin, K.; Essadiqi, E.; Yue, S. Development of 3rd generation AHSS with medium Mn content alloying compositions. Mater. Sci. Eng. A 2013, 564, 501–508. [Google Scholar] [CrossRef]
  35. Saeidi, N.; Ekrami, A. Comparison of mechanical properties of martensite/ferrite and bainite/ferrite dua-phase 4340 steels. Mater. Sci. Eng. A 2009, 523, 125–129. [Google Scholar] [CrossRef]
  36. Brockwell, P.J.; Davis, R.A. Introduction to Time Series and Forecasting; Springer: Cham, Switzerland, 2016; ISBN 978-3-319-29852-8. [Google Scholar]
  37. Bertocci, U.; Frydman, J.; Gabrielli, C.; Huet, F.; Keddam, M. Analysis of Electrochemical Noise by Power Spectral Density Applied to Corrosion Studies. J. Electrochem. Soc. 1998, 145, 2780–2786. [Google Scholar] [CrossRef]
  38. Tan, Y.; Bailey, S.; Kinsella, B. Studying the formation process of chromate conversion coatings on aluminium using continuous electrochemical noise resistance measurements. Corros. Sci. 2002, 44, 1277–1286. [Google Scholar] [CrossRef]
  39. Liu, X.; Zhang, T.; Shao, Y.; Meng, G.; Wang, F. In-situ study of the formation process of stannate conversion coatings on AZ91D magnesium alloy using electrochemical noise. Corros. Sci. 2010, 52, 892–900. [Google Scholar] [CrossRef]
  40. Mansfeld, F.; Sun, Z.; Hsu, C.H.; Nagiub, A. Concerning trend removal in electrochemical noise measurements. Corros. Sci. 2001, 43, 341–352. [Google Scholar] [CrossRef]
  41. Seifzadeh, D.; Basharnavaz, H.; Bezaatpour, A. A Schiff base compound as effective corrosion inhibitor for magnesium in acidic media. Mater. Chem. Phys. 2013, 138, 794–802. [Google Scholar] [CrossRef]
  42. Lentka, Ł.; Smulko, J. Methods of trend removal in electrochemical noise data - overview. Measurement 2018, 131, 569–581. [Google Scholar] [CrossRef]
  43. Tan, Y.J.; Bailey, S.; Kinsella, B. The monitoring of the formation and destruction of corrosion inhibitor films using electrochemical noise analysis (ENA). Corros. Sci. 1996, 38, 1681–1695. [Google Scholar] [CrossRef]
  44. Bhattacharya, D. Formable steels. In Advanced Steels; Springer: Berlin, Germany, 2011; pp. 163–175. ISBN 978-3-642-17665-4. [Google Scholar]
  45. Bakhtiari, R.; Ekrami, A. The effect of bainite morphology on the mechanical properties of a high bainite dua-phase (HBDP) steel. Adv. Mater. Sci. Eng. 2009, 525, 159–165. [Google Scholar] [CrossRef]
  46. Davies, R.G. The Deformation Behavior of a Vanadium-Strengthened dua-phase Steel. Metall. Trans. 1978, 9A, 41–52. [Google Scholar] [CrossRef]
  47. Ramazani, A.; Mukherjee, K.; Prahl, U.; Bleck, W. Modelling the effect of microstructural banding on the flow curve behaviour of dual-phase (DP) steels. Comput. Mater. Sci. 2012, 52, 46–54. [Google Scholar] [CrossRef]
  48. Davis, J.R. Engineering Data for Metals and Alloys. In Metals Handbook, Desk Edition, 2nd ed.; Davis, J.R., Ed.; ASM International: Cleveland, OH, USA, 1998; pp. 64–84. ISBN 978-1-62708-199-3. [Google Scholar]
  49. Calcagnotto, M.; Ponge, D.; Demir, E.; Raabe, D. Orientation gradients and geometrically necessary dislocations in ultrafine grained dual-phase steels studied by 2D and 3D EBSD. Mater. Sci. Eng. A 2010, 527, 2738–2746. [Google Scholar] [CrossRef]
  50. Ramazani, A.; Pinard, P.T.; Richter, S.; Schwedt, A.; Prahl, U. Characterisation of microstructure and modelling of flow behaviour of bainite-aided dual-phase steel. Comput. Mater. Sci. 2013, 80, 134–141. [Google Scholar] [CrossRef]
  51. Jha, A.K.; Prasad, B.K.; Modi, O.P.; Das, S.; Yegneswaran, A.H. Correlating microstructural features and mechanical properties with abrasion resistance of a high strength low alloy steel. Wear 2003, 254, 120–128. [Google Scholar] [CrossRef]
  52. Puget, Y.; Trethewey, K.; Wood, R.J.K. Electrochemical noise analysis of polyurethane-coated steel subjected to erosion—Corrosion. Wear 1999, 233, 552–567. [Google Scholar] [CrossRef]
  53. Shi, Y.Y.; Zhang, Z.; Cao, F.H.; Zhang, J.Q. Dimensional analysis applied to pitting corrosion measurements. Electrochim. Acta 2008, 53, 2688–2698. [Google Scholar] [CrossRef]
  54. Hashimoto, M.; Miyajime, S.; Murata, T. An experimental study of potential fluctuation during passive film breakdown and repair on iron. Corros. Sci. 1992, 33, 905–915. [Google Scholar] [CrossRef]
  55. Cheng, Y.F.; Luo, J.L. Passivity and pitting of carbon steel in chromate solutions. Electrochim. Acta 1999, 44, 4795–4804. [Google Scholar] [CrossRef]
  56. Almeraya, C.F.; Estupiñán, F.; Zambrano, R.P.; Martínez Villafañe, A.; Borunda, T.A.; Colás, R.; Gaona-Tiburcio, C. Análisis de los transitorios de ruido electroquímico para aceros inoxidables 316 Y – DUPLEX 2205 en NaCl Y FeCl (·) Electrochemical noise transient analysis for 316 and Duplex 2205 stainless steels in NaCl and FeCl. Rev. Metal. 2012, 48, 147–156. [Google Scholar] [CrossRef]
  57. Cuevas, C.; Brito, M.L.; Ocampo, A.M.-; Serna, S.; Torres, A. Analysis of Electrochemical Impedance and Noise Data for AISI-310 Exposed to Lithium Bromide Solution. Int. J. Electrochem. Sci. 2013, 8, 9593–9606. [Google Scholar]
  58. Burstein, G.T.; Souto, R.M. Observations of localised instability of passive titanium in chloride solution. Electrochem. Commun. 1995, 40, 1881–1888. [Google Scholar] [CrossRef]
  59. Dong, Z.H.; Shi, W.; Guo, X.P. Initiation and repassivation of pitting corrosion of carbon steel in carbonated concrete pore solution. Corros. Sci. 2011, 53, 1322–1330. [Google Scholar] [CrossRef]
  60. Ramirez, A.; Gonzalez, J.; Campillo, B.; Gaona, T.; Dominguez, P.; Lezama, L.; Chacón, N.; Neri, F.; Martinez, V. An Electrochemical Study of the Corrosion Behavior of a dua-phase Steel in 0.5m H2SO4. Int. J. Electrochem. Sci. 2010, 5, 1786–1798. [Google Scholar]
  61. Bogaerts, J.F.; Chen, W.F. The physical meaning of noise resistance. Corros. Sci. 1995, 37, 1839–1842. [Google Scholar] [CrossRef]
  62. Cottis, R.A.; Turgoose, S.; Neuman, R. Corrosion Testing Made Easy: Impedance and Noise Analysis; Syrett, B.C., Ed.; NACE International: Houston, TX, USA, 1999. [Google Scholar]
  63. Sanchez, J.M.; Cottis, R.A. Shot noise and statistical parameters for the estimation of corrosion mechanisms. Corros. Sci. 2005, 47, 3280–3299. [Google Scholar] [CrossRef]
  64. Li, Y.; Kumar, P.; Shi, X.; Nguyen, T.A.; Xiao, Z.; Wu, J. Electroless Synthesis of Ni-P and Ni-P-Zn Alloy Coatings for Protecting Steel Rebar from Chloride-Induced Corrosion. Int. J. Electrochem. Sci. 2012, 7, 8151–8169. [Google Scholar]
  65. Salamci, E.; Candan, S.; Kabakci, F. Effect of microstructure on corrosion behavior of dual-phase steels. Kov. Mater. 2017, 55, 133–139. [Google Scholar] [CrossRef] [Green Version]
  66. Gómez, J.A.; Antonissen, J.; Palacio, C.A.; Grave, E. De Effects of Si as alloying element on corrosion resistance of weathering steel. Corros. Sci. 2012, 59, 198–203. [Google Scholar] [CrossRef]
  67. Yoo, Y.H.; Hong, J.H.; Kim, J.G.; Lee, H.Y.; Han, J.G. Effect of Si addition to CrN coatings on the corrosion resistance of CrN/stainless steel coating/substrate system in a deaerated 3.5 wt.% NaCl solution. Surf. Coat. Technol. 2007, 201, 9518–9523. [Google Scholar] [CrossRef]
  68. Zhou, Y.; Chen, J.; Xu, Y.; Liu, Z. Effects of Cr, Ni and Cu on the Corrosion Behavior of Low Carbon Microalloying Steel in a Cl L Containing Environment. J. Mater. Sci. Technol. 2013, 29, 168–174. [Google Scholar] [CrossRef]
  69. Sarkar, P.P.; Kumar, P.; Manna, M.K.; Chakraborti, P.C. Microstructural influence on the electrochemical corrosion behaviour of dual-phase steels in 3.5% NaCl solution. Mater. Lett. 2005, 59, 2488–2491. [Google Scholar] [CrossRef]
  70. Shahzad, M.; Tayyaba, Q.; Manzoor, T.; Ud-din, R.; Subhani, T.; Qureshi, A. The effects of martensite morphology on mechanical properties, corrosion behavior and hydrogen assisted cracking in A516 grade steel. Mater. Res. Express 2018, 5, 1–11. [Google Scholar] [CrossRef]
  71. Wafaa, G.; Hussein, W.A.; Aboushahba, R.A.; Morad, M.M. The Corrosion Behavior of Ferrite Bainite dua-phase Steel in 3.5% NaCl Solution. Middle East J. Appl. Sci. 2016, 6, 627–635. [Google Scholar]
  72. Qu, S.; Pang, X.; Wang, Y.; Gao, K. Corrosion behavior of each phase in low carbon microalloyed ferrite – bainite dual-phase steel: Experiments and modeling. Corros. Sci. 2013, 75, 67–77. [Google Scholar] [CrossRef]
  73. Song, D.; Hao, J.; Yang, F.; Chen, H.; Liang, N.; Wu, Y.; Zhang, J.; Ma, H.; Eyram, E.; Gao, B.; et al. Corrosion behavior and mechanism of Cr e Mo alloyed steel: Role of ferrite/bainite duplex microstructure. J. Alloys Compd. 2019, 809, 151787. [Google Scholar] [CrossRef]
  74. Jamali, S.S.; Mills, D.J. Progress in Organic Coatings A critical review of electrochemical noise measurement as a tool for evaluation of organic coatings. Prog. Org. Coat. 2016, 95, 26–37. [Google Scholar] [CrossRef] [Green Version]
  75. Sarmiento, E.; Uruchurtu, J.; Menchaca, C.; Sarmiento, O. Electrochemical Noise Analysis of Type 316L Stainless Steel in a LiBr + Ethylene Glycol + H2O Solution. Corrosion 2011, 67, 1–8. [Google Scholar] [CrossRef]
  76. Cottis, R.A. A practical evaluation of electrochemical noise parameters as indicators of corrosion type. Electrochim. Acta 2004, 49, 2787–2793. [Google Scholar] [CrossRef]
  77. Mansfeld, F.; Sun, Z. Localization index obtained from electrochemical noise analysis. Corrosion 1999, 55, 915–918. [Google Scholar] [CrossRef]
  78. Mansfeld, F.; Sun, Z.; Hsu, C.H. Electrochemical noise analysis (ENA) for active and passive systems in chloride media. Electrochim. Acta 2001, 46, 3651–3664. [Google Scholar] [CrossRef]
  79. Lara Banda, M.; Gaona-Tiburcio, C.; Zambrano-Robledo, P.; Cabral, M.J.A.; Estupinan, F.; Baltazar-Zamora, M.A.; Almeraya-Calderon, F. Corrosion Behaviour of 304 Austenitic, 15-5PH and 17-4PH Passive Stainless Steels in acid solutions. Int. J. Electrochem. Sci. 2018, 13, 10314–10324. [Google Scholar] [CrossRef]
  80. Eden, D.A.; Rothwell, A.N. Electrochemical Noise Data: Analysis Interpretation and Presentation. In Proceedings of Corrosion # 92; NACE: Huoston, TX, USA, 1992; p. 292. [Google Scholar]
  81. Lara, M.; Gaona, C.; Zambrano, P.; Delgado, M.; Cabral, J.; Nieves, D.; Maldonado, E.; Estupiñan, F.; Chacón, J.; Almeraya, F. Alternative to Nitric Acid Passivation of 15-5 and 17-4PH Stainless Steel Using. Materials 2020, 12, 2836. [Google Scholar] [CrossRef] [PubMed]
  82. Nagiub, A.M. Comparative Electrochemical Noise Study of the Corrosion of Different Alloys Exposed to Chloride Media. Engineering 2014, 6, 1007–1016. [Google Scholar] [CrossRef] [Green Version]
  83. Legat, A.; Dolecek, V. Corrosion Monitoring System Based on Measurement and Analysis of Electrochemical Noise. Corrosion 1995, 51, 295–300. [Google Scholar] [CrossRef]
  84. Legat, A. Chaotic Analysis of Electrochemical Noise Measured on Stainless Steel. Electrochim. Acta 1995, 142, 1851–1858. [Google Scholar] [CrossRef]
  85. Fukuda, T. The evaluation of pitting corrosion from the spectrum slope of noise fluctuation 304 stainless steel electrodes. Corros. Sci. 1996, 38, 1085–1091. [Google Scholar] [CrossRef]
  86. Almeraya-Calderón, F.; Montoya, -R.M.; Garza Montes de Oca, N.; Castorena, G.H.J.; Estupiñan, L.F.; Cabral, M.J.; Maldonado, B.E.; Gaona-Tiburcio, C. Corrosion behavior of multilayer coatings deposited by PVD on Inconel 718 in Chloride and Sulphuric Acid solutions. Int. J. Electrochem. Sci. 2019, 14, 9596–9609. [Google Scholar] [CrossRef]
  87. He, L.; Jiang, Y.; Guo, Y.; Wu, X.; Li, J.; He, L.; Jiang, Y.; Guo, Y.; Wu, X.; Li, J. Electrochemical noise analysis of duplex stainless steel 2101 exposed to different corrosive solutions. Corros. Eng. Sci. Technol. 2016, 51, 187–194. [Google Scholar] [CrossRef]
  88. Zhang, L.; Xia, M.; Xiong, Z.; Du, Y.; Qiao, Z.; Zhang, H. Development of Low Carbon Niobium Bearing High Strength F-B dua-phase Steel with High Hole Expansion Property. In Proceedings of the HSLA Steels 2015, Microalloying 2015 & Offshore Engineering Steels 2015, Hangzhou, China, 11–13 November 2015; pp. 677–681. [Google Scholar] [CrossRef]
  89. Basantia, S.K.; Bhattacharya, A.; Khutia, N.; Das, D. Plastic Behavior of Ferrite–Pearlite, Ferrite–Bainite and Ferrite–Martensite Steels: Experiments and Micromechanical Modelling. Met. Mater. Int. 2019, 1–19. [Google Scholar] [CrossRef]
  90. Calcagnotto, M.; Ponge, D.; Raabe, D. Effect of grain refinement to 1μm on strength and toughness of dual-phase steels. Mater. Sci. Eng. A 2010, 527, 7832–7840. [Google Scholar] [CrossRef]
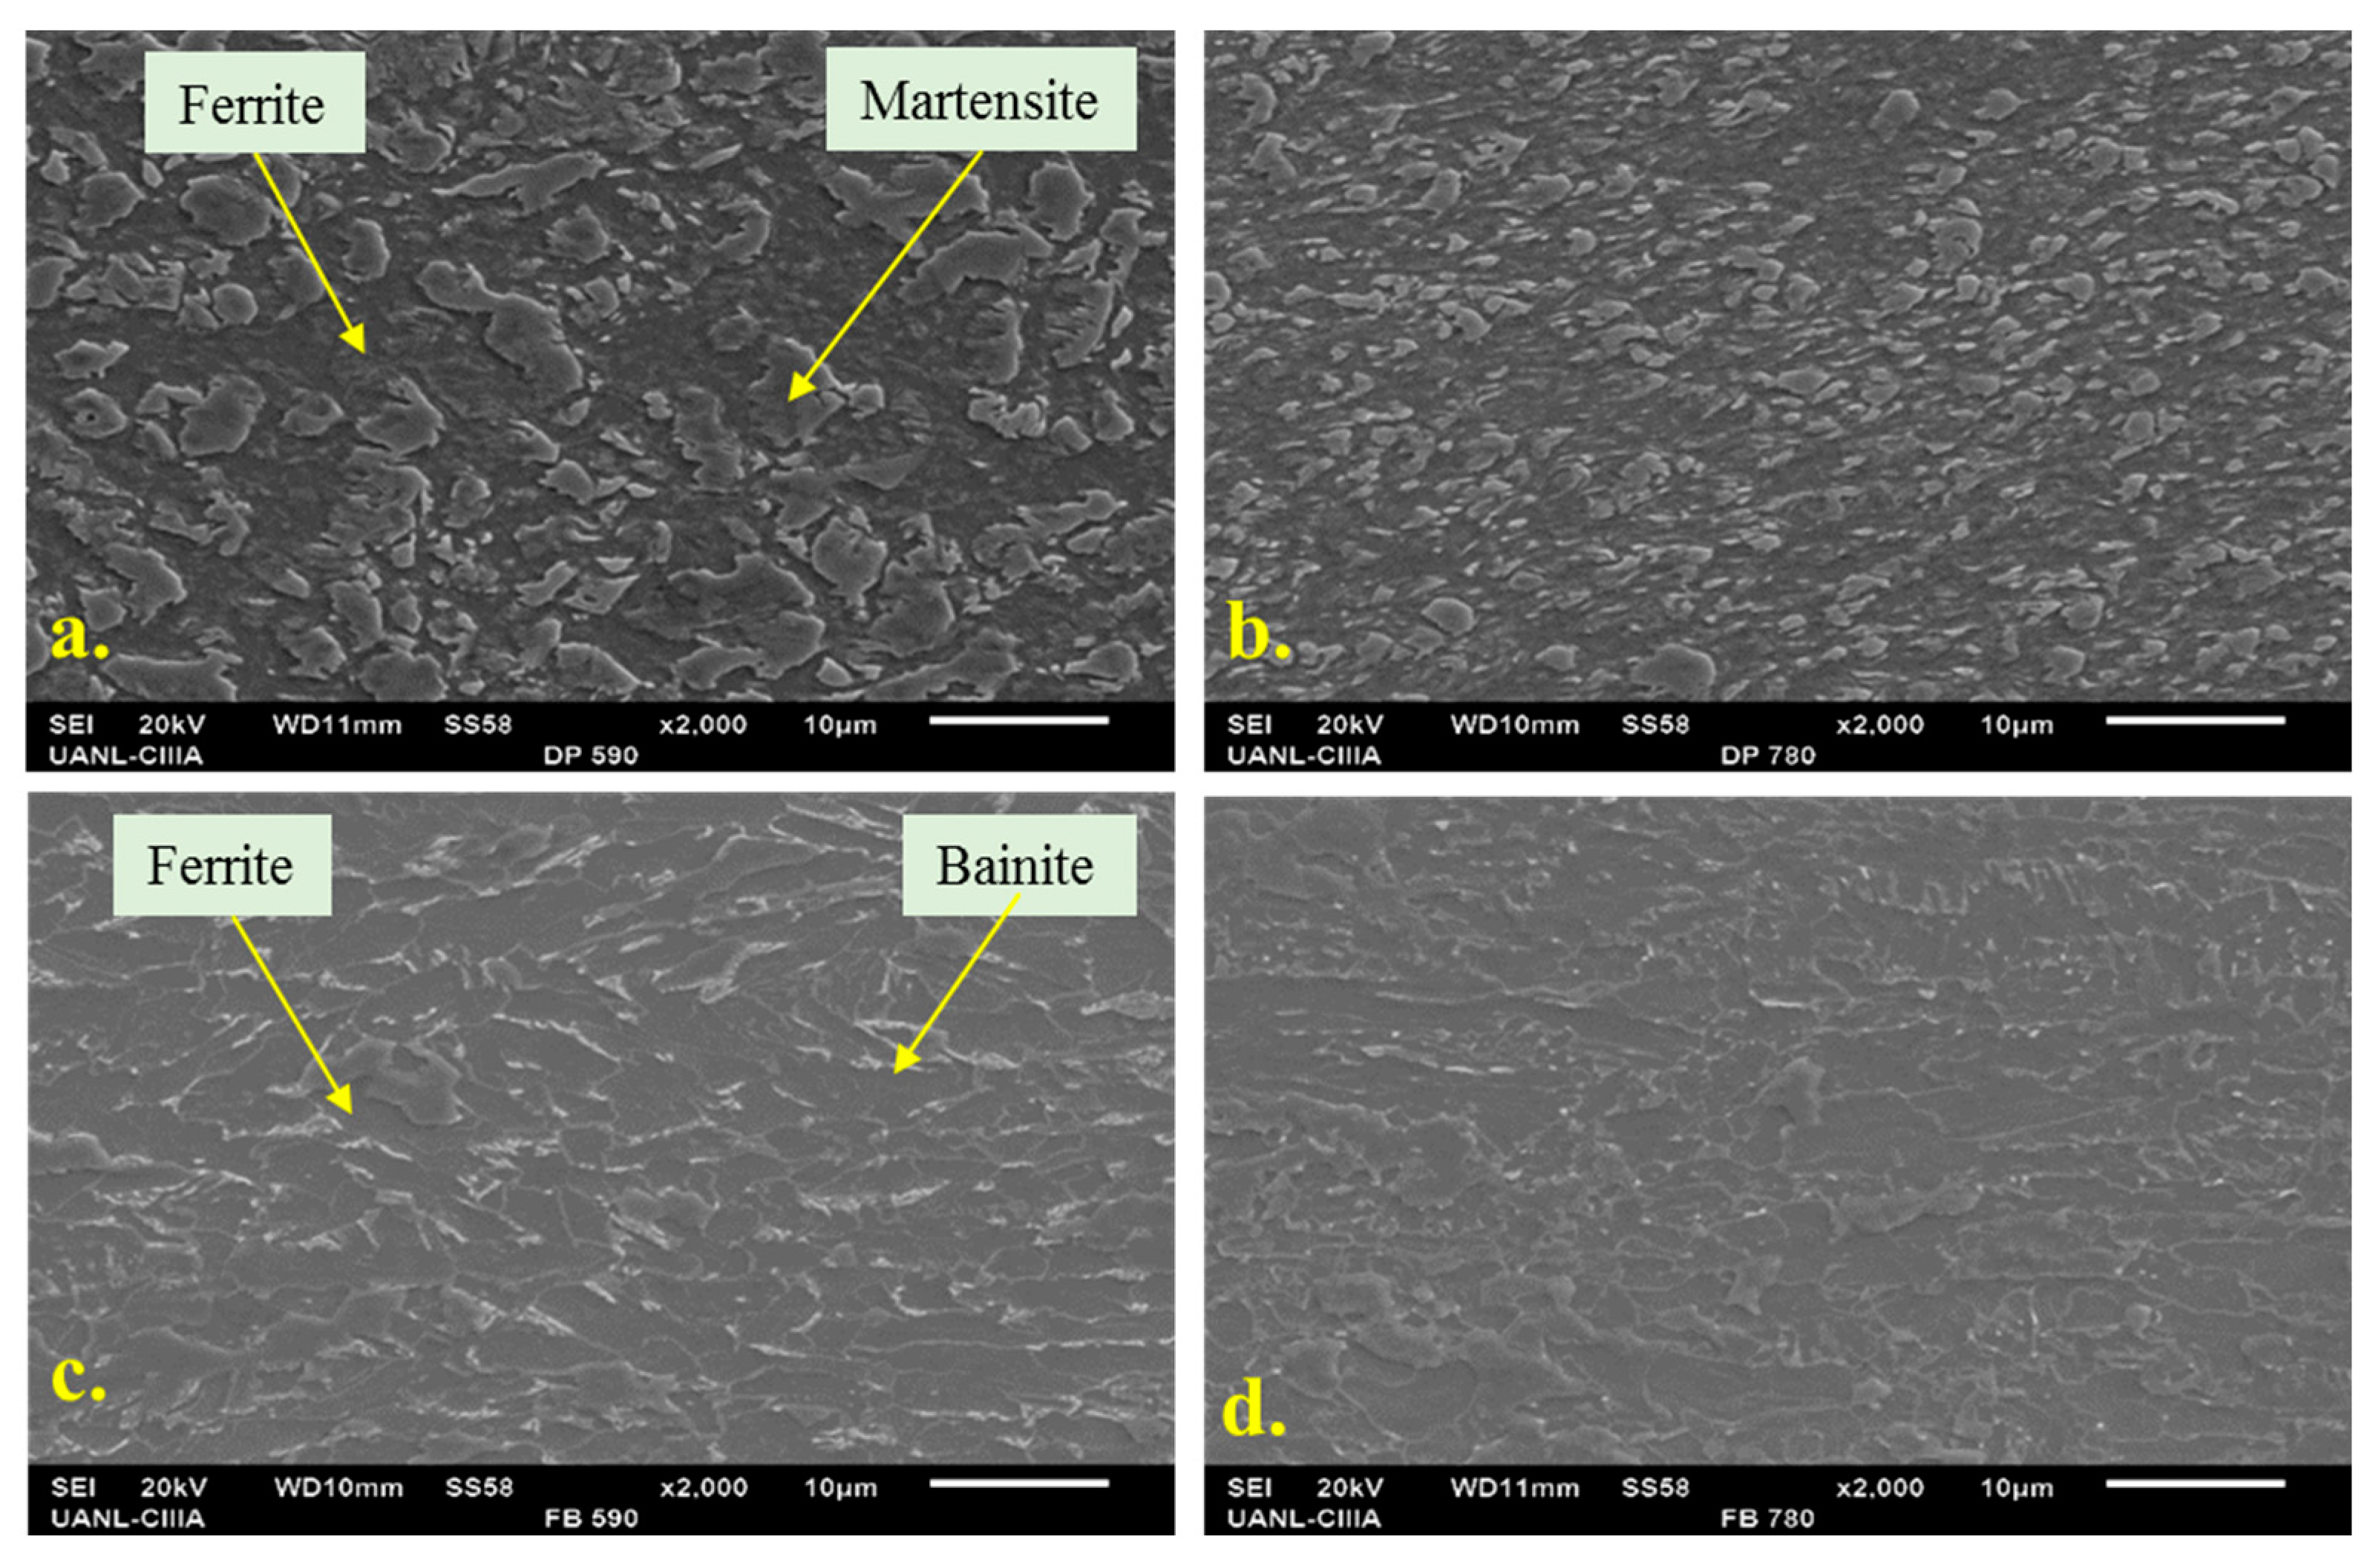
Figure 1. Scanning electron microscopy (SEM) microstructures of (a) DP590, (b) DP780, (c) FB590 and (d) FB780 steels.
Metals 10 01232 g001
Figure 2. Direct current (DC) trend for time series electrochemical noise (EN) data of DP590 and DP780 steels immersed in NaCl solution.
Metals 10 01232 g002
Figure 3. Removing DC trend from the electrochemical current and potential noise for DP590 and DP780 steels in different solutions.
Metals 10 01232 g003
Figure 4. Removing DC trend from the electrochemical current and potential noise for FB590 and FB780 steels in different solutions.
Metals 10 01232 g004
Figure 5. Reciprocal of the resistance Rn in the different solutions for the different advanced steels.
Metals 10 01232 g005
Figure 6. Instantaneous measured Rn for different steels in NaCl, CaCl2 and MgCl2 solutions.
Metals 10 01232 g006
Figure 7. EN data in frequency domains for DP steels exposed in NaCl, CaCl2 and MgCl2 solutions.
Metals 10 01232 g007
Figure 8. EN data in frequency domains for FB steels exposed in NaCl, CaCl2 and MgCl2 solutions.
Metals 10 01232 g008
Table 1. Chemical composition of different advanced high-strength steels (AHSS, wt.%).
AHSSFeCMnCrNiMoSiPTiNb
DP590Bal.0.091.200.4400.0690.0390.3300.022--
DP780Bal.0.102.610.420--0.510-0.080-
FB590Bal.0.091.510.022--0.290--0.043
FB780Bal.0.091.730.640-0.0060.300-0.021-
Table 2. Statistical parameters of the noise data of different advances steel in different solutions.
AHSSSolutionRn
Ω·cm2
Localization IndexType CorrosionSkewness (i)Kurtosis (i) m i m v
DP590NaCl1560.00472uniform−1.1437.15−10.79−7.18
CaCl23490.15431Localized7.3574.84−9.73−8.80
MgCl24210.00054uniform0.223.71−2.49−0.82
780NaCl3530.02445Mixed0.133.47−9.34−4.56
CaCl21200.00853uniform−2.2342.23−8.94−5.72
MgCl24220.14547Localized−2.9919.62−7.25−2.41
FB590NaCl2910.00355uniform0.163.58−3.37−2.85
CaCl216860.00201uniform0.143.22−4.62−2.32
MgCl24250.00383uniform−0.54.98−5.42−5.49
FB780NaCl4260.00698uniform−6.18106.52−7.17−2.74
CaCl216220.00159uniform−0.072.28−3.77−2.59
MgCl21960.00837uniform0.423.65−10.47−6.33
Table 3. Hardness measurement and predicted tensile strength of different AHSS.
PropertyDP590DP780FB590FB780
Vickers hardness number, HVN182303184258
Ultimate tensile strength, UTS (MPa)589961594816
Table 4. Slopes of power spectral density (PSD) of electrochemical noise for different types of corrosion.
Type of CorrosionSlope
(dB[V]/decade)(dB[A]/decade)
MaxMinMaxMin
Passivation−15−251−1
Pitting−20−25−7−14
Uniform0−70−7