In Situ Synchrotron X-ray Study of the Mechanical Properties of Pure Mg Produced by Powder Metallurgy
by
Li Li
1, 
Leyun Wang
1,2,*,
Jie Wang
1,
Huan Zhang
1,
Qingchun Zhu
1,
Zhiqiang Li
2 and
Xiaoqin Zeng
1,2,* 1
National Engineering Research Center of Light Alloy Net Forming, Shanghai Jiao Tong University, 800 Dongchuan Road, Shanghai 200240, China
2
School of Materials Science and Engineering, The State Key Laboratory of Metal Matrix Composites, Shanghai Jiaotong University, 800 Dongchuan RD. Minhang District, Shanghai 200240, China
*
Authors to whom correspondence should be addressed.
Metals 2020, 10(9), 1198; https://doi.org/10.3390/met10091198
Submission received: 16 July 2020
/
Revised: 13 August 2020
/
Accepted: 15 August 2020
/
Published: 8 September 2020
(This article belongs to the Special Issue Strengthening Mechanisms in Metallic Materials)
Abstract
:In this study, in situ synchrotron X-ray experiments with wide-angle X-ray scattering (WAXS) and small-angle X-ray scattering (SAXS) detectors were performed on two pure magnesium materials produced by powder metallurgy. According to SAXS analysis, each of the two materials has a porosity of less than 0.5%. Line broadening analysis was performed on diffraction patterns collected by WAXS to analyze the dislocation evolution during material deformation. In both materials, <a>-type dislocation activities dominate the tensile deformation. The influence of grain size and texture on the different tensile behaviors of these two materials is also discussed.
1. Introduction
Yield strength and ductility are two key mechanical properties for metallic structural materials. However, these two properties are usually exclusive of each other. Recently, a deformed and partitioned steel with very high ductility [1] was developed using a “dislocation engineering” concept. Therein, high dislocation density contributes to the high yield strength, and a large fraction of mobile dislocations is responsible for achieving high ductility.
The same alloy design strategy can be applied to magnesium alloys, the lightest metallic structural materials. To increase the mobile dislocation density, it is necessary to activate <c + a> dislocations, which proves to be critical for enhancing the ductility of Mg [2,3,4]. While the type of dislocations in deformed Mg can be examined by transmission electron microscopy (TEM) [4], a more statistically robust method is more desirable.
High-energy X-ray experiments have the potential to address this issue. X-ray line profile analysis (XLPA) has been used to quantitatively analyze the different types of dislocations in hexagonal metals [5,6,7] by analyzing diffraction profiles obtained from wide-angle X-ray scattering (WAXS). The extension Convolutional Multiple Whole Profile (e-CMWP) software and the Hexburger software are established tools for data analysis [8,9,10].
In this work, we use in situ synchrotron X-rays to analyze the dislocation density evolution in two pure Mg materials produced by powder metallurgy (PM). The porosity is first evaluated in these two materials by using the small-angle X-ray scattering (SAXS) profile [11,12]. Texture evolution and dislocation evolution during material deformation were analyzed using the WAXS data [13,14,15,16,17,18,19,20,21].
2. Methods
2.1. Materials and Experimental Procedures
Gas-atomized pure Mg powders (99.7 wt%), from a direct current arc plasma evaporation apparatus, with spherical particles ranging from 2.2 to 10 μm and a lognormal distribution (measured by Brunauer–Emmet–Teller (BET)) were cold pressed by a 2000 KN hydraulic press machine. The consolidated powders were milled out (DH) or heat-treated at 500 °C for 1 h and then milled out (FPS). Powders sheathed in cans were compacted at 200 °C and then stripped off to obtain extrusion feedstock. The feedstock was kept at 350 °C for 0.5 h; afterwards, it was extruded at the extrusion temperature of 300 °C, the extrusion ratio of 25:1, and the extrusion speed of 11 mm/s. The processing procedures for the two materials are shown in Figure 1.
From the extruded bar, flat dog-bone tensile specimens with 5.0 mm (L) × 1.2 mm (W) × 1.0 mm (T) gauge dimensions were fabricated by electrical discharge machining (EDM). The tensile axis was parallel to the extrusion direction. The uniaxial tensile experiment was performed at a strain rate of 2 × 10⁻⁴ s−1 at 1-ID beamline of the Advanced Photon Source (APS). WAXS and SAXS signals were simultaneously collected during specimen loading, as illustrated in Figure 2. Instrument parameters (beam center, detector tilts, and sample-to-detector distance) were calibrated using a CeO2 standard sample (NIST-SRM 674b). More details can be found in [29].
To more completely characterize the microstructure, optical metallography (OM) and transmission electron microscopy (TEM, JEM-2100F, JEOL, Japan) were employed. All of the microscopy samples were cut from the sections perpendicular to the extrusion directions. OM samples were etched using a mixture of 1 g citric acid, 40 mL ethanol, and 20 mL distilled water. TEM samples were prepared by electro-polishing with a solution containing 5% perchloric acid, 34% butanol, and 61% distilled water.
2.2. X-ray Data Analysis
The WAXS diffraction patterns were transformed to diffraction line profiles using the GSAS-II software (GSAS-II, Argonne National Laboratory, United States) [30]. The azimuthal range of [−25°, 25°] around the tensile direction was used (tensile direction is marked with a white arrow marked in Figure 2) [19,29]. The XLPA procedure was further performed to estimate the fraction of different dislocation slip systems during material deformation using the CMWP (http://csendes.elte.hu/cmwp/) and Hexburger software (1.0, HexBurger, Prague, Czechia). Assuming that the two materials have a fiber texture, an open-source software, MTEX (5.3.1, Mtex, Chemnitz, Germany) [18], was utilized to calculate inverse pole figures from the WAXS diffraction patterns. The SAXS data were analyzed using the Irena package in Igor Pro (1.4.1, Irena, Argonne National Laboratory, DuPage County, IL, United States) [31] to estimate the porosity in the materials.
3. Results
3.1. Initial Microstructure
Figure 3 shows the OM images (a,c) and the measured grain size distributions (b,d) of the two materials. The grain size was measured using the linear intercept method with a software named Nano-measurement. For both DH and FPS, at least three images were used to measure the grain size. The average grain size is 3.1 μm in the DH material and 11.6 μm in the FPS material. For the DH sample, the grain size is close to the size of the original powders, which have a lognormal grain size distribution. The porosity was less than 0.5% in each of these two materials according to both the Archimedes measurement and the SAXS measurement (see Figure 4).
3.2. Mechanical Properties Determined by In Situ Tensile Tests at Room Temperature
Engineering stress–strain curves of the DH specimen (grain size = 3.1 μm) and the FPS specimen (grain size = 11.6 μm) were obtained from in situ testing and are shown in Figure 7. Key tensile properties extracted from the curves are listed in the built-in table. Elongation of the FPS specimen is almost twice the elongation of the DH specimen. The yield strength and UTS of the two specimens are close to each other.
3.3. Texture Evolution
Figure 8a,c shows the initial texture of the two specimens based on their WAXS diffraction patterns calculated by MTEX. The two specimens show similar texture, with the tensile axis close to the {1-100} pole. The only difference between these two materials is that the powder was heat-treated at 500 °C for 1 h before extrusion for the FPS material. This step increases the grain size but is unlikely to change the texture significantly. Figure 8b,d shows the texture of the specimens before their fracture. Because the two specimens failed at relatively small strain, the texture did not change much for both specimens.
3.4. Peak Broadening during the Tensile Test
During the in situ tensile test, shifting and broadening of diffraction peaks were observed, as shown in the inset of Figure 9. We are more interested in peak broadening, which reflects the dislocation activity in the specimen. Figure 9 shows the evolution of the full width at half maximum (FWHM) of the {}, {}, and {} peaks as a function of strain. Those peaks all show a gradual increase of FWHM values.
3.5. Dislocation Evolution Analysis
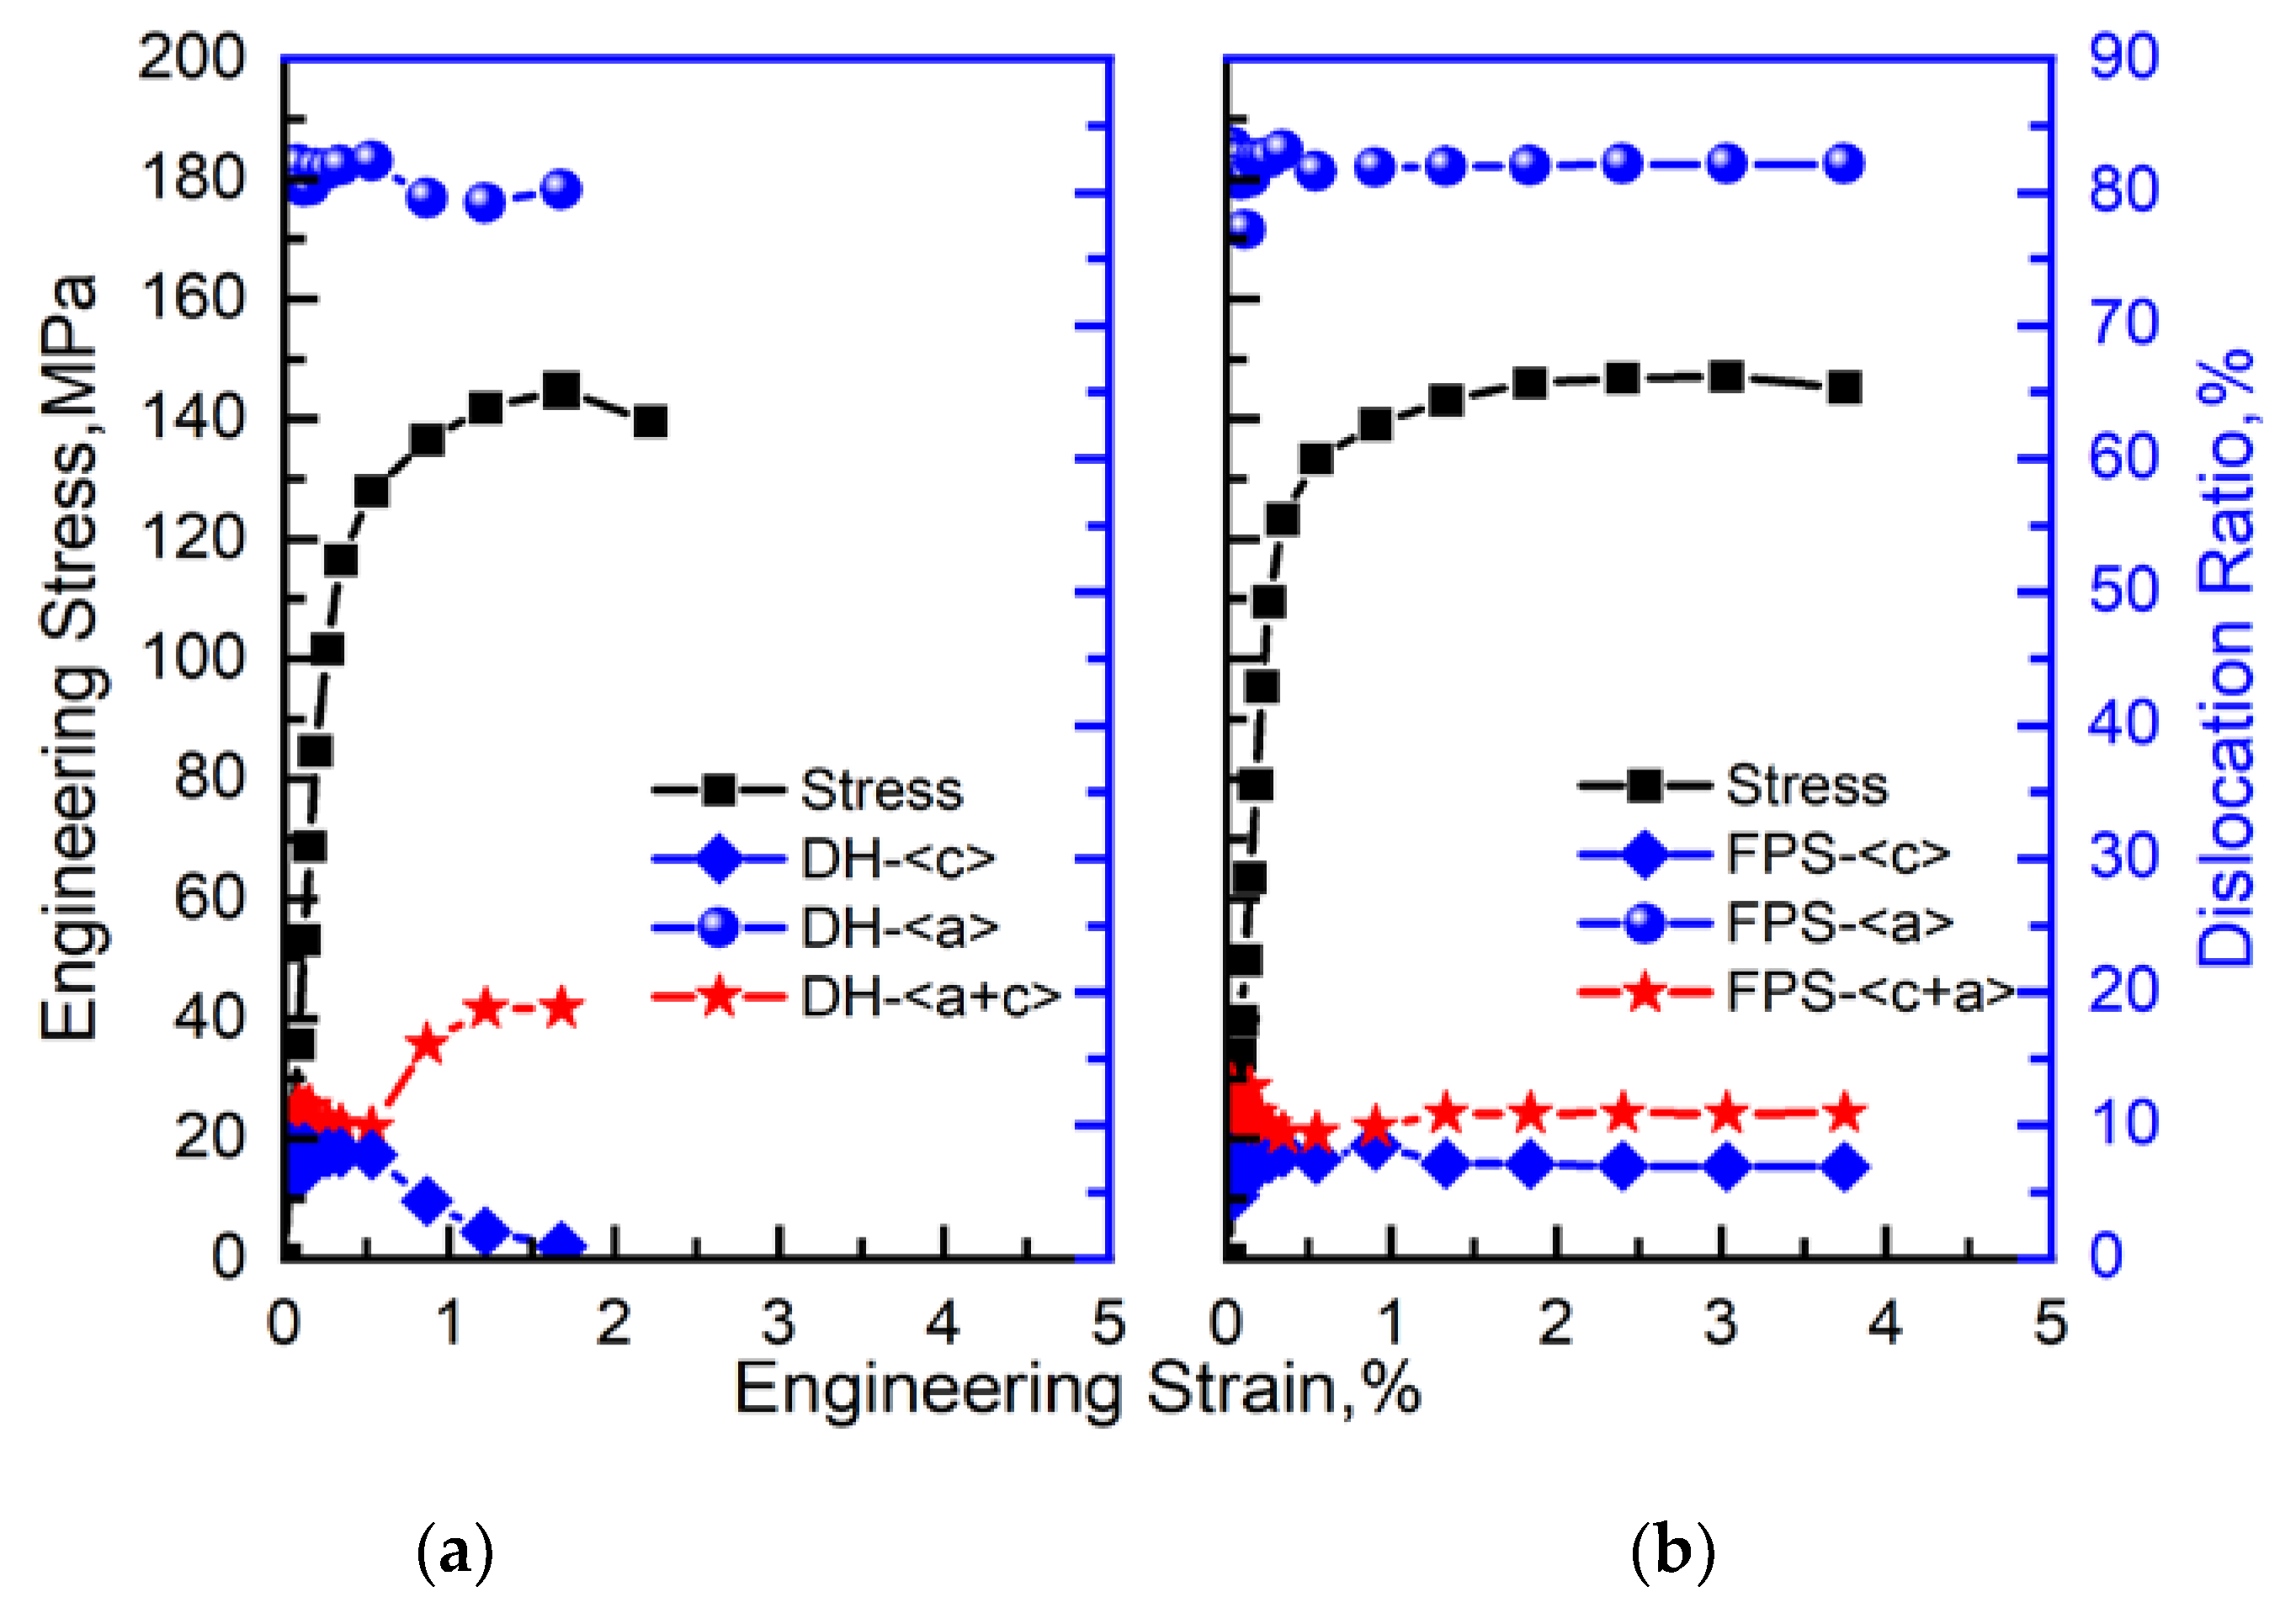
The observed peak broadening in the two samples were caused by dislocation activity. To quantitatively understand the activity of different dislocation slip systems, the Hexburger software was used. Table 1 shows the 11 possible slip systems that can be activated [5,8]. Following the instructions of the Hexburger software [5,8,19], we computed the relative fraction of each slip system. We grouped the slip systems into three categories according to their Burgers vectors: <a>, <c>, and <c + a>. Figure 10 shows the evolution of the relative fraction of <a>, <c>, and <c + a> dislocations in the DH and the FPS specimens during deformation. In both specimens, the <a> dislocations dominate the deformation. The DH specimen shows an increase of <c + a> dislocation fraction during plastic deformation. This specimen has smaller grain size. The increased <c + a> activity could be induced by the stress concentration at grain boundaries. The DH specimen fractured earlier than the FPS specimen, which may also be explained by the sudden increase of <c + a> dislocations, which are usually less mobile [3].
4. Discussion
The two materials (DH and FPS) were both obtained by extrusion of pressed Mg powders. Indeed, both materials have lower yield strength than that of conventional pure Mg extrusion bars. We conducted some ex situ tensile and compression tests, and similar findings were obtained. This decrease in yield strength could be due to the texture effect: both DH and FPS materials were prepared by extruding powders instead of cast ingots. This difference causes a weak texture, as demonstrated in Figure 8. Under a weak texture, the easy basal slip can be activated in more grains, which reduces the yield strength. The DH material with a grain size of ~3 μm shows a yield strength similar to that of the FPS material with a grain size of ~10 μm. A possible explanation is that the heat treatment at 500 °C not only increased the grain size but also eliminated some porosity in the FPS material. The latter effect may offset the Hall–Petch effect, so that the two materials show similar strength.
From the X-ray line profile analysis, we were able to estimate the relative fraction of <a>, <c>, and <c + a> dislocations during material deformation. The <a> dislocations dominated the deformation of both materials. This observation is consistent with other researchers’ findings in conventional pure Mg [22]. The <c + a> dislocations became more active with strain. Nucleation of <c + a> dislocations can accommodate the stress concentration and strain incompatibility across grain boundaries. On the other hand, the <c + a> dislocations have low mobility [3], so both materials fractured at a relatively small strain.
The DH material shows a higher fraction of <c + a> dislocations during its deformation. The smaller grain size causes more dislocation pile-up at grain boundaries, which tends to induce <c + a> dislocations. Similar results were reported in [28].
5. Conclusions
- (1)
- Two pure Mg materials with different grain sizes (DH and FPS) were prepared by extrusion of Mg powders. After extrusion, porosity was less than 0.5% in both materials.
- (2)
- From the in situ tensile test, it was determined that the yield strength values of DH and FPS were 114 and 124 MPa, respectively. The elongation values of DH and FPS were 2.2% and 4.3%, respectively.
- (3)
- According to the analysis of diffraction peak broadening, <a>-type dislocations dominated the deformation of both materials. The DH material showed a higher fraction of <c + a> dislocations, which may be due to its smaller grain size causing more dislocation pile-up at grain boundaries.
Author Contributions
Conceptualization, X.Z. and L.L.; methodology, Z.L. and L.W.; experiments, J.W., H.Z., and Q.Z.; software, L.L.; writing—original draft preparation, L.L.; writing—review and editing, L.W.; project administration, Shanghai Jiao Tong University. All authors have read and agreed to the published version of the manuscript.
Funding
This research was funded by the National Natural Science Foundation of China, grant numbers No.51671127 and No.51825101. Use of the Advanced Photon Source was supported by the United States Department of Energy, Office of Science, Office of Basic Energy Sciences, under Contract No. DE-AC02-06CH11357.
Acknowledgments
The authors are thankful for the kind help of K. Mathis at Charles University and Sangbong Yi at Helmholtz-Zentrum Geesthacht for the usage of Hexburger software. The authors are also grateful for the help of Youkang Wang at University of Science and Technology Beijing with the usage of MTEX.
Conflicts of Interest
The authors declare no conflict of interest.
References
- He, B.B.; Hu, B.; Yen, H.W.; Cheng, G.J.; Wang, Z.K.; Luo, H.W.; Huang, M.X. High dislocation density–induced large ductility in deformed and partitioned steels. Science 2017, 357, 1029–1032. [Google Scholar] [CrossRef] [PubMed] [Green Version]
- Wang, M.; He, B.B.; Huang, M.X. Strong and ductile Mg alloys developed by dislocation engineering. J. Mater. Sci. Technol. 2019, 35, 168–169. [Google Scholar] [CrossRef]
- Wu, Z.; Curtin, W.A. The origins of high hardening and low ductility in magnesium. Nature 2015, 526, 62–67. [Google Scholar] [CrossRef] [PubMed] [Green Version]
- Liu, B.-Y.; Liu, F.; Yang, N.; Zhai, X.-B.; Zhang, L.; Yang, Y.; Li, B.; Li, J.; Ma, E.; Nie, J.-F.; et al. Large plasticity in magnesium mediated by pyramidal dislocations. Science 2019, 365, 73–75. [Google Scholar] [CrossRef]
- Gubicza, J. X-ray Line Profile Analysis in Materials Science; IGI Global: Hershey, PA, USA, 2014. [Google Scholar]
- Máthis, K.; Nyilas, K.; Axt, A.; Dragomir-Cernatescu, I.; Ungár, T.; Lukáč, P. The evolution of non-basal dislocations as a function of deformation temperature in pure magnesium determined by X-ray diffraction. Acta Mater. 2004, 52, 2889–2894. [Google Scholar] [CrossRef]
- Máthis, K.; Csiszár, G.; Čapek, J.; Gubicza, J.; Clausen, B.; Lukáš, P.; Vinogradov, A.; Agnew, S.R. Effect of the loading mode on the evolution of the deformation mechanisms in randomly textured magnesium polycrystals–Comparison of experimental and modeling results. Int. J. Plast. 2015, 72, 127–150. [Google Scholar] [CrossRef] [Green Version]
- Dragomir, I.C.; Ungár, T. Contrast factors of dislocations in the hexagonal crystal system. J. Appl. Crystallogr. 2002, 35, 556–564. [Google Scholar] [CrossRef]
- Scardi, P.; Leoni, M.; Delhez, R. Line broadening analysis using integral breadth methods: A critical review. J. Appl. Crystallogr. 2004, 37, 381–390. [Google Scholar] [CrossRef]
- Ungár, T.; Tichy, G.; Gubicza, J.; Hellmig, R.J. Correlation between subgrains and coherently scattering domains. Powder Diffr. 2005, 20, 366–375. [Google Scholar] [CrossRef] [Green Version]
- Bale, H.D. Small-Angle X-Ray-Scattering Investigation of Submicroscopic Porosity with Fractal Properties. Phys. Rev. Lett. 1984, 53, 596–599. [Google Scholar] [CrossRef]
- Guizar-Sicairos, M.; Georgiadis, M.; Liebi, M. Validation study of small-angle X-ray scattering tensor tomography. J. Synchrotron Radiat. 2020, 27, 779–787. [Google Scholar] [CrossRef] [PubMed]
- Ha, C.; Bohlen, J.; Yi, S.; Zhou, X.; Brokmeier, H.-G.; Schell, N.; Letzig, D.; Kainer, K.U. Influence of Nd or Ca addition on the dislocation activity and texture changes of Mg–Zn alloy sheets under uniaxial tensile loading. Mater. Sci. Eng. A 2019, 761, 138053. [Google Scholar] [CrossRef]
- Wcislak, L.; Klein, H.; Bunge, H.J.; Garbe, U.; Tschentscher, T.; Schneider, J.R. Texture analysis with high-energy synchrotron radiation. J. Appl. Crystallogr. 2002, 35, 82–95. [Google Scholar] [CrossRef] [Green Version]
- Yi, S.; Gan, W.; Brokmeier, H.G. Texture Analyses by Synchrotron X-rays and Neutrons; Wiley-VCH Verlag GmbH & Co. KGaA: Weinheim, Germany, 2017. [Google Scholar]
- Lutterotti, L.; Vasin, R.; Wenk, H.-R. Rietveld texture analysis from synchrotron diffraction images. I. Calibration and basic analysis. Powder Diffr. 2014, 29, 76–84. [Google Scholar] [CrossRef] [Green Version]
- Wenk, H.-R.; Lutterotti, L.; Kaercher, P.; Kanitpanyacharoen, W.; Miyagi, L.; Vasin, R. Rietveld texture analysis from synchrotron diffraction images. II. Complex multiphase materials and diamond anvil cell experiments. Powder Diffr. 2014, 29, 220–232. [Google Scholar] [CrossRef] [Green Version]
- Bachmann, F.; Hielscher, R.; Schaeben, H. Texture Analysis with MTEX–Free and Open Source Software Toolbox. Solid State Phenom. 2010, 160, 63–68. [Google Scholar] [CrossRef] [Green Version]
- Ribarik, G.; Ungar, T. Characterization of the microstructure in random and textured polycrystals and single crystals by diffraction line profile analysis. Mater. Sci. Eng. A 2010, 528, 112–121. [Google Scholar] [CrossRef]
- Ungár, T.; Stoica, A.D.; Tichy, G.; Wang, X.-L. Orientation-dependent evolution of the dislocation density in grain populations with different crystallographic orientations relative to the tensile axis in a polycrystalline aggregate of stainless steel. Acta Mater. 2014, 66, 251–261. [Google Scholar] [CrossRef]
- Cornelius, T.W.; Thomas, O. Progress of in situ synchrotron X-ray diffraction studies on the mechanical behavior of materials at small scales. Prog. Mater. Sci. 2018, 94, 384–434. [Google Scholar] [CrossRef]
- Cepeda-Jiménez, C.M.; Molina-Aldareguia, J.M.; Pérez-Prado, M.T. Effect of grain size on slip activity in pure magnesium polycrystals. Acta Mater. 2015, 84, 443–456. [Google Scholar] [CrossRef]
- Cepeda-Jiménez, C.M.; Molina-Aldareguia, J.M.; Pérez-Prado, M.T. Origin of the twinning to slip transition with grain size refinement, with decreasing strain rate and with increasing temperature in magnesium. Acta Mater. 2015, 88, 232–244. [Google Scholar] [CrossRef]
- Fan, H.; Aubry, S.; Arsenlis, A.; El-Awady, J.A. Grain size effects on dislocation and twinning mediated plasticity in magnesium. Scr. Mater. 2016, 112, 50–53. [Google Scholar] [CrossRef]
- Sim, G.D.; Kim, G.; Lavenstein, S.; Hamza, M.H.; Fan, H.; El-Awady, J.A. Anomalous hardening in magnesium driven by a size-dependent transition in deformation modes. Acta Mater. 2018, 114, 11–20. [Google Scholar] [CrossRef] [Green Version]
- Chino, Y.; Kimura, K.; Mabuchi, M. Twinning behavior and deformation mechanisms of extruded AZ31 Mg alloy. Mater. Sci. Eng. A 2008, 486, 481–488. [Google Scholar] [CrossRef]
- del Valle, J.A.; Carreño, F.; Ruano, O.A. Influence of texture and grain size on work hardening and ductility in magnesium-based alloys processed by ECAP and rolling. Acta Mater. 2006, 54, 4247–4259. [Google Scholar] [CrossRef]
- Wang, H.-Y.; Xue, E.-S.; Xiao, W.; Liu, Z.; Li, J.-B.; Jiang, Q.-C. Influence of grain size on deformation mechanisms in rolled Mg–3Al–3Sn alloy at room temperature. Mater. Sci. Eng. A 2011, 528, 8790–8794. [Google Scholar] [CrossRef]
- Zhang, D.; Wang, L.; Zhang, H.; Maldar, A.; Zhu, G.; Chen, W.; Park, J.-S.; Wang, J.; Zeng, X. Effect of heat treatment on the tensile behavior of selective laser melted Ti-6Al-4V by in situ X-ray characterization. Acta Mater. 2020, 189, 93–104. [Google Scholar] [CrossRef]
- Toby, B.H.; Dreele, R.B.V. GSAS-II: The Genesis of a Modern Open-Source All-Purpose Crystallography Software Package. J. Appl. Crystallogr. 2013, 46, 544–549. [Google Scholar] [CrossRef]
- Ilavsky, J.; Jemian, P.R. Irena: Tool suite for modeling and analysis of small-angle scattering. J. Appl. Crystallogr. 2009, 42, 347–353. [Google Scholar] [CrossRef]
Figure 1.
Powder metallurgy (PM) process flow and sample position of tensile samples.
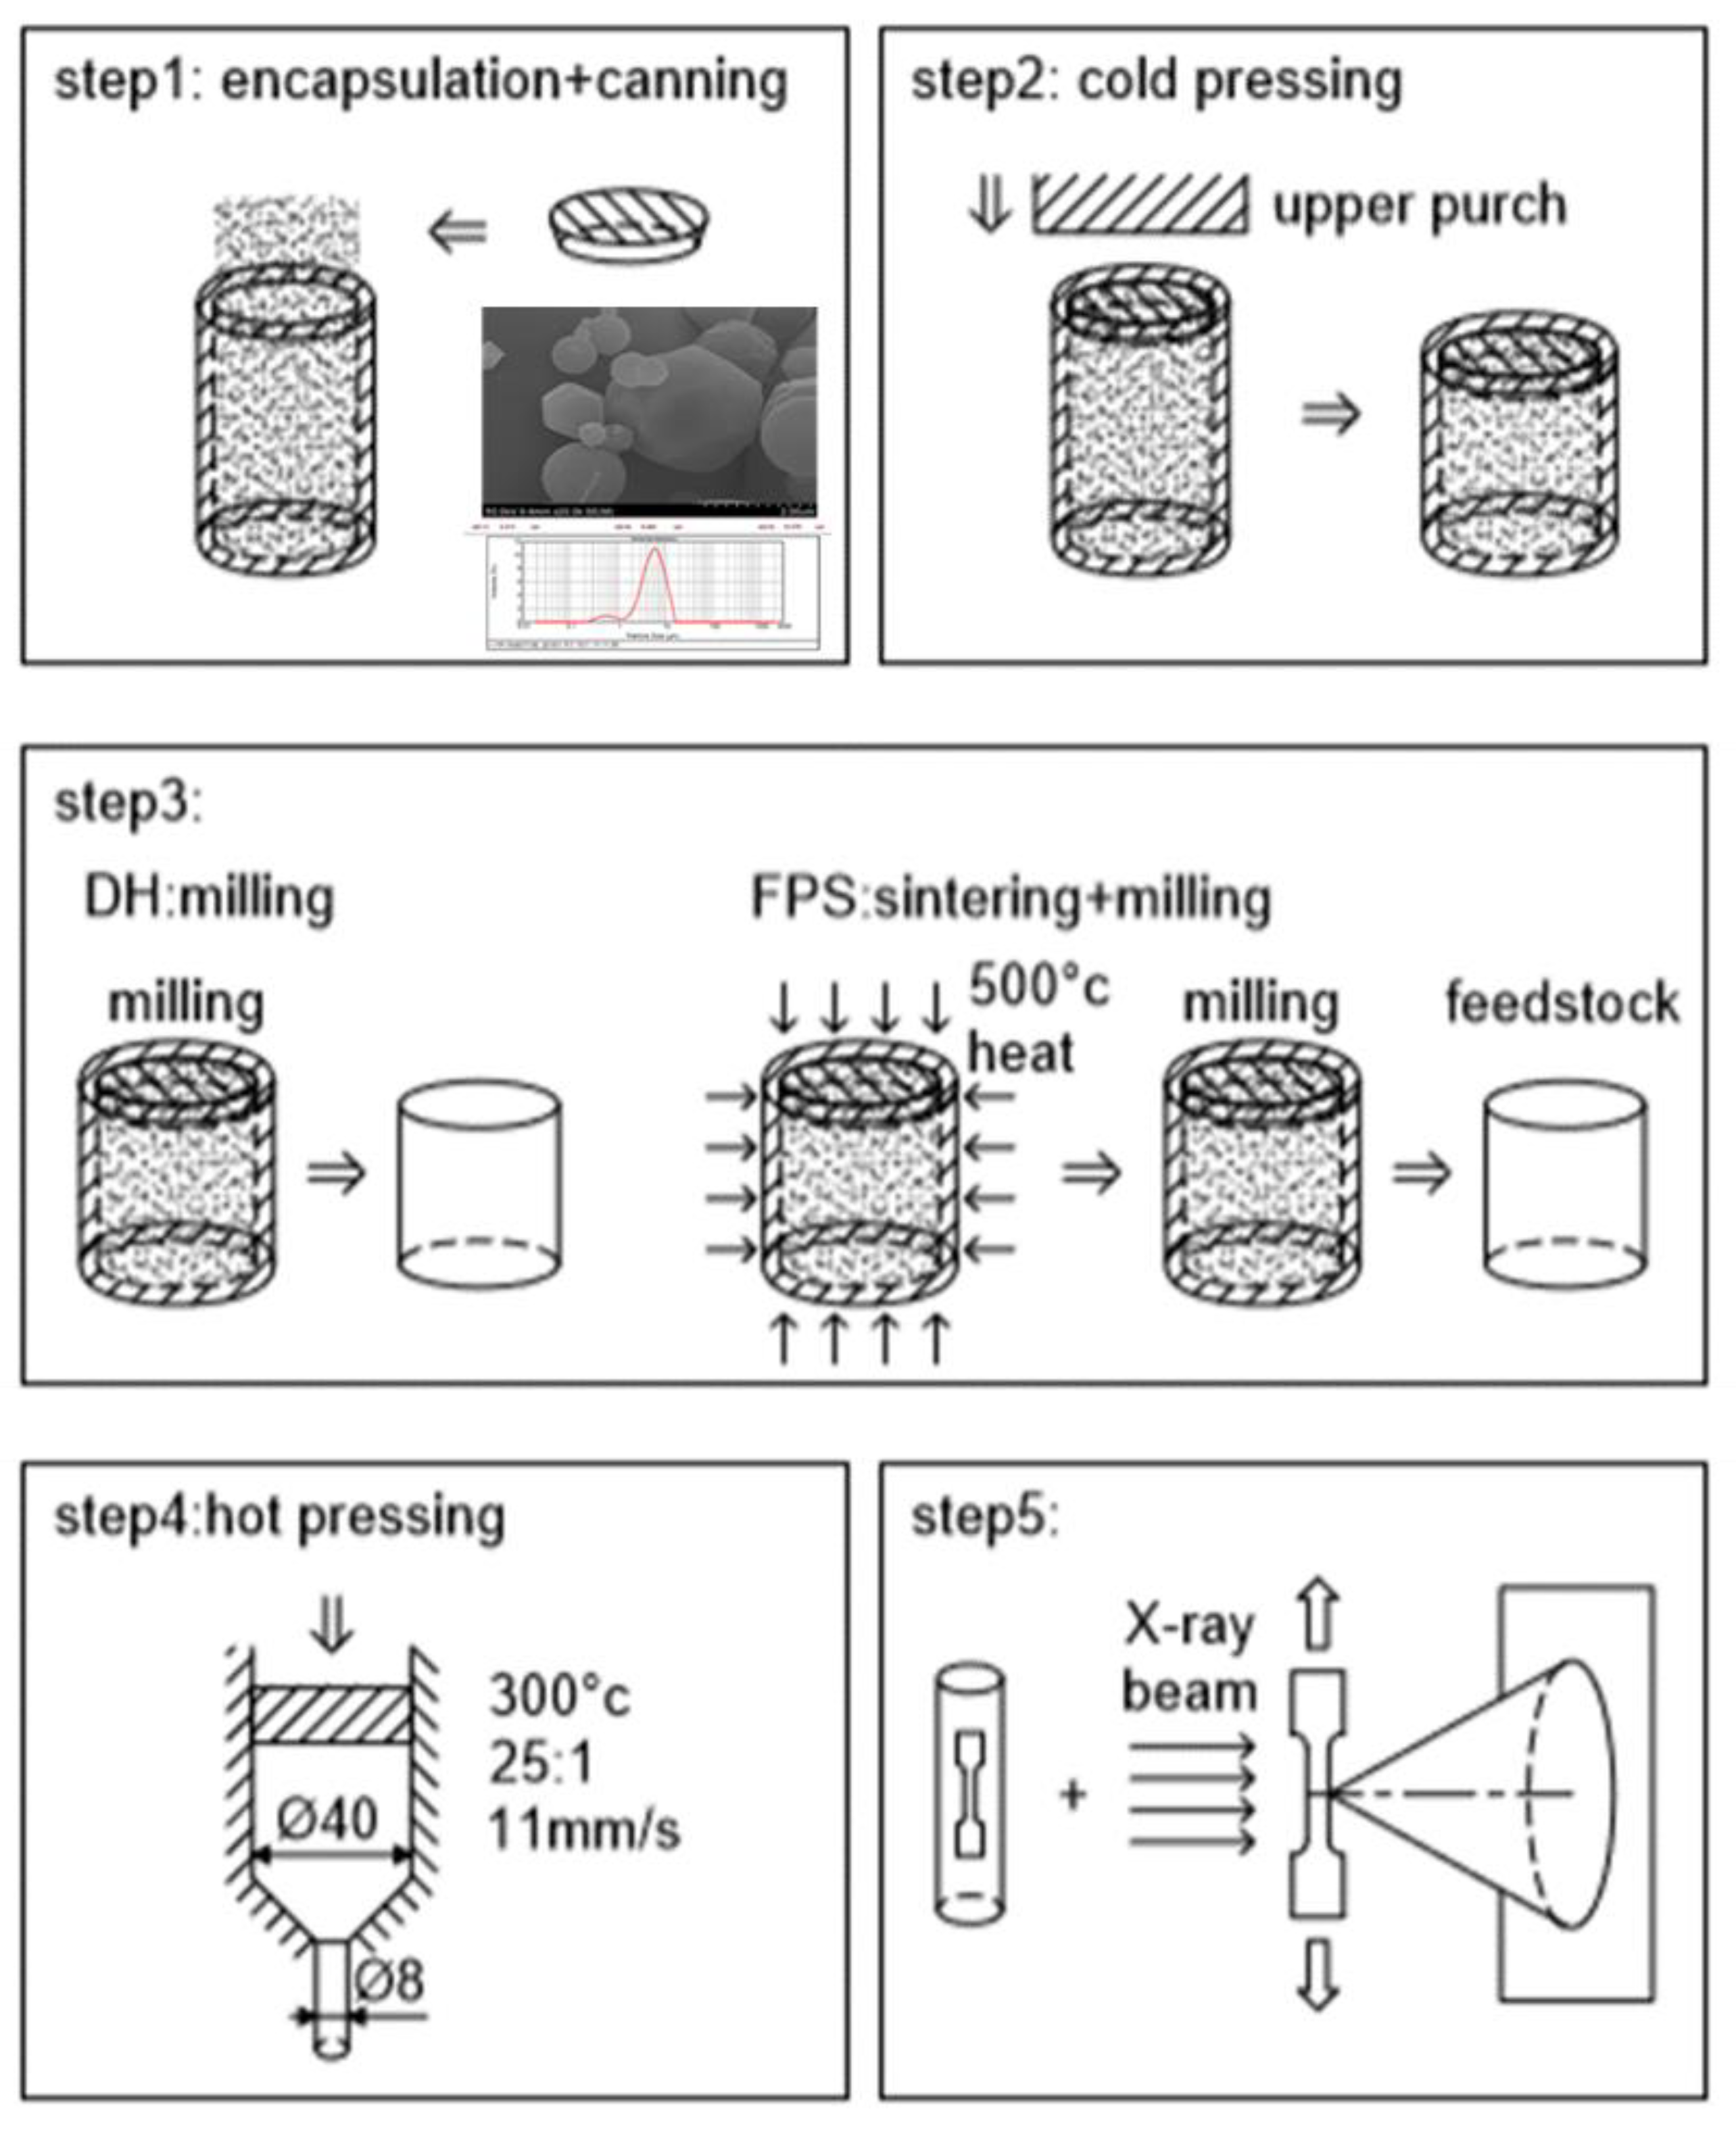
Figure 2.
In situ tensile experimental setup at beamline 1-ID of the advanced photon source (APS) concurrent with wide-angle X-ray scattering (WAXS) and small-angle X-ray scattering (SAXS) detectors. The arrow on the GE3 detector indicates the azimuthal direction of focus in this work.
Figure 2.
In situ tensile experimental setup at beamline 1-ID of the advanced photon source (APS) concurrent with wide-angle X-ray scattering (WAXS) and small-angle X-ray scattering (SAXS) detectors. The arrow on the GE3 detector indicates the azimuthal direction of focus in this work.
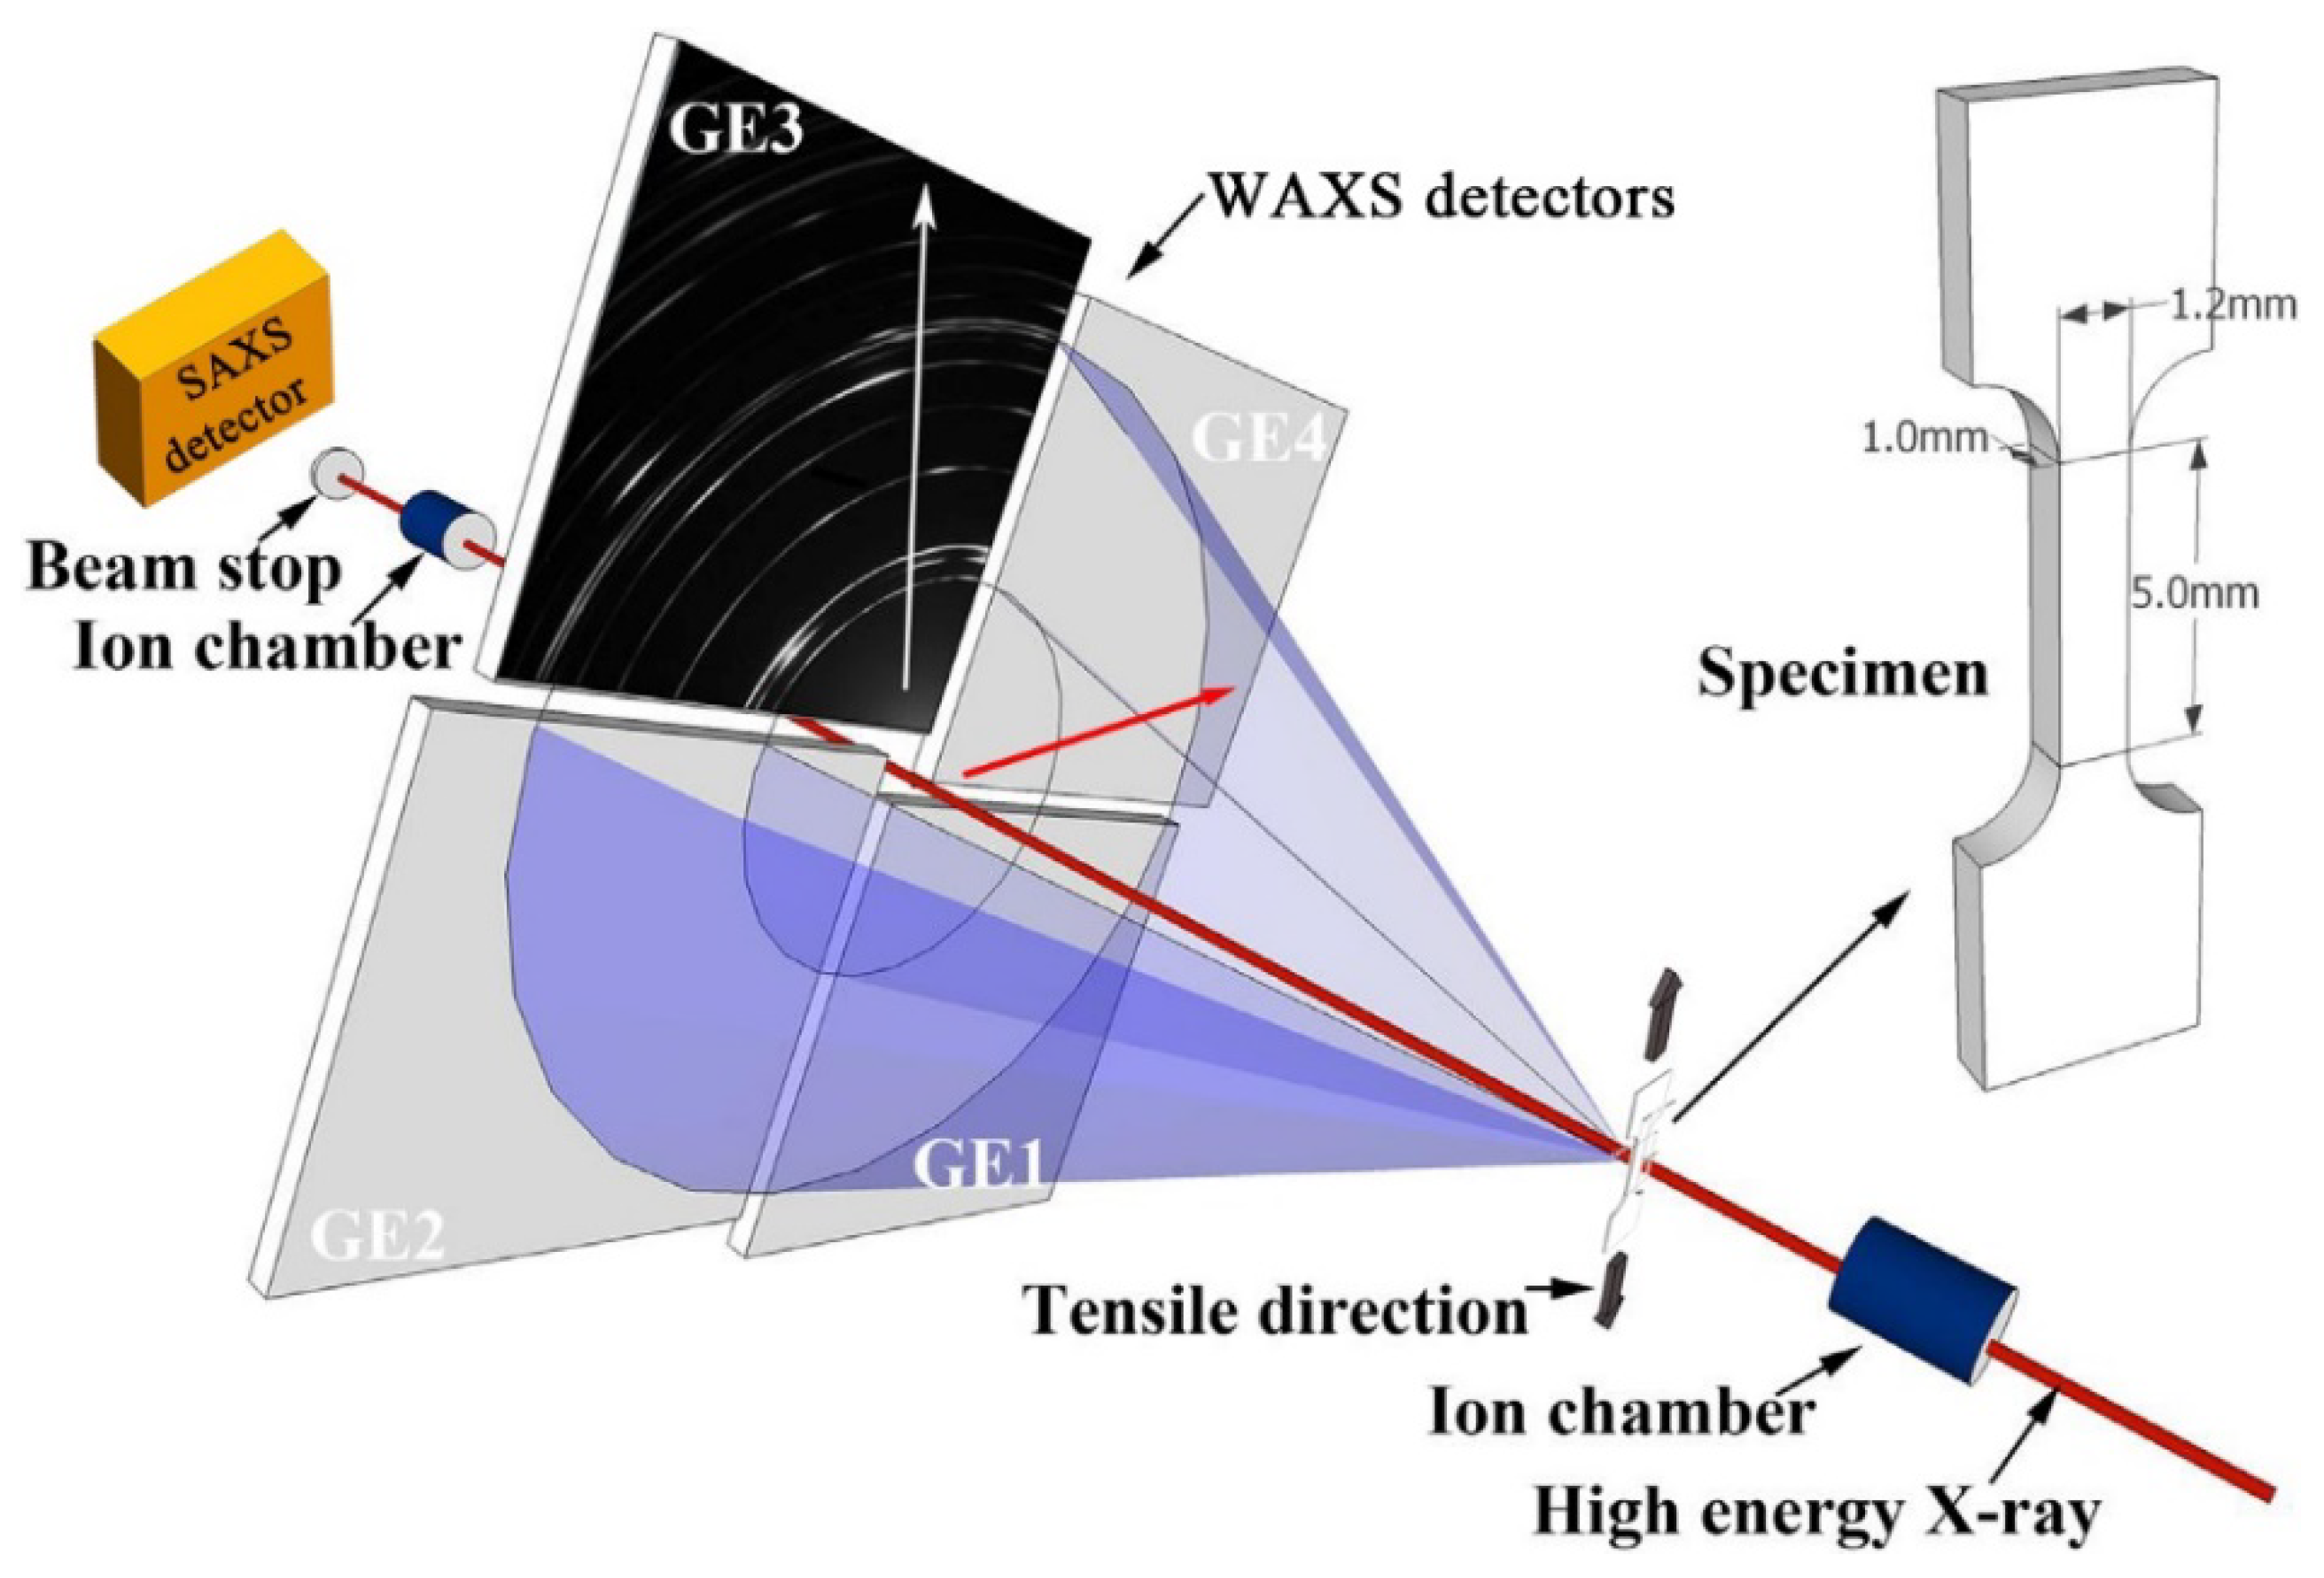
Figure 3.
Optical microstructure (a,c) and the measured grain size distribution (b,d).

Figure 4.
Estimation of the porosity in the milled-out specimen (DH) using SAXS line profile.

Figure 5.
TEM images of initial dislocations in DH sample (3.1 μm grain size): (a–c), non-<a> type (g = []), B close to [ ]); (d–f), <a> type (g = [ ], B close to [ ]); (a,d) selected area electron diffraction (SAED) patterns; (b,e) bright field images; (c,f) dark field images.
Figure 5.
TEM images of initial dislocations in DH sample (3.1 μm grain size): (a–c), non-<a> type (g = []), B close to [ ]); (d–f), <a> type (g = [ ], B close to [ ]); (a,d) selected area electron diffraction (SAED) patterns; (b,e) bright field images; (c,f) dark field images.
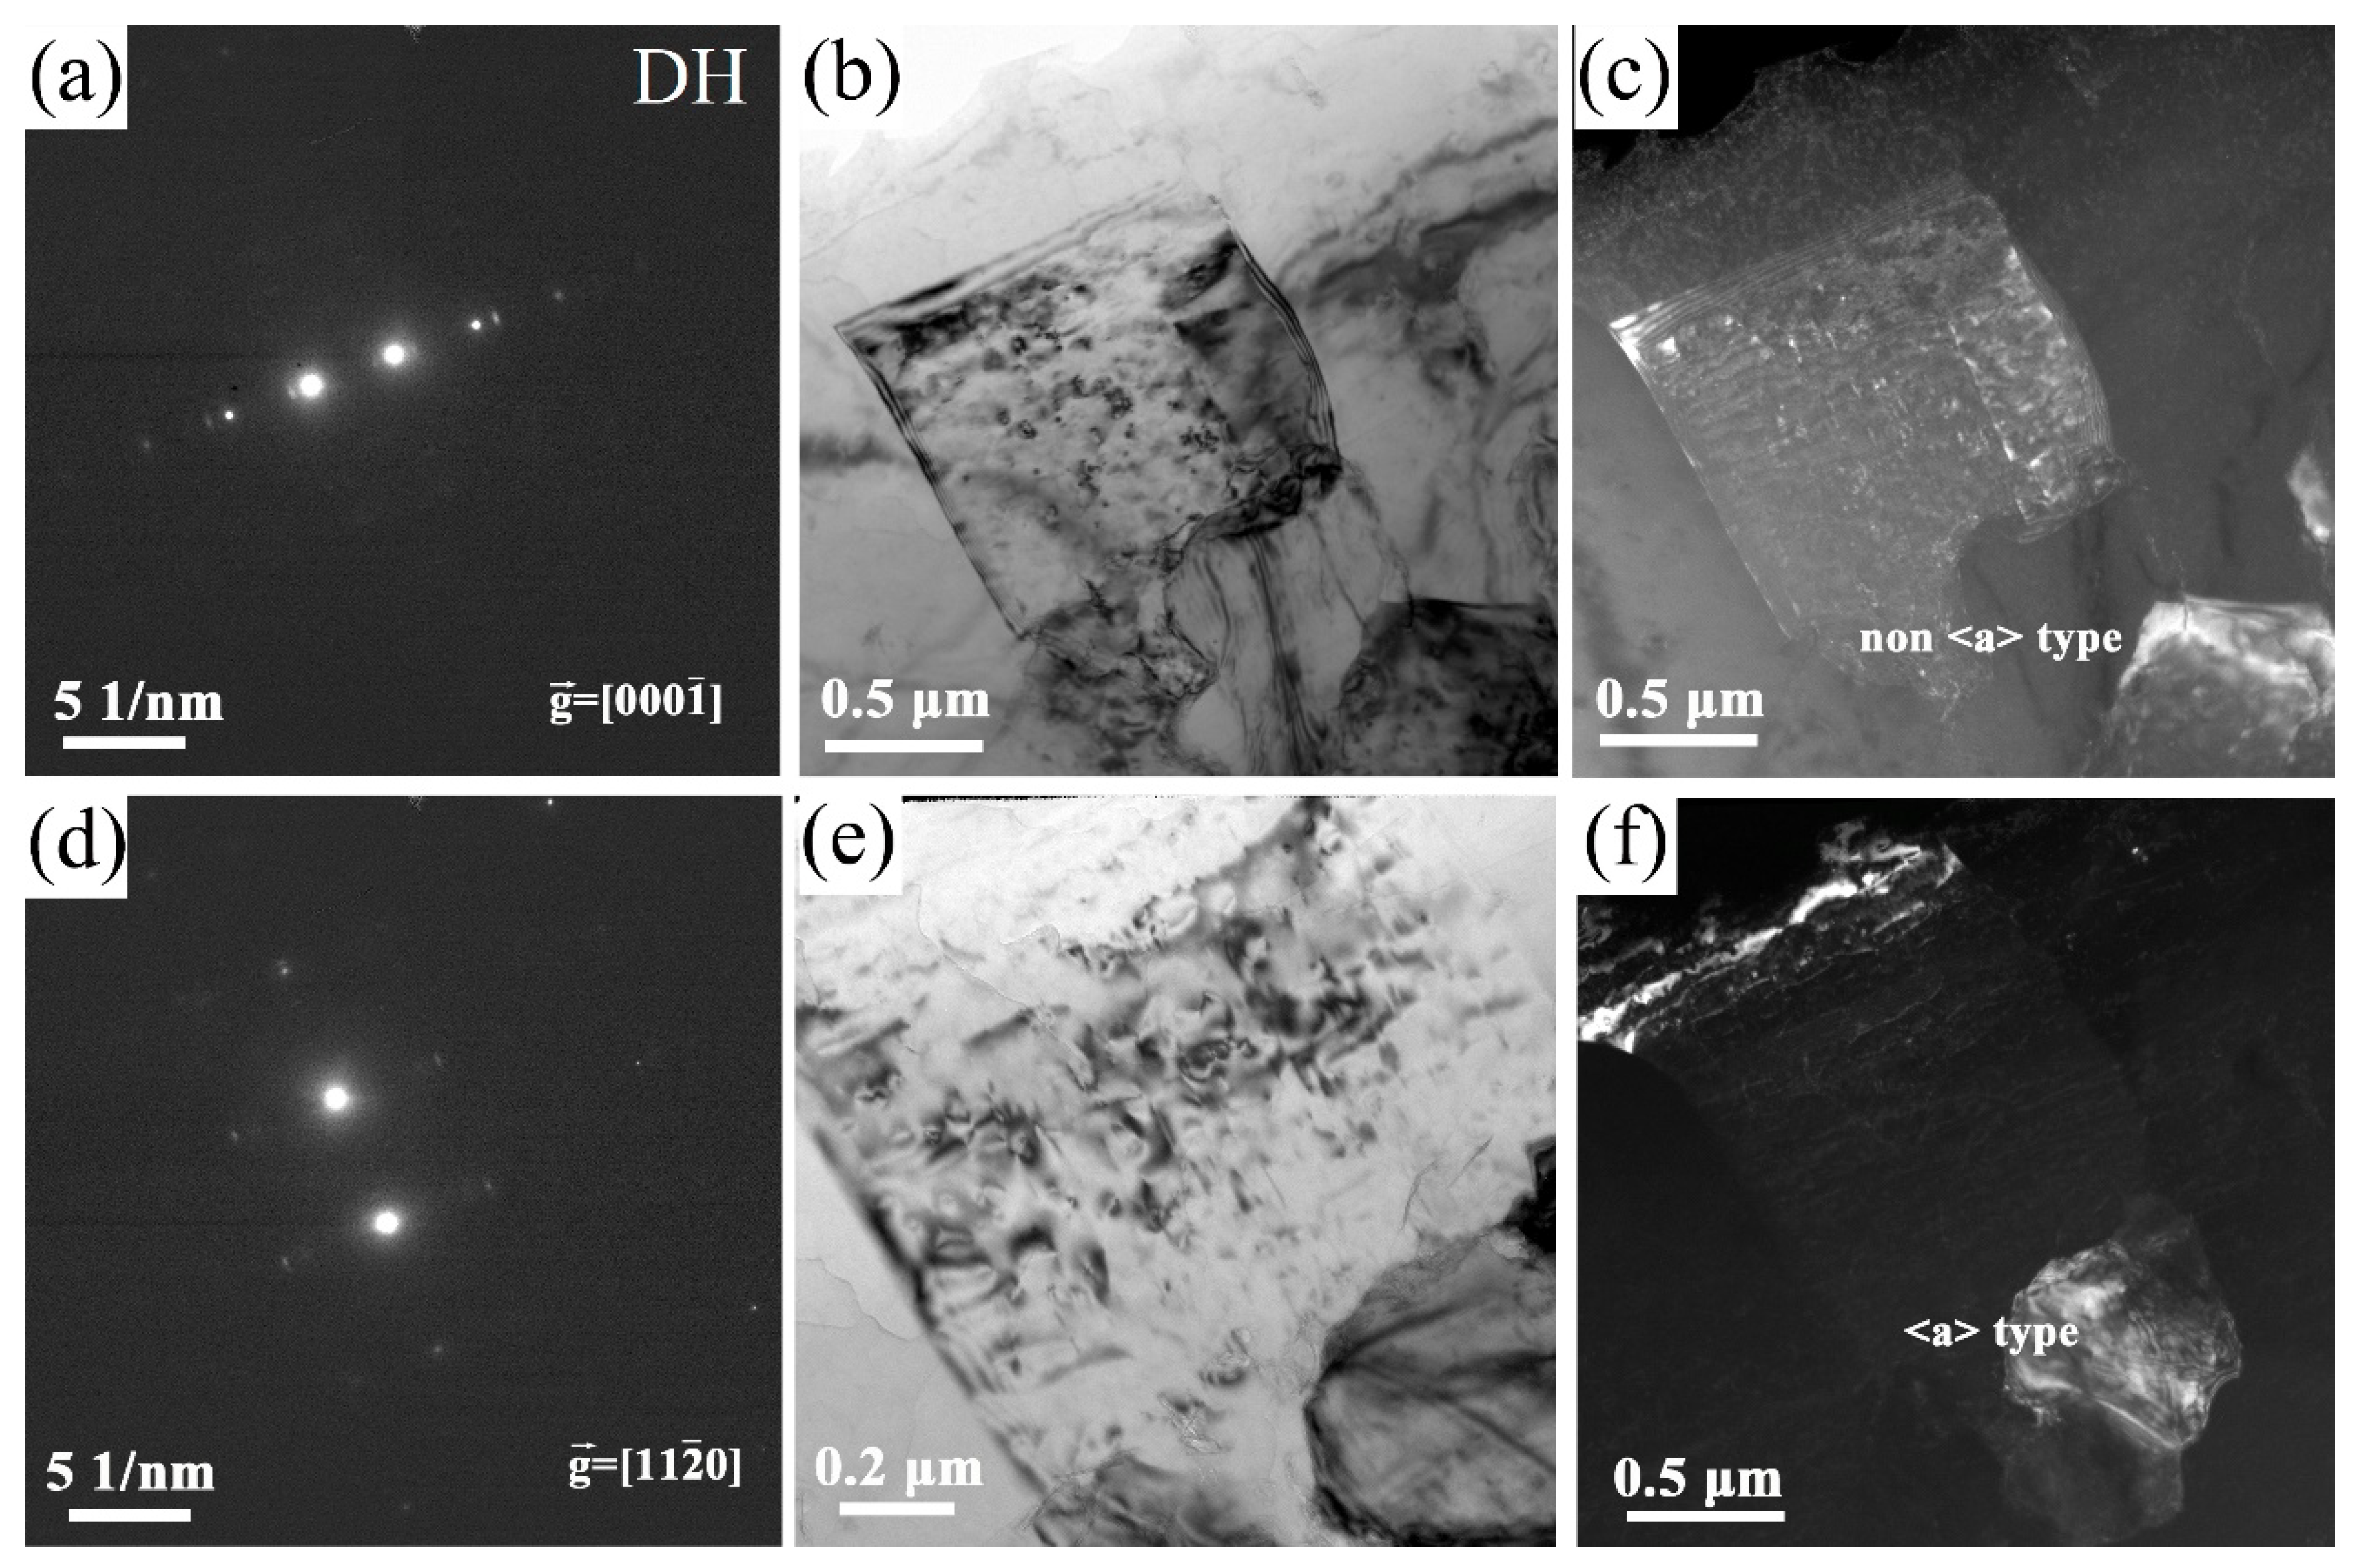
Figure 6.
TEM images of initial dislocations in heat-treated and milled-out sample (FPS) (11.6 μm grain size): (a–c), non-<a> type (g = []), B close to [ ]); (d–f), <a> type (g = [ ], B close to [ ]); (a,d) selected area electron diffraction (SAED) patterns; (b,e) bright field images; (c,f) dark field images.

Figure 7.
Engineering stress–strain curve of the DH and FPS specimens from the in situ tensile tests.
Figure 7.
Engineering stress–strain curve of the DH and FPS specimens from the in situ tensile tests.
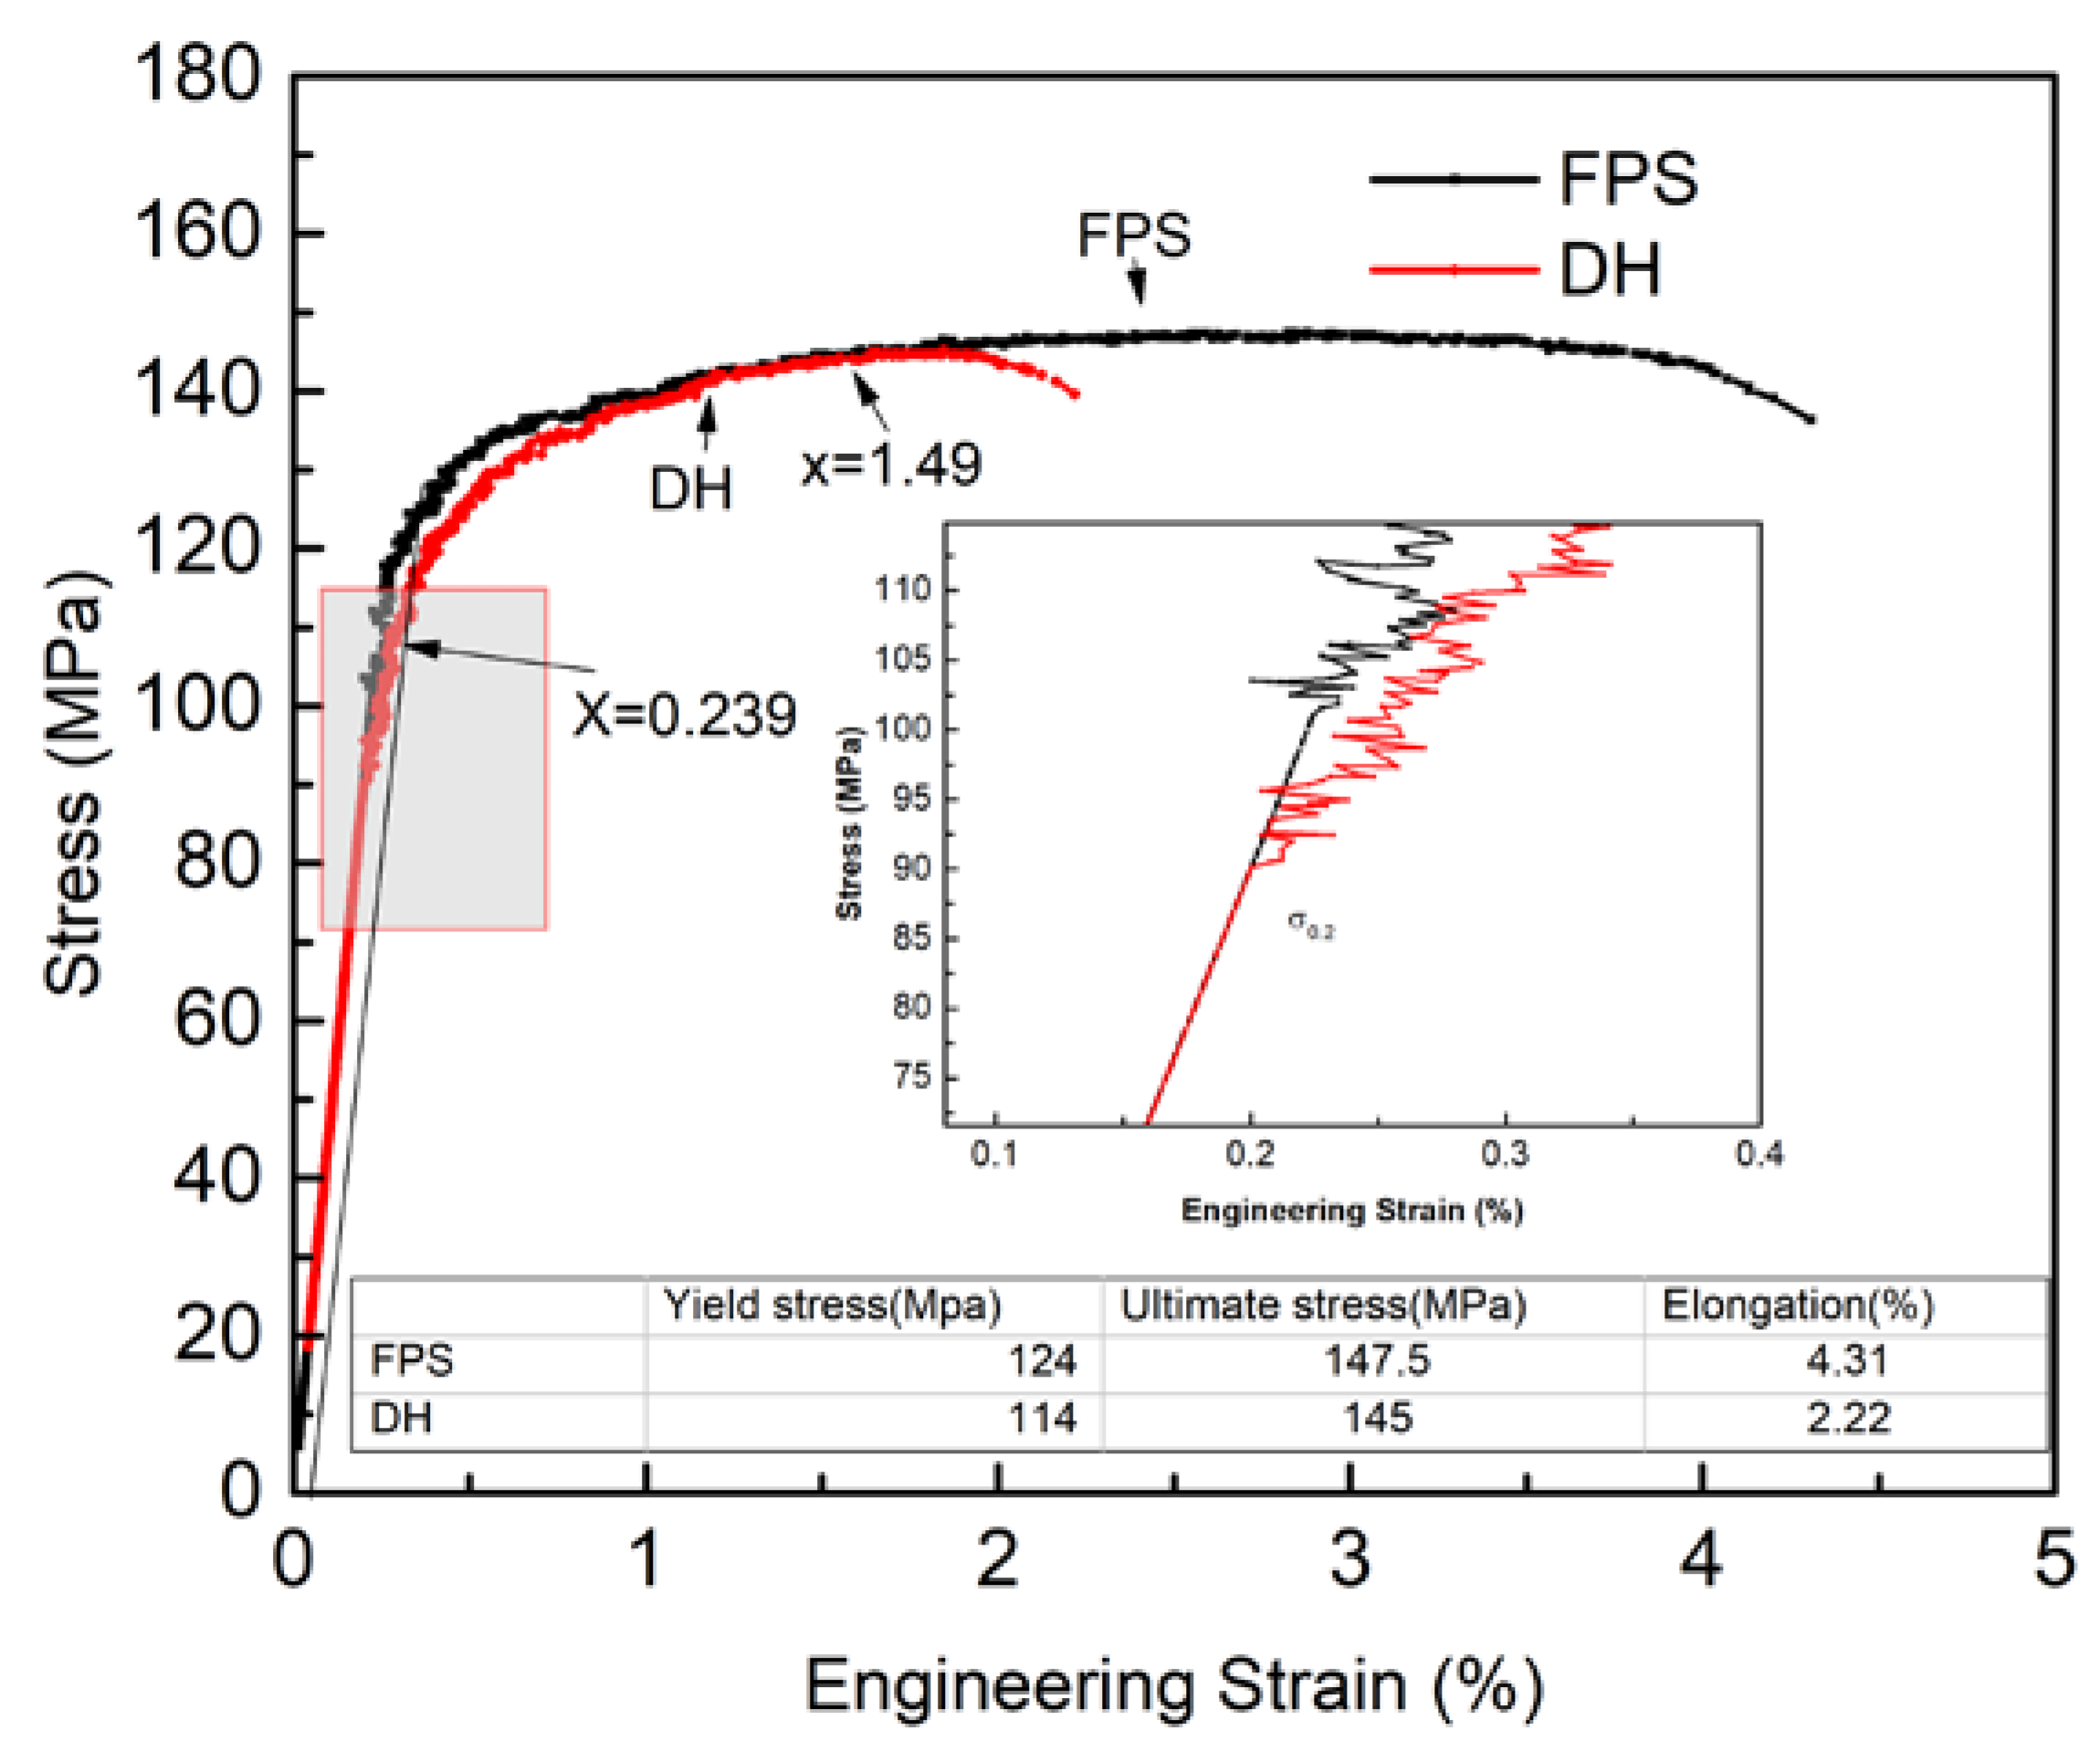
Figure 8.
Inverse pole figure maps of (a) the DH specimen before deformation, (b) the DH specimen before fracture, (c) the DH specimen before deformation, and (d) the FPS specimen before fracture.
Figure 8.
Inverse pole figure maps of (a) the DH specimen before deformation, (b) the DH specimen before fracture, (c) the DH specimen before deformation, and (d) the FPS specimen before fracture.
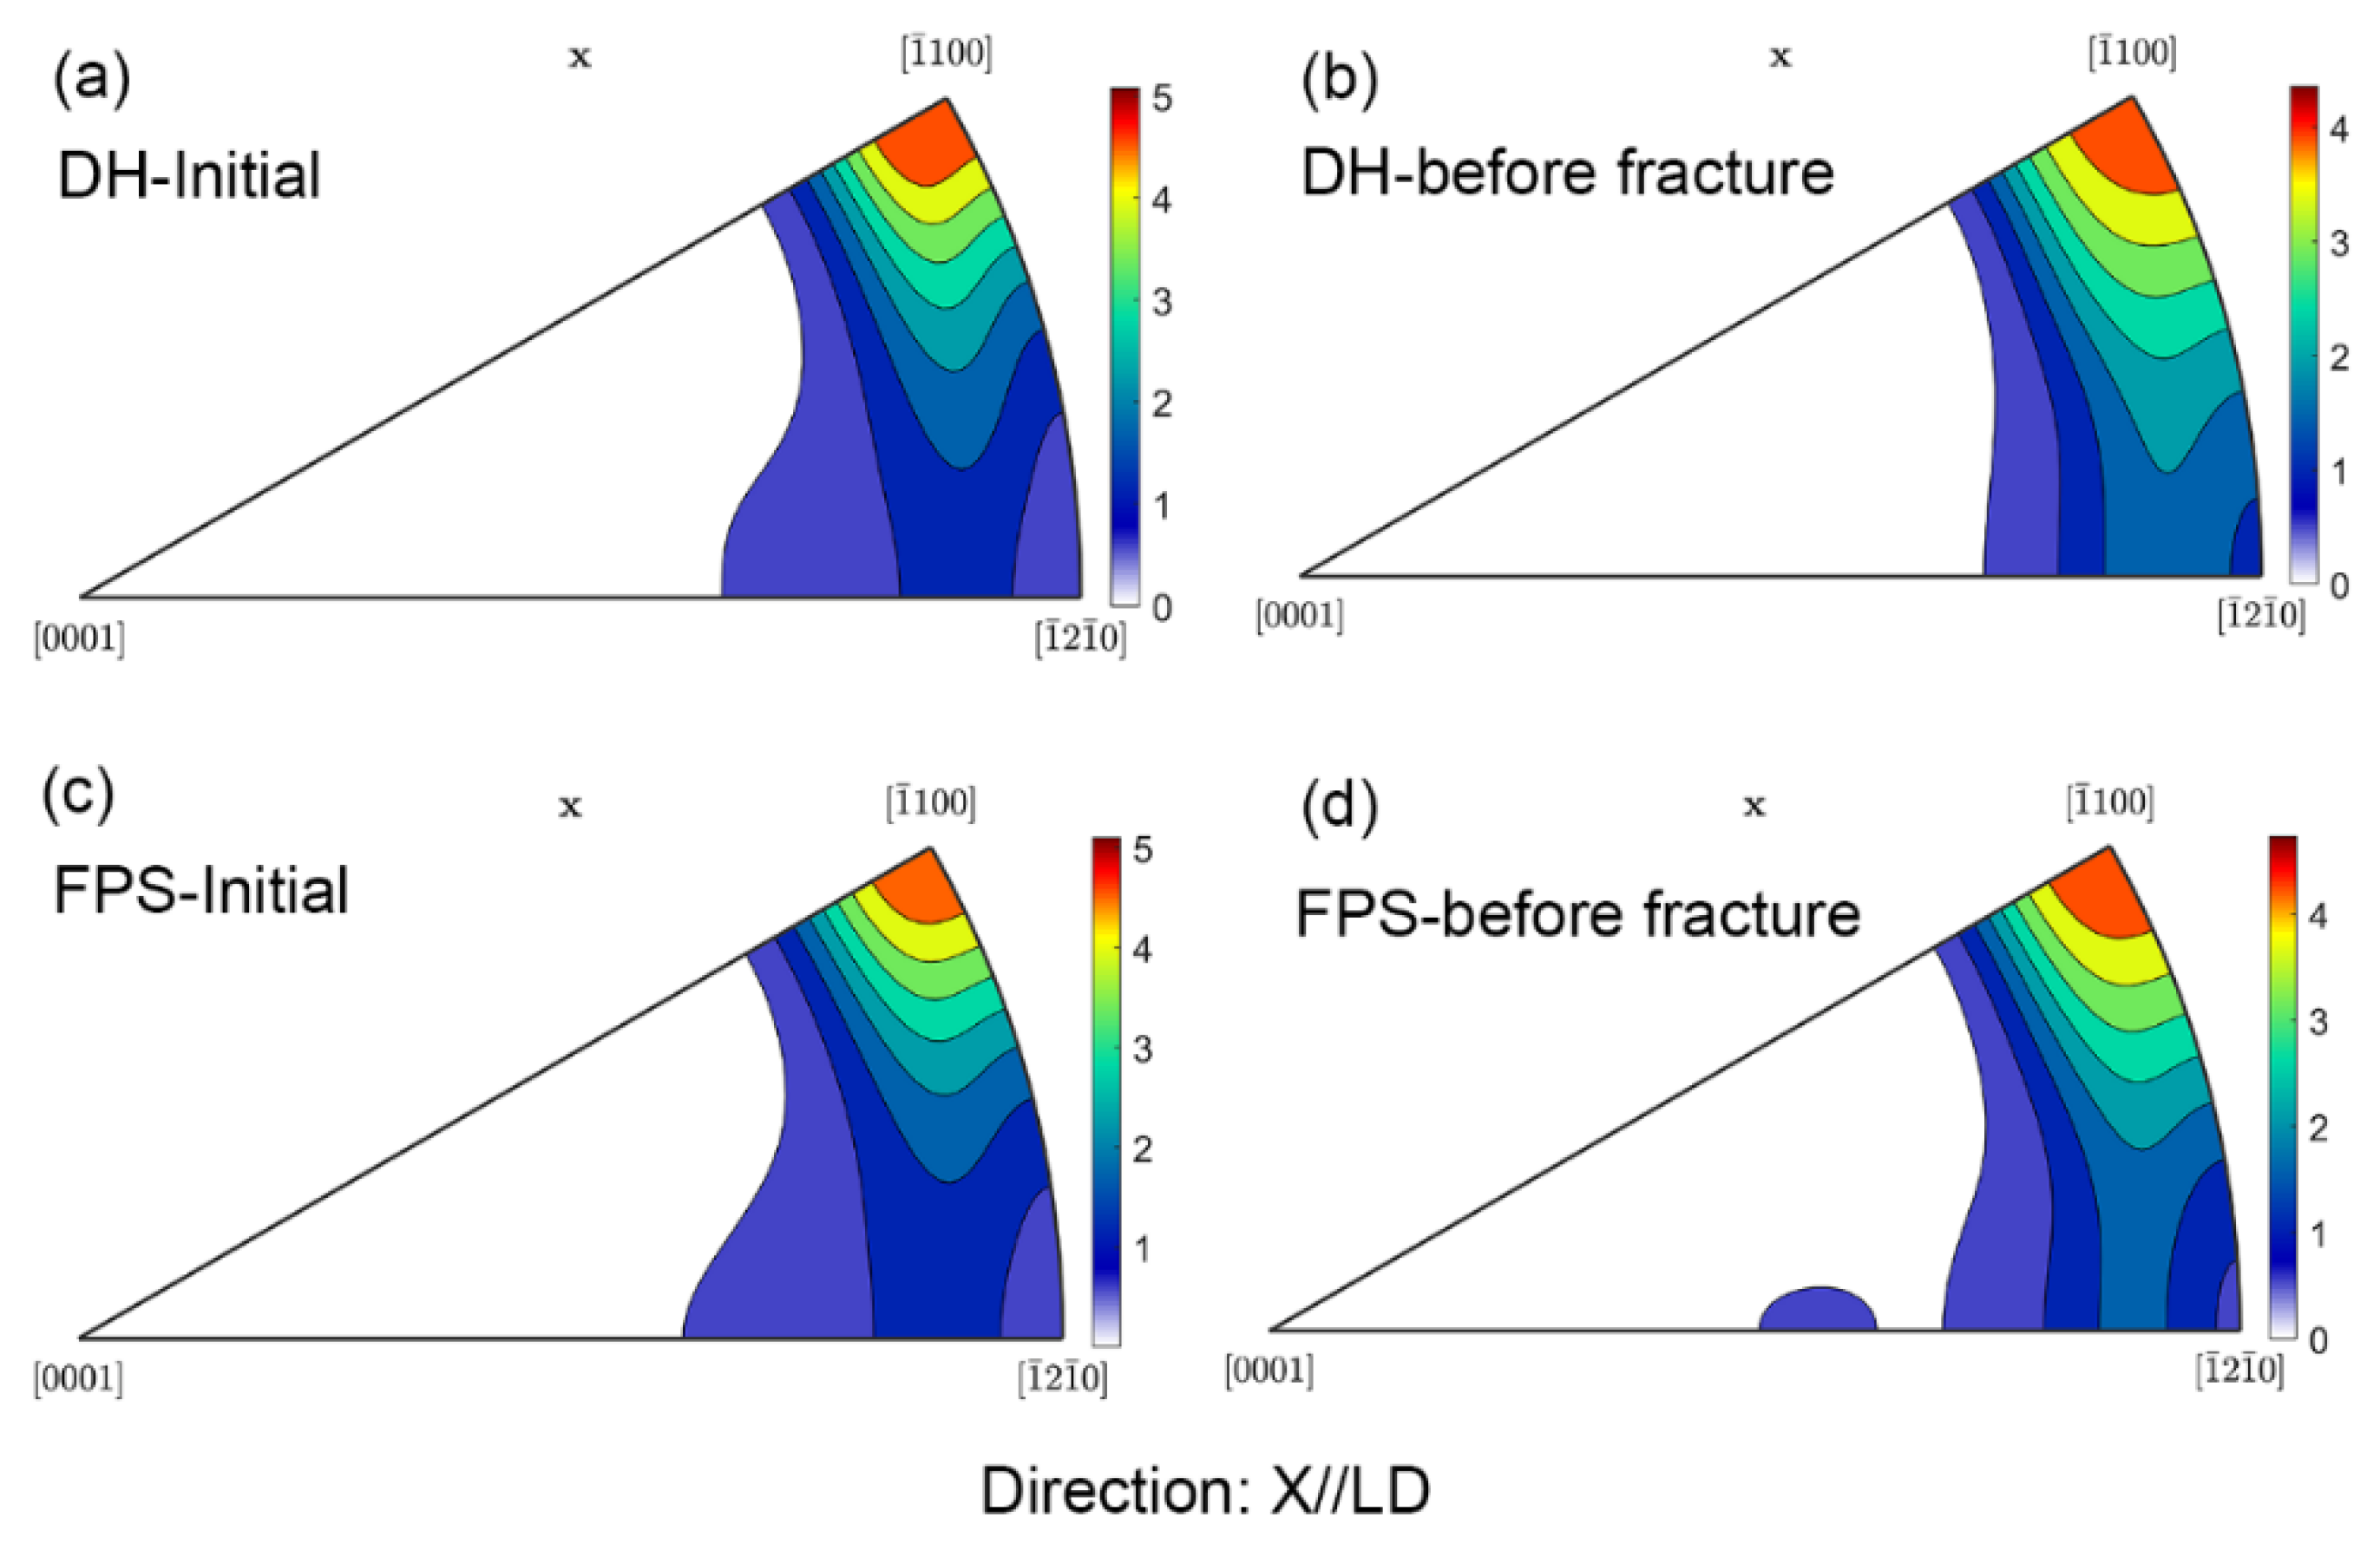
Figure 9.
The evolution of the full width at half maximum (FWHM) of the {}, {}, and {} peaks as a function of strain. The inset shows the shape and position change of the {} peak of the DH specimen at different stress levels.
Figure 9.
The evolution of the full width at half maximum (FWHM) of the {}, {}, and {} peaks as a function of strain. The inset shows the shape and position change of the {} peak of the DH specimen at different stress levels.

Figure 10.
Relative fraction of <a>, <c>, and <c + a> dislocations during deformation of the DH (a) and FPS (b) materials. The engineering stress–strain curves are also shown.
Figure 10.
Relative fraction of <a>, <c>, and <c + a> dislocations during deformation of the DH (a) and FPS (b) materials. The engineering stress–strain curves are also shown.

© 2020 by the authors. Licensee MDPI, Basel, Switzerland. This article is an open access article distributed under the terms and conditions of the Creative Commons Attribution (CC BY) license (http://creativecommons.org/licenses/by/4.0/).
Share and Cite
MDPI and ACS Style
Li, L.; Wang, L.; Wang, J.; Zhang, H.; Zhu, Q.; Li, Z.; Zeng, X. In Situ Synchrotron X-ray Study of the Mechanical Properties of Pure Mg Produced by Powder Metallurgy. Metals 2020, 10, 1198. https://doi.org/10.3390/met10091198
AMA Style
Li L, Wang L, Wang J, Zhang H, Zhu Q, Li Z, Zeng X. In Situ Synchrotron X-ray Study of the Mechanical Properties of Pure Mg Produced by Powder Metallurgy. Metals. 2020; 10(9):1198. https://doi.org/10.3390/met10091198
Chicago/Turabian StyleLi, Li, Leyun Wang, Jie Wang, Huan Zhang, Qingchun Zhu, Zhiqiang Li, and Xiaoqin Zeng. 2020. "In Situ Synchrotron X-ray Study of the Mechanical Properties of Pure Mg Produced by Powder Metallurgy" Metals 10, no. 9: 1198. https://doi.org/10.3390/met10091198
Note that from the first issue of 2016, this journal uses article numbers instead of page numbers. See further details here.