Article

Study on Plastic Deformation Behavior of Mo-10Ta under Ultra-High Strain Rate

1
Ministerial Key Laboratory of ZNDY, Nanjing University of Science and Technology, Nanjing 210094, China
2
Xiamen Tungsten Co., Ltd., Xiamen 361006, China
*
Author to whom correspondence should be addressed.
Metals 2020, 10(9), 1153; https://doi.org/10.3390/met10091153
Submission received: 22 July 2020 / Revised: 16 August 2020 / Accepted: 18 August 2020 / Published: 25 August 2020

Abstract

:
This study investigated the deformation behavior of the Mo-10Ta alloy with a strain rate range of 102–105 s−1. The Split Hopkinson pressure bar (SHPB) experiments were conducted to investigate the influence of deformation conditions on the stress-strain relationship and strain rate sensitivity of the material within a strain rate range of 0.001–4500 s−1. The Shaped Charge Jet (SCJ) forming experiments under detonation loading was conducted to clarify the dynamic response and microstructure evolution of the material within an ultra-high strain rates range of 104–105 s−1. Based on the stress-strain relationship of Mo-10Ta alloy at high temperature (286–873 K) and high strain rate (460–4500 s−1), the influence of temperature and strain rate on the activation energy Q was analyzed. The results indicate that the material strain rate sensitivity increased with the increase in strain rate and strain. Meanwhile, the activation energy Q decreased as the temperature and strain rate increased. The plasticity of the Mo-10Ta alloy under the condition of SCJ forming was substantially enhanced compared with that under quasi-static deformation. The material grain was also refined under ultra-high strain rate, as reflected by the reduction in grain size from 232 μm to less than 10 μm.

1. Introduction

Plasticity is a critical property of metallic materials. It is defined as the ability of a metallic material to undergo permanent and non-damaging deformation in response to an applied force. The plastic deformation behavior of metals is influenced synthetically by deformation conditions, deformation amount (i.e., strain), and material characteristics. The deformation conditions mainly include deformation temperature, strain rate, and the state of stress [1,2]. Many studies have indicated [3,4,5,6,7,8,9,10,11] that some metallic materials may undergo remarkable plastic deformation ability under certain conditions, and the ductility could reach 1000% or greater. However, most of these studies were conducted under hot deformation conditions with a low strain rate (10−3–1 s−1). As metallic materials are applied more widely in several fields, including manufacturing and military, researchers have started focusing on achieving superplastic deformation of metallic materials under a higher strain rate. Mabuchi [12] discovered that the ductility of Si3N4/6061 Al alloy reached 620% under a temperature of 833 K and strain rate of 2 s−1. Another study indicated that the ductility of IN9021 Al alloy reached an extremely high value of 1250% [12] under the conditions of 823 K and 50 s−1. Nieh [13] pointed out that the occurrence of grain refinement within the material structure is a necessary condition to achieve superplastic under high strain rate. Currently, researchers in this field have conducted several studies to understand the external conditions and internal mechanisms regarding superplastic occurrence under high strain rate. Chokshi [14] first reported that the shaped charge jet (SCJ) of charge warheads was a typical application of metal dynamic superplastic deformation in the military field. Driven by the explosion energy, the charge liner made from copper underwent superplastic deformation (with a high ductility of 1000%), and the strain rate reached 105 s−1. Chokshi believed that the ultra-high strain rate suppressed the outward heat transfer of the copper material; hence, the material temperature dramatically increased to above 0.4 Tm. This led to the dynamic recrystallization and refinement of the grain size of the material structure to below 10 μm. Hence, the copper material was equipped with superplastic deformation ability under such a high strain rate. Chokshi’s theory regarding the superplastic deformation mechanism under ultra-high strain rates has been validated by other studies [15,16,17,18,19]. In fact, many studies have demonstrated that dynamic recrystallization is a critical factor that leads to the superplastic deformation of metallic materials under high strain rate [20,21,22,23,24,25]. However, the grain refinement evolution mechanisms differ greatly under different strain rates. Gang [18] and Peng [10] found that the superplastic deformation of pure-copper materials under ultra-high strain rate (103–105 s−1) was achieved mainly through the combination of grains and the rotation of grain boundary, i.e., the mechanics-driven sub-grain rotation mechanism [20]. This mechanism mainly includes steps such as sub-grain formation, rotation, and boundary refinement. Meanwhile, the grain boundary sliding and diffusion creep combined mechanism proposed by Ashby and Verrall [21] explains the recrystallization behavior of metallic materials under relatively low strain rates (<10 s−1) [22].
Mo-Ta alloys were a refractory body-centered cubic metal [26]. Owing to its characteristics such as high density, high strength, and favorable mechanical properties under high temperature, the Mo-Ta alloys have great application prospects in the field of military manufacturing. Given the potential working environment (high-velocity impact) to which the material might be exposed, it is critical to study the plastic deformation response of the alloys under high strain rate. The split Hopkinson pressure bar (SHPB) experiments are typically used to investigate the mechanical response characteristics of materials under medium to high strain rate (102–104 s−1) [27]. Andrade [28] investigated the insulating shear and dynamic recrystallization behavior of copper under a high strain rate (104 s−1) through SHPB experiments. Akhtar [29] studied the stress-strain relationship of Ta and Ta alloys under different temperatures and strain rates through SHPB experiments and established a constitutive model to describe the material plastic behavior under medium-high strain rate based on experimental data. This study employed SHPB experiments to investigate the deformation response of the Mo-10Ta alloy under different temperatures (286–873 K) and different strain rates (102–103 s−1). The influence of temperature and strain rate on the stress-strain relationship and the activation energy of the Mo-Ta alloy were analyzed. In addition, an SCJ warhead was designed using Mo-10Ta as the material of liner. Driven by the huge explosion energy, the Mo-10Ta alloy underwent plastic deformation under a higher strain rate (>104 s−1). Therefore, the plastic deformation behavior of the Mo-10Ta alloy under ultra-high strain rate was further revealed.

2. Materials and Methods

2.1. Material

In the current study, cylindrical billets with a mass ratio of 9:1 were prepared through the liquid-phase sintering process. To further enhance the densification of the alloy, the billets were forged under room temperature and high speed. The density of the obtained Mo-10Ta was 10.5 g/cm3, and the densification was 98%. Table 1 presents the measured chemical composition of the Mo-10Ta alloy. The Leica MC170HD inverted-phase metallographic microscope (Leica, Berlin, Germany) was used to observe the microstructure of the alloy under magnifications of 200× and 500×. The polished sample surface needed to be corroded with potassium ferricyanide and sodium hydroxide (Chongqing Kunlun, Chongqing, China) until it turned gray, and then observed under a microscope. The observed microstructures are presented in Figure 1. As shown in the Figure 1, no holes were observed within the microstructure of the forged Mo-10Ta alloy, but grain deformation was observed. Meanwhile, the obtained Mo-10Ta alloy featured coarse grains, with an average grain size of 232 μm, which was mainly due to the long time high-temperature sintering.
To further investigate the thermal–mechanical properties of the Mo-10Ta alloy, the specific heat of the material (323–1473 K) was measured under standard atmosphere, based on the ASTM (American Society for Testing and Materials) E973-2006 (2018) standards. As indicated in Figure 2, within the temperature range of 323 K to 873 K, the specific heat of the Mo-10Ta alloy increased as the environmental temperature increased. When the environmental temperature was above 873 K, the specific heat of the material decreased as the temperature increased. The relationship between the specific heat of the Mo-10Ta alloy and temperature within the temperature range of 323 K to 1473 K is given in Equation (1).
C p = 0.16 + T 5.47 4 T 2 3.18 7 ,   ( 323 < T < 1473 ) ,

2.2. Test Method

2.2.1. SHPB Test

Mechanical test samples with dimensions of Φ4 mm × 3 mm (Φ is diameter) were prepared using the Mo-10a alloy (Figure 3a), and the SHPB equipment (Archimedes limited, Beijing, China) was used to investigate the dynamic plastic deformation response of Mo-10Ta under medium-high strain rates (102–103 s−1). For comparison purposes, sheet tensile test samples were also prepared (Figure 3b). The universal test machine (Changchun Testing Machine Research Institute, Changchun, China) was used to obtain the stress-strain relationship of Mo-10Ta under static compression and tensile deformation conditions (286 K, 0.001 s−1). In order to ensure the accuracy of the test data, three repeated tests were carried out under the same deformation condition, and the stress-strain relationship of Mo-10Ta alloy under different conditions was the average value of three repeated tests. Details regarding the SHPB equipment, the dynamic/static compression experimental process, and the data analysis methods can be found in a previous study [30].

2.2.2. SCJ Forming Test

The SCJ is a high-energy metal jet formed along the axis of a warhead. Its formation is based on the principle of concentrating energy and due to the collapse of the metal liner as a result of high-pressure explosion (30 GPa) [31]. Figure 4 illustrates the material deformation process of a liner. Studies have indicated that the collapse rate of the liner material driven by high pressure can be as high as 103 m/s (the exact value is dependent on the material density and liner structure), and the strain rate could be as high as 105 s−1. To investigate the plastic deformation behavior of Mo-10Ta under a higher strain rate, an SCJ warhead (Figure 5) was prepared in this study using the Mo-10Ta as the material of liner (Figure 3c). The warhead caliber was 60 mm, the explosive material was JH-2, and the charge density was 1.713 g/cm3. During the experiments, a dedicated X-ray system (Scandiflash AB, Uppsala, Sweden) was used to capture the Mo-10Ta jet shape after the explosion, and the equipment setup is presented in Figure 6. After the explosion, the Mo-10Ta liner formed a downward-moving metal jet driven by the explosion pressure. X-ray was used to irradiate the metal jet, which reflected the jet shape on the film. Hence, dual-flash X-ray could be used to record the shape of the Mo-10Ta jet at any two moments. A target board placed along the jet direction was used to recover partial Mo-10Ta jet fragments, so that their microstructure evolution could be observed. Additionally, the mechanical samples in Figure 3 and the liner were made from the same batch of Mo-10Ta materials.

3. The Deformation Response under Medium-High Strain Rate (102–103 s−1)

3.1. The Stress-Strain Relationship

The SHPB and the universal test machines were used to obtain the dynamic/static compression true stress–true strain relationship of the Mo-10Ta alloy within a temperature range of 286–876 K and a strain rate of 0.001–4500 s−1 (Figure 7). Under the deformation condition of 286 K and 0.001 s−1, the Mo-10Ta alloy showed minor work hardening characteristics. When the deformation strain rate was increased to above 460 s−1, the alloy showed significant softening characteristics, and the stress decreased as the strain increased. The key factor that led to such a phenomenon was the temperature increase accompanying deformation, as a result of the insufficient outward heat transfer during the Mo-10Ta plastic deformation [32]. As the deformation temperature increased, the driving force of the material dynamic softening gradually increased, and the stress decreased. Meanwhile, as the deformation strain rate increased, the material deformation dislocation and entangled dislocation multiplied. As a result, the dislocation was hindered, and the deformation stress increased with the strain rate.
Furthermore, Figure 7 shows that the stress of the Mo-10Ta alloy reached its peak value after minor deformation ( ε < 0.1 ) under the dynamic deformation conditions. Under the deformation condition of 286 K and 4500 s−1, the stress-strain relationship of the material showed a typical dynamic recrystallization characteristic: During the preliminary stage of deformation, the deformation stress of the material increased dramatically to its peak value ( σ p ) as the strain increased; then with further increase in the strain, the stress decreased and ultimately stabilized ( σ s ). This behavior is due to dynamic recrystallization, which is a feature of static flow. As demonstrated by Figure 7a–c, as the initial environmental temperature increased, the dynamic recrystallization rate also increased. As a result, the required amount of strain to transition from σ p to σ s decreased, and the stress-strain curve became flatter. Overall, the deformation temperature and strain rate have a profound influence on the plastic deformation response of the Mo-10Ta alloy.

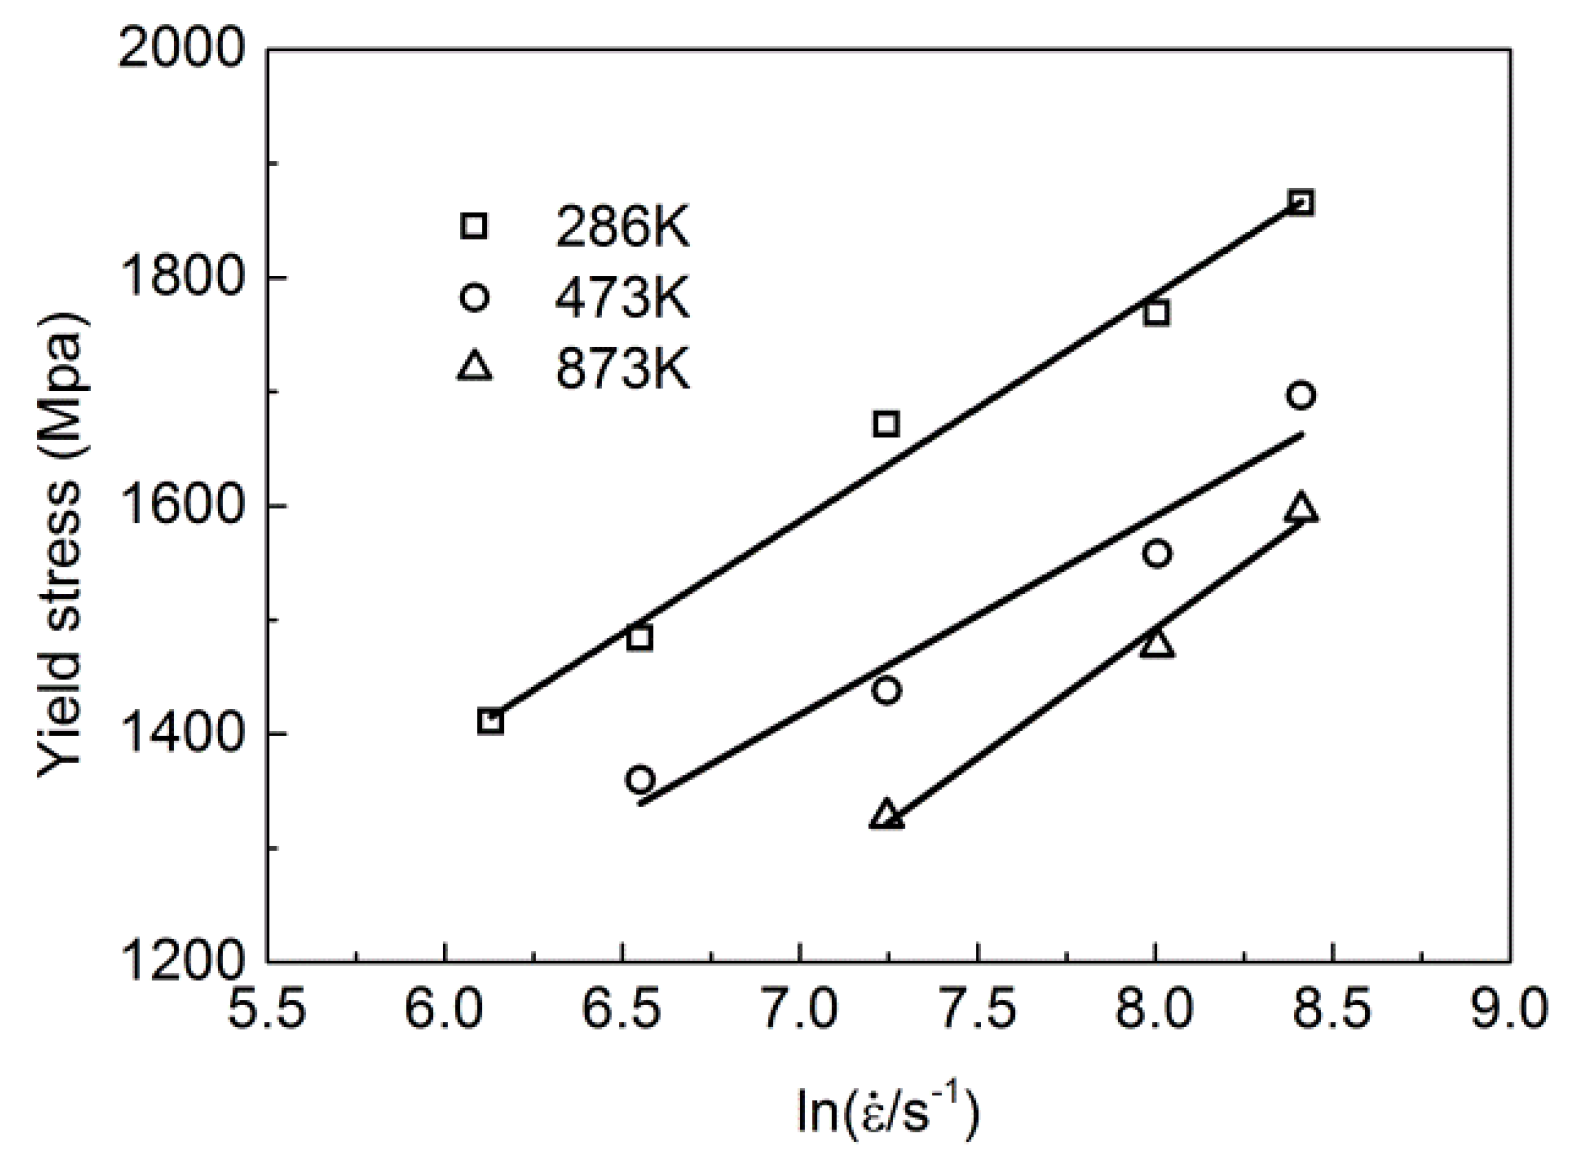
3.2. Effect of Strain-Rate on Deformation

Figure 8 illustrates the influence of the deformation strain rate on the yield stress of the Mo-10Ta alloy under different initial environmental temperatures. Under the dynamic compression deformation condition, the yield stress ( σ 0.2 ) of the Mo-10Ta alloy increased linearly with ln ε ˙ . Meanwhile, the vary of the initial environmental temperature had a minor influence on the slope of the ln ε ˙ σ 0.2 curve.
According to the theory of the superplastic deformation of metals, the material flow stress sensitivity toward a varying strain rate (strain rate sensitivity m) is typically used to characterize the plastic deformation capacity [10,11], as expressed in Equation (2). Many studies have indicated [33] that the strain rate, deformation temperature, grain size, and shape of grain could all influence the m value. In these studies, under a deformation condition of low strain rate, the ln σ ln ε ˙ function relation of the metallic material followed an “S” shape as the strain rate increased (Figure 9). Based on the increasing rate of the m value, the curve has been divided into three regions: region I, region II, and region III, and the stress varies most dramatically with the strain rate within region II. It has been widely recognized that superplastic deformation can only be achieved within region II. The corresponding strain rate is mostly within 10−3–10−2 s−1 (quasi-static deformation), and the environmental temperature to achieve superplastic deformation should be higher than 0.5 times the melting temperature of the material.
m = d ln σ d ln ε ˙ ,
This study investigated the vary of m value under dynamic deformation condition by leveraging the stress-strain relationship of the Mo-10Ta alloy at 286 K and within the strain rate range of 0.001–4500 s−1. As depicted in Figure 10, the deformation strain rate and strain had a significant influence on the m value of the Mo-10Ta alloy. Under dynamic deformation conditions, the m value increased as the deformation strain rate increased (Figure 10a). Under static deformation ( ε ˙ = 0.00 s−1), the influence of the strain on the m value was minor. As the strain increased from 0.1 to 0.4, the m value remained relatively low (m = 0.00967). As the strain rate increased, the influence of the strain on m gradually became more significant. When the strain rate was above 1500 s−1, the m value increased linearly with the strain. This was mainly because under the high strain rate condition, the material temperature gradually increased with deformation, which increased the free energy of the metal atoms and promoted grain boundary sliding. This indicates that even under room temperature, as the strain rate further increased, the Mo-10Ta alloy could still reach high strain rate sensitivity.

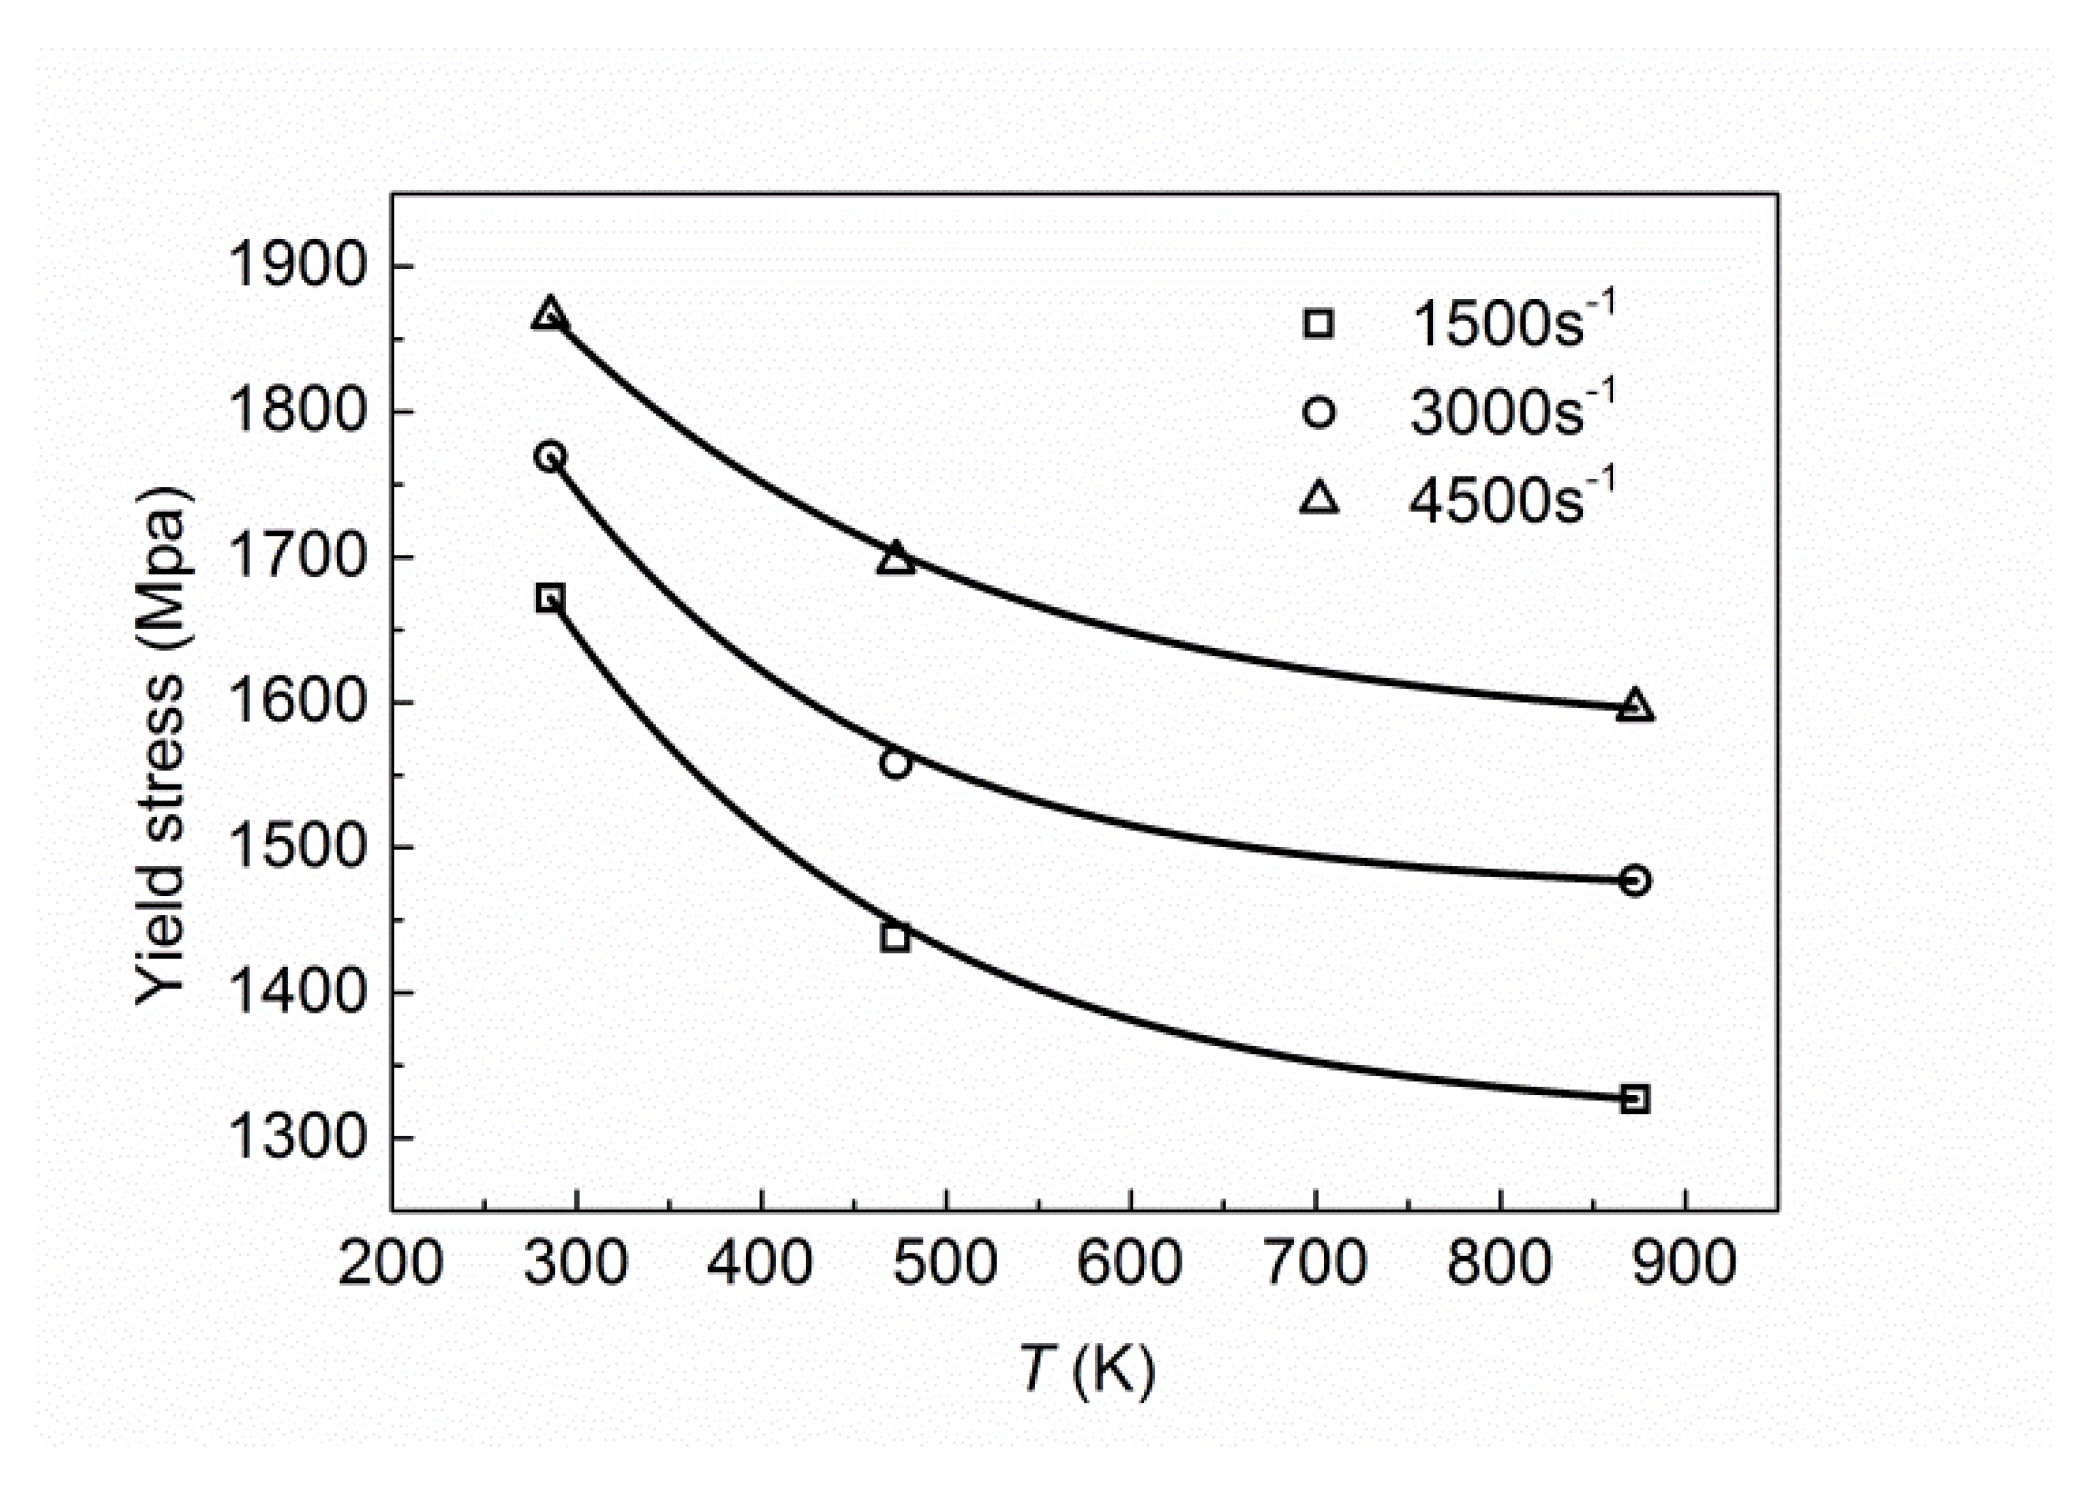
3.3. Effect of Temperature on Deformation

Figure 11 demonstrates the influence of different initial environmental temperatures on the yield strength of Mo-10Ta. As the initial environmental temperature of the material increased, the material yield strength declined. Moreover, such softening trends were not dramatically influenced by the varying strain rate. Compared with static deformation (low strain rate), dynamic deformation has a distinct feature: the material temperature increases with deformation. The temperature increase, as a result of plasticity, could be calculated using Equation (3) [32].
Δ T ( ε ) = β ρ C p 0 ε σ d ε   ,
where ρ is the material density, C p is the material specific heat, and β is the thermal conversion factor, i.e., the proportion of plastic work converted to heat. The β value is determined by many factors, including the material characteristics, strain rate, strain history, and deformation temperature, and is taken as 0.9 in this work [32]. Equation (3) was used to calculate the temperature increase in the material under the deformation condition of 286 K and 4500 s−1. As reflected in Figure 12, under the dynamic deformation condition, as the deformation amount increased, the material temperature increased dramatically. When the stress-strain curve developed to a steady-flow stage ( σ = σ s ), the instantaneous deformation temperature of Mo-10Ta was 680 K, which was about 394 K higher than the temperature during the preliminary deformation stage. An observation of the microstructure of the deformed samples indicated that irregular grains (Figure 1) transitioned to regular equiaxial grains (Figure 13), and the grain size was refined from 232 μm to 35 μm. Meanwhile, finer equiaxial grains existed around the boundary of coarse grains. The microstructure vary of the material indicates that under the impact of dynamic deformation, the Mo-10Ta alloy underwent dynamic recrystallization and dramatic grain size refinement, which also led to an increase in the material m value.

3.4. Constitutive Model

Johnson and Cook [34] proposed the Johnson–Cook constitutive model (J–C constitutive model) to describe the stress-strain relationship of metallic materials under high temperature, high strain rate, and dramatic deformation conditions. This model considers the synthetical influence of strain rate and temperature on flow stress:
σ = ( A + B ε p n ) ( 1 + C ln ε ˙ * ) ( 1 T * m )   ,
where A, B, n, C and m are the constitutive factors to be decided; ε ˙ * = ε ˙ ε ˙ 0 ( ε ˙ 0 is the reference strain rate); T * = ( T T r ) ( T T m ) ( T r is the reference temperature, and T m is the material melting temperature). In this study, the J–C constitutive factors of the Mo-10Ta alloy (Figure 14a–c) were calibrated and optimized using the stress-strain data under the deformation conditions of 286–873 K and 460–4500 s−1. The method for calibrating the J–C constitutive model has been illustrated in detail in several other papers [30,35,36]. The obtained J–C constitutive factors for the Mo-10Ta alloy are presented in Table 2.

4. The Deformation Response under Ultra-High Strain Rate (104–105 s−1)

4.1. SCJ Forming Characteristics of Mo-10Ta Alloy

To investigate the plastic deformation behavior of Mo-10Ta under higher strain rates, an SCJ warhead was designed using the Mo-10Ta as the liner material (Figure 5), and dual-flash X-rays imaging experiments (Figure 6) were conducted to record the plastic deformation process of the Mo-10Ta liner. Figure 15 presents the Mo-10Ta jet shape at 22 μs and 75 μs after the explosion. Driven by the explosion pressure, the liner collapsed inward and merged along the axis position. During this process, a part of the material moved forward to form the jet, and the other part of the material moved backward to form the slug. Owing to the high velocity gradient during the material tensile forming process, the jet and slug could be separated. As the deformation continued, the internal cavity of the material propagated; hence, the jet body could break after a certain period. As reflected in Figure 14, at 75 μs, the jet body of the Mo-10Ta completely broke. Assuming different parts of the jet broke simultaneously, by summing up the length of every jet fragment, it was calculated that the Mo-10Ta jet had a length of 247.8 mm before breakage. Taking the length of the liner generating line (47.92 mm) as the initial length of the jet before tension, the ductility of the Mo-10Ta alloy jet was calculated to be 417.1%. However, in the static tensile experiments of Mo-10Ta, the material broke only after reaching a tensile length of 0.2928 mm (Figure 16), and the ductility was 1.2%. Compared with the static tensile condition (286 K, 0.001 s−1), the Mo-10Ta ductility was enhanced by about 346.6 times under the high strain rate deformation environment created by the SCJ.
To obtain detailed plastic deformation response data of the Mo-10Ta jet, the plastic deformation process of the Mo-10Ta liner driven by explosive materials was simulated using the Autodyn-2D dynamic explicit finite element software. The experimentally obtained J–C constitutive factors and the shock state equation were used to describe the material deformation process under high temperature and pressure. The superposition principle of mixtures [37] was used to calculate the parameters of the shock state equation, which were obtained as follows: C0 = 4780 m/s, S0 = 1.28, γ 0 = 1.53. The simulation results are presented in Figure 17a,b. As reflected by the figure, the velocities of the Mo-10Ta jet head and slug were around 6281 and 1431 m/s, respectively. The velocities of elements decreased from the jet head to the slug. A hierarchical flow was observed, and the plasticity of the internal material was dramatically higher than that of the external material (Figure 17b). Meanwhile, the plastic strain of the slug material exhibited a decreasing trend along the jet tensile direction. Since the plastic work was the key factor leading to the jet temperature increase, the temperature distribution trend should be similar to the plastic strain trend. At 22 μs, the internal temperature of the jet reached 1832 K, and the slug internal temperature was as high as 1683 K, larger than 0.5 times the material melting temperature. In addition, in order to verify the accuracy of the J–C constitutive model obtained in this paper, the shape parameters and velocity parameters of Mo-10Ta jet at 20 μs obtained by numerical simulation and experiment were compared (Table 3). The results show that the jet parameters obtained by numerical simulation were in good agreement with the experimental data, which proves that the J–C constitutive parameters obtained in this paper could describe the plastic deformation of Mo-10Ta alloy at ultra-high strain rate

4.2. Microstructure Evolution of Slug

Section 4.1 presents the experiment- and simulation-based analyses of the deformation condition and plastic deformation behavior of the Mo-10Ta material during the SCJ forming process. The results indicate that the plastic flow of Mo-10Ta was hierarchical. In the slug, the deformation of the material closer to the jet was dramatically larger than that of the tail material. Meanwhile, the temperature of the internal slug material was higher than 0.5 times the material melting point, which indicates that the Mo-10Ta material underwent dynamic recrystallization during deformation. Figure 18 presents the Mo-10Ta slug recovered using the target, and an optical microscope was used to observe the microstructure of the slug at three different positions (1#, 2#, and 3#). Figure 19a–i show metallographic pictures of the Mo-10Ta alloy slug at different positions under 100×, 500×, and 1000× magnifications. As reflected in Figure 19a,d,g, a substantial dense layered deformation band existed at position 1# of the Mo-10Ta metallographic picture. As the deformation continued, the material grain was elongated and refined. Observation under 1000× magnification indicated that a large amount of 2–5 μm fine grains existed at position 1# (Figure 19g). The material deformation at position 2# was similar to that at position 1#. The grains were severely elongated and refined. However, since position 2# was closer to the slug tail, the material deformation amount was smaller than that of position 1#. Therefore, more thin and long grains with a width of 5 μm existed beside the existence of some 5 μm equiaxial grains. Different from positions 1# and 2#, position 3# was at the slug tail and hence had an even smaller amount of deformation and a larger amount of fine grains with a width of 6 μm.
Based on the above results, it could be concluded that a larger amount of fine equiaxial grains existed in the metallographic structure of the jet material. The grain refinement as a result of dramatic deformation during the liner collapse process was a critical factor leading to the dramatic enhancement of the Mo-10Ta jet ductility.

5. Discussion

This study experimentally investigated the Mo-10Ta alloy plastic deformation response under extreme deformation conditions (high temperature, high strain rate). The results indicate that Mo-10Ta obtained better plastic performance under high strain rate compared with that under low strain rate deformation. The better performance was mainly reflected by the improvement in the strain rate sensitivity under a high strain rate condition as compared with that under low strain rate. Meanwhile, the grain structure refinement of the Mo-10Ta material under high strain rate continued as the deformation continued. Under detonation loading, the grain size of the Mo-10Ta liner material could be refined to 5 μm or even smaller. Such a vary greatly promoted the Mo-10Ta plasticity (i.e., the ductility was 346.6 times that under the static state).
In fact, the plastic deformation of Mo-10Ta under high strain rate was a special thermal deformation process (the heat to drive material deformation originated from the plastic deformation of the material), and thermal activation is a critical parameter to describe the thermal deformation process. Some recent studies indicated [38,39,40] that the thermal activation energy was not a complete material-specific parameter. The deformation conditions (strain, strain rate, and deformation temperature) all influenced the deformation activation energy. Zhang et al. [38] discovered that the thermal activation energy of Ti-15-3 titanium alloy increased as the temperature increased or strain rate decreased. Sang [39] and Shi [40], respectively, discovered that the thermal activation energy of 7075 aluminum alloy and AA7150 aluminum alloy decreased as the temperature or strain rate increased. Hence, Shi et al. [40] optimized the classic hyperbolic sine relationship of activation energy, which considered the influence of temperature and strain rate. In the next research, the peak stresses σ p of Mo-10Ta under different temperatures and strain rates (Figure 7) were used as fundamental parameters to calculate the thermal activation energy of the Mo-10Ta alloy under high strain rate. An in-depth description of the method can be found in the literature [40]. Figure 19a presents the influence of the material deformation strain rate on ln ( sin   h   α σ p ) under different deformation temperatures. Figure 19b presents the influence of deformation temperature on ln ( sin   h   α σ p ) under different strain rates. According to the classic hyperbolic sine theory, the material activation energy can be calculated as follows:
Q = R [ ln ε ˙ ln [ sin h ( α σ p ) ] ] T [ ln [ sin h ( α σ p ) ] ( 1 / T ) ] ε ˙ = R n S
where n is the slope of the ln ε ˙ ln ( sin   h   α σ p ) relationship, and S is the slope of the ln ( sin   h   α σ p ) 1 / T relationship. However, the n and S values of the Mo-10Ta material at different temperatures and strain rates were not fixed (Figure 19); that is, the n value of Mo-10Ta is a function of temperature T, and the S value is a function of the strain rate ε ˙ . Hence, based on the optimized hyperbolic sine theory, Equation (5) could be modified as follows:
Q = R n ( T ) S ( ε ˙ )   ,
n ( T ) = a 1 + b 1 1 T ,
( ε ˙ ) = ( a 2 ) b 2 ln ( ε ˙ ) c   ,
As reflected in Figure 20a, the n value of the Mo-10Ta alloy decreased as the deformation temperature increased. Similarly, as the deformation strain rate increased, the S value of the material decreased (Figure 20b). Hence, Equations (7) and (8) were used to describe the n ( T ) and S ( ε ˙ ) function relationships. As reflected in Figure 21, the n value increased linearly with 1/T. The S value decreased as ln ( ε ˙ ) increased, and the rate of decrease gradually became slower.
Based on the above methods, the Mo-10Ta alloy activation energy Q as a function of temperature T and strain rate ε ˙ was obtained as follows:
Q ( T , ε ˙ ) = ( 19.829 + 8945.856 T ) ( 1 3 ) 0.849 ln ( ε ˙ ) 10.272
Figure 22 presents the dynamic response nephogram of deformation activation energy Q of Mo-10Ta material in the range of temperature 286~873 K and strain rate 1000~10000 s−1 according to Equation (9) varying with deformation conditions (temperature, strain rate). As reflected by the figure, under a high strain rate deformation condition, the Q value of Mo-10Ta decreased as strain rate and temperature increased. If calculated according to Equation (5), the Q value of Mo-10Ta in this paper was about 2229.72 J/mol, which is far less than the creep activation energy (493 kJ/mol) calculated in reference [41]. The value seems to be closer to the diffusion activation energy of liquid metal [42]. Meanwhile, the increasing strain rate accelerated dislocation propagation and promoted the dynamic recovery rate. The increase in the environmental temperature, dislocation, and collapse all promoted dynamic recovery, which reduced the dislocation density and the dislocation resistance [39,40,43,44]. Therefore, the Q value of Mo-10Ta will decrease at a high strain rate.
Figure 23 displays the deformation strain rate image of the Mo-10Ta jet during the forming process. As reflected by the figure, the liner material was subjected to the maximum strain rate ( ε ˙ max = 9.7 × 10 5 s 1 ) at the junction point of the compression movement. As the jet further underwent tensile forming, the strain rate exhibited a decreasing trend. At 30 μs, the strain rate of the jet body material decreased to 8.0 × 10 4 s 1 . Applying Equation (9) and using the jet temperature and the strain rate distribution image, the Mo-10Ta thermal activation energy at different positions could be calculated. As reflected in Figure 24, at 22 μs, along the jet tensile direction, the Q value exhibited an “increasing-decreasing-increasing” trend, and the lowest value (21.35 J/mol) was at the boundary of jet and slug.
Using Equation (9), which was obtained from the data of low strain rate, to calculate the activation energy of materials in higher strain rate and more complex deformation state may have a large error. However, according to the trend of data, the deformation activation energy of Mo-10Ta is very low under the condition of SCJ deformation. The activation energy of the main part of the jet is lower than 30 J/mol, which was the same order of magnitude as the diffusion activation energy of the liquid metal. Meanwhile, Figure 16 shows that the temperature of the center part of Mo-10Ta shaped charge jet is close to the melting temperature of the material, indicating that Mo-10Ta was indeed a liquid and solid coexistence of metal fluid. This phenomenon indicates that dislocation movement was no longer the main mechanism of plastic deformation of Mo-10Ta.
Peng [19] studied the superplastic deformation behavior of nano polycrystalline copper under SCJ forming by molecular dynamics simulation. The author pointed out that the superplastic deformation mechanism of polycrystalline copper under ultra-high strain rate was grain boundary sliding and grain rotation, and explained the essential reason that grain boundary movement dominated. The deformation mechanism proposed by Peng could also explain the deformation behavior of Mo-10Ta.
Under the condition of Mo-10Ta SCJ forming, in the initial stage of deformation, the deformation is mainly due to dislocation movement. With the further increase in the deformation amount, a large number of dislocations accumulates, and the material temperature keeps increasing, which promotes the occurrence of dynamic recovery (DRX) of material structure, resulting in the refinement of material grain. With the decrease in grain size, the proportion of grain boundary atoms increases and the ratio of grain boundary thickness to grain size increases, which makes it difficult for dislocations to nucleate at the grain boundary. At the same time, the critical strain of grain boundary rotation and slip will decrease under the condition of small grain size, which promotes the occurrence and intensification of grain boundary movement. Therefore, the grain boundary movement in the form of grain boundary rotation and slip was the main reason for the improvement of plasticity of Mo-10Ta under ultra-high strain rate.

6. Conclusions

This study investigated the plastic deformation behavior of the Mo-10Ta alloy within the strain rate of 102–105 s−1 through SHPB experiments and SCJ forming experiments. The influence of deformation conditions on the material stress-strain relationship, strain rate sensitivity, and thermal activation energy was analyzed. Below is a summary of the results:
(1)
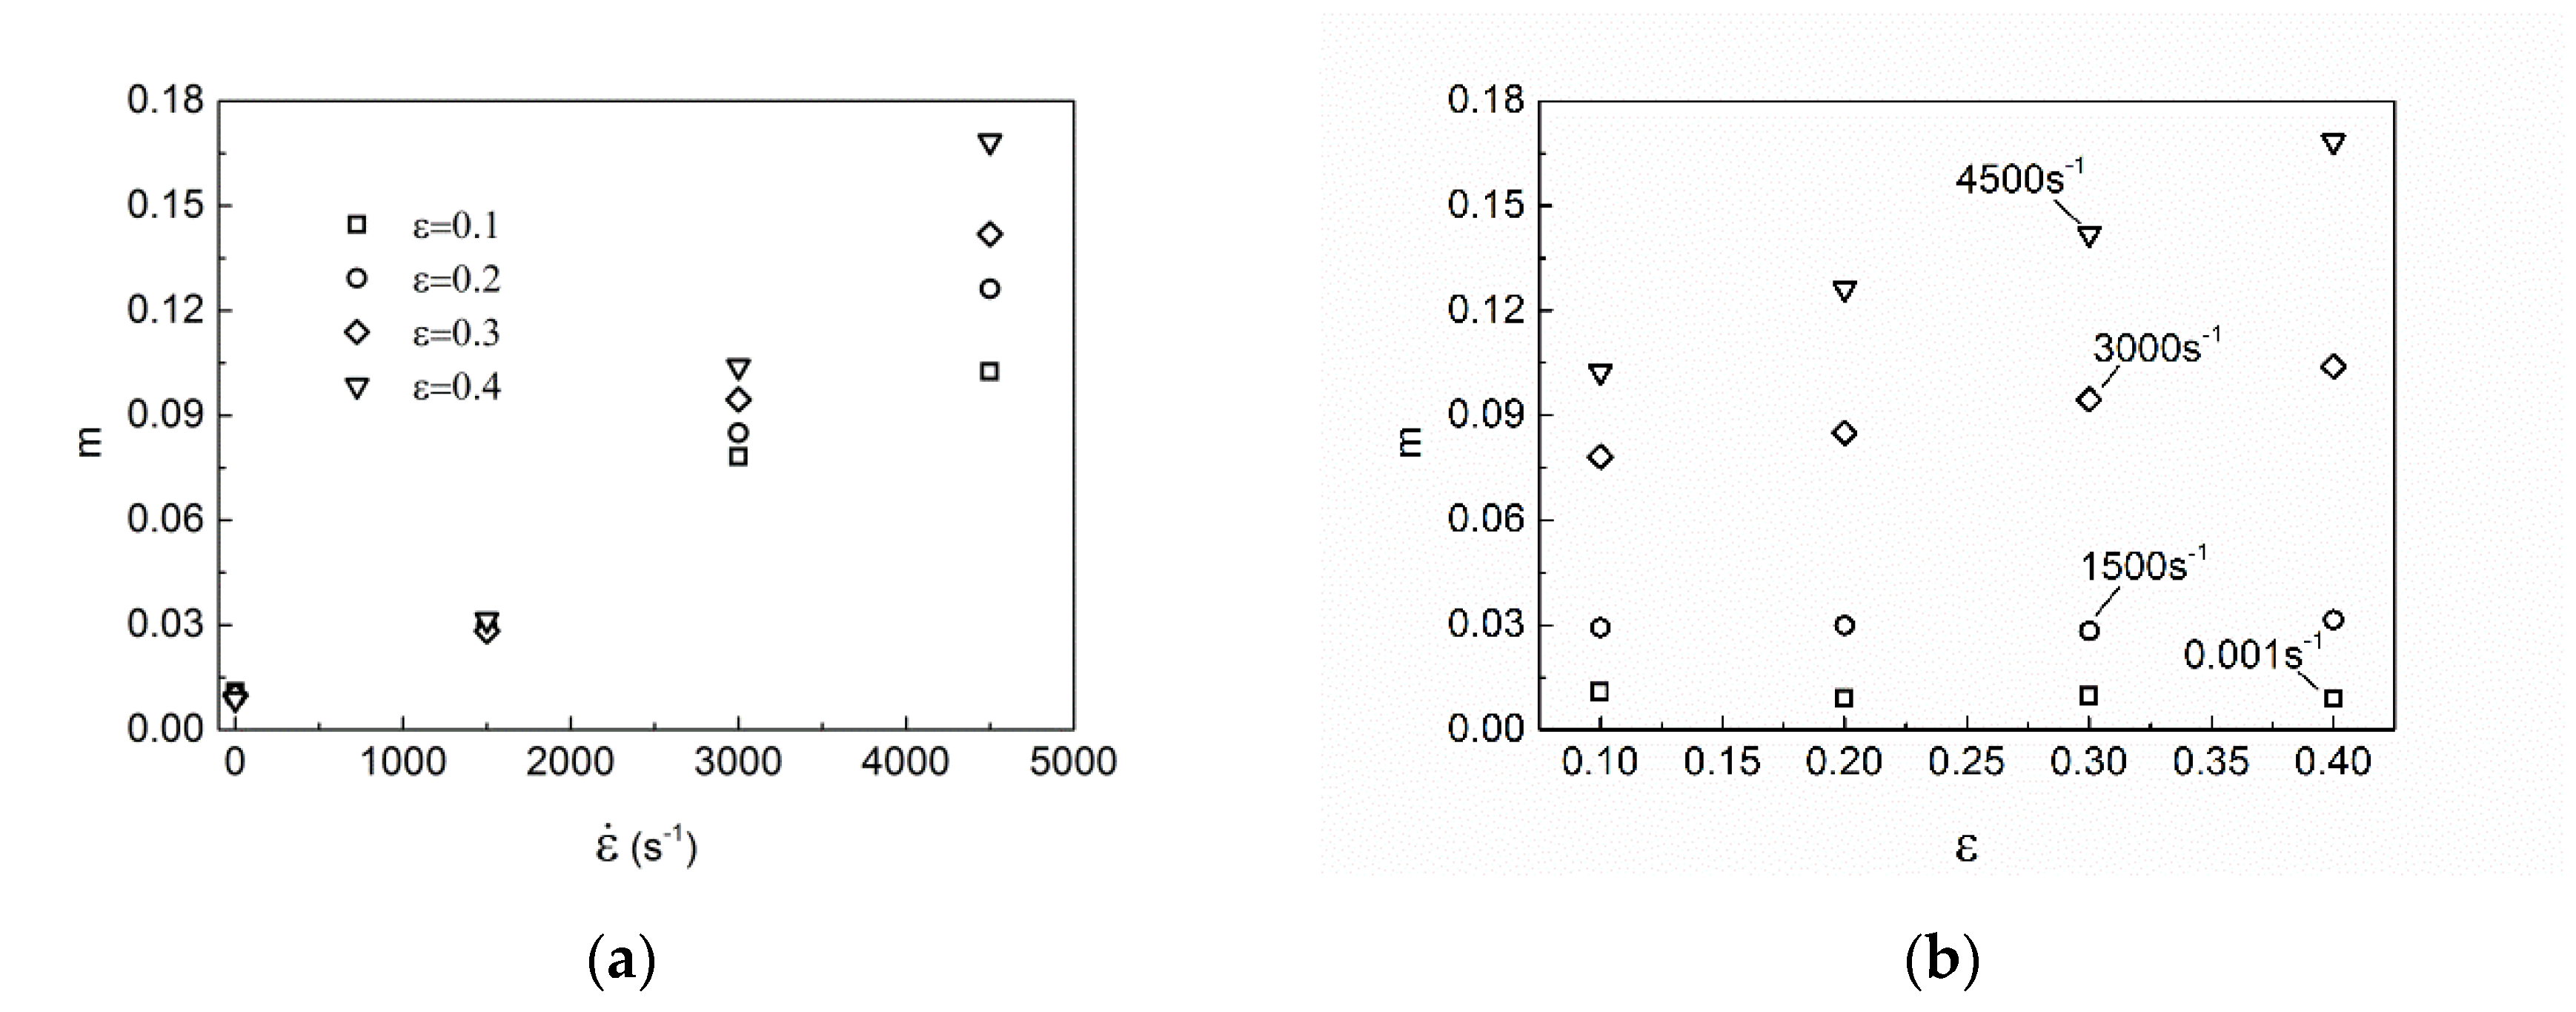
The SHPB experiments were conducted to understand the influence of deformation conditions (strain, strain rate) on the Mo-10Ta strain rate sensitivity factor m. The material m value increased exponentially as the strain rate increased. Under low strain rates (0.001–1500 s−1), the influence of deformation amount on m was negligible. When the strain rate was greater than 1500 s−1, m increased linearly with strain.
(2)
The material stress-strain relationship within the temperature range of 286–873 K and the strain rate range of 0.001–4500 s−1 was leveraged to investigate the influence of temperature and strain rate on the material activation energy Q. The Q value of material decreases rapidly with the increase in strain rate and temperature, and the Q value is the most sensitive to the vary of strain rate.
(3)
Under high strain rate deformation conditions, the Mo-10Ta alloy plasticity was greatly improved. With the shaped charge jet conditions, the ductility of the Mo-10Ta material was improved; it was 346.6 times that under static deformation. This was mainly because the increase in material temperature and grain refinement under a dynamic condition makes the grain boundary movement more intense, and the dislocation movement no longer plays an important role in deformation coordination.

Author Contributions

Conceptualization, P.S., W.-B.L. and B.-Y.Y.; methodology, P.S.; software, P.S.; validation, P.S., J.-P.S., X.-C.J.; data curation, P.S.; writing—original draft preparation, P.S.; writing—review and editing, Y.Z., B.-Y.Y.; funding acquisition, W.-B.L. All authors have read and agreed to the published version of the manuscript.

Funding

This research received no external funding.

Acknowledgments

The author gratefully acknowledges Xiamen Tungsten Co., Ltd., Xiamen, Fujian, China, which provided materials for this research.

Conflicts of Interest

The authors declare no conflict of interest.

References

  1. Sierakowski, R.L. Strain Rate Behavior of Metals and Composites. In Proceedings of the Convegno Igf XIII Cassino, Università di Cassino, Facoltà di Ingegneria, Cassino, France, 27–28 May 1997. [Google Scholar]
  2. Armstrong, R.W.; Walley, S.M. High strain rate properties of metals and alloys. Int. Mater. Rev. 2008, 53, 105–128. [Google Scholar] [CrossRef]
  3. Torres-Villasenor, G.; Negrete, J. A reinvestigation of the mechanical history on superplasticity of Zn-22Al-2Cu at room temperature. Mater. Sci. Forum 1997, 243–245, 553–556. [Google Scholar] [CrossRef]
  4. Chokshi, A.H.; Mukherjee, A.K. On the transition from superplastic to non-superplastic deformation at high strain rates. Sci. Metall. 1986, 20, 1771–1774. [Google Scholar] [CrossRef]
  5. Chokshi, A.H. The development of cavity growth maps for superplastic materials. J. Mater. Sci. 1986, 21, 2073–2082. [Google Scholar] [CrossRef]
  6. Chokshi, A.H.; Langdon, T.G. The mechanical properties of the superplastic AI- 33 Pct Cu eutectic alloy. Metall. Trans. A 1988, 19, 2487–2496. [Google Scholar] [CrossRef]
  7. Alfonso, B.L.; Manuel, J.M.; Arturo, D.R. The role of a threshold stress in the superplastic deformation of fine-grained Yttria-Stabilized Zirconia Polycrystals. Scr. Mater. 1996, 34, 1155–1160. [Google Scholar] [CrossRef]
  8. Owen, D.M.; Chokshi, A.H. Analysis of deformation mechanisms in superplastic yttria-stabilized tetragonal zirconia. Int. J. Plast. 2001, 17, 353–368. [Google Scholar] [CrossRef]
  9. Takayama, Y.; Tozawa, T.; Kato, H. Superplasticity and thickness of liquid phase in the vicinity of solidus temperature in a 7475 aluminum alloy. Acta Mater. 1999, 47, 1263–1270. [Google Scholar] [CrossRef]
  10. Alabort, E.; Putman, D.; Reed, R.C. Superplasticity in Ti–6Al–4V: Characterisation, modelling and applications. Acta Mater. 2015, 95, 428–442. [Google Scholar] [CrossRef] [Green Version]
  11. Alabort, E.; Kontis, P.; Barba, D. On the mechanisms of superplasticity in Ti–6Al–4V. Acta Mater. 2016, 105, 449–463. [Google Scholar] [CrossRef] [Green Version]
  12. Mabuchi, M.; Higashi, K.; Okada, Y. Very high strain-rate superplasticity in a particulate Si3N4/6061 aluminum composite. Scr. Metall. 1991, 25, 2517–2552. [Google Scholar] [CrossRef]
  13. Nieh, T.G.; Wadsworth, J.; Imai, T. A rheological view of high-strain-rate superplasticity in alloys and metal-matrix composites. Scr. Metall. 1992, 26, 703–708. [Google Scholar] [CrossRef]
  14. Chokshi, A.H.; Meyers, M.A. The prospects for superplasticity at high strain rates: Preltminary considerations and an example. Scr. Metall. 1990, 24, 605–610. [Google Scholar] [CrossRef]
  15. Tian, W.H.; Fan, A.L.; Gao, H.Y. Comparison of microstructures in electroformed copper liners of shaped charges before and after plastic deformation at different strain rates. Mater. Sci. Eng. A 2003, 350, 160–167. [Google Scholar] [CrossRef]
  16. Murr, L.E.; Trillo, E.A.; Pappu, S. Adiabatic shear bands and examples of their role in severe plastic deformation. J. Mater. Sci. 2002, 37, 3337–3360. [Google Scholar] [CrossRef]
  17. Murr, L.E.; Niou, C.S.; Garcia, E.P. Comparison of jetting-related microstructures associated with hypervelocity impact crater formation in copper targets and copper shaped charges. Mater. Sci. Eng. A 1997, 222, 118–132. [Google Scholar] [CrossRef]
  18. Gang, T.; Hao, C.; Qin-can, S. Superplastic flow problems of copper shaped-charge jets. Explos. Shock Wave 2008, 28, 336–340. [Google Scholar]
  19. Peng, W.; Gang, T.; Bao-xiang, R.; Zheng, P. Superplastic deformation mechanism of nanocrystalline copper: A molecular dynamics study. Acat Phys. Sin. 2015, 64, 1–8. [Google Scholar]
  20. Kennedy, C. Ballistic Perforation of OFHC Cu and 7039AI targets: A Microstructural and Hydrocode Study; The University of Texas: At E1 Paso, TX, USA, 2000. [Google Scholar]
  21. Ashby, M.F.; Verrall, R.A. Diffusion-accommodated flow and superplasticity. Acta Mater. 1973, 21, 149–163. [Google Scholar] [CrossRef]
  22. Xuhe, L.; Guanjun, D.; Ruizhi, W. Deformation and microstructure evolution of a high strain rate superplastic Mg-Li-Zn alloy. J. Alloys Compd. 2011, 509, 9558–9561. [Google Scholar] [CrossRef]
  23. Yan, X.; Lianxi, H.; Yu, S. Deformation behaviour and dynamic recrystallization of AZ61 magnesium alloy. J. Alloys Compd. 2013, 580, 262–269. [Google Scholar] [CrossRef]
  24. Xu, T.C.; Peng, X.D.; Qin, J. Dynamic recrystallization behavior of Mg-Li-Al-Nd duplex alloy during hot compression. J. Alloys Compd. 2015, 639, 79–88. [Google Scholar] [CrossRef]
  25. McQueen, H.J.; Imbert, C.A.C. Dynamic recrystallization: Plasticity enhancing structural development. J. Alloys Compd. 2004, 378, 35–43. [Google Scholar] [CrossRef]
  26. Masuda-Jindo, K.; Van Hung, V.; Hoa, N.T. First principles calculations of thermodynamic and mechanical properties of high temperature bcc Ta–W and Mo–Ta alloys. J. Alloys Compd. 2008, 452, 127–132. [Google Scholar] [CrossRef]
  27. Field, J.E.; Walley, S.M.; Proud, W.G.; Goldrein, H.T.; Siviour, C.R. Review of experimental techniques for high rate deformation and shock studies. Int. J. Impact Eng. 2004, 30, 725–775. [Google Scholar] [CrossRef]
  28. Andrde, U.; Meyers, M.A.; Vecchio, K.S.; Chokshi, A.H. Dynamic recrystallization in high-strain, high-strain-rate plastic deformation of copper. Acta Metall. Et Mater. 1994, 42, 3183–3195. [Google Scholar] [CrossRef]
  29. Akhtar, S.K.; Riqiang, L. Behaviors of three BCC metal over a wide range of strain rates and temperatures: Experiments and modeling. Int. J. Plast. 1999, 15, 1089–1109. [Google Scholar] [CrossRef]
  30. Ping, S.; Wen-bin, L.; Yu, Z. The constitutive behavior of Ti-5Al-3V-2Cr-2Fe under high-velocity impact: Experimental, modeling, and validation. J. Alloys Compd. 2019, 811. [Google Scholar] [CrossRef]
  31. Walters, W.P.; Zukas, J.A. Fundamentals of Shaped Charge; John Wiley: Hoboken, NJ, USA, 1989. [Google Scholar]
  32. Rajeev, K.; Sia, N.N. Determination of temperature rise during high strain rate deformation. Mech. Mater. 1998, 24, 1–12. [Google Scholar] [CrossRef]
  33. Shi-chun, W. Superplastic Deformation Theory of Metals; Nation Defense Industry Press: Beijing, China, 1994. [Google Scholar]
  34. Johnson, G.R.; Cook, W.H. A constitutive model and data for metals subjected to large strains, high strain rates and high temperatures. In Proceedings of the Seventh International Symposium on Ballistic, The Hague, The Netherlands, 19–21 April 1983; pp. 541–547. [Google Scholar]
  35. Jie, L. Deformation Behavior of 7N01 Aluminum Alloy during Hot Compression Deformation at Elevated Temperature; Hunan University: Changsha, China, 2008. [Google Scholar]
  36. Senthil, K.; Iqbal, M.A. Study of the constitutive behavior of 7075-T651 aluminium alloy. Int. J. Impact Eng. 2017, 108, 171–190. [Google Scholar] [CrossRef]
  37. Meyers, M.A. Dynamic Behavior of Materials; Wiley Interscience: Hoboken, NJ, USA, 1994. [Google Scholar]
  38. Zhang, J.D.; Di, H.S.; Wang, H.T. Hot deformation behavior of Ti-15-3 titanium alloy: A study using processing maps, activation energy map, and Zener-Hollomon parameter map. J. Mater. Sci. 2012, 47, 4000–4011. [Google Scholar] [CrossRef]
  39. Sang, D.L.; Fu, R.D.; Li, Y.J. The hot deformation active energy of 7075 aluminum alloy under three different deformation modes. Metals 2016, 6, 49. [Google Scholar] [CrossRef]
  40. Cangji, S.; Weimin, M.; Grant, C.X. Evolution of activation energy during hot deformation of AA7150 aluminum alloy. Mater. Sci. Eng. A 2013, 571, 83–91. [Google Scholar] [CrossRef]
  41. Bao, M.; Min, W.; Xiangdong, W. Constitutive modeling for high-temperature tensile deformation behavior of pure molybdenum considering strain effects. Int. J. Refract. Metals Hard Mater. 2014, 45, 14–47. [Google Scholar] [CrossRef]
  42. Cahoon, J.R. A Modified ‘‘Hole’’ Theory for solute impurity diffusion in liquid metals. Metall. Mater. Trans. A 1997, 28, 583–593. [Google Scholar] [CrossRef]
  43. Honeycombe, R.W.K. The Plastic Deformation of Metals, 2nd ed.; Edward Arnold Ltd.: Baltimore, MD, USA, 1984; pp. 33–128. [Google Scholar]
  44. Gourdet, S.; Montheillet, F. An experimental study of the recrystallization mechanism during hot deformation of aluminum. Mater. Sci. Eng. A 2000, 283, 274–288. [Google Scholar] [CrossRef]
Figure 1. Microstructure of Mo-10Ta alloy, (a) 200×, (b) 500×.
Metals 10 01153 g001
Figure 2. The relationship between specific heat (CP) of Mo-10Ta and temperature (T).
Metals 10 01153 g002
Figure 3. The structure diagram of test samples (unit: mm): (a) dynamic/static compression sample, (b) static tensile sample, (c) liner.
Metals 10 01153 g003
Figure 4. The forming process of SCJ.
Metals 10 01153 g004
Figure 5. SCJ Warhead.
Metals 10 01153 g005
Figure 6. Explosive forming test layout.
Metals 10 01153 g006
Figure 7. The dynamic/static compression stress-strain relationship of Mo-10Ta alloy at different ambient temperature, (a) T = 286 K, (b) T = 473 K, (c) T = 873 K.
Metals 10 01153 g007aMetals 10 01153 g007b
Figure 8. Effect of strain rate (460–4500 s−1) on yield stress ( ε p = 0.002 ) at different ambient temperature.
Metals 10 01153 g008
Figure 9. The relationship of ln ε ˙ ln σ .
Metals 10 01153 g009
Figure 10. Influence of deformation conditions (strain rate, strain) on M (T = 286 K), (a) ε ˙ m function relation, (b) ε m function relation.
Metals 10 01153 g010
Figure 11. Effect of initial ambient temperature on yield stress ( ε p = 0.002 ) at different strain rate.
Metals 10 01153 g011
Figure 12. Deformation temperature rise of Mo-10Ta (286 K, 4500 s−1).
Metals 10 01153 g012
Figure 13. Microstructure of Mo-10Ta after plastic deformation (286 K, 4500 s−1), (a) 500×, (b) 1000×.
Metals 10 01153 g013
Figure 14. Calibration of J–C constitutive parameters of Mo-10Ta: (a) functional relationship between equivalent plastic strain and equivalent stress, (b) functional relationship between dimensionless strain-rate and yield strength, (c) functional relationship between dimensionless temperature and yield strength.
Metals 10 01153 g014aMetals 10 01153 g014b
Figure 15. The X-ray image of Mo-10Ta jet.
Metals 10 01153 g015
Figure 16. The displacement–load curve of Mo-10Ta under static tensile (286 K, 0.001 s−1).
Metals 10 01153 g016
Figure 17. The numerical simulation of Mo-10Ta jet forming, (a) velocity gradient nephogram (cm/μm), (b) equivalent plastic strain nephogram, (c) temperature nephogram (K).
Metals 10 01153 g017
Figure 18. The fragments of Mo-10Ta alloy slug.
Metals 10 01153 g018
Figure 19. The metallographic picture of Mo-10Ta alloy slug, (a,d,g) are the grain morphology at position 1# of the slug; (b,e) and (h) are the grain morphology at position 2# of the slug; (c,f,i) are the grain morphology at position 3# of the slug.
Metals 10 01153 g019
Figure 20. The function relation of ln   ( sin h   α σ p ) with (a) ln ε ˙ and (b) 1/T, respectively.
Metals 10 01153 g020
Figure 21. (a) is the effect of temperature T on n and (b) is the effect of strain rate ε ˙ on S.
Metals 10 01153 g021
Figure 22. Effect of temperature (T) and strain rate ( ε ˙ ) on activation energy (Q).
Metals 10 01153 g022
Figure 23. The varying of material strain rate during jet forming of Mo-10Ta.
Metals 10 01153 g023
Figure 24. The varying of Q value at different axial positions of Mo-10Ta jet.
Metals 10 01153 g024
Table 1. The chemical composition of Mo-10Ta.
Chemical Composition (ppm)Mass Fraction (%)
FeAlSiCaCdCrCuMgMnNiPbSbSnVTaMo
55551586552415159.96Remainder
Table 2. The J-C constitutive parameters of Mo-10Ta.
DescriptionNotationsValues
Elastic modulusE (Gpa)249
Densityρ (g/cm3)10.5
Yield stress constantA (Mpa)1550.2
Strain hardening constantB (Mpa)249.6
-n10.15
Strain rate hardening constantC0.12
Thermal softening constantm10.387
Reference strain rate ε ˙ 0 (s−1)1400
Melting temperatureTm (K)2921
Room temperatureTr (K)286
Specific heat (Mean)Cp (J/(g · K))0.361
Table 3. Verification of Mo-10Ta J–C constitutive model.
DataThe Length of Jet (mm)Maximum Diameter of Slug (mm)Jet Head Velocity (m/s)Slug Velocity (m/s)
Simulation data36.918.2462811431
Experimental data38.218.964411356
Error3.4%3.5%2.5%5.2%

