Article

FEM-Based Methodology for the Design of Reduced Scale Representative Experimental Testing Allowing the Characterization of Defect Evolution during Hot Rolling of Bars

1
ABS Centre Métallurgique (ACM), 57070 Metz, France
2
Arts et Métiers Institute of Technology, Université de Lorraine, LCFC, HESAM Université, 574070 Metz, France
*
Author to whom correspondence should be addressed.
Metals 2020, 10(8), 1035; https://doi.org/10.3390/met10081035
Submission received: 15 July 2020 / Revised: 26 July 2020 / Accepted: 28 July 2020 / Published: 2 August 2020
(This article belongs to the Special Issue Challenges and Achievements in Metal Forming)

Abstract

:
Defects generated during the casting process of steel can be reduced by forming processes such as hot rolling. During these processes the effective strain, the temperature, the stress state and the alternation of the forming direction all influence the defect evolution. Analytical or numerical models are available in the literature to predict the defect evolution. However, experiments have to be carried out to identify the parameters of these models. Thus, the quality of the identification depends on the representativeness of the experiments with respect to the industrial forming process. This paper proposes a methodology to design reduced scale experiments with an improved level of representativeness. This methodology consists first in the identification of the thermomechanical parameters driving the defect evolution and the quantification of these parameters in the industrial process by FEM simulation. These last results are then utilised as criteria for the representative experiment design. In this work the methodology is applied to the rolling of bars. The representative experiment consists of successive forming operations of a cylindrical sample between shaped anvils reproducing the roll shape at a 1:10 scale. A validation is finally achieved by reproducing qualitative results concerning the evolution of voids in the vicinity of hard inclusions.

1. Introduction

During the steel casting process, internal defects such as shrinkage porosities and inclusions are generated in the cast products. These imperfections are crack initiation sites, responsible for the degradation of the mechanical properties of the finished product. Controlling these defects during the forming process following the casting operation is one of the levers to limit the impact of these defects and improve, for example, the fatigue behaviour of finished part. The reduction of the impact of imperfections is achieved mainly during heavy forming operations such as rolling or cogging, which involve multi-directional forming paths. A better understanding of the void and inclusion evolution phenomena during forming is thus a key point to limit the impact of defects on finished steel products.
The evolution of defects in steel matrices is influenced by thermomechanical fields, geometrical parameters, and process parameters and depends on the nature of the defects. Regarding the evolution of shrinkage porosities, numerical studies have assessed the influence of the thermomechanical fields on void closure. Lee et al. [1] have determined that effective strain influences the void closure phenomenon by using FEM modelling compared with two alternated direction-upsetting experiments performed to evaluate shrinkage porosity. These defects are analysed before and after forming by tomography to provide information on void morphology. Using simulation of representative volume elements (RVE) with different loadings and morphologies of void, Saby et al. [2] identify the pressure state through a stress triaxiality ratio as a first-order parameter intervening in void closure. This latter is the ratio between the hydrostatic pressure and the equivalent stress. Feng and Cui [3] use the same simulation approach compared with cogging experiments performed on lead samples containing spherical machined voids. The authors define a 3-dimensional void evolution criterion dedicated to multi-stage formation with voids located in the centre area of samples. Chbihi et al. [4], by using the same approach as Saby, highlight the influence of Lode angle on the void closure phenomenon. Concerning the healing of voids, Hibbe and Hirt [5] identify temperature as a key parameter for evaluating the bounding efficiency at the prior inner surface of cavities. This evaluation was carried out using hot testing conditions in which the effect of alternated forming direction during hot processing could be reproduced. This phenomenon is important in the context of multistage forming operations in which previously healed defects can be reopened during the formation process. Ståhlberg and Keife [6] indicate that the thermal gradient generated in samples influences the void closure phenomenon as well, by affecting the state of stress and strain at the core of the sample. This effect is produced by performing experiments on rolled steel samples containing drilled cavities. To evaluate the void closure capacity of a forming route, Tanaka et al. [7] proposed the hydrostatic integration, Q (see Equation (1)), defined as the integral of the stress triaxiality over the cumulated strain. In Equation (1), σh is the hydrostatic pressure, σeq the equivalent stress, and ε ¯ the equivalent strain:
Q = 0 ε ¯ σ h σ e q   d ε ¯ ,
With regard to the geometrical aspect of void evolution, Kakimoto et al. [8] studied the influence of void location and void dimension on porosity closure behaviour by using upsetting experiments performed on drilled aluminium samples to model defects and compare their morphological evolution with FEM analysis results. A threshold of Q = 0.21 is also determined during this study as a value over which void closure in unidirectional forming processes is achieved. Saby et al. [9] identified the global morphology of the defects and its tortuosity which characterises shrinkage porosities as affecting parameters during the void closure, especially during the last phase of cavity reduction, by increasing the number of contact points between the internal faces of the cavities. The orientation of defects with regard to the strain direction is also described as influencing the void closure. Void evolution is also affected by parameters directly linked to the process. Nakasaki et al. [10] used experiments on plasticine and FEM modelling analysis to highlight the impact of multi-stand rolling with alternated forming directions on the void closure. The authors evaluate the threshold of hydrostatic integration to reach void closure during multistage rolling with alternation of the forming direction. In this configuration, they propose a corrected factor of Q called C, with C = 0.024 to apply in every rolling stand with an area reduction higher than 2%. During cogging operations using multistage forming with alternated directions, Kukuryk [11] identified a threshold of Q = 0.85 for the complete closure of axial voids. Feng et al. [12] also identified the alternation of forming directions as a parameter which decreases void closure efficiency by performing cogging process on samples including machined spherical voids in a steel matrix. Banaszek and Stefanik [13] highlighted the effect of tool shape on void closure phenomenon during open-die forging experiments using FEM evaluation of internal fields.
Concerning the morphological evolution of inclusions during the hot forming process, Luo and Ståhlberg [14] brought out the impact of the relative plasticity index between the behaviour of the inclusion and the behaviour of the matrix surrounding it. This parameter is thus related to temperature, taking into account the plastic behaviour of the materials involved. This study investigates this effect by using FEM modelling of unidirectional hot rolling. Using a FEM analysis approach, Ervasti and Ståhlberg [15] completed the first analysis of this index by bringing to light that void initiation occurs only around hard inclusion and that cavity evolution is restricted by high hydrostatic states during flat hot rolling. Luo [16], by using FEM analysis of flat rolling, also linked the evolution of cavities initiated in the vicinity of hard inclusion to the effective strain level at this location.
The influence of thermomechanical fields on defect evolution, the geometry of the defects and the process parameters are identified in a large variety of experimental investigations, usually coupled with FEM analysis to interpret the results. Three main types of experimental methods can be identified using this approach. The first can be called laboratory approach. It consists of using elementary solicitations like the upsetting test as carried out by Kakimoto [8] to analyse void evolution. Park and Yang [17] used this kind of experimentation to explore the bonding efficiency of healed voids under plain strain conditions. Qi et al. [18] exploited upsetting experiments to model the behaviour of matrix material surrounding hard inclusion by reproducing the phenomenon with model material approaching the behaviour of steel at high temperature. Kim et al. [19] applied this type of method in a second type of experimentation, based on reproducing, at a lower scale, complex forming paths encountered in industrial manufacturing processes for lead samples. The third approach involves using direct industrial installation to analyse defect evolution. Faini et al. [20] used this approach to evaluate a multistage rolling process of long products by comparison with FEM analysis. In this modelling, the Q factor and the effective strain level are used to evaluate the forming route capacity with regard to defect closure. The initial states of voids and their evolution after forming operations are measured using ultrasonic testing.
The first two approaches are advantageous in terms of their control of parameters and the setting up of initial defects. Nevertheless, the use of model material or elementary operations limits the representativeness of the experiment. The last method is a better solution with regard to the representativeness of the phenomenon, but the dimensions of the samples involved did not allow for an accurate measurement of the defect evolution due to constraints of the non-destructive testing processes, and the production of the initial defects was also non mastered. The representativeness of the experiment linked to the studied process in terms of thermomechanical solicitation is hence an important parameter that can influence conclusions, as illustrated by the differences in Q values advanced by different authors to achieve the complete closure of cavities.
This paper thus proposes the development of an experimental platform allowing the evaluation of morphological evolution of defects and of criteria of evolution of the latter. This platform is based on the reproduction of the thermomechanical path of a multistage forming process on a reduced scale with a high degree of representativeness in terms of thermomechanical route and material involved. This approach is applied to a rolling mill producing long products from 270 mm diameter blooms issued from continuous casting. The purpose of the study is to avoid industrial limitations due to productivity constraints and dimensional limits such as non-destructive analysis on wide sections by reproducing thermomechanical loading representative of the industrial process in a controlled environment. This testing aims to reach a wide range of representative fields to allow the study of defect evolution and experimental calibration of evolution criteria. The scale transition performed allows the sampling of defect morphology as well, at different stages of the process, and permits non-destructive analysis compatible with defect reconstruction, such as 3D tomography, to perform comparison of the defect evolution between FEM modelling and experimentations.
The applied approach consists in first defining reference fields to reproduce according to the studied phenomenon. In the case of void evolution, the representative thermomechanical fields selected are the temperature at the centre of the sample, the effective strain amplitude, the stress triaxiality level, and the value of the hydrostatic integration Q. These latter two factors are in fact identified in the literature as influencing parameters of both void closure and void evolution in the vicinity of inclusion phenomena. Once these representative fields are identified, an FEM modelling of the industrial process is set up to obtain the reference values to be reproduced inside the formed bars. The simulation is validated through comparison with the torque and thermal measurements, and a parametric study is carried out to evaluate the precision with which the model is able to estimate the representative fields. A representative test is then designed to reproduce at a 1:10 scale the dimensions of the industrial tools on shaped anvils using a sample of a 1/10 diameter of the initial product. This initial configuration is used to set up a FEM modelling of the test that can evaluate the representative fields’ values at the core of the sample. The experimental parameters of the test are eventually adjusted to improve the representativeness of the test.

2. Representative Experiment Design

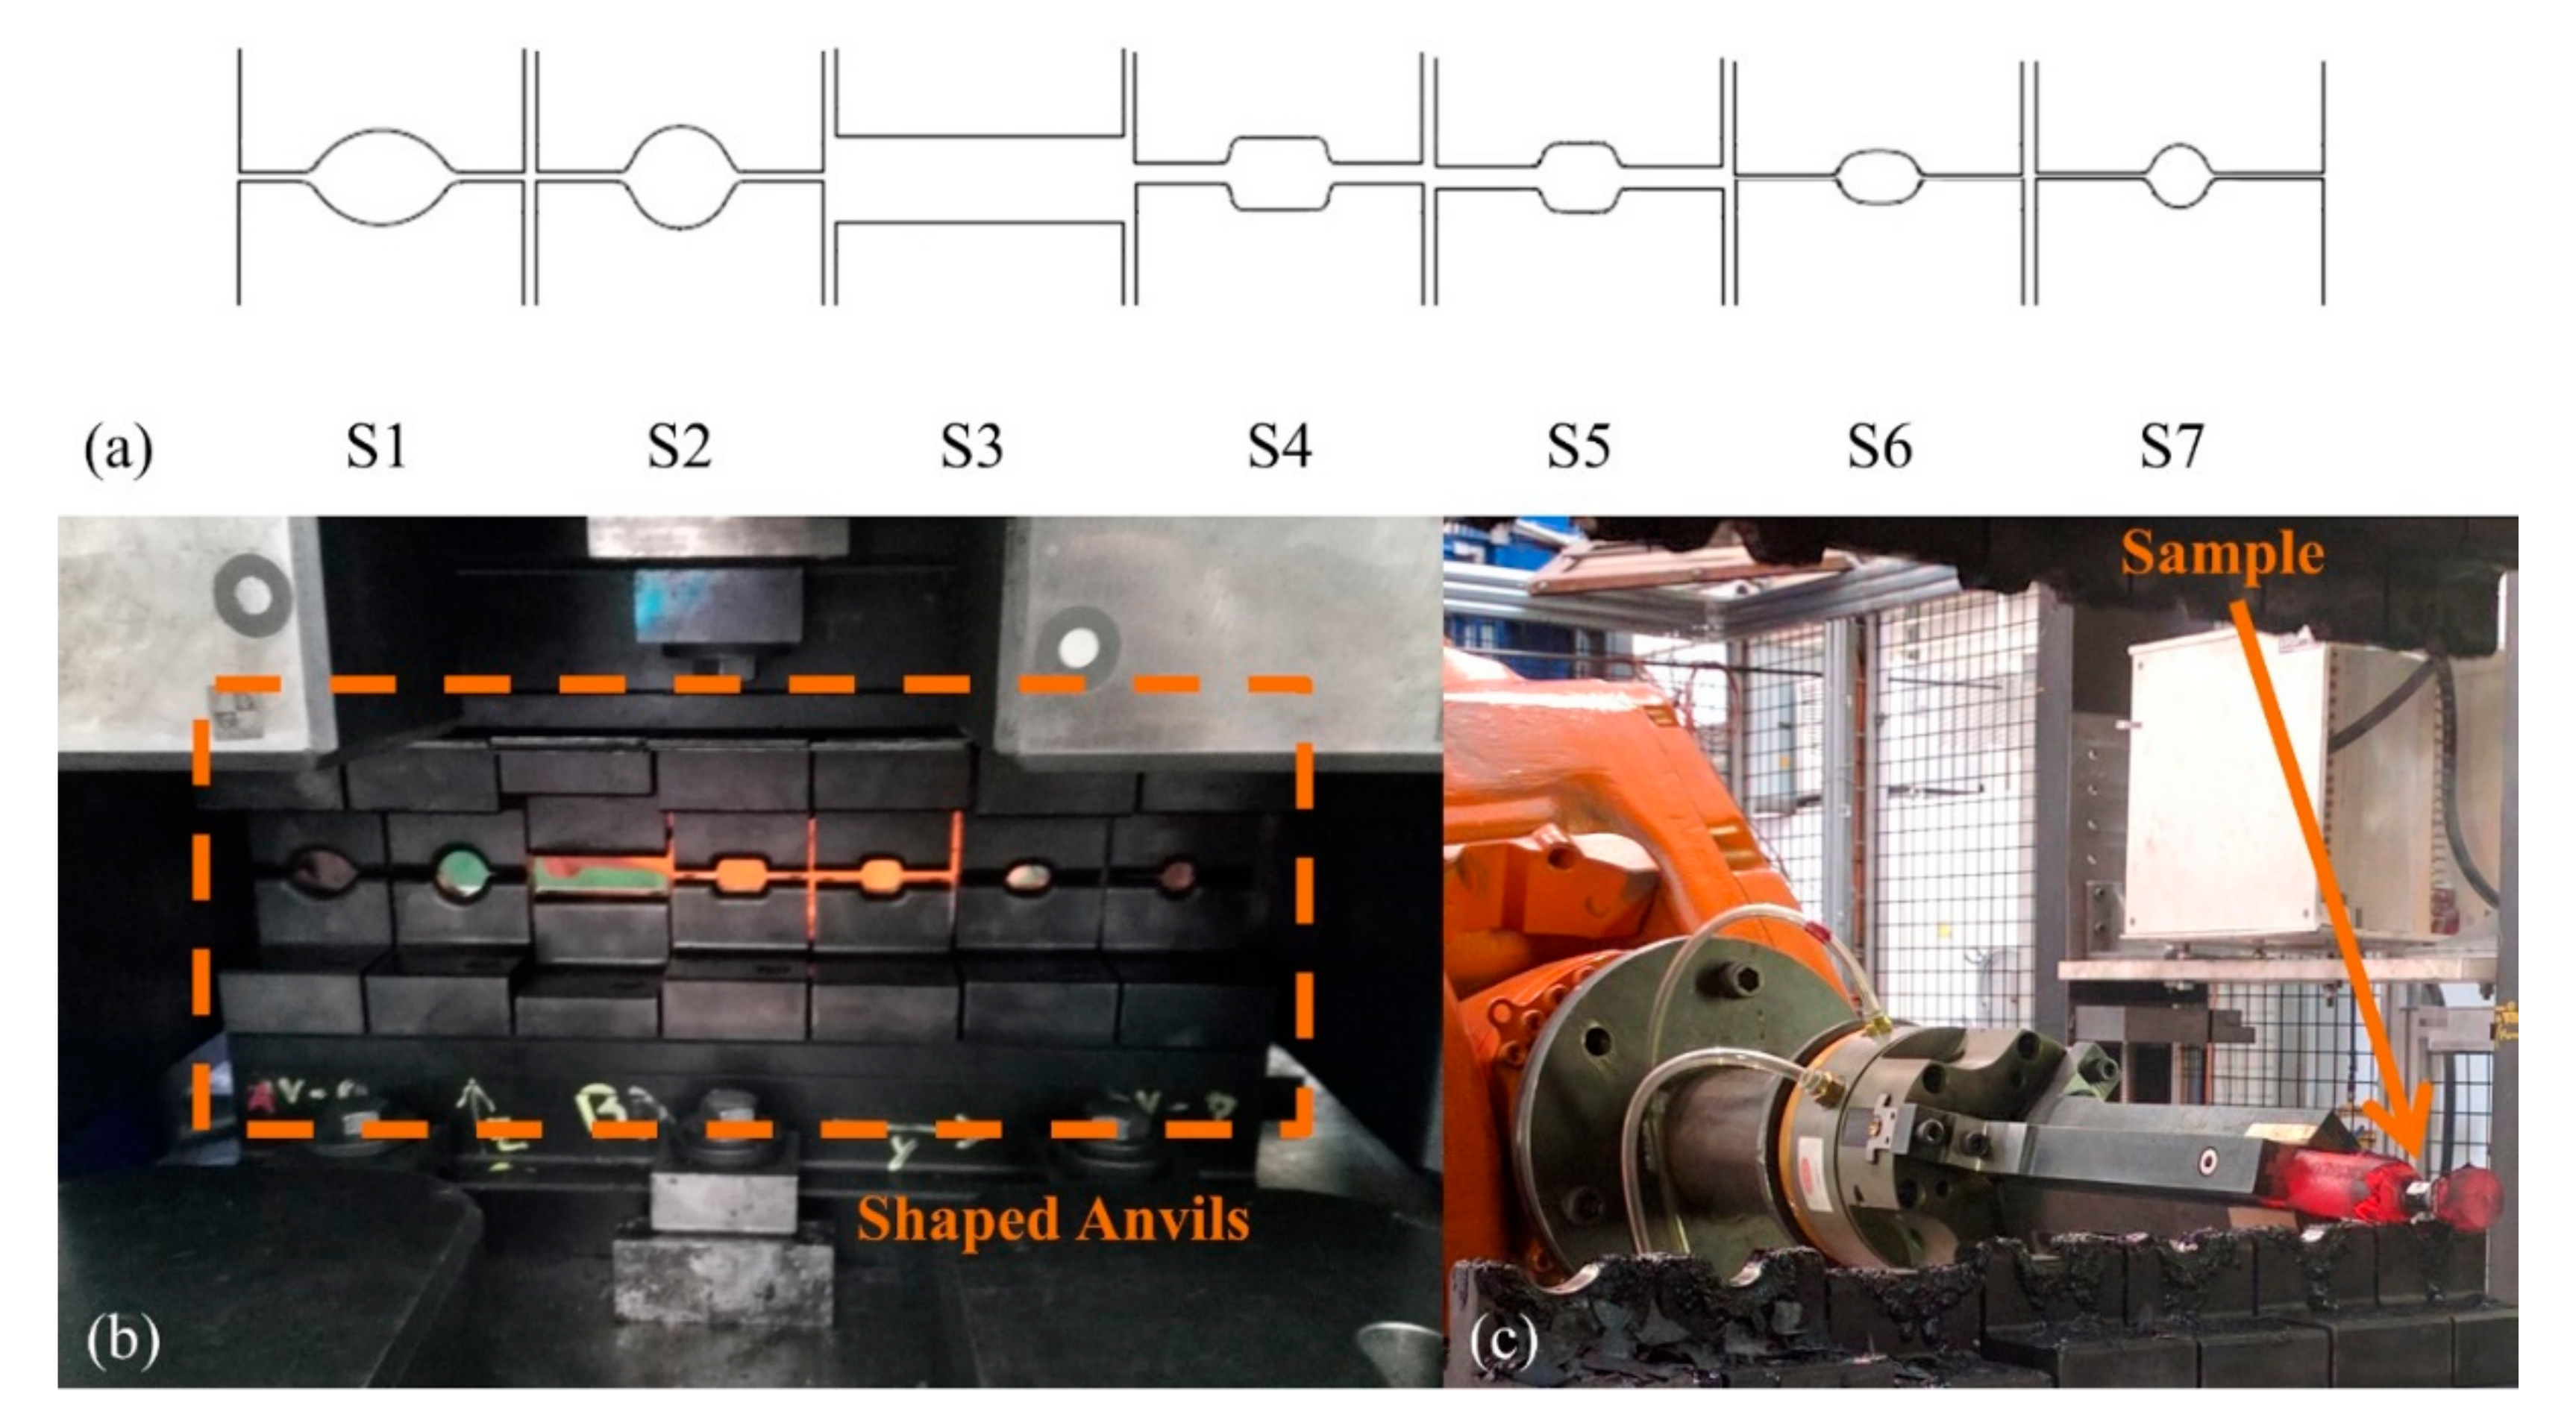
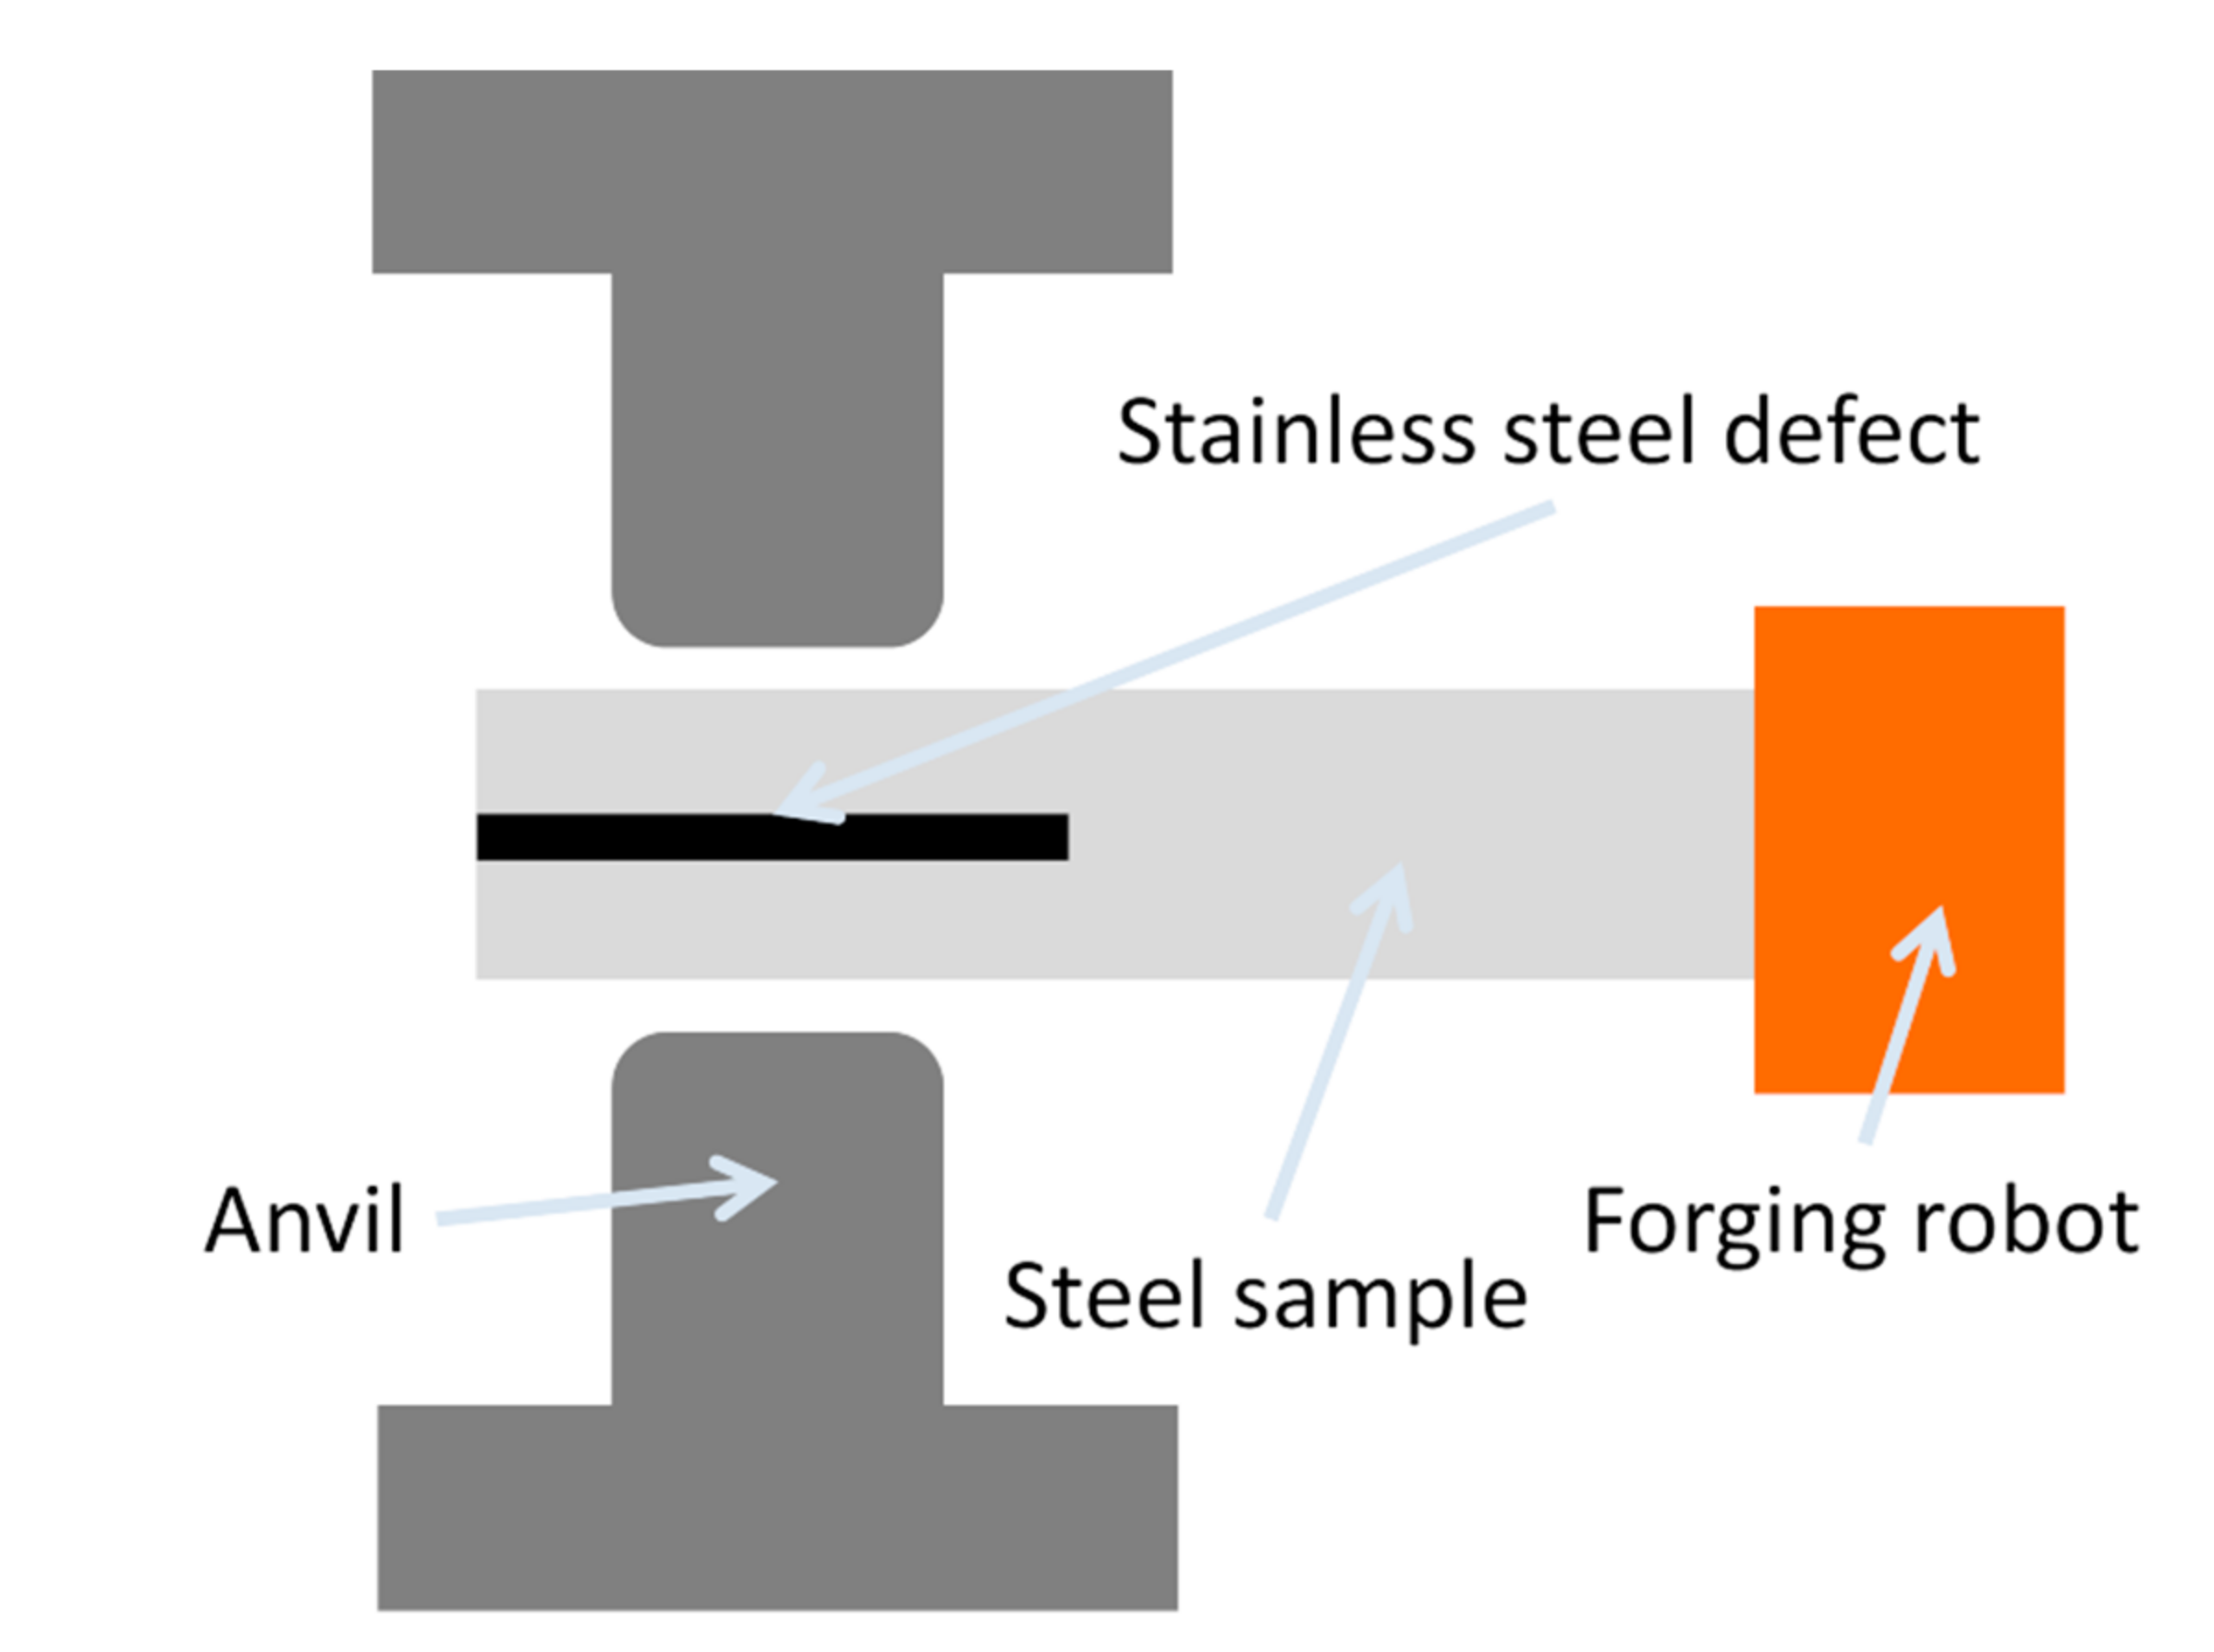
2.1. Test Description

The representative test developed in this study consists in reproducing the thermomechanical path of the first seven stands of an industrial continuous rolling mill on a reduced scale. This industrial forming route is designed for the hot rolling of bars with an initial diameter of 270 mm to a final diameter of 60 mm at the end of the thirteenth stand. The gaps of each stand are given in Table 1. The rolling speed ranges from 0.12 m∙s−1 for the third stand to 1.31 m∙s−1 for the thirteenth stand. The described manufacturing program is applied to a 41Cr4 steel.
A representation of the first seven rolls groove shapes is shown in Figure 1a,b by their reproduction on the anvils of the representative experiment to describe the forming operation.
The representative experiment is performed on a vertical press using shaped anvils reproducing on a 1:10 scale the industrial settings. The anvils are designed with a constant flat active width of 10 mm, surrounded by two rounded edges for a total width of 23 mm. The 1:10 scale was selected to achieve a compromise between the reproduction of a maximum of rolling stands within the dimensions of the ram of the press and the limitation of the temperature loss at the heart of the sample. This temperature loss is due to heat exchange with the tools and with the external environment and depends on the thermal inertia of the sample.
The gap designates in the rolling process the distance between the two rolling rolls (rolling gap) involved in a rolling stand. The latter is modelled here on the representative test by the distance between the upper and the lower die once the ram of the press is at its lowest position. The reduced scale gap values are rounded at +/− 0.5 mm due to experimental constraints. The results of the test design are illustrated in Figure 1a with a drawing of the die represented in a closed position, in its initial configuration.
During the experiments, a cylindrical steel sample with a 27 mm diameter is handled between forming operations by a robotic arm illustrated Figure 1c that alternates the forming direction, and positions the sample in the centre of the tools’ active parts. No lubrication is used at the interface between the tools and the samples during the initial settings of the test.
To assess the representativeness of the experiment, a simulation of the industrial rolling installation is first used to define a reference thermomechanical path undergone by the core of the bars during rolling operations. The representativeness of the test is then evaluated through a comparison of the FEM modelling of the representative experiment with the FEM modelling of the industrial rolling process. This implied the identification of the FEM parameters of the two involved forming processes to set up the simulations.
Regarding the improvement of the representativeness of the experiment, the gaps and the lubrication can be modified. The consequences of the changes on the representative test are then evaluated through a FEM analysis to validate the degree of reproduction of the thermomechanical fields of reference that can be reached in the representative test.

2.2. FEM Modelling of the Industrial Rolling Process

The simulation of rolling performed in the current study is carried out using Forge® NxT 2.1 software edited by Transvalor. S.A. (Sophia Antipolis CEDEX, France) This method of modelling uses tetrahedral elements with 4 nodes. The validation of the simulation parameters is performed by comparing thermal measurement and torque recordings with the estimations of the model, as achieved by Nalawade et al. [21].
The rolled material is modelled using the Hensel-Spittel equation with five parameters of the 41Cr4 steel provided by the Forge® NxT 2.1 database. The parameters are displayed Table 2. This material will be used in all the FEM-Modelling of the industrial test and of the representative test.
The applied strategy of rolling is based on a steady state analysis described in Figure 2 and developed in previous work [22]. This analysis uses only an area of the rolled product where a thermomechanical steady state is achieved during the forming operation, to be transferred to the next step of the manufacturing process. This method is used to reduce computation time. It can result in the neglect of the influence of the coupling between successive stands. The simulation is also performed on one quarter of the bar, and its meshing size is only refined in the area between the rolls, to reduce the number of elements needed and hence the calculation time. The extremities of the bar are using free boundaries conditions. At the beginning of a rolling stand, the bar is numerically trimmed by the rolling roll to initiate the bite of the rolling operation. During the simulations, the tools are considered rigid and the contact with the deformable body are modelled using unilateral contacts with friction behaviour modelled by a Tresca-limited Coulomb law. The steady state area position is chosen in order to be sufficiently far from the extremities not to be affected by this boundary conditions (see Figure 2). A mesh convergence study was performed on the rolling torque and a mesh size of 5 mm was defined in the refined meshing box (see Figure 2).

2.2.1. Identification of FEM Parameters

The input parameters of the FEM modelling are identified by comparing the computed value of control fields with the measurements of these fields carried out on the industrial installation. The friction between the rolls and the bar is modelled here by a Tresca-limited Coulomb law with friction coefficients considered identical at every stand. Concerning the friction coefficients, the letter µ is referring to the friction coefficient of Coulomb and m to the friction coefficient of Tresca. The thermal exchanges at these interfaces are also the same for each forming stand, and a constant emissivity of 0.88 is used for the thermal exchange by radiation. Only the roll temperature for each stand is modified and adjusted according to temperature measurements undertaken during the rolling process. The experimental temperatures are measured by a set of thermal cameras and two-colour pyrometers right after the reheating furnace, and after the second, the ninth, and the thirteenth stands. The FEM-parameters matching these assumptions and achieving the best compromise in terms of comparison with measurements appear in Table 3.
The comparison results using this set of reference parameters appear in Figure 3. The measurements are depicted using the mean value of the measurements. with one standard deviation of uncertainty. The comparison of torques measured and estimated in Figure 3a displays a good reproduction of torque tendency during the whole rolling operation. An underestimation of torque during stands 1, 6, 7, 8 and 9 is still noticeable with a higher relative deviation of –22% reached during the eighth stand of rolling. Concerning the studied forming route (stands 1 through 7), the mean absolute percentage deviation is of 9% between the computed and measured values of the torque.
A good correlation on skin temperature is obtained using the reference parameters on the FEM modelling of the rolling as seen in Figure 3b. The lower temperature measured for the initial state is probably due to scale formation on the surface of reheated bar. The FEM results are thus satisfactory in terms of torque and skin temperature despite their underestimation for some stands.

2.2.2. Sensitivity Study of the Rolling Mill Model

A sensitivity study of friction and the thermal exchange coefficients, on the computed torques and skin temperatures, and on the representative fields is achieved. The objective of this part is to validate the use of the rolling torques and the skin temperatures for the identification of the friction and thermal exchange coefficients.
The selected FEM parameter values for the sensitivity study appear in Table 4. Given that the levels considered here are extreme values, they can be used to identify FEM parameters’ influence over a large range of variations. During the study, each parameter is modified independently, meaning that no coupling effect of parameter modification is investigated. The modified values, especially the values of friction coefficients are not representative of realistic values observed during rolling processes. They are used here to have a significant variation of friction parameters without observing bar slipping in the simulation during the parametric study.
The variation according to a large range of the modelling parameters (extreme values of friction and thermal exchange with die) leads to a modification of the value of control fields (fields compared with experimentations and measurements) and of representative thermomechanical parameters (triaxiality, hydrostatic integration and equivalent strain). The relation is illustrated by the results obtained after the seventh stand shown in Table 5. This feature is especially noticeable throughout the modification of thermal exchange, where the mean torque measured drops by 10.9% whereas the magnitude of Q drops by 11.4%.
The analysis of the parametric study results leads to the conclusion that a modification of an entry parameter that causes the modification of a control field also modifies the reference fields with the same order of magnitude. This observation highlights the ability of the model to represent the reference field’s magnitude and its possible variation by evaluating the reproduction of control field values.
Hence, the sensitivity analysis of the FEM simulation results validates the use of the measured torques and skin temperatures as control parameters to identify the friction and thermal exchange coefficients with a satisfactory precision. This precision can be evaluated by considering the sensitivity of the representative fields to variations of the friction or the thermal exchange coefficients.
The representative fields obtained by calculation in the centre of the bar will be used in the following as a reference for the representative test design and dimensioning.

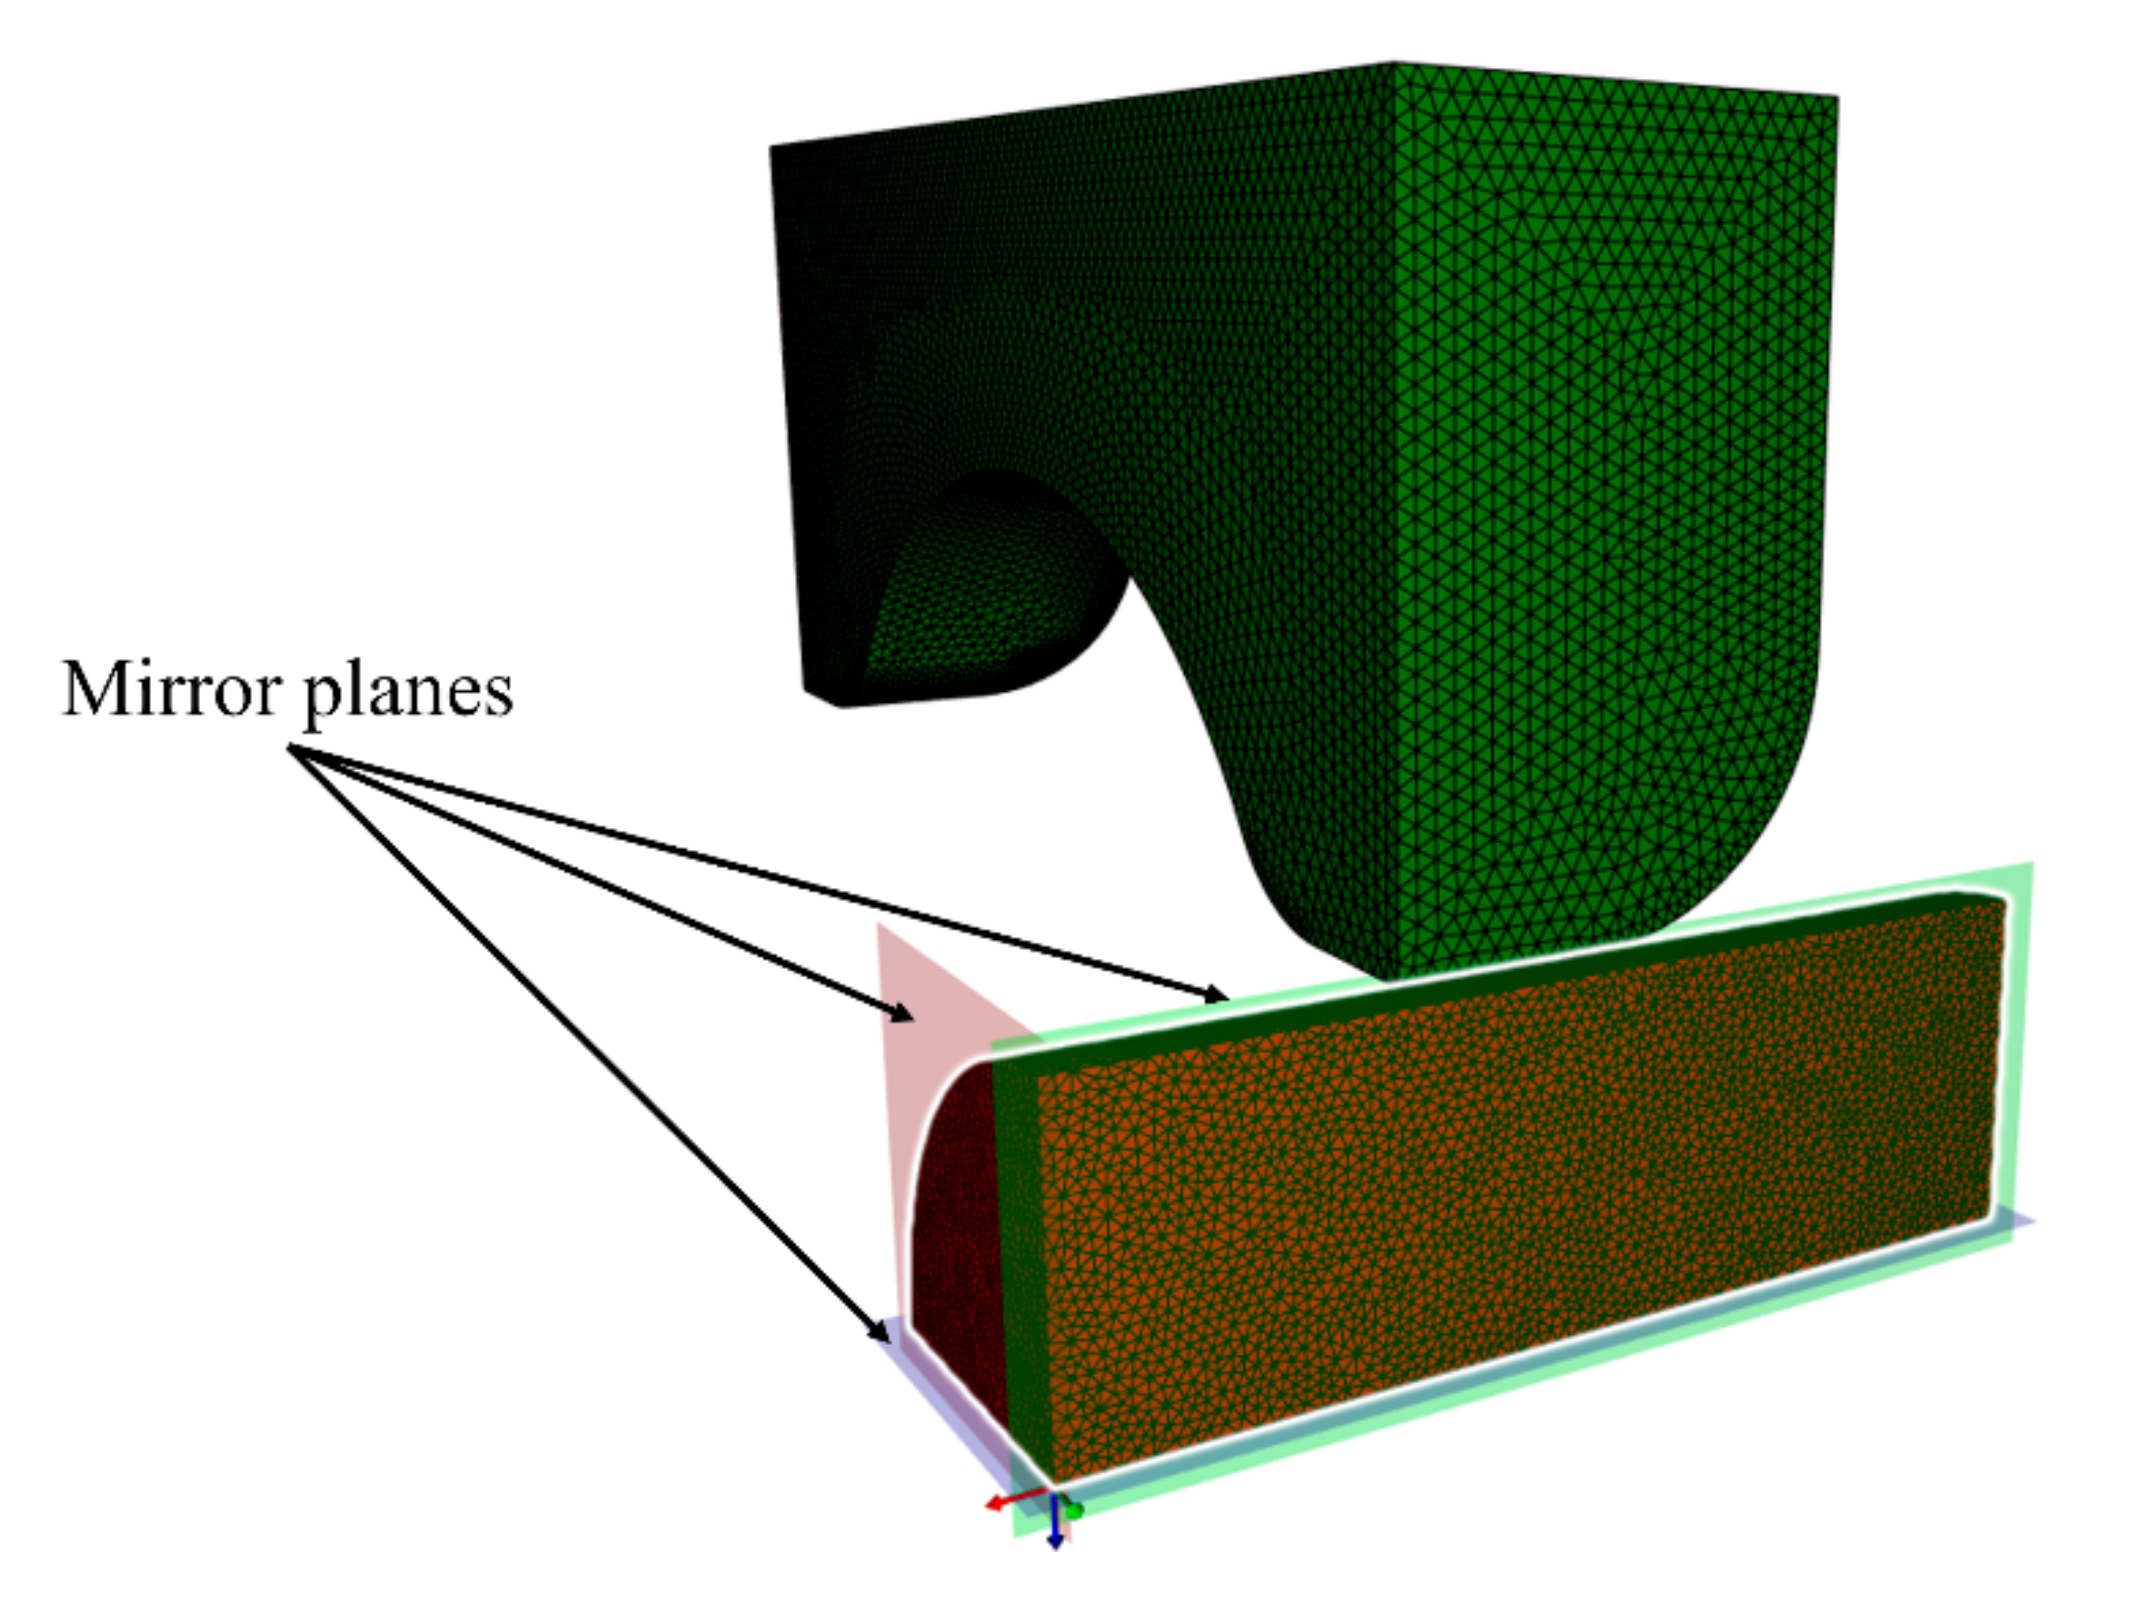
2.3. FEM Modelling of the Representative Test

The representative test is modelled using Forge® NxT 2.1. The symmetry of the experiment (see Figure 1) allows meshing on only one eighth of the sample, to reduce the computation time. The mirror planes used in the FEM-modelling of the experiment are presented in Figure 4.
A convergence study allows the definition of an overall meshing size of 0.5 mm for the sample. The tools are considered rigid in the simulation and the contact with the deformable body are modelled using unilateral contacts with friction behaviour modelled by a Tresca-limited Coulomb law.
The parameter identification of the simulation used to assess the representativeness of the test is performed by comparing measured and numerically calculated temperatures on the skin of the formed sample. The complex geometry of tools and the different modes of flow involved in the test make difficult to identify the friction factor using comparison with sample geometry. A unique friction coefficient is thus used and consistent with the existing magnitudes applied in similar configurations. Given that the representative test is performed without lubricant, a coefficient m = 0.8 is proposed in the database of Forge® NxT 2.1. This value will thus be used as reference value to carry out FEM modelling of the representative test. For comparison, a coefficient m = 0.7 is used in FEM modelling of similar test configurations after ring test identification by Kukuryk [11]. The identified set of parameters appears in Table 6.
Concerning the thermal exchange parameters, a constant emissivity of 0.88 is used for the thermal exchange by radiation. For the other exchange parameters, Figure 5 presents a good correlation between thermal measurements of the maximum temperature on the free and on the forged side of the sample and the maximum temperature computed on the skin of the sample in the formed area.
The measurement areas can be found in Figure 6. The maximum computed temperatures are obtained on a line located on the whole external quadrant of the sample. The experimental measurements presented here are the mean value of the maximum temperatures measured with a thermal camera on the surfaces of samples during testing. The two measurement areas are located in the vicinity of the two ends of the external quadrant of the part on the free and the forged areas of the part. The forged area means here the last area of the part that was in contact with the anvils before measurement.
The selected parameters are thus validated to estimate the representative fields obtained at the core of the sample during the representative test. Evaluation of representativeness and adaptation of the experimental configuration can then be performed.

3. Validation and Calibration of Thermomechanical Field Reproduction

3.1. Validation Criteria

The validation of the representative test is based on comparing of the representative field values obtained via the FEM modelling of the rolling mill and via the FEM modelling of the representative test. A criterion for comparison is selected for each type of field as follows.
The temperature comparison is performed by evaluating the minimal temperature in each simulation. Concerning the effective strain, the amplitude for each stand is used as a comparison criterion. The triaxiality level reproduction is evaluated by comparing the mean value of triaxiality over the strain path of each stand. Eventually, the amplitude of the hydrostatic integration Q is used to compare the forming paths.
The evaluation for each stand of the effective strain amplitude and Q amplitude supplies information on the contribution of each forming stand on the void closure, linking in particular the evolution of these parameters with each forming direction involved. It permits an accurate experimental simulation of the evolution of defects, considering the change of the forming direction which has an impact on the study of the previously healed void and of cavity evolution in the vicinity of inclusions.

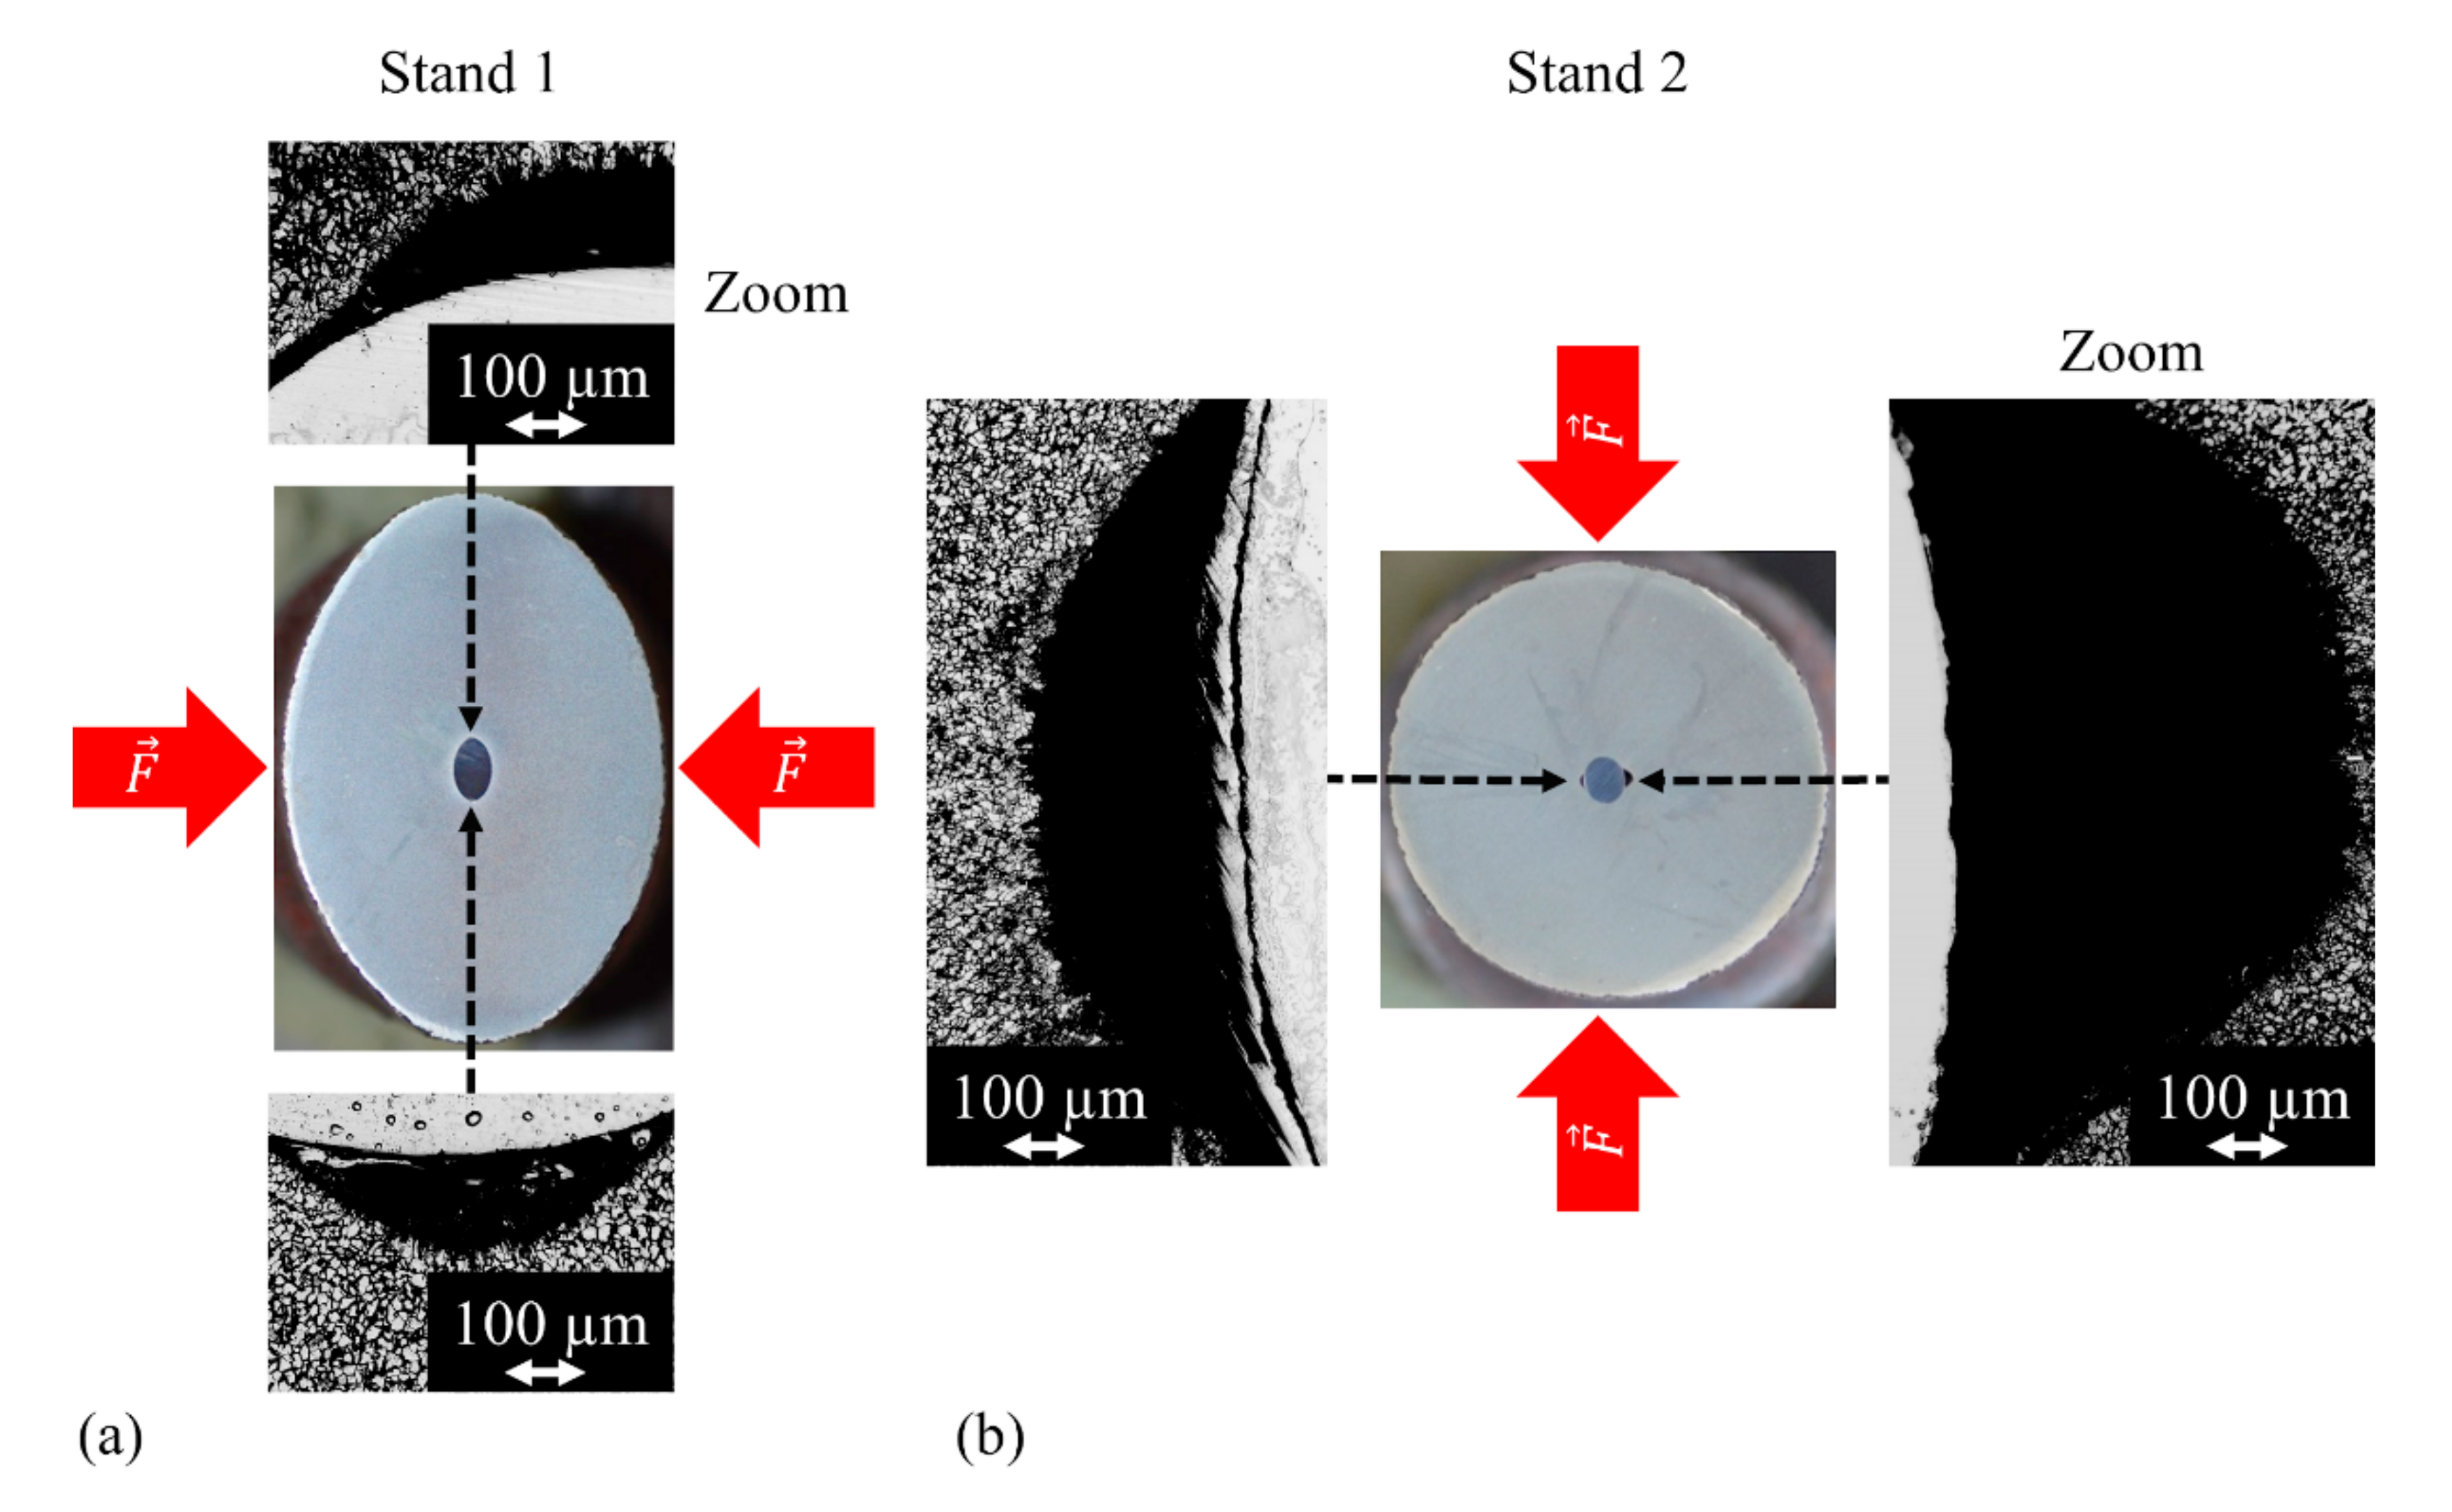
3.2. Experimental Data

The corrected experimental values used to reproduce the representative fields lie in Table 7 and are displayed with their initial values.
This correction is mainly reached by modifying the effective strain amplitude of the representative test via a gap modification. No variation of the lubrication condition was necessary to improve the representativeness of the experimental test. The effect of the adjustment and its consequences on the subsequent stand is evaluated after each step, using FEM modelling to improve the reproduction of the effective strain’s amplitude level.

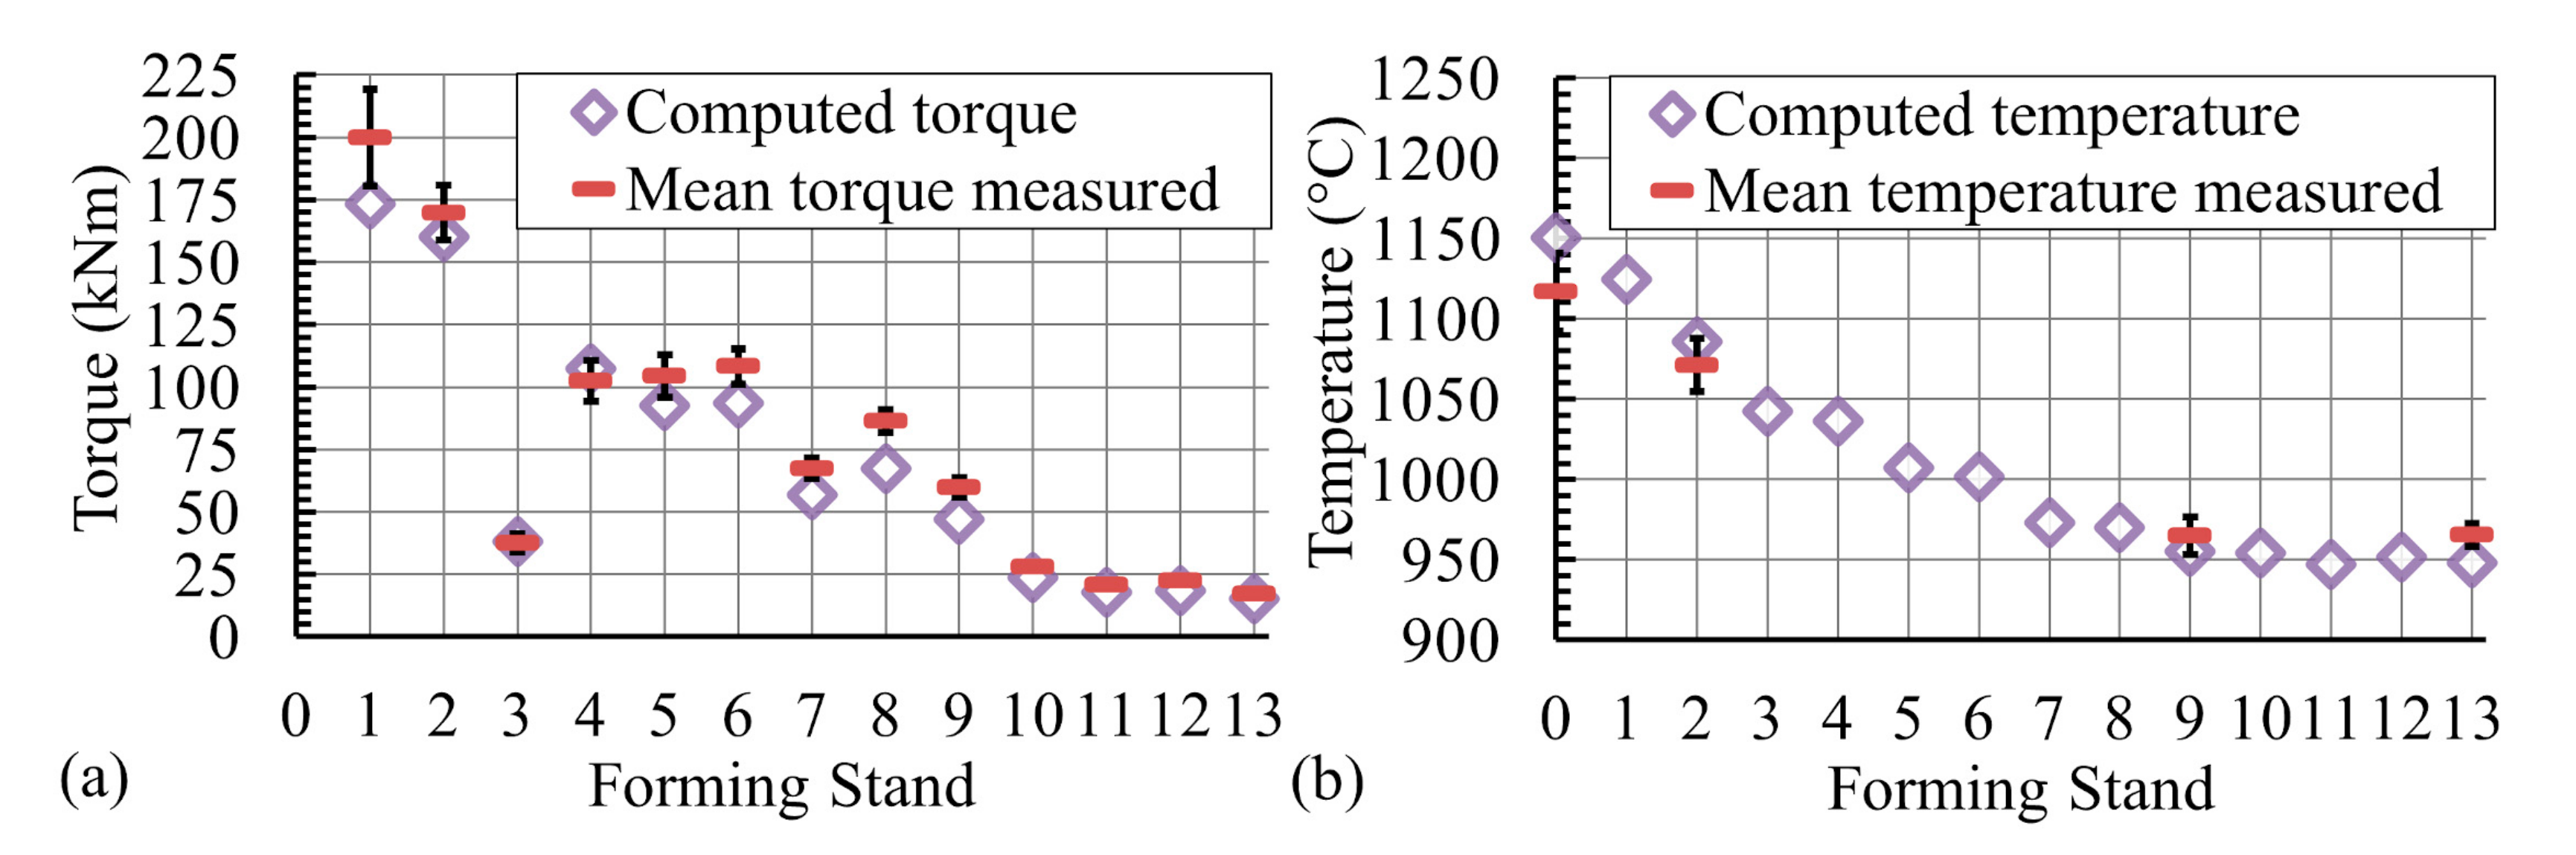
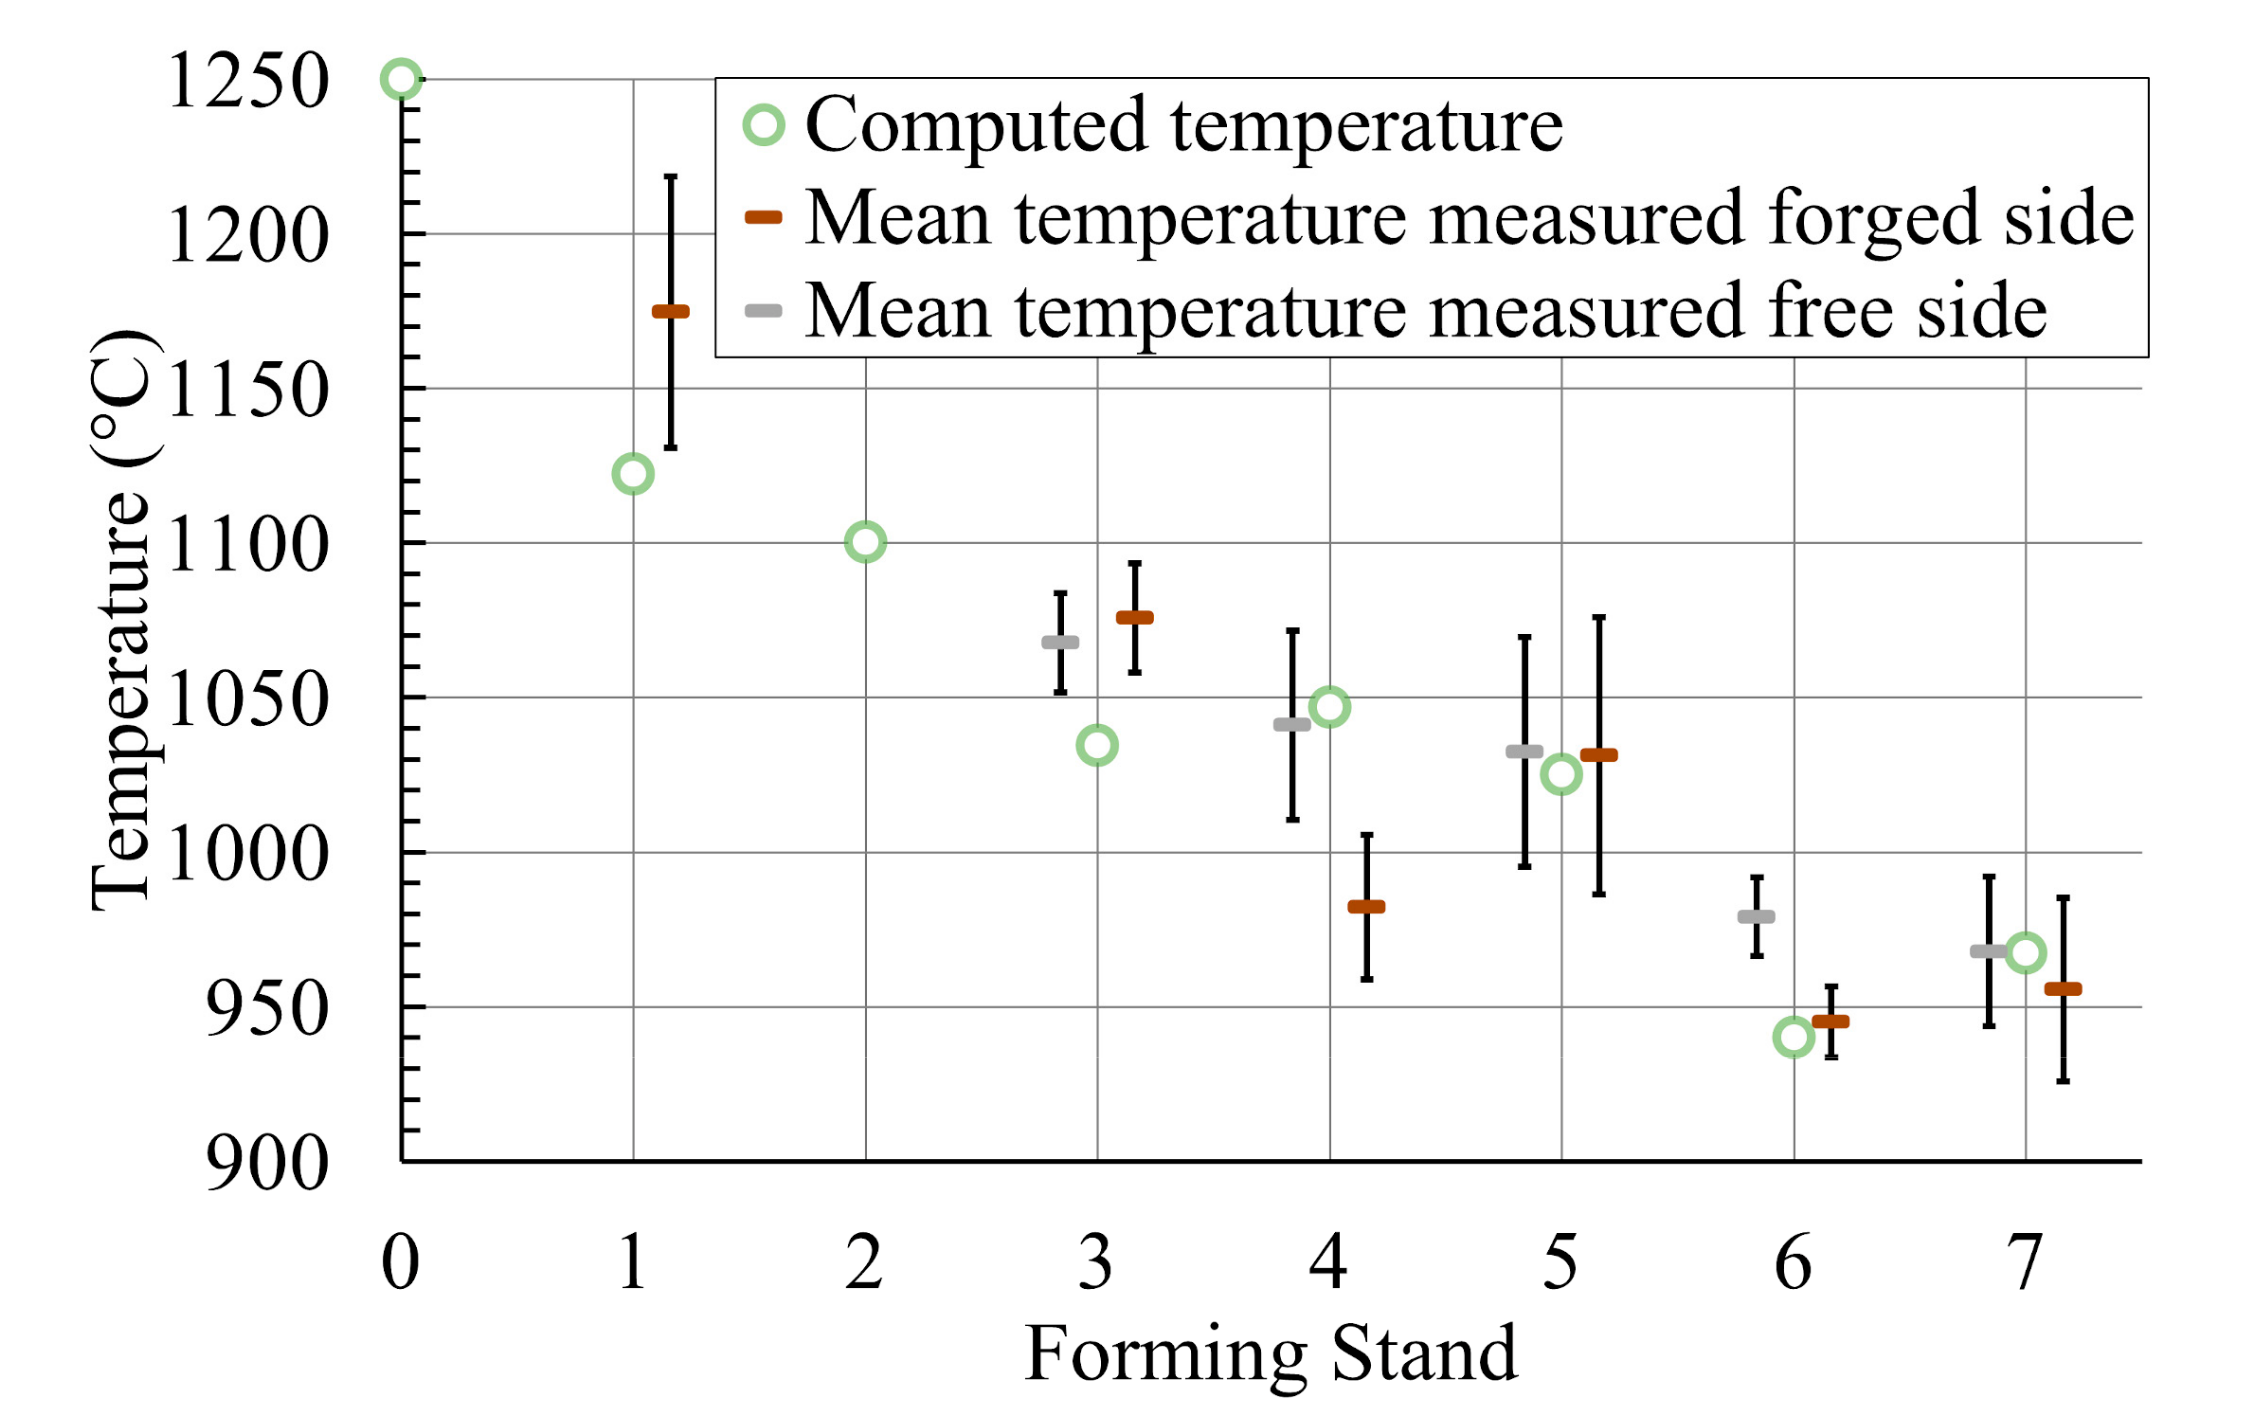
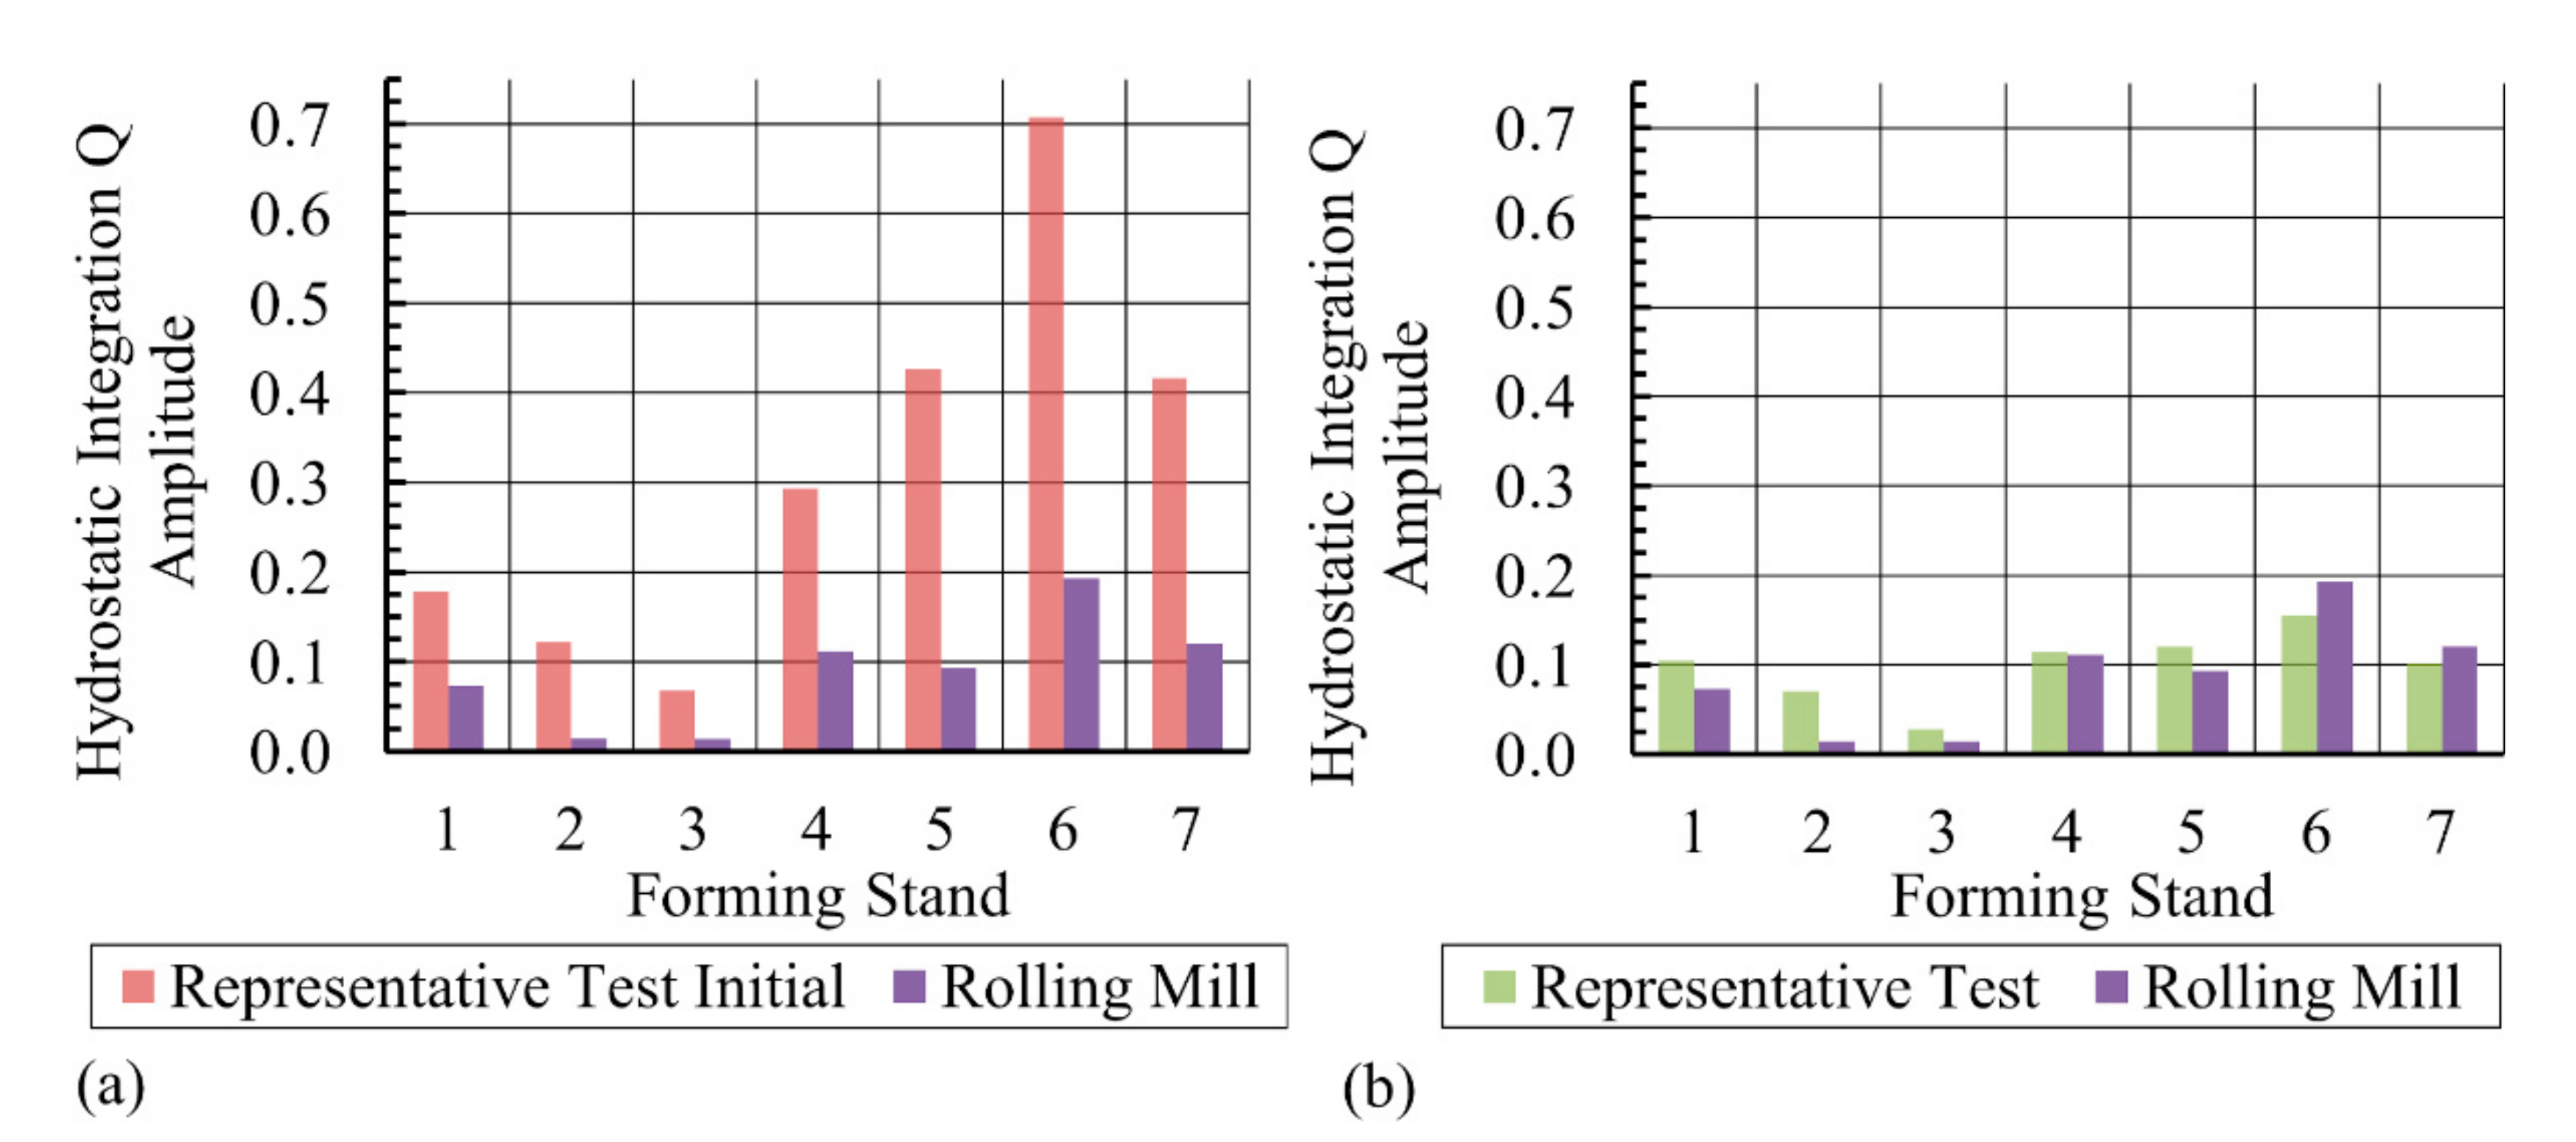
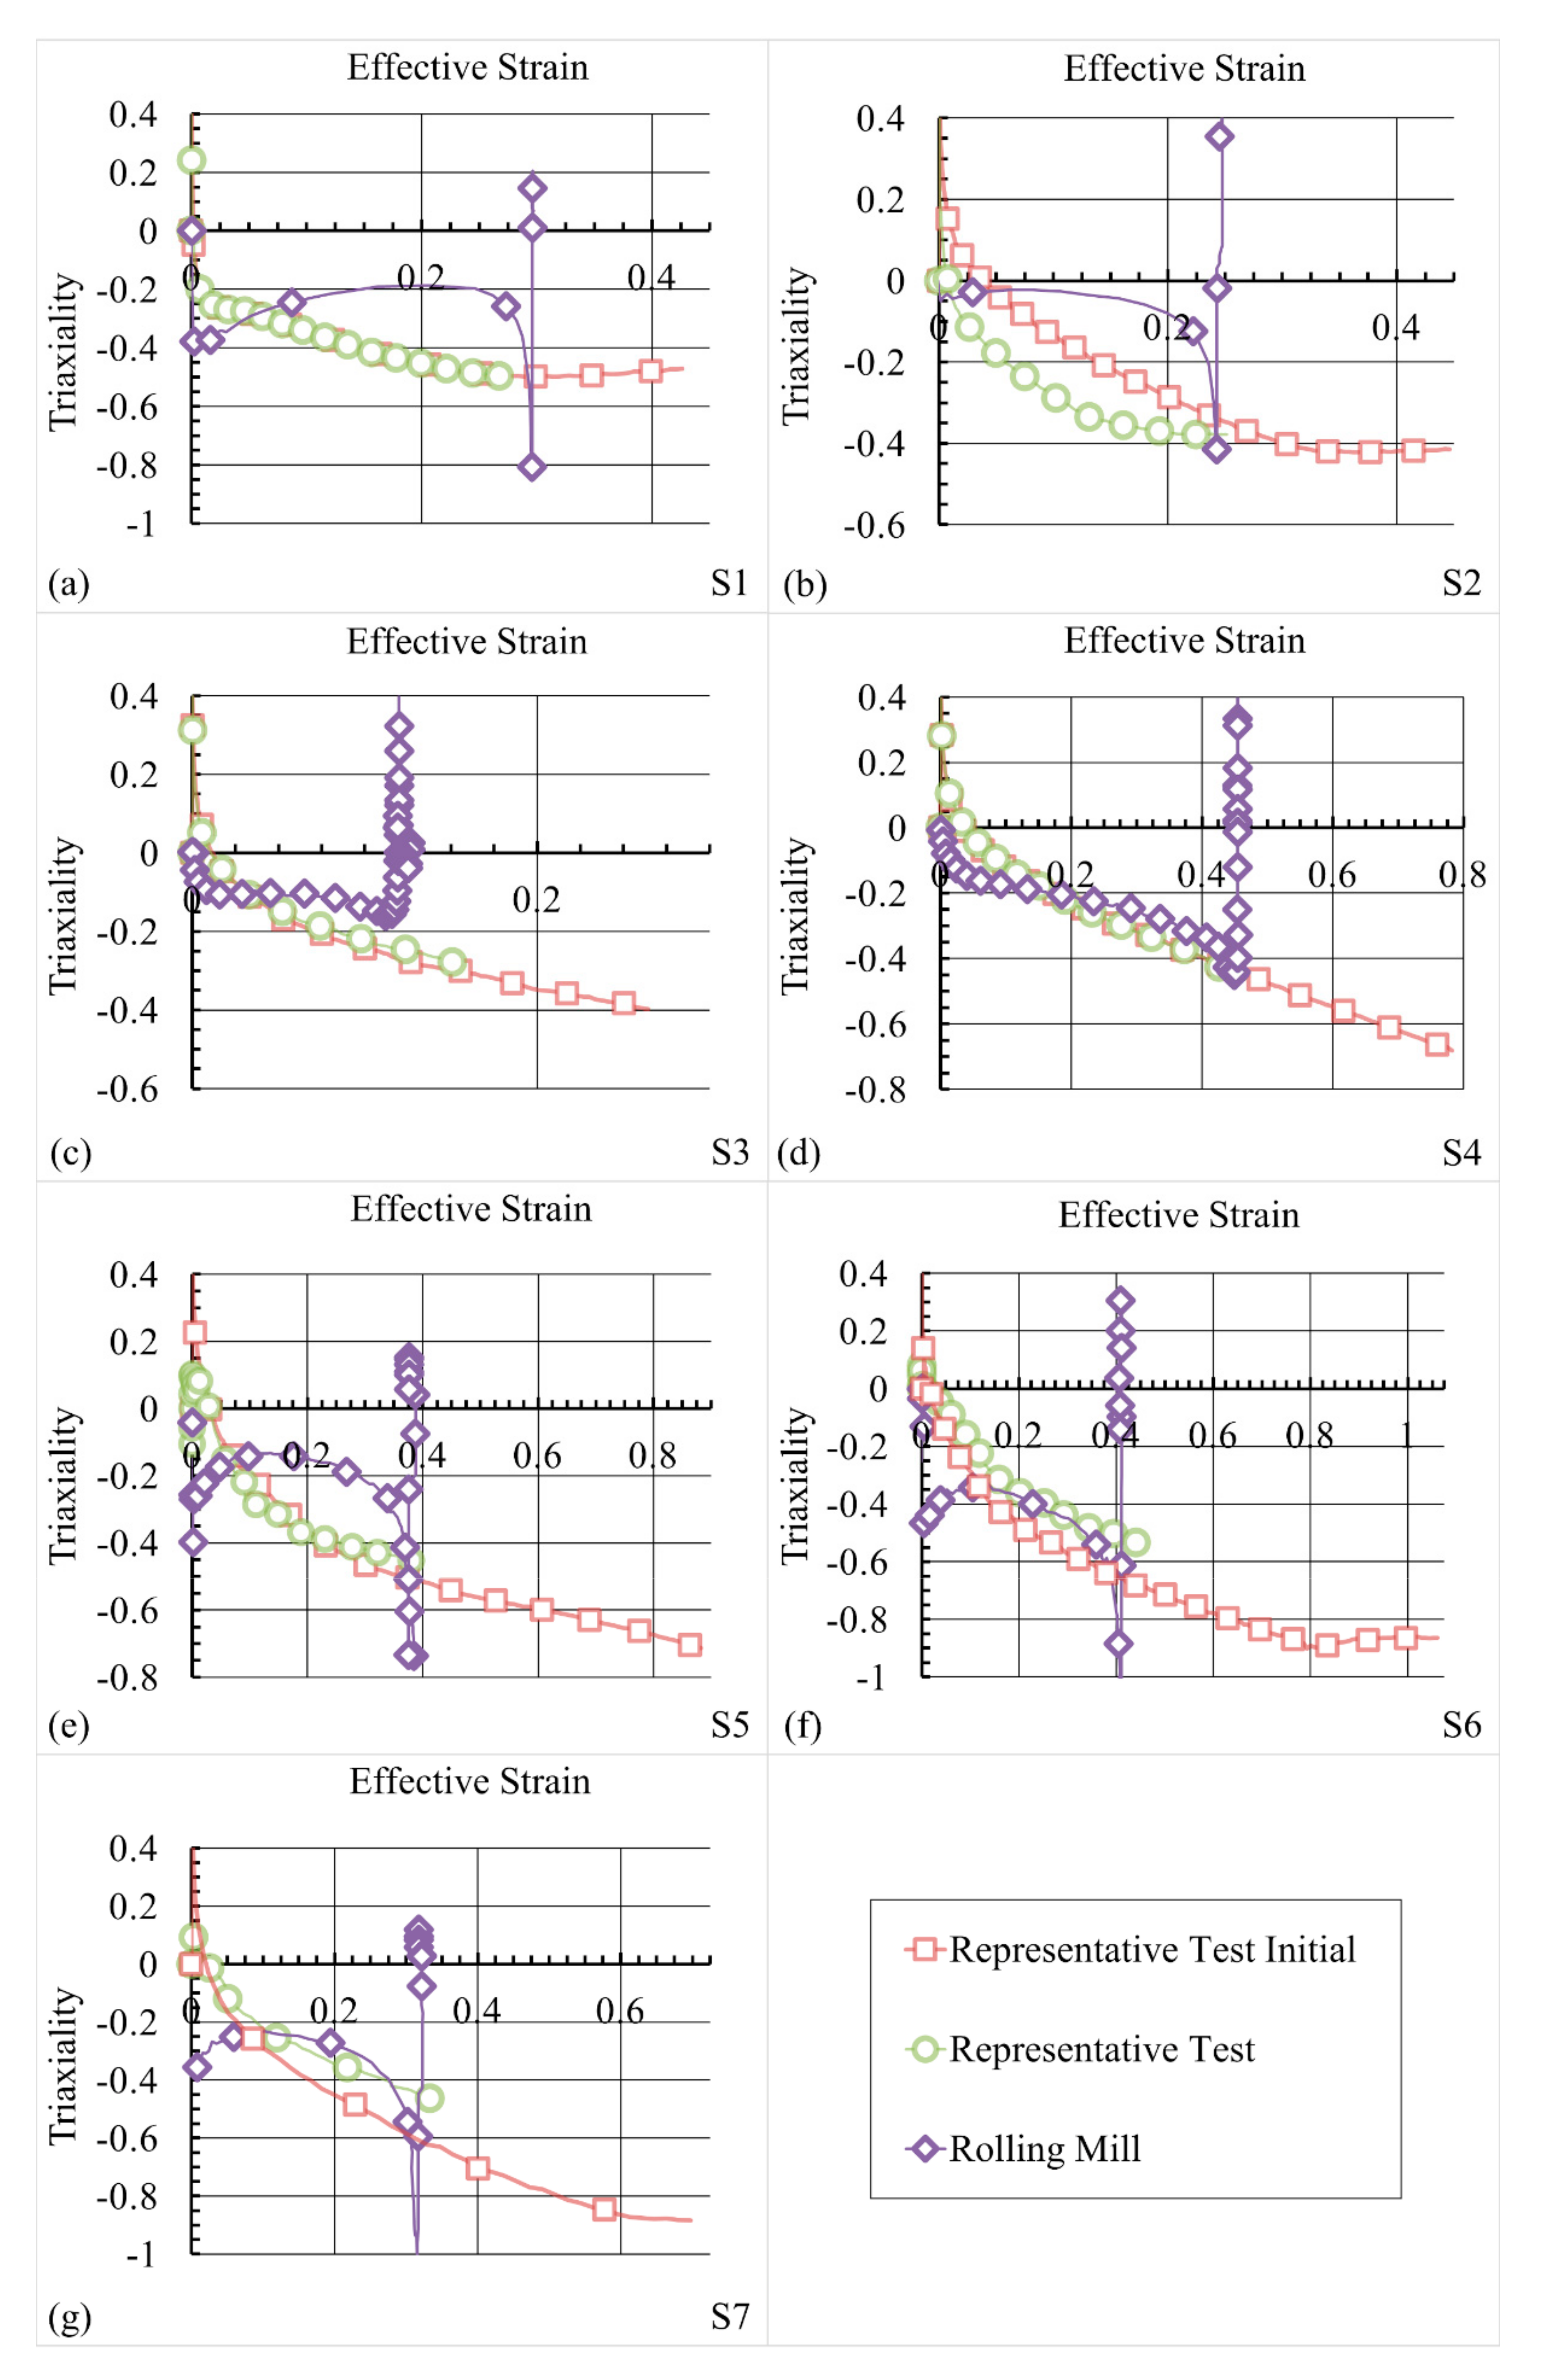
3.3. Representatives Field Comparison Results

The comparison of the representative fields before and after the correction of the representative test configuration is presented below through the comparison of temperature effective strain amplitude, mean triaxiality and hydrostatic integration amplitude at the core of the sample.
The temperature comparisons presented in Figure 7a,b show discrepancies at the core of the sample despite the configuration corrections, with a 16.3% lower temperature at the end of the corrected representative test. This difference is attributable to the reduced scale of sample, which causes a faster cooling of the central area. The modified configuration (Figure 7b) presents a slight improvement of the final core temperature by comparison with the initial settings (Figure 7a), which displays a 17.4% lower temperature at the end of the experiment. This difference is explained by the reduction of the contact time and of the contact surface between the anvils and the sample on the modified configuration.
Concerning the effective strain, the comparison Figure 8b shows a good agreement between the simulation of the rolling and of the reduced scale test. The mean absolute percentage deviation is in fact 6.1%.
This deviation was 96.6% in the initial configuration (see Figure 8a). These results highlight the direct influence of the modification of the experimental gaps on the effective strain amplitude reached during the representative test.
The width of the anvils of the representative test was limited to 10 mm in order to promote the elongation of the sample with respect to its transverse widening. This limited width combined with the shape reproduction of the anvil allows achieving a plastic strain at the center of the sample close to that at the heart of the bar during rolling. The average ratio between the axial (elongation) and the transverse (widening) strain at the center of the sample is about 2 with a minimum of about 1 for the third flat stand and is in good accordance with that of the rolling process.
The order of magnitude of the mean triaxiality level is likewise well reproduced on the representative test as presented in Figure 9b. Higher discrepancies are nevertheless noticeable before the third forming stand and especially for the second one which shows the higher difference, with an absolute difference of 0.22 in mean triaxiality level between the rolling mill and representative test values. During the whole forming process, the mean absolute difference between the test and the rolling mill is 0.10 with a relative standard deviation of 0.71. This value is 0.21 with a relative standard deviation of 0.30 in the initial configuration. Concerning the latter settings, it is evident in Figure 9a that the initial configuration seems to reproduce the same evolution of the mean triaxiality level encountered on the rolling mill with a higher compressive level. This tendency is confirmed by the weaker relative standard deviation observed in the difference in this configuration by contrast with the corrected settings values. Regarding the corrected experiment, the modification of the gap in the first stands does not affect the mean triaxiality level reached. The analysis of the triaxiality levels during the strain paths is detailed below.
Regarding the Q level between the two processes, an overestimation of Q is generally observed during the test. This overestimation is especially noticeable at the beginning of the forming process, as indicated in Figure 10b, with the higher discrepancies identified during the second forming stand. The overall Q level is thus higher during the corrected representative test compared with the rolling process, with Q = 0.69 and Q = 0.62, respectively. Therefore, the representative test seems more favourable in terms of void closure potential. The overall Q value of the initial configuration was Q = 2.21. Concerning the amplitude per stand, these values present, in the corrected configuration, a mean absolute difference of 0.03 with a relative standard deviation of 0.65. The maximum absolute deviation encountered throughout this process has a magnitude of 0.06, reached during the second stand. These levels are 0.23, 0.72 and 0.51 for the maximum deviation achieved during the sixth stand for the initial test configuration (see Figure 10a).
Despite the discrepancies observed in triaxiality levels, the modification of the experimental gaps allows a significant improvement of the Q level reproduction when the effective strain amplitude level reproduction is enhanced.
The triaxiality level over the effective strain level is detailed in Figure 11 for the modelling of the rolling and of the representative test before and after correction during the whole forming process. During the first two rolling passes of the industrial rolling, the stress triaxiality exhibits two minima located at the beginning and at the end of the forming path (see Figure 11a,b). These minima frame a larger area in which the compressive state is relatively moderate. For the representative test, the triaxiality evolution is an increasing function of the plastic strain all over the forming path. As a consequence, the mean value of the triaxiality and the Q factor calculated for the representative test may be higher than that of the industrial rolling process for stands experiencing slightly compressive triaxiality, which has as a consequence the overestimation of Q using the initial settings of the test. The same features are observed for the last three stands, in Figure 11e–g but to a lesser extent. The Figure 11c,d show a good correlation of the triaxiality evolution between the representative test and the rolling for the third and the fourth stand (see Figure 11c,d).

3.4. Discussion

The representativeness of the test is limited due to the discrepancy of the minimum temperature reached at the end of the reduced scale test. This limitation is nevertheless not critical, considering that the core of the sample stays approximately in the range of 1000 °C–1200 °C. No influence of this range of temperature on the bonding strength for low alloyed steel at the prior internal surface of healed void has in fact been identified by Hibbe and Hirt [5]. This phenomenon is important in the study of void closure during processes involving the modification of the forming direction between stands. In fact, this property is important for evaluating the potential reopening of closed voids when the forming direction is applied collinear to a welded interface generated at the previous stage. In the case of the study of the evolution of inclusion, the temperature can be important because it can influence the flow stress ratio between the inclusion and the matrix. To improve the representativeness of the test with regards to this phenomenon, tool heating of the anvils can be considered. However, this modification must be integrated into the global representative test design and validation protocol. The addition of heating can in fact affect the thermal gradient in the sample and may influence the triaxiality, the Q level and the plastic strain fields in the sample. A higher thermal gradient had indeed been identified by Ståhlberg and Keife [6] as a driving parameter of the closing of internal voids. The preheating temperature can be set up to some hundreds of degrees Celsius with anvils made of tool steel.
Regarding the thermomechanical reference path, the representative test is able, after correction, to reproduce the effective strain magnitude with good accuracy. A mean absolute percentage deviation of 6.1% is in fact calculated between the modelling of the rolling and the modelling of the test. The reproduction of this reference field is therefore well suited for the study of matrix material behaviour in the vicinity of inclusions.
Concerning the mean triaxiality level, the representative test reproduces the global variation of triaxiality, except for the second stand, which presents a higher difference with regard to the value calculated during the rolling process. This forming step presents a slightly compressive triaxiality that cannot be reproduced in the representative test, using shaped anvils while simultaneously reproducing the effective strain amplitude. All along the forming path, the mean absolute difference in the mean triaxiality level is 0.10, which limits the quantitative interpretation of defect evolution during the hot rolling process based on its reproduction in the reduced scale test. A sensitivity study of void volume evolution to the triaxiality performed by Saby et al. [2] on FEM modelling using representative volume elements (RVE) tends, however, to show that such magnitude of difference has only a slight influence on void volume evolution during the forming pass if the main axis of the defect is collinear to the principal deformation direction. In our case, the common morphology of shrinkage porosity is in accordance with this assumption, which tends to limit the impact of the observed discrepancies on the result of the test in this specific case. In addition, the mean triaxiality level encountered during the strain path of the test covers the interval [−0.38, −0.17] without performing any effort on the design of tool geometry to enlarge the range of triaxiality achievable. By comparison, Saby et al. [2] define in their work a triaxiality interval of [−1, 0] as representative of the most common hot rolling and hot forging processes.
Regarding the hydrostatic integration Q, the amplitude is generally higher in the representative test due to the distribution of the triaxiality level over the effective strain. In the case of the rolling process, the lowest triaxiality levels are reached during a short portion of the forming path. This localisation of encountered extremes values highly influencing the Q level observed. This last limitation tends also to orient the study of the qualitative analysis of defect evolution during the rolling using the representative test.
The reproduction of the equivalent strain magnitude and the mean triaxiality order of magnitude with the alternation of the forming direction approaching industrial conditions tends, however, to provide an experimental platform, reproducing complex forming route conditions with a high level of representativeness.
Regarding the results obtained in the last two representative fields analysed, the discrepancies obtained are also a consequence of focusing on effective strain reproduction as a correcting factor of the test configuration instead of triaxiality or hydrostatic integration Q. An improvement of these fields can be achieved by degrading the reproduction of the effective strain amplitude. The complex evolution of triaxiality over the effective strain curve observed during the rolling process tends to direct the choice of the hydrostatic integration Q as the reference parameter to reproduce that will improve the global representativeness of the test. This enhancement will in fact increase the representativeness of the test with respect to the void evolution study. Thus, the choice of the field of reference used to correct the configuration of the experiment must be in accordance with the studied phenomenon.
The initial assumption behind using 1:10 scale shaped anvils also presents a limitation of the test. This choice permits to reproduce lateral limitation of the spread of the material experienced due to groove morphology. This contribution is especially observed on grooves involved in the fourth to seventh stands of forming as presented in Figure 11 with the occurrence of high compressive conditions. They present in fact the lower triaxiality levels reached during the test, especially on the initial configuration, due to the occurrence of the restriction of the lateral flow as a consequence of their morphology (see Figure 1). These anvil shapes have a positive effect on the reproduction of the reference thermomechanical path of the industrial hot-rolling operations studied. However, the initial choice of geometry restricts a possible improvement of the range of the reference fields that can be reached by using more suitable groove geometry, especially limiting the application of the test on other hot forming process. The use of standard anvils suited for specific effective strain levels and low levels of triaxiality is preferable for improving the representativeness of the test by extending the reachable values of reference fields. In similar configurations of testing, Kukuryk [11] highlights the generation of favourable compressive states using V-shaped anvils. Using standard geometry can thus be a solution for enlarging the triaxiality range reached by the representative test. It can also enhance the possibility that the experiments would reproduce complex forming routes on the representative test developed and enhance the representativeness of the Q level achieved during the test without altering the other results. The consequence of such standard tooling will be to increase the complexity of the test design by the integration of tool-related parameters to reproduce reference forming paths as well as increasing the computation resources needed to optimise these parameters.
The restriction exposed in the paragraphs above must also be used carefully due to FEM discrepancies in the definition of the representative fields. The combination of this constraint with differences obtained in field reproduction restrains the use of the representative test to qualitative analysis of defect evolution during the analysed rolling process. However, the methodology of defining a representative test using an FEM-comparison allows for the establishment of an improved testing environment including alternation of forming directions and thermomechanical fields approaching industrial forming processes. The thermomechanical paths are sufficiently close to consider with confidence the transposition of the results obtained with the representative test to the industrial rolling process. For example, a void closing model identified by using the representative test should be valid for simulating void evolution during the hot rolling of bars.

4. Application

An experiment using drilled cylindrical voids with 3 mm diameter and 50 mm depth has been performed on the cylindrical samples used for the representative test. These holes are filled with stainless-steel rods to represent the occurrence of a defect at the core of the sample as the initial state of the representative test. The selected defect dimension is thus representing a ratio of the diameter ion of the defect over the diameter of the cylindrical sample of 0.11. The sample containing a stainless-steel bar is described in Figure 12. The hole is placed at the centre of the sample where the thermomechanical loading is representative of the loading observed at the core of the bar during rolling. It means that the test is only representative for the study of defects placed in the centre of the bars during rolling.
The initial experimental configuration is used at 1000 °C to maximise the flow stress ratio between the low alloyed steels used for the sample and the stainless-steel defect. This experiment is thus used to model the behaviour of the matrix material surrounding a hard-ductile inclusion which presents no bounding with the matrix material. In this case, the relative plasticity index value is approximatively 2.5. Figure 13 represents the sample section after the first two forming stands with a focus on the centre of the section of the sample. The forming direction for each observed stand is depicted by two opposite red arrows.
During the representative tests, the formation of a void in the surrounding of a hard inclusion is observed. Its shape is similar with matrix behaviour observed numerically by Luo [16] and during upsetting experiments on lead samples by Qi et al. [18] in the vicinity of hard inclusion and during cold rolling experiments on stainless-steel strips by Yu et al. [23] in the vicinity of hard inclusions.
Concerning the forming stands with higher effective strains, one can observe in Figure 14 the occurrence of a self-welding line at the extremity of the void generated in the vicinity of hard inclusions. The reduction of the void with the conservation of its general shape and the lengthening of the self-welding line are also in accordance with simulation results completed by Luo [16]. The representative test is thus able to reproduce the phenomenon of void opening and self-welding in a unique forming stand without changing the direction of forming when the effective strain amplitude and the Q level of the forming stand reach an adequate point. In the studied case, these conditions are met by the fourth stand where the square shape of the anvils allows the sample to reach high values of plastic strain and Q (see Figure 10b). This highlights the relevancy of reproducing the industrial stand shapes.
It is interesting to notice that a healing of the initial void, opened in the first stand, occurs as a second perpendicular forming operation is carried out as seen in Figure 13b. The interest in using alternated forming directions is thus confirmed in experimental configurations to identify and characterise specific phenomena occurring in multidirectional forming processes. This phenomenon is in fact absent in single direction forming when the increase of the effective strain leads to a self-welding line around the hard inclusion, as seen before.
The use of an original defect with a void to sample ratio of 0.11 limits the direct extrapolation of the results to the industrial rolling where a ratio of 0.01 would be more realistic. It yet gives a good depiction of the plastic behaviour in the surrounding of hard inclusion under representative thermomechanical loading.

5. Conclusions

This study presents the design process of an experimental test dedicated to the analysis of the internal defect evolution during the hot rolling process with a high degree of representativeness. This methodology is based on the identification and reproduction of the thermomechanical fields driving the evolution of the defect under study. In the case of a void evolution study, the reference fields are the effective strain, the triaxiality level during the forming path and the hydrostatic integration Q.
The application of the experimental test design to an industrial rolling process of bars shows the ability of the test to reproduce the representative fields in the same order of magnitude as the one present during the industrial process. Despite the discrepancies between the representative fields generated by the test and by the industrial process, the orders of magnitude achievement and the alternation of the forming direction allow for reproduction of the main defect phenomena. Defect evolution models can be identified with the representative test under conditions close to that of the industrial process. To assess the capability of the designed test, an application was performed allowing the reproduction of void evolution mechanism in the vicinity of hard inclusion and thus highlighting the significance of realising a representative forming path by showing phenomena occurring in the case of alternated forming directions.

Author Contributions

C.P. performed the simulations, analysed the results and wrote the paper; L.L. supervised the work, implemented the methodology and co-wrote the paper; R.B. supervised the work, contributed to the funding acquisition and co-wrote the article; D.C. designed the experimental device and performed the testing. All authors have read and agreed to the published version of the manuscript.

Funding

This research was funded by the Association Nationale de la Recherche et de la Technologie (ANRT), grant number: CIFRE N° 2017/0839.

Acknowledgments

The authors are thankful to ISEETECH for the provision of the Vulcan 4.0 platform dedicated to forging tests.

Conflicts of Interest

The authors declare no conflict of interest.

References

  1. Lee, Y.S.; Lee, S.U.; Van Tyne, C.J.; Joo, B.D.; Moon, Y.H. Internal void closure during the forging of large cast ingots using a simulation approach. J. Mater. Process. Technol. 2011, 211, 1136–1145. [Google Scholar] [CrossRef]
  2. Saby, M.; Bouchard, P.-O.; Bernacki, M. A geometry-dependent model for void closure in hot metal forming. Finite Elem. Anal. Des. 2015, 105, 63–78. [Google Scholar] [CrossRef]
  3. Feng, C.; Cui, Z. A 3-D model for void evolution in viscous materials under large compressive deformation. Int. J. Plast. 2015, 74, 192–212. [Google Scholar] [CrossRef]
  4. Chbihi, A.; Bouchard, P.-O.; Bernacki, M.; Pino Muñoz, D. Influence of Lode angle on modelling of void closure in hot metal forming processes. Finite Elem. Anal. Des. 2017, 126, 13–25. [Google Scholar] [CrossRef]
  5. Hibbe, P.; Hirt, G. Analysis of the bond strength of voids closed by open-die forging. Int. J. Mater. Form. 2019. [Google Scholar] [CrossRef]
  6. Ståhlberg, U.; Keife, H. A study of hole closure in hot rolling as influenced by forced cooling. J. Mater. Process. Technol. 1992, 30, 131–135. [Google Scholar] [CrossRef]
  7. Tanaka, M.; Ono, S.; Tsuneno, M. Factors contributing to crushing of voids during forging. J. Jpn. Soc. Technol. Plast. 1986, 27, 927–934. [Google Scholar]
  8. Kakimoto, H.; Arikawa, T.; Takahashi, Y.; Tanaka, T.; Imaida, Y. Development of forging process design to close internal voids. J. Mater. Process. Technol. 2010, 210, 415–422. [Google Scholar] [CrossRef]
  9. Saby, M.; Bernacki, M.; Roux, E.; Bouchard, P.-O. Three-dimensional analysis of real void closure at the meso-scale during hot metal forming processes. Comput. Mater. Sci. 2013, 77, 194–201. [Google Scholar] [CrossRef]
  10. Nakasaki, M.; Takasu, I.; Utsunomiya, H. Application of hydrostatic integration parameter for free-forging and rolling. J. Mater. Process. Technol. 2006, 177, 521–524. [Google Scholar] [CrossRef]
  11. Kukuryk, M. Experimental and FEM analysis of void closure in the hot cogging process of tool steel. Metals 2019, 9, 538. [Google Scholar] [CrossRef] [Green Version]
  12. Feng, C.; Cui, Z.; Liu, M.; Shang, X.; Sui, D.; Liu, J. Investigation on the void closure efficiency in cogging processes of the large ingot by using a 3-D void evolution model. J. Mater. Process. Technol. 2016, 237, 371–385. [Google Scholar] [CrossRef]
  13. Banaszek, G.; Stefanik, A. Theoretical and laboratory modelling of the closure of metallurgical defects during forming of a forging. J. Mater. Process. Technol. 2006, 177, 238–242. [Google Scholar] [CrossRef]
  14. Luo, C.; Ståhlberg, U. Deformation of inclusions during hot rolling of steels. J. Mater. Process. Technol. 2001, 114, 87–97. [Google Scholar] [CrossRef]
  15. Ervasti, E.; Ståhlberg, U. Void initiation close to a macro-inclusion during single pass reductions in the hot rolling of steel slabs: A numerical study. J. Mater. Process. Technol. 2005, 170, 142–150. [Google Scholar] [CrossRef]
  16. Luo, C. Evolution of voids close to an inclusion in hot deformation of metals. Comput. Mater. Sci. 2001, 21, 360–374. [Google Scholar] [CrossRef]
  17. Park, C.Y.; Yang, D.Y. A study of void crushing in large forgings I: Bonding mechanism and estimation model for bonding efficiency. J. Mater. Process. Technol. 1996, 57, 129–140. [Google Scholar] [CrossRef]
  18. Qi, R.; Jin, M.; Liu, X.; Guo, B. Formation Mechanism of Inclusion Defects in Large Forged Pieces. J. Iron Steel Res. Int. 2016, 23, 531–538. [Google Scholar] [CrossRef]
  19. Kim, Y.; Cho, J.; Bae, W. Efficient forging process to improve the closing effect of the inner void on an ultra-large ingot. J. Mater. Process. Technol. 2011, 211, 1005–1013. [Google Scholar] [CrossRef]
  20. Faini, F.; Attanasio, A.; Ceretti, E. Experimental and FE analysis of void closure in hot rolling of stainless steel. J. Mater. Process. Technol. 2018, 259, 235–242. [Google Scholar] [CrossRef]
  21. Nalawade, R.S.; Puranik, A.J.; Balachandran, G.; Mahadik, K.N.; Balasubramanian, V. Simulation of hot rolling deformation at intermediate passes and its industrial validity. Int. J. Mech. Sci. 2013, 77, 8–16. [Google Scholar] [CrossRef]
  22. Chevalier, D.; Cezard, P.; Langlois, L.; Bigot, R. Modelization of the Rolling Mill with a FE Code. Key Eng. Mater. 2015, 651–653, 291–296. [Google Scholar] [CrossRef]
  23. Yu, H.; Bi, H.; Liu, X.; Chen, L.; Dong, N. Behavior of inclusions with weak adhesion to strip matrix during rolling using FEM. J. Mater. Process. Technol. 2009, 209, 4274–4280. [Google Scholar] [CrossRef]
Figure 1. (a) Schematic representation of the initial configuration of the representative test, (b) representative test anvils and (c) steel sample handled by a robotic arm during the experiment.
Metals 10 01035 g001
Figure 2. Meshing details and strategy of modelling of the industrial rolling of bars.
Metals 10 01035 g002
Figure 3. (a) Computed torques and (b) computed skin temperature versus measurements on an industrial rolling mill. The temperature of the forming stand 0 corresponds to the initial temperature just before stand 1.
Metals 10 01035 g003
Figure 4. Symmetry of the FEM-modelling of the representative test.
Metals 10 01035 g004
Figure 5. Maximum computed temperatures (reference parameter) and mean maximum temperature measured on the representative test.
Metals 10 01035 g005
Figure 6. Areas of temperature measurements on the representative test.
Metals 10 01035 g006
Figure 7. Comparison between the temperature calculated at the centre of the sample for (a) the initial representative test configuration and the rolling mill and (b) for the corrected representative test configuration and the rolling mill.
Metals 10 01035 g007
Figure 8. (a) Effective strain amplitude comparison between the initial representative test and the rolling mill simulations and (b) between the corrected representative test and the rolling mill simulations.
Metals 10 01035 g008
Figure 9. (a) Mean triaxiality level comparison between the initial representative test and the rolling mill and (b) between the corrected representative test and the rolling mill.
Metals 10 01035 g009
Figure 10. (a) Q amplitude per stand comparison between the initial representative test and the rolling mill and (b) between the corrected representative test and the rolling mill.
Metals 10 01035 g010
Figure 11. Triaxiality comparison between the initial representative test, the corrected representative test, and the rolling mill for (a) stand 1, (b) stand 2, (c) stand 3, (d) stand 4, (e) stand 5 (f) stand 6 and (g) stand 7 of rolling.
Metals 10 01035 g011
Figure 12. Experimental configuration: evolution of stainless-steel defect.
Metals 10 01035 g012
Figure 13. (a) Stainless-steel defect morphology after stand 1 of forming and (b) after stand 2 of forming (+90° rotation between forming stands).
Metals 10 01035 g013
Figure 14. (a) Stainless-steel defect morphology after stand 3 and (b) stainless-steel defect morphology after the stand 4 exhibiting bonding line.
Metals 10 01035 g014
Table 1. Manufacturing program of the rolling mill.
Forming StandGap (mm)
S125
S225
S3190
S439
S546
S612
S711
S812
S912
S1010
S115
S1211
S139
Table 2. Hensel-Spittel parameters of 41Cr4.
Am1m2m3m4
1620.466−0.00277−0.174240.1541−0.06497
Table 3. Reference parameters of the FEM modelling of rolling.
ParameterReference Value
Thermal exchange with air10 W∙m−2∙K−1
Thermal exchange with dies10 000 W∙m−2∙K−1
Friction coefficients µ/m0.4/0.8
Initial cooling time10 s
Table 4. FEM modelling parameters used for the parametric study.
ParameterInitial ValueModified Value
Thermal exchange with dies20,000 W∙m−2∙K−12000 W∙m−2∙K−1
Friction coefficients µ/m0.4/0.80.5/1
Table 5. Parametric study results: Field variation observed with modified friction and modified thermal exchange.
Forming StandFieldEvolution with Modified FrictionEvolution with Modified
Thermal Exchange
S7Skin temperature0.3%4.6%
Mean torque1.6%−10.9%
Min. core temperature−0.2%0.5%
Amplitude effective strain1.2%−1.3%
Min. triaxiality3.4%−12.0%
Amplitude Q2.6%−11.4%
Table 6. Reference parameters of the FEM modelling of the representative test.
ParameterReference Value
Thermal exchange with air10 W∙m−2∙K−1
Thermal exchange with dies2000 W∙m−2∙K−1
Friction coefficients µ/m0.4/0.8
Table 7. Experimental data of the representative test.
Forming StandS1S2S3S4S5S6S7
Initial
gap between upper and lower dies (mm)
2.52.51944.511
Corrected
gap between upper and lower dies (mm)
44.5217.5966.5

