Numerical Prediction and Reduction of Hat-Shaped Part Springback Made of Dual-Phase AHSS Steel


Abstract
1. Introduction
2. Materials and Methods
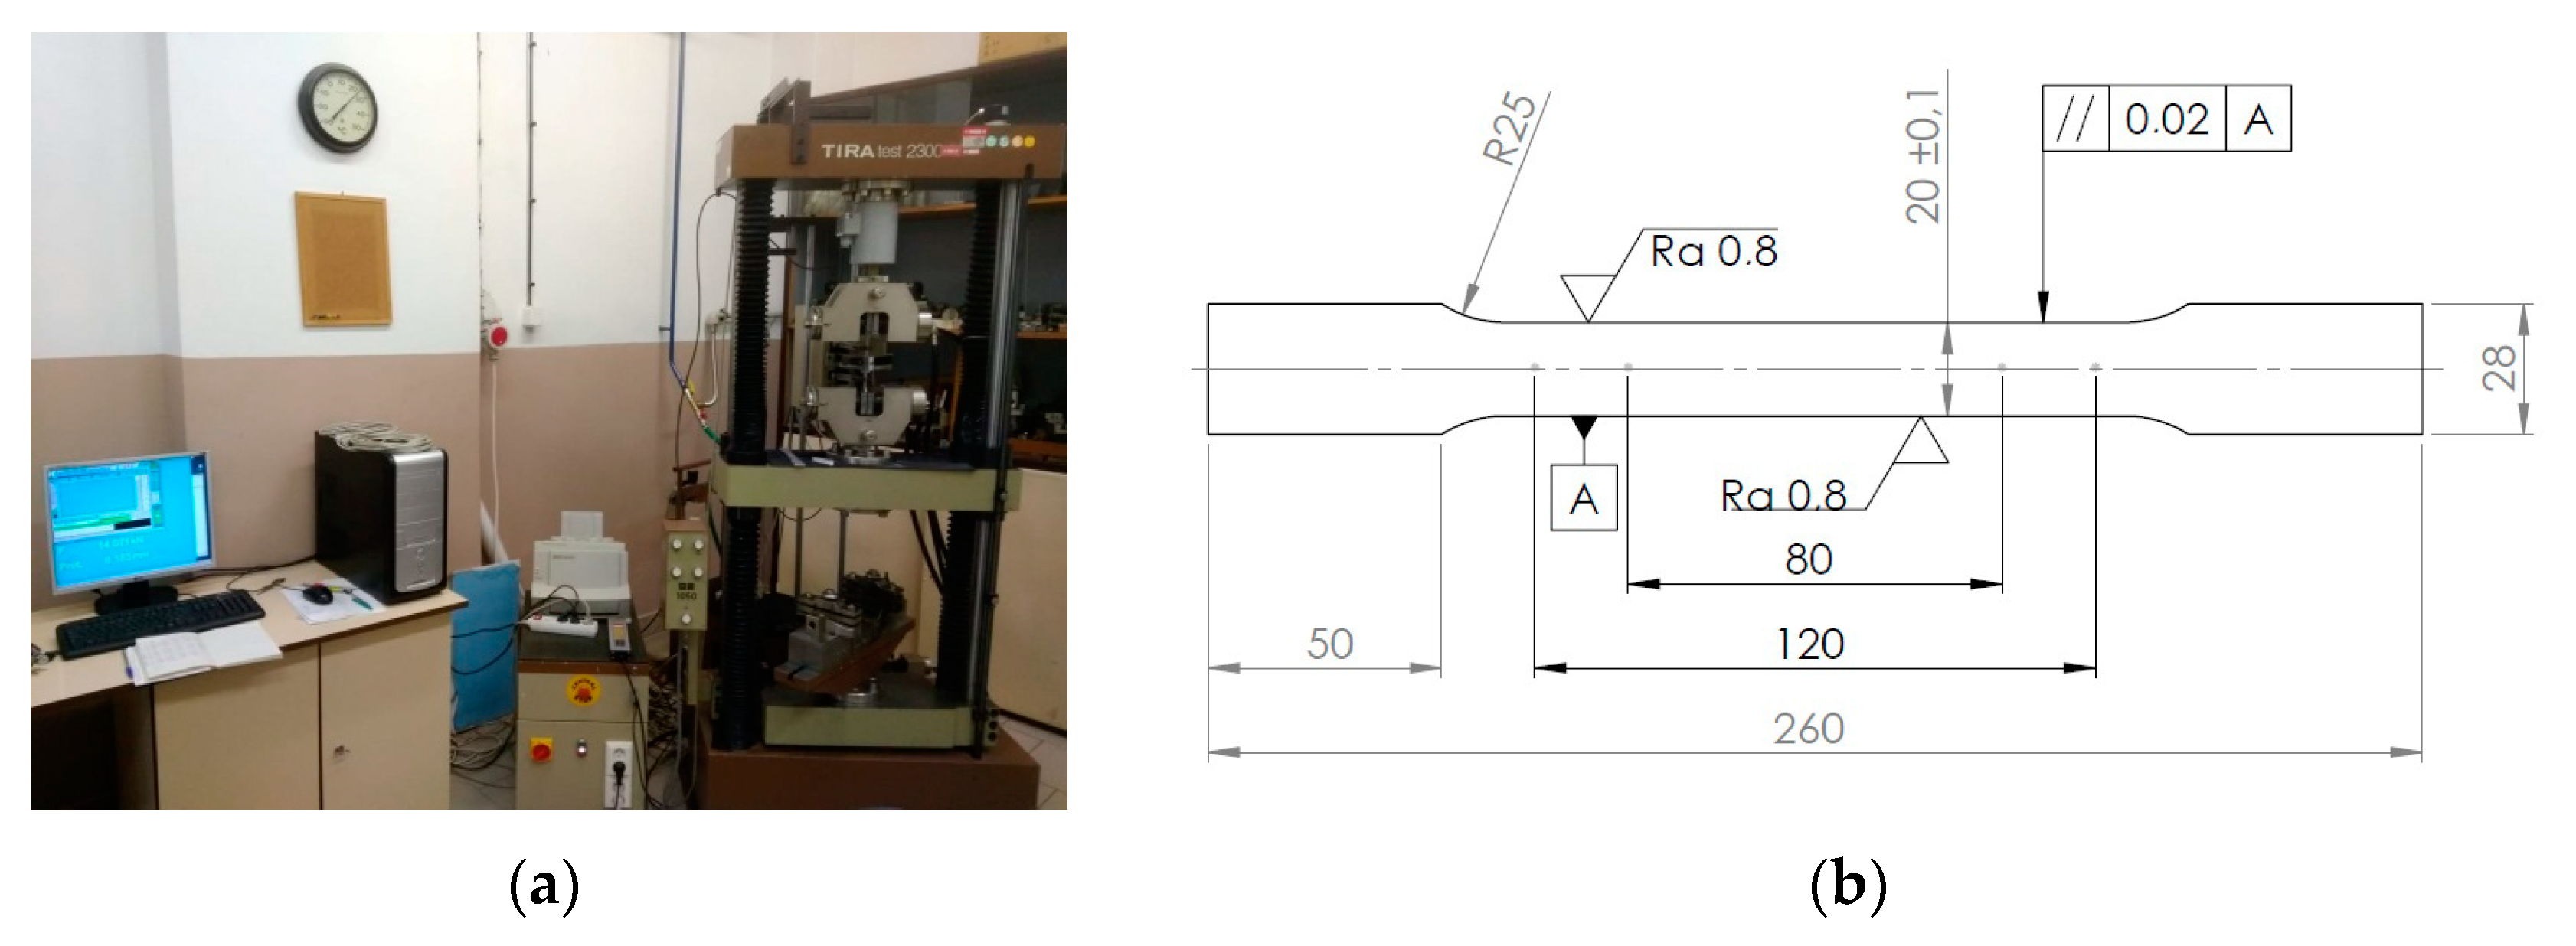
2.1. Material
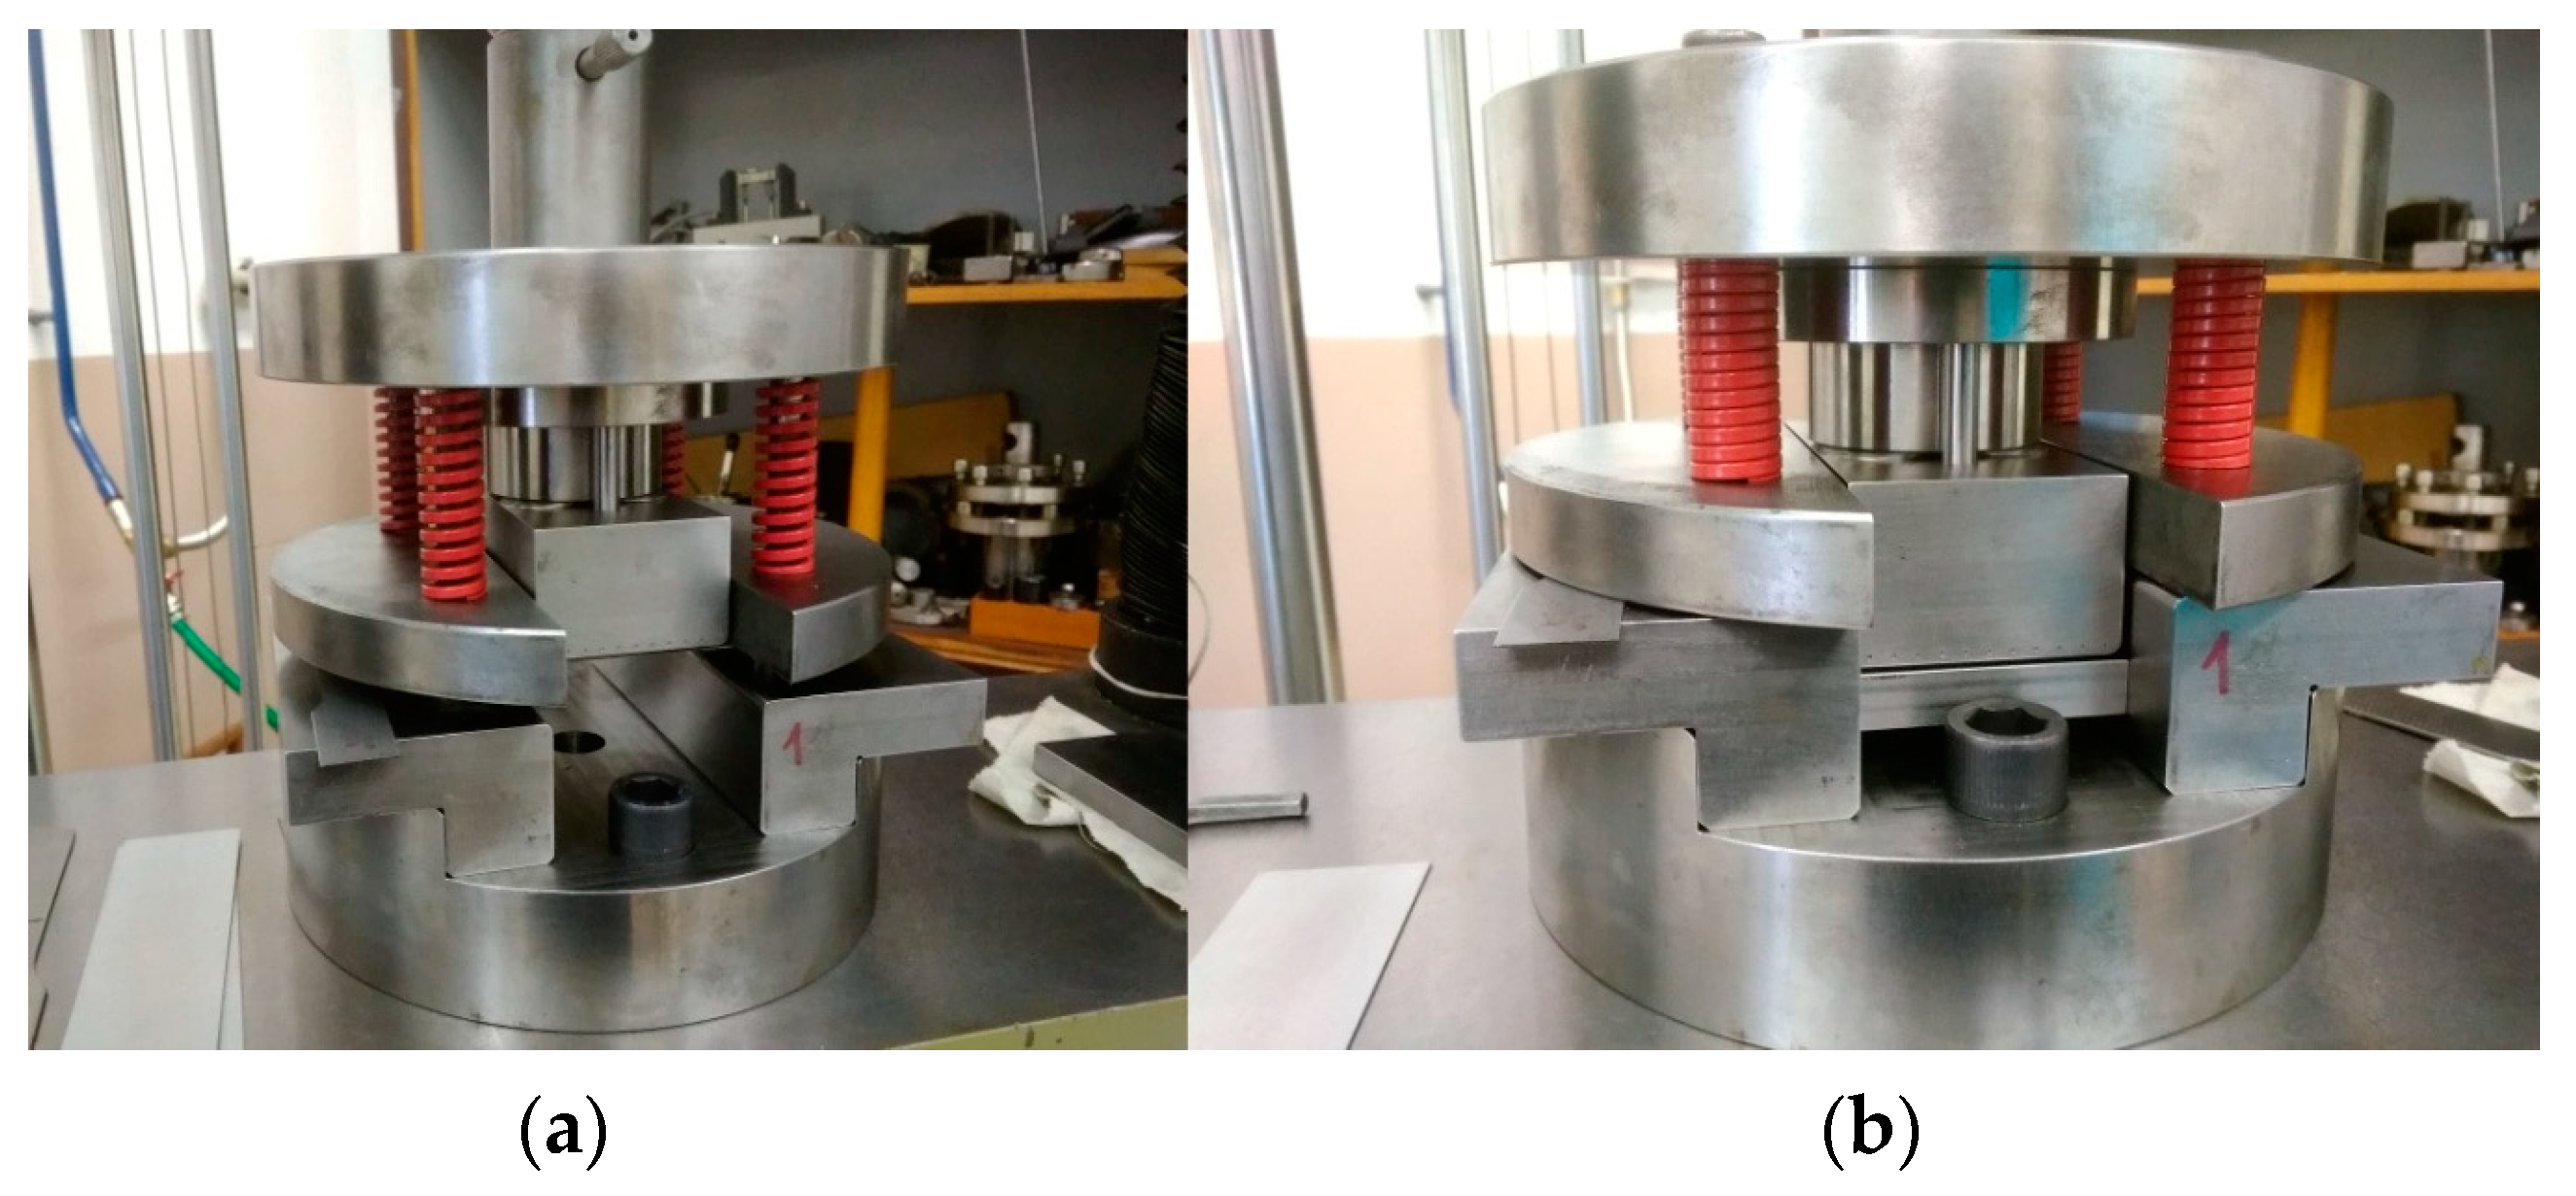
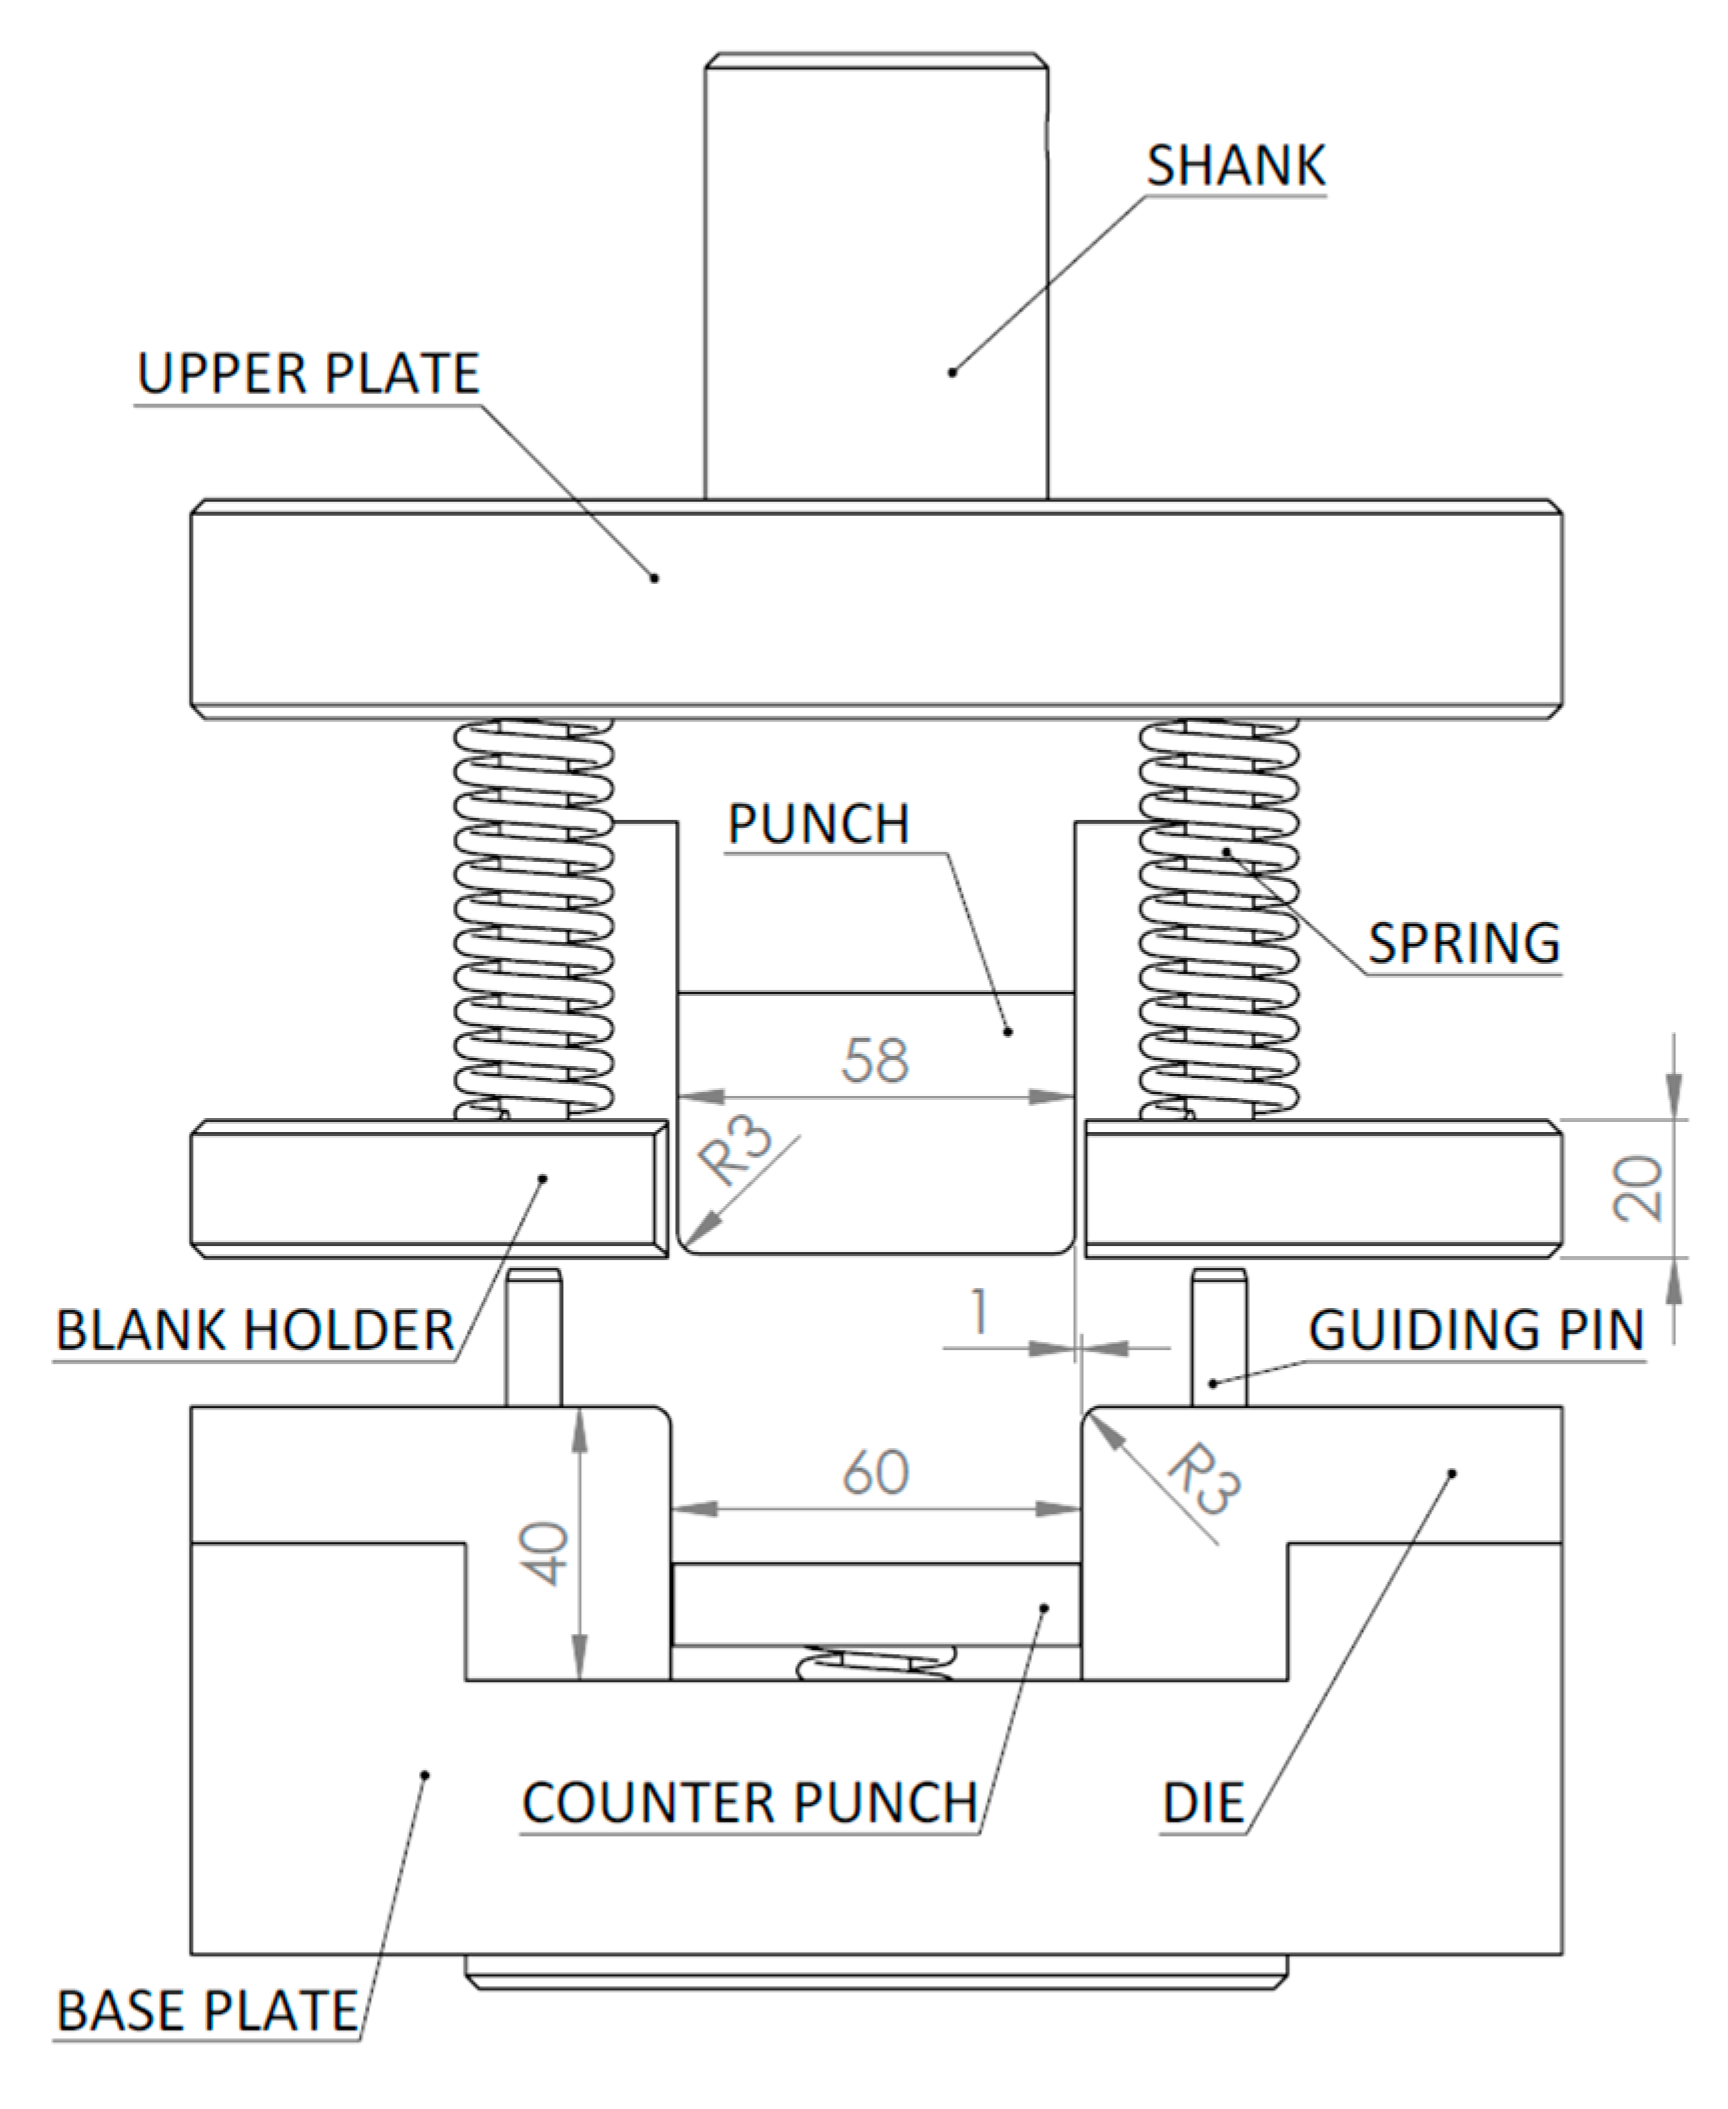
2.2. Experimental Setup
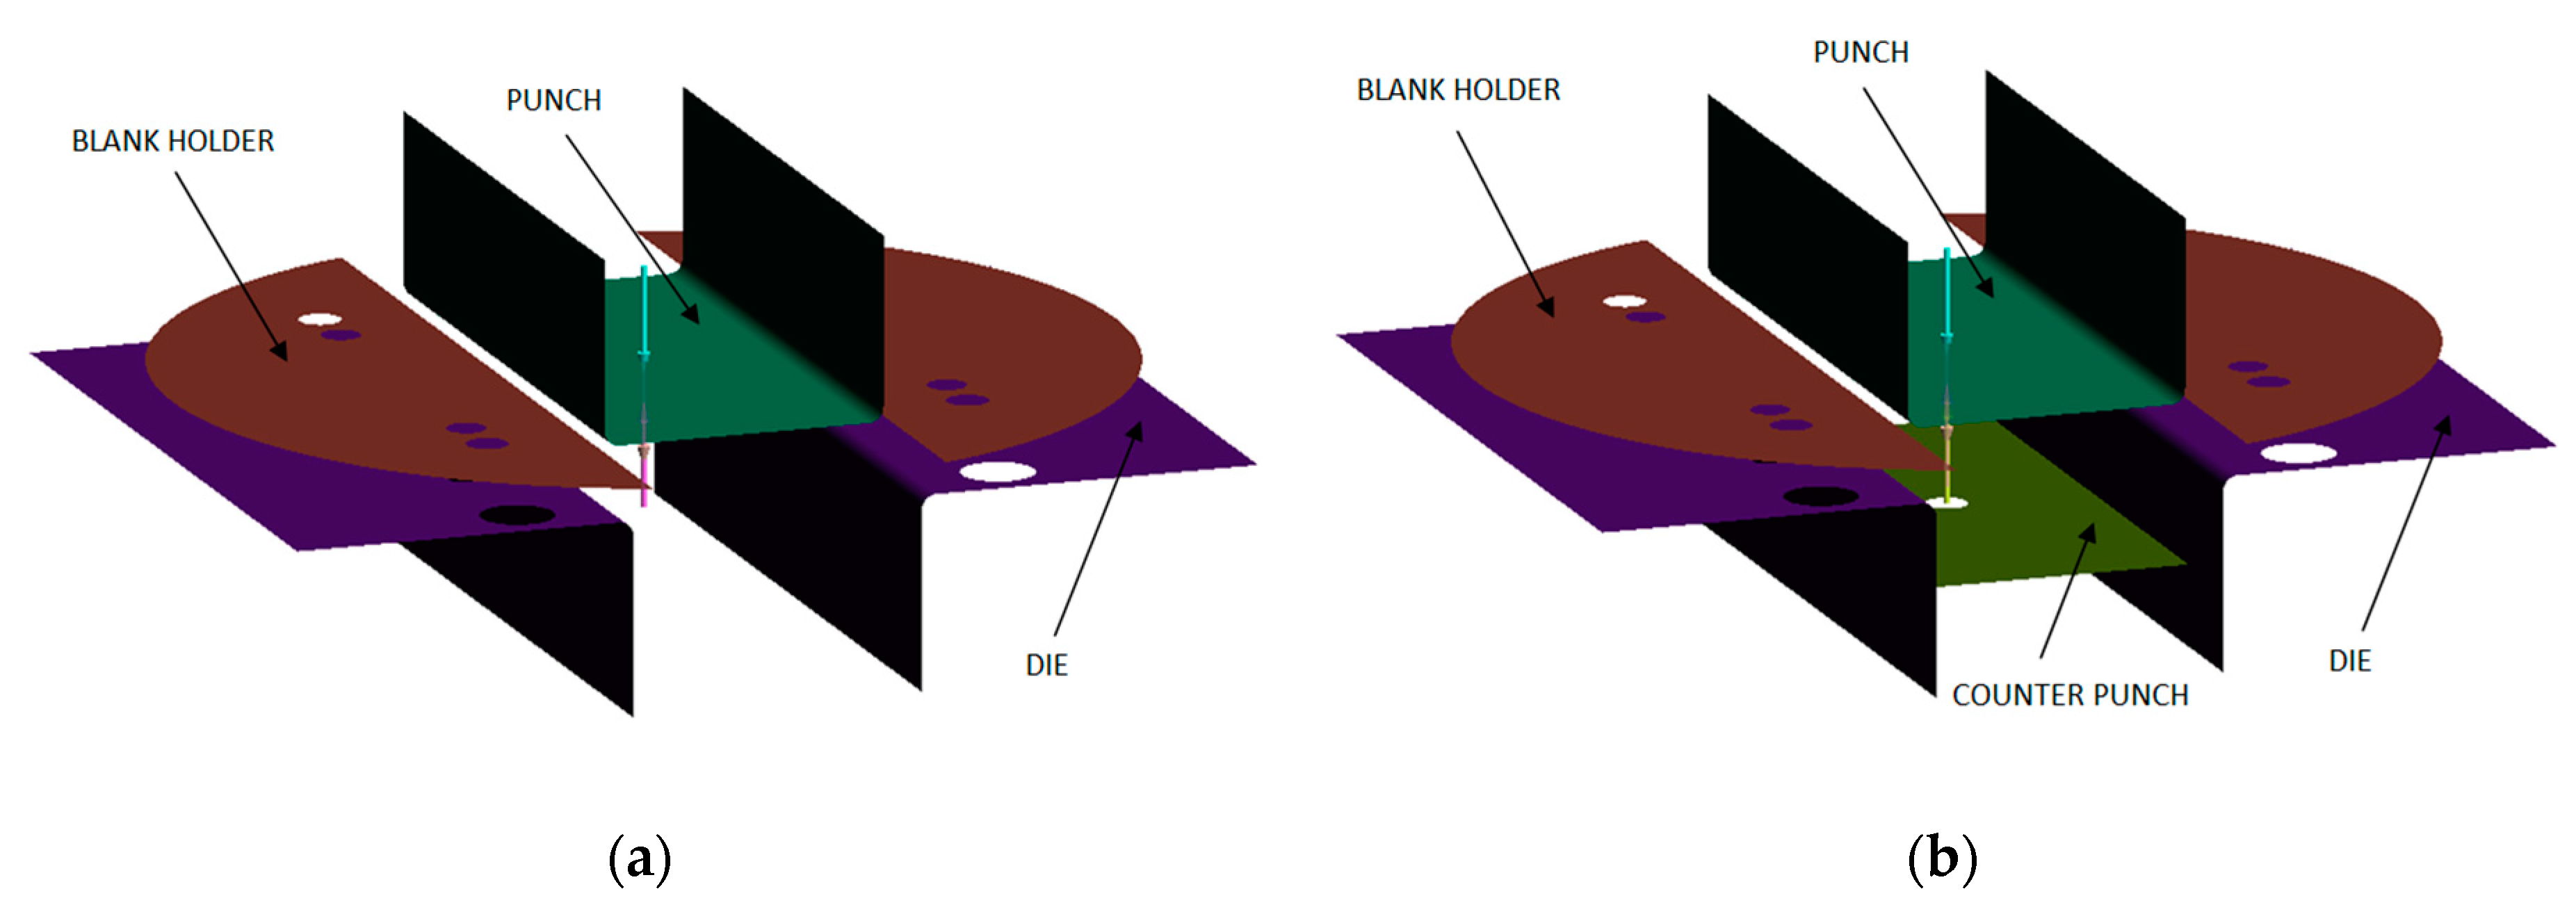
2.3. Numerical Simulation
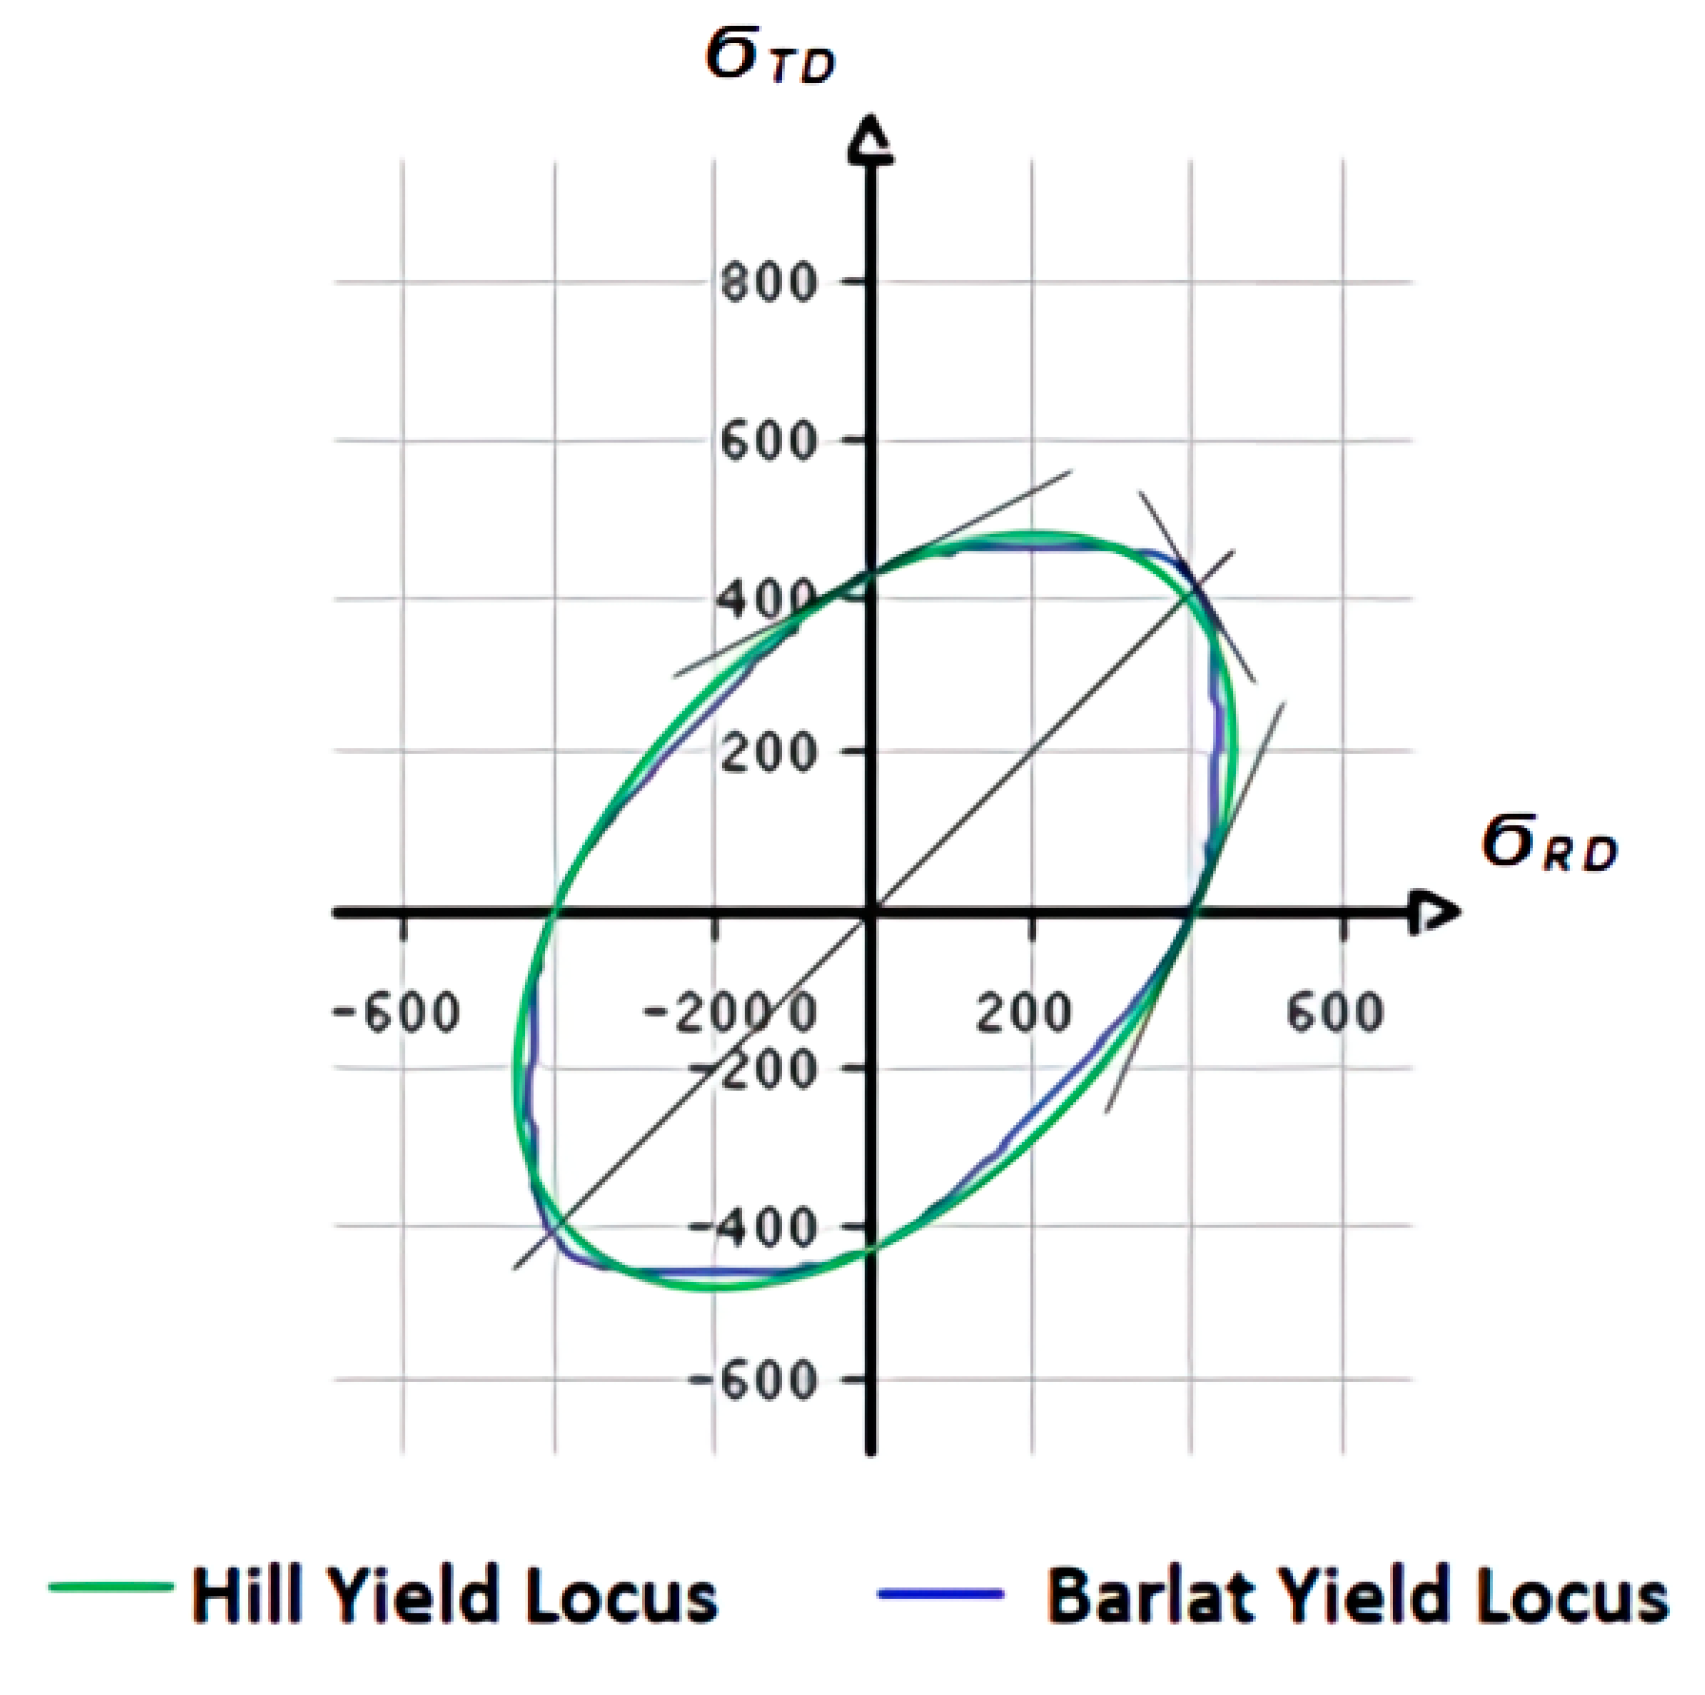
2.3.1. Yield Surface
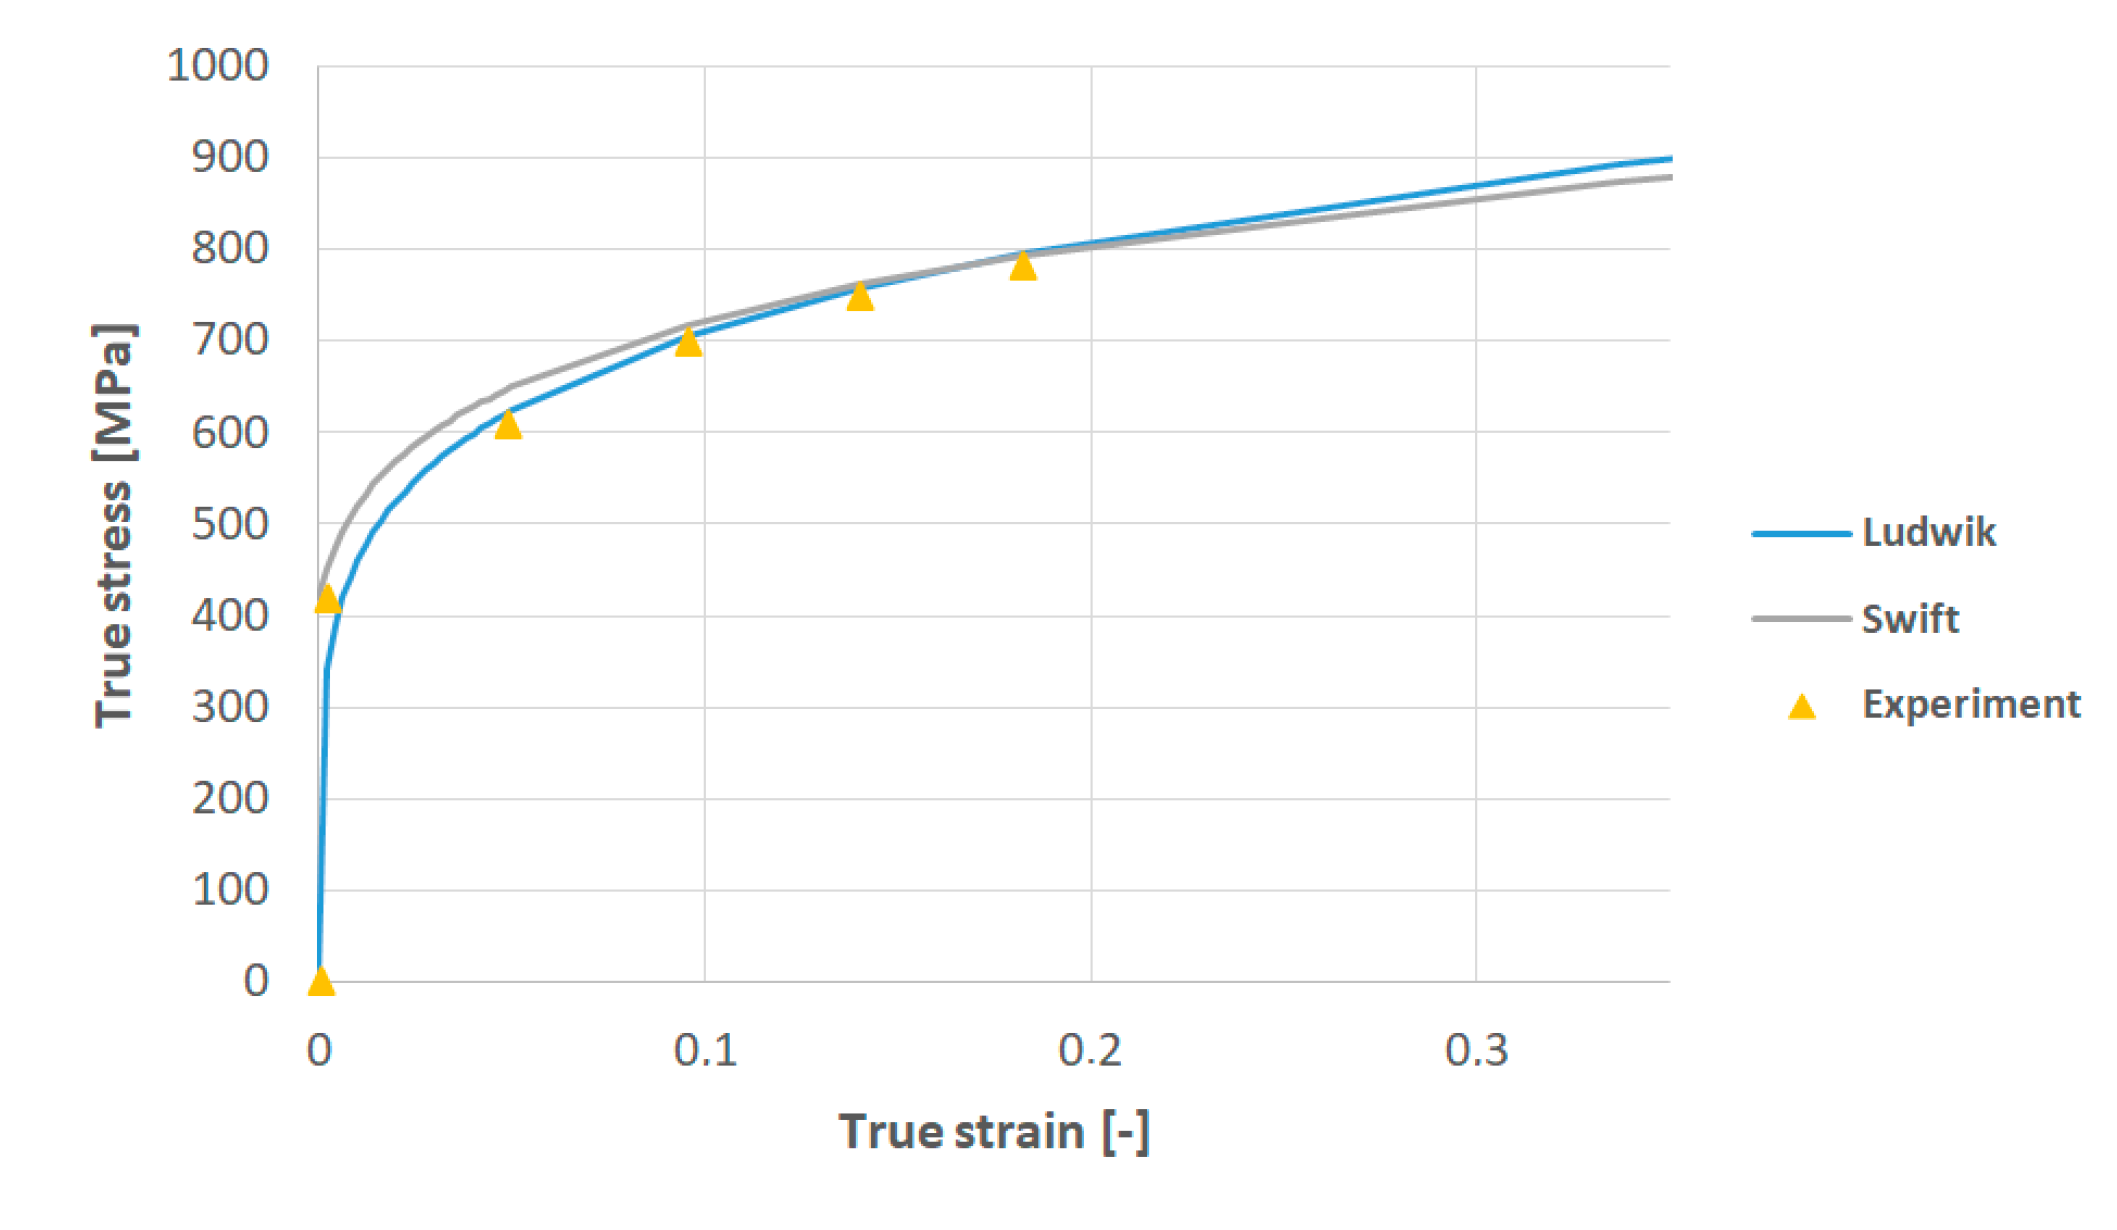
2.3.2. Material Hardening Model
- Ludwik
- Swift
3. Results
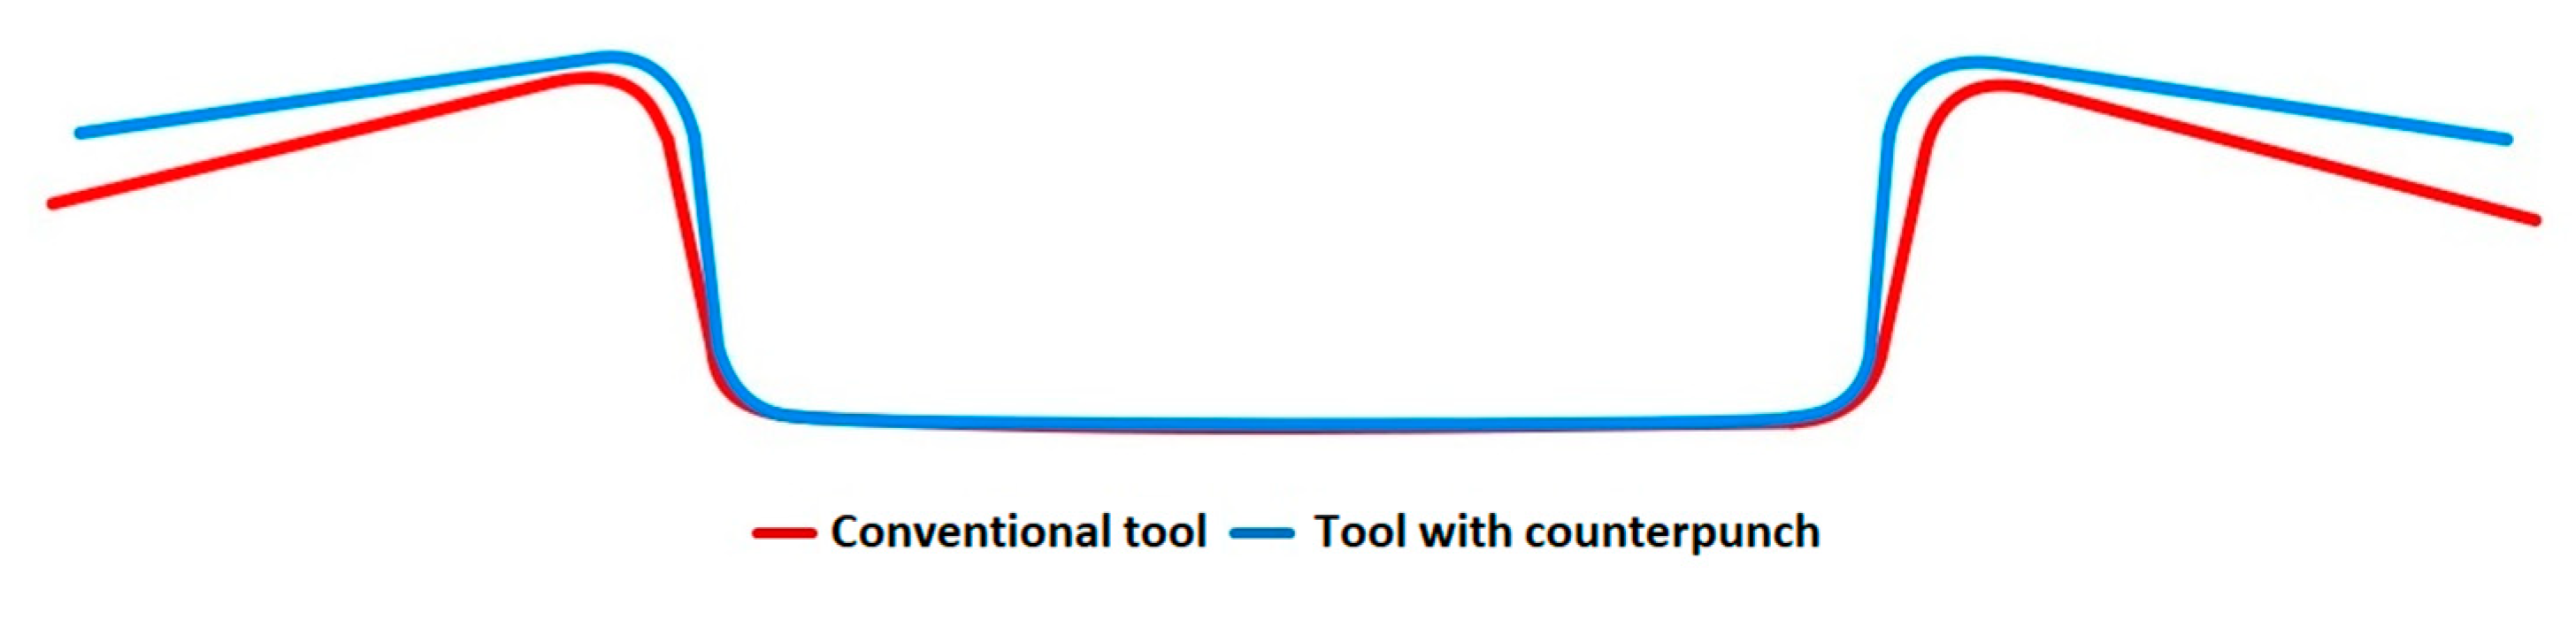
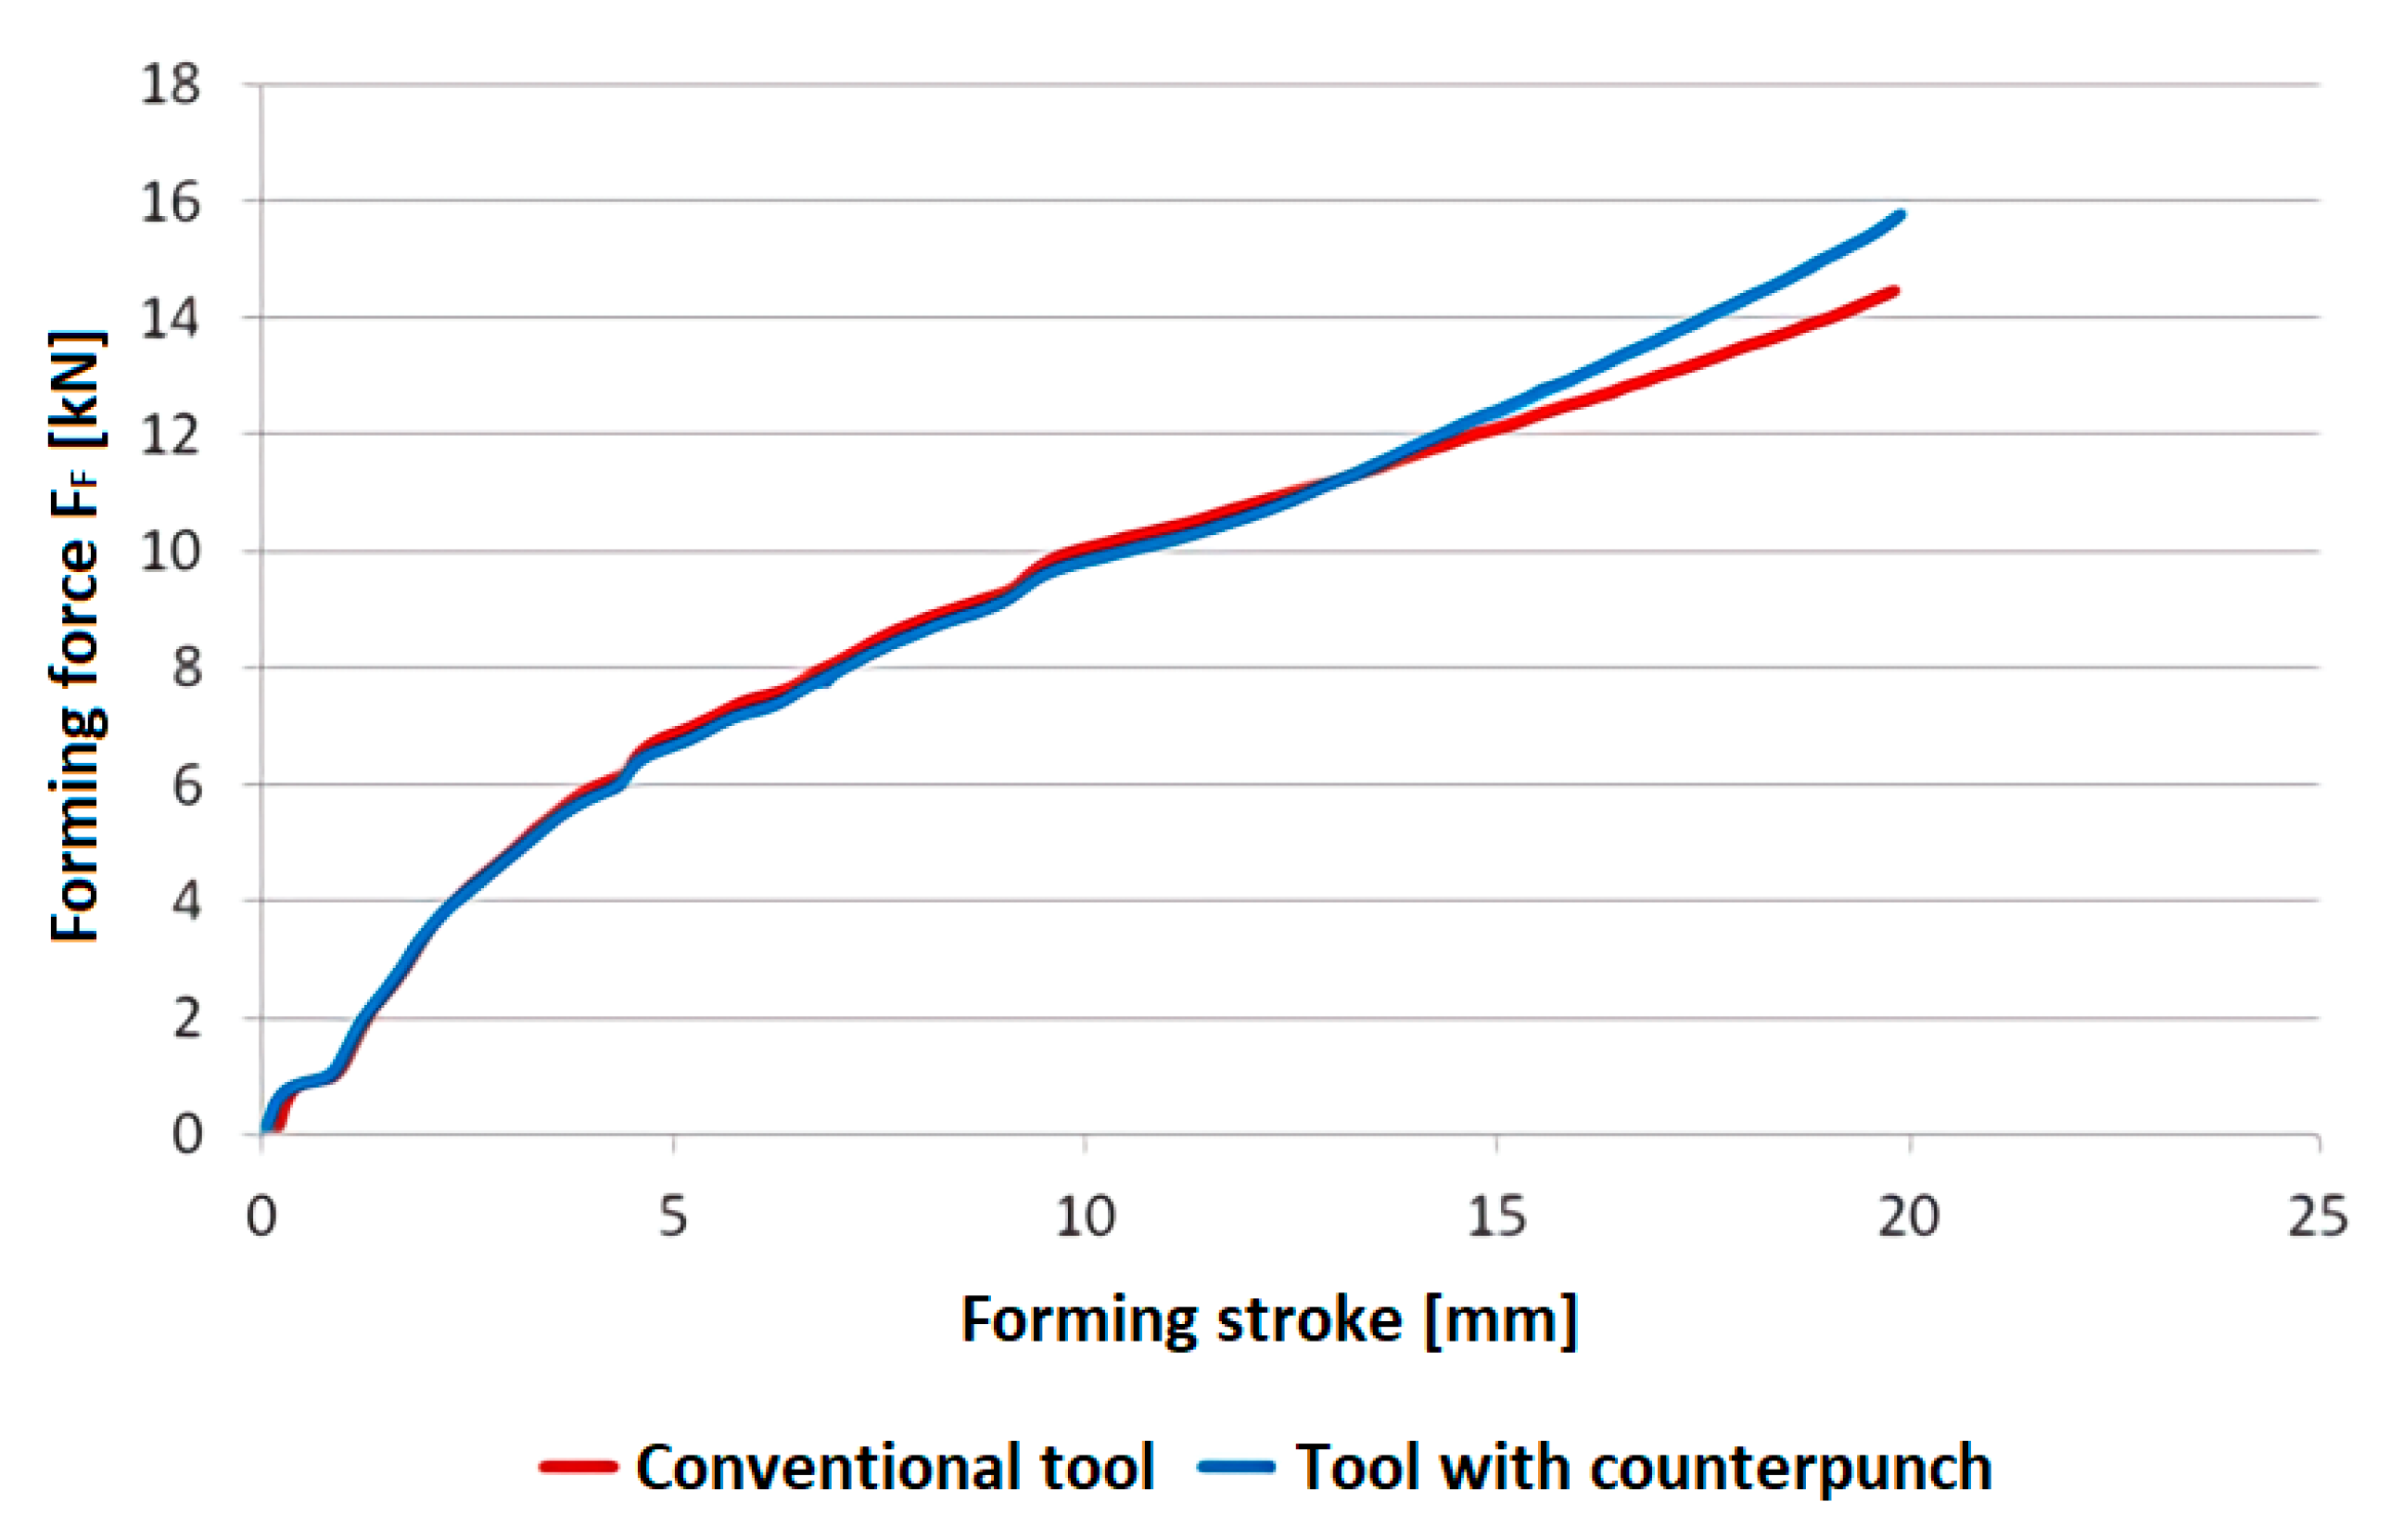
3.1. Analysis of Experimental Springback Results
3.2. Analysis of Springback Prediction Results
4. Discussion
5. Conclusions
- Significant springback reduction, reduction in values of springback angles α (reduction of 49%) and β (reduction of 38%) was achieved with the use of the tool design which includes counterpunch. This tool design can be adopted for stamping hat-shaped parts in industrial practice.
- The use of isotropic–kinematic combined hardening models showed more accurate springback prediction results compared to isotropic hardening models.
- Barlat yield criterion in combination with isotropic–kinematic hardening model based on Ludwik hardening law showed the best correlation in terms of springback prediction when a tool with counterpunch was used.
- Hill yield criterion in combination with isotropic–kinematic hardening model based on Ludwik hardening law achieved the most accurate springback prediction for the hat-shaped part made in the conventional tool.
- The springback prediction of the hat-shaped part made in the conventional tool was less accurate than the predictions of part made in the tool with a counterpunch.
Author Contributions
Funding
Conflicts of Interest
References
- Chongthairungruang, B.; Uthaisangsuk, V.; Suranuntchai, S.; Jirathearanat, S. Springback prediction in sheet metal forming of high strength steels. Mater. Des. 2013, 50, 253–266. [Google Scholar] [CrossRef]
- Banu, M.; Takamura, M.; Hama, T.; Naidim, O.; Teodosiu, C.; Makinouchi, A. Simulation of springback and wrinkling in stamping of a dual phase steel rail-shaped part. J. Mater. Process. Technol. 2006, 173, 178–184. [Google Scholar] [CrossRef]
- Jeswiet, J.; Geiger, M.; Engel, U.; Kleiner, M.; Schikorra, M.; Duflou, J.; Neugebauer, R.; Bariani, P.; Bruschi, S. Metal forming progress since 2000. CIRP J. Manuf. Sci. Technol. 2008, 1, 2–17. [Google Scholar] [CrossRef]
- Wagoner, R.H.; Lim, H.; Lee, M.-G. Advanced Issues in springback. Int. J. Plast. 2013, 45, 3–20. [Google Scholar] [CrossRef]
- Yoshida, T.; Sato, K.; Hashimoto, K. Springback Problems in Forming of High-Strength Steel Sheets and Countermeasures. In Nippon Steel Technical Report No. 103; Nippon Steel & Sumitomo Metal Corporation: Tokyo, Japan, 2013. [Google Scholar]
- Toros, S.; Polat, A.; Ozturk, F. Formability and springback characterization of TRIP800 advanced high strength steel. Mater. Des. 2012, 41, 298–305. [Google Scholar] [CrossRef]
- Wagoner, R.H. Advanced High Strength Workshop 2006; The Ohio State University: Columbus, OH, USA, 2006. [Google Scholar]
- Jin, T.; Ha, N.; Goo, N. A study of the thermal buckling behavior of a circular aluminum plate using the digital image correlation technique and finite element analysis. Thin-Walled Struct. 2014, 77, 187–197. [Google Scholar] [CrossRef]
- Naofal, J.; Naeini, H.M.; Mazdak, S. Effects of Hardening Model and Variation of Elastic Modulus on Springback Prediction in Roll Forming. Metals 2019, 9, 1005. [Google Scholar] [CrossRef]
- Baara, W.A.B.; Baharudin, B.T.H.T.; Ariffin, M.K.A.M.; Ismail, M.I.S. Effect of Elastic Module Degradation Measurement in Different Sizes of the Nonlinear Isotropic–Kinematic Yield Surface on Springback Prediction. Metals 2019, 9, 511. [Google Scholar] [CrossRef]
- Tomáš, M.; Evin, E.; Kepič, J.; Hudák, J. Physical Modelling and Numerical Simulation of the Deep Drawing Process of a Box-Shaped Product Focused on Material Limits Determination. Metals 2019, 9, 1058. [Google Scholar] [CrossRef]
- Seo, K.-Y.; Kim, J.-H.; Lee, H.-S.; Kim, J.H.; Kim, B. Effect of Constitutive Equations on Springback Prediction Accuracy in the TRIP1180 Cold Stamping. Metals 2017, 8, 18. [Google Scholar] [CrossRef]
- Mulidrán, P.; Šiser, M.; Slota, J.; Spišák, E.; Sleziak, T. Numerical Prediction of Forming Car Body Parts with Emphasis on Springback. Metals 2018, 8, 435. [Google Scholar] [CrossRef]
- Li, X.; Yang, Y.; Wang, Y.; Bao, J.; Li, S. Effect of the material-hardening mode on the springback simulation accuracy of V-free bending. J. Mater. Process. Technol. 2002, 123, 209–211. [Google Scholar] [CrossRef]
- Li, K.; Geng, L.; Wagoner, R. Simulation of springback w-ith the draw/bend test. In Proceedings of the Second International Conference on Intelligent Processing and Manufacturing of Materials. IPMM’99 (Cat. No.99EX296), Leuven, Belgium, 22–24 September 1999; Katholieke Universiteit Leuven: Heverlee, Belgium, 1999. [Google Scholar]
- Xu, W.; Ma, C.; Li, C.; Feng, W. Sensitive factors in springback simulation for sheet metal forming. J. Mater. Process. Technol. 2004, 151, 217–222. [Google Scholar] [CrossRef]
- Yao, H.; Liu, S.-D.; Du, C.; Hu, Y. Techniques to Improve Springback Prediction Accuracy Using Dynamic Explicit FEA Codes. SAE Tech. Pap. Ser. 2002, 111, 100–106. [Google Scholar] [CrossRef]
- N’Jock, M.Y.; Houssem, B.; Labergère, C.; Saanouni, K.; Zhenming, Y. Explicit and implicit springback simulation in sheet metal forming using fully coupled ductile damage and distortional hardening model. In Proceedings of the 1st International Conference on Mechanical and Materials Science Engineering: Innovation and Research-2018, Maharashtra, India, 5–6 July 2018; AIP Publishing: Melville, NY, USA, 2018; Volume 1960, p. 090014. [Google Scholar]
- Lawanwong, K.; Hamasaki, H.; Hino, R.; Yoshida, F. Double-action bending for eliminating springback in hat-shaped bending of advanced high-strength steel sheet. Int. J. Adv. Manuf. Technol. 2019, 106, 1855–1867. [Google Scholar] [CrossRef]
- Slota, J.; Jurčišin, M.; Lăzărescu, L. Influence of technological parameters on the springback angle of high-strength steels. Acta Met. Slovaca 2014, 20, 236–243. [Google Scholar] [CrossRef]
- Cui, X.; Xiao, A.; Du, Z.; Yan, Z.; Yu, H. Springback Reduction of L-Shaped Part Using Magnetic Pulse Forming. Metals 2020, 10, 390. [Google Scholar] [CrossRef]
- Barraza-Fierro, J.I.; Campillo-Illanes, B.; Li, X.; Castaneda, H. Steel Microstructure Effect on Mechanical Properties and Corrosion Behavior of High Strength Low Carbon Steel. Met. Mater. Trans. A 2014, 45, 3981–3994. [Google Scholar] [CrossRef]
- Abspoel, M.; Scholting, M.E.; Lansbergen, M.; An, Y.; Vegter, H. A new method for predicting advanced yield criteria input parameters from mechanical properties. J. Mater. Process. Technol. 2017, 248, 161–177. [Google Scholar] [CrossRef]
- Karagiozova, D.; Shu, D.; Lu, G.; Xiang, X. On the energy absorption of tube reinforced foam materials under quasi-static and dynamic compression. Int. J. Mech. Sci. 2016, 105, 102–116. [Google Scholar] [CrossRef]
- Ha, N.S.; Lu, G.; Xiang, X. High energy absorption efficiency of thin-walled conical corrugation tubes mimicking coconut tree configuration. Int. J. Mech. Sci. 2018, 148, 409–421. [Google Scholar] [CrossRef]
- Ha, N.S.; Lu, G.; Xiang, X. Energy absorption of a bio-inspired honeycomb sandwich panel. J. Mater. Sci. 2019, 54, 6286–6300. [Google Scholar] [CrossRef]
- Wang, L.; Lee, T. The effect of yield criteria on the forming limit curve prediction and the deep drawing process simulation. Int. J. Mach. Tools Manuf. 2006, 46, 988–995. [Google Scholar] [CrossRef]
- Hill, R. A theory of the yielding and plastic flow of anisotropic metals. Proc. R. Soc. Lond. Ser. A Math. Phys. Sci. 1948, 193, 281–297. [Google Scholar] [CrossRef]
- Bruschi, S.; Altan, T.; Banabic, D.; Bariani, P.; Brosius, A.; Cao, J.; Ghiotti, A.; Khraisheh, M.; Merklein, M.; Tekkaya, A.E. Testing and modelling of material behaviour and formability in sheet metal forming. CIRP Ann. 2014, 63, 727–749. [Google Scholar] [CrossRef]
- Barlat, F.; Brem, J.; Yoon, J.W.; Chung, K.; Dick, R.; Lege, D.; Pourboghrat, F.; Choi, S.-H.; Chu, E. Plane stress yield function for aluminum alloy sheets—Part 1: Theory. Int. J. Plast. 2003, 19, 1297–1319. [Google Scholar] [CrossRef]
- Slota, J. Numerická Simulácia Lisovania Plechov, 1st ed.; Technical University of Košice: Košice, Slovakia, 2016; p. 194. [Google Scholar]
- Kubli, W.; Krasovskyy, A.; Sester, M. Modeling of reverse loading effects including workhardening stagnation and early re-plastification. Int. J. Mater. Form. 2008, 1, 145–148. [Google Scholar] [CrossRef]
- Tisza, M.; Lukacs, Z. Formability Investigations of High-Strength Dual-Phase Steels. Acta Met. Sin. Engl. Lett. 2015, 28, 1471–1481. [Google Scholar] [CrossRef]
- Šiser, M.; Slota, J. Material Model of AW 5754 H11 Al Alloy for Numerical Simulation of Deep Drawing Process. Acta Mech. Slovaca 2016, 20, 32–40. [Google Scholar] [CrossRef]
- Neto, D.; Oliveira, M.; Alves, J.L.C.M.; Menezes, L.F. Influence of the plastic anisotropy modelling in the reverse deep drawing process simulation. Mater. Des. 2014, 60, 368–379. [Google Scholar] [CrossRef]
- Neto, D.; Oliveira, M.; Santos, A.D.; Alves, J.; Menezes, L.F. Influence of boundary conditions on the prediction of springback and wrinkling in sheet metal forming. Int. J. Mech. Sci. 2017, 122, 244–254. [Google Scholar] [CrossRef]


| C [%] | Mn [%] | Si [%] | P [%] | S [%] | Al [%] | Nb [%] | Ti [%] | V [%] | Mo [%] | Cr [%] |
|---|---|---|---|---|---|---|---|---|---|---|
| 0.090 | 1.890 | 0.260 | 0.014 | 0.001 | 0.026 | 0.001 | 0.003 | 0.002 | 0.002 | 0.010 |
| Dir. [°] | E [GPa] | Rp0.2 [MPa] | Rm [MPa] | A80 [%] | r [-] | rm [-] | Δr [-] | n [-] | nm [-] | Δn [-] |
|---|---|---|---|---|---|---|---|---|---|---|
| 0 | 405 | 656 | 24.4 | 0.745 | 0.197 | |||||
| 45 | 199 | 423 | 661 | 22.3 | 0.883 | 0.862 | −0.044 | 0.186 | 0.188 | 0.005 |
| 90 | 430 | 670 | 25.5 | 0.934 | 0.183 |
| Yield Criterion | r0 [-] | r45 [-] | r90 [-] | σ0 [MPa] | σ45 [MPa] | σ90 [MPa] | σbiax [-] | M [-] |
|---|---|---|---|---|---|---|---|---|
| Hill48 | 0.745 | 0.883 | 0.926 | 405.2 | 410.6 | 430.0 | 1 | - |
| Barlat89 | 0.745 | 0.883 | 0.926 | 405.2 | 413.1 | 430.0 | 1.03 | 6 |
| Model | K [MPa] | n [-] | φ0 [-] |
|---|---|---|---|
| Ludwik | 1 100 | 0.197 | - |
| Swift | 1 070 | 0.183 | 0.00496 |
| Model | K [-] | γ [-] | ξ [-] | κ [-] |
|---|---|---|---|---|
| Combined (isotropic–kinematic) | 0.005 | 0.1 | 0.5 | 40 |
| Tool | α [°] | β [°] | FF [kN] |
|---|---|---|---|
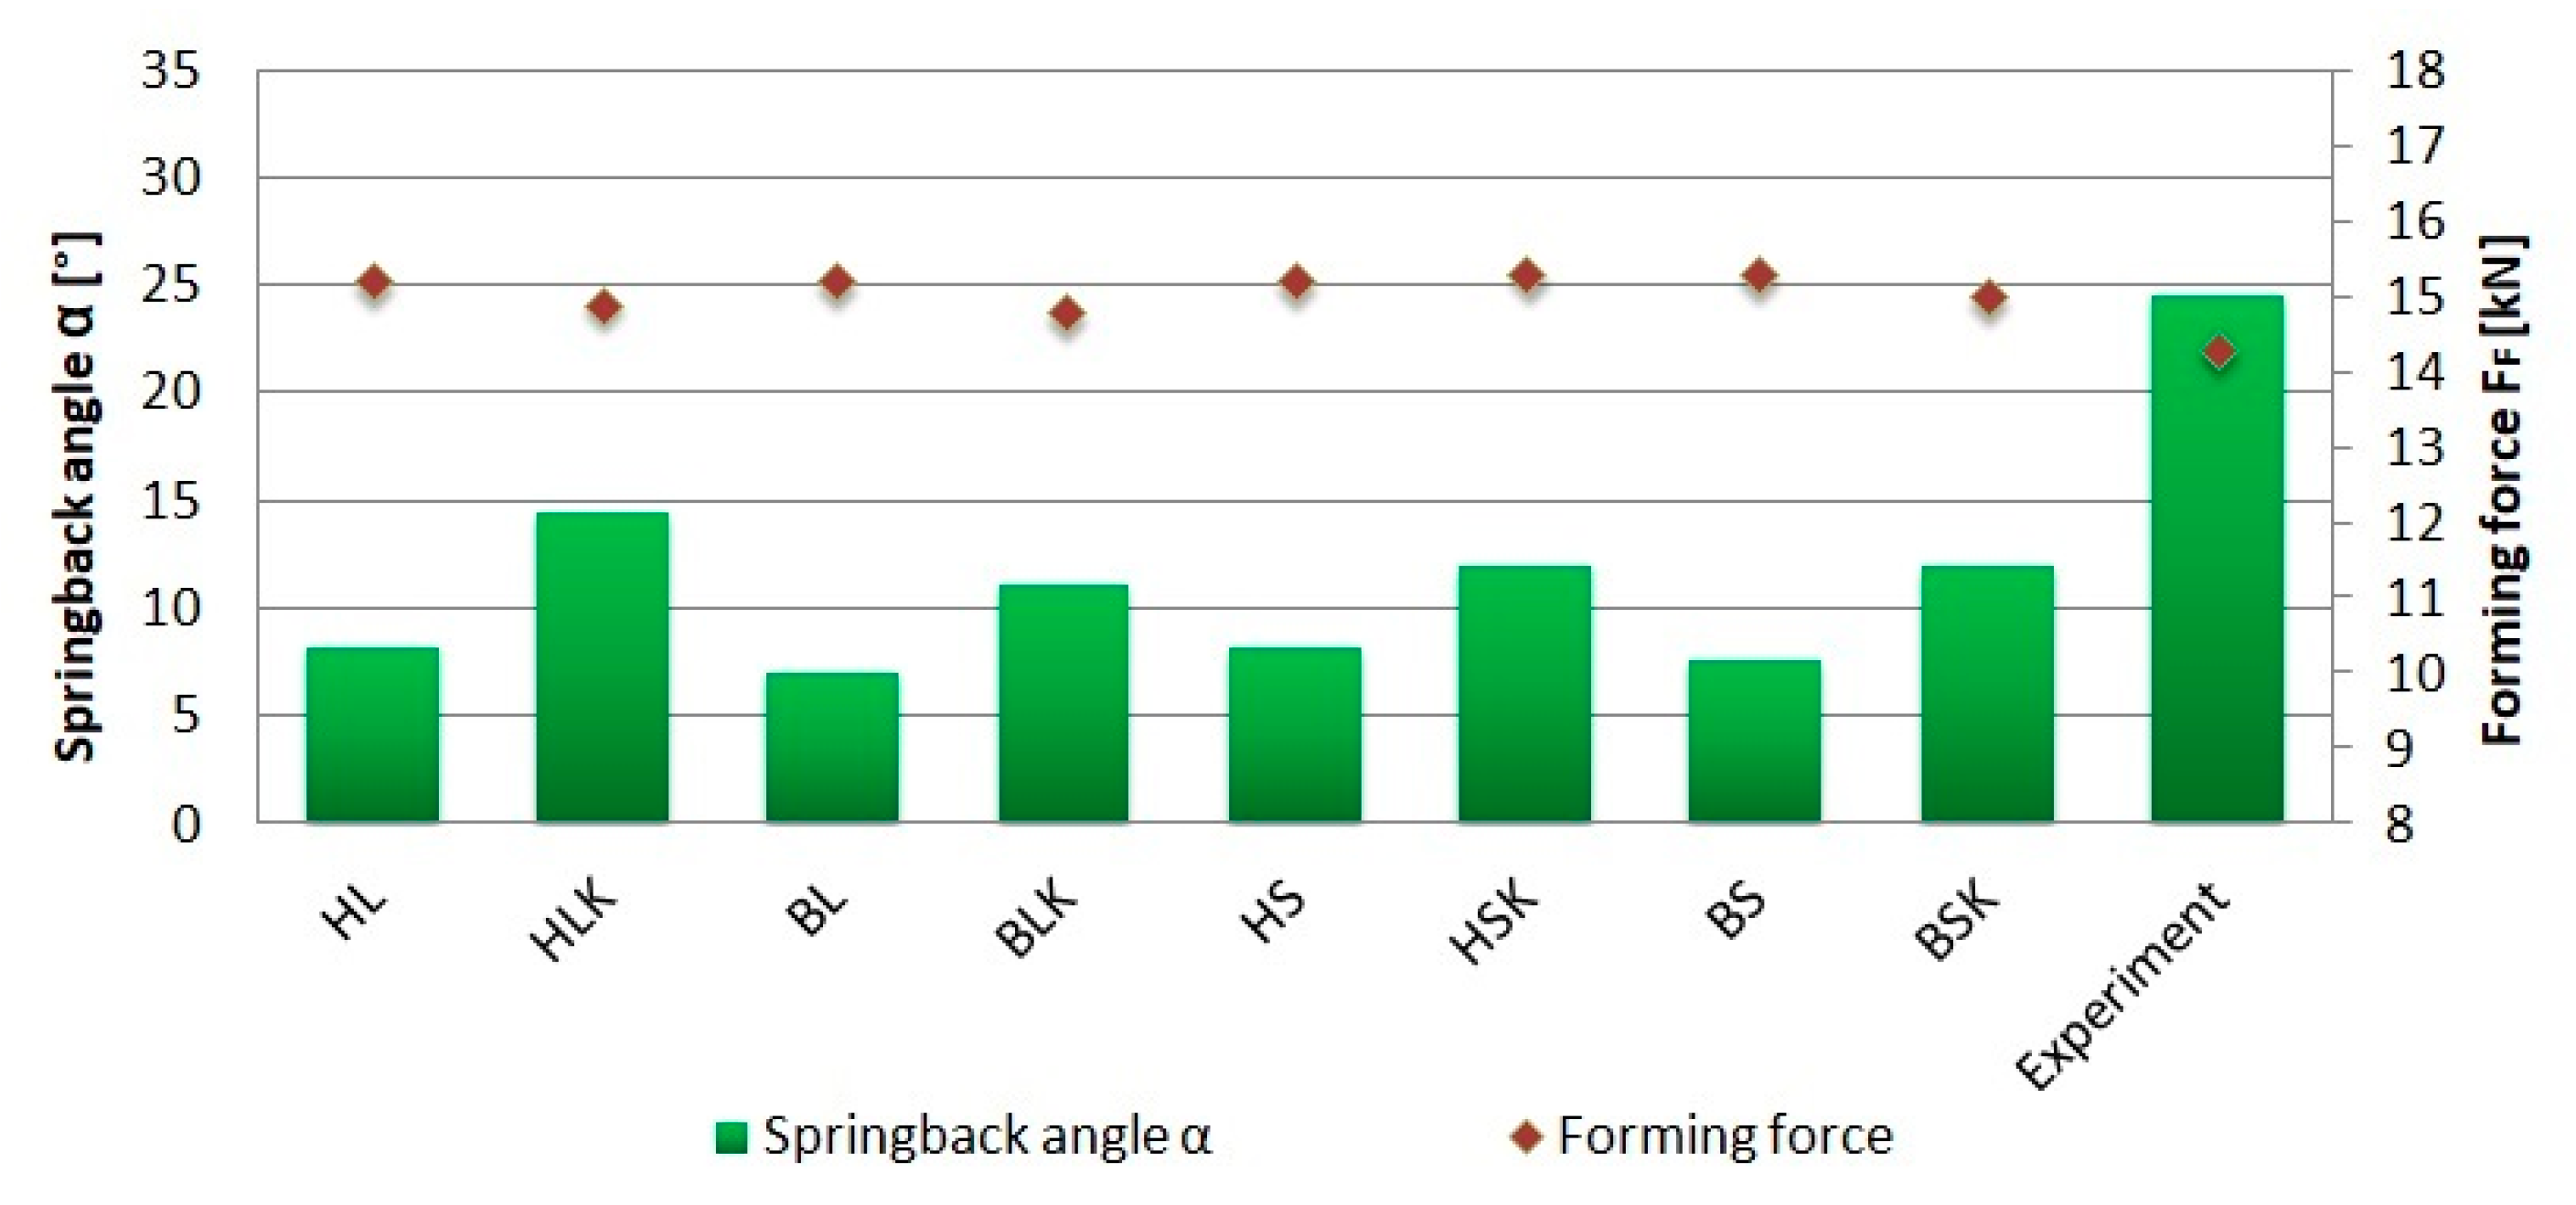
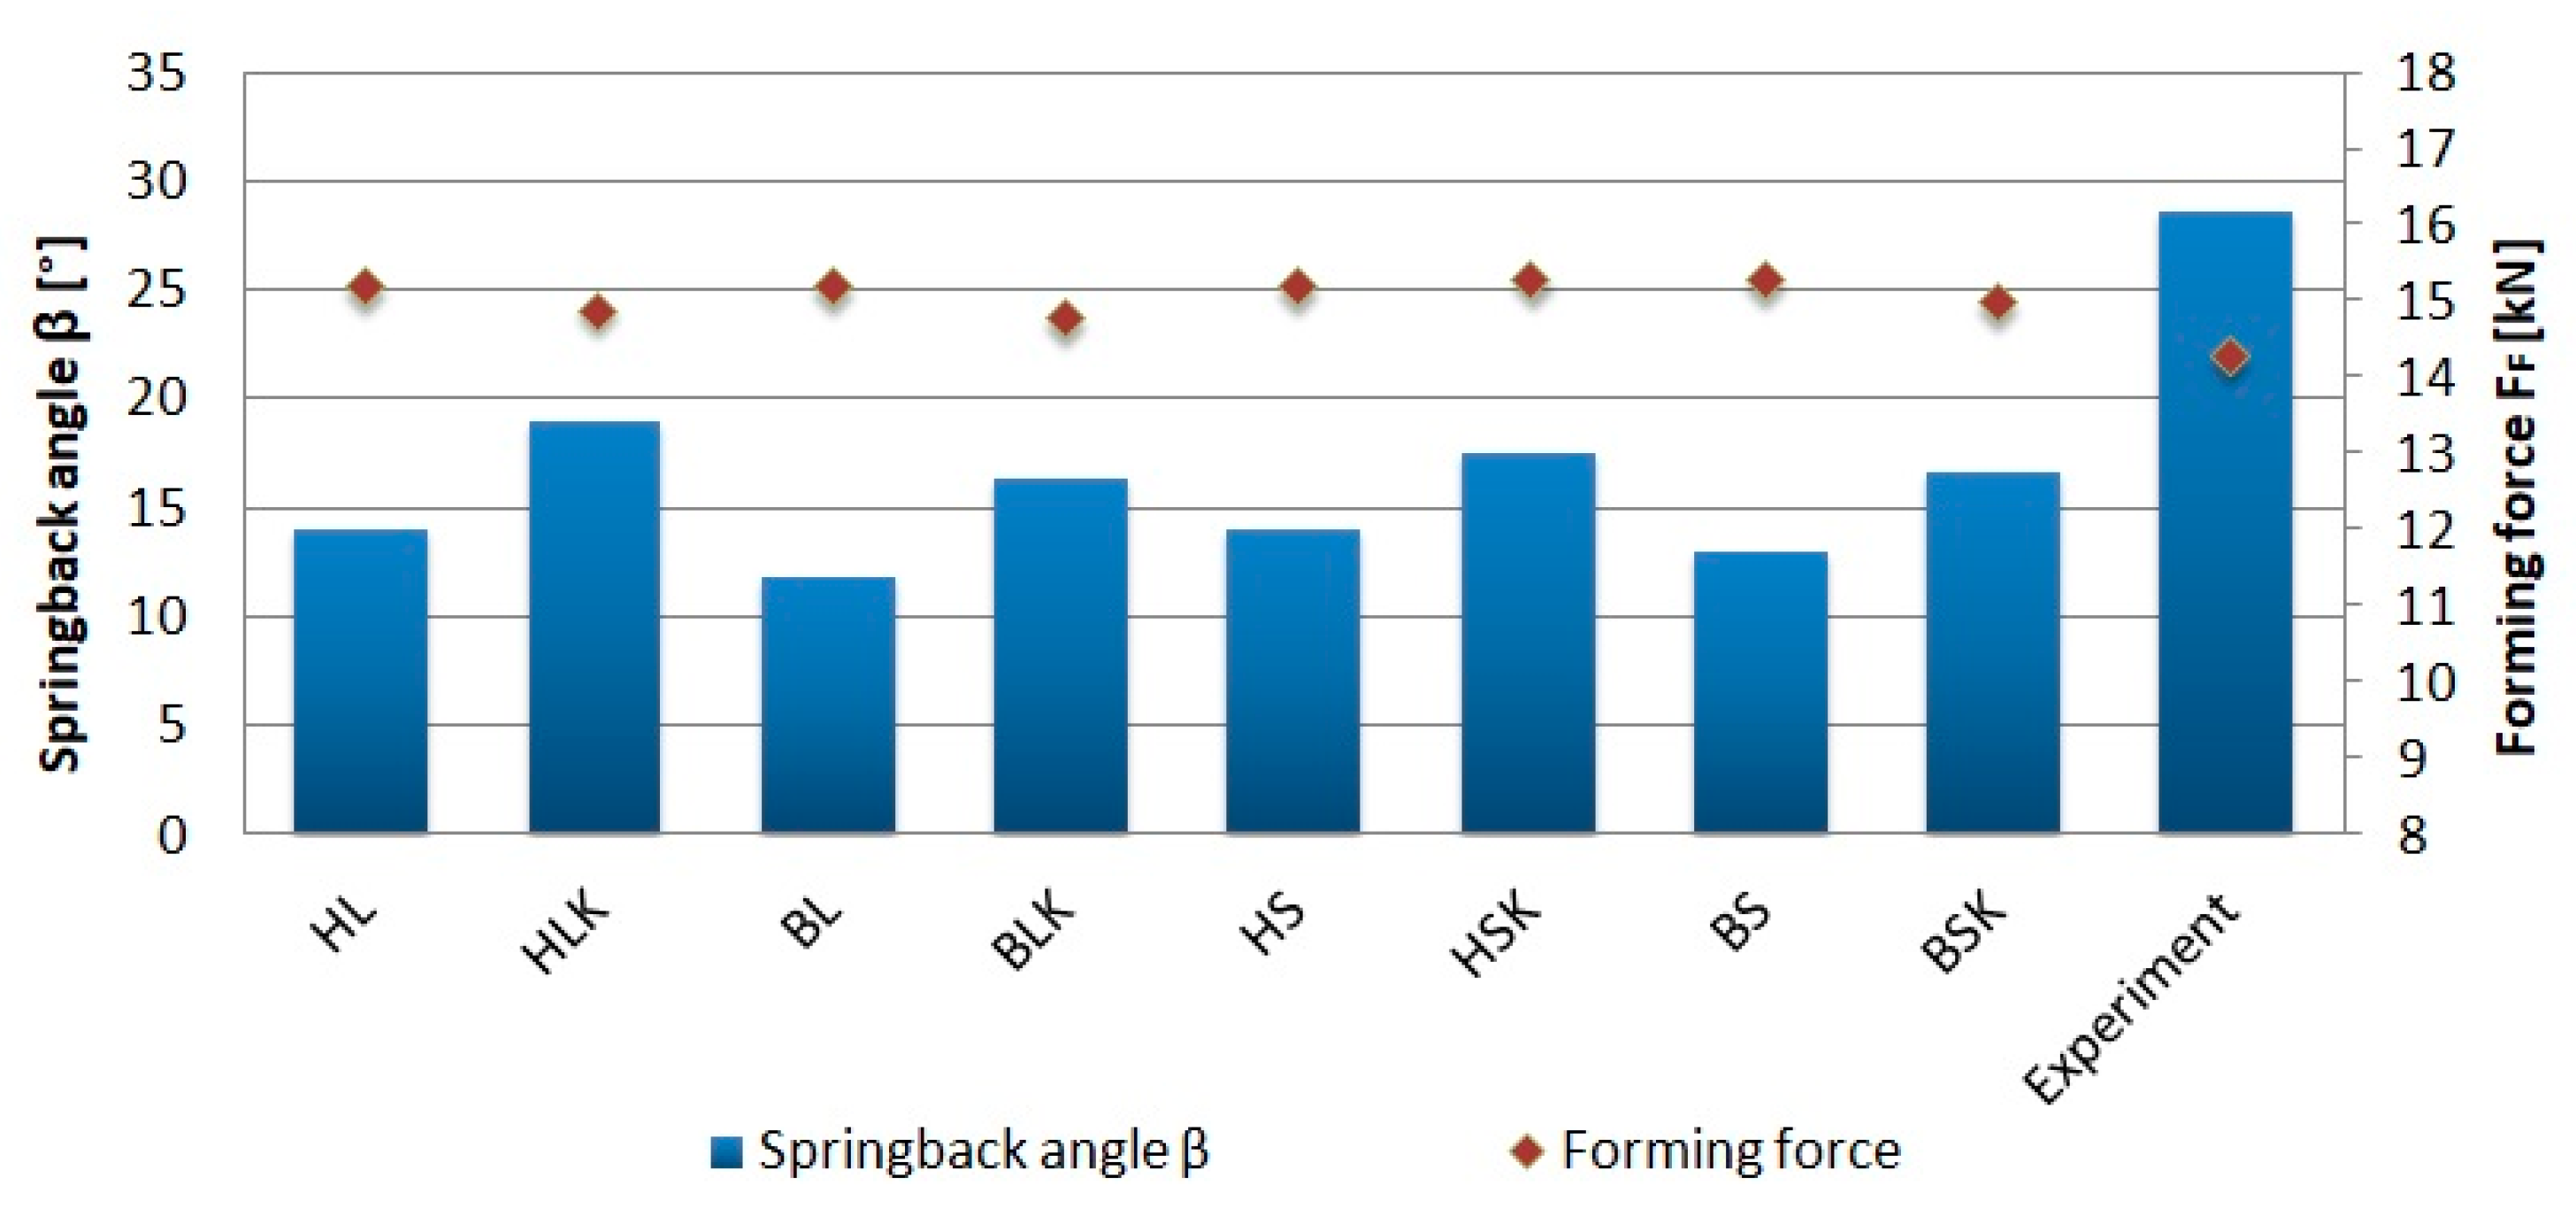
| Conventional | 24.5 ± 0.6 | 28.5 ± 0.26 | 14.4 ± 0.11 |
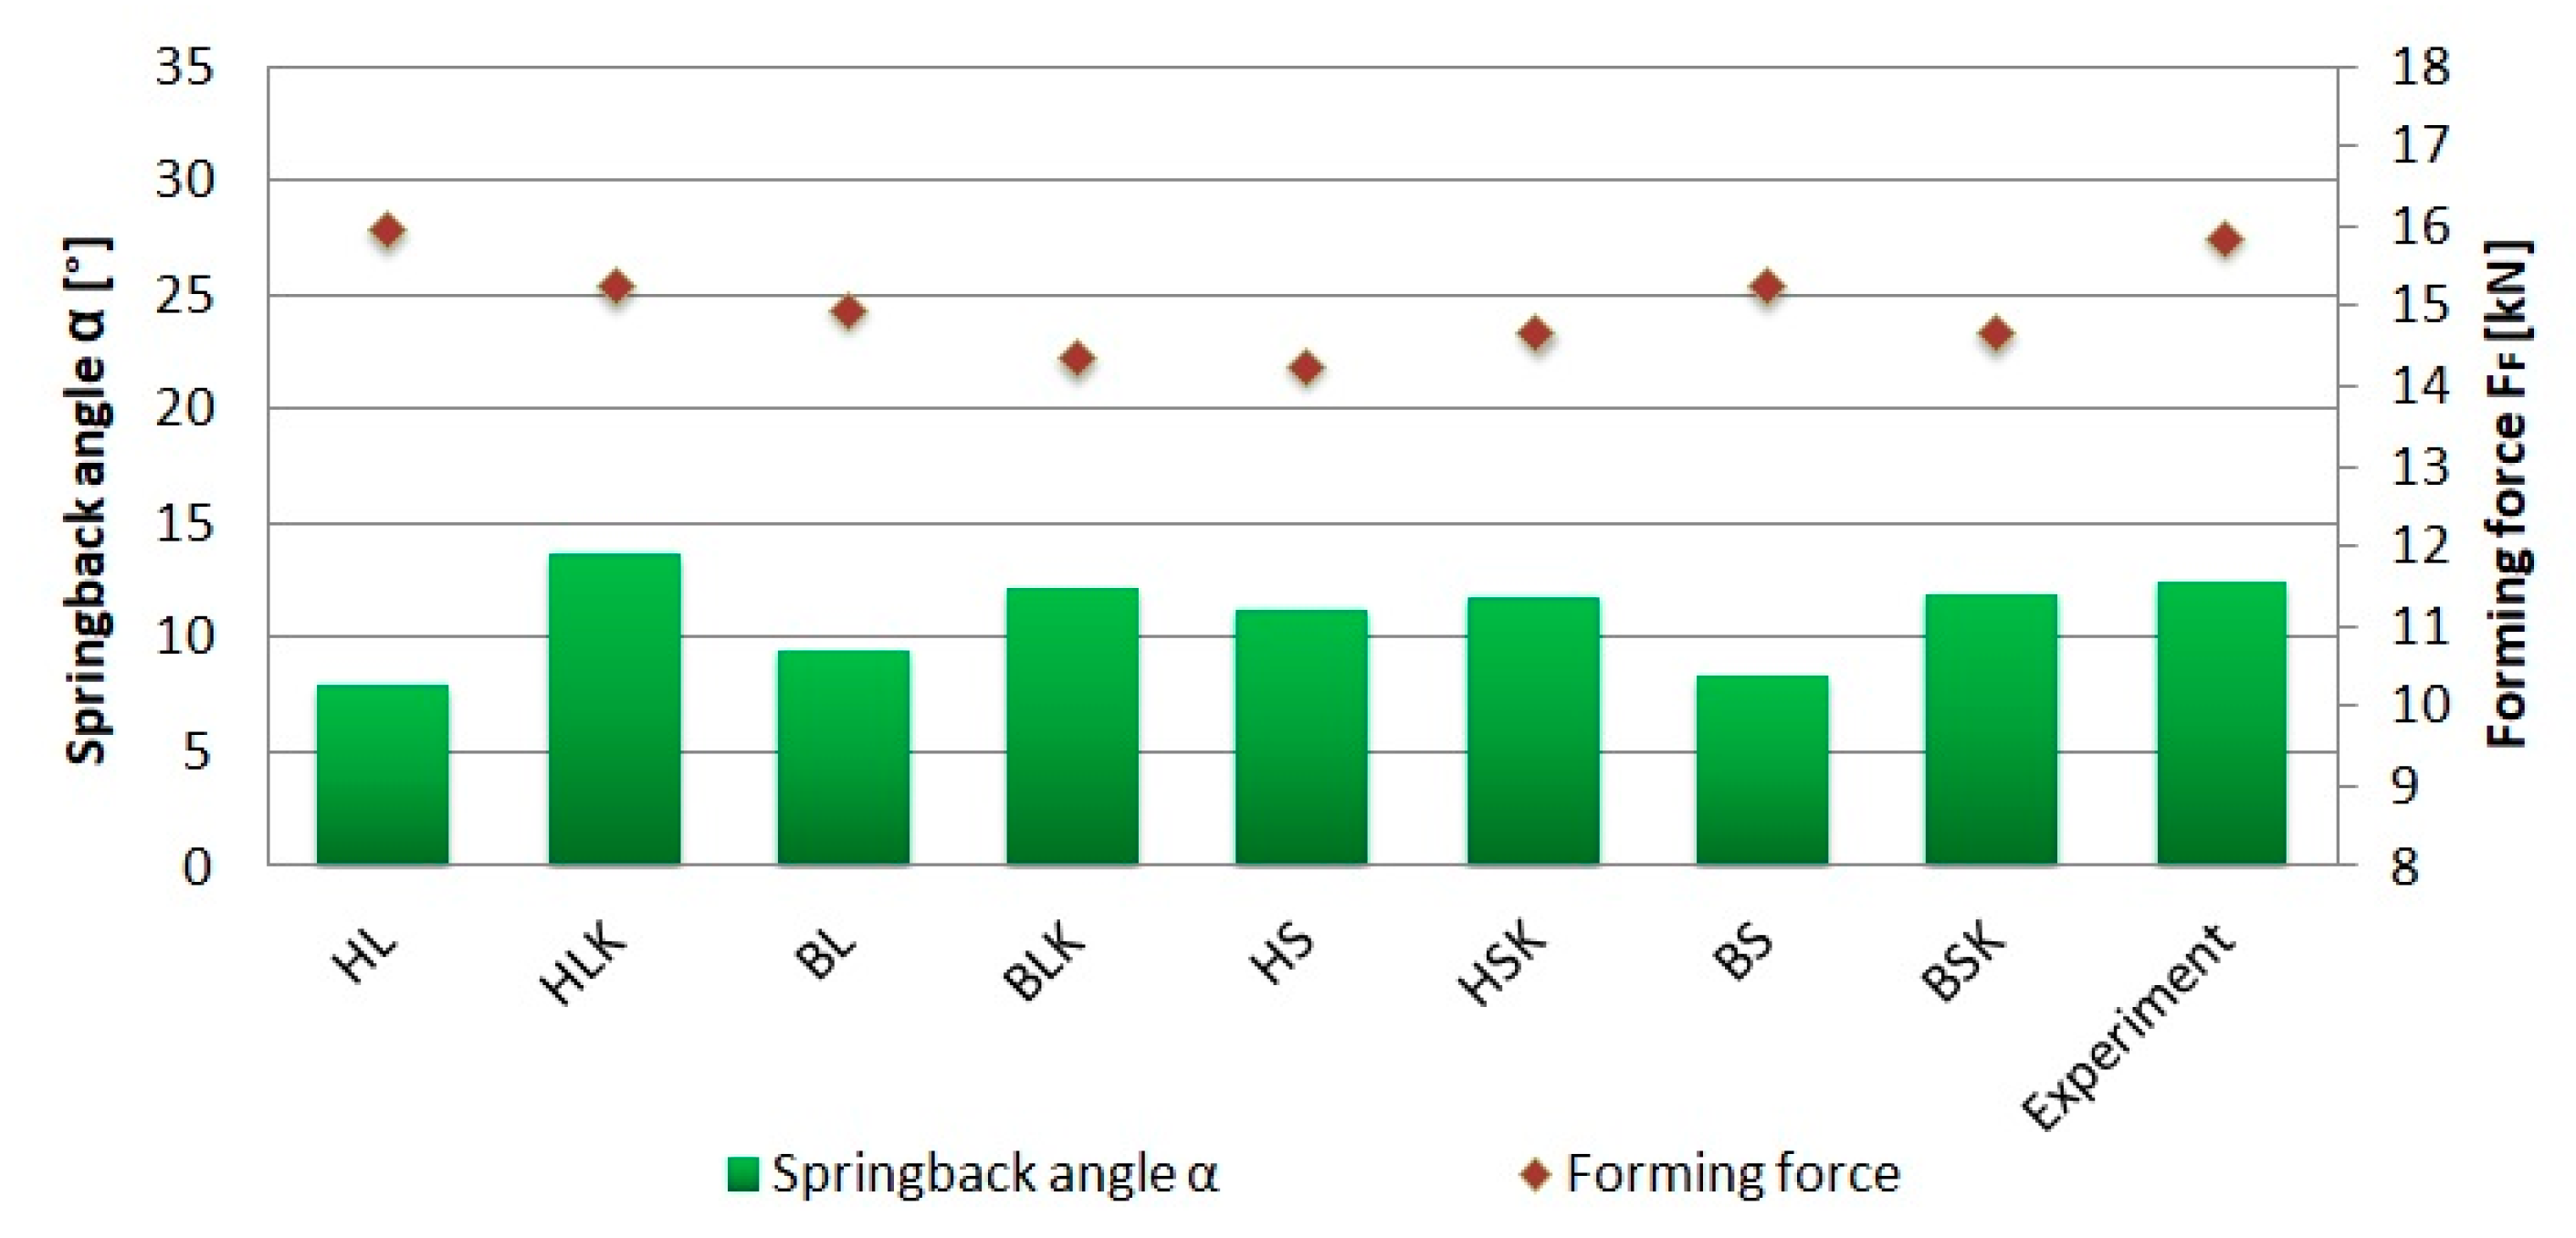
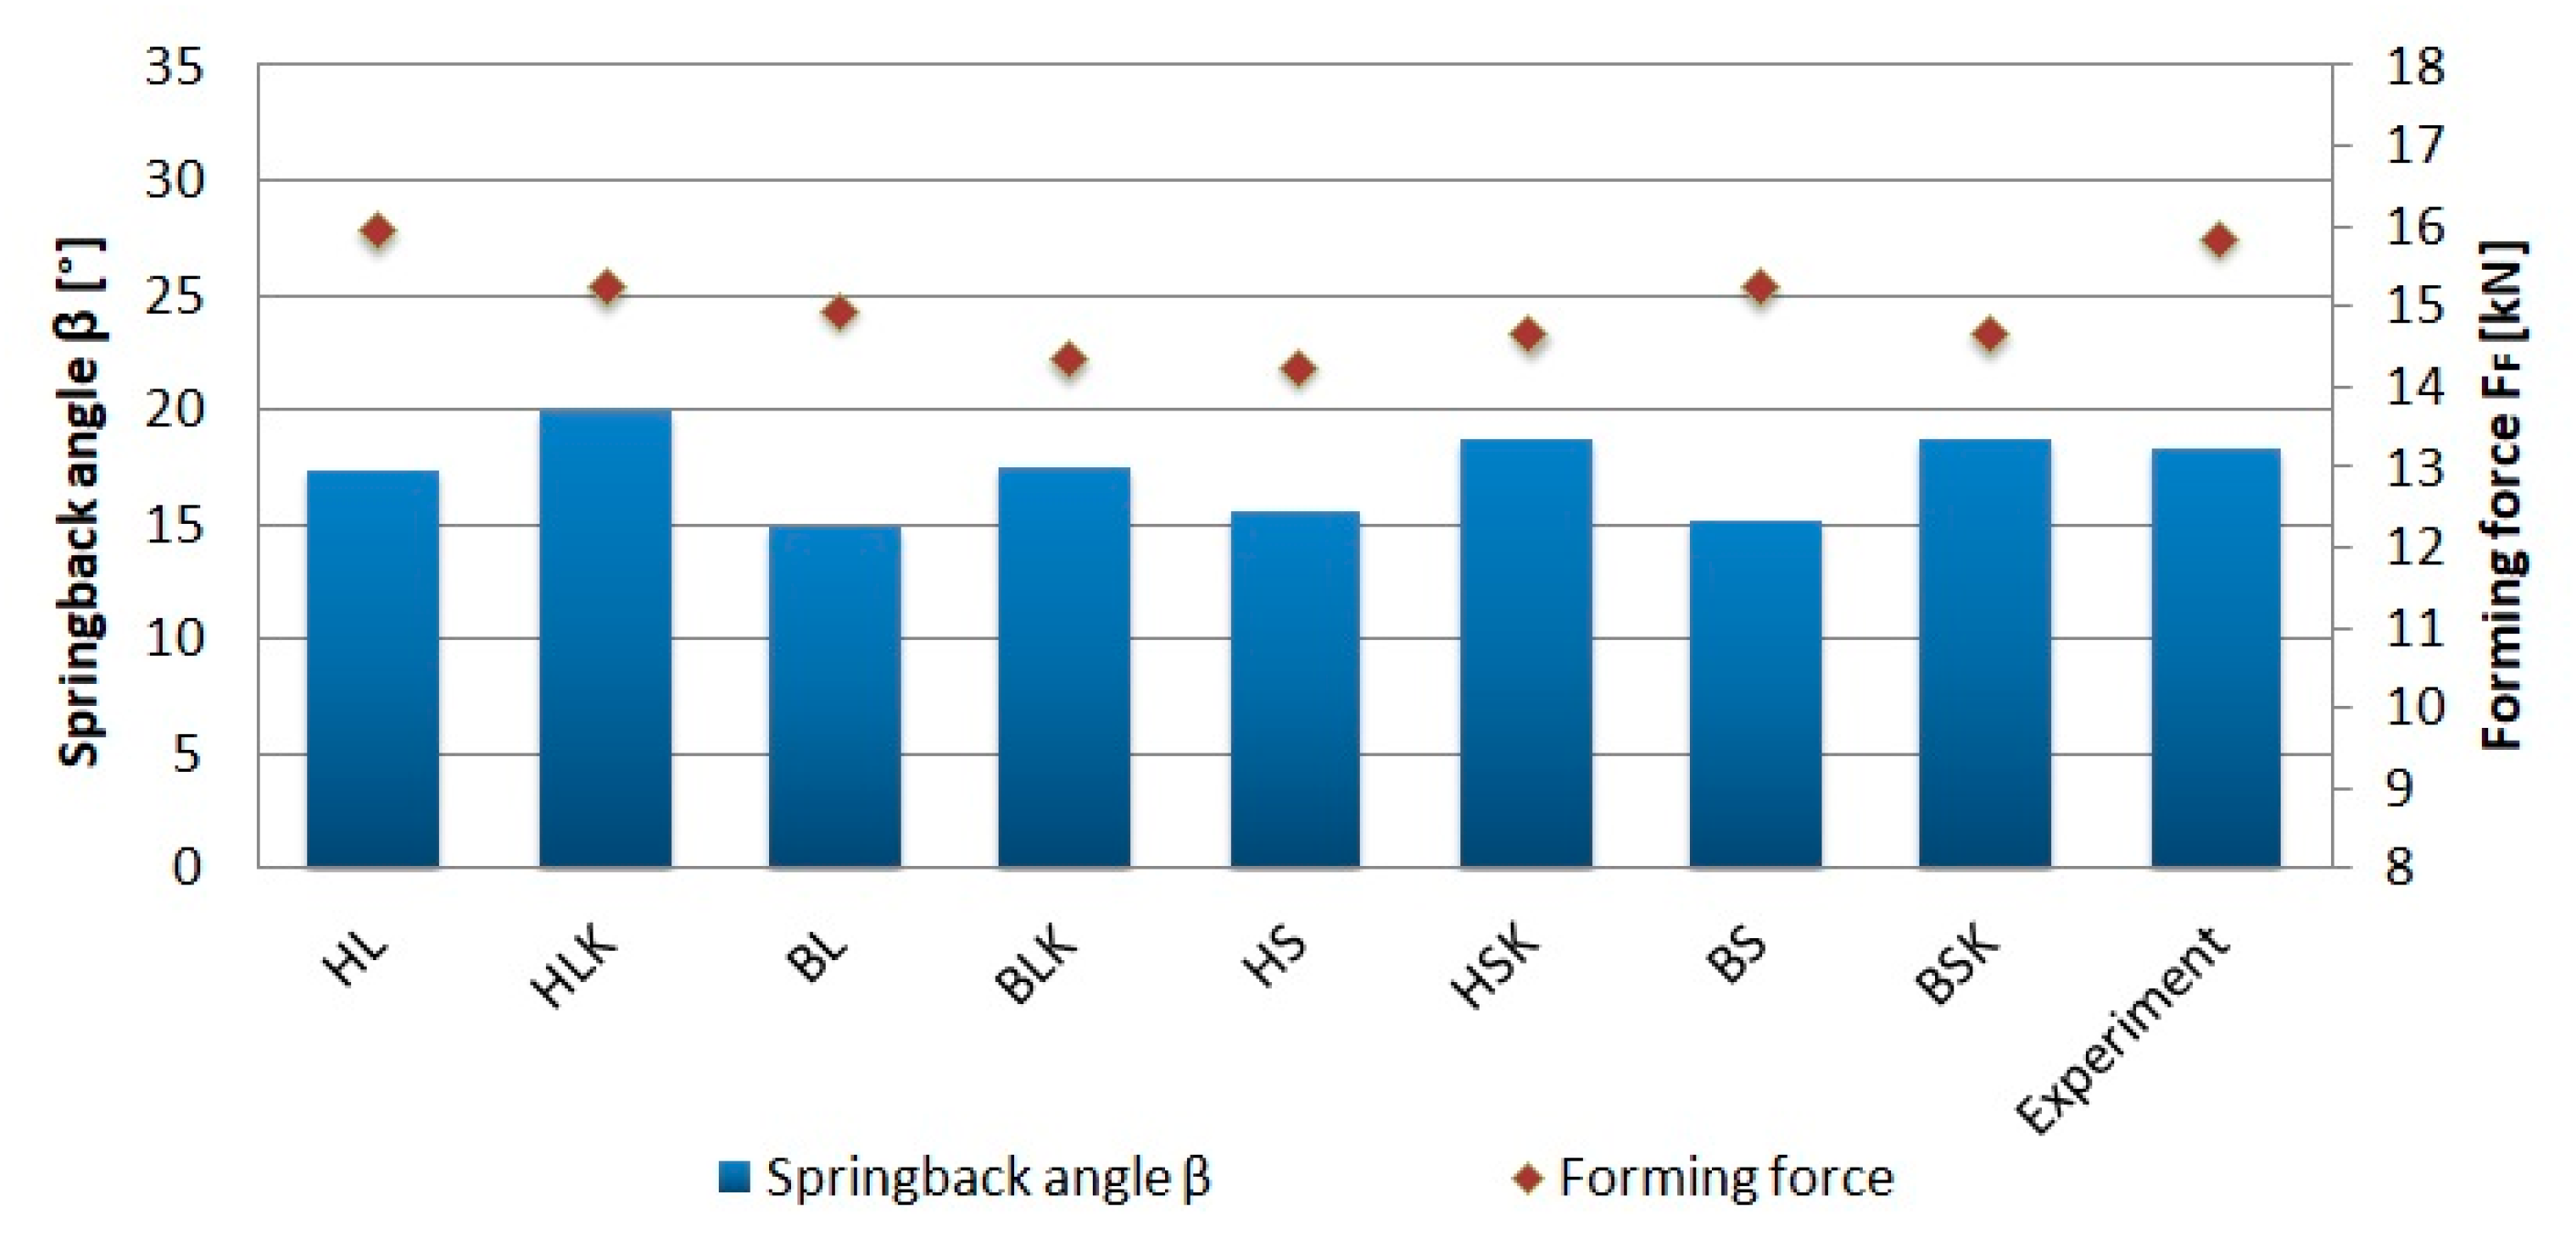
| With counterpunch | 12.4 ± 1.03 | 17.6 ± 0.48 | 15.8 ± 0.20 |
| Abbreviation | Yield Locus | Hardening Law | Isotropic–Kinematic Hardening |
|---|---|---|---|
| HL | Hill48 | Ludwik | no |
| HLK | Hill48 | Ludwik | yes |
| BL | Barlat89 | Ludwik | no |
| BLK | Barlat89 | Ludwik | yes |
| HS | Hill48 | Swift | no |
| HSK | Hill48 | Swift | yes |
| BS | Barlat89 | Swift | no |
| BSK | Barlat89 | Swift | yes |
| Evaluated Parameters | HL | HLK | BL | BLK | HS | HSK | BS | BSK | Experiment |
|---|---|---|---|---|---|---|---|---|---|
| α [°] | 8.2 | 14.4 | 7.0 | 11.1 | 8.2 | 12.0 | 7.6 | 12.1 | 24.5 |
| Dev α [%] | −66.5 | −41.2 | −71.4 | −54.7 | −66.5 | −51.0 | −69.0 | −50.6 | - |
| β [°] | 14.0 | 18.9 | 11.8 | 16.4 | 14.0 | 17.5 | 12.9 | 16.6 | 28.6 |
| Dev β [%] | −51.0 | −33.9 | −58.7 | −42.7 | −51.0 | −38.8 | −54.9 | −42.0 | - |
| Evaluated Parameters | HL | HLK | BL | BLK | HS | HSK | BS | BSK | Experiment |
|---|---|---|---|---|---|---|---|---|---|
| α [°] | 7.9 | 13.7 | 9.5 | 12.2 | 11.2 | 11.7 | 8.3 | 11.9 | 12.4 |
| Dev α [%] | −36.3 | 10.5 | −23.4 | −1.6 | −9.7 | −5.6 | −33.1 | −4.0 | - |
| β [°] | 17.4 | 20 | 14.9 | 17.5 | 15.6 | 18.7 | 15.1 | 18.7 | 18.3 |
| Dev β [%] | −4.9 | 9.3 | −18.6 | −4.4 | −14.8 | 2.2 | −17.5 | 2.2 | - |
© 2020 by the authors. Licensee MDPI, Basel, Switzerland. This article is an open access article distributed under the terms and conditions of the Creative Commons Attribution (CC BY) license (http://creativecommons.org/licenses/by/4.0/).
Share and Cite
Mulidrán, P.; Spišák, E.; Tomáš, M.; Slota, J.; Majerníková, J. Numerical Prediction and Reduction of Hat-Shaped Part Springback Made of Dual-Phase AHSS Steel. Metals 2020, 10, 1119. https://doi.org/10.3390/met10091119
Mulidrán P, Spišák E, Tomáš M, Slota J, Majerníková J. Numerical Prediction and Reduction of Hat-Shaped Part Springback Made of Dual-Phase AHSS Steel. Metals. 2020; 10(9):1119. https://doi.org/10.3390/met10091119
Chicago/Turabian StyleMulidrán, Peter, Emil Spišák, Miroslav Tomáš, Ján Slota, and Janka Majerníková. 2020. "Numerical Prediction and Reduction of Hat-Shaped Part Springback Made of Dual-Phase AHSS Steel" Metals 10, no. 9: 1119. https://doi.org/10.3390/met10091119
APA StyleMulidrán, P., Spišák, E., Tomáš, M., Slota, J., & Majerníková, J. (2020). Numerical Prediction and Reduction of Hat-Shaped Part Springback Made of Dual-Phase AHSS Steel. Metals, 10(9), 1119. https://doi.org/10.3390/met10091119