Article

The Effect of the Processing Parameters on the Properties of the Liquid Phase Spark Plasma Sintered 80Fe-20(Al + MWCNT) Magnetic Metal Matrix Nanocomposites

1
Institute of Carbon Technology, Jeonju University, Jeollabuk-do 55069, Korea
2
Department of Mechanical and Automotive Engineering, Jeonju University, Jeollabuk-do 55069, Korea
3
Department of Mechanical Engineering, Vision College of Jeonju, Jeollabuk-do 55069, Korea
*
Authors to whom correspondence should be addressed.
Metals 2020, 10(7), 962; https://doi.org/10.3390/met10070962
Submission received: 2 June 2020 / Revised: 15 July 2020 / Accepted: 15 July 2020 / Published: 16 July 2020
(This article belongs to the Special Issue Spark Plasma Sintering of Metals and Metal Matrix Nanocomposites)

Abstract

:
In this paper, the liquid phase sintering was performed using spark plasma sintering to produce iron (Fe: 80 vol%)–aluminum (Al)–multi-walled carbon nanotubes (MWCNTs) magnetic hybrid metal matrix nanocomposites. The properties of the nanocomposites were investigated by considering different parameters of materials processing. The reinforcement of MWCNT with a content of 0–2 vol% did not affect the saturation magnetization of the nanocomposites but increased the coercivity and reduced both the electrical resistivity and the mechanical transverse rupture strength. It was found that milling the powders for 24 h resulted in composite with high saturation magnetization (148.820 A·m2/kg) and high coercivity (2175.6 A/m) but further milling time had reduced the values of magnetic properties. The mixture of Fe nanoparticles and Fe microparticles in composites with a nanoparticles-to-microparticles volume ratio of 1:1 has led to the enhanced saturation magnetization up to 157.820 A·m2/kg and reduced the coercivity of 50.20% in comparison with the Fe nanoparticles based nanocomposites. That mixture exhibited good electrical resistivity but caused the reduction of mechanical strength. The post-sintering annealing has significantly improved the magnetic softness of the composites by reducing the coercivity up to 854.30 A/m and increased the saturation magnetization.

1. Introduction

Metal matrix composites (MMC) are the composite materials that generally consist of metal, as the base (matrix) material, and additional phases, which are known as the reinforcement materials. In case at least one of the components (either the metallic matrix or the reinforcements) is at nanoscale, the composite is usually referred to as the metal matrix nanocomposite (MMNC). The MMNC materials are attractive materials because they can have enhanced properties such as tensile and compression strengths, high temperature mechanical properties, corrosion resistance, the coefficient of thermal expansion and others than the monolithic counterparts [1] and the MMC [2]. It is worth noting that the improvement in the selected properties of the final composites depends on various factors including; matrix materials, selected reinforcements and fabrication processes. While aluminum, titanium and magnesium are the most used as matrices for structure applications [3,4,5,6,7,8], it is believed that the ferromagnetic metals like iron, nickel and cobalt and their alloys are a suitable choice as matrix materials for electromagnetic applications. However, to the best of our knowledge, up to now there are very few works that have been reported on iron metal matrix nanocomposites and their magnetic properties. For instance, Gupta et al. [9,10,11] have studied the electrochemical behavior, hardness and wear behavior of the iron-alumina nanocomposites. Additionally, in their studies, they reported that the iron-alumina nanocomposites exhibited the improved hardness, density wear resistance and corrosion resistance. Khosla et al. [12] have synthesized the iron-silicon carbide metal matrix nanocomposites using powder metallurgy method at different sintering temperature. In their study, the found that density was decreased whereas the hardness was increased by increasing the sintering temperature. However, in the above studies [9,10,11,12], the electrical and magnetic properties of the nanocomposites were not investigated.
It is well known that iron (Fe) has the best magnetic properties such as the highest saturation magnetization among all elements and high relative permeability. This makes it a potential material for electromagnetic applications. However, the use of pure iron (alone) in electromagnetic devices is usually not advised due to different application requirements that the pure iron, itself, cannot provide. These requirements may include the properties such as; high electrical resistivity, which is one of the requirements to reduce eddy current losses, low core losses (especially at high frequency), improved mechanical properties and good corrosion resistance.
Therefore, pure iron is usually combined with other elements to form alloys or composites for industrial practices [13,14]. It is worth noting that both alloys and metal matrix composites are formed through the combination of two or more components. However, in the case of alloys; the components do not retain their original properties after alloying and there is no strict proportion in elemental composition; whereas in the case of composites, the components retain their original properties and a strict proportions in elemental composites is needed [15]. Although, aluminum (Al) has lower electrical resistivity than iron, it was demonstrated that the combination of iron (Fe) and aluminum (Al) produce the final material with higher electrical resistivity than pure Fe [13,16,17,18].
Carbon nanotubes (CNTs) are among the most attractive carbon materials with an average Young’s modulus of about 1.8 TPa, high aspect ratio, low density and high flexibility [19]. Those are some of the fascinating characteristics of CNTs that attract many investigators to use CNTs as a reinforcement in metal matrix nanocomposite materials [20,21,22,23,24]. For instance, Amar et al. [19] reported the improvement of both the mechanical strength and magnetic properties of the Fe50Co alloy by adding CNTs as a reinforcement with a volume content of 0.5 vol% and 1 vol%. A further increase in CNT content led to poor properties. Akshay et al. [25] studied the fabrication of iron (Fe) matrix reinforced with multi-walled carbon nanotubes (MWCNTs) by comparing the wet and dry method of mixing the components (Fe and MWCNT). For wet mixing method (sonication), the ethanol was used as the process control agent whereas for the dry mixing method (high energy ball milling), the process control agent was stearic acid. They reported the occurrence of mechanical and chemical degradation of reinforcements (MWCNT) when the wet method was used. On the other hand, the dry method (ball milling) was found to give uniform dispersion of MWCNT in the matrix. The study of Akshay et al. [25] has focused on microstructures of the Fe-MWCNT nanocomposites but there were no further report on structural and physical properties of these nanocomposites.
There are several techniques that can be used to produce metal matrix composites, which may be performed either by solid state processing or liquid state processing or deposition processing [1,3,26]. Among them, the powder metallurgy, which consists of the blending of powders and additives followed by consolidation and sintering is the most preferred technique due to its simplicity. Moreover, the powder metallurgy can allow one to overcome the problem of producing the undesirable phases in the final composites when compared to other methods [27,28]. For consolidation of the MMC and MMNC, the spark plasma sintering (SPS) was found to be a very promising sintering technique as it is the fast processing method and considerably limits the grain growth that often occurs when the conventional sintering methods such as hot-isostatic pressing, hot pressing and high-temperature extrusion are used [29,30,31]. Most of the previous work on the MMC and MMNC using spark plasma sintering have focused on solid state processing to consolidate the composites where the sintering temperatures were lower than the melting point of each and every component [29,32,33]. It is not common to find work in the literature where the MMC or MMNC composites were fabricated through the liquid state processing using spark plasma sintering. Basically, during the process of solid state sintering all the components stay in their solid phase; whereas the liquid phase sintering is a sintering process under the conditions where there is a coexistence of liquid phase and solid phase [34].
In this work, the fabrication of 80Fe-20(Al + MWCNT) nanocomposites sintered through liquid phase processing using spark plasma sintering at the sintering temperature of 800 °C was attempted. The sintering temperature in this work was obviously higher than the melting point of Al (660 °C). The magnetic and mechanical properties of the composites were analyzed according the processing parameters such as the MWCNT content and ball milling time and post-sintering heat treatment. In fact, in the previous study by the authors [16,18], the Fe-Al-MWCNT magnetic hybrid nanocomposites (with Fe content up to 70 vol%) sintered at 600 °C has shown the composites to have high magnetic coercivity (greater than 5000 A/m) making the materials magnetically hard. The intention of the present paper is to produce the relatively softer magnetic nanocomposite materials with lower coercivity.

2. Experimental Procedures

2.1. Materials and Sample Preparations

The commercial iron nanoparticles powder (nFe: average particles size of 90–110 nm and purity of 99.9%) and aluminum particles (Al: average particles size of 30–40 μm and purity of 99.9%) were purchased from Ditto-Technology Co., Ltd., Gunpo, Korea. The iron microparticles (mFe: average particles size of 40–50 μm and purity of 99.9%) were purchased from Avention Co., Ltd., Incheon, Korea. The multi-walled carbon nanotubes powder (MWCNT: average diameter of 8–15 nm and length of 5–20 µm) was supplied by Nanosolution, Jeonju, Korea. The scanning electron microscope (SEM) images that show the morphology of the as-received powders are shown in Figure 1. The powder mixtures were prepared according to the volume ratio of each component, as shown in Table 1, by considering a cylindrical sample of 50 mm diameter and 30 mm length. The effect of MWCNT on the properties of the nanocomposites was investigated for MWCNT content varying from 0 to 2 vol%. The effect of mixing the iron nanoparticles and iron microparticles on the properties of the materials was also studied.
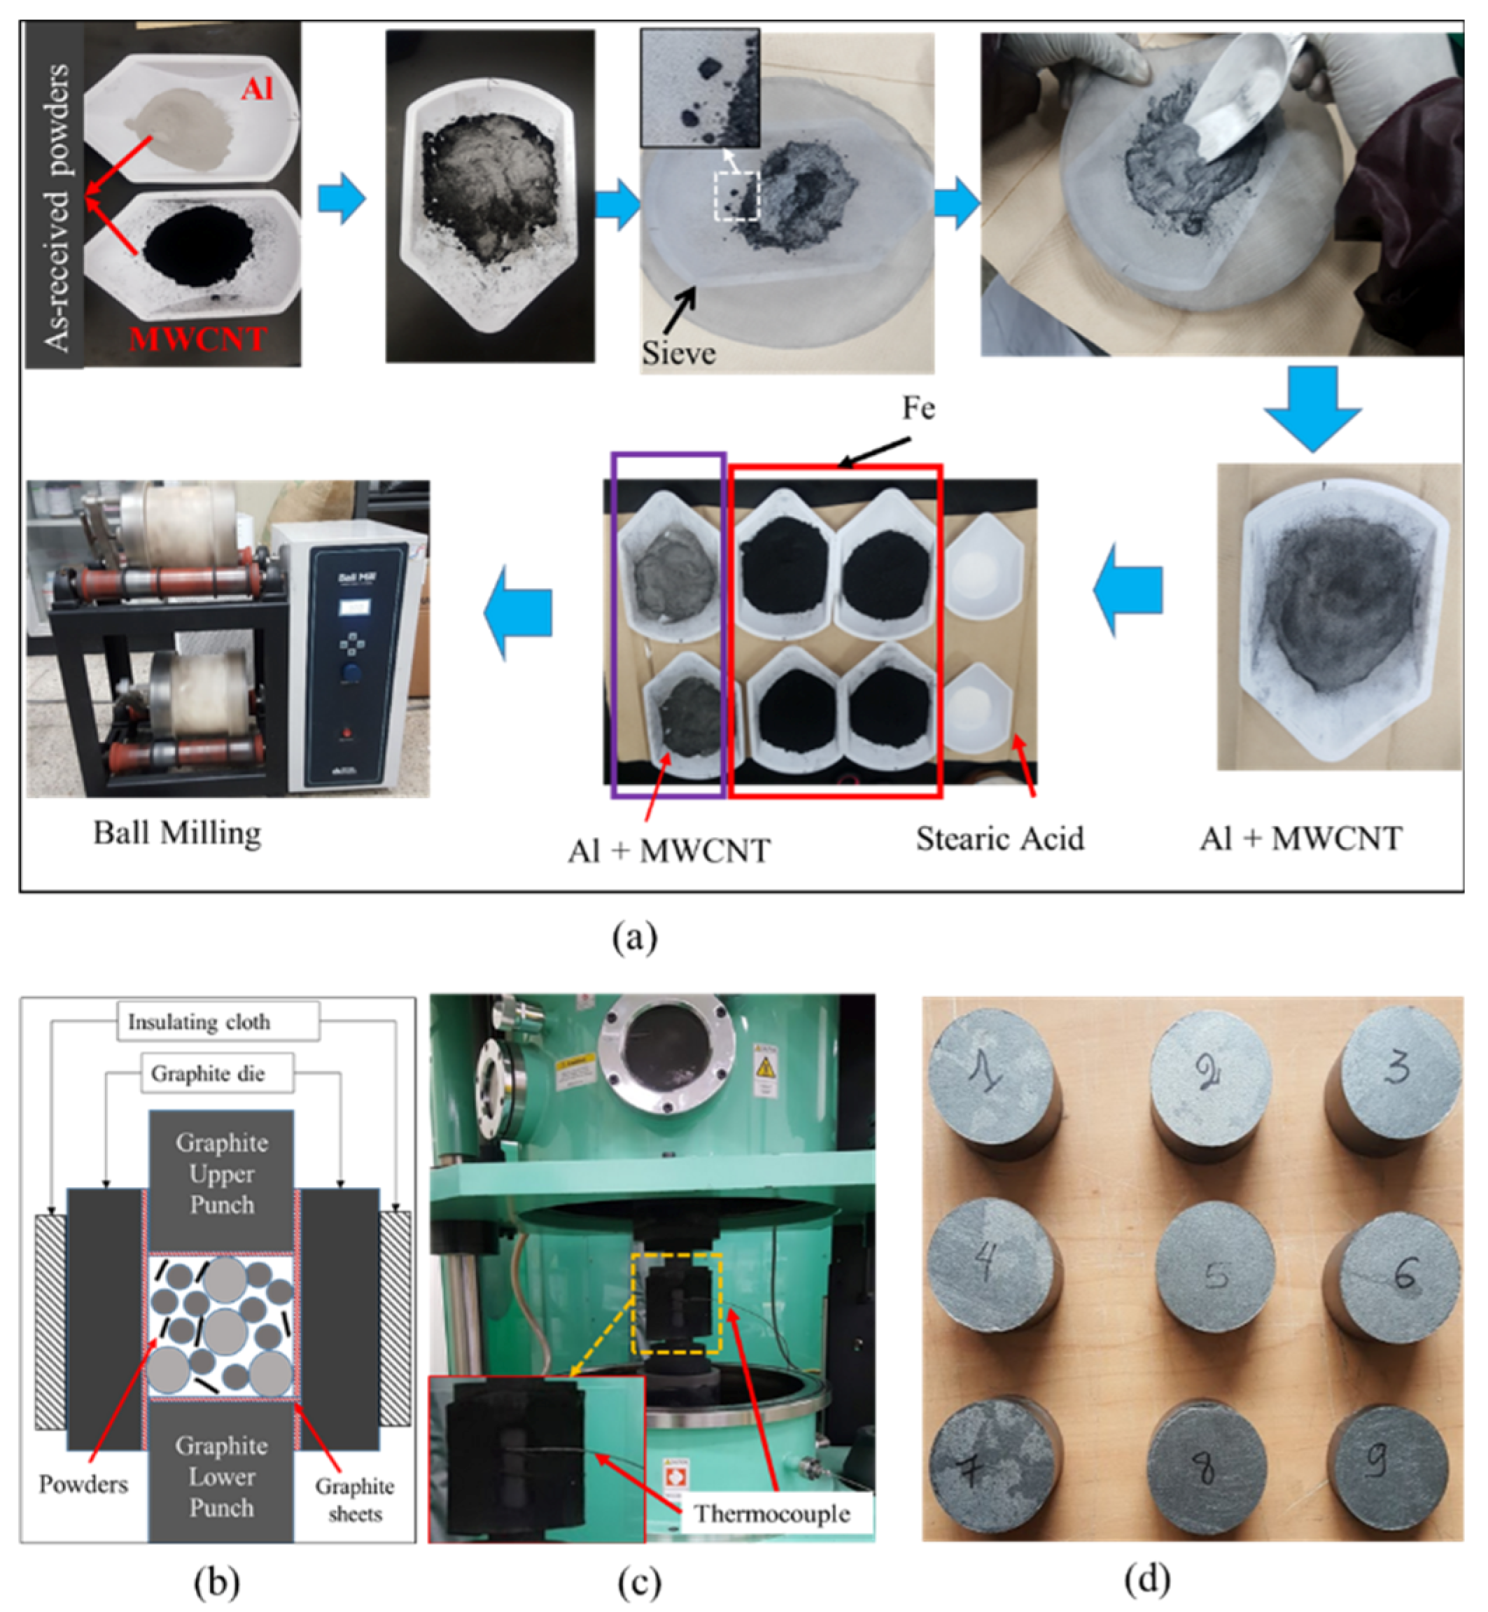
Figure 2 shows the step by step for the preparation of the powder mixtures. As shown in Figure 2a the Al and MWCNT powders were measured according to their respective volume ratios in the composite and manually mixed prior to the ball milling of all composite powders in order to reduce the MWCNT clusters. To do so, the sieve (with opening size of 75 µm) was placed over the container, and then the Al-MWCNT powders were placed over the surface of the sieve, as illustrated on Figure 2a. Thereafter, the laboratory spoon was used to slide the powders back and forth so that the Al-MWCNT mixture could fall in the container with MWCNT having smaller clusters in the mixture than in the as-received MWCNT powders. Then the Al-MWCNT pre-mixed powders, iron powders, stearic acid (4 g) and alumina balls were put in a milling jar in order to mix the powders using the ball milling technique on the horizontal roll ball mill. The stearic acid was used as the process control agent. The alumina balls (60 balls) of 10 mm diameter were used as milling media. The milling speed was set to 300 rpm. The effect of milling time on the material properties was studied by comparing the composites fabricated with the powders milled for 12 h, 24 h and 48 h.
The mixed powders were then filled in graphite die, as shown in Figure 2b. In order to make sure that outer-lengths of upper and lower punches were equal before spark plasma sintering, their adjustment was performed using a hydraulic press. This step could also improve the powder packing in the mold through the rearrangement of the particles and promote the shrinkage of pores within the compacts.
The prepared die filled with the powders was put in the chamber of spark plasma sintering (SPS) machine (SPS-3.20MK-V, SPS Syntex Inc., Kawasaki, Japan) for compaction and sintering to produce the bulk samples, as shown in Figure 2c,d. Then the chamber was closed and the vacuum atmosphere was applied in the chamber. During the sintering process, the initial pressure of 20 MPa was applied while increasing the temperature from room temperature to 500 °C. Then, from 500 to 800 °C, the pressure of 40 MPa was applied. After the temperature reached 800 °C, both the temperature and the pressure were maintained constant for 10 min. Then the pressure was completely released and the sample was cooled in the SPS Chamber. For comparison, the sample with pure iron nanopowders was also produced using spark plasma sintering. The whole sintering process of the materials was performed in vacuum atmosphere. Thereafter, the electrical discharge machine (EDM) was used to cut the bulk sample into the specimens according to the testing of interest for characterization of materials properties.

2.2. Characterization

The density of the each material was obtained from the ratio of the mass of the sintered sample and its volume. The field emission scanning electron microscopy (FE-SEM, JSM-7100F, Joel, Tokyo, Japan) and energy dispersive X-ray spectrometer (EDS; Aztec Energy, Oxford Instruments, Abingdon, UK) were used to study the morphology and elemental distribution of the composites respectively. The X-ray powder diffraction (XRD, CuKα: λ = 1.54 Å) was used to study the crystallography of the composites and the XRD data were analyzed using the software MDI Jade 5.0. The mean crystallite size were calculated using the Scherrer equation [35]. The X-photoelectron spectrometer (XPS, K-Alpha, ThermoFisher Scientific, Waltham, MA, USA) was used to analyze the composition and the chemical state of the sintered composites. The cubic specimens of 2 mm × 2 mm × 2 mm were machined from the bulk samples and used for magnetic properties measurements using vibrating sample magnetometer (VSM, 7404-S, Lakeshore Cryotronics. Inc., Westerville, OH, USA) with an applied field of ±800 kA/m. The preparation of the specimens (with 31.7 mm in length, 12.7 mm in width and 6.35 in thickness) and their transverse rupture strength (TRS) testing were performed according to ASTM B528 [36] using a universal testing machine, ST-1001 (SALT Co., Ltd., Incheon, Korea). The microhardness was also tested using Vickers Microhardness Tester (HM-123, Code No 810-990K, Mitutoyo Corporation, Kawasaki, Japan) with an applied load of 0.1 kgf for a dwell time of 10 s. Ten values of microhardness were taken and averaged for each specimen. The electrical resistivity measurements were taken using the four probe method on rectangular samples, which had the same size as the TRS specimens. For each sample, 20 measurements were recorded and averaged [18]. In order to compare the magnetic properties of our materials, the standard toroidal sendust core (Fe-Si-Al alloys, code: CS610125) was purchased from Chang Sung Corporation (South Korea). Since the VSM measurements requires small sample, the testing sample (2 mm × 2 mm × 2 mm) of sendust core was machined in the same way as our materials using the electrical discharge machining method.

3. Results and Discussion

3.1. Effect of MWCNT Content on the Properties of the Nanocomposites

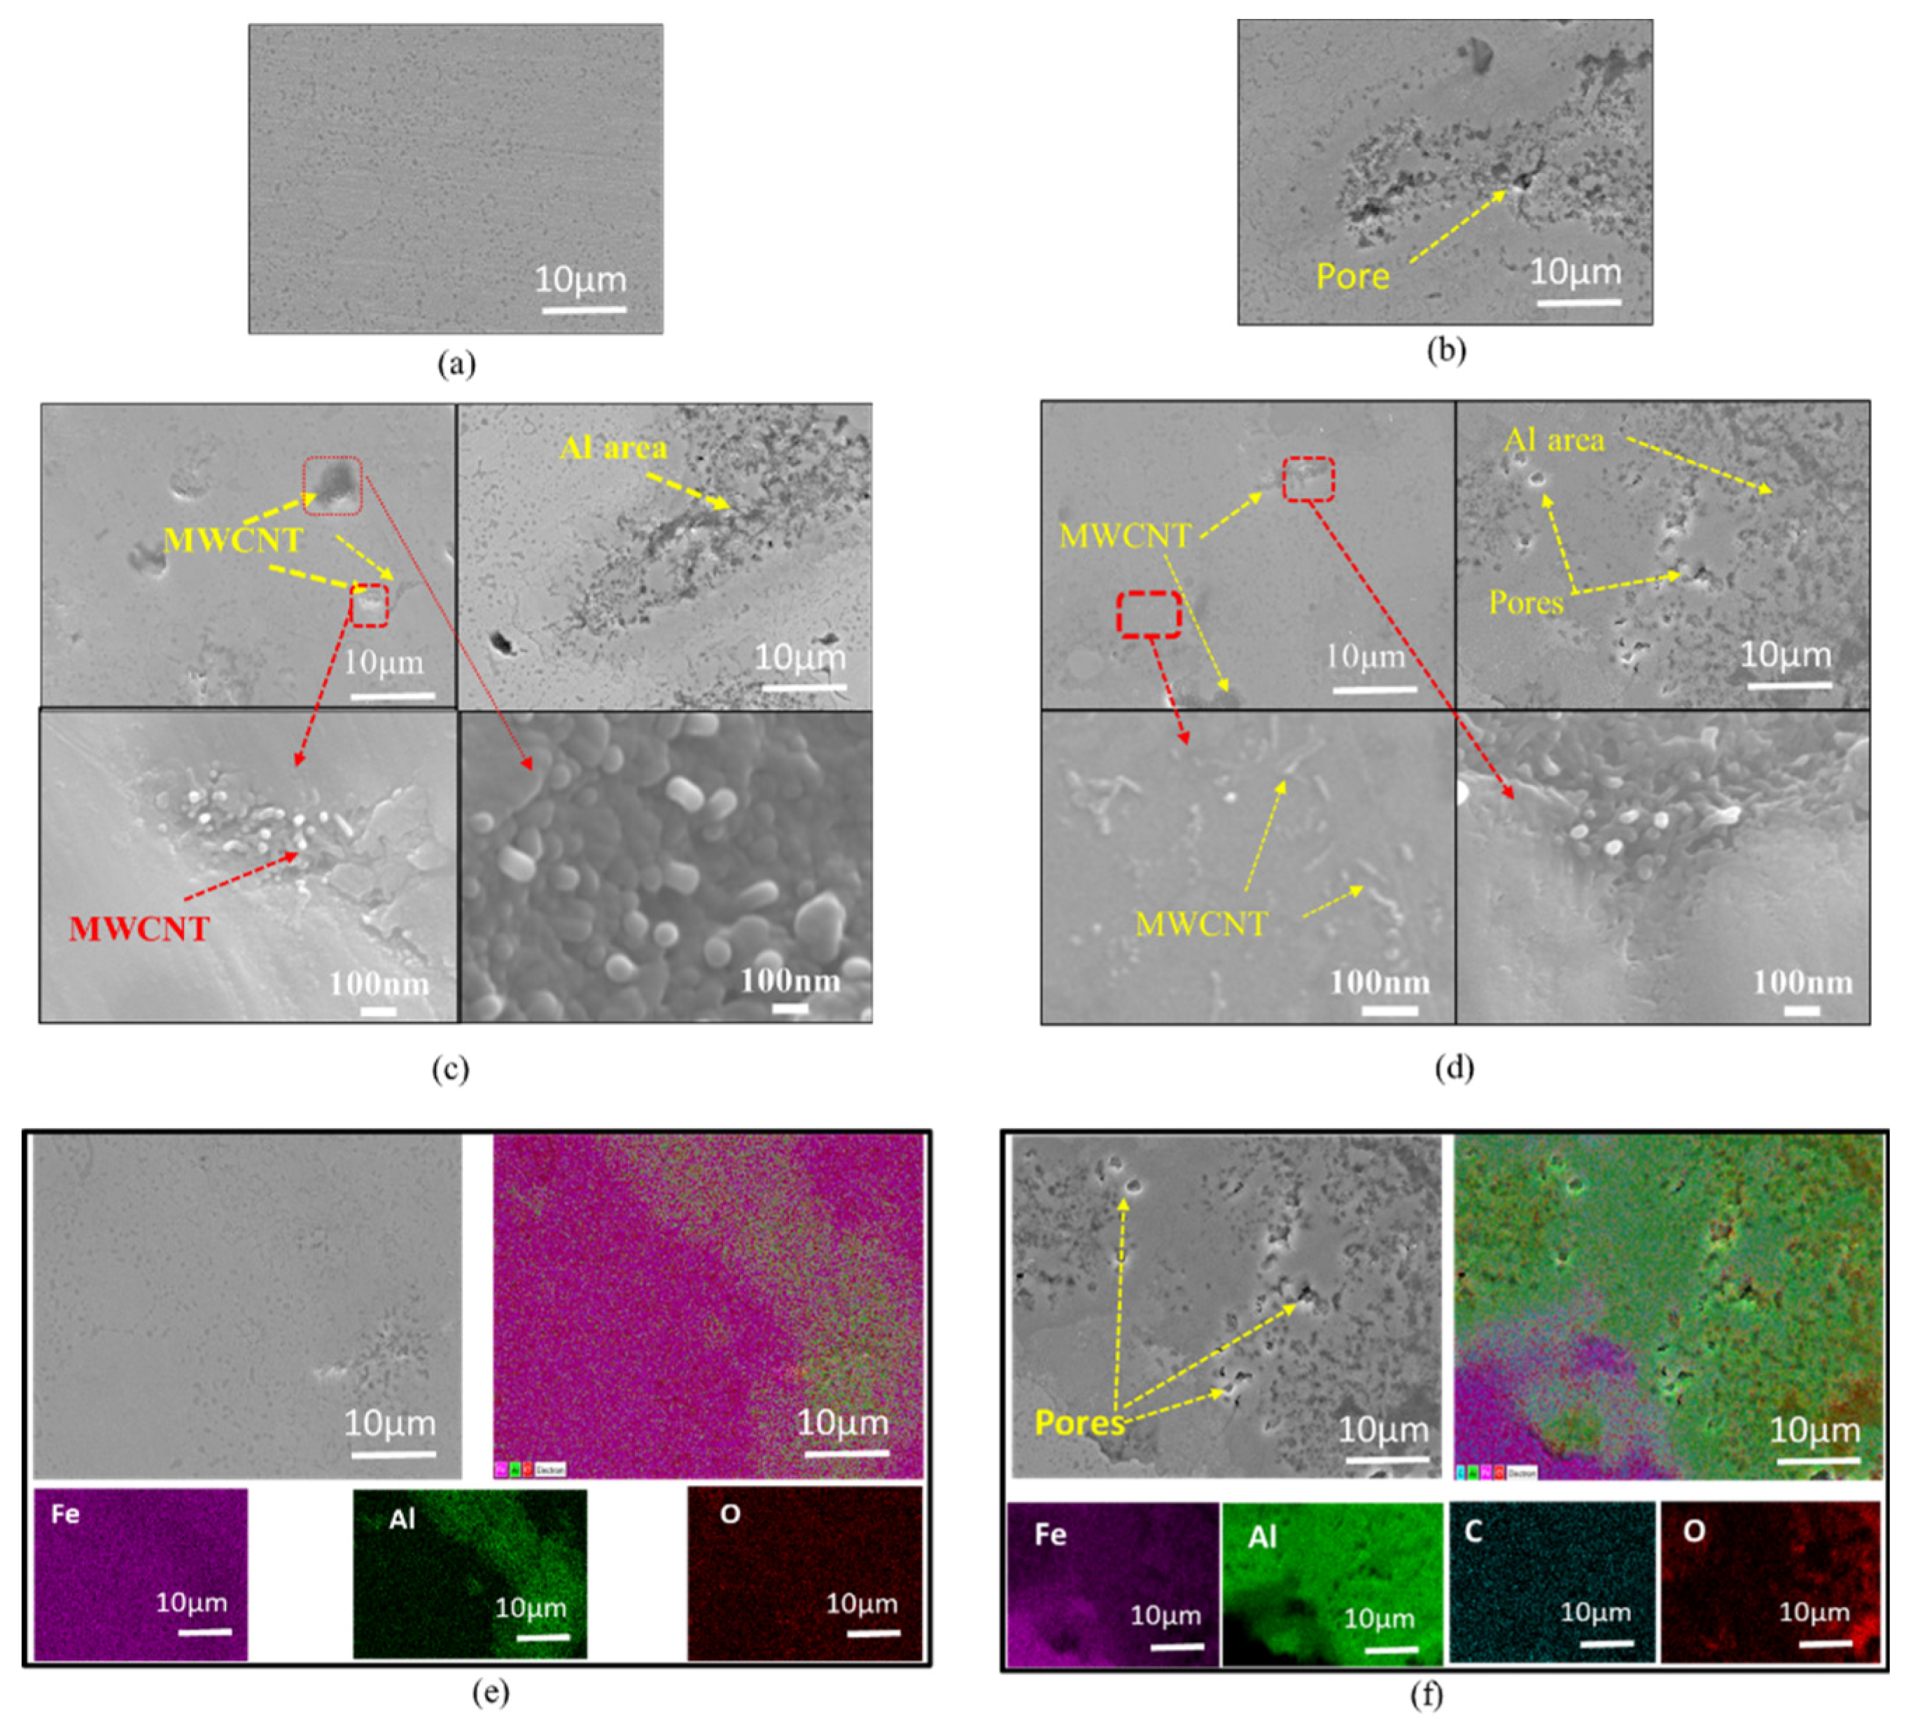
Figure 3a–d presents the FE-SEM images showing their surface morphology of the composite materials in comparison with the unreinforced bulk iron. The surface analysis of the internal cross-section (at 10 mm from the circumference of the samples (i.e., mold surface)) of the sintered materials using FE-SEM and EDS showed all Fe-Al based materials (Figure 3b–f) had a relatively dense area, similar to that of pure Fe compact (Figure 3a), and another area containing Al with some porosities. The microstructure of the later area can be attributed to high temperature sintering, which is higher than the melting point of aluminum. In fact, the high temperature led to the formation of aluminum liquid, which have flowed between the solid particles of other components and wetted them causing considerable change in microstructures of the final materials. The FE-SEM images in Figure 3c,d show the dispersion of MWCNT in composites as small MWCNT clusters and single MWCNTs. The high magnification (×50,000) of the area with MWCNT clusters showed that the MWCNT were embedded in the metal matrix.
The dispersion of each component was observed using EDS mapping and the images are shown in Figure 3e,f. It can be seen from Figure 3e,f that the area with a high concentration of Al had more porosities than the area with a high concentration of Fe. The carbon (C) that represents MWCNT was found all-over the surface of the Fe-Al-MWCNT composites, which suggested a good dispersion of MWCNTs in the composites. This may be explained by the fact that the mixing process of MWCNT and Al using a sieve prior to the ball milling have contributed to the reduction of the MWCNT clusters size and improved the dispersion of MWCNT within nanocomposites. The presence of carbon on all the surface of the sample may also be attributed to the promoted diffusion of carbon atoms (from MWCNT and stearic acid) within the material due to the high sintering temperature (800 °C) and long sintering time (10 min) [37]. Another issue that was observed was the presence of a higher concentration of oxygen in the area with high aluminum content in comparison to the other area of the sample. It is believed that the polished areas of the samples were sensitive to the oxidation after being exposed to the air, especially the area of melted aluminum. This was different from the previous study on the Fe-Al-MWCNT nanocomposites that were sintered at 600 °C where the oxidation tended to occur on the surface of iron area and the solid aluminum particles were clearly and distinctively separated from iron particles and MWCNT [16,18]. Additionally, the existence of oxygen in the materials may be resulted from the contamination during the ball milling due to the use of stearic acid.
The phase identification in the materials with a different content of MWCNT (0–2 vol%) was studied using X-ray diffraction. Figure 4a,b shows the XRD plots of the sintered composites in comparison to pure powder materials. The detailed analysis of XRD patterns was conducted in Figure 4b–f to check whether some carbides or other additional phases were formed in the composites. One can notice, in Figure 4b, that some iron oxides peaks, namely Fe3O4 (JCPDS Ref No: 019-0629) and α–Fe2O3 (JCPDS Ref No: 87-1164) were observed in XRD patterns. The formation of iron carbide (Fe3C: JCPDS 06-0686) was observed in the composites reinforced with MWCNT as shown in Figure 4e,f. This agrees with the previous studies [38] that have reported that when CNTs are used as a reinforcement in the metal matrix, there is a chance for CNT to react with metals and form the carbides. In fact, the carbides were formed due to the promotion of carbon atom diffusion at high sintering temperature [27,37].
The disappearance of these Al peaks (Al(111) and Al(311)) in the nFe-Al based materials indicates that Al has partially reacted with iron to form Fe-Al intermetallic compounds like FeAl or Fe3Al [39,40]. The others peaks of Al (200) and (220) may be hidden behind the Fe (110) and Fe (220) respectively. As shown in Figure 4c–f, the zooming of high intensity peaks of pure Fe in the angular (2 theta) range of 40–50°, the peaks of Fe-Al compounds were observed in the composites and they can be ascribed to FeAl (110) (JCPDS Ref No: 01-1257) or Fe3Al (220) (JCPDS Ref No: 06-0695) [39]. It was noticed that the intensity of intermetallic compounds decreased when the MWCNT content was increased while decreasing the Al content.
The highest peaks of the composites were broadened when compared to that of pure metals. Indeed, the broadening of the peaks can be justified by the greater full-width-at-half maximum (FWHM) of the Al (200)/Fe (110) XRD-peaks for the composites than for metals (Al and Fe) as shown in Figure 4g. The average crystallite sizes were calculated by considering the FWHM obtained for the Al (200)/Fe (110) peaks of the materials using the Scherrer equation [35]. It can be seen, in Figure 4g, that MWCNT reinforced composites had a smaller crystallite size ranging between 24.5 and 30 nm than that of Al (46.09 nm), Fe (48.61 nm) and 80nFe-20Al (39.68 nm). The smaller crystallite sizes in nFe-Al composites indicate that larger microstrains were induced in nFe-Al based materials when compared with the pure nFe compact [41]. The reduction of crystallite sizes in nFe-Al based materials may be ascribed to the subgrains formation, dislocations and grain boundary sliding that occurred in the materials when the heterogeneous particles interacted and their atoms tried to diffuse during the spark plasma sintering process due to the applied heat and sintering pressure.
The chemical state of the surface of the composites with a different content of MWCNT was analyzed using XPS, as shown in Figure 5. Figure 5a shows the survey spectra of the composites and Figure 5b–e compares the composites for the peaks of Fe 2p, Al 2p, O 1s and C 1s respectively. It can be seen that all composites had similar spectra of the abovementioned elements but the major peaks of the spectra detected in composites with 2 vol% of MWCNT (i.e., 80nFe-18Al-2MWCNT) were found to be sharper with higher intensities in comparison to that of other composites. The C 1s peaks were detected in all composites even in the composite without MWCNT (i.e., 80nFe-20Al). The appearance of C 1s peaks in all composites can be ascribed to the absorption of adventitious carbon on the surface of the composites due to air exposure [42,43].
The deconvolution of the Fe 2p, Al 2p, O 1s and C 1s peaks for 80nFe-18Al-2MWCNT composite are shown in Figure 5f–i. Generally, the Fe 2p spectra present two major peaks Fe 2p1/2 and Fe2p3/2. Figure 5f shows that the Fe 2p3/2 XPS peak exhibited Fe0, Fe2+ and Fe3+ peaks located at 706.69 eV, 709.96 eV and 714.32 eV respectively [44,45,46]. The ratio of Fe2+/Fe3+ in Fe 2p3/2 was about 2:1, which was greater than the ratio 1:2 reported in [47,48]. This suggests the coexistence of both Fe2O3 and Fe3O4 in the analyzed sample, which also confirmed the XRD analysis in Figure 4b. The presence of Fe2O3 was also confirmed by the detection of the satellite peak at 719.68 eV, which is associated with Fe 2p3/2 for Fe2O3 [48]. The Fe 2p1/2 XPS peak comprised of the Fe2+ (723.18 eV) and Fe3+ (729.22 eV) peaks [44]. Figure 5g that Al0 and Al3+ [44,47] were detected at the binding energy of 72.36 eV and 74.54 eV. It can be seen in Figure 5h that O 1s peak had three peaks after deconvolution, which are located at 529.65 eV, 530 eV and 531.81 eV, which correspond to Fe2+, Fe3+ and Al3+ respectively [44,45,47]. Based on the XPS analysis, it can be concluded that there was the formation of iron oxides (Fe2O3 and Fe3O4) and aluminum oxide (Al2O3) on the surface of the composites. This supports the EDS mapping (in Figure 3e,f) and XRD analysis (in Figure 4), except that the XRD did not detect the Al2O3 peaks probably due to the very low content of aluminum oxide in the materials. Based on XRD and XPS analysis, it can be assessed that the FeAl/Fe3Al were formed in materials.
Figure 5i shows that C 1s peaks can be divided into three peaks with binding energy of 285.14 eV, 285.68 eV and 288.74 eV, which were attributed to C–C, C–O and C=O bonding respectively [49]. Note that as it can be seen in Figure 5e C 1s peaks were found to be similar in the analyzed samples, except that a very slight shift of major peaks in C 1s spectra to lower binding energy was noticed in composites reinforced by MWCNT. This may be explained by the increase in species with C–C bonding on the surface of the sample when MWCNTs were used as reinforcement due to the presence of MWCNT in the form of single or clusters as was observed with SEM images in Figure 3c,d.
The variation of magnetic properties according to the CNT content in composites was investigated. For comparison, a pure iron (nanoparticles) compact was sintered and machined under the same conditions as the composites. Moreover, those properties were compared with the commercial sendust core (Fe-Si-Al alloys, code: CS610125), which was purchased from Chang Sung Corporation (South Korea) and machined for sampling.
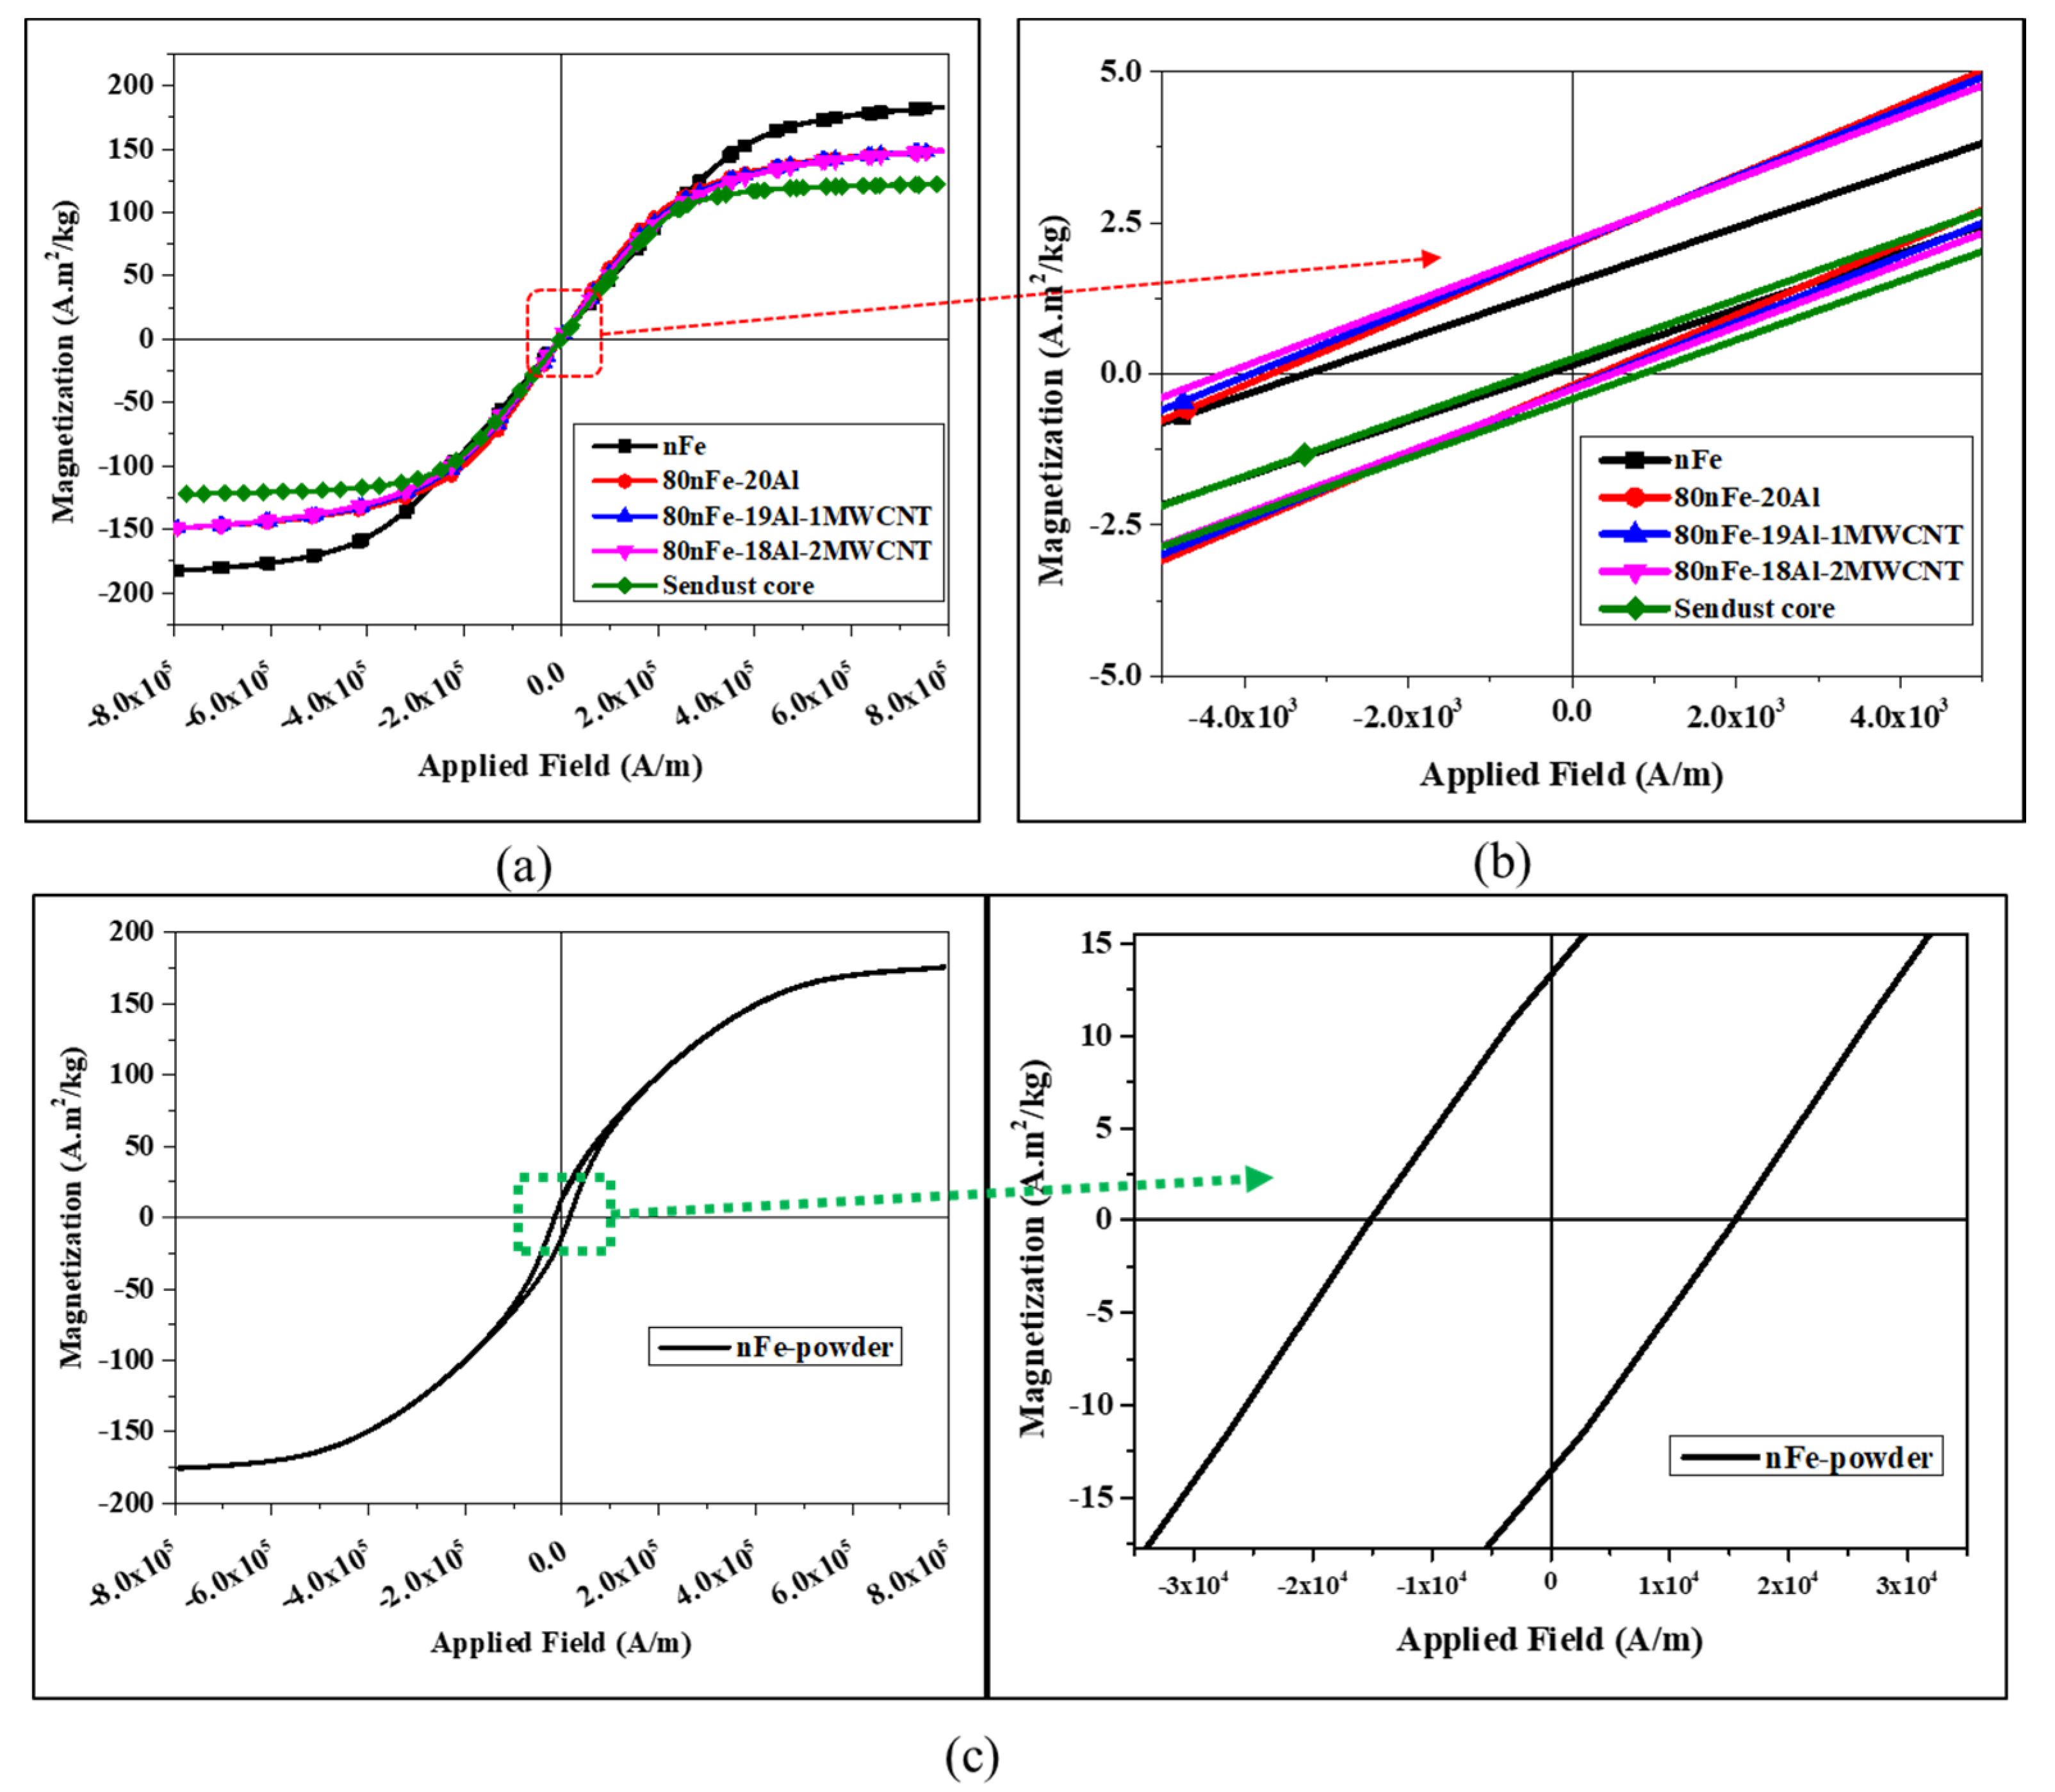
The hysteresis loops of the above materials were generated by VSM and are plotted in Figure 6. As it can be seen, the composites had the hysteresis loops with slopes comparatively similar to that of pure iron compact and sendust core. The comparison among the composites showed that the incorporation of MWCNT in composites did not significantly affect the saturation magnetization. In this case, all Fe-Al based composites had a saturation magnetization close to 148.8 A.m2/kg, which is higher than that of sendust core (122.2 A.m2/kg) as shown in Table 2.
Table 2 compares the typical magnetic properties and the density of composites with the commercial sendust core. It can be seen that composites had higher coercivity (1995.70–2368.63 A/m) and higher remanence (1.16–1.22 A·m2/kg) than sintered pure iron and sendust core (Fe-Si-Al alloys). Both the coercivity and remanence were increased with an increase of MWCNT content. The increase in coercivity with respect to the MWCNT content in composites can be explained by the fact that by increasing the amount of MWCNT, which are not magnetic materials, there is a chance of increasing the number and size of MWCNT clusters, which in turn promotes the decoupling of neighboring magnetic grain domains and result in high coercivity [50]. The high coercivity of the nFe-Al based composite was also attributed to the high coercivity of the initial iron nanoparticles and to the formation of carbides and FeAl/Fe3Al compounds, as was shown in XRD analysis (Figure 4). In addition, as shown in Figure 4g, the materials exhibited small grain sizes (<50 nm), which can explain such high coercivity of the materials because the grain boundaries of those small grains would promote the magnetic domain-mall pinning effect [51], and therefore demagnetization of the materials would require high magnetic energy leading to greater coercivity.
The sintering process of the iron nanoparticles has reduced coercivity up to 90.42% and improved the saturation magnetization as compared to the as-received iron nanopowders (see Figure 6 and Table 2).
As shown in Table 2, although there was not significant change in the density of the composites, the density decreased as the content MWCNT increased and the composites had comparatively lower density than the pure iron compact. That is because MWCNT is lighter than both Al and Fe, and Al is lighter than Fe.
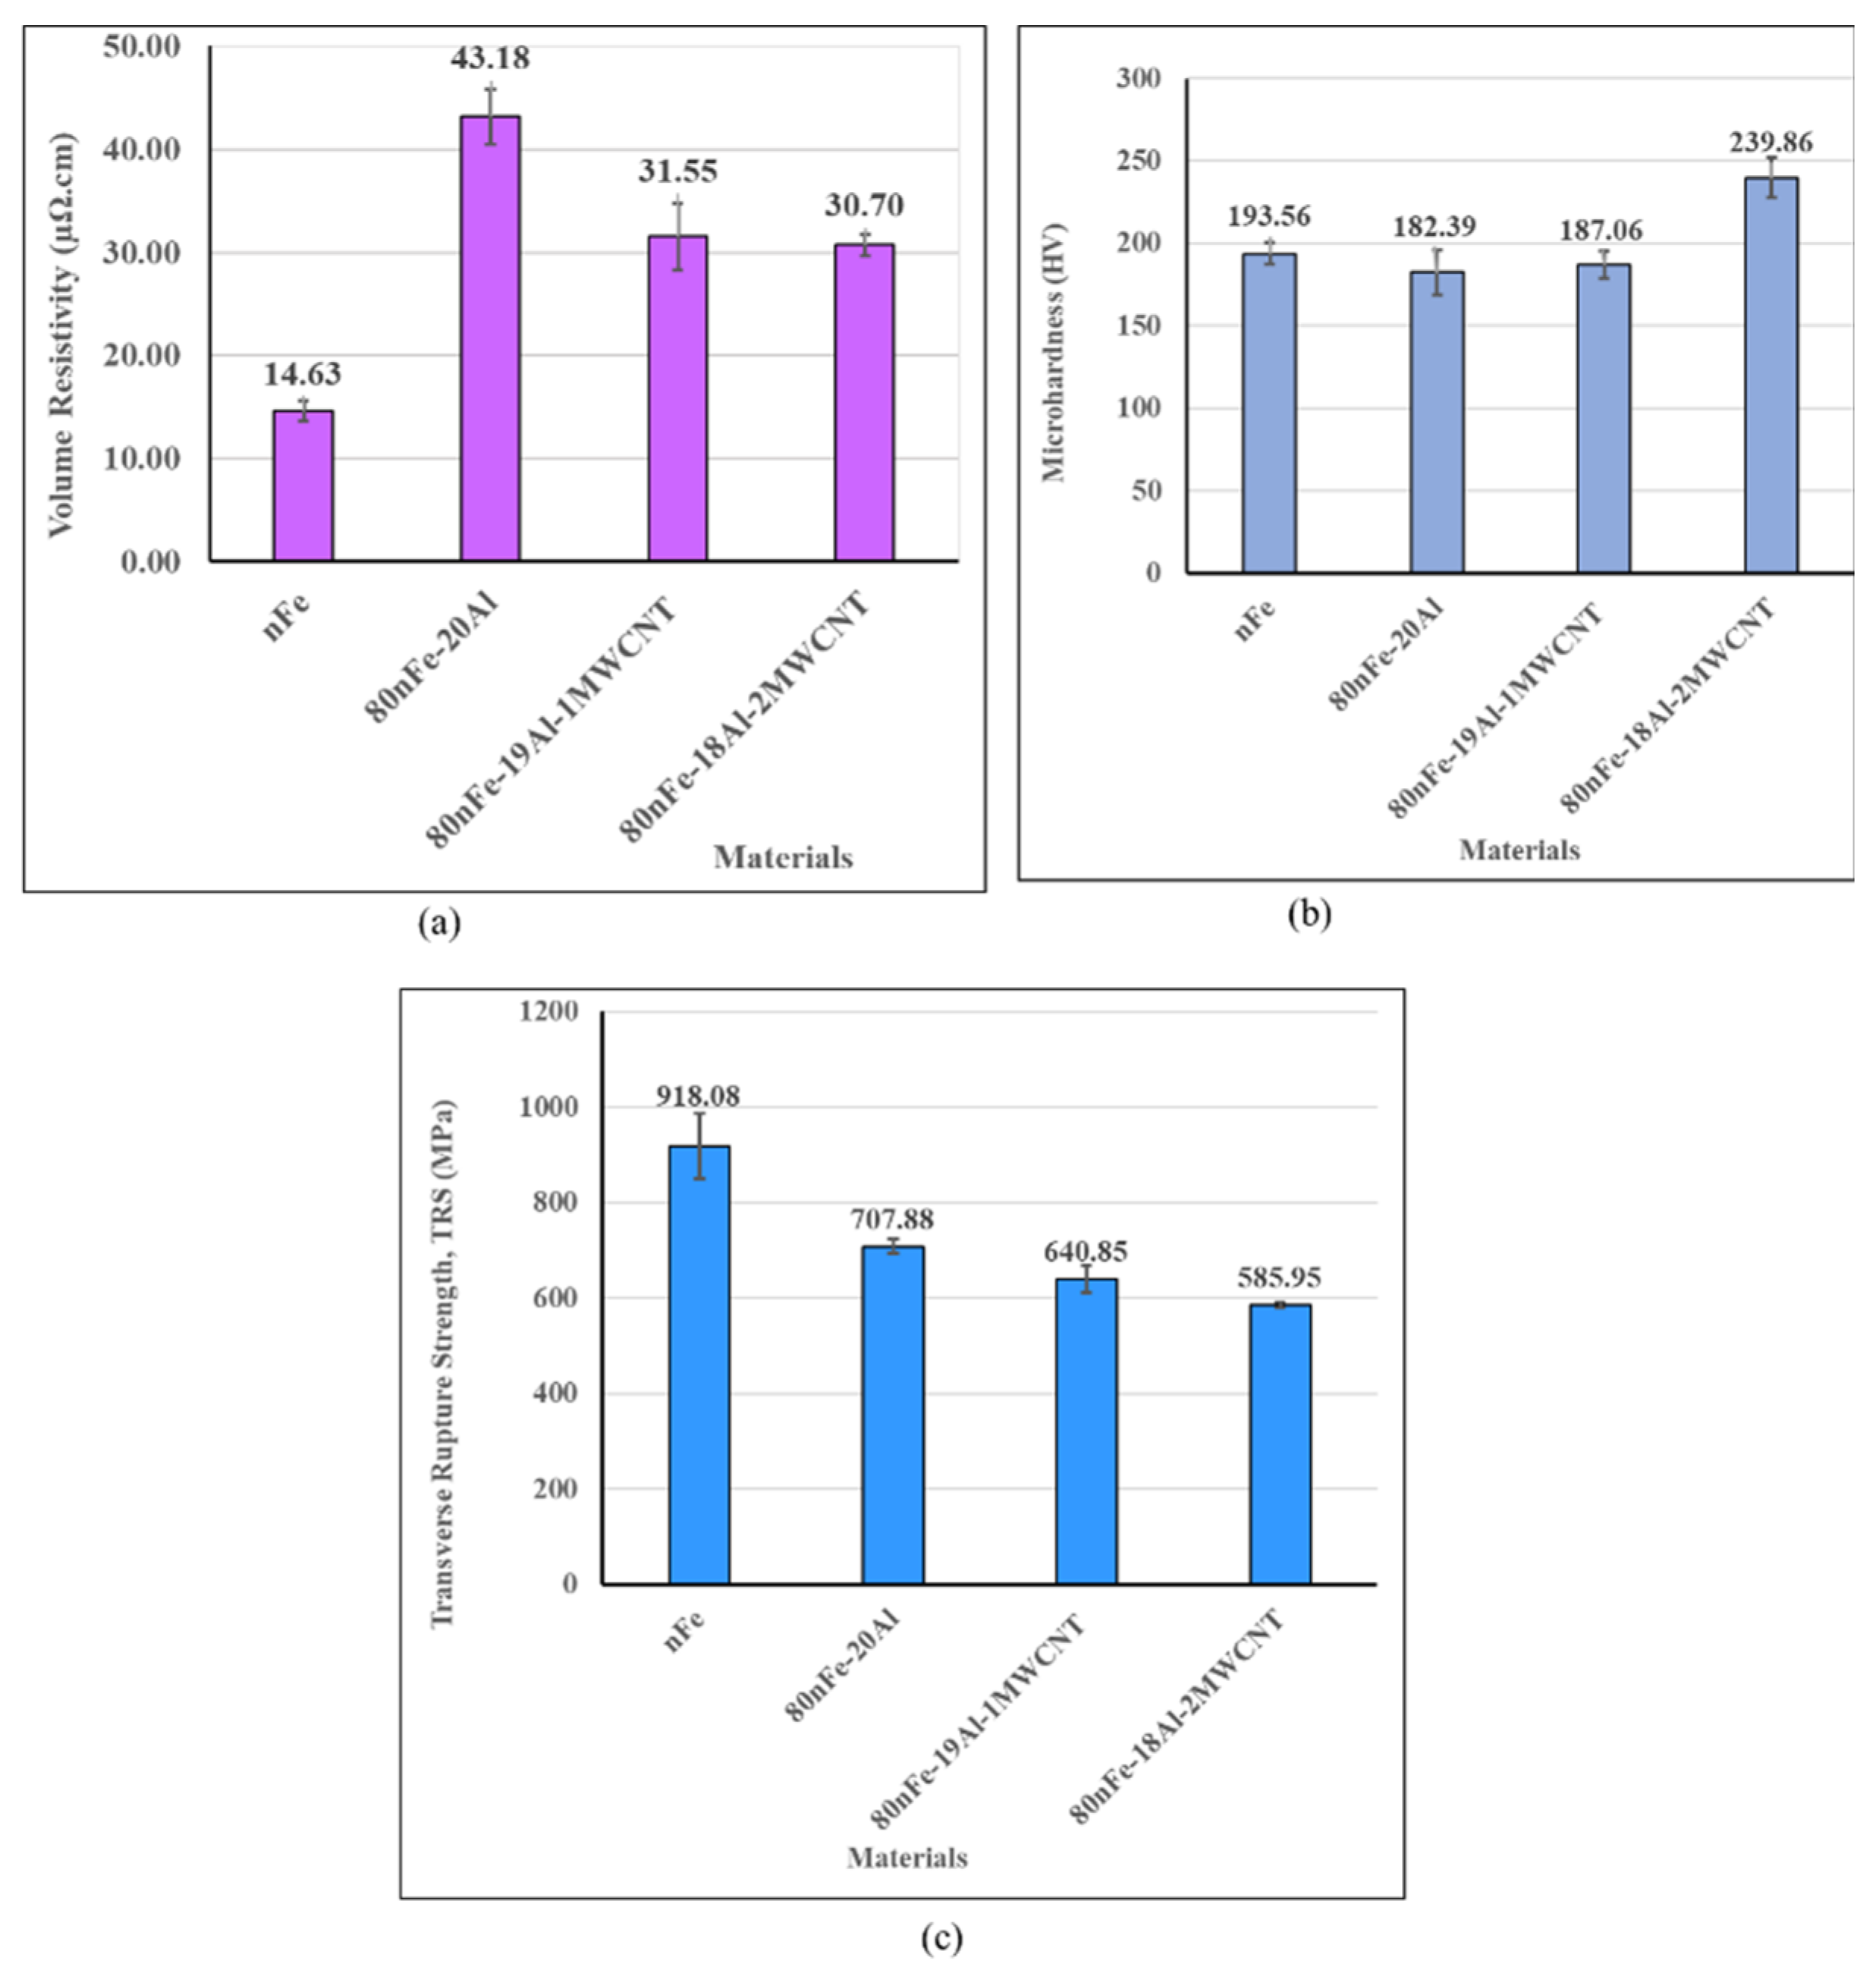
Figure 7a shows the electrical properties of the sintered materials. It can be seen that all composites exhibited about twofold higher resistivity than the pure iron compact. These results were in good agreement with the fact that the addition of a small amount of Al in the Fe matrix would result in material with improved electrical resistivity [13,16,17,18]. A decrease in electrical resistivity of the composites was observed as the result of increasing the volume content of MWCNT. Basically, when an magnetic materials is placed in varying magnetic field, the eddy currents are created within the materials, which in turn generate magnetic fields circulating in the opposite direction to the original field and cause the energy loss known as eddy current losses [52]. Those losses are inversely proportional to resistivity [53,54]. That means that the magnetic materials with higher resistivity are needed to reduce eddy current losses in the magnetic circuit. Therefore, the composites manufactured in this work would generate lower eddy current losses than the pure iron compact.
The effect of MWCNT content on mechanical properties was also evaluated. The MWCNTs were found to increase the hardness of composites (see Figure 7b). The hardness was improved up to 19.3% and 24% by using CNT 2 vol% in comparison with pure Fe compact and 80nFe-20Al respectively. This can be attributed to the presence of iron carbide formed during the sintering of the composites that contain MWCNTs and their small crystallite size as shown in XRD analysis, Figure 4.
Figure 7c illustrated the transverse rupture strength (TRS) of the composites with respect to the MWCNT content and in comparison with the compact of Fe nanoparticles. It was found that the MWCNTs have reduced the strength of the composite materials and the more MWCNTs were used the lower the strength that was observed. The material without MWCNT (80nFe-20Al) had the TRS of 707.88 MPa. However, after adding MWCNT 1 vol% and 2 vol% as reinforcements, the strengths were dropped to 640.85 MPa and 585.95 MPa respectively. This contracted what was expected, which was the improvement of the mechanical strength of the Fe-Al based nanocomposites due to the MWCNT reinforcement as was reported on the strengthening of metal matrix composites with carbon nanotube materials in literature [55].
The composites had a lower strength than the pure iron compact. This trend might be associated with the presence of pores in the area of high concentration of Al. Moreover, the network structure of MWCNTs makes them difficult to be separated one from the others and causing them to be dispersed in small cluster forms (aggregation) [56]. Therefore, an aggregate of MWCNT in composites may be considered as the pores due to insufficient MWCNT-metal particles bonding that might cause insufficient load transfer between metallic domains and the MWCNTs and therefore led to the reduced transverse rupture strength. Moreover, the reduction of the mechanical strength of the nFe-Al- MWCNT materials was caused by the formation of brittle iron carbides.

3.2. Effect of Powder Milling Time

The morphology of the composites milled at different time was studied using FE-SEM and the images are presented in Figure 8a–c. It can be seen that the MWCNT clusters were found even after 48 h of ball milling. This may be attributed to the small number of balls (low ball to powder weight ratio) that was used in order to avoid or limit the particles size reduction. In fact, the large number of balls are usually used for grain/particles refinements [57].
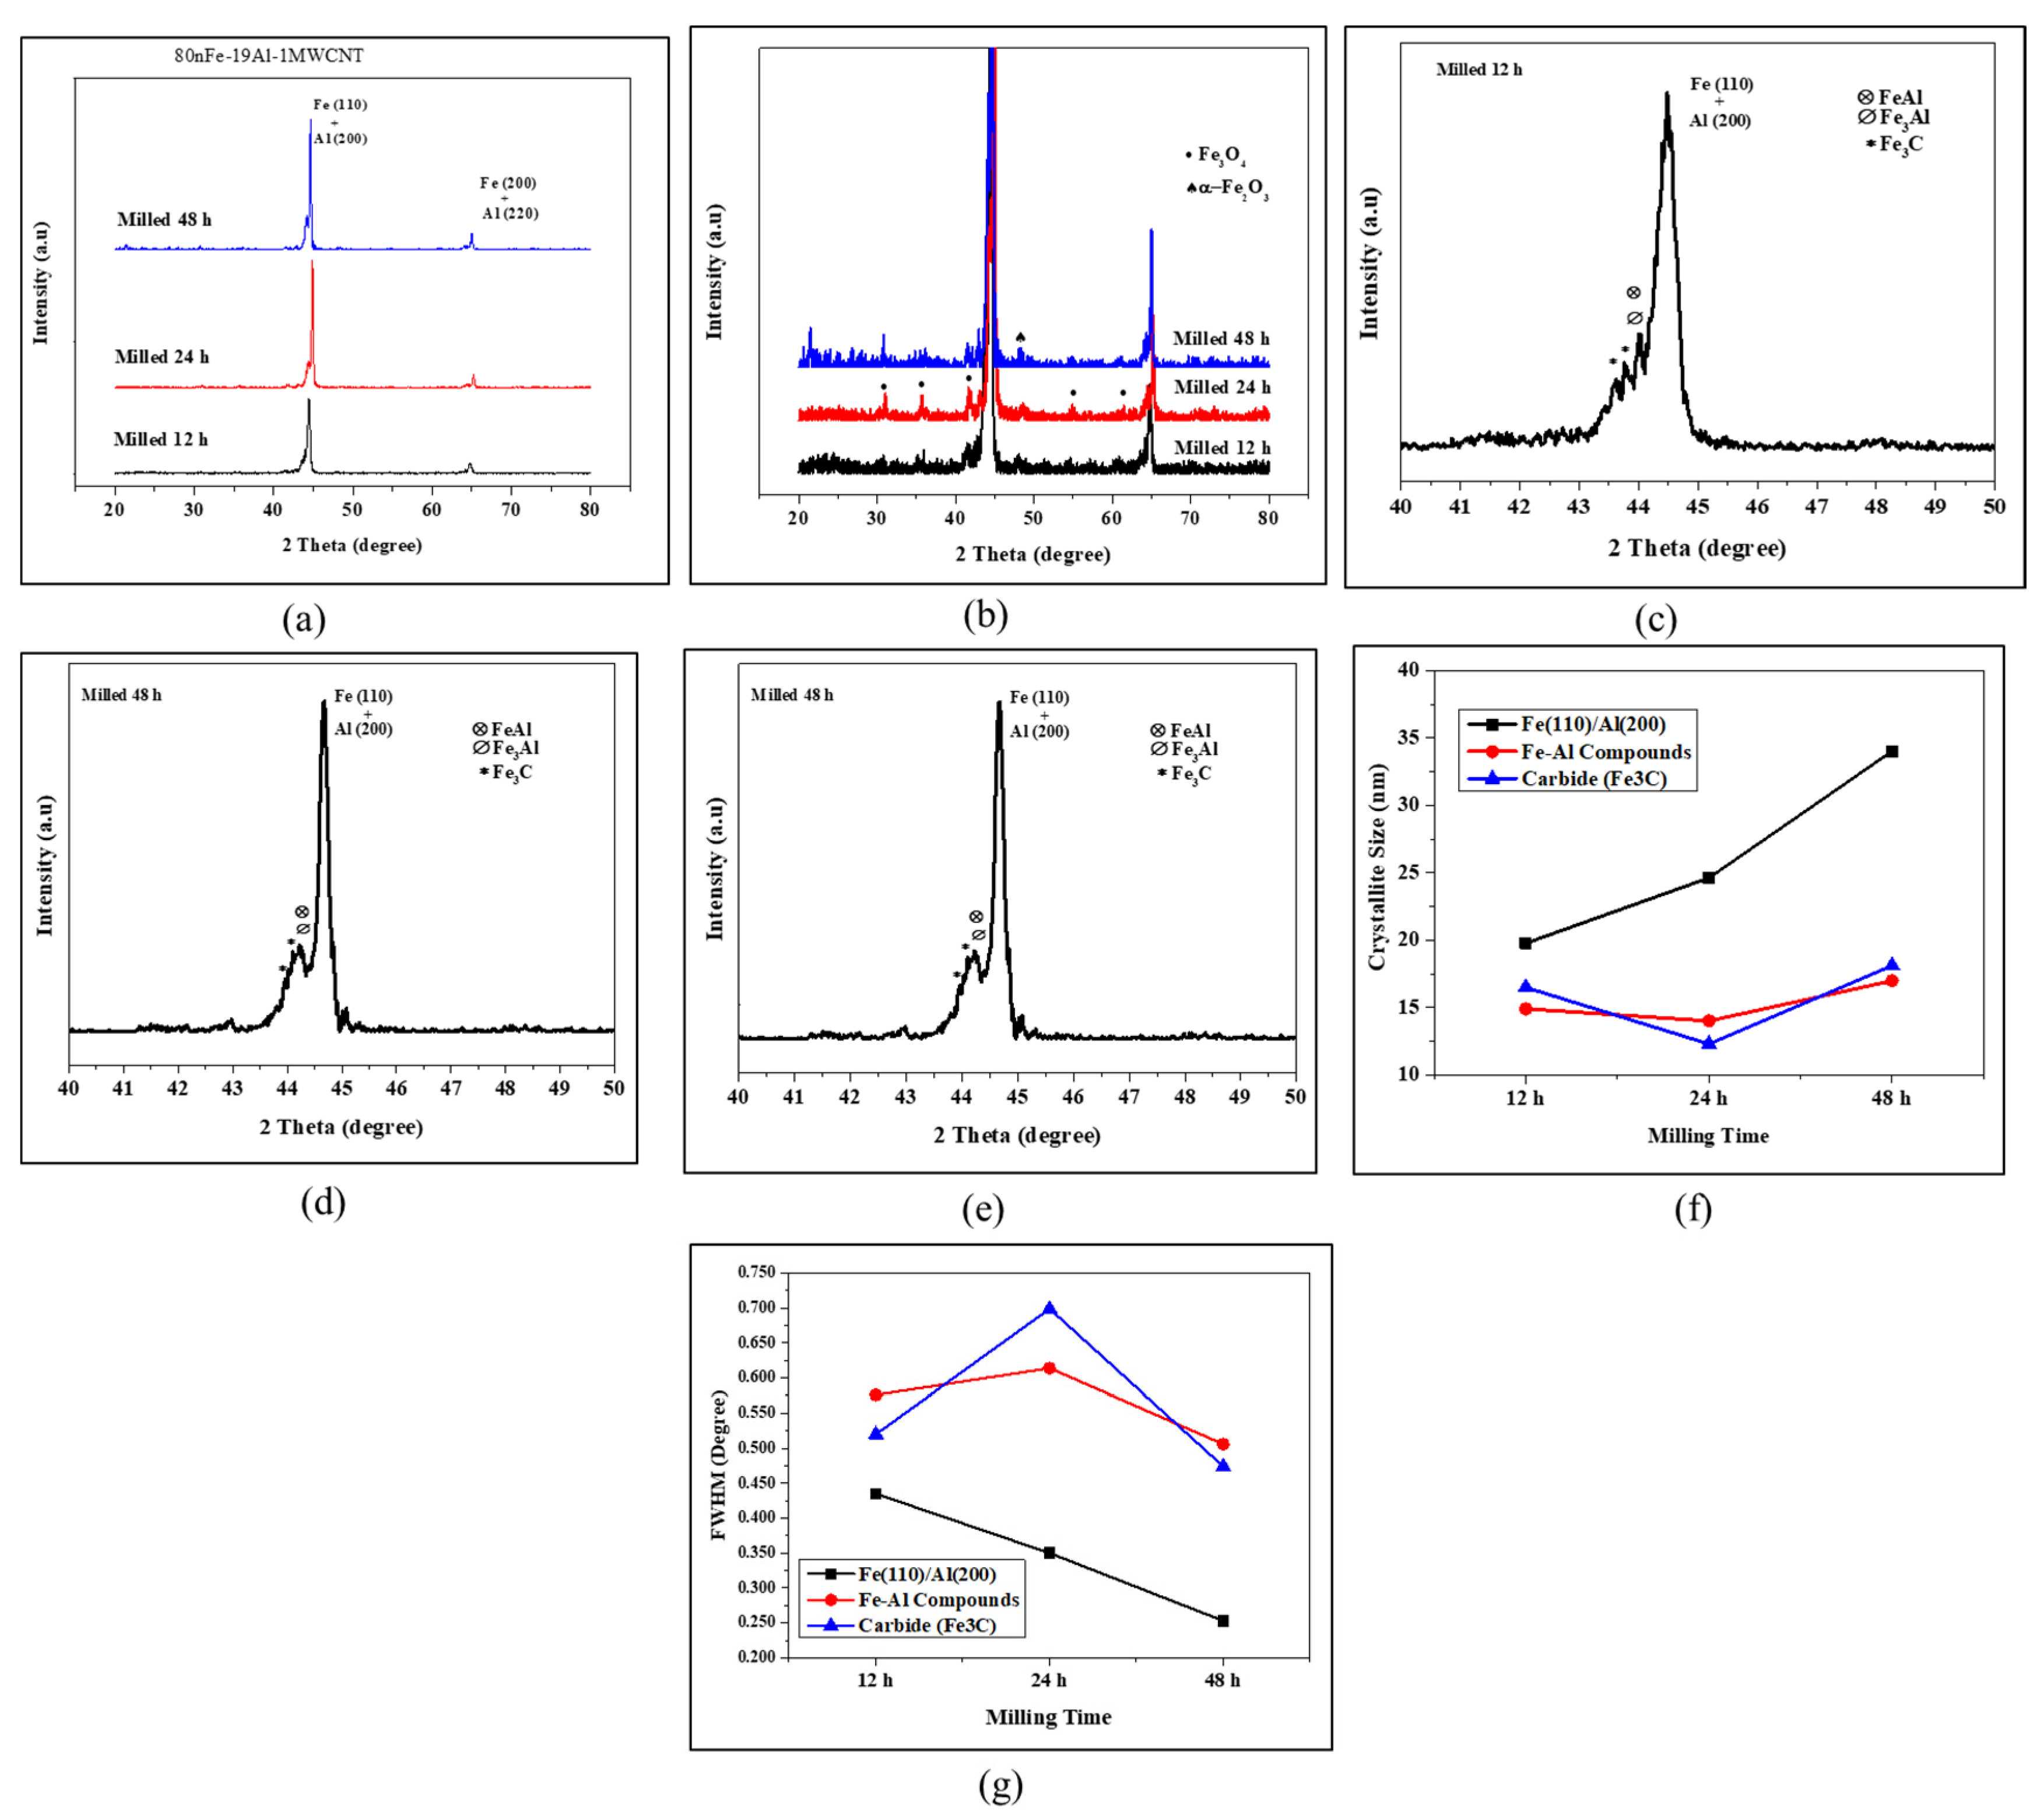
The milling time might also affect the crystal structure of materials. The XRD patterns of sintered 80nFe-19Al-1MWCNT for different times of ball milling (12 h, 24 h and 48 h) are shown in Figure 9. Figure 9a shows that the intensity of the major peaks increased when the composites were milling for a long period. The detailed view of the low intensity peak, in Figure 9b showed that the iron oxides were formed in all samples. Figure 9c–e highlights the presence of small peaks on the left side of major peaks in the angular range of 40–50°. As it was seen in the previous section, those peaks correspond to Fe-Al intermetallic compounds and iron carbides. In order to determine the crystallite size from the FWHM, the peaks analysis was conducted for Fe (110)/Al(200) peaks, Fe-Al compounds main peaks and iron carbide main peaks, which were detected between 40 and 50°. From Figure 9f it can be seen that the crystallite size corresponding to the highest peaks Fe (110)/Al(200) increased with the milling time. On the other hand, the powder milled for 24 h produced the composites with the smallest crystallite size of the compounds (FeAl/Fe3Al and Fe3C).
Figure 10 compares the magnetic hysteresis loops of 80nFe-19Al-1MWCNT for different milling times. The magnetic properties, extracted from the hysteresis loops are shown in Table 3. The saturation magnetization, coercivity and remanence were higher after 24 h of milling than 12 h and 48 h. For 24 h, the saturation magnetization and coercivity were 148.82 A·m2/kg and 2175.64 A/m respectively. The similar saturation magnetization was found for the samples milled for 12 h and 48 h. The results showed that milling the powder for 48 h resulted in a composite with the lowest remanence and lowest coercivity, which implies that the surface area of the hysteresis loops to the later composite was smaller than that that of composites milled for 12 h and 24 h. Therefore, since the hysteresis losses are proportional to the area of hysteresis loops [58], the hysteresis losses of the composite could be minimized by the milling powders composite for 48 h. The volume densities and the relative densities of the composites have continuously increased as the milling time was prolonged. It can be believed that the extended period of powders milling led to greater microstructural modifications of the particles, due to repetitive collisions, fracture and welding/rewelding of particles during the ball milling that promoted the densification of the end composites.
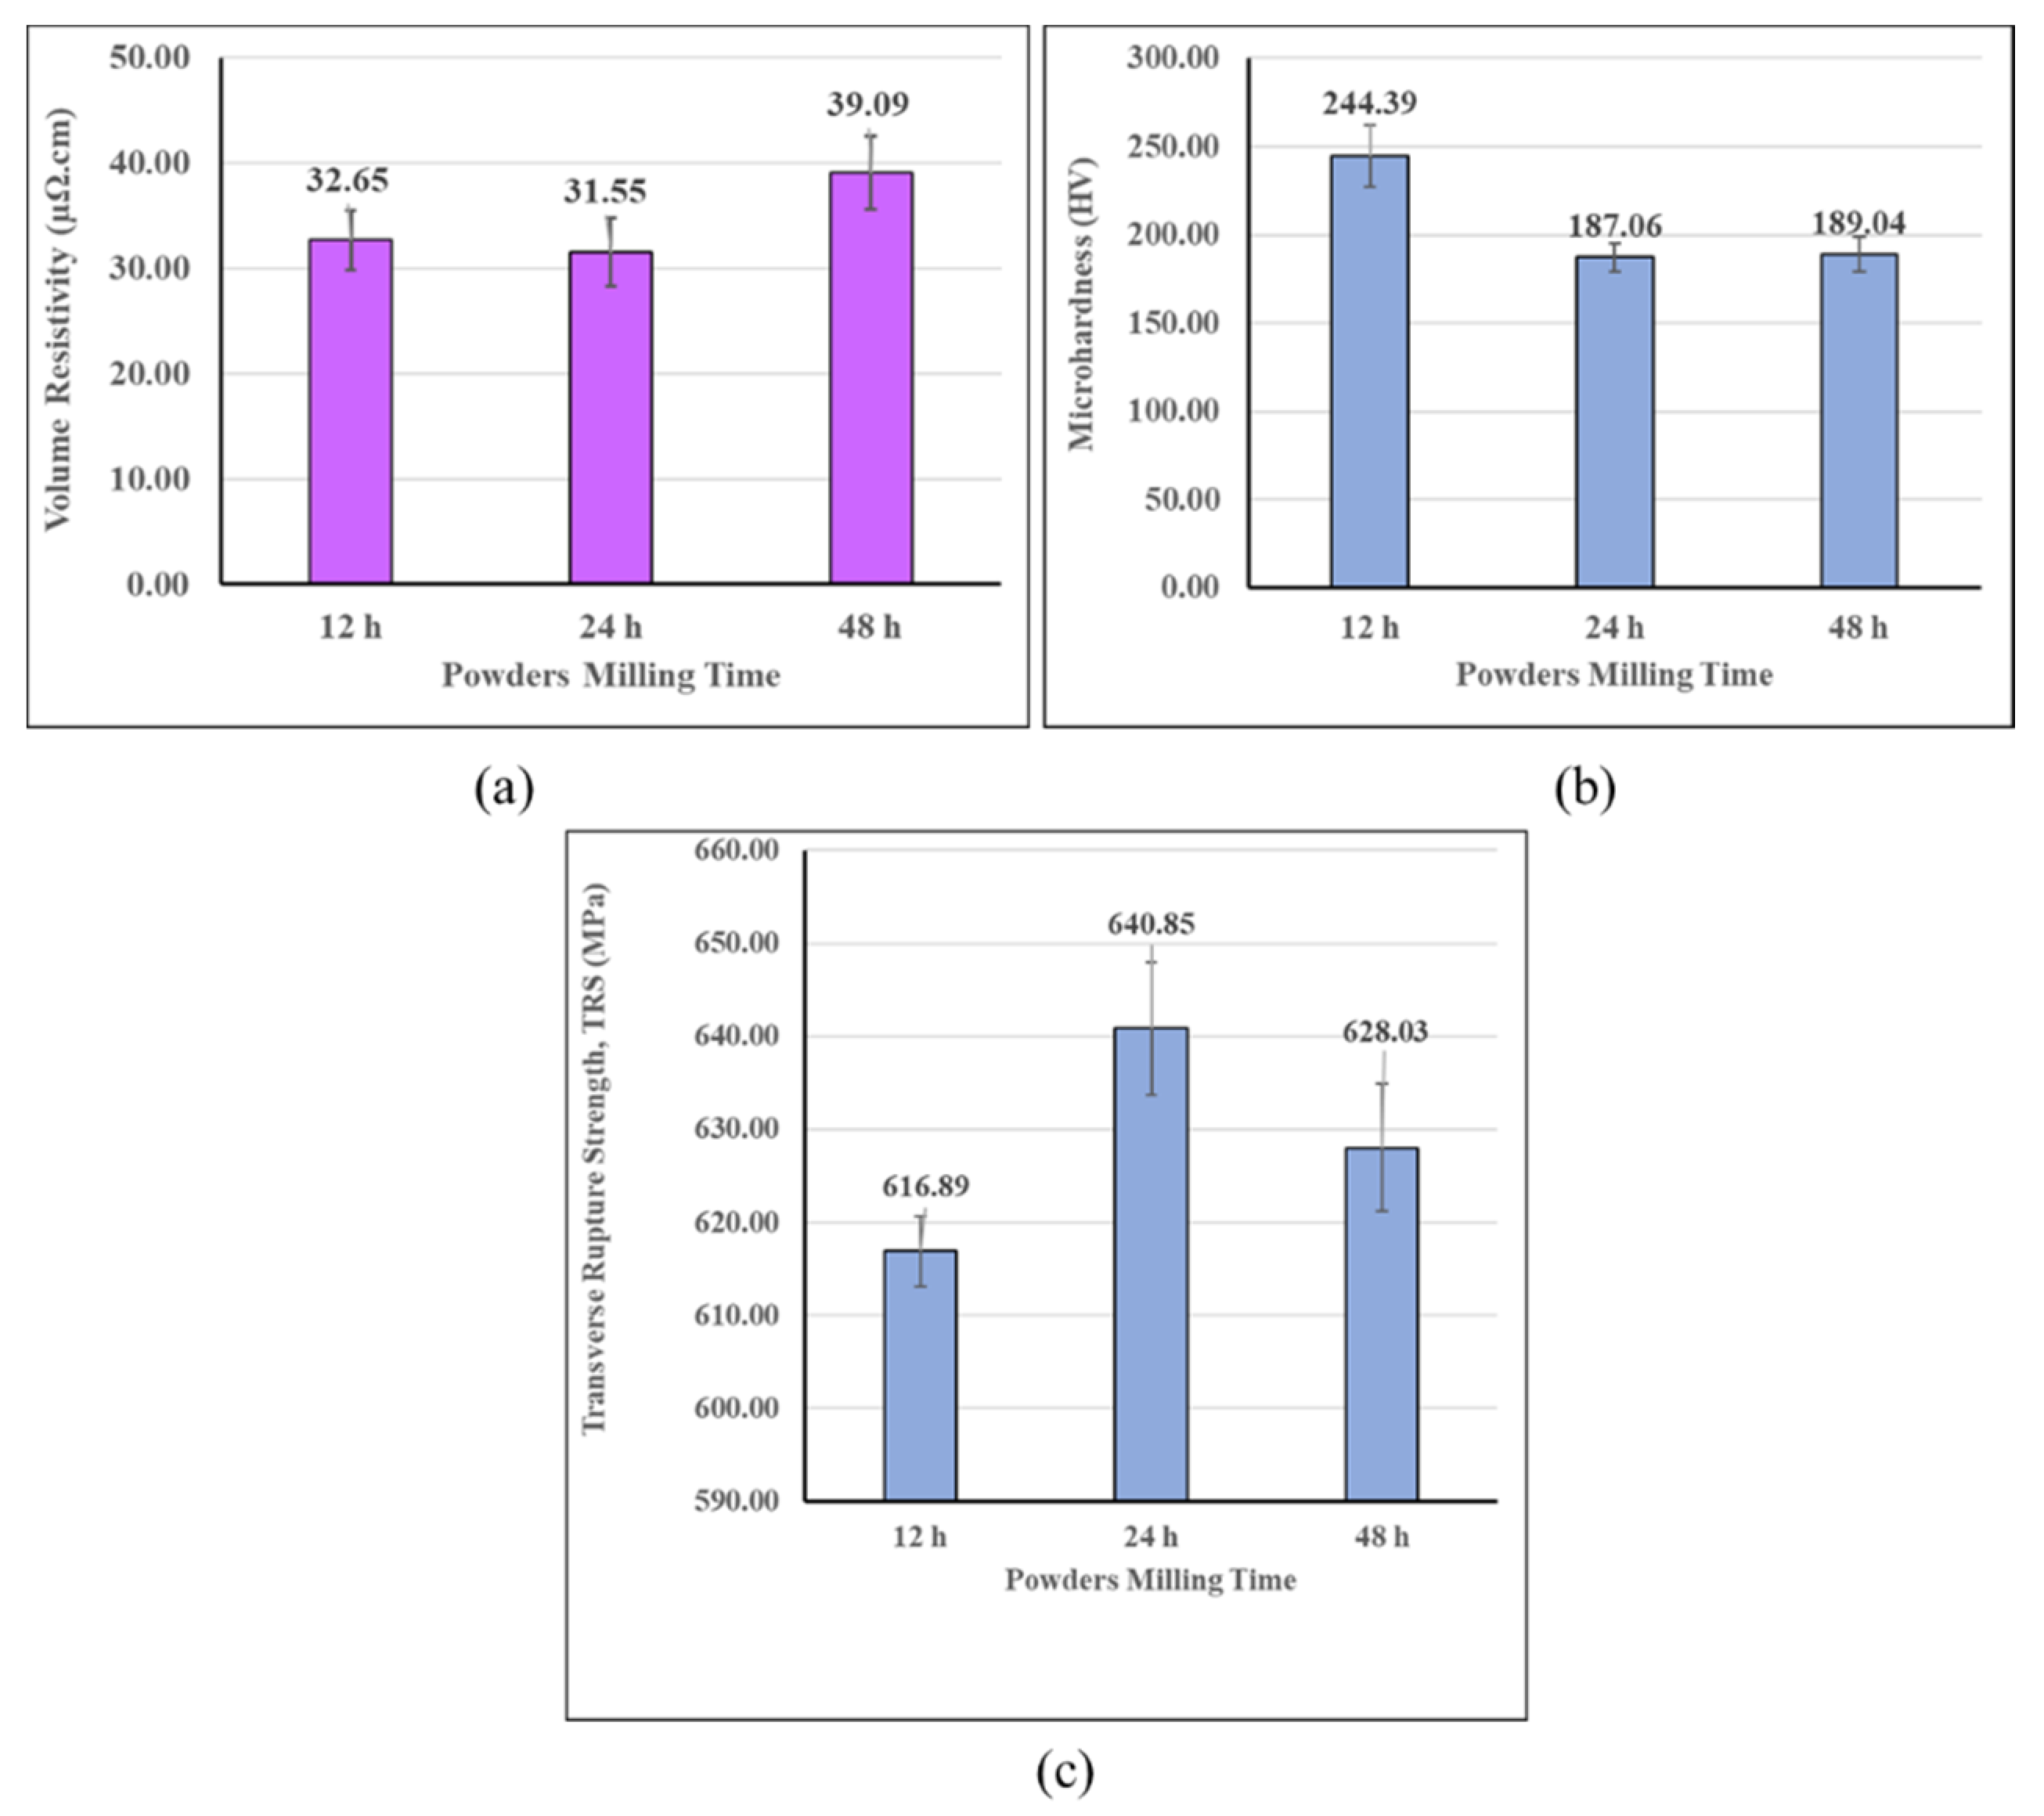
The electrical resistivity measurements, illustrated in Figure 11a, showed conflicting behavior of these properties with respect to the powder milling time. However, the powder milled for 48 h provided a composite with higher resistivity when compared to the ones milled for 12 h and 24 h. In Figure 11b, a decline in material hardness with an increase of milling time was noticed. While the composite milled for 12 h had greater hardness, the hardness dropped for the composites milled for 24 h and 48 h. However, there was no remarkable difference in the hardness of the composite milled for more than 24 h.
The mechanical transverse rupture strength (TRS) of materials was found to be sensitive to the powder milling time. As shown in Figure 11c; 12 h, 24 h and 48 h of the milling time were compared and it was assessed that prolonged time of powder ball milling improved the strength of materials. The composite with powders milled for 24 h had the best transverse rupture strength (TRS). In fact, a prolonged time of ball milling increased the hardening, surface area and plastic deformation and grain refinement in particles, which facilitated the compaction and therefore improved the mechanical strength as well as the density.

3.3. Effect of Combining Fe Nanoparticles and Fe Microparticles

The mixture of nanoparticles and microparticles is another factor that might affect the properties of the powder metallurgical parts. Here, the use of iron particles depending on the nanoparticles (nFe) to microparticles (mFe) volume ratio was considered in the 80Fe-19Al-1MWCNT composites. The iron nanoparticles had an average size of 90–110 nm and purity of 99.9% whereas the iron microparticles had an average particle size of 40–50 μm and purity of 99.9%. The powders of composites were ball milled for 24 h and spark plasma sintered at 800 °C as described in the experimental section.
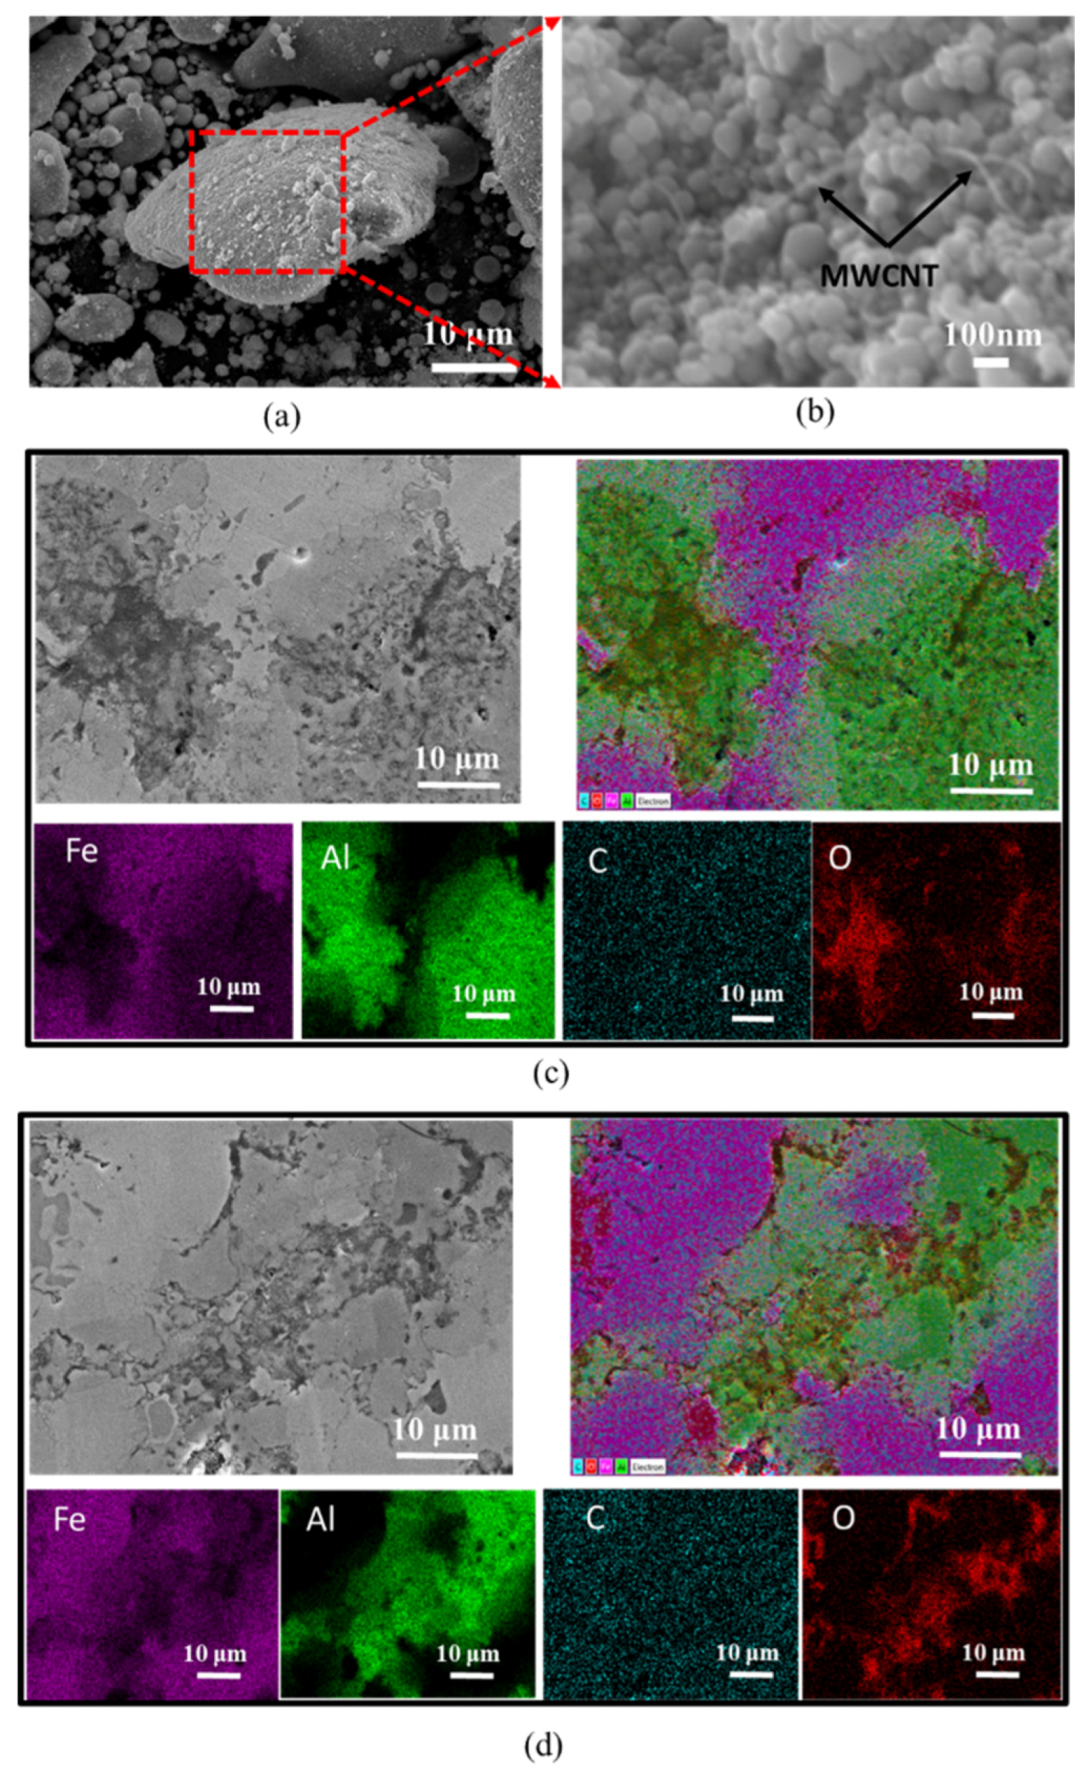
Figure 12 shows the microstructure of the composites according to the mixture ratio of iron (Fe) nanoparticles and Fe microparticles. As illustrated in Figure 12a,b, the ball milling of nanoparticles and microparticles caused the nanoparticles to be coated on the surface of the large particles resulting in core-shell structures formation. Two kinds of core-shells were formed after ball milling, namely the (mFe-nFe) core-shells and the (Al-nFe) core-shells. Then, during the liquid phase sintering, the (Al-nFe) core-shells were destroyed due to the melting of Al causing the transformation of the Al solid in Al liquid and the Al liquid penetrated between the nearby Fe nanoparticles. That caused the rearrangement of solid particles in the liquid phase within the composites where the liquid had to fill the gap between the solid particles. Then the crystallization of the liquid–solid phase resulted in non-uniformity of the high Al concentration region. The presence of a small amount of iron in the area of high Al concentration is the iron nanoparticles that were merged in the Al liquid. On the other hand, (mFe-nFe) core-shells formed on the homogenous component by diffusion bonding among the Fe microparticles (mFe) and Fe nanoparticles (nFe) due to relatively high temperature sintering. In Figure 12c,d, the EDS mappings of local area on the polished surface of the composites show a non-uniform surface at the region of high Al concentration and a uniform surface at the region of high Fe concentration.
The phase identification studied with XRD is shown in Figure 13. The composite with a high content of iron microparticles had lower intensity peaks. On the other hand, the peaks of the composites with 50/50 nano-to-micro ratio (i.e., 40nFe-40mFe-19Al-1MWCNT) showed a wider base and higher peak intensity than the other composites. This implies that the microstrains were largely induced in the later composite (40nFe-40mFe-19Al-1MWCNT) when compared with other composite materials [41]. A detailed analysis of XRD-peaks revealed the presence of iron oxides peaks in all composites, Fe-Al compounds (FeAl/Fe3Al) and iron carbide in all composites as shown in Figure 13b–e. These compounds resulted from the chemical reactions between the components during the sintering process. Figure 13f shows that the composites 40nFe-40mFe-19Al-1MWCNT exhibited the biggest crystallite size of iron carbides and smallest crystallite size of Fe and Fe-Al compounds.
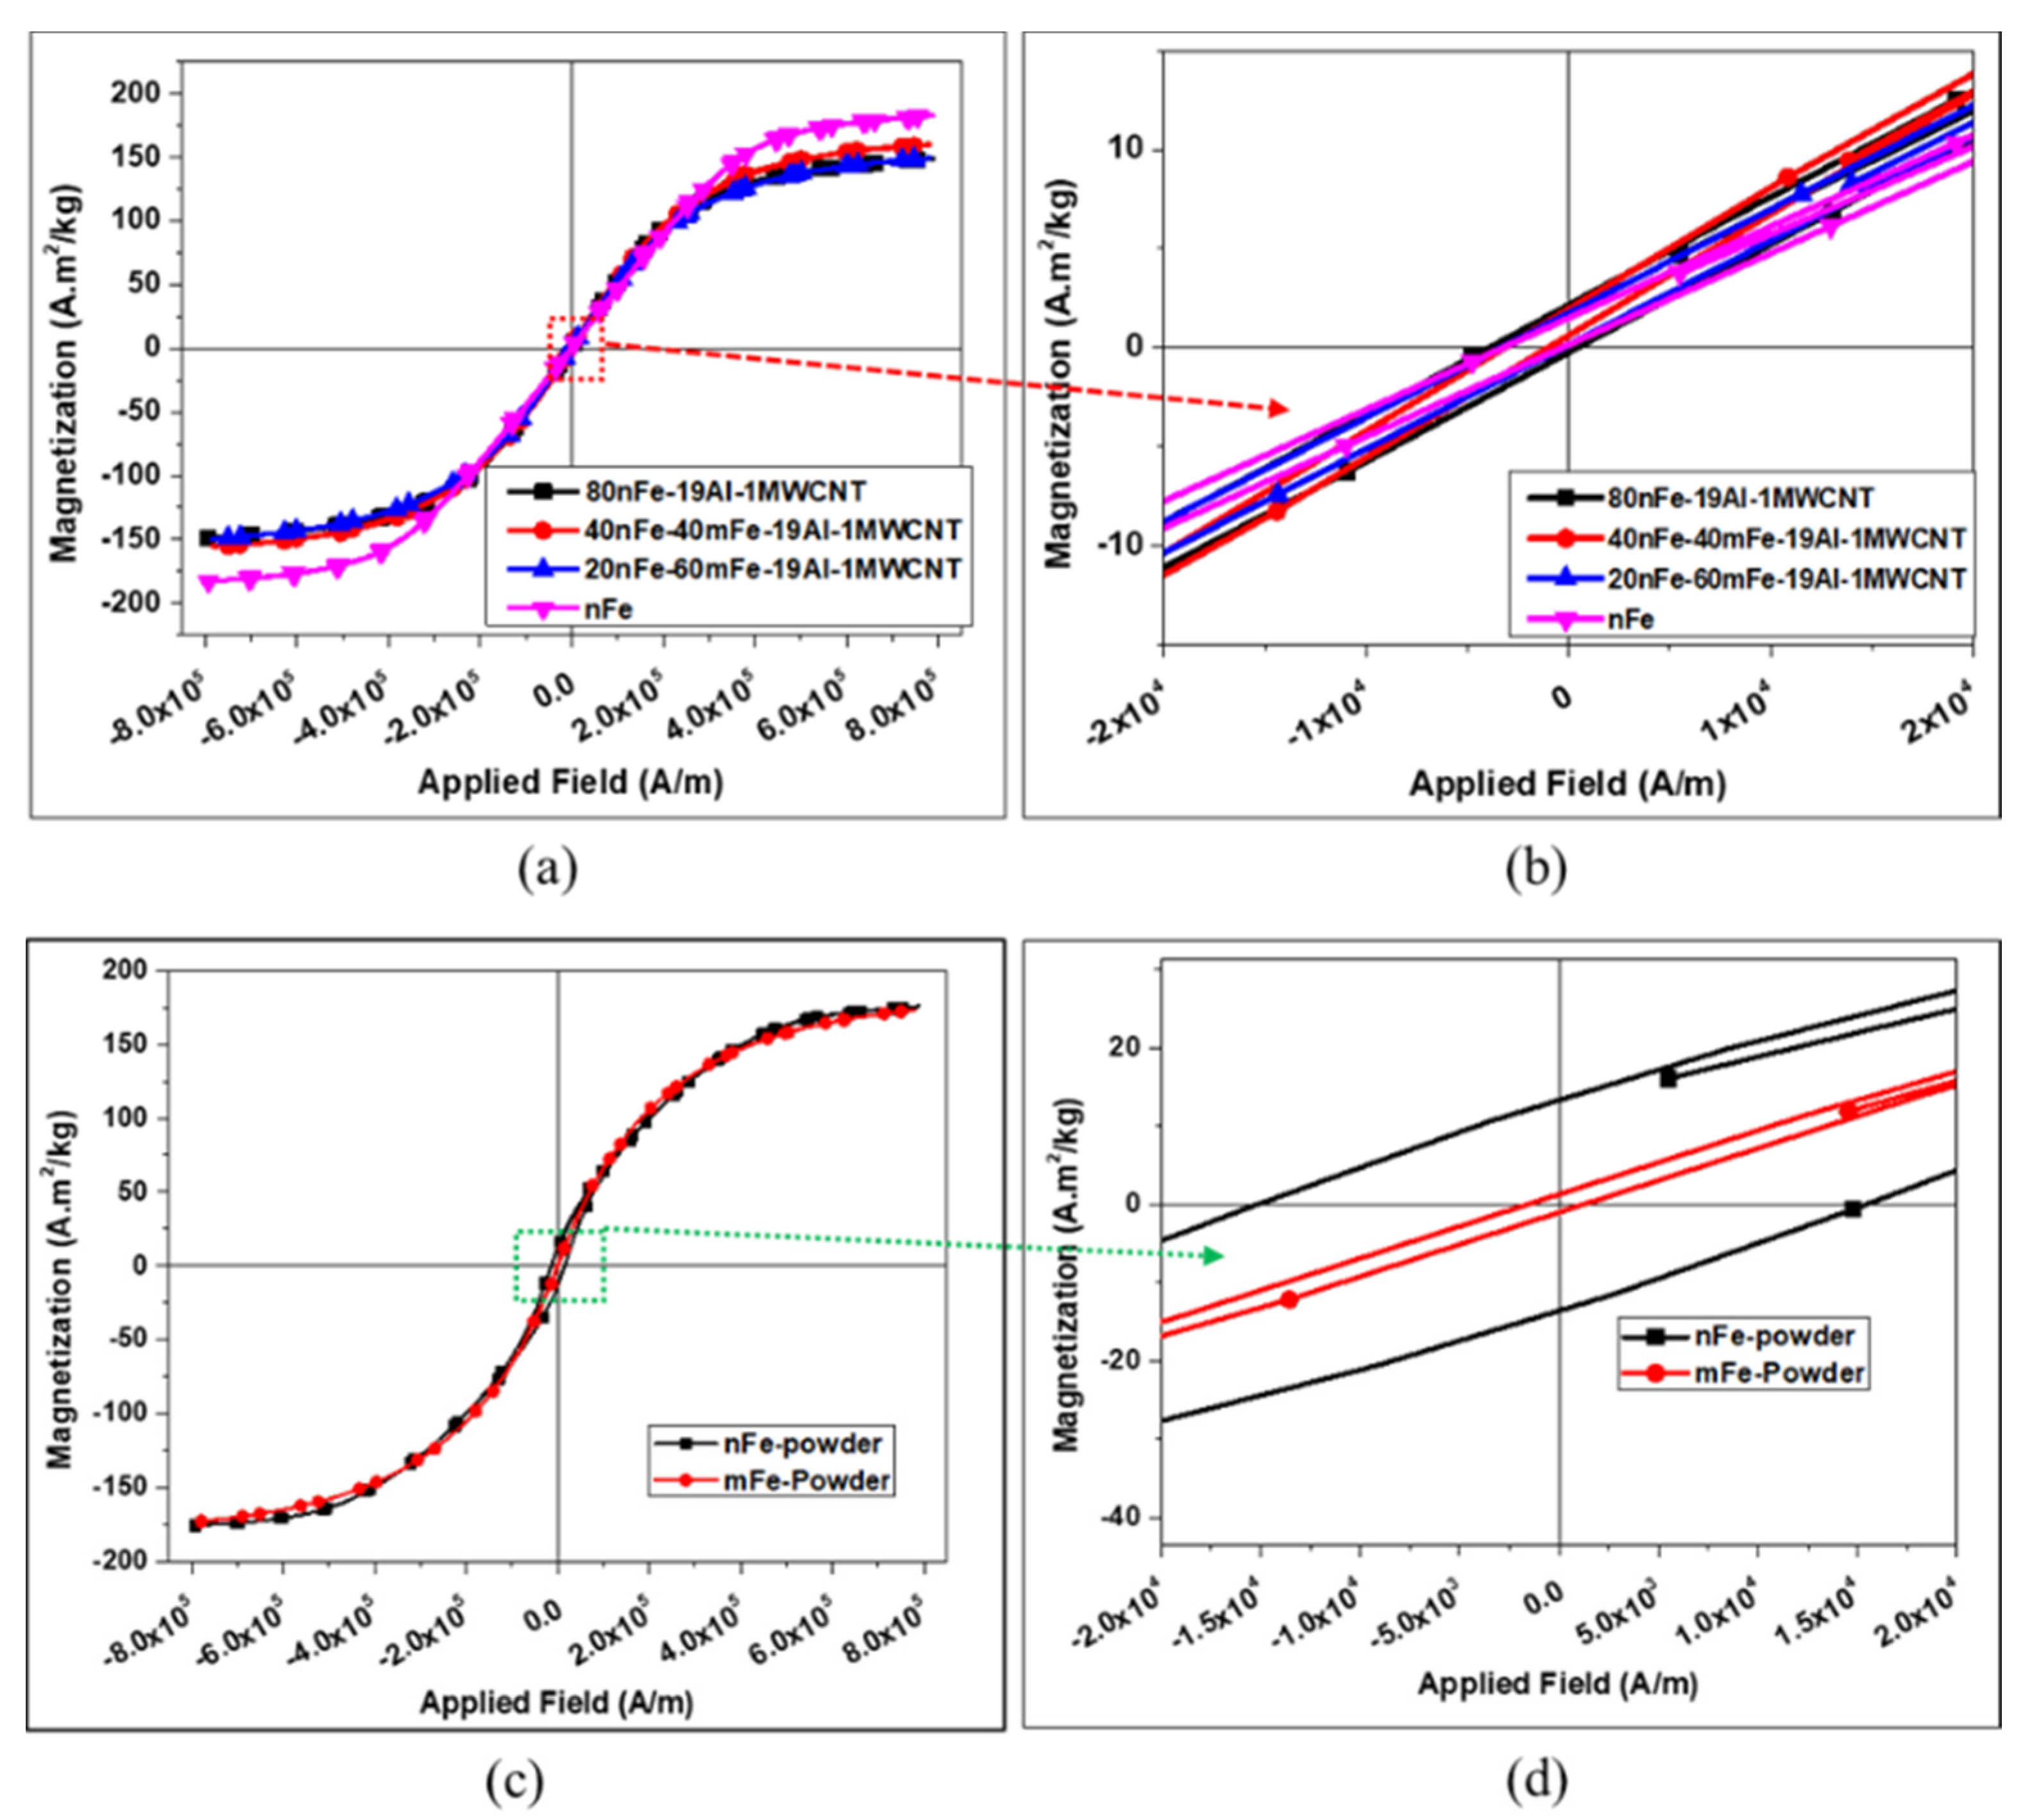
The magnetic hysteresis loops of the composites are shown in Figure 14a,b and Figure 14c,d compares the hysteresis of the as-received iron nanoparticles and iron microparticles. Table 4 compares the magnetic properties obtained by VSM measurements and the density of the composites, which are compared with iron nanoparticles based compact, as-received Fe nanopowders and Fe micropowders. The nFe-Al-MWCNT nanocomposite consisting of iron nanoparticles only had the highest coercivity of 2175.64 A/m, which may be attributed to higher coercivity of the iron nanoparticles (15,309.71 A/m) as shown in Figure 14c,d and Table 4. The mixture of iron nanoparticles and iron microparticles have enhanced the saturation magnetization and reduced both the coercivity and remanence. The 40nFe-40mFe-19Al-1MWCNT exhibited the highest magnetization of 157.82 A·m2/kg and lowest coercivity of 1083.36 A/m.
As shown in Table 4, the density of the composites with only iron nanoparticles had the highest density (6.28 g/cm3) among the composites but lower than the pure iron nanoparticles compact (7.47 g/cm3). Obviously, the densification reduced as the content of large particles increased. Actually, the iron particles are harder than the aluminum particles. Therefore, the small particles of iron are easily packed with aluminum because they are harder and have a small surface of contact, which allows them to easily penetrate on the surface of aluminum particles due to particle–particles impacts during ball milling and also due to compaction. On the other hand, the larger iron particles induced large deformation of aluminum particles and among themselves during the compaction, which may not completely eliminate the space between particles and consequently resulted in lower density of the compact. Moreover, the large Fe particles (microparticles) require high compacting pressure than Al particles to eliminate the space between them and are not easily packed as for small Fe particles (nanoparticles). It can be assessed that the number of small voids between particles in compacts may have been greater in the composites with a high volume content of Fe microparticles, which reduced their densities.
As shown in Figure 15a, the slight increase in electrical resistivity was observed as the content of iron microparticles increased. This may be associated with the presence of small pores within the composites that reduced the electrical contact inside the composites and increased the resistance of the electricity flow. The volume resistivity of each composite was more than two times than that of pure iron compact. Figure 15b compares the hardness of composites with a different content of nanoparticles and microparticles. It was found that the incorporation of Fe microparticles in composites has improved about 16.5% in microhardness. Interestingly, the composites with nanoparticles and microparticles mixture exhibited more than 10.8% in hardness than the pure iron (nanoparticles) sintered part. This was attributed to the availability of a large and hard cross-section created by the iron microparticles that can support the load applied by the indenter of the Vickers hardness tester. In addition, from the results shown in Figure 13f and Figure 15b, there were no obvious dependency between Vickers microhardness and crystallite size, thus the increase in hardness with particle size may be attributed to the phase transition (soft to hard) and the decrease of interfacial motions [59].
The results on mechanical transverse rupture strength (TRS) of composites depending on the nano-micro Fe mixture are illustrated in Figure 15c. On the basis of 80 vol% of iron powder in the overall composite volume; 80 vol% of nanoparticle (80nFe), the combination of 40 vol% nanoparticles and 40 vol% microparticles (40nFe-40mFe), and the combination of 20 vol% nanoparticles and 60 vol% microparticles (20nFe-60mFe) were compared. The results in Figure 15c show that the strength had reduced with an increase of Fe microparticles content. The reason for this decrease in strength might be because, firstly, the nanoparticles have large surface area to volume ratio than the microparticles. This makes nanoparticles to be easily packed with lower porosities than for microparticles and leads to a dense and stronger compact. Secondly, during milling of powders, the nanoparticles have formed a core-shell on the surface of the microparticles. Additionally, when the large volume fraction of nanoparticles was used, the excess amount of them has remained separated to microparticles. The remainders have filled the space among the microparticles during the powder packing and bonded with other neighborhood particles during compaction and sintering. Thus, the larger the volume fraction of nanoparticles with respect to the content of microparticles the smaller were the unfilled spaces (pores) among the particles. Additionally, then with enough compacting pressure while sintering, the greater the strength of materials was achieved. In fact, for composites with a high content of Fe microparticles, high compaction pressure or high sintering temperature is required to achieve full densification and high strength.

3.4. Effect of Post-Sintering Annealing Heat Treatment

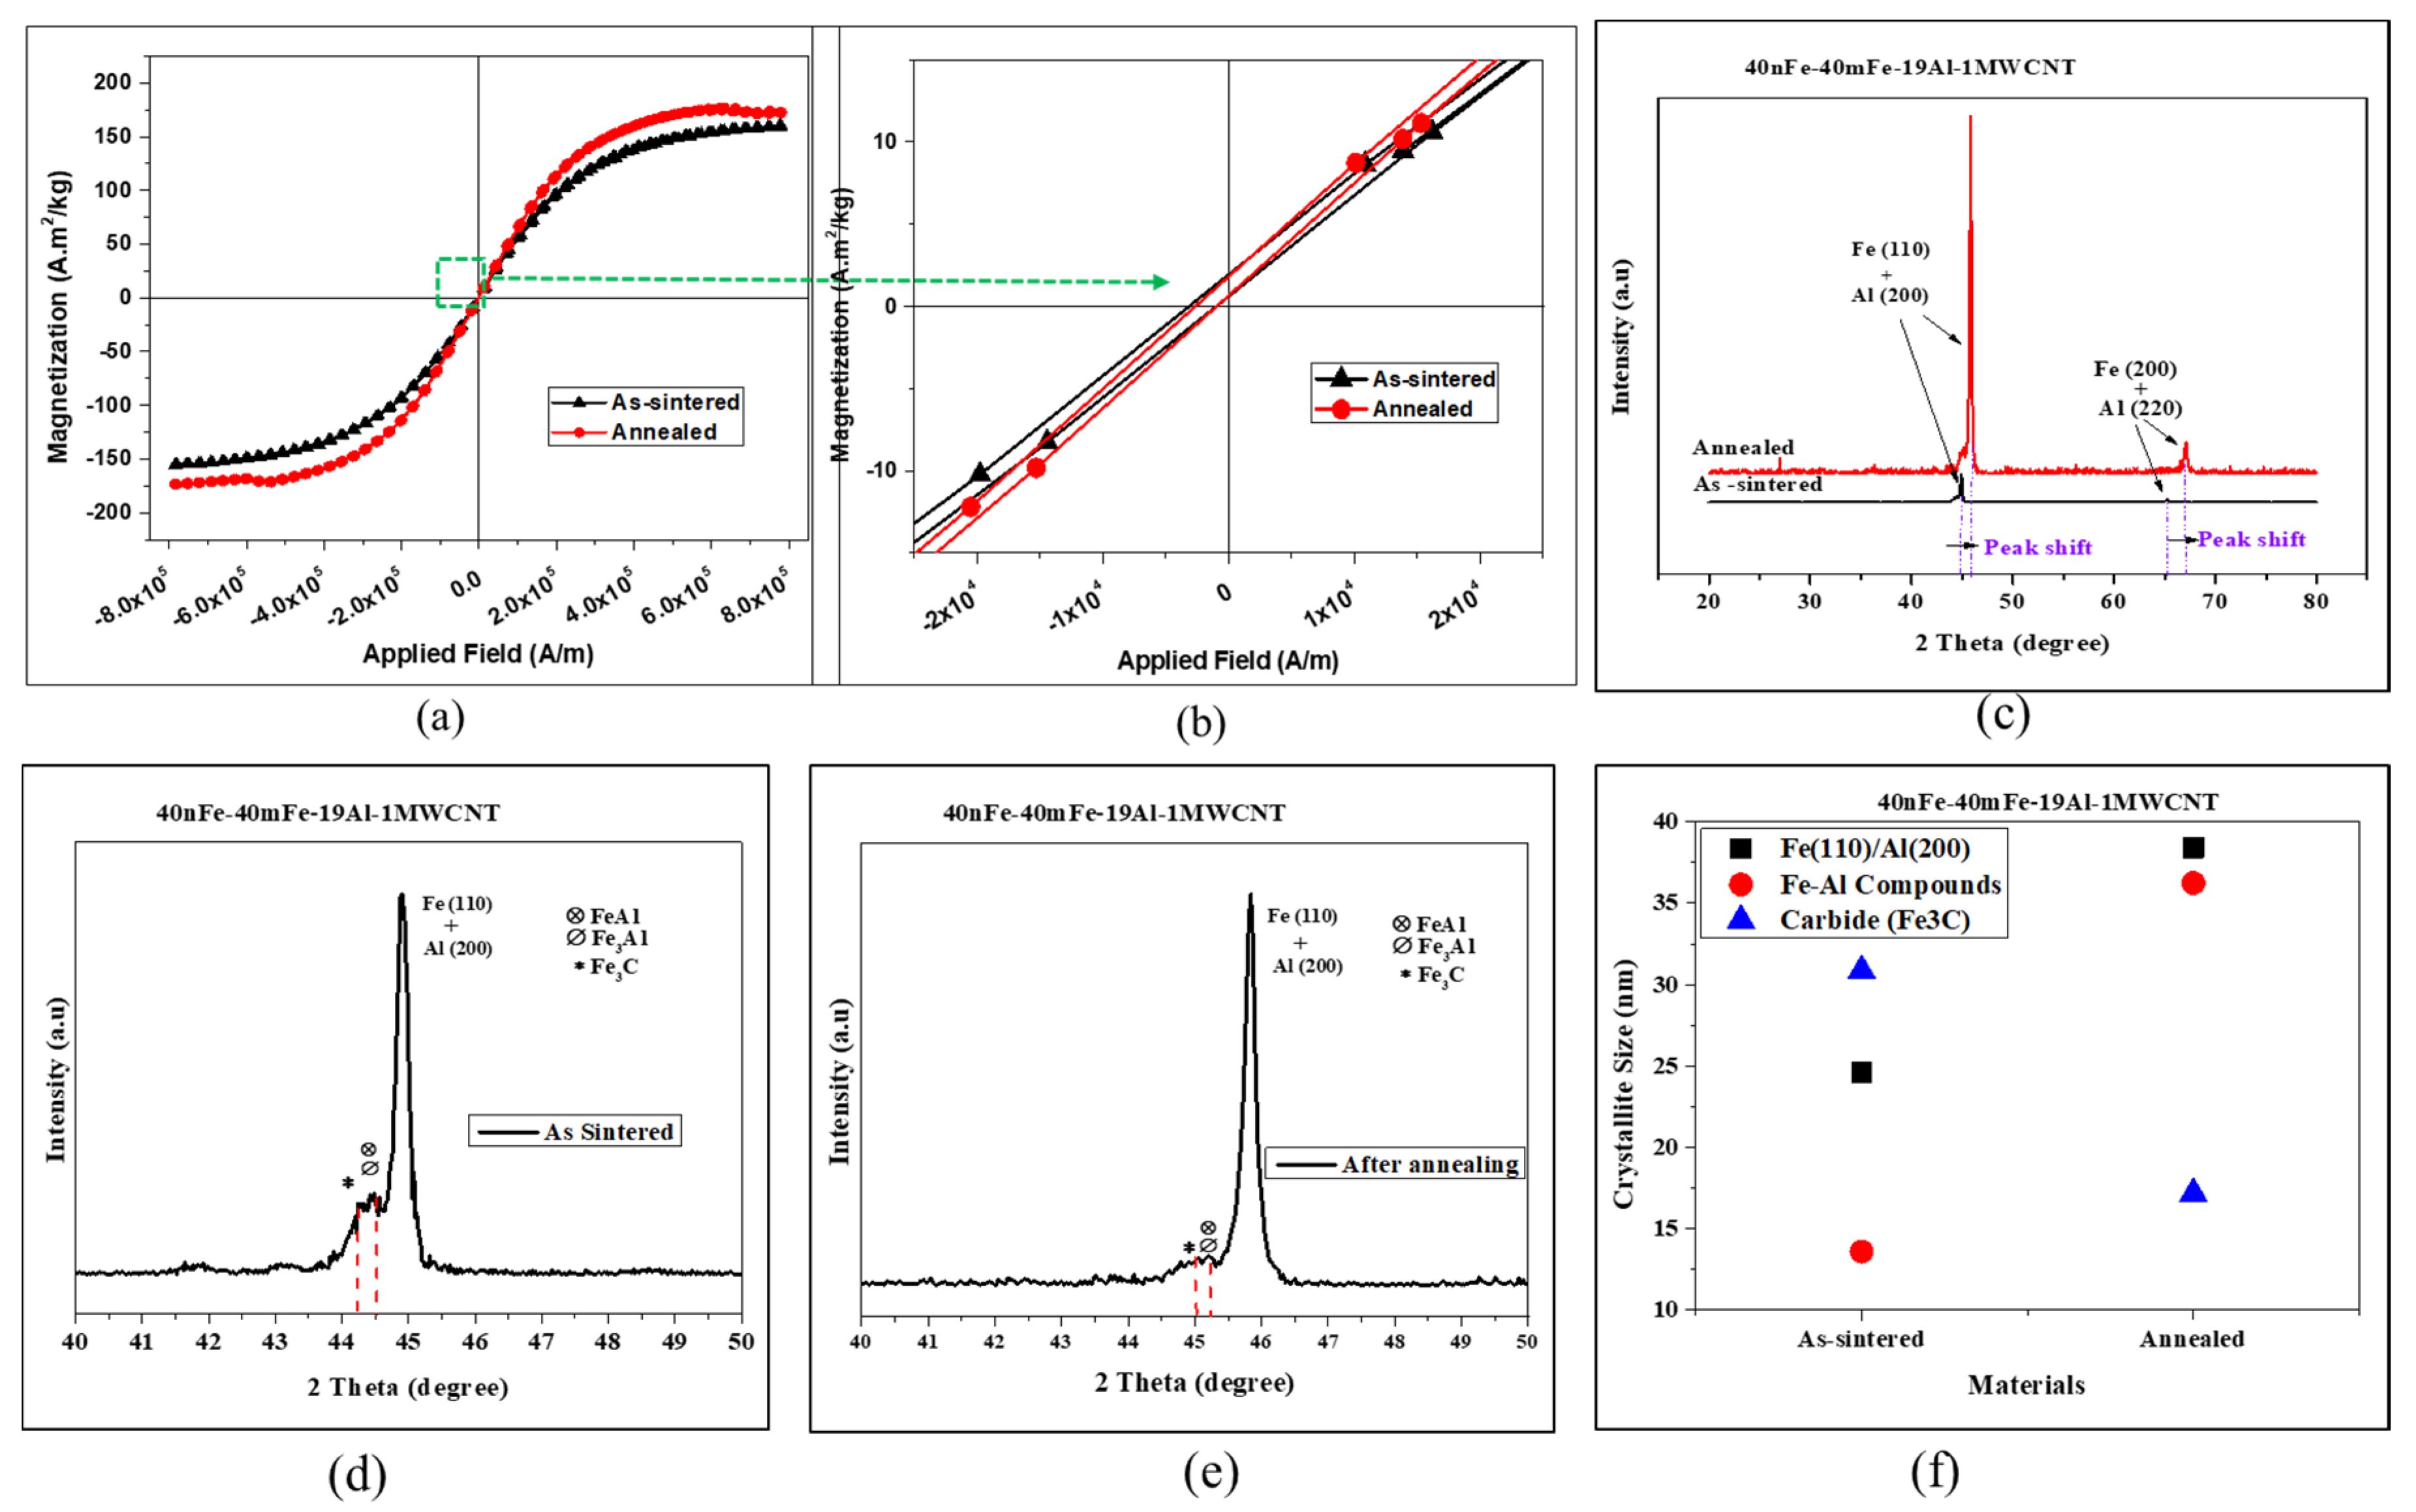
In order to investigate the influence of heat treatment after sintering, an additional 40nFe-40mFe-19Al-1MWCNT composite was fabricated in the same ways as described in the experimental section of this work. Furthermore, after sintering and prior to machining, the composite was annealed in the muffle furnace using argon atmosphere. The heating rate was 10 °C/min, and the annealing temperature was 700 °C, which was maintained for 2 h under argon atmosphere. After heat treatment, the heat-treated composite was characterized and its properties were compared with the untreated composite with the same composition.
The comparison of magnetic properties is shown in Figure 16 and Table 5. As it can be seen in Figure 16, the heat-treated composites exhibited the improved saturation magnetization and the slop of its hysteresis loop was slightly higher when compared to an untreated composite. As it can be seen in Table 5, the saturation magnetization was increased from 157.82 to 175.11 A.m2/kg after annealing. On the other hand, the coercivity and remanence declined as results of the heat treatment. The annealing magnetically softened the 40nFe-40mFe-19Al-1MWCNT by reducing the magnetic coercivity from 1083.36 to 854.30 A/m after heat treatment. In fact, the residual stresses in the compact that are caused by the compacting process and magnetic anisotropy are among the reason for high coercivity. The annealing heat treatment helped to relieve the residual stresses and lowered the magnetic anisotropy in the heat treated sample. From these results, it can be inferred that the heat treatment can increase the magnetic softness of the composites. This is consistent with the previous study of the effect of annealing heat treatment on the magnetic properties of the magnetic materials [60,61].
Figure 16c compares the XRD-patterns of the composite before and after annealing heat treatment. It can be seen that the heat treated samples had very high intensity peaks in comparison to the as-sintered composite. There was also a significant shift of peaks to a high angle after heat treatment. Figure 16d,e shows that the peaks corresponding to the compounds (FeAl/Fe3Al and Fe3C) became very small with respect to the major peak (Fe(110)/Al(200)) and tended to disappear after heat treatments. By referring to the major peaks, the intensity percentage of Fe-Al compounds and Fe3C compound were 29.7% and 13.4% respectively, for the as-sintered composite, whereas they were 6.3% and 5% respectively after heat treatment. This suggests that there were a decrease in the amount of compounds in the composite after heat treatment. Figure 16f presents that the crystallite sizes of Fe and Fe-Al compounds increased whereas the ones of Fe3C decreased due to the annealing. Since the crystalline size in materials is inversely proportional to the lattice strain in the materials [62], it can be assessed that that the heat treatment reduced the internal strains. Moreover, the residual stresses decreases when the strains are reduced [62]. Therefore, it can be inferred that there was reduction of residual stresses in the composites after heat treatment, which contribute to the enhancement of magnetic properties of the heat treated composites.
The post-sintering annealing led to lower mechanical strength and electrical resistivity, as shown in Table 6. While the as-sintered composite exhibited 590.39 MPa in mean TRS, the annealed sample had the average TRS of 460.43 MPa, which indicates a drop of 22% in mechanical strength of the composite subjected to an annealing heat treatment at 700 °C in the Ar atmosphere for 2 h.

4. Conclusions

The Fe-Al-MWCNT composites were sintered at an elevated temperature of 800 °C (higher than the melting point of the Al, 660 °C) using the spark plasma sintering process. The influence of different processing parameters such as MWCNT content, ball milling time, the mixture of iron nanoparticles and microparticles and post-sintering heat treatment on the properties of composites were investigated. The increase in MWCNT contents was found to increase the coercivity and remanence but the saturation magnetization was about 148.8 A·m2/kg regardless of the MWCNT content. Moreover, the greater the MWCNT content was, the lower the electrical resistivity was. Therefore, it was inferred that larger content MWCNT may lead to higher magnetic core losses of the composite due to the wider hysteresis loops (large coercivity and remanence) and lower electrical resistivity. The increase in MWCNT volume content also reduced the transverse rupture strength but improved the microhardness of the composites. This was attributed to the formation of iron-aluminum compounds and iron carbide, which are brittle and hard.
A comparative study according to the powder ball milling time of 12 h, 24 h and 48 h showed that milling for 24 h produced a composite with improved saturation magnetization, transverse rupture strength but lower hardness when compared to other milling times. Mixing the iron nanoparticles and iron microparticles within the composites has enhanced the magnetic softness of the composites when compared to a fully nanoparticle-based composite. Prior to heat treatments, the highest saturation magnetization of 157.82 A·m2/kg was obtained when the iron nanoparticles and microparticles were mixed in the ratio of 1:1.
The post-sintering annealing heat treatment was found to increase the saturation magnetization to 175.11 A·m2/kg and reduced the coercivity up to 854.30 A/m, and therefore improved the magnetic softness of the composites. It was found that the heat treatment increased the crystallite size of the Fe phase and reduced the ones of iron carbides. However, the electrical resistivity and transverse rupture strength were reduced after annealing. Overall, the annealed 40nFe-40mFe-19Al-1MWCNT composite exhibited the best magnetic properties with saturation magnetization greater than the commercially sendust core. From this study, it can be assessed that the mixture of ferromagnetic nanoparticles and microparticles at a suitable ratio can be used to produce magnetic composites with enhanced properties for electromagnetic applications. Moreover, this study showed that it is possible to produce good powder metallurgy composite parts by performing liquid phase sintering using spark plasma sintering. However, a lower content of the component in the composite that undergoes the liquid phase should be used and a relatively short time of sintering should be considered in order to limit the liquid phase for squeezing out the die due to the compression.

Author Contributions

Conceptualization, H.G.K., L.K.K., and H.J.S.; methodology, A.T., H.J.S. and S.H.G.; validation, H.G.K., L.K.K.; formal analysis, A.T., and S.H.G.; investigation, H.G.K., L.K.K. and A.T.; resources, H.J.S. and H.G.K.; data curation, A.T. and S.H.G.; writing—original draft preparation, A.T.; writing—review and editing, H.G.K., L.K.K. and A.T.; visualization, A.T. and S.H.G.; supervision, H.G.K., H.J.S. and L.K.K.; project administration, H.G.K., H.J.S. and L.K.K.; funding acquisition, H.G.K., and H.J.S. All authors have read and agreed to the published version of the manuscript.

Funding

This research was supported by Basic Science Research Program through the National Research Foundation of Korea (NRF) funded by the Ministry of Education (MOE) (No. 2016R1A6A1A03012069) and (No. 2017R1D1A1B0303569014).

Acknowledgments

The authors would like to thank the staffs of the Institute of Carbon Technology for their supports.

Conflicts of Interest

The authors declare no conflict of interest.

References

  1. Malaki, M.; Xu, W.; Kasar, A.K.; Menezes, P.L.; Dieringa, H.; Varma, R.S.; Gupta, M. Advanced metal matrix nanocomposites. Metals 2019, 9, 330. [Google Scholar] [CrossRef] [Green Version]
  2. Yu, W.H.; Sing, S.L.; Chua, C.K.; Kuo, C.N.; Tian, X.L. Particle-reinforced metal matrix nanocomposites fabricated by selective laser melting: A state of the art review. Prog. Mater. Sci. 2019, 104, 330–379. [Google Scholar] [CrossRef]
  3. Shirvanimoghaddam, K.; Hamim, S.U.; Karbalaei Akbari, M.; Fakhrhoseini, S.M.; Khayyam, H.; Pakseresht, A.H.; Ghasali, E.; Zabet, M.; Munir, K.S.; Jia, S.; et al. Carbon fiber reinforced metal matrix composites: Fabrication processes and properties. Compos. Part A Appl. Sci. Manuf. 2017, 92, 70–96. [Google Scholar] [CrossRef]
  4. Kumar, N.; Chittappa, H.C.; Ezhil Vannan, S. Development of Aluminium-Nickel Coated Short Carbon Fiber Metal Matrix Composites. Mater. Today Proc. 2018, 5, 11336–11345. [Google Scholar] [CrossRef]
  5. Ma, P.; Jia, Y.; Gokuldoss, P.K.; Yu, Z.; Yang, S.; Zhao, J.; Li, C. Effect of Al2O3 nanoparticles as reinforcement on the tensile behavior of Al-12Si composites. Metals 2017, 7, 359. [Google Scholar] [CrossRef] [Green Version]
  6. Esawi, A.M.K.; Morsi, K.; Sayed, A.; Gawad, A.A.; Borah, P. Fabrication and properties of dispersed carbon nanotube-aluminum composites. Mater. Sci. Eng. A 2009, 508, 167–173. [Google Scholar] [CrossRef]
  7. Kalra, C.; Tiwari, S.; Sapra, A.; Mahajan, S.; Gupta, P. Processing and Characterization of Hybrid Metal Matrix Composites. J. Mater. Environ. Sci. Environ. Sci. 2018, 9, 1979–1986. [Google Scholar]
  8. Ceschini, L.; Dahle, A.; Gupta, M.; Jarfors, A.E.W.; Jayalakshmi, S.; Morri, A.; Rotundo, F.; Toschi, S.; Singh, R.A. Aluminum and Magnesium Metal Matrix Nanocomposites; Springer: Berlin/Heidelberg, Germany, 2017; ISBN 978-981-10-2680-5. [Google Scholar]
  9. Gupta, P.; Kumar, D.; Jha, A.K.; Parkash, O. Effect of height to diameter (h/d) ratio on the deformation behaviour of Fe-Al2O3 metal matrix nanocomposites. Bull. Mater. Sci. 2016, 39, 1245–1258. [Google Scholar] [CrossRef]
  10. Gupta, P.; Kumar, D.; Quraishi, M.A.; Parkash, O. Effect of sintering parameters on the corrosion characteristics of Iron-Alumina metal matrix nanocomposites. J. Mater. Environ. Sci. 2015, 6, 155–167. [Google Scholar]
  11. Gupta, P.; Kumar, D.; Quraishi, M.A.; Parkash, O. Influence of processing parameters on corrosion behavior of metal matrix nanocomposites. J. Mater. Environ. Sci. 2016, 7, 3930–3937. [Google Scholar]
  12. Khosla, P.; Singh, H.K.; Katoch, V.; Dubey, A.; Singh, N.; Kumar, D.; Gupta, P. Synthesis, mechanical and corrosion behaviour of iron–silicon carbide metal matrix nanocomposites. J. Compos. Mater. 2018, 52, 91–107. [Google Scholar] [CrossRef]
  13. Krings, A.; Boglietti, A.; Cavagnino, A.; Sprague, S. Soft Magnetic Material Status and Trends in Electric Machines. IEEE Trans. Ind. Electron. 2017, 64, 2405–2414. [Google Scholar] [CrossRef]
  14. Wu, C.; Huang, M.; Luo, D.; Jiang, Y.; Yan, M. SiO2 nanoparticles enhanced silicone resin as the matrix for Fe soft magnetic composites with improved magnetic, mechanical and thermal properties. J. Alloys Compd. 2018, 741, 35–43. [Google Scholar] [CrossRef]
  15. Difference Between Alloy and Composite. Available online: http://www.differencebetween.net/science/difference-between-alloy-and-composite/ (accessed on 12 March 2020).
  16. Tugirumubano, A.; Go, S.H.; Shin, H.J.; Kwac, L.K.; Kim, H.G. Magnetic, Electrical, and Mechanical Behavior of Fe-Al-MWCNT and Fe-Co-Al-MWCNT Magnetic Hybrid Nanocomposites Fabricated by Spark Plasma Sintering. Nanomaterials 2020, 10, 436. [Google Scholar] [CrossRef] [Green Version]
  17. Holladay, J.W. Review of Developments in Iron-Aluminum-Base Alloys; Battelle Memorial Institute, Defense Metals Information Center: Colombus, OH, USA, 1961. [Google Scholar]
  18. Tugirumubano, A. Development and Characterization of Magnetic Particulate Composites for Magnetic Core Applications. Ph.D. Thesis, Jeonju University, Jeonju, Korea, 2020. [Google Scholar]
  19. Albaaji, A.J.; Castle, E.G.; Reece, M.J.; Hall, J.P.; Evans, S.L. Mechanical and magnetic properties of spark plasma sintered soft magnetic FeCo alloy reinforced by carbon nanotubes. J. Mater. Res. 2016, 31, 3448–3458. [Google Scholar] [CrossRef]
  20. Pang, L.X.; Xing, D.J.; Zhang, A.Q.; Xu, J.; Sun, S.S. Magnetic Properties of MWNTs-Fe3Al Composite. Adv. Mater. Res. 2009, 79–82, 1351–1354. [Google Scholar] [CrossRef]
  21. Phuong, D.D.; Van Trinh, P.; Van An, N.; Van Luan, N.; Minh, P.N.; Khisamov, R.K.; Nazarov, K.S.; Zubairov, L.R.; Mulyukov, R.R.; Nazarov, A.A. Effects of carbon nanotube content and annealing temperature on the hardness of CNT reinforced aluminum nanocomposites processed by the high pressure torsion technique. J. Alloys Compd. 2014, 613, 68–73. [Google Scholar] [CrossRef]
  22. Kurita, H.; Kwon, H.; Estili, M.; Kawasaki, A. Multi-Walled Carbon Nanotube-Aluminum Matrix Composites Prepared by Combination of Hetero-Agglomeration Method, Spark Plasma Sintering and Hot Extrusion. Mater. Trans. 2011, 52, 1960–1965. [Google Scholar] [CrossRef] [Green Version]
  23. Singla, D.; Amulya, K.; Murtaza, Q. CNT Reinforced Aluminium Matrix Composite-A Review. Mater. Today Proc. 2015, 2, 2886–2895. [Google Scholar] [CrossRef]
  24. Shadakshari, R.; Mahesha, K.; Niranjan, H.B. Carbon Nanotube Reinforced Aluminium Matrix Composites – A Review. Int. J. Innov. Res. Sci. Eng. Technol. 2012, 1, 206–213. [Google Scholar]
  25. Kumar, A.; Banerjee, M.K. Production of Iron—Multiwall Carbon Nanotubes (CNT) Composite by Mechanical Alloying. Int. J. Eng. Technol. Sci. Res. 2017, 4, 469–479. [Google Scholar]
  26. Everett, R.K.; Arsenault, R.J. (Eds.) Metal Matrix Composites: Processing and Interfaces; Academic Press: Cambridge, MA, USA, 1991; ISBN 0123418321. [Google Scholar]
  27. Vani, V.V.; Chak, S.K. The effect of process parameters in Aluminum Metal Matrix Composites with Powder Metallurgy. Manuf. Rev. 2018, 5, 7. [Google Scholar] [CrossRef] [Green Version]
  28. Chang, I.; Yuyuan, Z. (Eds.) Advances in Powder Metallurgy: Properties, Processing and Applications; Woodhead Publishing: Amsterdam, The Netherlands, 2013; ISBN 9781845695316. [Google Scholar]
  29. Saheb, N.; Iqbal, Z.; Khalil, A.; Hakeem, A.S.; Al Aqeeli, N.; Laoui, T.; Al-Qutub, A.; Kirchner, R. Spark plasma sintering of metals and metal matrix nanocomposites: A review. J. Nanomater. 2012, 2012, 1–13. [Google Scholar] [CrossRef] [Green Version]
  30. Amin, K. Carbon Nanotubes Reinforced Aluminum Matrix Composites—A Review of Processing Techniques. Pertanika J. Sch. Res. Rev. 2017, 3, 70–92. [Google Scholar]
  31. Franceschin, G.; Flores-Martínez, N.; Victorio, G.V.; Ammar, S.; Valenzuela, R. Sintering and Reactive Sintering by Spark Plasma Sintering (SPS). In Sintering of Functional Materials; InTech: Burlington, MA, USA, 2018. [Google Scholar]
  32. Chen, B.; Shen, J.; Ye, X.; Imai, H.; Umeda, J.; Takahashi, M.; Kondoh, K. Solid-state interfacial reaction and load transfer efficiency in carbon nanotubes (CNTs)-reinforced aluminum matrix composites. Carbon N. Y. 2017, 114, 198–208. [Google Scholar] [CrossRef]
  33. Aliyu, I.; Saheb, N.; Hassan, S.; Al-Aqeeli, N. Microstructure and Properties of Spark Plasma Sintered Aluminum Containing 1 wt.% SiC Nanoparticles. Metals 2015, 5, 70–83. [Google Scholar] [CrossRef]
  34. German, R.M.; Suri, P.; Park, S.J. Review: Liquid phase sintering. J. Mater. Sci. 2009, 44, 1–39. [Google Scholar] [CrossRef] [Green Version]
  35. He, K.; Chen, N.; Wang, C.; Wei, L.; Chen, J. Method for Determining Crystal Grain Size by X-ray Diffraction. Cryst. Res. Technol. 2018, 53, 1–6. [Google Scholar] [CrossRef]
  36. ASTM, A. B528-99: Standard Test Methods for Transverse Rupture Strength of Metal Powder Specimens. In ASTM Standards; ASTM International: West Conshohocken, PA, USA, 2004. [Google Scholar]
  37. Neamţu, B.V.; Chicinaş, I.; Isnard, O.; Ciascai, I.; Chiriac, H.; Lostun, M. Magnetic properties of nanocrystalline Ni3Fe compacts prepared by spark plasma sintering. Intermetallics 2013, 35, 98–103. [Google Scholar] [CrossRef]
  38. Bakshi, S.R.; Lahiri, D.; Agarwal, A. Carbon nanotube reinforced metal matrix composites—A review. Int. Mater. Rev. 2010, 55, 41–64. [Google Scholar] [CrossRef]
  39. Shishkovsky, I.; Missemer, F.; Kakovkina, N.; Smurov, I. Intermetallics synthesis in the Fe-Al system via layer by layer 3D laser cladding. Crystals 2013, 3, 517–529. [Google Scholar] [CrossRef] [Green Version]
  40. Paris, S.; Gaffet, E.; Bernard, F. Control of FeAl Composition Produced by SPS Reactive Sintering from Mechanically Activated Powder Mixture. J. Nanomater. 2013, 2013, 1–11. [Google Scholar] [CrossRef]
  41. Sunday, K.J. Development of Ferrite-coated Soft Magnetic Composites: Correlation of Microstructure to Magnetic Properties. Ph.D. Thesis, Drexel University, Drexel, PA, USA, 2017. [Google Scholar]
  42. Ryl, J.; Wysocka, J.; Cieslik, M.; Gerengi, H.; Ossowski, T.; Krakowiak, S.; Niedzialkowski, P. Understanding the origin of high corrosion inhibition efficiency of bee products towards aluminium alloys in alkaline environments. Electrochim. Acta 2019, 304, 263–274. [Google Scholar] [CrossRef]
  43. Greczynski, G.; Hultman, L. X-ray photoelectron spectroscopy: Towards reliable binding energy referencing. Prog. Mater. Sci. 2020, 107, 100591. [Google Scholar] [CrossRef]
  44. Luo, F.; Fan, X.; Luo, Z.; Hu, W.; Li, G.; Li, Y.; Liu, X.; Wang, J. Ultra-low inter-particle eddy current loss of Fe3Si/Al2O3 soft magnetic composites evolved from FeSiAl/Fe3O4 core-shell particles. J. Magn. Magn. Mater. 2019, 484, 218–224. [Google Scholar] [CrossRef]
  45. Luo, Z.; Fan, X.; Hu, W.; Luo, F.; Wang, J.; Wu, Z.; Liu, X.; Li, G.; Li, Y. Properties of Fe2SiO4/SiO2 coated Fe-Si soft magnetic composites prepared by sintering Fe-6.5wt%Si/Fe3O4 composite particles. J. Magn. Magn. Mater. 2020, 499. [Google Scholar] [CrossRef]
  46. Grosvenor, A.P.; Kobe, B.A.; Biesinger, M.C.; McIntyre, N.S. Investigation of multiplet splitting of Fe 2p XPS spectra and bonding in iron compounds. Surf. Interface Anal. 2004, 36, 1564–1574. [Google Scholar] [CrossRef]
  47. Liu, D.; Wu, C.; Yan, M.; Wang, J. Correlating the microstructure, growth mechanism and magnetic properties of FeSiAl soft magnetic composites fabricated via HNO3 oxidation. Acta Mater. 2018, 146, 294–303. [Google Scholar] [CrossRef]
  48. Yamashita, T.; Hayes, P. Analysis of XPS spectra of Fe2+ and Fe3+ ions in oxide materials. Appl. Surf. Sci. 2008, 254, 2441–2449. [Google Scholar] [CrossRef]
  49. Davydov, V.; Rakhmanina, A.; Kireev, I.; Alieva, I.; Zhironkina, O.; Strelkova, O.; Dianova, V.; Samani, T.D.; Mireles, K.; Yahia, L.H.; et al. Solid state synthesis of carbon-encapsulated iron carbide nanoparticles and their interaction with living cells. J. Mater. Chem. B 2014, 2, 4250–4261. [Google Scholar] [CrossRef]
  50. Fähler, S.; Schultz, L. Magnetic Films: Hard. In Encyclopedia of Materials: Science and Technology; Elsevier: Amsterdam, The Netherlands, 2001; pp. 4767–4771. [Google Scholar]
  51. Yu, R.H.; Basu, S.; Zhang, Y.; Parvizi-Majidi, A.; Xiao, J.Q. Pinning effect of the grain boundaries on magnetic domain wall in FeCo-based magnetic alloys. J. Appl. Phys. 1999, 85, 6655–6659. [Google Scholar] [CrossRef] [Green Version]
  52. Chapman, J.S. Electric Machinery Fundamentals, 5th ed.; McGraw-Hill: New York, NY, USA, 2012; ISBN 9780073529547. [Google Scholar]
  53. Goldman, A. Magnetic Components for Power Electronics, 1st ed.; Springer: New York, NY, USA, 2002; ISBN 9781461352808. [Google Scholar]
  54. Taghvaei, A.H.; Shokrollahi, H.; Janghorban, K.; Abiri, H. Eddy current and total power loss separation in the iron-phosphate-polyepoxy soft magnetic composites. Mater. Des. 2009, 30, 3989–3995. [Google Scholar] [CrossRef]
  55. Agarwal, A.; Baskshi, S.R.; Lahiri, D. Carbon Nanotubes: Reinforced Metal Matrix Composites, 1st ed.; CRC Press: Boca Raton, FL, USA, 2017; ISBN 9781138113732. [Google Scholar]
  56. Li, Y.; Kröger, M. A theoretical evaluation of the effects of carbon nanotube entanglement and bundling on the structural and mechanical properties of buckypaper. Carbon N. Y. 2012, 50, 1793–1806. [Google Scholar] [CrossRef]
  57. Suryanarayana, C. Mechanical Alloying and Milling; CRC Press: New York, NY, USA, 2004; ISBN 0203020642, 9780203020647. [Google Scholar]
  58. Hanejko, F.G.; Ellis, G.W.; Hale, T.J. Application of High Performance Material Processing—Electormagnetic Products. In Proceedings of the International Conference on Powder Metallurgy & Particulate Materials, Las Vegas, NV, USA, 31 May–4 June 1998; pp. 1–16. [Google Scholar]
  59. Prasanna, A.A. Effect of crystallite size on Vickers microhardness in nanostructured Heusler Ni39+xMn50Sn11−x (x ≤ 2)alloys. In Proceedings of the IEEE International Conference on Nanoscience, Engineering and Technology (ICONSET 2011), Chennai, India, 28–30 November 2011; pp. 424–428. [Google Scholar]
  60. Lei, J.; Zheng, J.; Zheng, H.; Qiao, L.; Ying, Y.; Cai, W.; Li, W.; Yu, J.; Lin, M.; Che, S. Effects of heat treatment and lubricant on magnetic properties of iron-based soft magnetic composites with Al2O3 insulating layer by one-pot synthesis method. J. Magn. Magn. Mater. 2019, 472, 7–13. [Google Scholar] [CrossRef]
  61. Yi, Y.; Peng, Y.; Xia, C.; Wu, L.; Ke, X.; Nie, J. Influence of heat treatment on microstructures and magnetic properties of Fe-based soft magnetic composites prepared by co-precipitation method. J. Magn. Magn. Mater. 2019, 476, 100–105. [Google Scholar] [CrossRef]
  62. Muhammed Shafi, P.; Chandra Bose, A. Impact of crystalline defects and size on X-ray line broadening: A phenomenological approach for tetragonal SnO2 nanocrystals. AIP Adv. 2015, 5, 057137. [Google Scholar] [CrossRef]
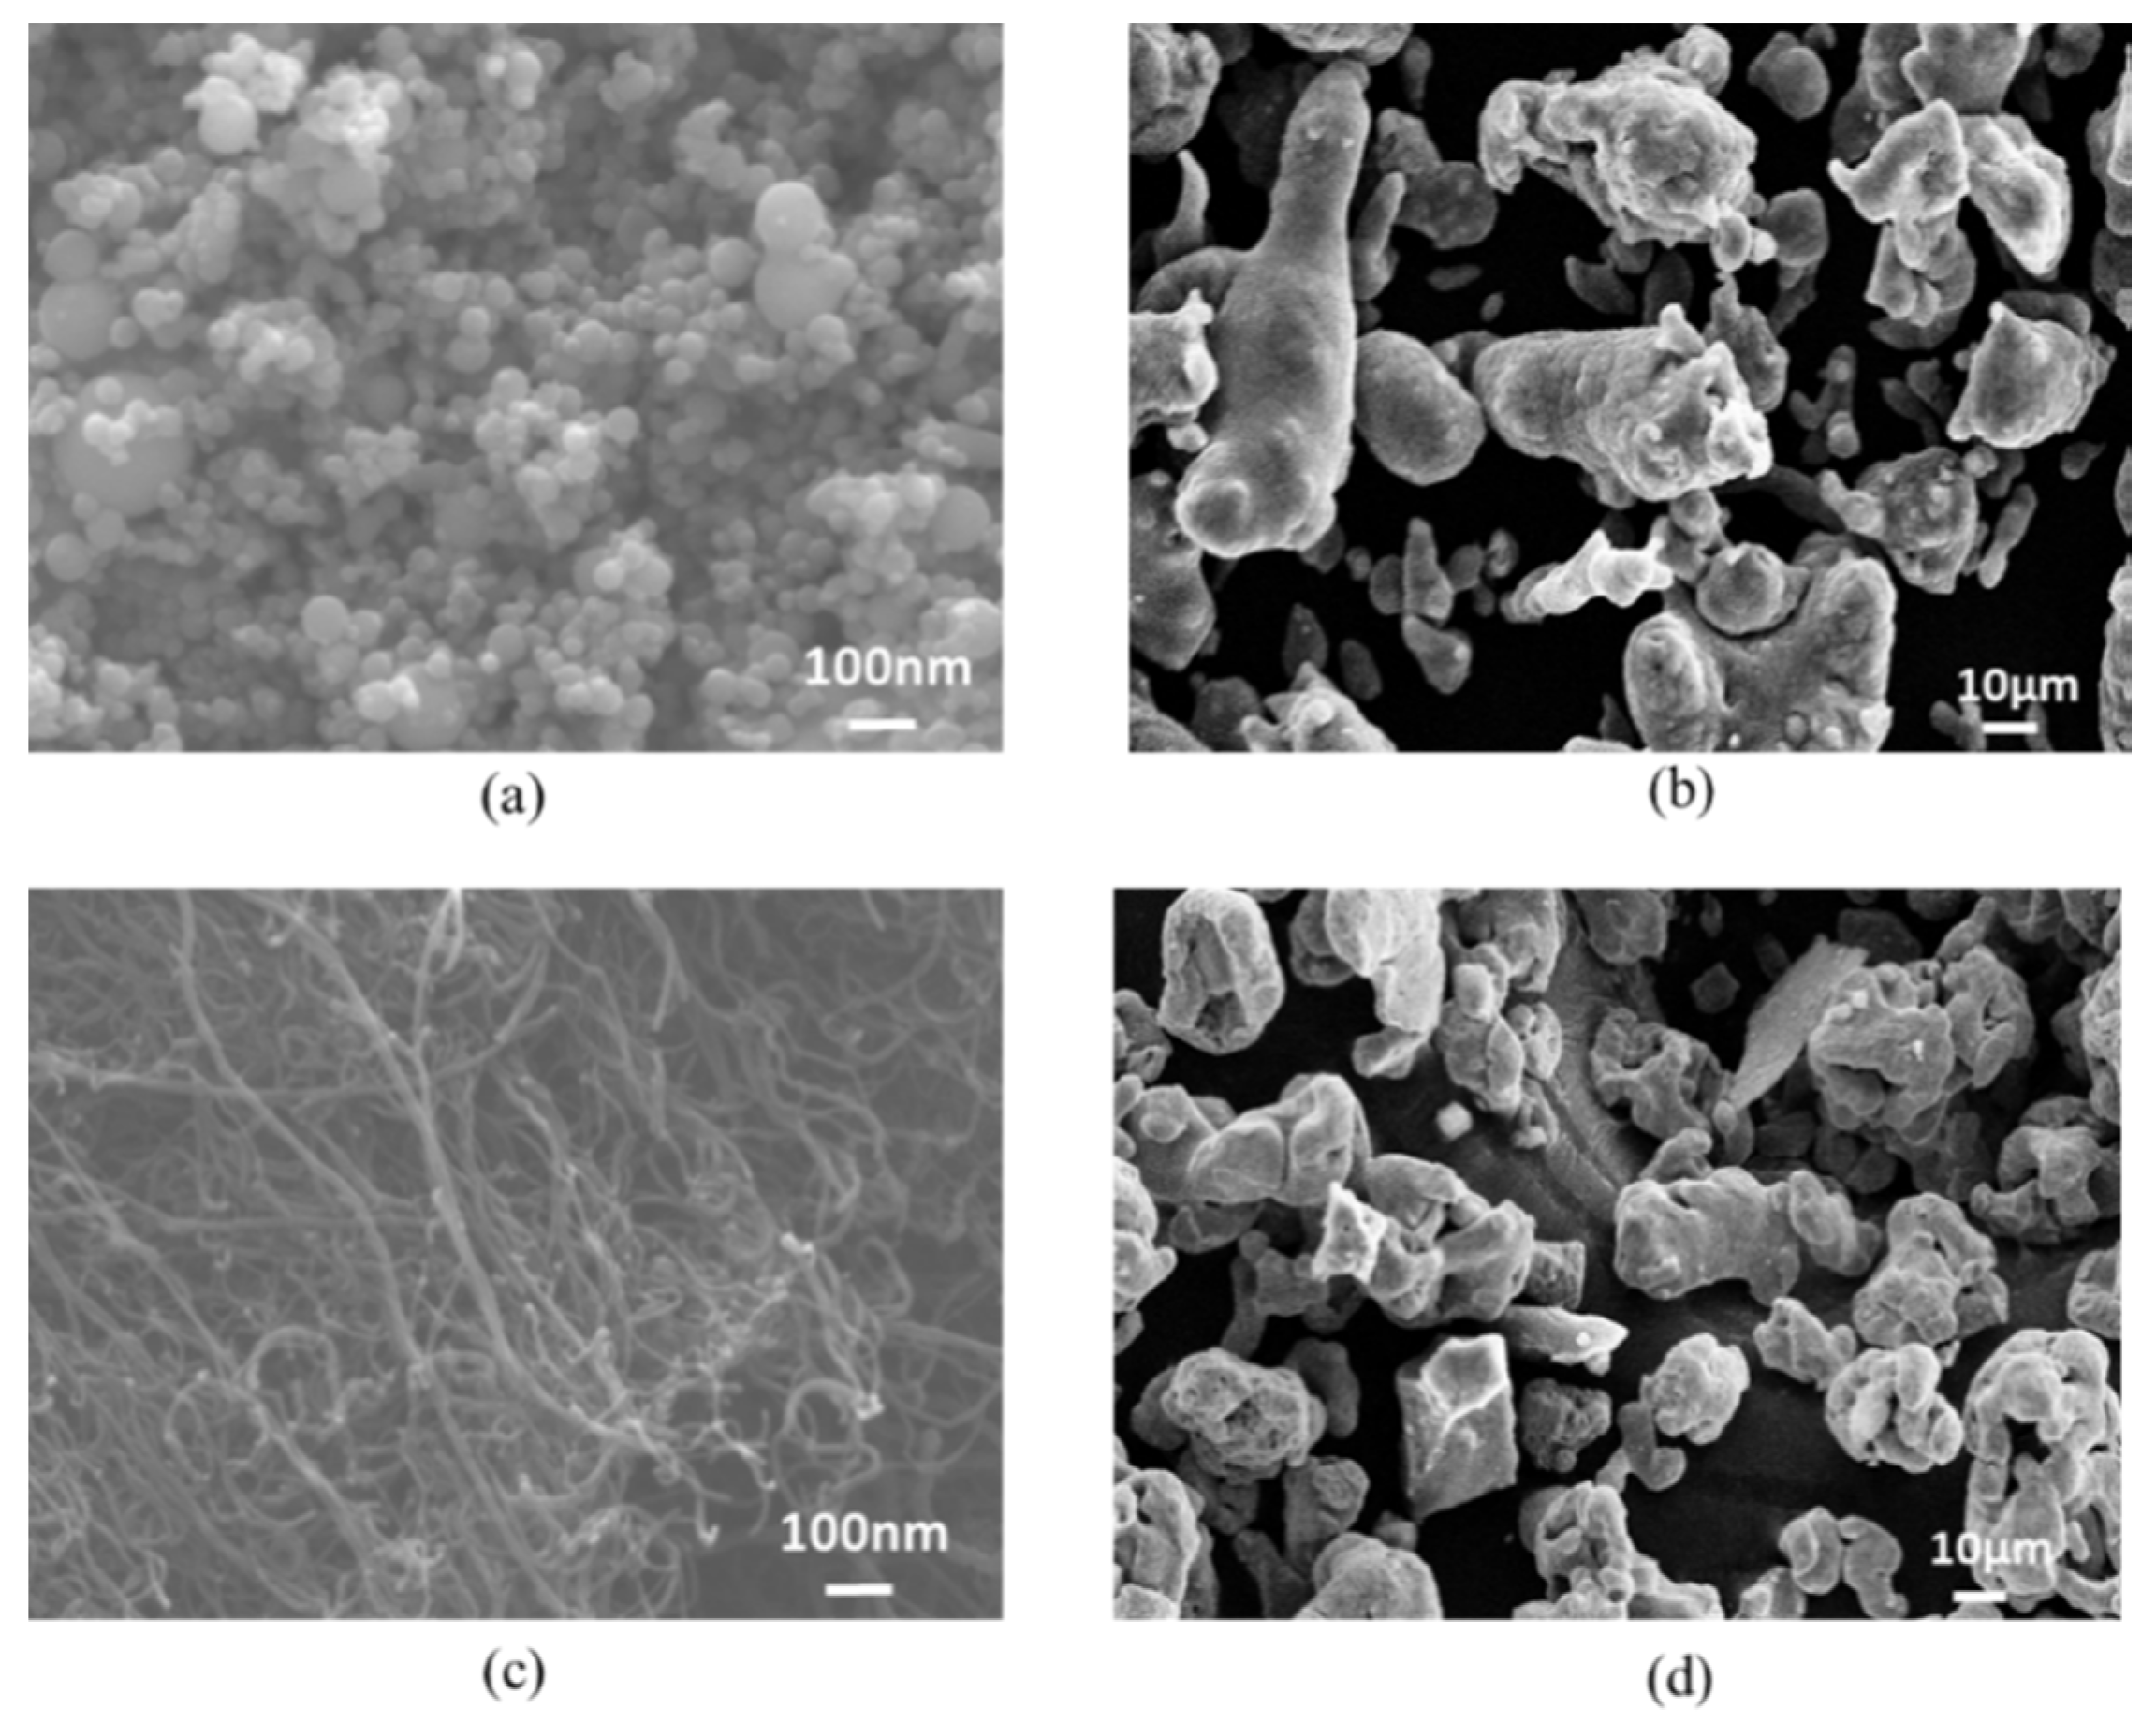
Figure 1. SEM images of the as-received powders: (a) Fe nanopowders (nFe); (b) Al powders; (c) multi-walled carbon nanotube (MWCNT) powders and (d) Fe microparticles (mFe).
Metals 10 00962 g001
Figure 2. Sample preparation: (a) powders mixing procedures; (b) model of die-powders-punches system preparation; (c) mounting the die-powders-punches system in the spark plasma sintering (SPS) machine and (d) sintered samples.
Metals 10 00962 g002
Figure 3. Morphology of the sintered composites: (a) SEM images of pure Fe (sintered nFe); (b) SEM images of 80nFe-20Al; (c) SEM images of 80nFe-19Al-1MWCNT; (d) SEM images of 80nFe-18Al-2WMCNT; (e) EDS mapping of 80nFe-20Al and (f) EDS mapping of 80nFe-18Al-2WMCNT.
Metals 10 00962 g003
Figure 4. (a) XRD analysis of the composites according to the MWCNT content; (b) details of the XRD patterns of the materials in (a); (cf) the zoom-up of the XRD pattern in the angular range of 40–50° for pure Fe, 80nFe-20Al, 80nFe-19Al-1MWCNT and 80nFe-18Al-2MWCNT respectively and (g) crystallite size and full-width-at-half maximum (FWHM) calculated based on peaks of Al(200) and Fe(110).
Metals 10 00962 g004
Figure 5. XPS analysis: (a) survey; (b) Fe 2p; (c) Al 2p; (d) O 1s; (e) C 1s; (fi) deconvolution of Fe 2p, Al 2p, O 1s and C 1s for 80nFe-18Al-2MWCNT respectively.
Metals 10 00962 g005
Figure 6. Hysteresis loops according to the MWCNT content; (a) full loops; (b) magnification of the selected region in (a); (c) the as-received iron nanoparticles.
Metals 10 00962 g006
Figure 7. Effect of the MWCNT volume content on the electrical and mechanical properties: (a) electric resistivity; (b) Vickers microhardness and (c) transverse rupture strength.
Metals 10 00962 g007
Figure 8. SEM Images of 80nFe-19Al-1MWCNT composites milled for: (a) 12 h; (b) 24 h and (c) 48 h.
Metals 10 00962 g008
Figure 9. (a) Full scan of the XRD pattern of 80nFe-19Al-1MWCNT at different ball milling time; (b) detailed view of XRD patterns for small peaks observation; (ce) zoom-in of the peaks in the angular range of 40–50° in case of powder milled for 12 h, 24 h and 48 h respectively; (f) crystallite size at a different milling time and (g) FWHM corresponding to the crystallite size in (f).
Metals 10 00962 g009
Figure 10. Hysteresis loops of 80nFe-19Al-1MWCNT according to the milling time: (a) full loops and (b) magnification of the selected region.
Metals 10 00962 g010
Figure 11. Effect of milling time on: (a) electrical resistivity; (b) Vickers microhardness and (c) transverse rupture strength of 80nFe-19Al-1MWCNT nanocomposite.
Metals 10 00962 g011
Figure 12. Morphology of the composites with the mixture of Fe nanoparticles and Fe microparticles: (a) SEM image of 40nFe-40mFe-19Al-1MWCNT powders after 24 h of ball milling; (b) high magnification (×50,000) of the selected region in (a); (c) EDS mapping of 40nFe-40mFe-19Al-1MWCNT nanocomposites and (d) EDS mapping of 20nFe-60mFe-19Al-1MWCNT nanocomposites.
Metals 10 00962 g012
Figure 13. Effect of iron nanoparticles to iron microparticles volume ratio on crystallography: (a) full length of high intensity XRD peaks and (b) detailed view of low intensity peaks; (ce) zoom of the major peak between 42 and 46° in XRD patterns for the composites and (f) crystallite size of some phases in the composites.
Metals 10 00962 g013
Figure 14. Comparative hysteresis loops of: (a,b) the nanocomposites according to Fe nanoparticles and Fe microparticles volume content and (c,d) the as-received Fe nanoparticles and Fe microparticles.
Metals 10 00962 g014
Figure 15. Effect of Fe nanoparticles and Fe microparticles mixture on: (a) electrical resistivity; (b) Vickers microhardness and (c) transverse rupture strength.
Metals 10 00962 g015
Figure 16. (a) Effect of the annealing heat treatment on the hysteresis loops of 40nFe-40mFe-19Al-1MWCNT; (b) magnified region in (a); (c) full XRD scan of the composites after and before annealing; (d,e) magnification of the XRD pattern in the angular range of 40–50° for the as-sintered and annealed, respectively; (f) crystallite size for the main peaks of the Fe(110)/Al(200), Fe-Al compounds and iron carbide phase present between 40 and 50°.
Metals 10 00962 g016
Table 1. Volume ratio of the nanocomposite materials.
CompositesVolume Fraction (vol%)
FeAlMWCNT
nFemFe
80nFe-20Al80 20
80nFe-19Al-1MWCNT80 191
80nFe-18Al-2MWCNT80 182
40nFe-40mFe-19Al-1MWCNT4040191
20nFe-60mFe-19Al-1MWCNT2060191
nFe100
Table 2. Magnetic properties and density of the composites according to the MWCNT content.
CompositesDensity (g/cm3)Relative Density (%)Coercivity, Hc (A/m)Magnetization, Ms (A·m2/kg)Remanence, Mr (A·m2/kg)
nFe7.4794.931466.24182.760.68
80nFe-20Al6.3092.161995.70148.831.16
80nFe-19Al-1MWCNT 6.2891.982175.64148.821.19
80nFe-18Al-2MWCNT6.2191.092368.63148.831.22
Sendust Core6.03-685.10122.200.33
nFe (as-received powders) 15,309.71175.9713.44
Table 3. Magnetic properties and density of 80nFe-19Al-1MWCNT according to the milling time.
Milling TimeDensity (g/cm3)Relative Density (%)Coercivity, Hc (A/m)Magnetization, Ms (A·m2/kg)Remanence, Mr (A·m2/kg)
12 h6.2291.082125.64 143.04 1.12
24 h6.2891.982175.64 148.82 1.19
48 h6.3593.032094.19 143.86 1.05
Table 4. Density and magnetic properties according to nano-Fe and micro-Fe mixtures.
CompositesDensity (g/cm3)Relative Density (%)Coercivity, Hc (A/m)Magnetization, Ms (A·m2/kg)Remanence, Mr (A·m2/kg)
80nFe-19Al-1MWCNT 6.2891.982175.64148.821.19
40nFe-40mFe-19Al-1MWCNT 6.2491.361083.36157.820.68
20nFe-60mFe-19Al-1MWCNT 6.0889.081514.41149.610.79
nFe Compact7.4794.931466.24182.760.68
nFe (as-received powders) 15309.71175.9713.44
mFe (as-received powders) 1409.24173.121.15
Table 5. Effect of the annealing heat treatment on the magnetic properties of 40nFe-40mFe-19Al-1MWCNT.
40nFe-40mFe-19Al-1MWCNTDensity (g/cm3)Coercivity, Hc (A/m)Magnetization, Ms (A·m2/kg)Remanence, Mr (A·m2/kg)
As sintered6.241083.36157.820.68
Annealed6.27854.29175.110.58
Table 6. Effect of post-sintering annealing on transverse rupture strength (TRS) and electrical resistivity of 40nFe-40mFe-19Al-1MWCNT composite.
40nFe-40mFe-19Al-1MWCNTTRS (MPa)Electrical Resistivity (μΩ·cm)
As sintered590.3934.99
Annealed460.4330.30