Article

Microstructure Evolution and Mechanical Properties of the 2195 Al-Li Alloy via Different Annealing and Ramp Heating-Up Treatments

1
School of Materials Science and Engineering, Central South University, Changsha 410083, China
2
Key Laboratory of Nonferrous Materials Science and Engineering of Ministry of Education, Central South University, Changsha 410083, China
3
Beijing Institute of Astronautical Systems Engineering, Beijing 100076, China
*
Author to whom correspondence should be addressed.
Metals 2020, 10(7), 910; https://doi.org/10.3390/met10070910
Submission received: 15 June 2020 / Revised: 27 June 2020 / Accepted: 6 July 2020 / Published: 8 July 2020

Abstract

:
In this paper, the microstructure evolution of the 2195 Al-Li alloy under different isothermal annealing schedules and ramp heating-up heat treatments prior to solution heat treatment and the tensile properties of the aging alloy were investigated. The grain structure characteristics of the aging alloy could be influenced by the change of different heat treatment schedules prior to the solution heat treatment. Meanwhile, the mechanical properties of the aging alloy including strength, heterogeneity, and anisotropy were closely related to the grain structure characteristics. There were evident differences in the mechanical properties of aging samples, attributed to the mutual effect of grain structure evolution and texture change. Annealing at a lower temperature (300–350 °C) resulted in the growth of the grain size and the aspect ratio as well as the decrease of the deformation texture components, related to the decline of the strength and the heterogeneity. While grains refined and the deformation texture components increased as the annealing temperature rose (350–400 °C), the strength along the transverse direction decreased, and the heterogeneity increased. Fibrous and overall texture components significantly strengthened in the grain structure of aging samples treated with the low heating-up rate, resulting in a higher strength in the longitudinal direction.

1. Introduction

Al-Li alloys possess a series of excellent properties such as low density, high elastic modulus, and high specific strength. Therefore, they have attracted intense attention from the aeronautic and aerospace industries. The 2195 Al-Li alloy is a typical third-generation Al-Li alloy, which has been successfully used in launch vehicles, fuel tanks, and aircraft [1]. The excellent mechanical properties of the 2195 Al-Li alloy are due to the addition of Mg, Ag, and Zn elements and the appropriate Cu/Li ratio, optimizing the precipitates [2]. However, some shortcomings, including high anisotropy and poor combination of strength and ductility of the third-generation Al-Li alloys, have hindered the further application of Al-Li alloys [3].
To optimize the mechanical properties and reduce the anisotropy used to meet the increasing need for designing advanced aerospace equipment, one of the most important methods is to improve the grain structure adaptability of Al-Li alloys [4]. Some studies show that severe plastic deformation [5], the addition of micro-alloying elements [6], and heat treatment [7] result in significant differences in the grain structures of Al-Li alloys. Ma et al. [8] studied the effect of cold rolling reduction on the grain structures of solutionized 1445 Al-Li alloy sheets. The fraction and size of the recrystallized grains in the solutionized sheets decreased with an increasing cold rolling reduction. Wang et al. [9] studied alloy sheets obtained by cold rolling possesses significantly elongated grains and relatively high stored energy, which constitute the driving force for recrystallization in the subsequent recrystallization annealing or solution treatment. Hence, recrystallization easily occurs in cold-rolled sheets during annealing or solution treatment, resulting in grain refinement and amelioration of the mechanical properties. The second-phase particles in alloys could also make a difference in the grain structure by affecting the recrystallization process. Suresh et al. [10] reported that the addition of Sc and Zr elements to the 2195 alloy resulted in grain refinement due to the presence of Al3(Sc, Zr) particles, which affected the stability of the sub-grain structure by exerting a drag force on the sub-grain boundaries, and further influenced recrystallization. Moreover, the recrystallization process of the alloys is also related to heat treatments after severe plastic deformation. Xiao et al. [11] designed electro-pulsing-assisted recrystallization annealing to rapidly complete the recrystallization process and lead to grain refinement. The impact of recrystallized grains on mechanical properties is bifacial: on the one hand, recrystallization can result in grain refinement, which can promote the strength and keep the ductility at a high degree, and on the other hand, it may weaken the crystallographic texture, which is well known for strengthening Al-Cu alloys.
Modification of the texture characteristics is also an essential aspect of the grain structure related to the mechanical properties of Al-Li alloys. Many works have been executed on the texture evolution of rolled and annealed Al-Li alloys. In terms of the rolling process, the grains are gradually rotated to β fiber running from the Brass{110}<112> to Copper{112}<111> through the S{123}<634> orientation, and then finally steadily located on β fiber. Vasudevan et al. [12] conducted a similar study showing that Brass{110}<112> usually formed in Al-Li alloys. After annealing or solution treatment, the crystallized texture components, including the textures near α fiber such as Goss{110}<100> and Cube{100}<100>, grew sharply. Roy et al. [13] examined the evolution of microstructure and mechanical properties of the alloy under annealing treatment following severe plastic deformation. It was confirmed that annealing and cold-rolling have a significant influence on the texture of components. Wang et al. [14] investigated texture evolution with different intermediate annealing treatments of Al-Mg-Si-Cu alloys and found that low-temperature annealing is beneficial to form recrystallized texture components. Huo et al. [15] obtained steady hardness distribution and excellent texture composition of the 1060 Al alloy by discussing isothermal and isothermal annealing.
In summary, extensive investigations have demonstrated that grain structure optimization is connected firmly with the microstructure evolution of recrystallization and texture. To date, although abundant works have focused on improving the grain structure adaptability of the Al-Cu alloy or Al-Mg alloy [16,17] through various micro-alloying elements and processes. However, few studies have been conducted on the optimization of the grain structure related to the mechanical properties of the 2195 Al-Li alloy via preliminary heat treatment prior to solution treatment. The current investigation aims to study the grain texture characteristic of the aging 2195 Al-Li alloy via different heat treatments prior to the solution treatment. The different grain texture characteristics was linked to the mechanical properties of the studied aging alloy. It offered a novel way to adjust the mechanical properties of the aging alloy by structuring optimize grain structure characteristics on the addition of the heat treatment prior to the solution heat treatment.

2. Experimental

The experimental 2195 Al-Li alloy plate with the chemical composition shown in Table 1 was supplied by Southwest Aluminum Co., Ltd. The original thickness of the sample was 20 mm. The alloy plates were firstly subjected to cold rolling with a 75% reduction to 5 mm. Different preliminary heat treatment schedules were designed to study the effect of the corresponding aging samples on the grain texture feature. The cold-rolled samples were then subjected to annealing treatments with different temperatures prior to the solution heat treatment. The isothermal annealing at temperature was a range of 300–400 °C for 2 h. Besides, the cold-rolled samples were under ramp heating-up with different rates during the solution process, including a high heating-up rate (around 10 °C /min), a medium heating-up rate (around 5 °C /min), and low heating-up (<2 ℃/min).
After two kinds as mentioned above heat treatments, the sheets were solutionized at 505 ℃ for 50 min, followed by quenching in cold water, and were then subjected to T8 temper-aging treatment (150 °C for 34 h after 4% pre-stretch deformation). The schematic of the processing route is shown in Figure 1. The microstructure evolution of the studied alloy during the different process procedures was detailed characterized to examine the influence of the preliminary heat treatment on the grain texture characteristics related to the mechanical properties of the aging alloy.
The tensile properties of the aged samples were characterized on an MTS 858 universal testing machine (MTS Industrial Systems CO.,LTD., Minneapolis, MN, USA) with a strain rate of 1.0 × 10⁻³ s−1 at room temperature. Samples with a parallel section gauge of 45 mm in length and 12.5 mm in width were cut from the cold-rolled sheets along with the longitudinal and transverse directions, respectively. To ensure the data reliability, three parallel samples were tested for each condition.
The samples for metallographic characterization were cut from the longitudinal direction of the solutionized sheets, and then mechanically ground and polished. The samples were anodically coated at 0.1 A in a solution containing 1.1 g H3BO3, 95 mL H2O, and 3 mL hydrofluoric acid by a DC machine (direct current machine). The metallographic images were captured on the Leica DMI300 M optical microscope (Leica Microsystems Inc., Wetzlar, Germany). Scanning electron microscopy (SEM) was used to characterize the particles in the samples treated by different annealing treatments. The SEM images were taken from Quanta-200 environmental SEM (FEI CO., Hillsboro, OR, USA) under the backscattering modes.
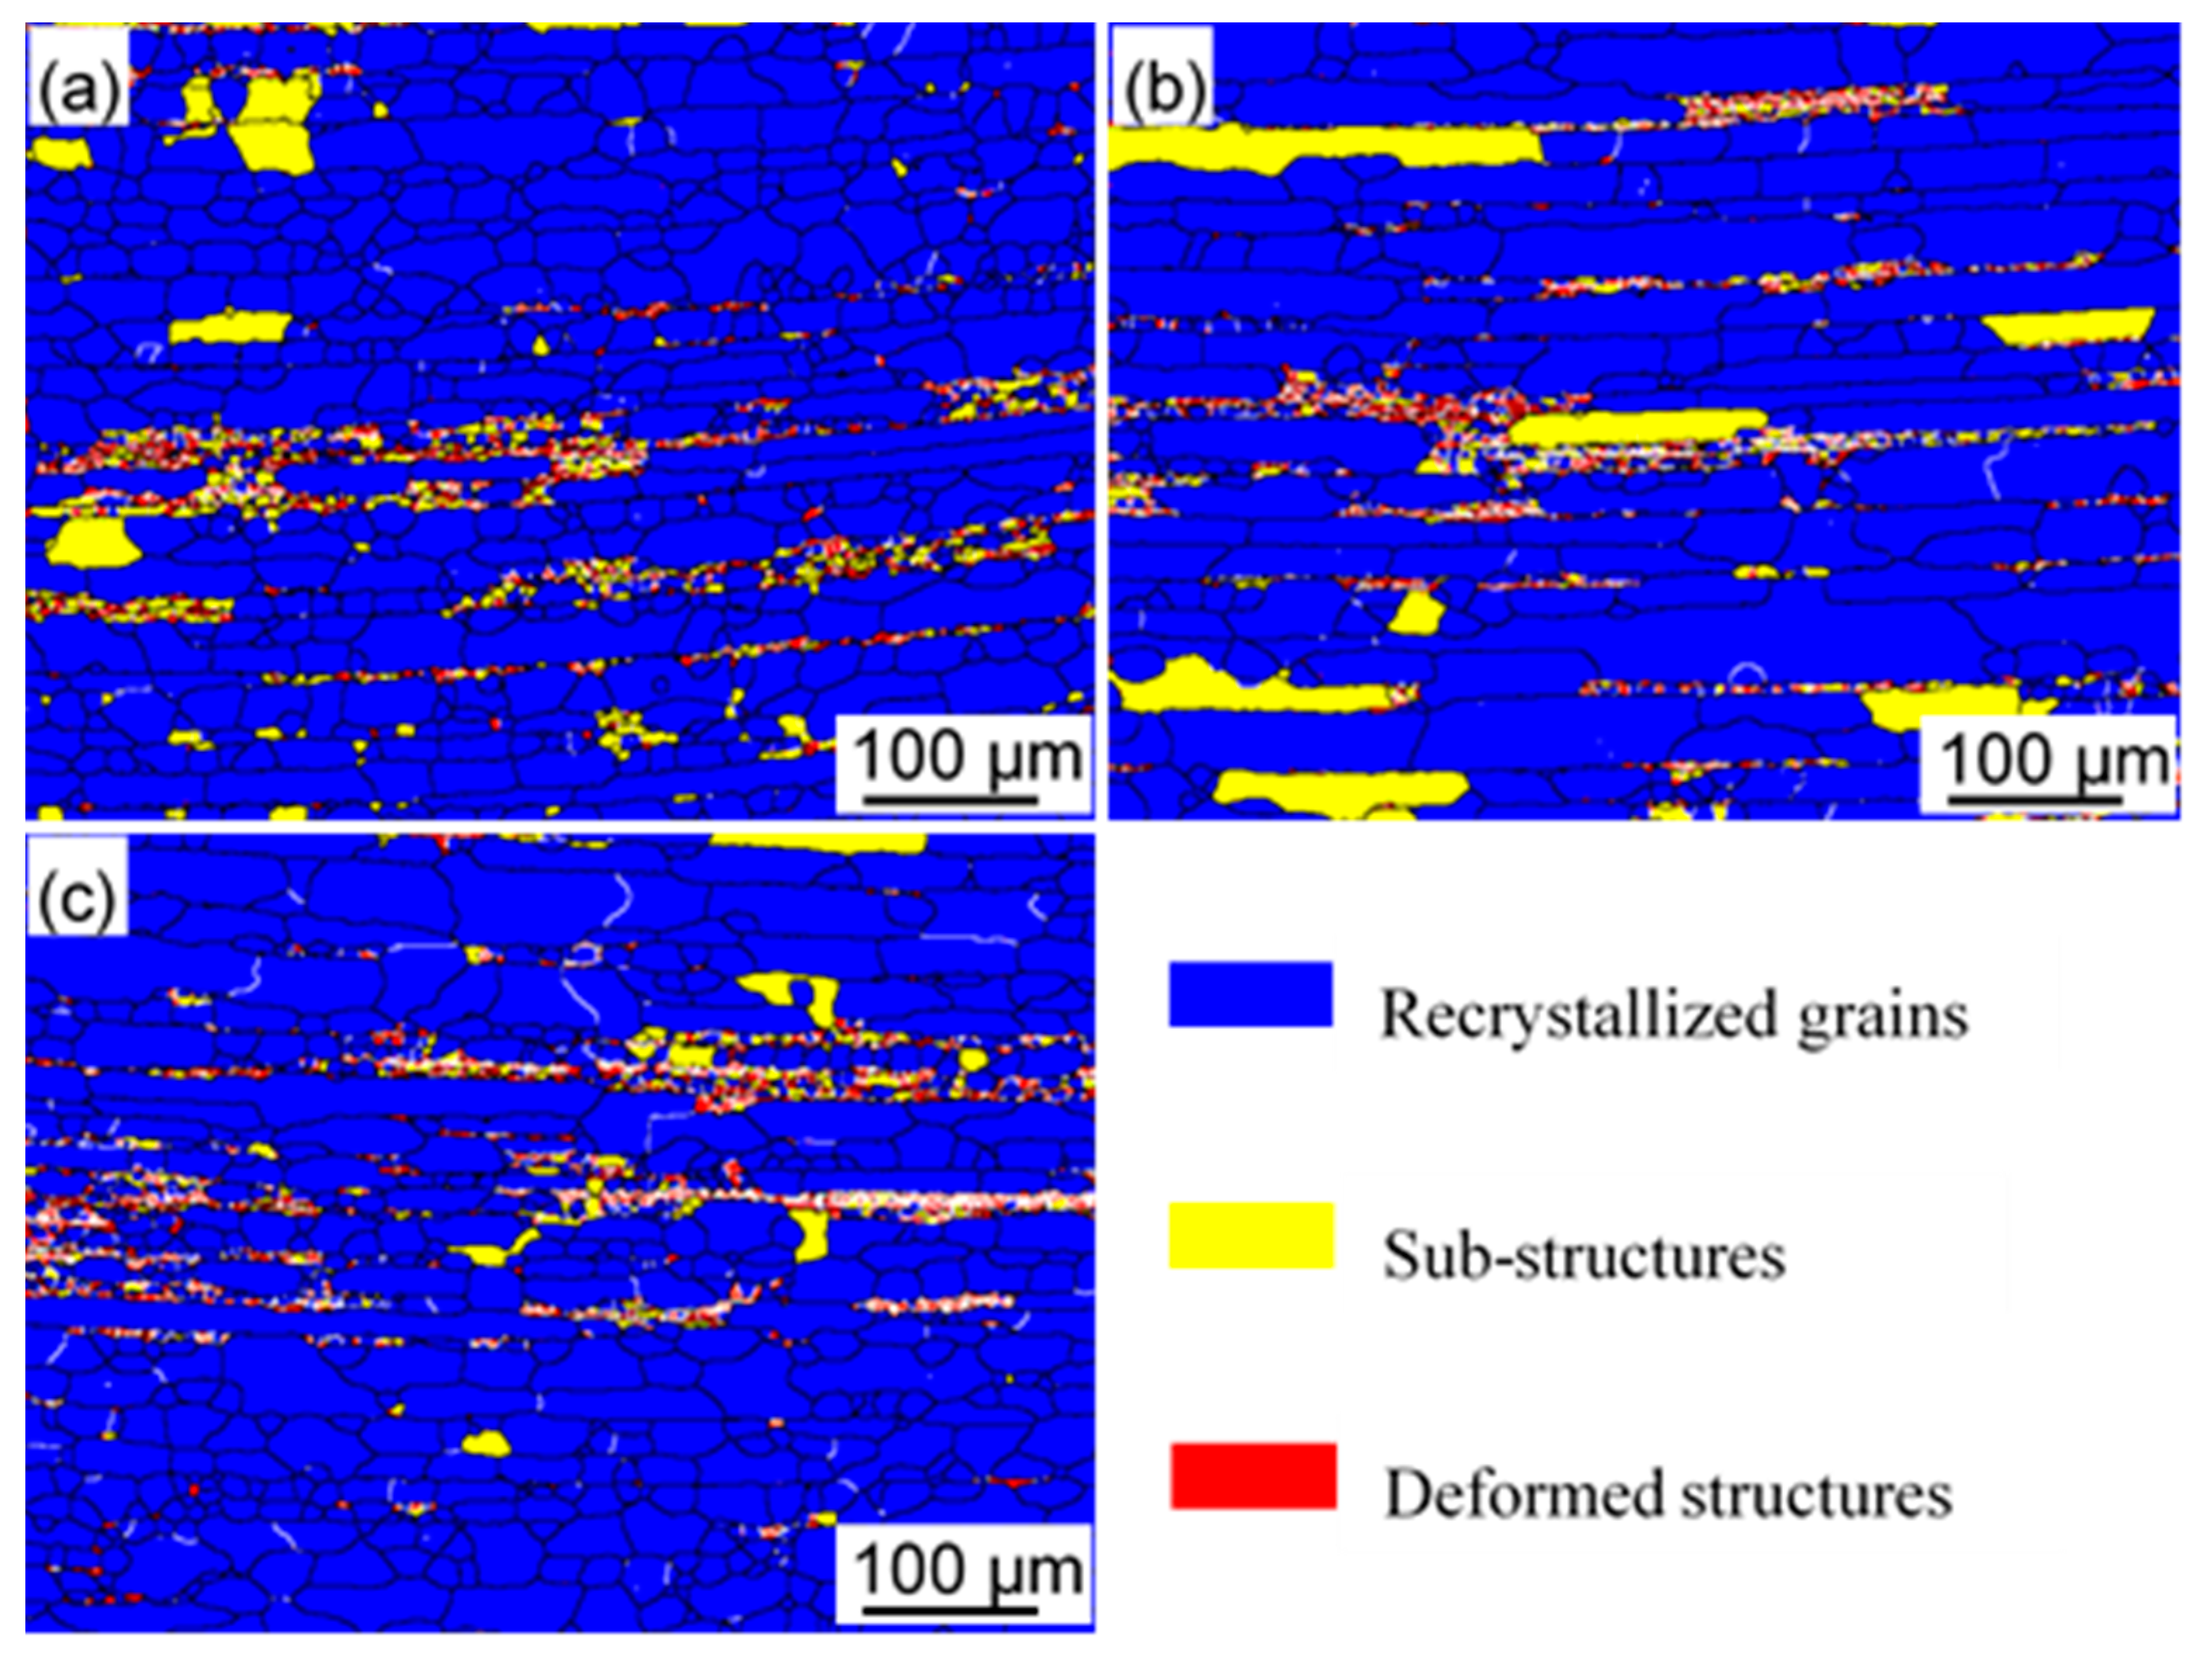
Electron backscattered diffraction (EBSD) observations were performed on the Helios Nanolab 600i dual-beam electron microscope, and the scanning step size was 0.9 µm at an accelerating voltage of 25 kV. HKL Channel 5 (Oxford Instruments, Oxford, UK, HKL Channel 5 version) was utilized to analyze the collected EBSD data. The detection rate of the raw EBSD data was 85% or more, and a standard noise reduction was applied to these raw data. Two kinds of boundaries were defined: low-angle boundaries (LABs) with a misorientation (θ) in the range of 2–15°, and high-angle boundaries (HABs) in the range as θ > 15°.
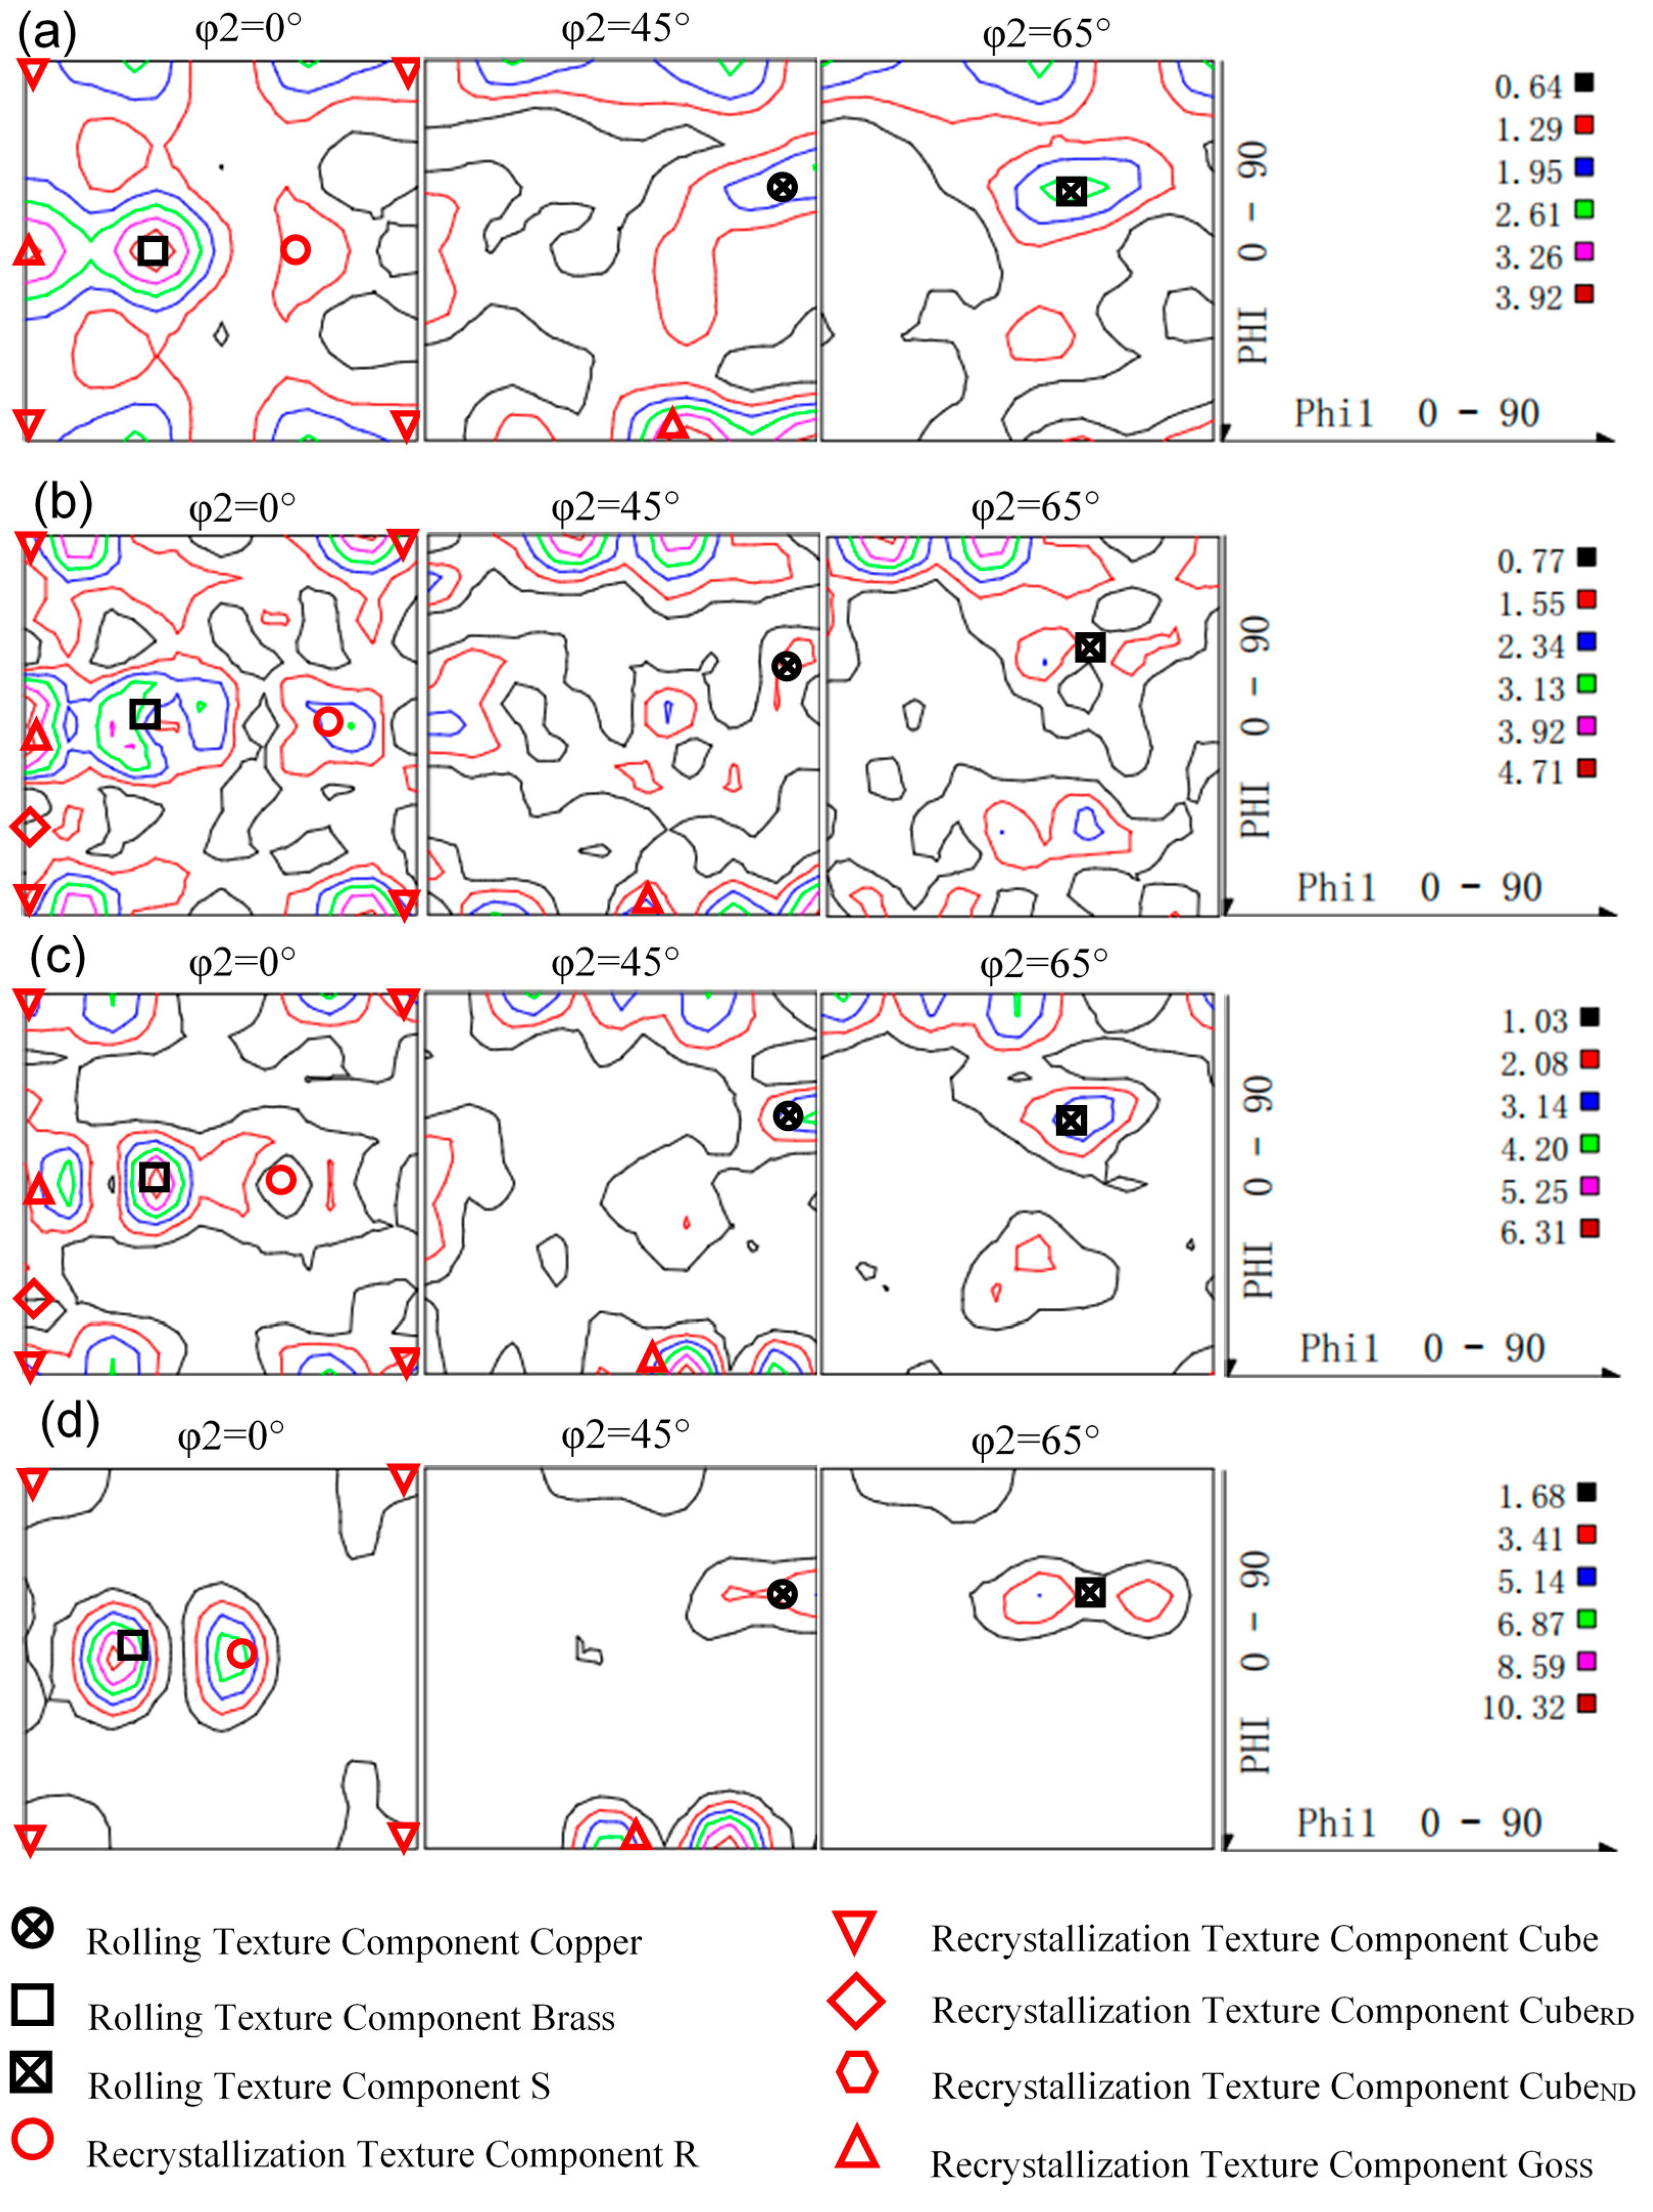
Texture measurements taken by X-ray diffraction (XRD) were carried through a Brucker D8 Discovery X-ray diffraction device at 40 kV and 40 mA with Cu kα radiation. The orientation distribution function (ODF) was calculated based on the incomplete pole figures in the three directions of {111}, {200}, and {220}. The volume fraction of the texture components was determined quantitatively using the particle swarm optimization algorithm, and an angular deviation within 15° was regarded as the same texture.
Samples for transmission electron microscopy (TEM) observation were prepared by mechanical grinding and twin-jet electropolishing in a solution containing 30% nitric acid and 70% methanol (volume fraction) at −25 °C~−35 °C with a controlled current of 90 mA. The observations were carried out through a Tecnai G220 transmission electron microscopy (FEI CO., Hillsboro, OR, USA) operating at 200 kV through selected area electron diffraction (SAED) patterns and conventional dark-field (DF) images.

3. Results

3.1. Metallographic Structure

Figure 2 shows the metallographic pictures of the solutionized samples after isothermal annealing treatments at different temperatures. As presented in Figure 2, the directly solutionized samples exhibited the coexistence of equiaxed grains, elongated grains, and fibrous grains. The size of the equiaxed grains is small and the elongated grains have a lower aspect ratio.
For annealing treatments at a lower temperature (300–350 °C) conducted on the cold-rolled sheets prior to the solution treatment, the equiaxed grains almost disappeared and the elongated grains coarsened, accompanied by an increase in the aspect ratio. After elevating the annealing temperature (350–400 °C), the equiaxed grains reappeared again and the grains were refined compared to those annealed at a low temperature. Meanwhile, the content of fibrous grains were slightly raised. Instead of isothermal annealing treatments prior to the solution treatment, the cold-rolled sheets were subjected to ramp heating-up during the solution process (shown in Figure 3). The equiaxed grains disappeared and the morphology of the grains converted to fibrous grains in the samples treated by a low heating-up rate. The grains tend to coarsen and the fraction of fibrous grains reduced with a higher heating-up rate.

3.2. Evolution of the Texture Structure

The ODF images of the annealing state samples with different annealing treatments and cold-rolled samples are shown in Figure 4. Brass{110}<112>, S{123}<634>, and Copper{112}<111>, namely β fiber texture components shown in Figure 4a, formed after cold rolling. Meanwhile, Goss{110}<100> and Cube{100}<100> are also observed. The corresponding ODF images of the cold-rolled samples subjected to an isothermal annealing treatment at different temperatures are shown in Figure 4b,c. It is seen that the deformation texture components, including Brass{110}<112>, S{123}<634>, and Copper{112}<111>, weakened after the annealing treatment, while the recrystallization texture components, including Cube{100}<100> and Goss{110}<100>, became stronger at the same time. The volume fraction of the textures was calculated through the particle swarm optimization algorithm, and the results are presented in Table 2. The overall volume fraction of the deformation texture declined after the annealing treatments (42.23–38.35%). A lot of Copper{112}<111> was found in the cold-rolled samples (9.13% volume fraction, the same below), which disappeared after the annealing treatment. The total volume fraction of Brass{110}<112> and S{123}<634> increased after annealing at 300 °C, and then decreased at 400 °C. After annealing at 400 °C, R-Cube{100}<110> texture was observed in the alloy. Furthermore, the volume fraction of Cube{100}<100> rose as the annealing temperature elevated, while the volume fraction of Goss{110}<100> remained stable during the annealing process. The volume fraction of the recrystallization textures peaked in the samples annealed at 400 °C (18.62%), which included a certain amount of R-Cube{100}<110> (7.53%).
Figure 5 shows the ODF images of the solutionized samples after different annealing treatments, low heating-up rate solution, and direct solution treatment. Table 3 presents the corresponding texture volume fractions of the solutionized samples under a different above-mentioned preliminary treatment. Compared to the cold-rolled or isothermal annealed samples shown in Table 2, the rolling texture components of the solutionized alloys became weaker and the total volume fraction of the textures also declined. However, the texture of the sheets treated with a low heating-up rate was not affected. In the solutionized samples after different annealing temperatures and a direct solution, Copper{112}<111> was not observed. In addition, the volume fraction of Brass {110}<112> decreased and Goss{110}<100> slightly increased. Compared to the direct solution with different preliminary annealing schedules, the texture fraction of Goss remained stable (about 5.5%).
Compared to the directly solutionized samples, in the samples annealed at 300 °C, S{123}<634> was not observed. Cube{100}<100> (10.51%) and Goss{110}<100> (5.54%) became the major texture components. For the samples annealed at 400 ℃, the fraction of Brass{110}<112> and S{123}<634> increased to 22.66%; the recrystallization texture components, including Goss{110}<100> and Cube{100}<100>, decreased (8.17%). Besides, in contrast to the samples treated by isothermal annealing prior to solution treatment, the evolution of texture with a low heating-up rate during the solution process was different. The total volume fraction of the texture components of the low heating-up rate solutionized sample increased substantially, especially the deformation texture (Brass{110}<112>, S{123}<634>, and Copper{112}<111>: 28.51%, 15.47%, and 18.43%, respectively).

3.3. Microstructure Characteristics of the Grains

To further investigate the microstructure of the grains, the EBSD outcomes of the solutionized samples after annealing treatments at different temperatures are presented in Figure 6. The LABs and the HABs are marked by white lines and black lines in the inverse pole figure (IPF) maps, respectively. The observation results from the IPF maps are in line with that of the metallographic pictures. As shown in Figure 6a,e,i, the grain size of the solutionized samples after the annealing treatment at 300 °C increased. In comparison, it was refined in the solutionized samples after the annealing treatment at 400 °C compared to the directly solutionized samples.
The statistical data of the grain sizes (in Figure 6c,g,k) also demonstrate this conclusion from another perspective. The average grain size of the directly solutionized samples was 12.34 µm, and that of the samples annealed at 300°C and 400 °C as 12.67 µm and 12.27 µm, respectively. Isothermal annealing before the solution treatment also had a significant influence on the grain aspect ratio. The difference in the grain aspect ratio between samples annealed at 400 °C and those directly solutionized was little (2.61 and 2.80). However, the grain aspect ratio of the samples annealed at 300 °C increased dramatically and achieved 3.49. As shown in Figure 6b,f,j, the directly solutionized samples obtained the lowest fraction of LABs (10.88%). The samples were subjected to annealing prior to solution treatment, and the higher the annealing temperature, the higher the fraction of the LABs after solution treatment. The LABs fraction of the samples annealed at 400 °C had the highest-16.75%.
The recrystallization fraction of the 2195 Al-Li alloy sheets after the annealing at different temperatures was also studied. Figure 7 shows the recrystallization grains, the sub-structure, and the deformed structure of the solutionized samples after annealing treatments at different temperatures, and the specific data are shown in Table 4. The grain structures of the indirectly solutionized sheets are composed of recrystallized grains, a sub-structure, and a deformed structure. After annealing at 300 °C and the subsequent solution treatment, the sub-structure and deformed structure become more than that of the directly solutionized samples. However, the sub-structure decreased, and the recrystallized grains and deformed structure increased after annealing at 400 °C and followed by the solution treatment compared to the directly solutionized samples.

3.4. Mechanical Properties

After the solution treatment at 505 °C followed by 150 °C T8 aging, the cold-rolled 2195 Al-Li alloy under different annealing treatments exhibited different tensile properties. Figure 8 shows the tensile curves of the aged 2195 Al-Li alloy with different annealing treatments, along the longitudinal and transverse directions.
Table 5 shows the corresponding tensile property values. The directly solutionized samples obtained the superior strength properties, both along with the longitudinal and transverse directions (587 MPa and 599 MPa of tensile strength, respectively). After isothermal annealing treatment at 300 °C, the strength of the alloy declined significantly. Elevating the annealing temperature to 400 °C, the yield strength and the tensile strength along the longitudinal direction surged from 513 MPa and 545 MPa to 553 MPa and 585 MPa, respectively. However, the strength along the transverse direction changed little, which means that the anisotropy of the alloy was more severe. After treatment with a low heating-up rate during the solution process, the tensile strength along the longitudinal direction increased slightly from 587 to 598 MPa. However, the tensile strength along the transverse direction decreased dramatically from 599 to 554 MPa.
The heterogeneity parameter (IPA, H) was calculated according to the following equation:
H = |I0I90|/Imin·100%
where I0 refers to the strength value along the longitudinal direction; I90 refers to the strength value along the transverse direction, and Imin is the minimum value between I0 and I90. The IPA of the T8-aged 2195 Al-Li alloy sheets with different annealing treatments is also presented in Table 5, which shows less heterogeneity for the samples directly solutionized and annealed (at 300 °C).

3.5. Microstructure Characteristics

The back-scattering electronic scanning observation was conducted to examine the second phase particle characteristics of the 2195 Al-Li alloy at different annealing conditions (in Figure 9). As shown in Figure 10a, two types of particles classified by size were presented. It included small-size particles (1 µm) and large size particles (>5 µm). The evolution of the second phase particles in 2195 Al-Li alloy is mainly reflected in the mutual transformation of these two types of particles. After being annealed at 300 °C, there was a big reduction of the number of small-size particles due to the dissolution or growth, which resulted in the decline of the density of particles and the Zener pinning pressure weakened. As a consequence, the size of grains grown and the average aspect ratio elevated as well. However, for those annealed at 400 °C, the large-size particles started discomposing, leading to a number of the large particles to decrease and the amount and density of small-size particles increased simultaneously. Hence, the grains refined, and the average aspect ratio decreased at 400 °C.
Figure 10 shows the TEM images of aged samples, including the dark field image and SAED patterns with different annealing treatment temperatures at 300 °C and 400 °C. As seen from Figure 11, the thin needle-like precipitates were considered as the T1 phase, which owned the habit plane located at {111}α corresponding to the streaks at 1/3 {220} and 2/3{220} from the 112]Al zone axis (Figure 10b,d). The T1 phase was the primary precipitates in the studied aging 2195 alloy. It could be found that the size and quantity of the T1 phase in T8-aged samples annealed at 300 °C and 400 °C were almost the same (Figure 10a,c). Thus, the strength difference of the aging alloys among the different preliminary heat treatment schedules was attributed to the grain texture characteristics.

4. Discussion

4.1. The Evolution of the Grain Structures

It is well known that recrystallization structure inevitably generates during the mechanical thermal processing of the Al-Cu-Li alloy, with the primary driving force of the stored energy caused by plastic deformation [18]. Moreover, the size of recrystallized grains results from the number of nucleation sites. The classical Johnson–Mehl model can express the connection between the nucleation sites and the size of recrystallized grains.
d = C·(G/N)1/4
where d refers to the size of the recrystallized grains; G refers to the growth rate of the recrystallized grains; N refers to the nucleation rate; and C is a constant. Recrystallization tends to nucleate at defective interfaces heterogeneously. For example, dislocations move and rearrange during the annealing treatment, accompanied by the vanishing of many vacancies due to the thermal activation. Therefore, after the annealing treatment at 300 °C, the stored energy of the cold-rolled sheets is mostly released, leading to a reduction of the recrystallization fraction and the coarsening of the grain size in subsequent solution treatment. However, after annealing at 400 °C and the subsequent solution treatment, the recrystallized grains became refined, and the fraction of recrystallization increased. This is owing to the fact that the sub-grains and high angle boundaries formed during the annealing treatment can serve as new nucleation sites for recrystallization during the following solution process. After annealing treatment at 400 °C (Figure 11), some recrystallization grains and sub-structures were formed in the alloy, which served as recrystallization nucleation sites and resulted in nucleation with sub-structure coalescence and growth during the following solution treatment.
Moreover, numerous studies have shown that second phase particles in alloy sheets could make a considerable difference to grain structures during the solution process [19]. The effects of second-phase particles on grain structures can be explained by Zener pinning pressure. With a given volume fraction f of second phase particles with a mean radius r, Zener pinning pressure can be expressed by
PZ = 3γf/4r
This equation demonstrates that the fine dispersoid second phase particles with a high density effectively hinder the grain boundary movement. The evolution of the second-phase particles in the 2195 Al-Li alloy is mainly reflected in the mutual transformation of small-sized particles (1 µm) and large-sized particles (>5 µm; shown in Figure 9a). A visible reduction could be observed in the number of small-sized particles in the cold-rolled alloy annealed at 300 °C for 2 h due to dissolution or growth, which resulted in a decline of the density of particles and a weakening of the Zener pinning pressure. Therefore, the size of the grains grown and the average aspect ratio increased as well. However, in contrast to the samples annealed at 300 °C, the number of large-sized particles and the average aspect ratio of the refined grains decreased, and the amount and density of small-sized particles increased in samples annealed at 400 °C, ascribed to the large-sized particles starting to discompose.

4.2. The Evolution of the Texture Structure

The different texture types of the alloy possessed different change characteristics under different thermodynamic conditions. The volume fraction of the Goss{110}<100> texture did not change much after annealing [20]. When the annealing temperature was relatively low, Copper{112}<111> could be quickly transformed into S{123}<634> and Brass{110}<112>, but only a small amount of S{123}<634> and Brass{110}<112> were converted to Cube{100}<100>. While the annealing temperature was relatively high, Copper {112}<111> plentifully converted to Cube{100}<100>. The experimental results in this paper were confirmed to be consistent with the texture, as mentioned earlier theory. After annealing at 300 °C, Copper{112}<111> disappeared and the volume fractions of S{123}<634> and Brass{110}<112> increased, while the volume fraction of Cube{100}<100> grew only slightly. At the annealing temperature on 400 °C, the volume fractions of S{123}<634> and Brass{110}<112> decreased, and the volume fraction of Cube{100}<100> increased.
Moreover, the recrystallization fractions were similar and all above 85% among the solutionized samples with different annealing treatments (shown in Table 5). The difference of the texture evolution between the samples can mostly be attributed to being various recrystallization modes mentioned above. It is well known that recrystallization modes include continuous recrystallization (i.e., in situ recrystallization), semi-continuous recrystallization, and discontinuous recrystallization [21]. Discontinuous recrystallization is usually completed by the migration of HABs with stored energy, which weakens the texture reinforcement linked to the volume fraction reduction of the Cube{100}<100> texture. In this paper, after annealing at 300 °C and the subsequent solution treatment, the stored energy was partially released during the annealing process, resulting in an insufficient driving force to support discontinuous recrystallization in the subsequent solid solution treatment; therefore, only semi-continuous recrystallization could occur. Thus, the volume fraction of the deformation texture decreased, and the S{123}<634> texture even disappeared, while the volume fraction of the Cube{100}<100> texture increased in the annealed (300 °C) and solutionized samples. Increasing the annealing temperature to 400 °C, a large amount of stored energy was released during the annealing process (as shown in Figure 11), part recovery and recrystallization occurred. Due to the lower temperature, the alloy only underwent semi-continuous recrystallization. According to Table 3, the β fiber components decreased, and the cubic-oriented texture (Cube{100}<100> texture and R-Cube{100}<110>) components increased significantly during the annealing process. Although stored energy was released in large quantities, the alloy could still be recrystallized, as the fine particles were extensively dissolved into the matrix after annealing treatment at 400 °C, which decreased the obstacle of recrystallization. Therefore, the Brass{110}<112> component was further reduced after the solution treatment, and the cubic orientation texture component also decreased compared to the samples annealed at 300 °C and then solutionized.

4.3. The Relationship between the Tensile Properties and the Microstructure Characteristics

It is known that the strengthening mechanisms of 2195 Al-Li alloys include the strengthening of aging precipitates and grain structure [16]. As seen in Figure 11, the size and quantity of the T1 phase in the aged samples annealed at 300 °C and 400 °C are almost the same. Therefore, strengthening the grain structures was considered the main factor of the studied alloy with different tensile properties under different annealing treatments. The strengthening of the grain structures was mainly due to the combined effects of grain refinement, a low aspect ratio, and modification of the texture. The increment of strength contributed by grain refinement usually abides by the Hall–Petch relationship:
σy = σ0 + kd−1/2
where σy refers to the alloy’s yield strength; d is the average diameter of the grains; σ0 is rationalized as the internal resistant stress to deformation; and k is the Hall–Petch slope, which reflects the resistance of the grain boundary to slip transfer. In this paper, there was no discernible difference between the aged alloy under different annealing temperatures by the calculation in Equation (4) and the study on the aspect ratio of the aged Al alloy linked to the tensile properties [22].
In the present study, the Taylor factor was emphatically calculated and used to assess the strength difference of the studied alloy with different texture components. The Schmid factors of conventional texture components in Al alloys ({111}<110> slip system) are shown in Table 6.
In the single crystals, the Taylor factor, which indeed can be defined as the reciprocal to the Schmid factor. Brass{110}<112>, S{123}<634>, and Copper{112}<111> texture components are of hard orientation with a lower Schmid factor, while Cube{100}<100>, R-Cube{100}<110>, and Goss{110}<100> texture components are of soft orientation with a higher Schmid factor. On a specific slip system, the weighted Schmid factor of the alloy can be expressed by the following formula:
mw = ∑fi·mi
where mw refers to the weighted Schmid factor on the specific slip system; fi refers to the volume fraction of the specific texture component; and mi is the Schmid factor of the specific texture component on the specific slip system. According to the volume fractions of the various textures provided in Table 4, and assuming that the uncalibrated textures are random textures (MR = 3), the weighted Taylor factors on the five slip system can be calculated using the data from EBSD (listed in Table 7). Thus, the M of solutionized samples with different annealing treatments prior to the solution treatment can be calculated (Table 7). The samples treated by annealing at 300 °C and the subsequent solution treatment possess a higher average Taylor factor (2.94), while the samples treated by a low heating-up rate during the solution treatment possess a lower average Taylor factor (3.45).
Besides, many authors have summed many strengthening terms to clarify the relationship between each influencing factor and strength [23]. As mentioned earlier, the Hall–Petch relationship can well clarify the relationship between grain size and alloy strength. Additionally, for other factors, the strengthening terms can be summed by the following relationship:
σy = σgb + M(σb + Δσss + Δσρ + Δσp)
where σy refers to the yield strength of the alloy; σb refers to the constant base shear strength; Δσss, Δσρ, and Δσp refers to the increment in strength due to solid solution hardening, strain hardening, and precipitation hardening, respectively; and M refers to the Taylor factor [23]. In the present study, the value of σgb among the aging alloy under a different preliminary heat treatment prior to the solution heat treatment was similar, which was ascertained by the calculation on the Equation (4). In addition, all of the samples possessed the same composition, pre-deformation, and similar precipitation. The value of σb, Δσss, Δσρ, and Δσp of all of the samples with different annealing treatments prior to the solution can be assumed the same. Therefore, the value of σy was determined by the value of the average calculated Taylor factor M. In the strength values of the aging alloy listed in Table 4, the value of the sample without annealing and under annealing at 400 °C was similar (587 MPa and 585 MPa), with a corresponding similar value of M on 3.13 (shown in Table 7). The strength of the aging sample under a low heating-up rate (598 MPa) was higher than that without annealing (587 MPa), which was in accord with the more considerable value of M under a low heating-up rate (3.45) than that without annealing (3.13). Besides, the decrease of the aging alloy under annealing at 300 °C comparing to that without annealing kept in line with the lower value of M (2.94) under annealing to without annealing (3.13). In summary, the calculated values of M in the present study were well accorded with the aged alloy’s strength difference characteristic under different preliminary heat treatment schedules. The average Taylor factor calculation is also a meaningful way to explain the cause of the strength differences of the aged alloys with different grain structure characteristics.

5. Conclusions

(1) The preliminary annealing heat treatments prior to the solution treatment have a significant effect on the structure of grains of the 2195 Al-Li alloy. After annealing at 300 °C prior to solution treatment, the fraction of equiaxed grains decreased dramatically, and the elongated grains coarsened in solutionized samples. In contrast, the grain refined in the samples annealed at 400 °C and then solutionized.
(2) Due to the similar precipitation characteristics of the aging alloy under different preliminary annealing heat treatments prior to the solution treatment, the different mechanical properties of the aging alloy were related to the grains’ structure.
(3) The decrease of the strength along the longitudinal and transverse direction and the heterogeneity of the aging alloy under the annealing at 300 °C prior to the solution treatment was derived from the decrease of the fraction of the deformation texture components and the increase of the volume of Cube{100}<100>. While the decrease of the strength along the transverse direction and the increase of the heterogeneity of the aging alloy under the annealing at 400 °C prior to the solution treatment were attributed to the increase of the fraction of the deformation texture components and the decrease of the volume of Cube{100}<100>.
(4) Compared to the directly solutionized samples, the grain structure was dominated by the texture components in aging samples treated at a low heating-up rate in the solution process, which possessed a higher strength in the longitudinal direction.

Author Contributions

Data curation, Y.-L.M.; Project administration, J.-F.L.; Supervision, J.-F.L.; Writing–original draft, T.-L.L.; Writing–review & editing, D.-Y.L. All authors have read and agreed to the published version of the manuscript.

Funding

This work was supported by Postdoctoral Research Foundation of China and the National Foundation of China (No. TDZX-17-005-1).

Conflicts of Interest

The authors declare no conflict of interest.

References

  1. Nayan, N.; Murty, S.V.S.N.; Jha, A.K.; Pant, B.; Sharma, S.C.; George, K.M.; Sastry, G.V.S. Processing and characterization of Al–Cu–Li alloy AA2195 undergoing scale up production through the vacuum induction melting technique. Mater. Sci. Eng. A 2013, 576, 21–28. [Google Scholar] [CrossRef]
  2. Li, J.F.; Liu, P.L.; Chen, Y.L.; Zhang, X.H.; Zheng, Z.Q. Microstructure and mechanical properties of Mg, Ag and Zn multi-microalloyed Al-(3.2-3.8)Cu-(1.0-1.4)Li alloys. Trans. Nonferrous Met. Soc. Chin. 2015, 25, 2103–2112. [Google Scholar] [CrossRef]
  3. Dorin, T.; Deschamps, A.; Geuser, F.D.; Robaut, F. Impact of grain microstructure on the heterogeneity of precipitation strengthening in an Al–Li–Cu alloy. Mater. Sci. Eng. A 2015, 627, 51–55. [Google Scholar] [CrossRef]
  4. Zhang, P.; Ye, L.Y.; Zhang, X.M.; Gu, G.; Jiang, H.C.; Wu, Y.L. Grain structure and microtexture evolution during superplastic deformation of 5A90 Al-Li alloy. Trans. Nonferrous Met. Soc. Chin. 2014, 24, 2088–2093. [Google Scholar] [CrossRef]
  5. Li, J.F.; Ye, Z.H.; Liu, D.Y.; Chen, Y.L.; Zhang, X.H.; Xu, X.Z.; Zheng, Z.Q. Influence of Pre-deformation on Aging Precipitation Behavior of Three Al–Cu–Li Alloys. Acta Metall. Sin. 2017, 30, 133–145. [Google Scholar] [CrossRef] [Green Version]
  6. Tsivoulas, D.; Prangnell, P.B. The effect of Mn and Zr dispersoid-forming additions on recrystallization resistance in Al-Cu-Li AA2198 sheet. Acta Mater. 2014, 77, 1–16. [Google Scholar] [CrossRef]
  7. Fan, X.B.; He, Z.B.; Lin, P.; Yuan, S.J. Microstructure, texture and hardness of Al-Cu-Li alloy sheet during hot gas forming with integrated heat treatment. Mater. Des. 2016, 94, 449–456. [Google Scholar] [CrossRef]
  8. Ma, Y.L.; Li, J.F.; Sang, F.J.; Li, H.Y.; Zheng, Z.Q.; Huang, C. Grain structure and tensile property of Al-Li alloy sheet caused by different cold rolling reduction. Trans. Nonferrous Met. Soc. Chin. 2019, 29, 1569–1582. [Google Scholar] [CrossRef]
  9. Wang, Q.; Yang, P.; Zhang, B.R.; Fan, H.; Xu, X.X.; Li, W.B.; Fan, X.L.; Wang, J.F.; Ding, H.M. Microstructure and texture evolution of cold rolled 1070 Al alloy during the subsequent annealing treatment. Results Phys. 2019, 13, 102178. [Google Scholar] [CrossRef]
  10. Suresh, M.; Sharma, A.; More, A.M.; Nayan, N.; Suwas, S. Effect of Scandium addition on evolution of microstructure, texture and mechanical properties of thermo-mechanically processed Al-Li alloy AA2195. J. Alloys Compd. 2018, 740, 364–374. [Google Scholar] [CrossRef]
  11. Xiao, H.; Jiang, S.S.; Zhang, K.F.; Jia, Y.; Shi, C.C.; Lu, Z.; Jiang, J.F. Optimizing the microstructure and mechanical properties of a cold rolled Al-Mg-Li alloy via electropulsing assisted recrystallization annealing and aging. J. Alloys Compd. 2020, 814, 1–14. [Google Scholar] [CrossRef]
  12. Vasudevan, A.K.; Przystupa, M.A.; Fricke, W.G. Effect of composition on crystallographic texture of hot-rolled Al-Li binary alloys. Mater. Sci. Eng. A 1995, 196, 1–8. [Google Scholar] [CrossRef]
  13. Roy, R.K.; Kar, S.; Das, S. Evolution of microstructure and mechanical properties during annealing of cold-rolled AA8011 alloy. J. Alloys Compd. 2009, 468, 122–129. [Google Scholar] [CrossRef]
  14. Wang, X.F.; Guo, M.X.; Chapuis, A.; Luo, J.R.; Zhang, J.S.; Zhuang, L.Z. The dependence of final microstructure, texture evolution and mechanical properties of Al-Mg-Si-Cu alloy sheets on the intermediate annealing. Mater. Sci. Eng. A 2015, 633, 46–58. [Google Scholar] [CrossRef]
  15. Huo, M.S.; Zhao, J.W.; Xie, H.B.; Jia, F.H.; Li, S.L.; Zhang, H.M.; Jiang, Z.Y. Effects of micro flexible rolling and annealing on microstructure, microhardness and texture of aluminum alloy. Mater. Charact. 2019, 148, 142–155. [Google Scholar] [CrossRef]
  16. Liu, D.Y.; Sang, F.J.; Li, J.F.; Birbilis, N.; Wang, Z.X.; Ma, Y.L.; Zhang, R.F. The role of grain structure characteristics on the localised corrosion feature in the 1445 Al-Cu-Li alloy. Mater. Charact. 2019, 158, 109981. [Google Scholar] [CrossRef]
  17. Dobatkin, S.V.; Bastarache, E.N.; Sakai, G.; Fujita, T.; Horita, Z.; Langdon, T.G. Grain refinement and superplastic flow in an aluminum alloy processed by high-pressure torsion. Mater. Sci. Eng. A 2005, 408, 141–146. [Google Scholar] [CrossRef]
  18. Bennett, T.A.; Petrov, R.H.; Kestens, L.A.I. Effect of particles on texture banding in an aluminum alloy. Scr. Mater. 2010, 62, 78–81. [Google Scholar] [CrossRef]
  19. Shuai, L.F.; Huang, T.L.; Wu, G.L.; Huang, X.; Mishin, O.V. Development of Goss texture in Al-0.3%Cu annealed after heavy rolling. J. Alloys Compd. 2018, 749, 399–405. [Google Scholar] [CrossRef] [Green Version]
  20. Chuang, Y.H.; Cho, K.K.; Han, J.H.; Shin, M.C. Effect of grain shape and texture on the earings in an Al-Li alloy. Scripta Mater. 2000, 43, 759–764. [Google Scholar] [CrossRef]
  21. Shanmugasundaram, T.; Heilmaier, M.; Murty, B.S.; Sarma, V.S. On the Hall-Petch relationship in a nanostructured Al-Cu alloy. Mater. Sci. Eng. A 2010, 527, 7821–7825. [Google Scholar] [CrossRef]
  22. Myhr, O.R.; Grong, O.; Andersen, S.J. Modellding of the age hardening behavior of Al-Mg-Si alloys. Acta Mater. 2001, 49, 65–75. [Google Scholar] [CrossRef]
  23. Bardel, D.; Perez, M.; Nelias, D.; Deschamps, A.; Hutchinson, C.R.; Maisonnette, D.; Chaise, T.; Garnier, J.; Bourlier, F. Coupled precipitation and yield strength modeling for non-isothermal treatments of a 6061 aluminum alloy. Acta Mater. 2014, 62, 129–140. [Google Scholar] [CrossRef] [Green Version]
Figure 1. The route of entire process procedures of the Al-Cu-Li alloy in this experiment.
Metals 10 00910 g001
Figure 2. Longitudinal sectional metallographic pictures of solutionized samples after isothermal annealing at different temperature. (a) Direct solution; (b) 300 °C; (c) 325 °C; (d) 350 °C; (e) 375 °C; and (f) 400 °C.
Metals 10 00910 g002
Figure 3. Longitudinal sectional metallographic pictures of solutionized samples after ramp heating-up treatments. (a) Direct solution; (b) ~10 °C /min; (c) ~5 °C /min; and (d) <2 °C /min.
Metals 10 00910 g003
Figure 4. Orientation distribution function (ODF) images of 2195 Al-Li alloy sheets after isothermal annealing at different temperatures. (a) Cold-rolled; (b) 300 °C; and (c) 400 °C.
Metals 10 00910 g004
Figure 5. ODF images of solutionized samples after different annealing treatments. (a) Direct solution; (b) 300 °C; (c) 400 °C; and (d) low heating-up rate.
Metals 10 00910 g005
Figure 6. Electron backscattered diffraction (EBSD) images of solutionized 2195 Al-Li alloy sheets after annealing at 300 °C prior to solution. (a) Inverse pole figure (IPF) maps; (b) misorientation angle distribution; (c) grain size distribution; (d) grain aspect ratio distribution; and the solutionized 2195 Al-Li alloy sheets after annealing at 300 °C prior to solution. (e) IPF maps; (f) misorientation angle distribution; (g) grain size distribution; (h) grain aspect ratio distribution; and the solutionized 2195 Al-Li alloy sheets after annealing at 400 °C prior to solution. (i) IPF maps; (j) misorientation angle distribution; (k) grain size distribution; and (l) grain aspect ratio distribution.
Metals 10 00910 g006
Figure 7. EBSD images showing the structure distribution of the solutionized samples after annealing at different temperature. (a) Direct solution; (b) 300 °C; and (c) 400 °C.
Metals 10 00910 g007
Figure 8. Tensile curves of the aged 2195 Al-Li alloy sheets with different annealing treatment after T8 aging following solution at 505 °C (a) longitudinal direction and (b) transverse direction.
Metals 10 00910 g008
Figure 9. SEM images of 2195 Al-Li alloy sheets after annealing at different temperature. (a) Cold-rolled; (b) 300 °C; and (c) 400 °C.
Metals 10 00910 g009
Figure 10. TEM observation showing the dark figure (DF) and the SAED patterns (which subjected the reciprocal changes by the operation of counter clockwise rotation with 90° to easily correspond the consistent orientation of the studied precipitate located on {111}Al) of T8-aged samples after annealing at different temperatures: (a,b) 300 °C and (c,d) 400 °C.
Metals 10 00910 g010
Figure 11. The magnified local structure distribution of 2195 Al-Li alloy sheets before and after solution with the annealing treatment at 400 °C. (a) Before solution and (b) after solution.
Metals 10 00910 g011
Table 1. The chemical composition of the studied 2195 Al-Cu-Li alloy (in wt. %).
CuLiMgAgMnZrZnTiAl
4.121.020.440.280.250.120.250.10Bal.
Table 2. Textures volume fraction of 2195 Al-Li alloy sheets after isothermal annealing at different temperatures (%).
Heat Treatment ScheduleBrassCopperSGossCubeR-CubeR-GossOther Texture
cold-rolled16.619.1316.492.975.2200.527.77
300 °C19.03021.563.465.9401.19.19
400 °C17.45020.92.918.187.5304.84
Table 3. Textures volume fraction of solutionized samples after different annealing treatments (%).
Heat Treatment ScheduleBrassCopperSGossCubeOther Texture
Direct solution10.81013.215.3607.05
300 °C12.15005.5410.5113.87
400 °C8.05014.615.492.6824.29
Low heating-up rate28.5115.4718.434.957.160
Table 4. The recrystallization fraction of the solutionized samples after annealing treatments at different temperatures (%).
Heat Treatment ScheduleRecrystallized GrainsSub-StructuresDeformed Structures
Direct solution88.916.134.96
300 °C85.928.705.38
400 °C91.003.025.98
Table 5. Tensile property values of 2195 Al-Li alloy sheets with different annealing treatment after T8 aging following the solution heat treatment.
Heat Treatment ScheduleDirectionTensile Strength/MPaStandard DeviationIPA of Tensile Strength/%Yield Strength/MPaStandard DeviationIPA of Yield Strength/%
Without annealingLongitudinal5870.832.045620.931.60
Transverse5991.805711.41
300 °CLongitudinal5455.432.025133.532.14
Transverse5566.445244.77
400 °CLongitudinal5850.286.565530.635.94
Transverse5497.165229.13
low heating-up rateLongitudinal5983.427.945665.566.59
Transverse5544.725312.79
Table 6. Schmid factor of textures corresponding to the {111}<110> slip system in the Al alloy.
Slip Plain111 1 ¯ 1 ¯ 1 1 1 ¯ 1 ¯ 1 ¯ 1 1 ¯
Slip Direction 1 ¯ 10 10 1 ¯ 01 1 ¯ 1 ¯ 10 1 ¯ 0 1 ¯ 0 1 ¯ 1 ¯ 110 101 01 1 ¯ 1 ¯ 1 ¯ 0 1 ¯ 01 011
Cube0.410.4100.410.4100.410.4100.410.410
R-Cube00000000.410.4100.410.41
Copper00.280.280000.2700.270.270.270
Brass0.410.140.270000.140.410.270.270.280
Goss0.410.4100.410.4100.410.4100.410.410
R-Goss0000.410.4100000.410.410
S0.100.230.330.270.090.170.060.010.060.430.330.09
Table 7. Weighted Schmid factors and average Schmid factors corresponding to the {111}<110> slip system and of samples with different annealing treatments prior to solution.
Slip Plain111 1 ¯ 1 ¯ 1 1 1 ¯ 1 ¯ 1 ¯ 1 1 ¯ M
Slip Direction 1 ¯ 10 10 1 ¯ 01 1 ¯ 1 ¯ 10 1 ¯ 0 1 ¯ 0 1 ¯ 1 ¯ 110 101 01 1 ¯ 1 ¯ 1 ¯ 0 1 ¯ 01 011
direct solution0.310.300.310.290.270.240.280.300.270.340.330.243.13
300 °C0.350.320.270.300.300.240.320.350.270.340.340.242.94
400 °C0.310.310.300.300.270.250.280.290.260.350.330.243.13
low heating-up rate0.270.260.270.180.150.120.230.250.210.330.320.103.45

