Article

Correlation between Microstructure and Mechanical Properties of Heat-Treated Ti–6Al–4V with Fe Alloying

1
Tech Institute for Advanced Materials and College of Materials Science and Engineering, Nanjing Tech University, Nanjing 210009, China
2
State Key Laboratory of Powder Metallurgy, Central South University, Changsha 410083, China
*
Author to whom correspondence should be addressed.
Metals 2020, 10(7), 854; https://doi.org/10.3390/met10070854
Submission received: 29 May 2020 / Revised: 24 June 2020 / Accepted: 25 June 2020 / Published: 28 June 2020
(This article belongs to the Special Issue Microstructure and Mechanical Properties of Titanium Alloys)

Abstract

:
The microstructure and mechanical properties of a newly developed Fe-microalloyed Ti–6Al–4V titanium alloy were investigated after different heat treatments. The volume fraction and the morphological features of the lamellar α phase had significant effects on the alloy’s mechanical performance. A dataset showing the relationship between microstructural features and tensile strength, elongation, and fracture toughness was developed. A high aging temperature resulted in high plasticity and fracture toughness, but relatively low strength. The high strength favored the fine α and the slender β. The high aspect ratio of lamellar α led to high strength but low fracture toughness. The alloy with ~84 vol % α exhibited the highest strength and lowest fracture toughness because the area of its α/β-phase interface was the highest. Optimal comprehensive mechanical performance and heat-treatment procedures were thus obtained from the dataset. Optimal tensile strength, yield strength, elongation, and fracture toughness were 999 and 919 MPa, 10.4%, and 94.4 MPa·m1/2, respectively.

1. Introduction

Ti–6Al–4V, the most widely used titanium alloy in the aerospace industry, has been used to manufacture compressor disks and blades for gas turbines in advanced jet engines [1,2,3,4]. To further improve its properties and reduce costs, a series of techniques, such as alloying [5,6,7], processing optimization for melting and hot working [8,9], and additive manufacturing [10,11,12,13,14], have been employed to modify the Ti–6Al–4V alloy. From these techniques, alloying is considered a low-cost but efficient method for improving its properties. Fe is the strongest β-phase stabilizer and the cheapest alloying element that can strengthen titanium alloys via solid solution and aging treatment [6,15]. Fe alloying refines β grains and facilitates subsequent forging [6,15]. The optimal amount of Fe should be controlled within the range of 0.1–1.0 wt% [15]. The authors’ preliminary studies [7] found that the trace addition of Fe into Ti–6Al–4V alloy could remarkably improve fracture toughness and increase hardness while maintaining the alloy’s strength. However, the optimal comprehensive properties and the corresponding heat-treatment procedures for Fe-microalloyed Ti–6Al–4V have not been found.
It is well known that an alloy’s mechanical properties, such as strength, ductility, creep resistance, and fracture toughness are affected by its microstructure (e.g., phase fraction and morphology). The high mole fraction of the fine α phase is conducive to high strength [4,16,17,18]. The formation of coarse α phase generally leads to good plasticity [4,16,17,18]. The introduction of α phase with a lamellar shape is better for fracture toughness than the equiaxed shaped α [4,16,17,18]. The microstructure varies with heat-treatment parameters. Annealing at high temperatures in the β-phase region for a long time enlarges the β grain [4,16,17,18]. A high cooling rate before aging promotes the precipitation of fine α during subsequent aging [4,16,17,18]. Aging at high temperatures in the α + β-phase region for a long time leads to coarse α precipitation [4,16,17,18]. Guo et al. [19] found that the fracture toughness of the TC4–DT alloy was improved through appropriate heat treatment to adjust its microstructural parameters. Therefore, for a given alloy, optimal properties can be assessed using a developed dataset of correlative heat-treatment parameters, microstructures, and properties. The objectives of this work were to develop a dataset showing the correlation between microstructural features and mechanical properties, and to optimize the mechanical properties of Fe-microalloyed Ti–6Al–4V alloy by adjusting heat-treatment procedures.

2. Materials and Methods

2.1. Materials

The as-received Fe-microalloyed Ti–6Al–4V (TC4F) sheet had a thickness of 14 mm and was produced by vacuum-arc remelting, followed by hot rolling in the β- and α + β-phase regions. Chemical composition was measured by inductively coupled plasma mass spectrometry (ICP-MS; iCAP Qc, Thermo Fisher, Waltham, MA, USA), and results are listed in Table 1. The microstructure of the hot-rolled TC4F alloy is shown in Figure 1. It consisted of an elongated α phase (white), an equiaxed α phase (white), and a small amount of transformed βT (gray).

2.2. Heat Treatment

Before heat treatment, the β-transus temperature of the as-received TC4F was determined by the metallographic method specified in GB/T 23605-2009 [20]. The TC4F was isothermally treated at a 970–1010 °C temperature range with an interval of 5 °C for 40 min, and then quenched in water. The α phase was observed with an optical microscope (OM; Axio Observer A1m, ZEISS, Jena, Germany). When the temperature reached and exceeded 980 °C, the α phase disappeared. At 975 °C, the volume fraction of α was less than 3%, so the β-transus temperature was determined to be 975 ± 5 °C.
The BASCA heat treatment (β-annealing, cooling, and aging) was selected [21]. Five heat-treatment procedures (marked as Samples 1–5) could be divided into two groups: high-temperature β-annealing + low-temperature aging (Samples 1 and 2), and low-temperature β-annealing + high-temperature aging (Samples 3–5), as shown in Table 2. For the first group (high-temperature β-annealing + low-temperature aging; Samples 1 and 2), alloys were subjected to β-annealing at 1005 °C for 70 min, followed by air cooling, aging for 2 h, and air cooling. The only difference between Samples 1 and 2 was the aging temperature, namely, 722 °C for Sample 1, and 732 °C for Sample 2. For the second group (low-temperature β-annealing + high-temperature aging; Samples 3–5), alloys were subjected to β-annealing at 1100 °C for 40 min, followed by cooling, aging at 712 °C for 2 h, and air cooling. The difference between Samples 3, 4, and 5 was cooling rate. A water-cooling was used for Sample 3, air cooling for Sample 4, and furnace cooling for Sample 5.

2.3. Mechanical Properties

Room-temperature tensile and mode-I fracture-toughness tests were carried out on the heat-treated TC4F. The tensile test was performed on an INSTRON 5581 (INSTRON, USA) at a rate of 0.02 mm/s. Sample processing and testing adhered to ASTM E8M-04 [22], and the treatment was the same as in our previous research [7]. The average values of the tensile strength, yield tensile strength, and elongation for TC4F were obtained from three valid data points.
Mode-I fracture toughness was measured on an INSTRON 651 (INSTRON, Norwood, MA, USA). The processing of the chevron-notched half compact-tension specimens, and the Mode-I fracture toughness test were performed in accordance with ASTM E399-06 [23]. The dimensions of the compact-tension specimen were thickness B = 12 mm, width W = 48 mm, and notch length a = 21 mm. The 24 mm precracks were preset at a constant ΔK of 21 MPa·m1/2, with a sinusoidal waveform at a frequency of 10 Hz. The fracture-toughness value of TC4F after individual heat treatment was obtained by averaging four measurements.

2.4. Microstructure Observation

The microstructure was observed with an OM and a scanning electron microscope (SEM; Scios, FEI, Hillsboro, OR, USA). Samples examined with the OM were polished using standard metallographic techniques to obtain a mirrorlike surface, and then etched with HF:HNO3:H2O = 1:2:7. The prior-β size was obtained through OM observation. In addition to the above polishing procedures, the samples examined with the SEM were electrochemically polished and cleaned with alcohol. For the SEM and OM images, the size of prior-β grains, the phase fractions, and the size of the α and retained β phases were obtained using Image-Pro Plus software. The phase fraction and size of the phases were measured repeatedly in different areas and/or samples; thus, the values of the average phase fraction and the average size of the α phases were statistically significant.

3. Results and Discussion
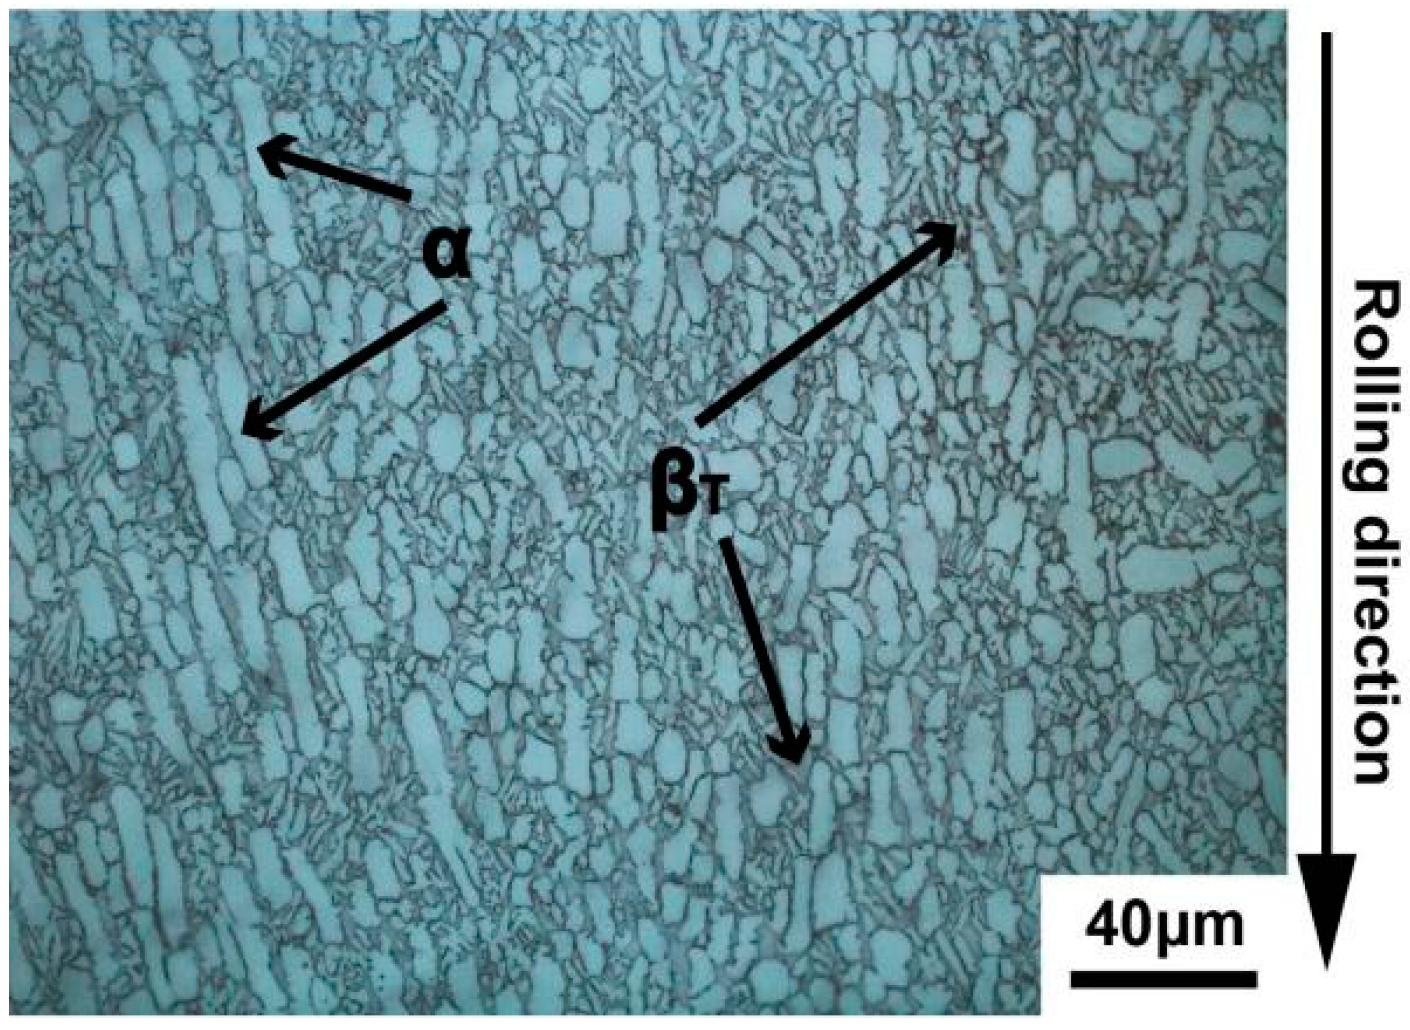
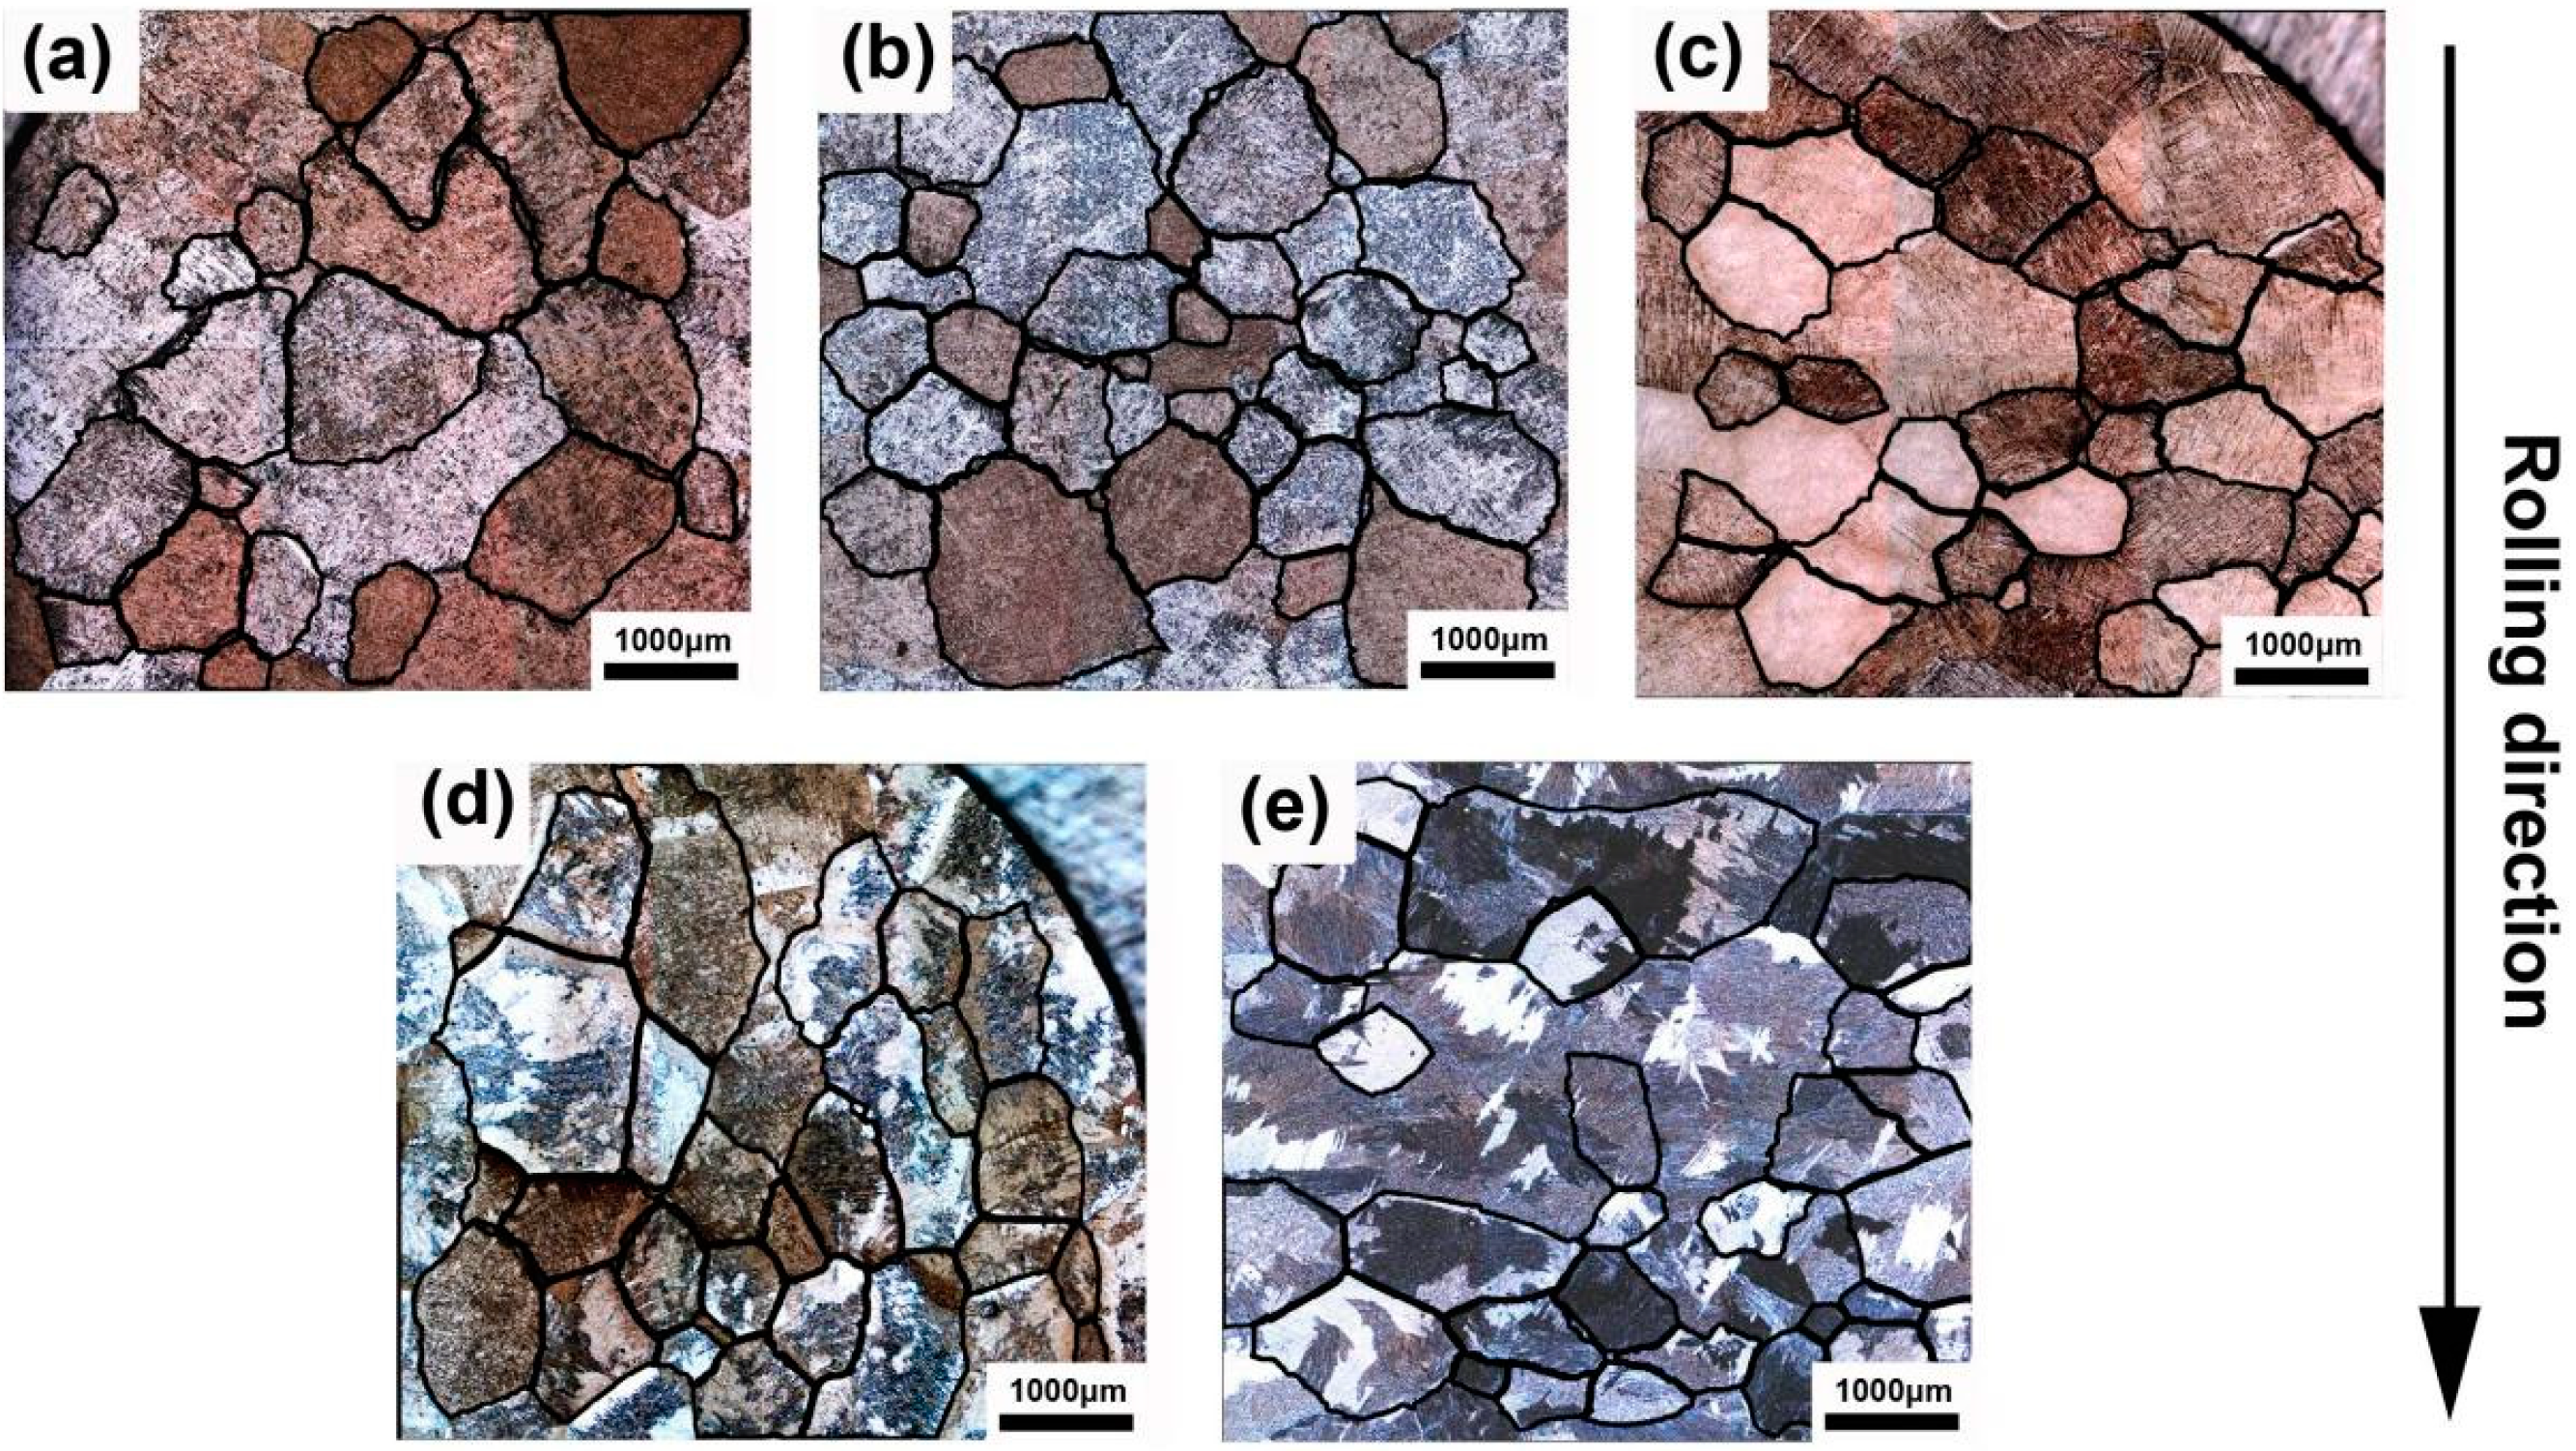
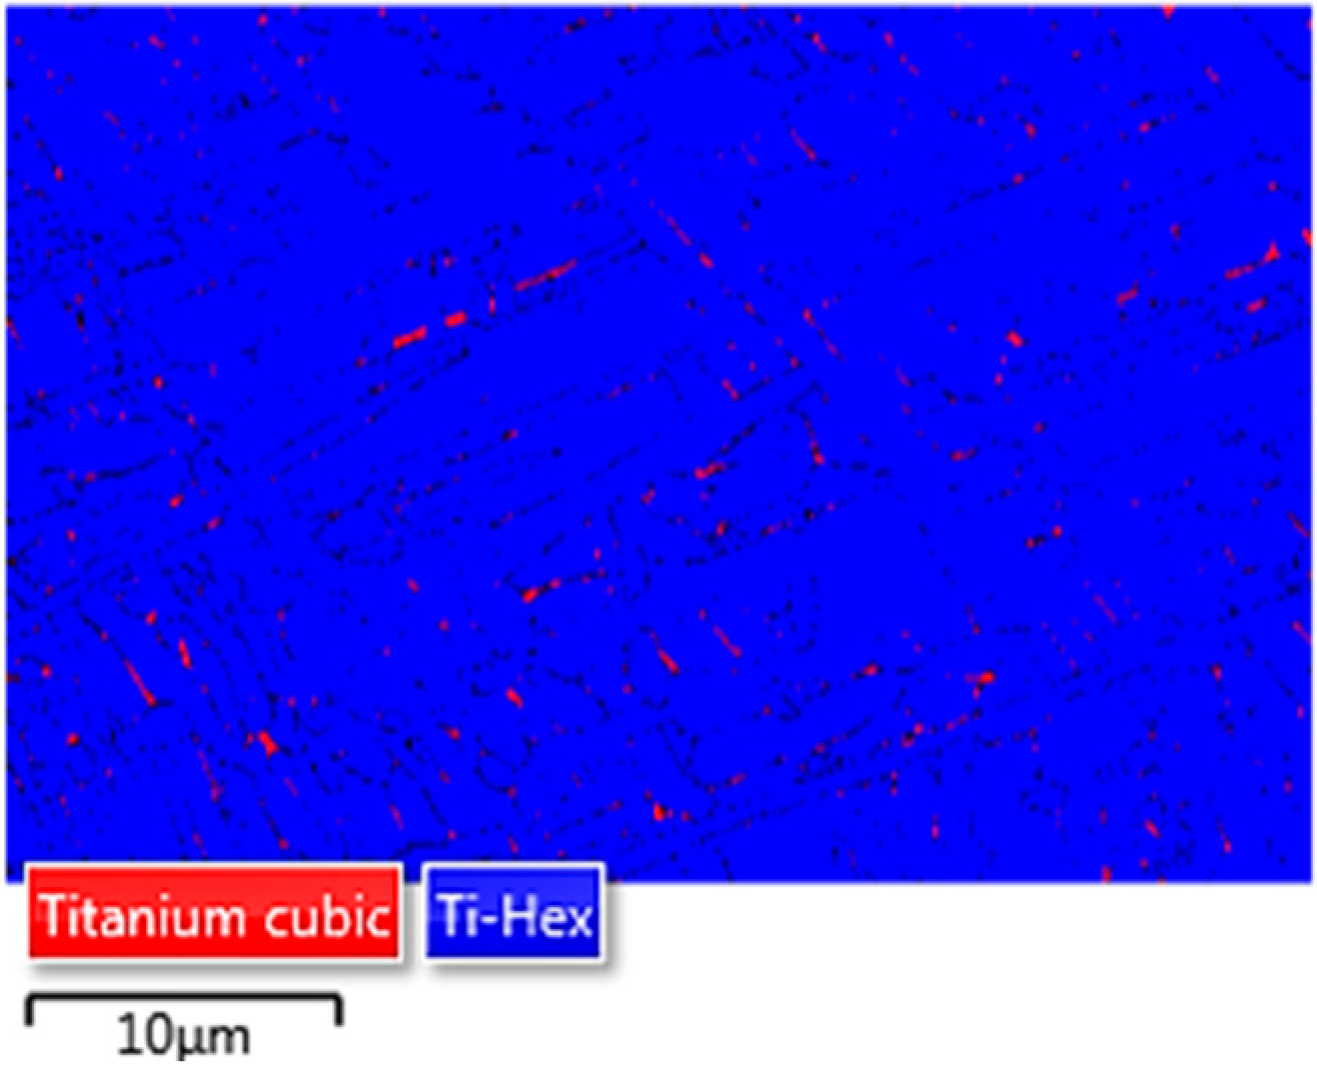
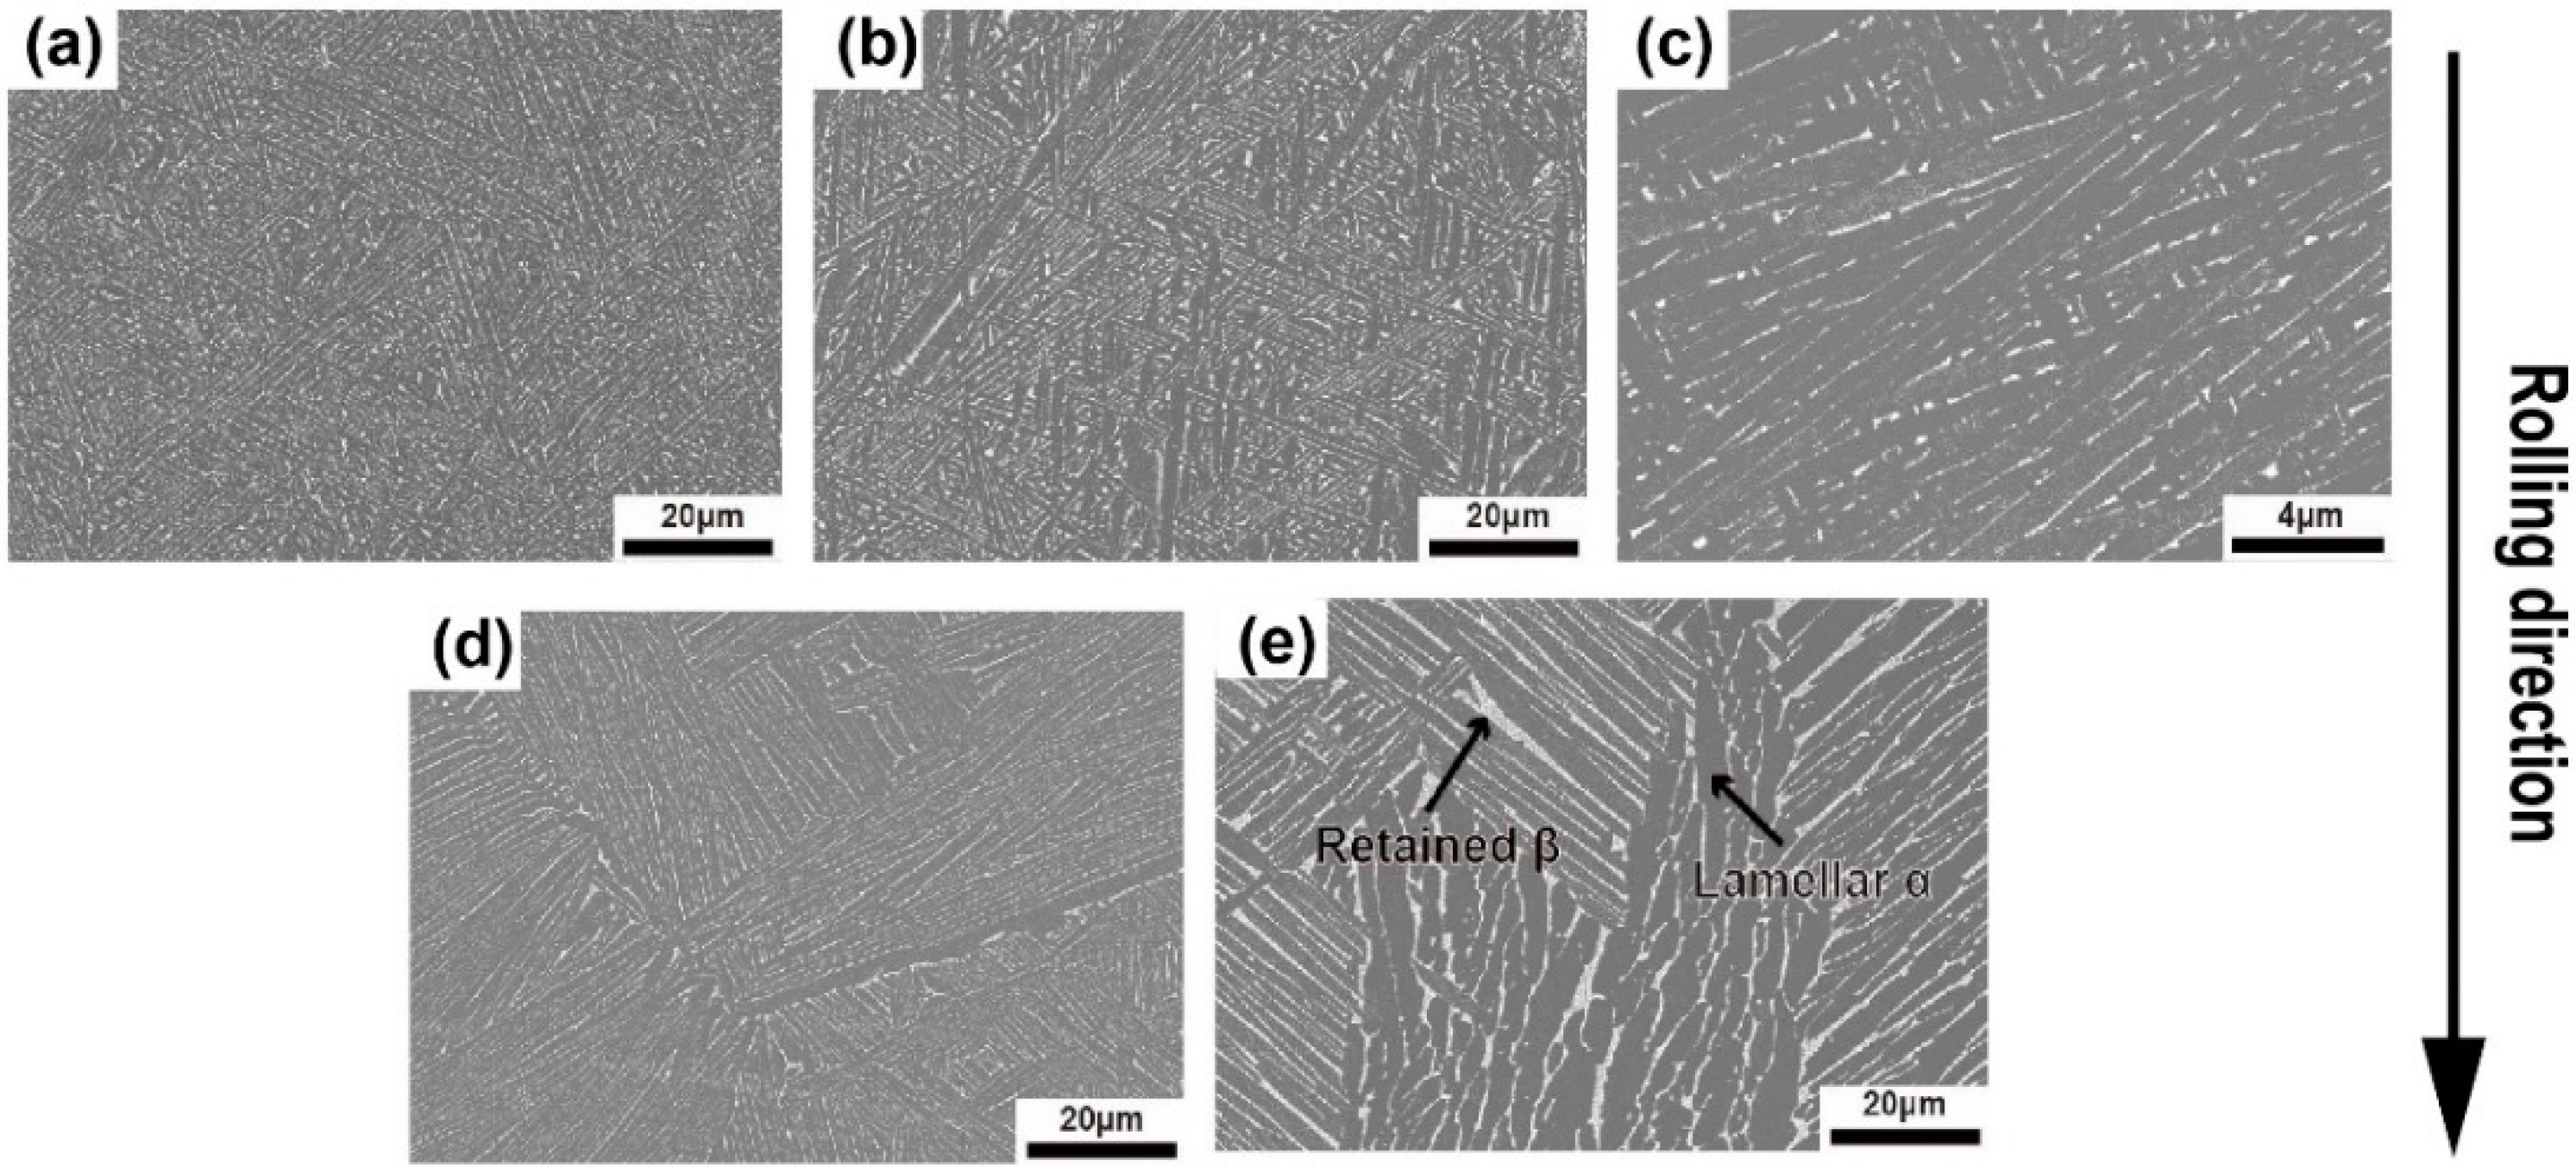
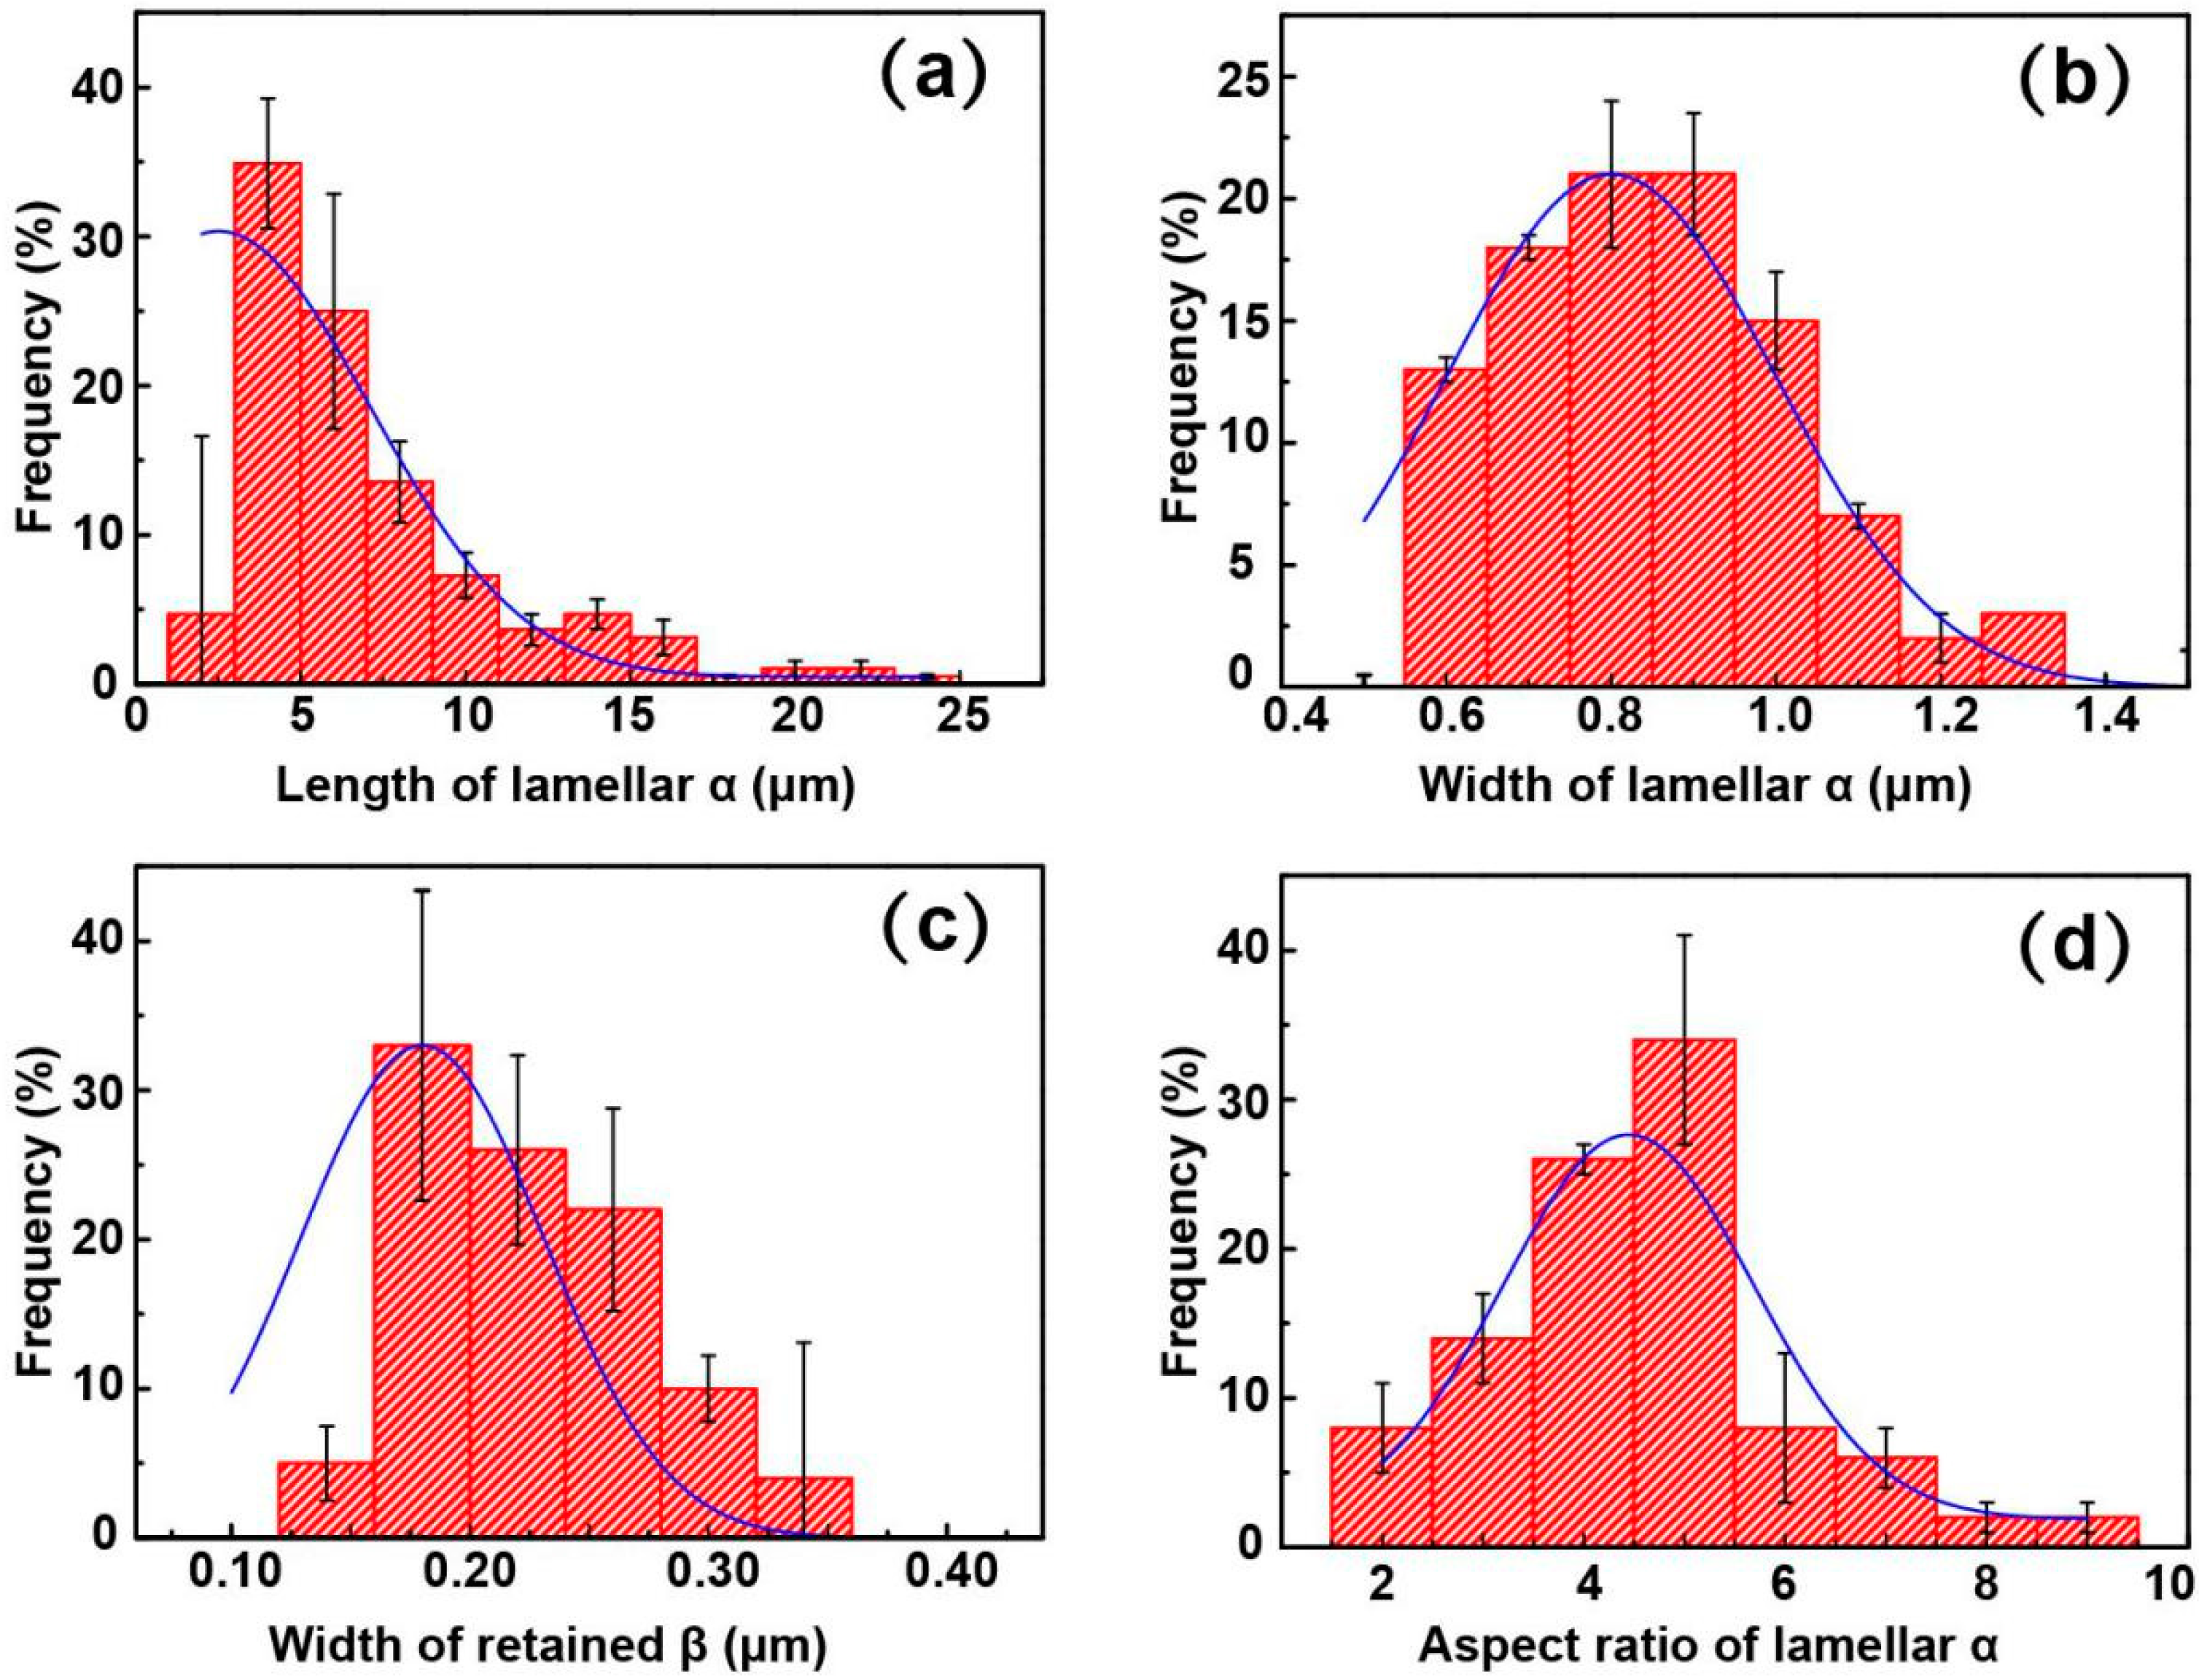
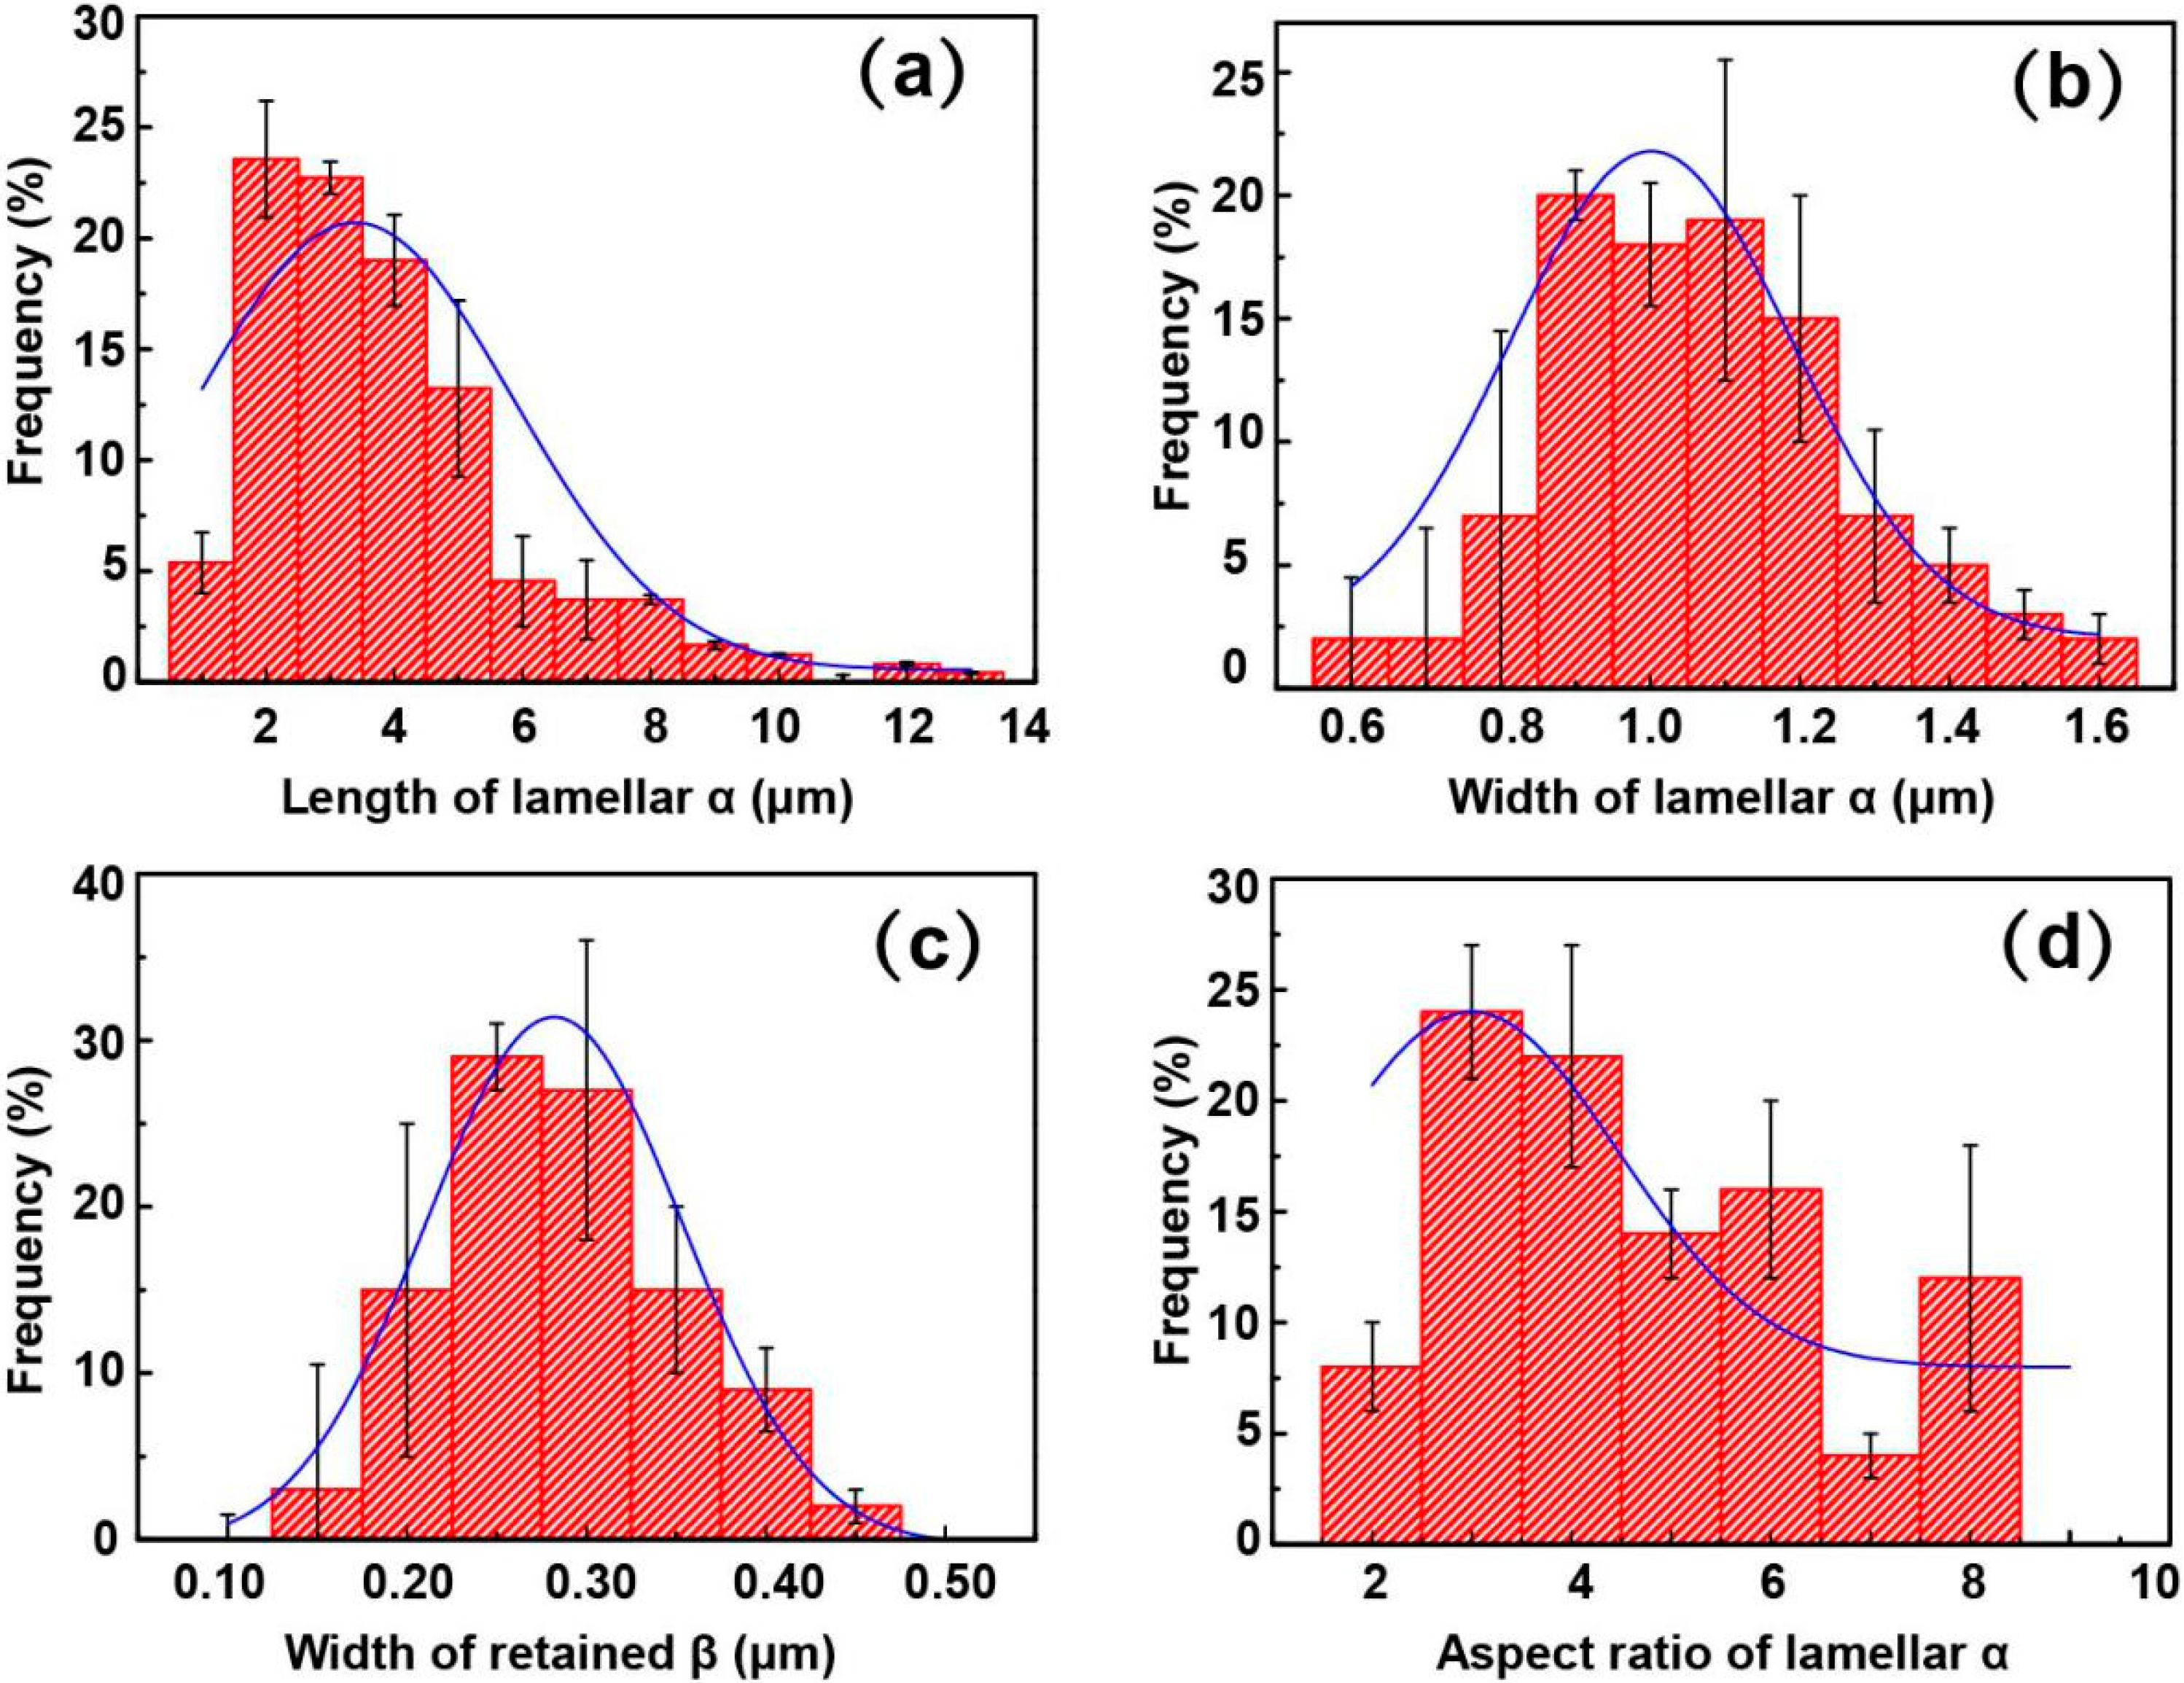
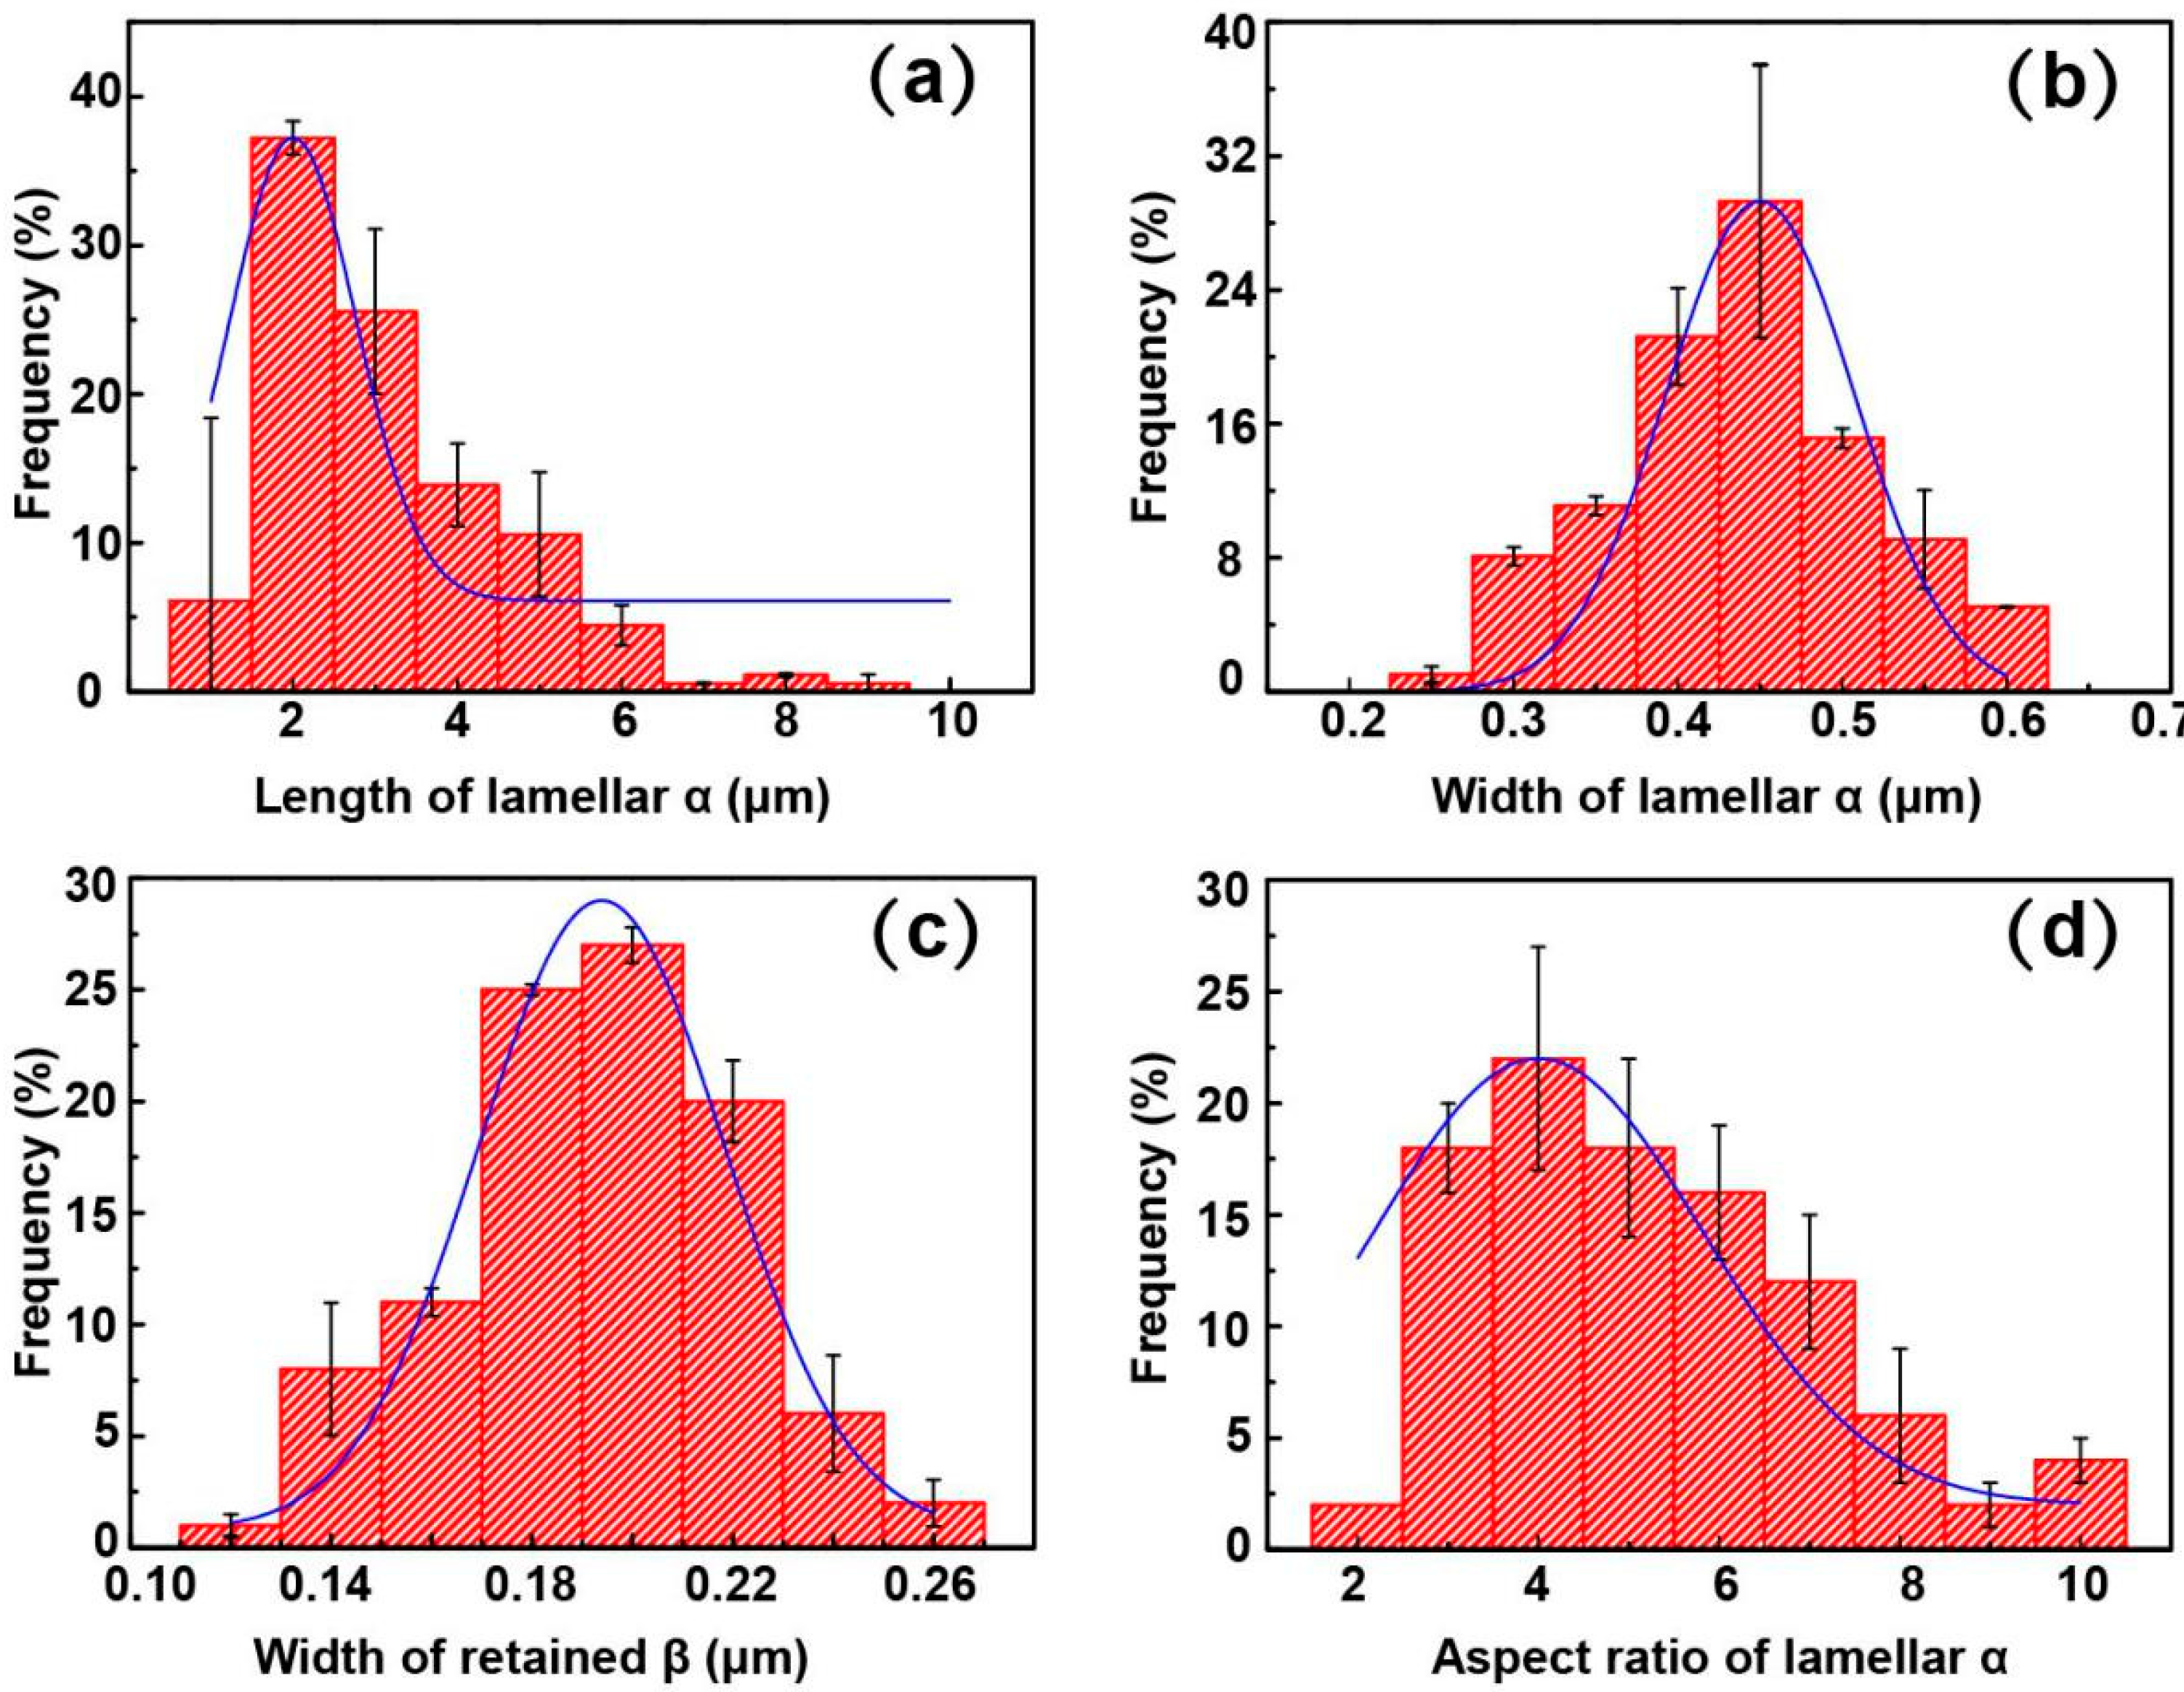
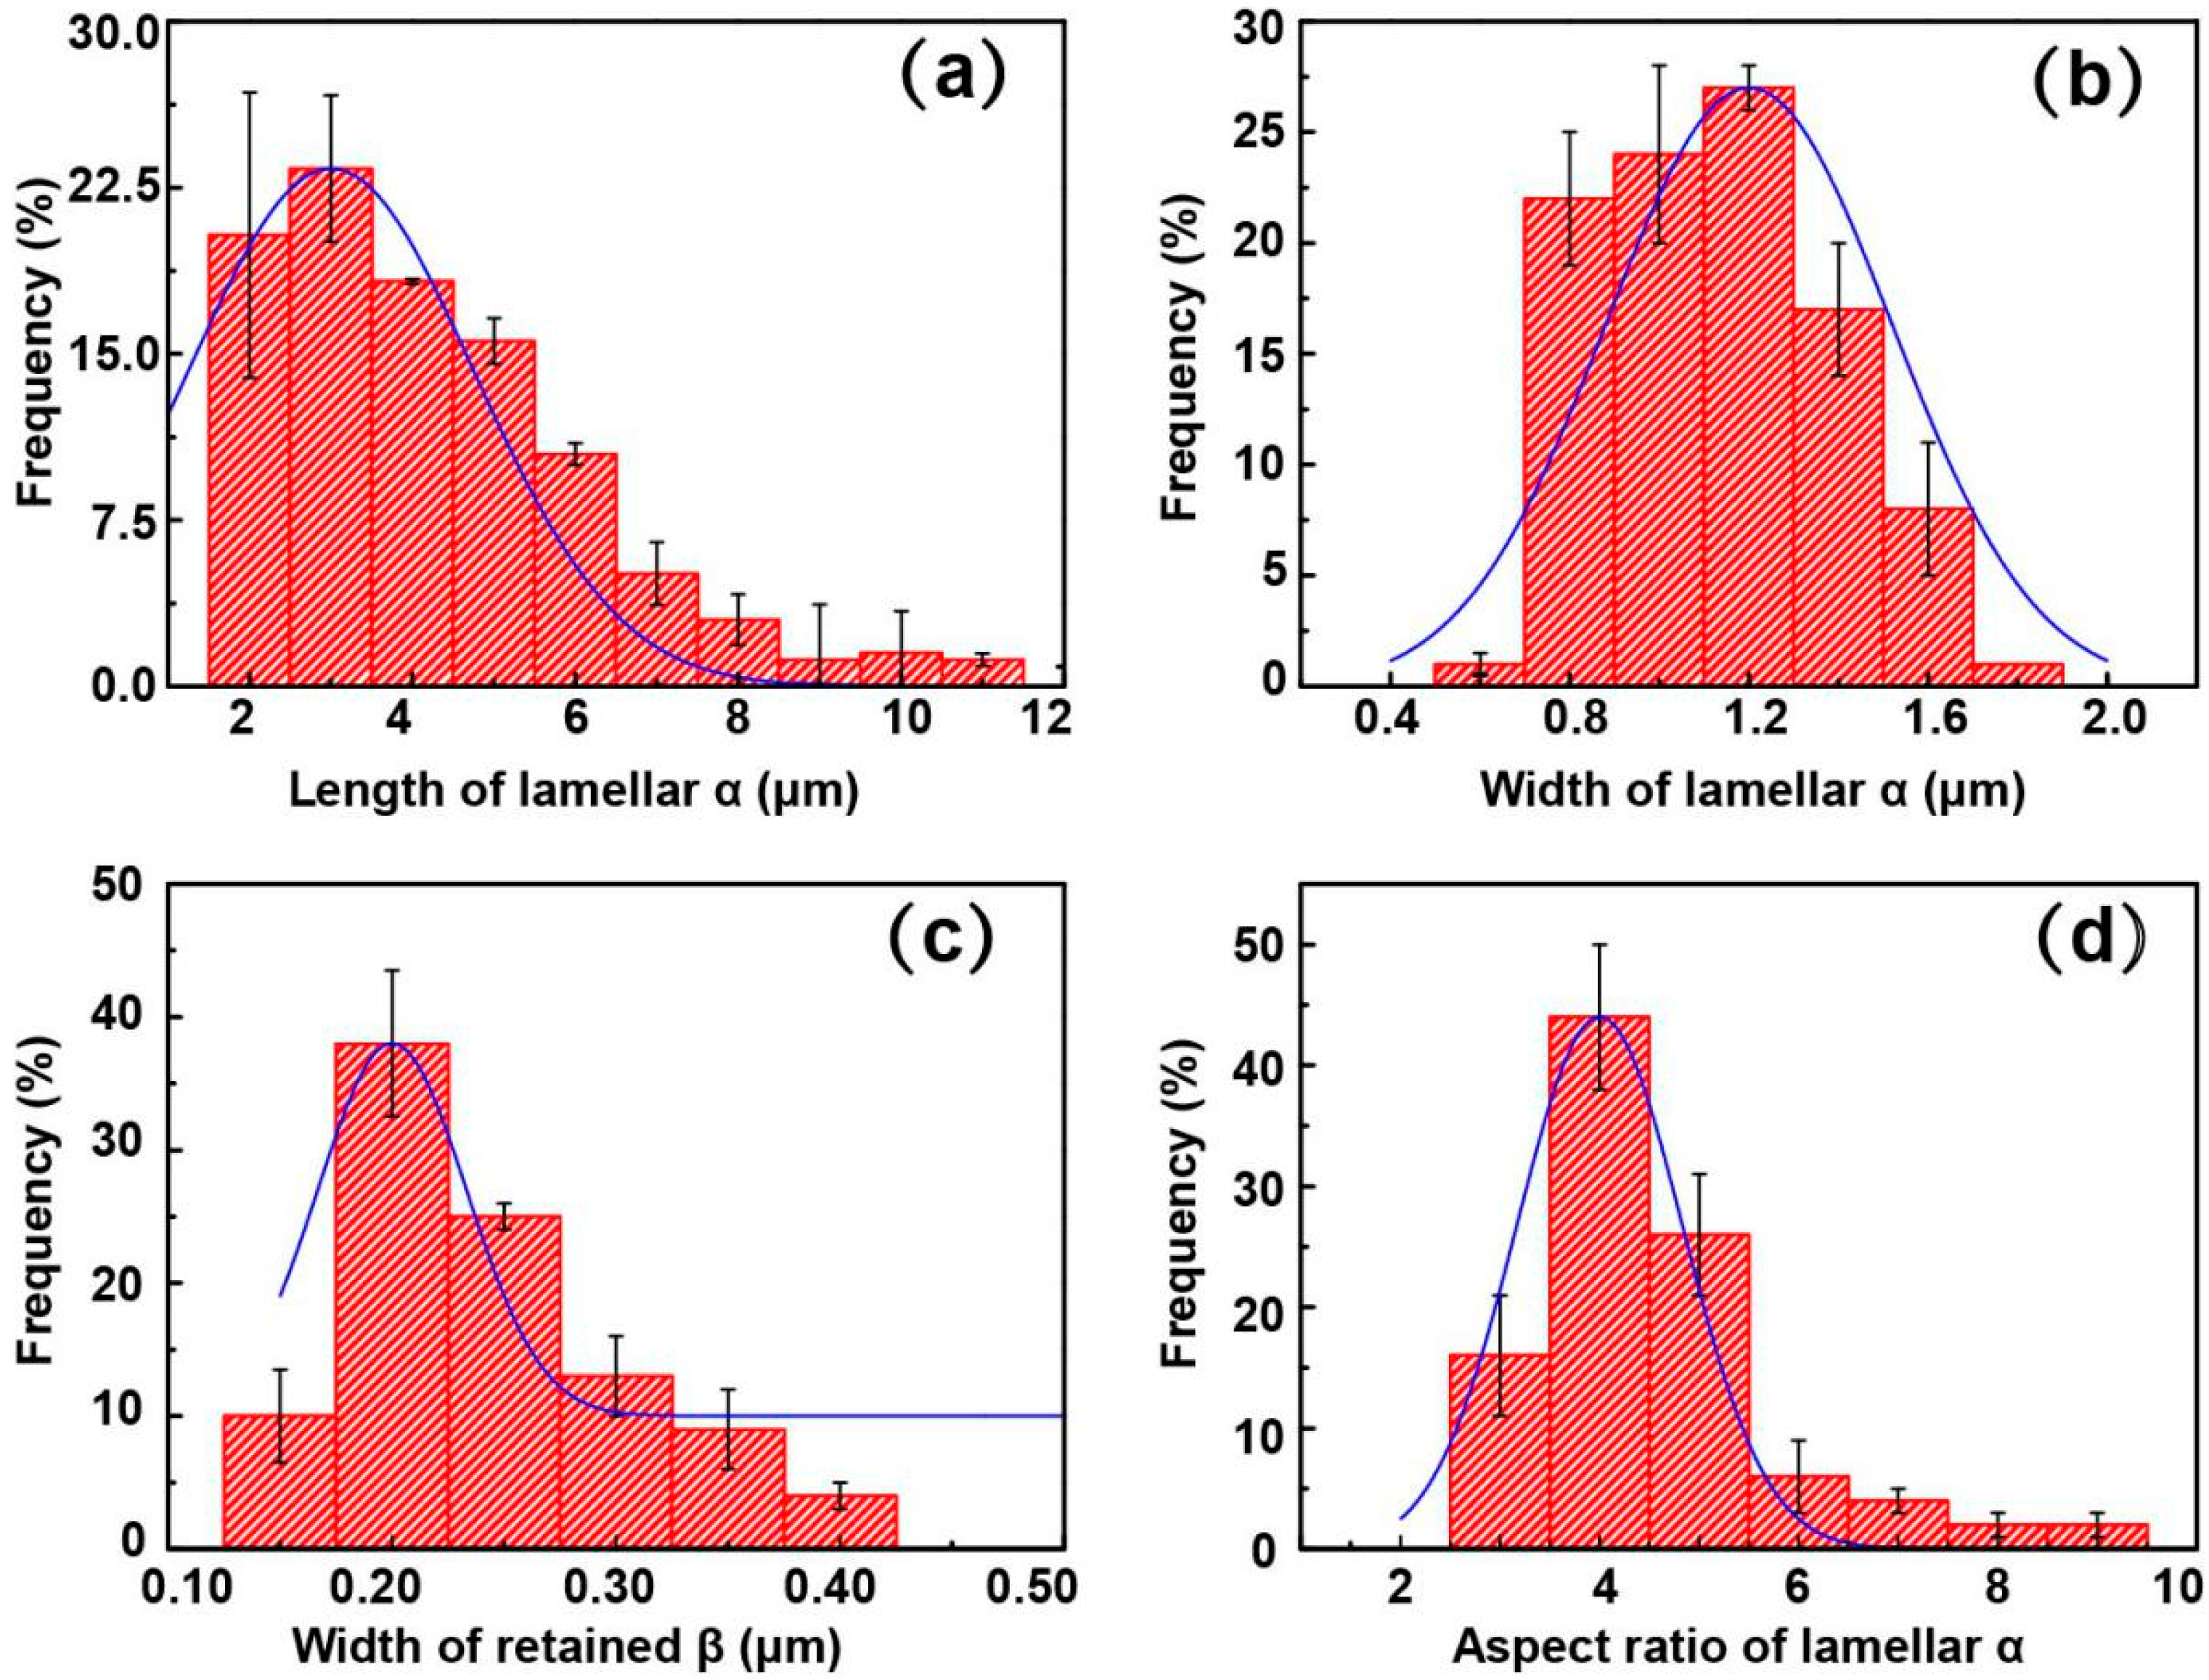
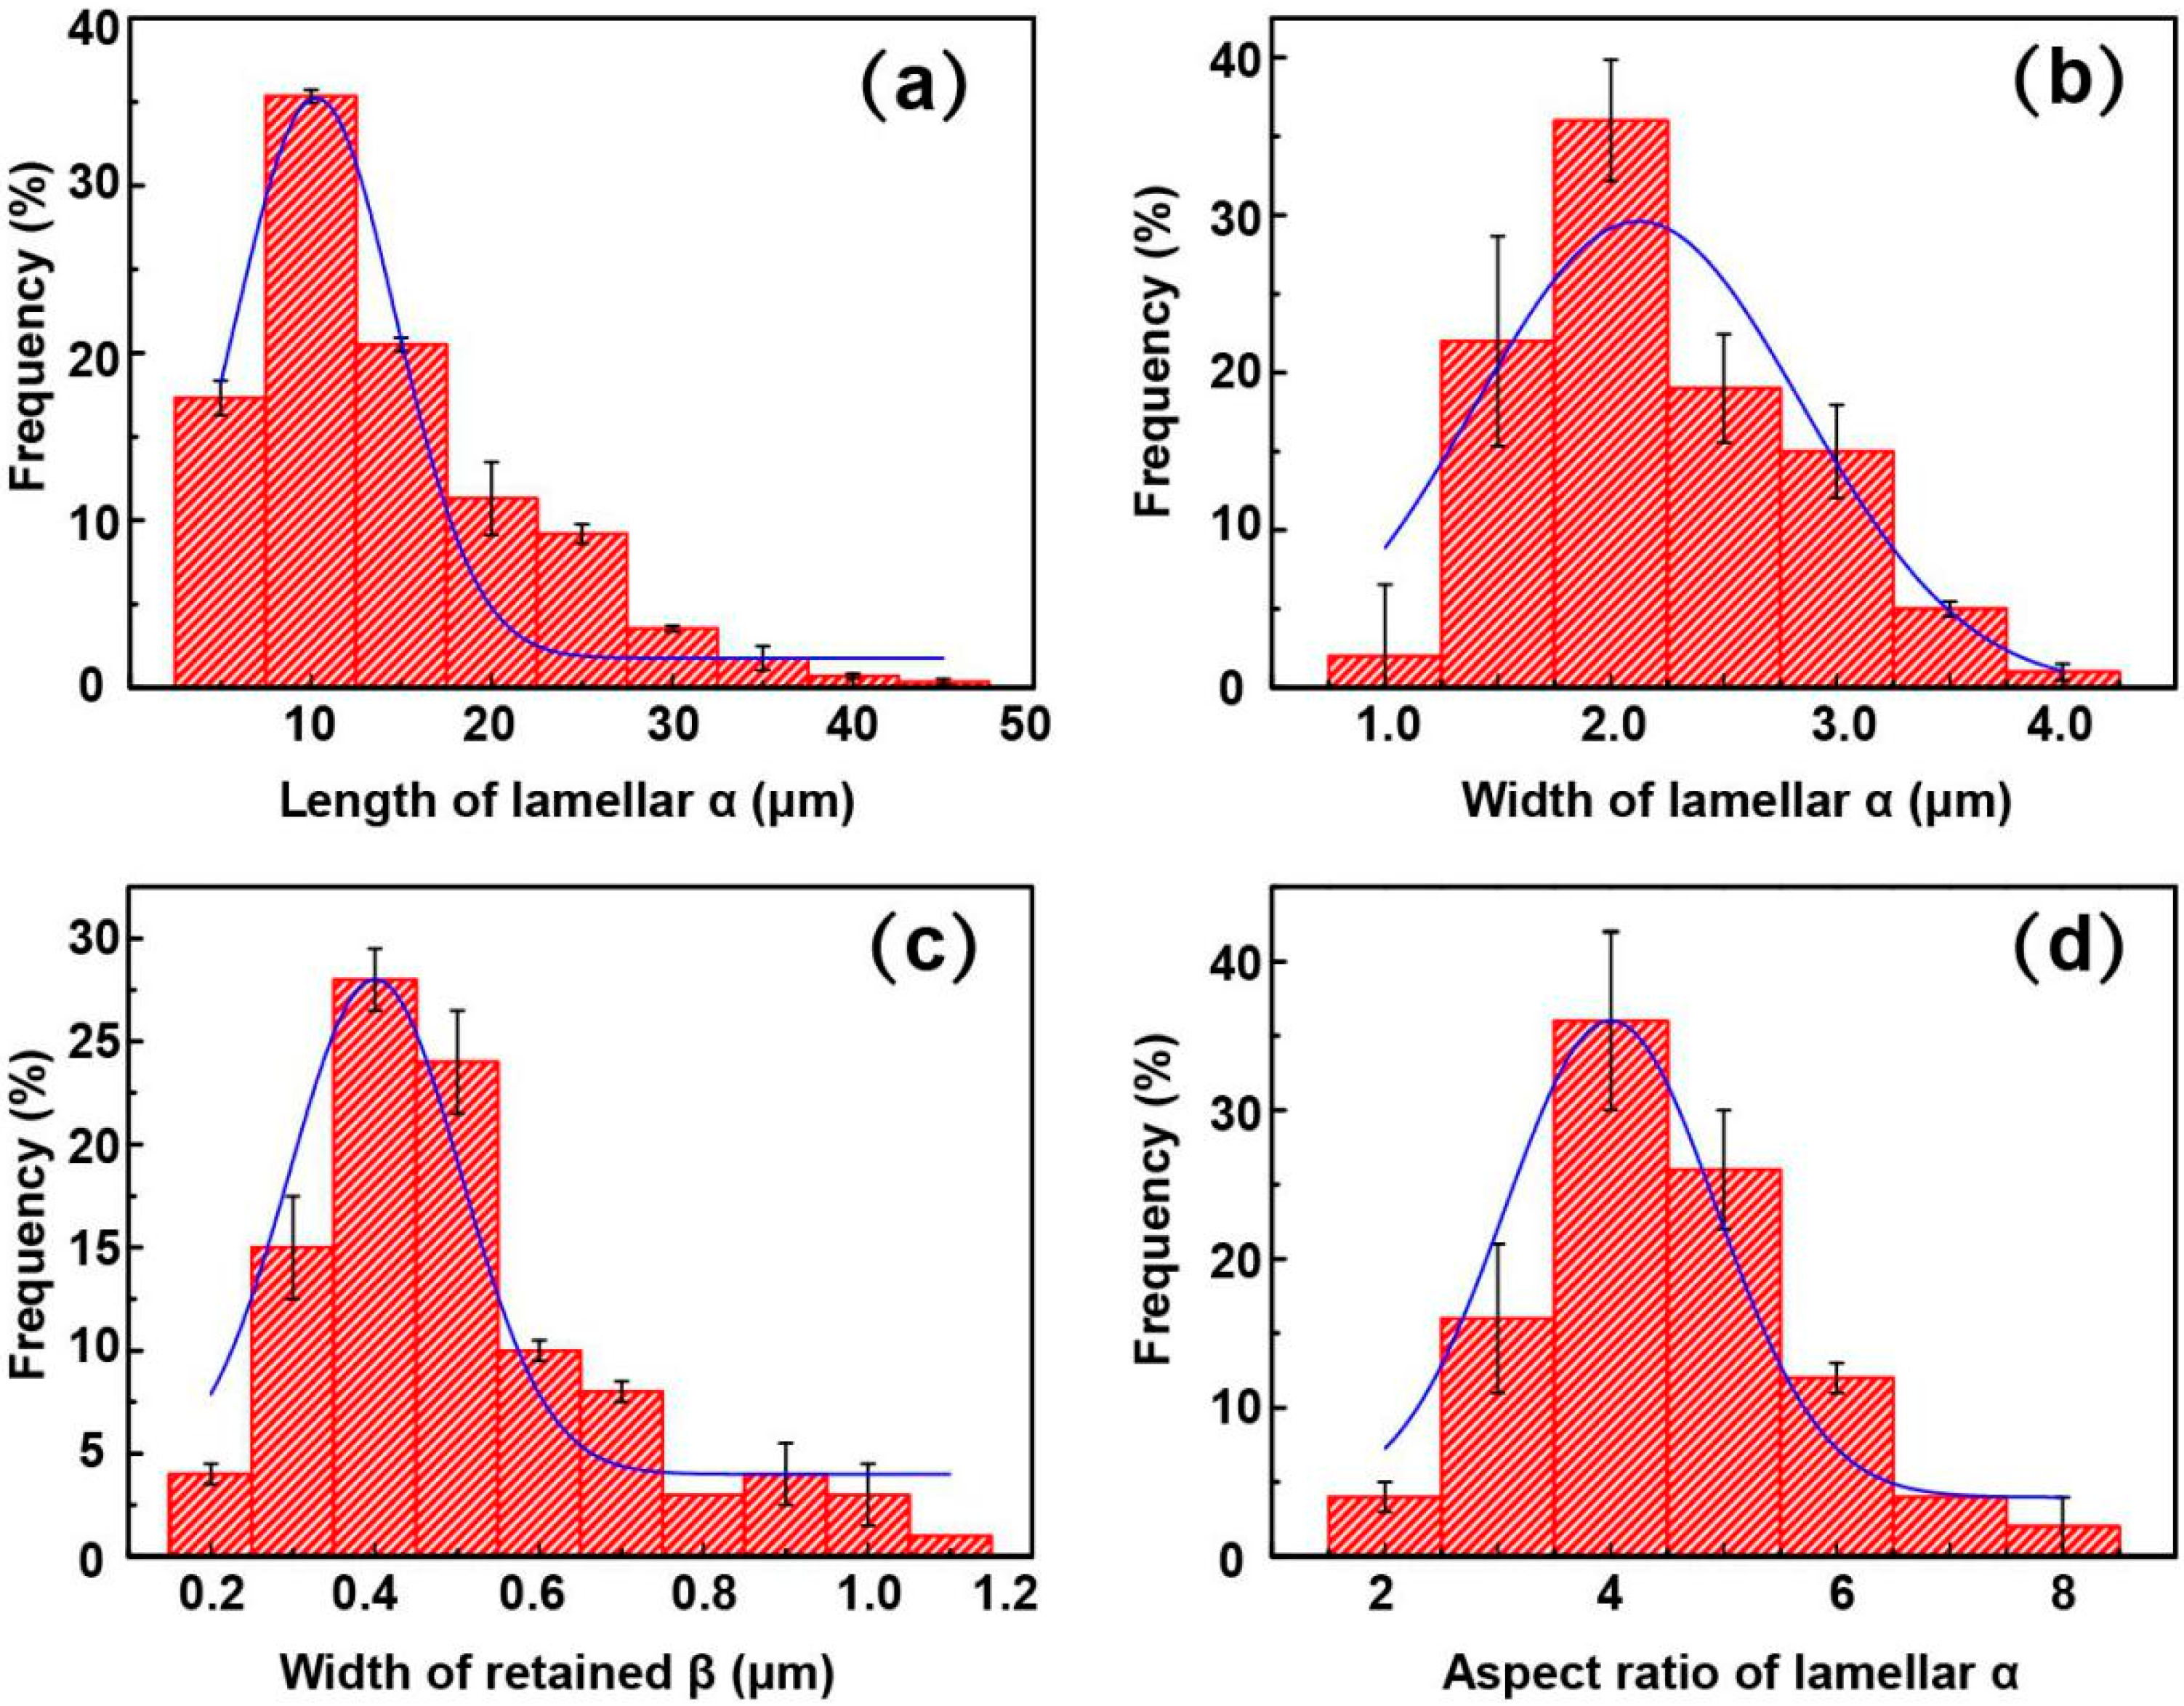
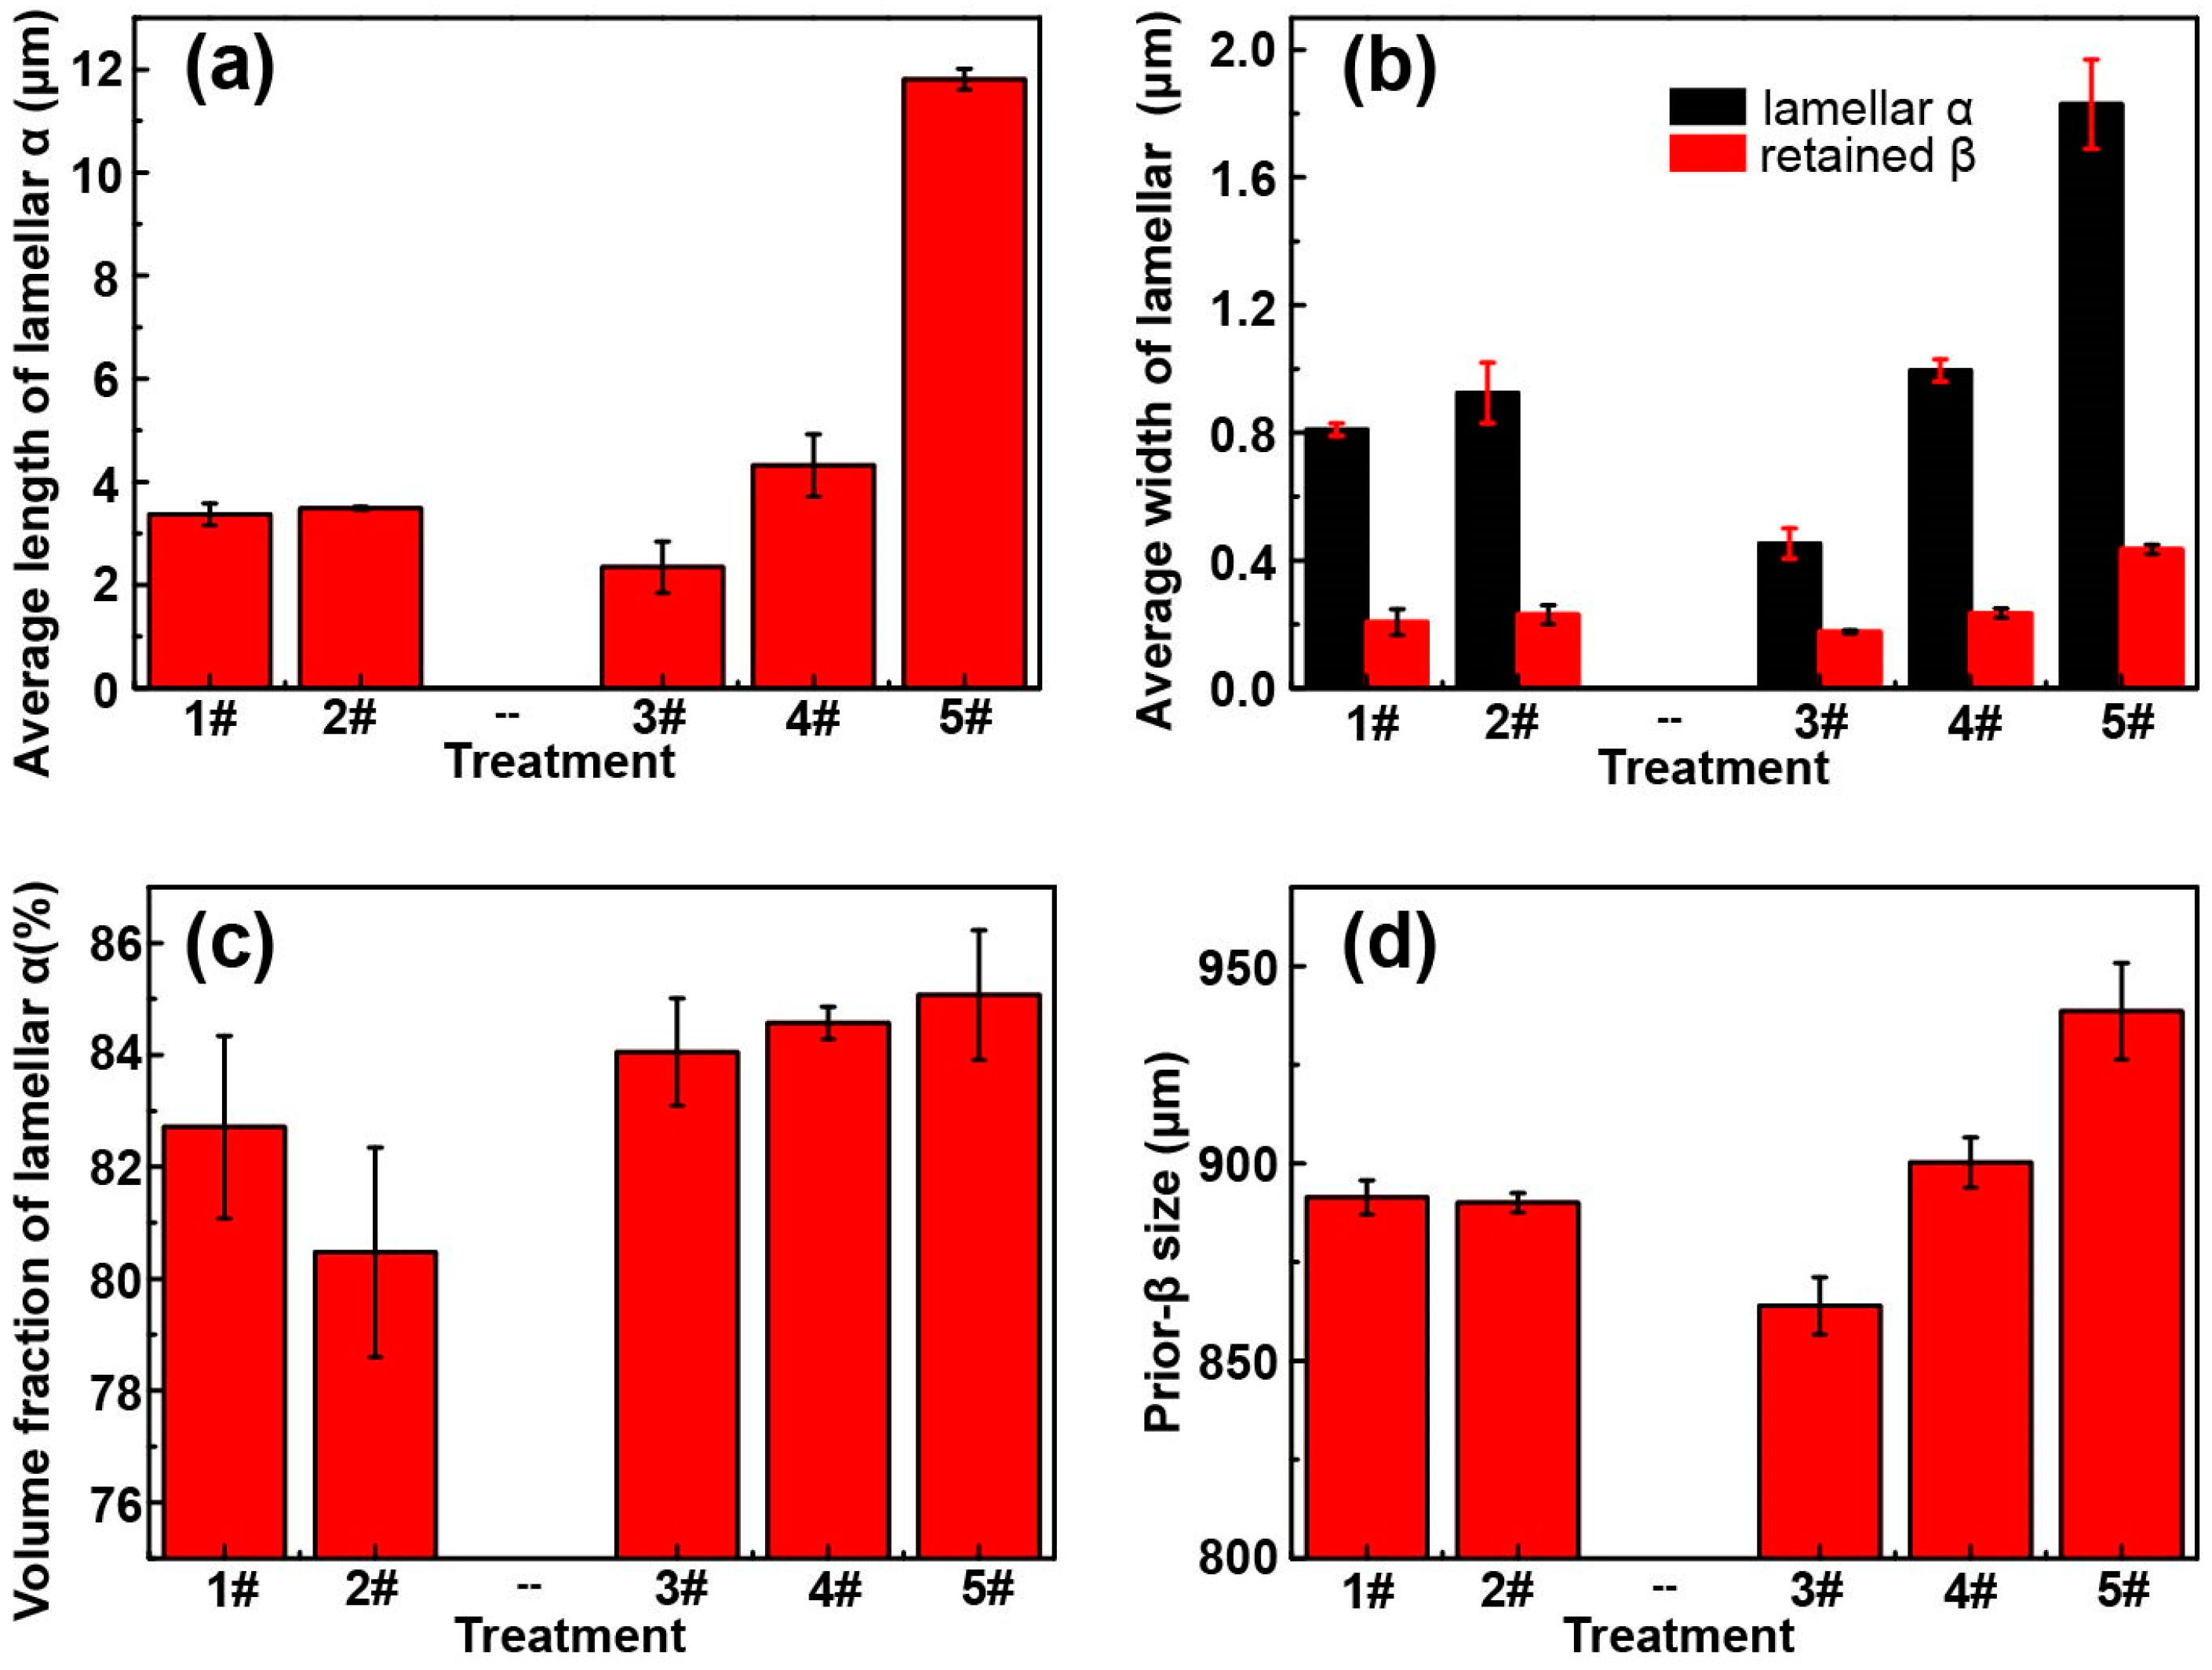
3.1. Microstructure

Figure 2 shows the optical images of the microstructure of TC4F after heat treatments, in which the equiaxed prior-β grain could be identified. Figure 3 shows the phase-indexing image of Sample 4 after heat treatment taken by electron backscatter diffraction (EBSD). According to Kikuchi patterns, the main cubic β phase, with a body-centered cubic (BCC) structure, and a small amount of the α phase, with a hexagonal close-packed (HCP) structure, were indexed. The distribution of the two phases is presented in blue and red. Figure 4 shows the backscattered SEM images of the TC4F samples’ microstructures. Corresponding to the phase morphology in Figure 3, the dark region in Figure 4 is the α phase, and the light region is the β phase. These regions appeared that way because β stabilizers are heavy elements. The region rich in β stabilizers, which appeared light in color in the backscattered SEM image, was the β phase. Conversely, the light α stabilizers dwelled in the α phase, appearing dark in color [19]. The five samples all contained the lamellar α and retained β phases, and the retained β delineated the lamellar α. Figure 5, Figure 6, Figure 7, Figure 8 and Figure 9 show frequency vs. microstructural features (namely, length and width of the α lamellae, the α aspect ratio, and the width of the retained β) of each sample based on SEM images (Figure 4). These comparisons of frequency vs. microstructural features could be fitted to normal distribution curves.
Figure 10 shows the statistical average values of TC4F’s microstructural features after heat treatments. Data are summarized in Table 3. The aging temperature of Sample 2 was higher than that of Sample 1, which led to a lower α fraction in Sample 2 than in Sample 1 (as shown in Figure 10c and Table 3). A higher aging temperature facilitated the growth of the α phase, as evidenced by the higher average width of lamellar α in Sample 2 than that in Sample 1 (see Figure 10b and Table 3), although the average length of lamellar α was almost identical. Cooling after the solution treatment mainly affected the size of the α phase precipitated during the subsequent aging process. The higher the cooling rate was, the smaller the α phase size was. The average length and width of lamellar α in Sample 4 were larger than those in Sample 3 but smaller than those in Sample 5 (see Figure 10a,b and Table 3). The prior-β grain size was controlled by the β-annealing treatment. A high temperature and a long time accelerated the growth of the prior-β grain. After β-annealing at 1005 °C for 70 min or 1100 °C for 40 min, the β-grain size was around 900 μm (see Figure 10d and Table 3). The difference in β-grain size of Samples 3–5 was mainly due to the result of the cooling rate after solution treatment; 1100 °C was more than 100 °C higher than the β-transus temperature. The slow-cooling rate caused β-phase grains to continue growing at temperatures higher than 975 °C during the cooling process. Similar conclusions were also found for other α + β titanium alloys [10,11,12,13,14,15,16,17,18,19]. β-Annealing at a low temperature for a short time in the β-phase region facilitated small prior-β grains. Fast water cooling and aging at a low temperature for a short time facilitated the formation of the finest lamellar α precipitates.

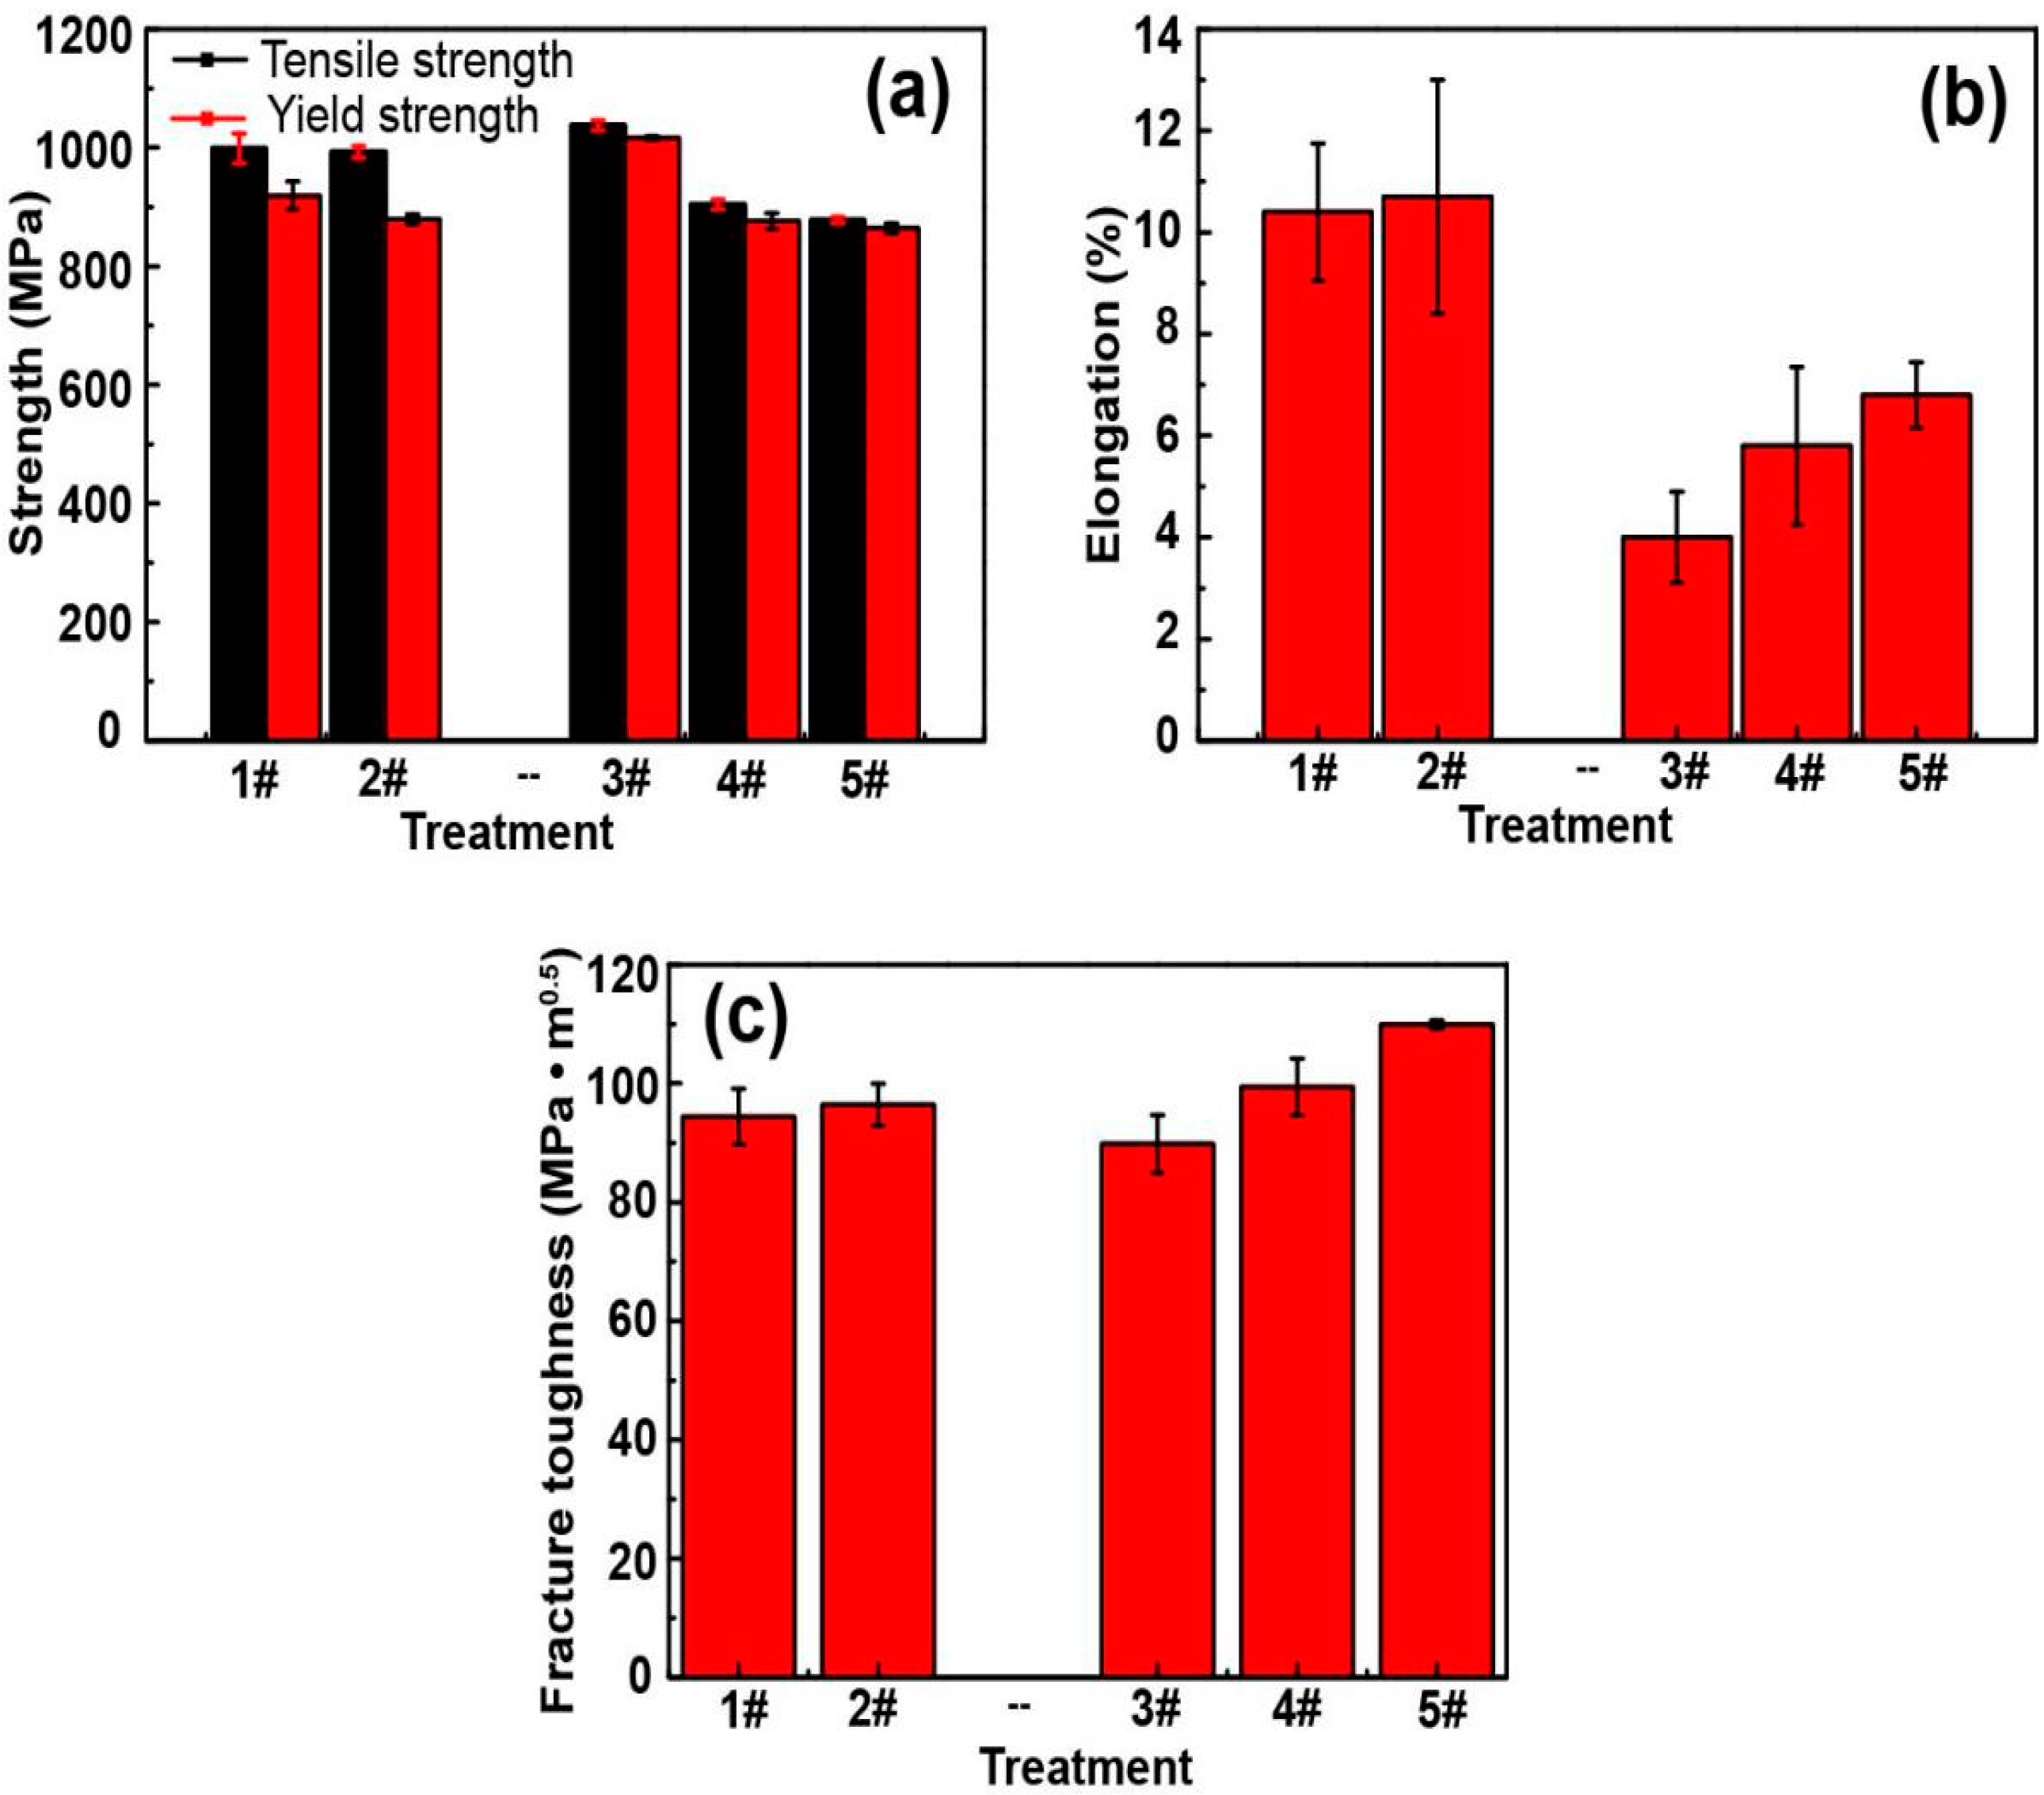
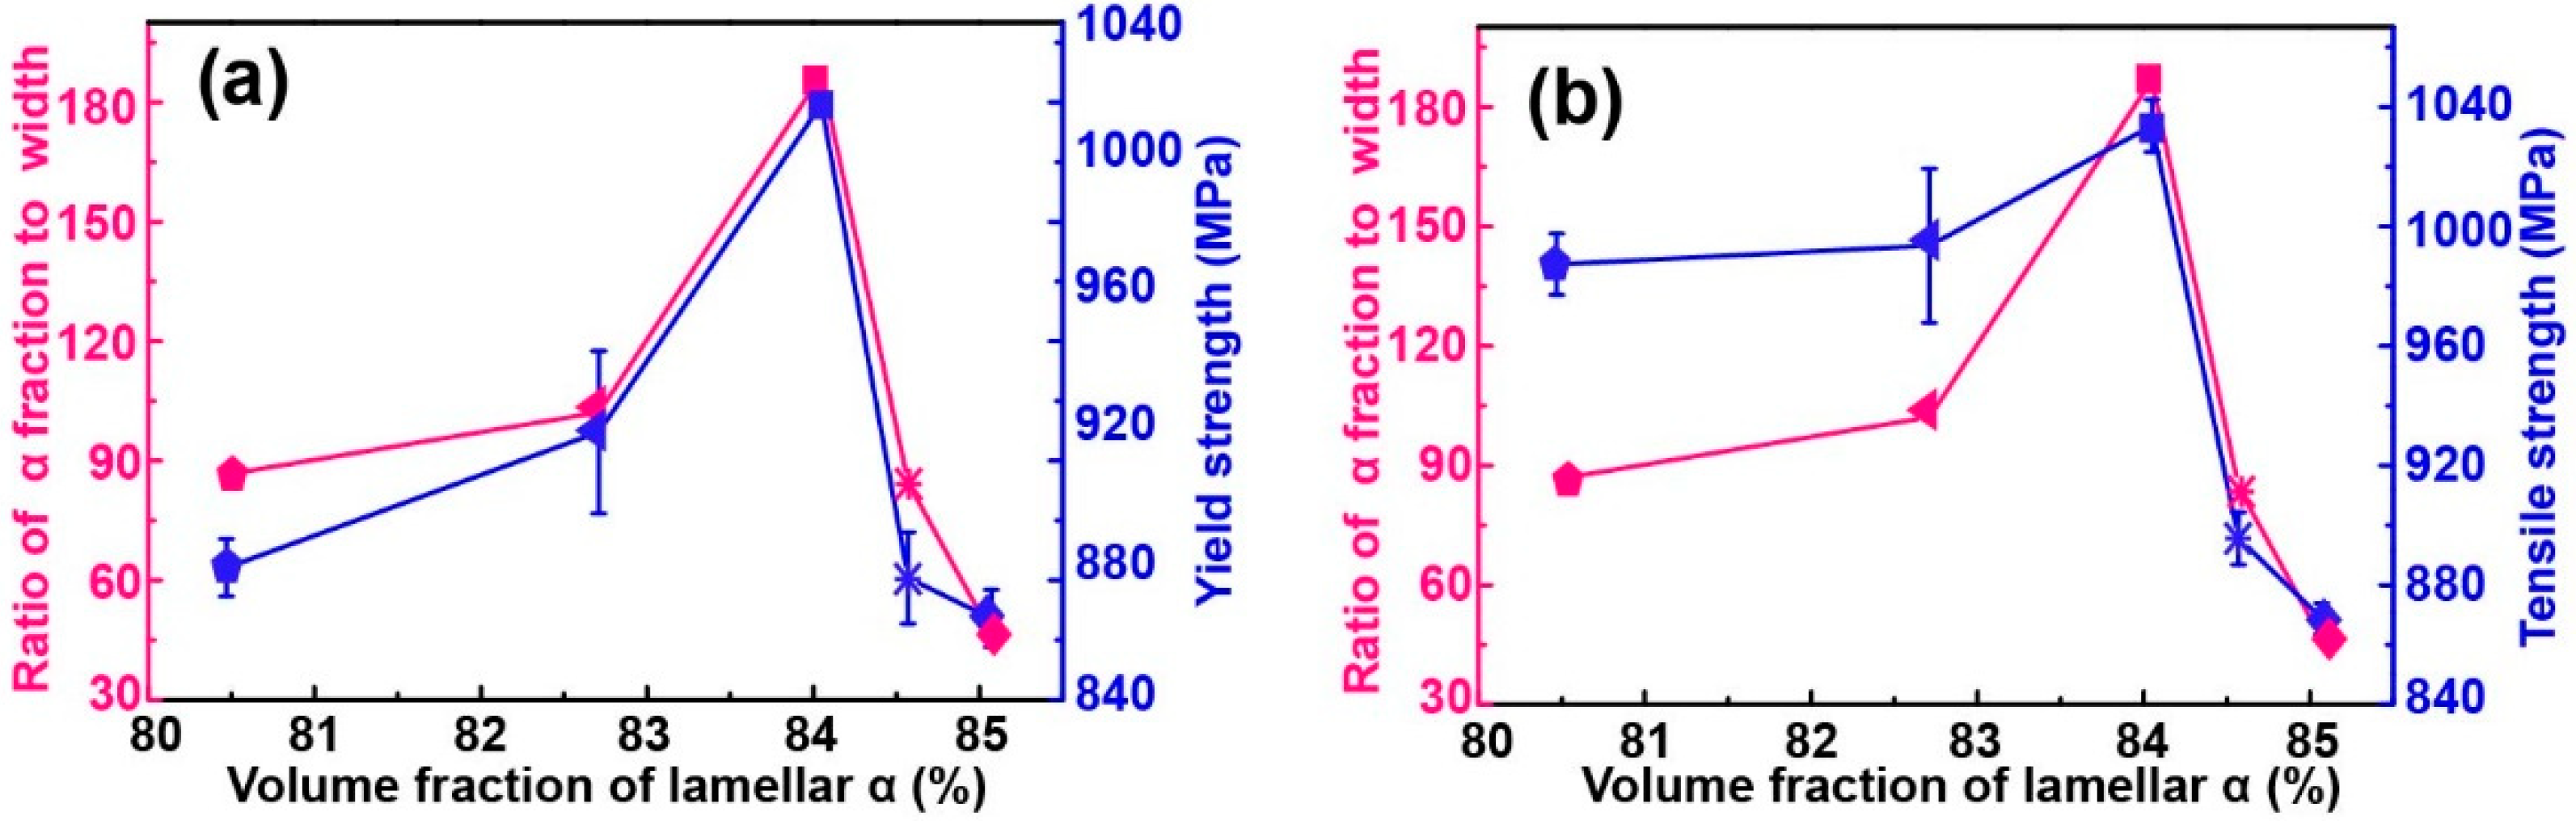
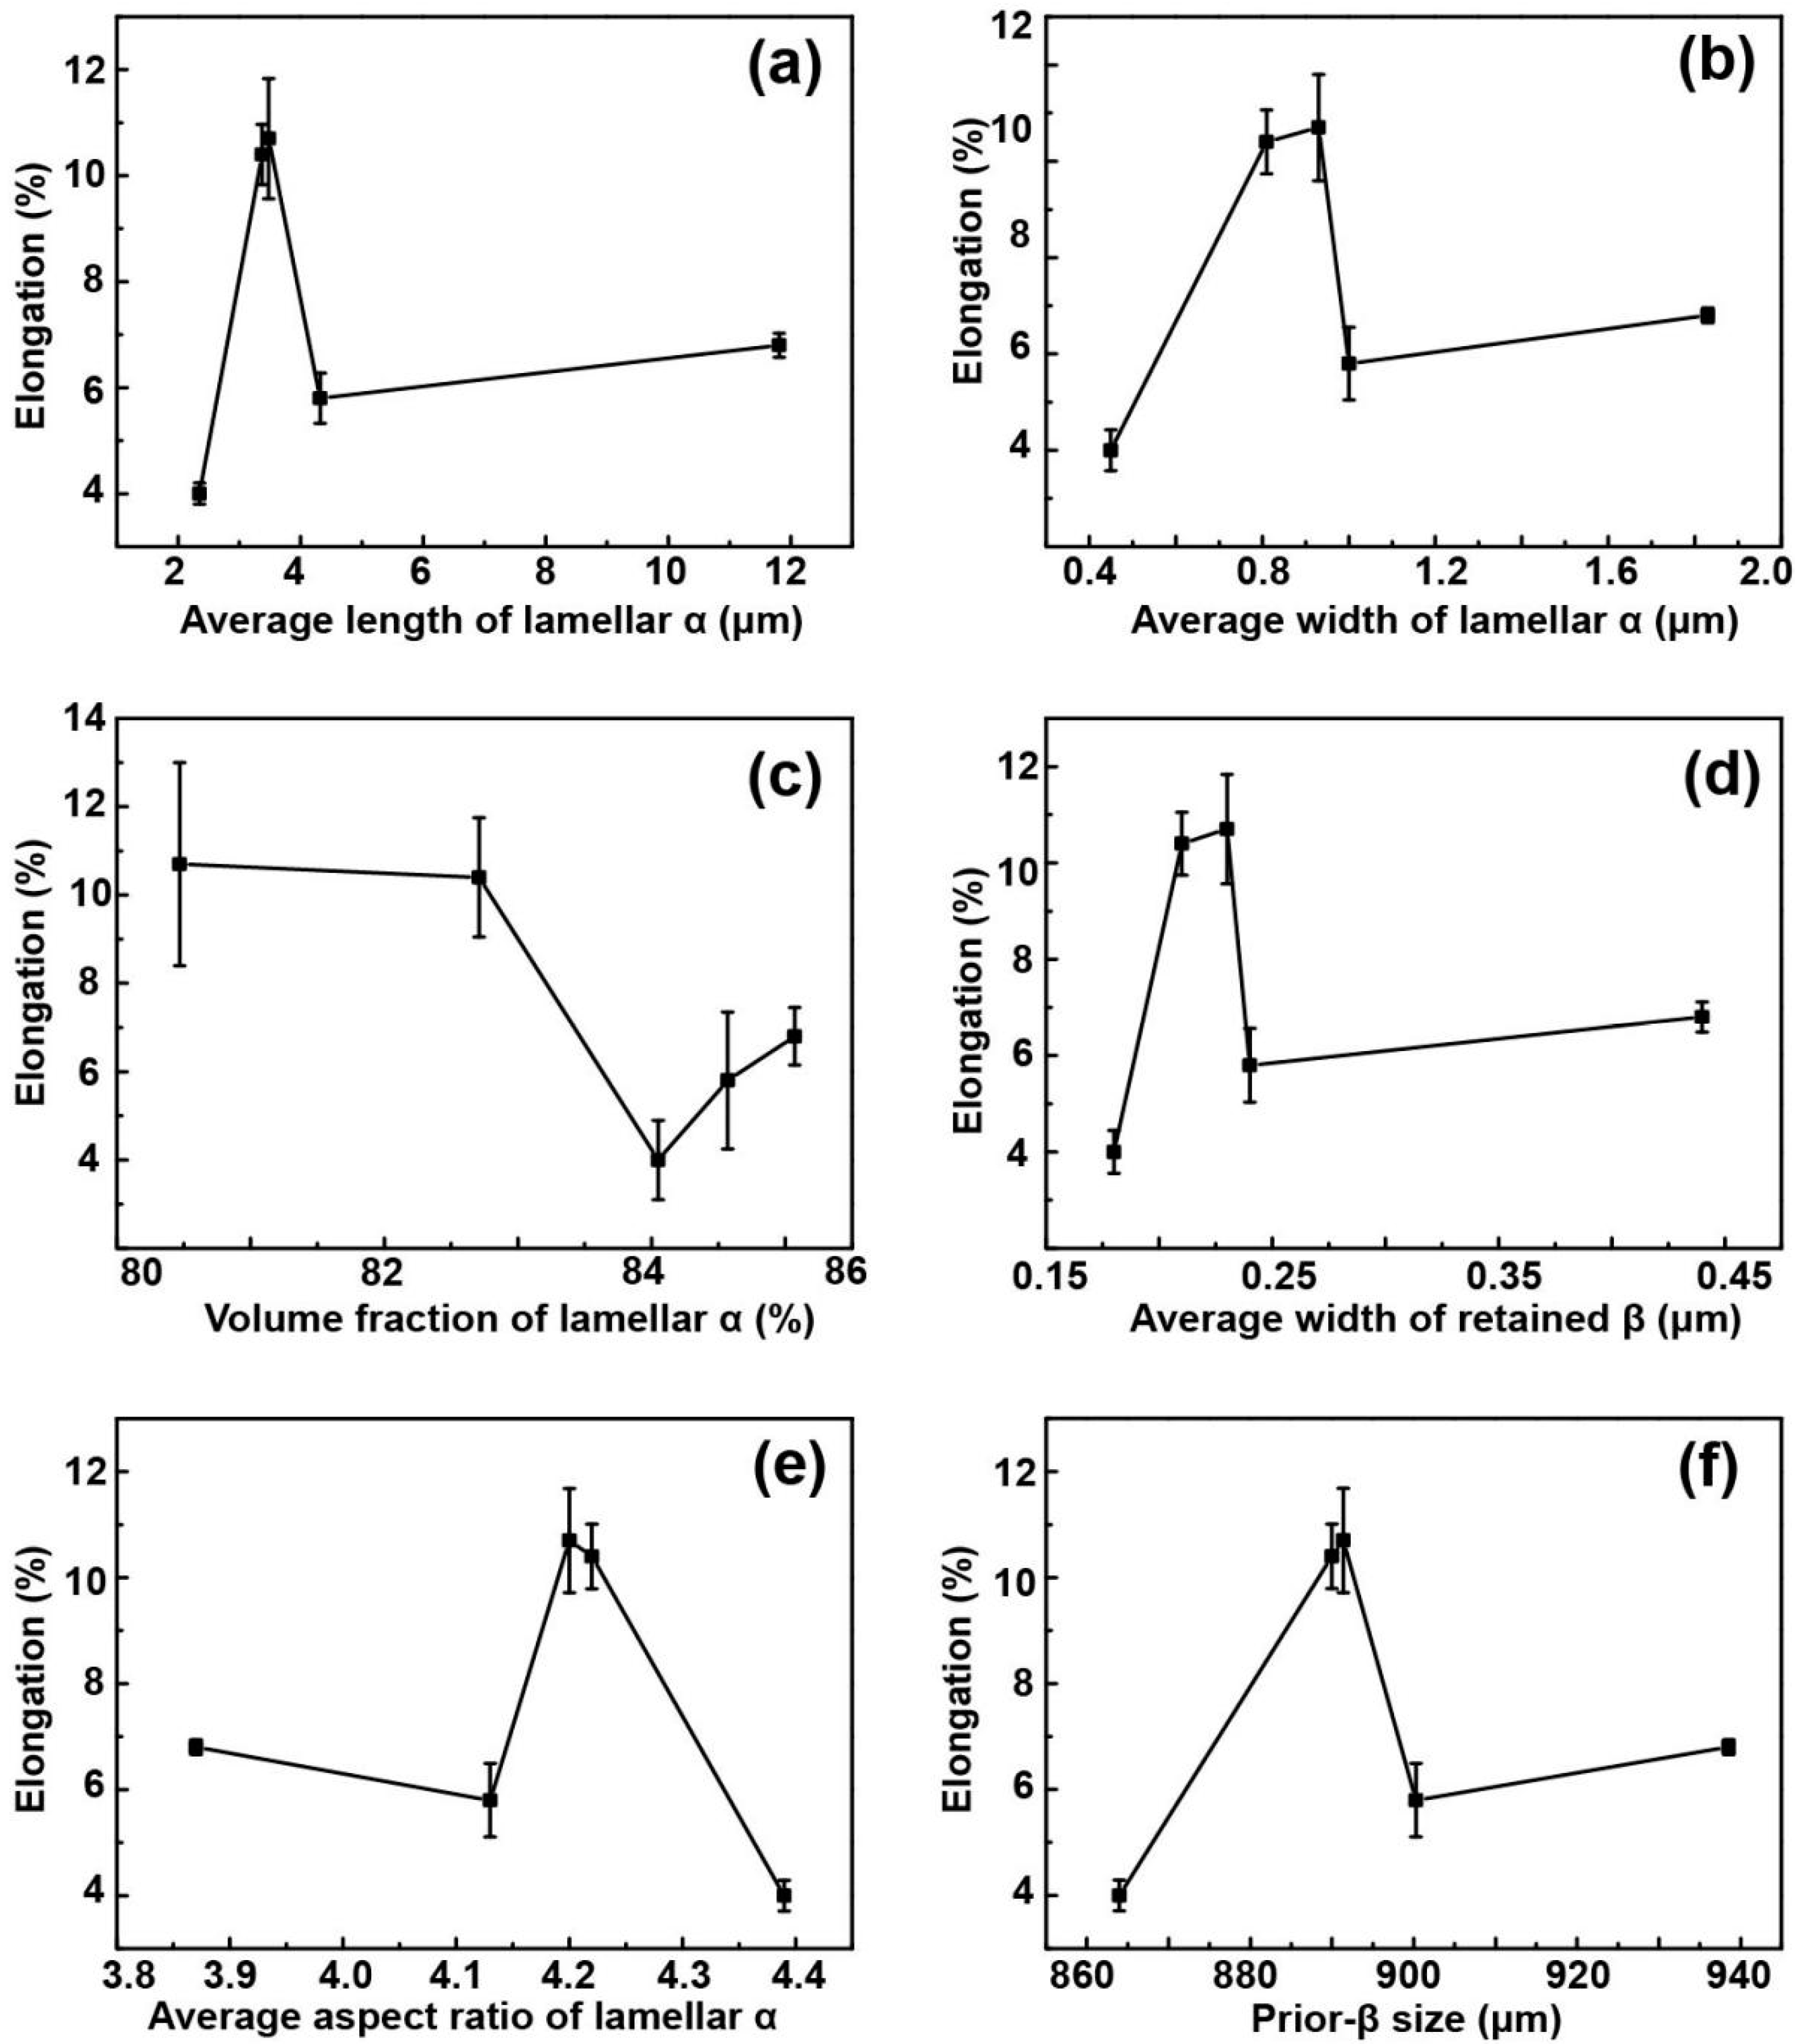
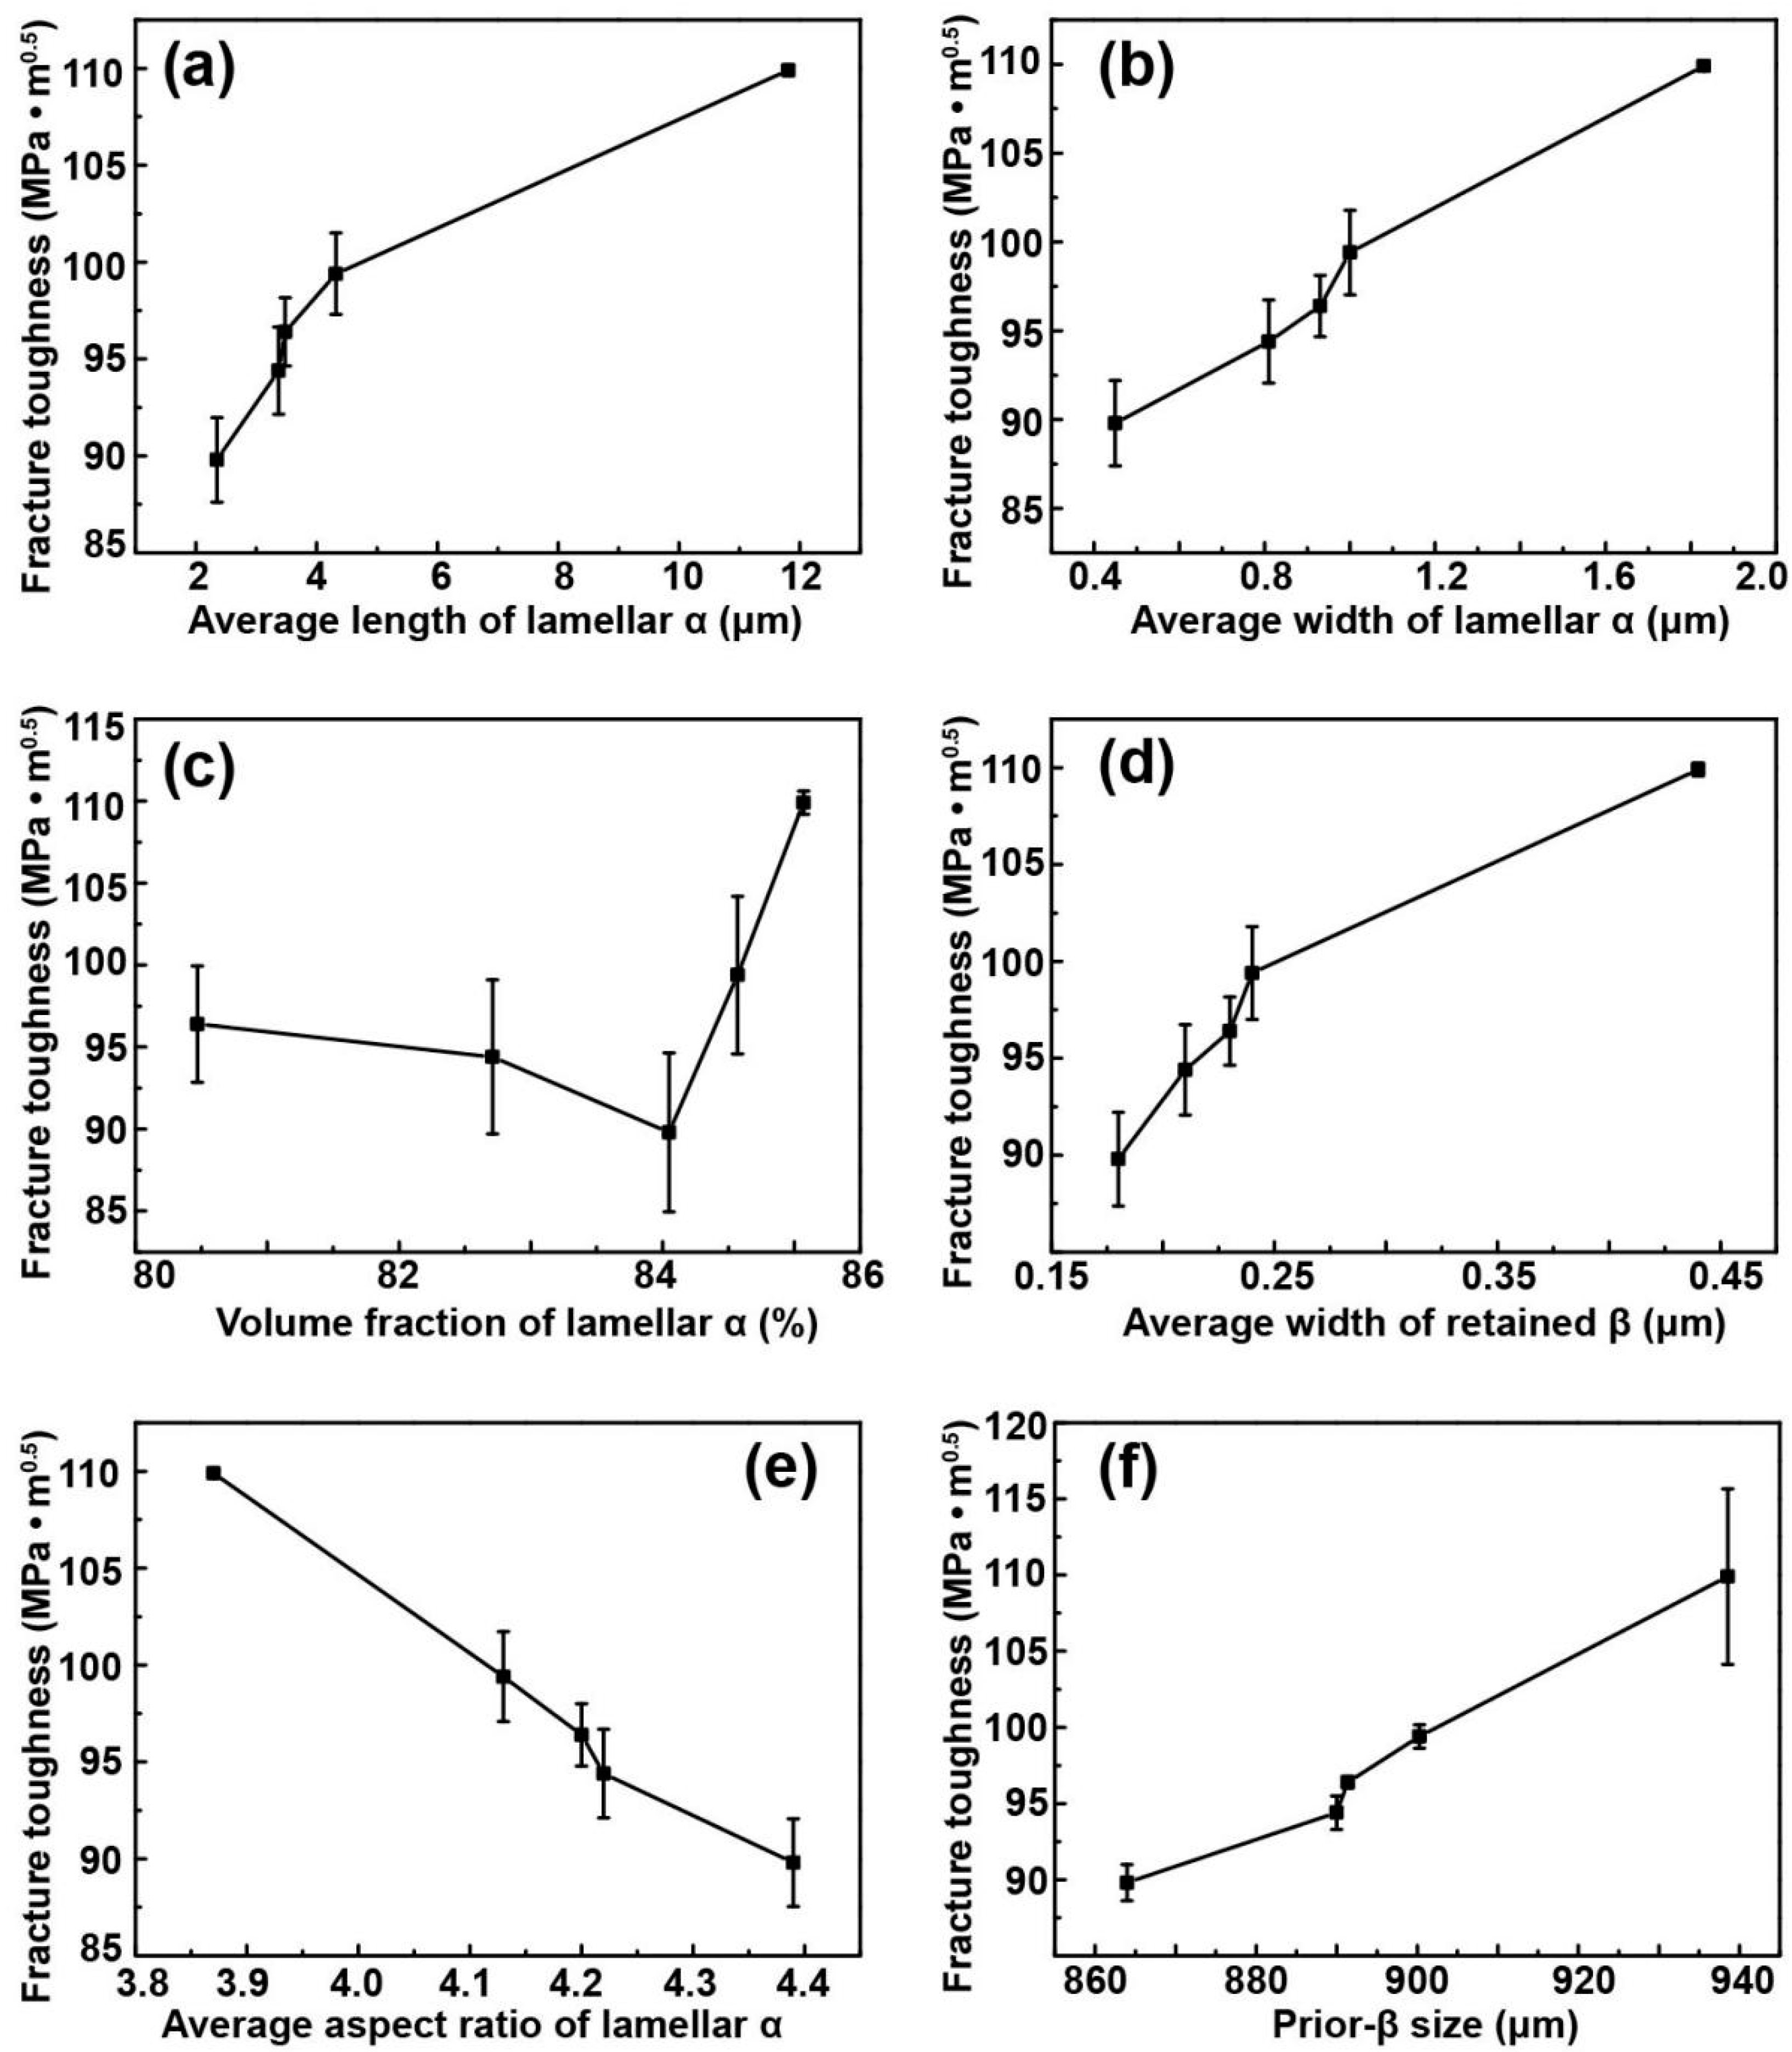
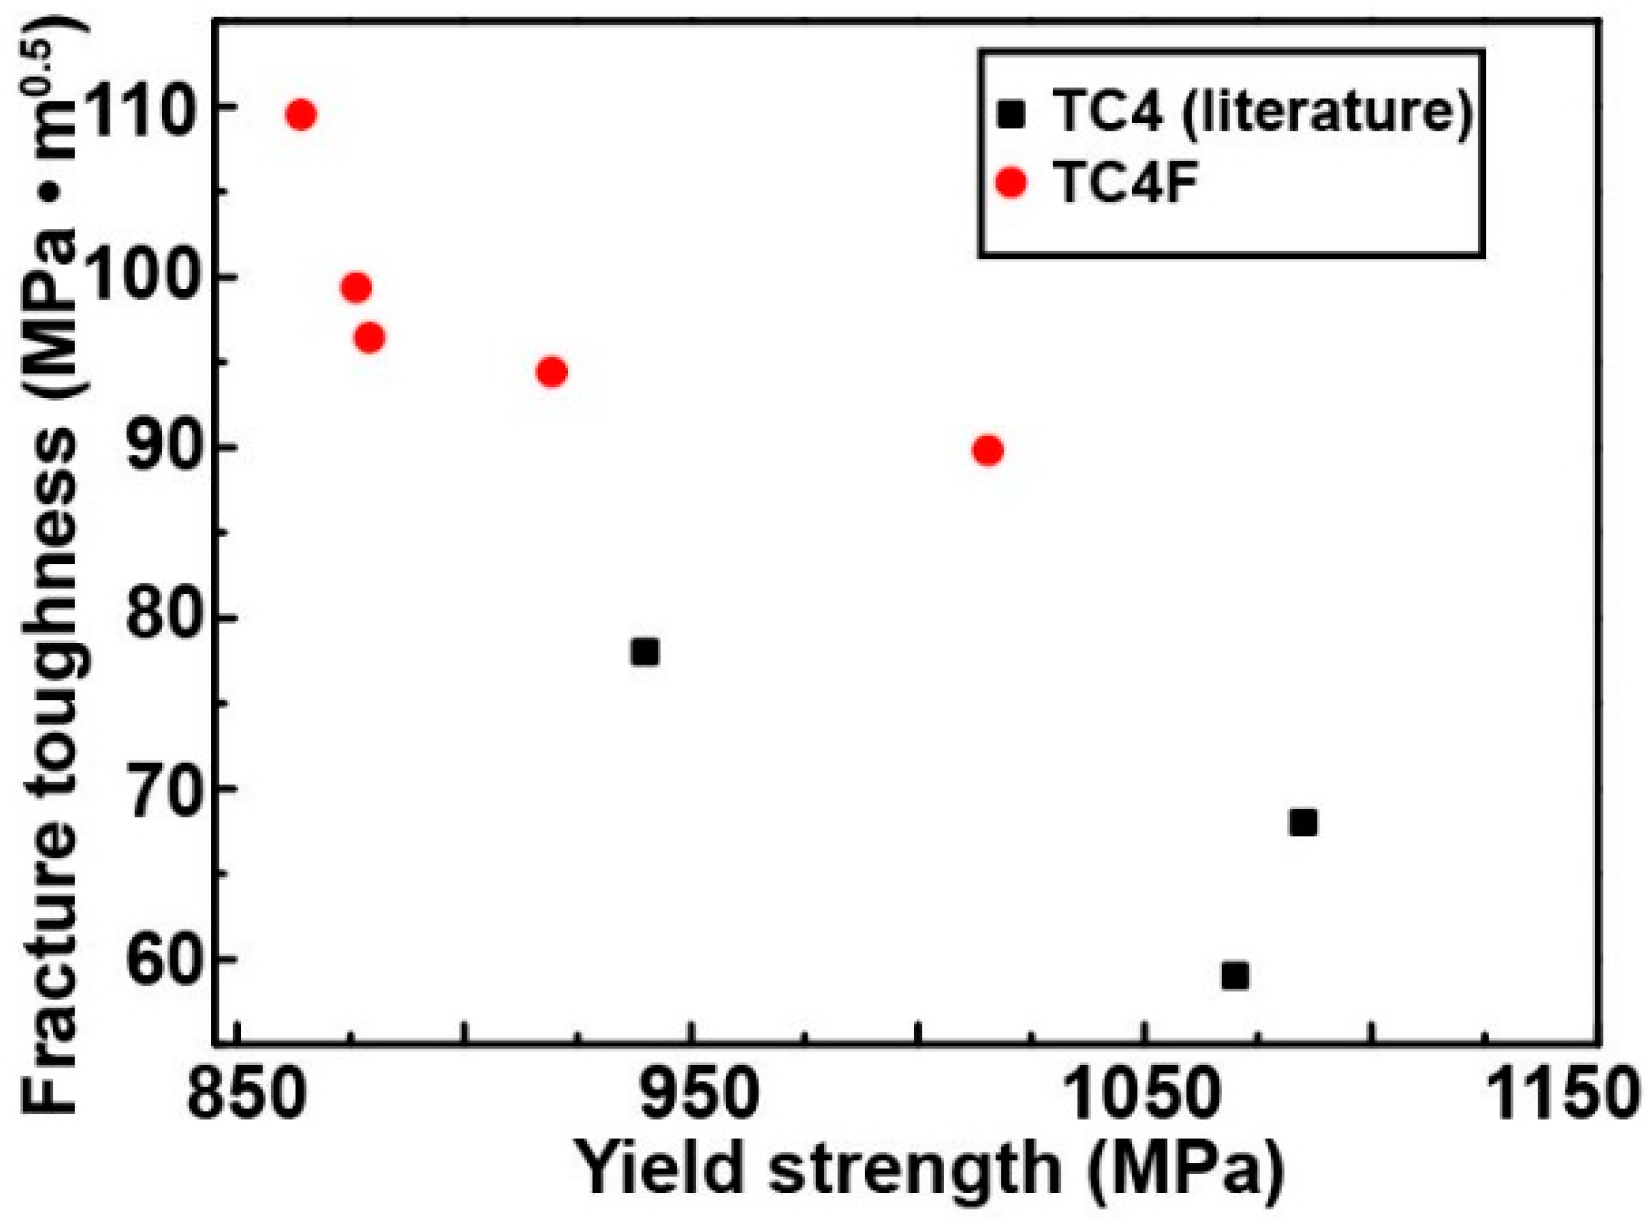
3.2. Mechanical Properties

Figure 11 shows the tensile strength, elongation, and fracture toughness of the heat-treated TC4F samples; data are summarized in Table 4. Results showed that TC4F had a wide performance window to optimize microstructure and heat treatments. Tensile strength, yield tensile strength, elongation, and fracture toughness were in the range of 878–1038 MPa, 864–1016 MPa, 4.0–10.7%, and 89.8–109.5 MPa·m1/2, respectively. When the mechanical properties of Samples 1 and 2 were compared, the alloy treated at a higher aging temperature was found to have lower strength, and higher plasticity and fracture toughness. When the mechanical properties of Samples 3–5 were compared, the high cooling temperature was found to result in high strength, but low plasticity and toughness.
Figure 12 shows the fracture surface of the heat-treated TC4F alloys after the fracture-toughness test. The fracture surfaces of TC4F in Samples 1 and 2 showed plastic fractures (see Figure 12a,b). The cracked surfaces contained large dimples and the formation of secondary cracks. The fracture surfaces of Samples 3 and 4 exhibited brittle fractures (see Figure 12c,d). There were micropores and cleavage steps with strip patterns. More cracking along the lamella could be observed on the fracture surfaces. The fracture surface of Sample 5 showed a typical mixed-mode fracture (see Figure 12e). Dimples, ravines, and micropores could be observed on the fracture surface. When the fracture surfaces were compared after three treatments, Sample 5 had the largest dimples. It was evident that the high numbers of relatively large dimples and higher undulation depth were beneficial to fracture toughness since Sample 5 had the highest value in the experiment.

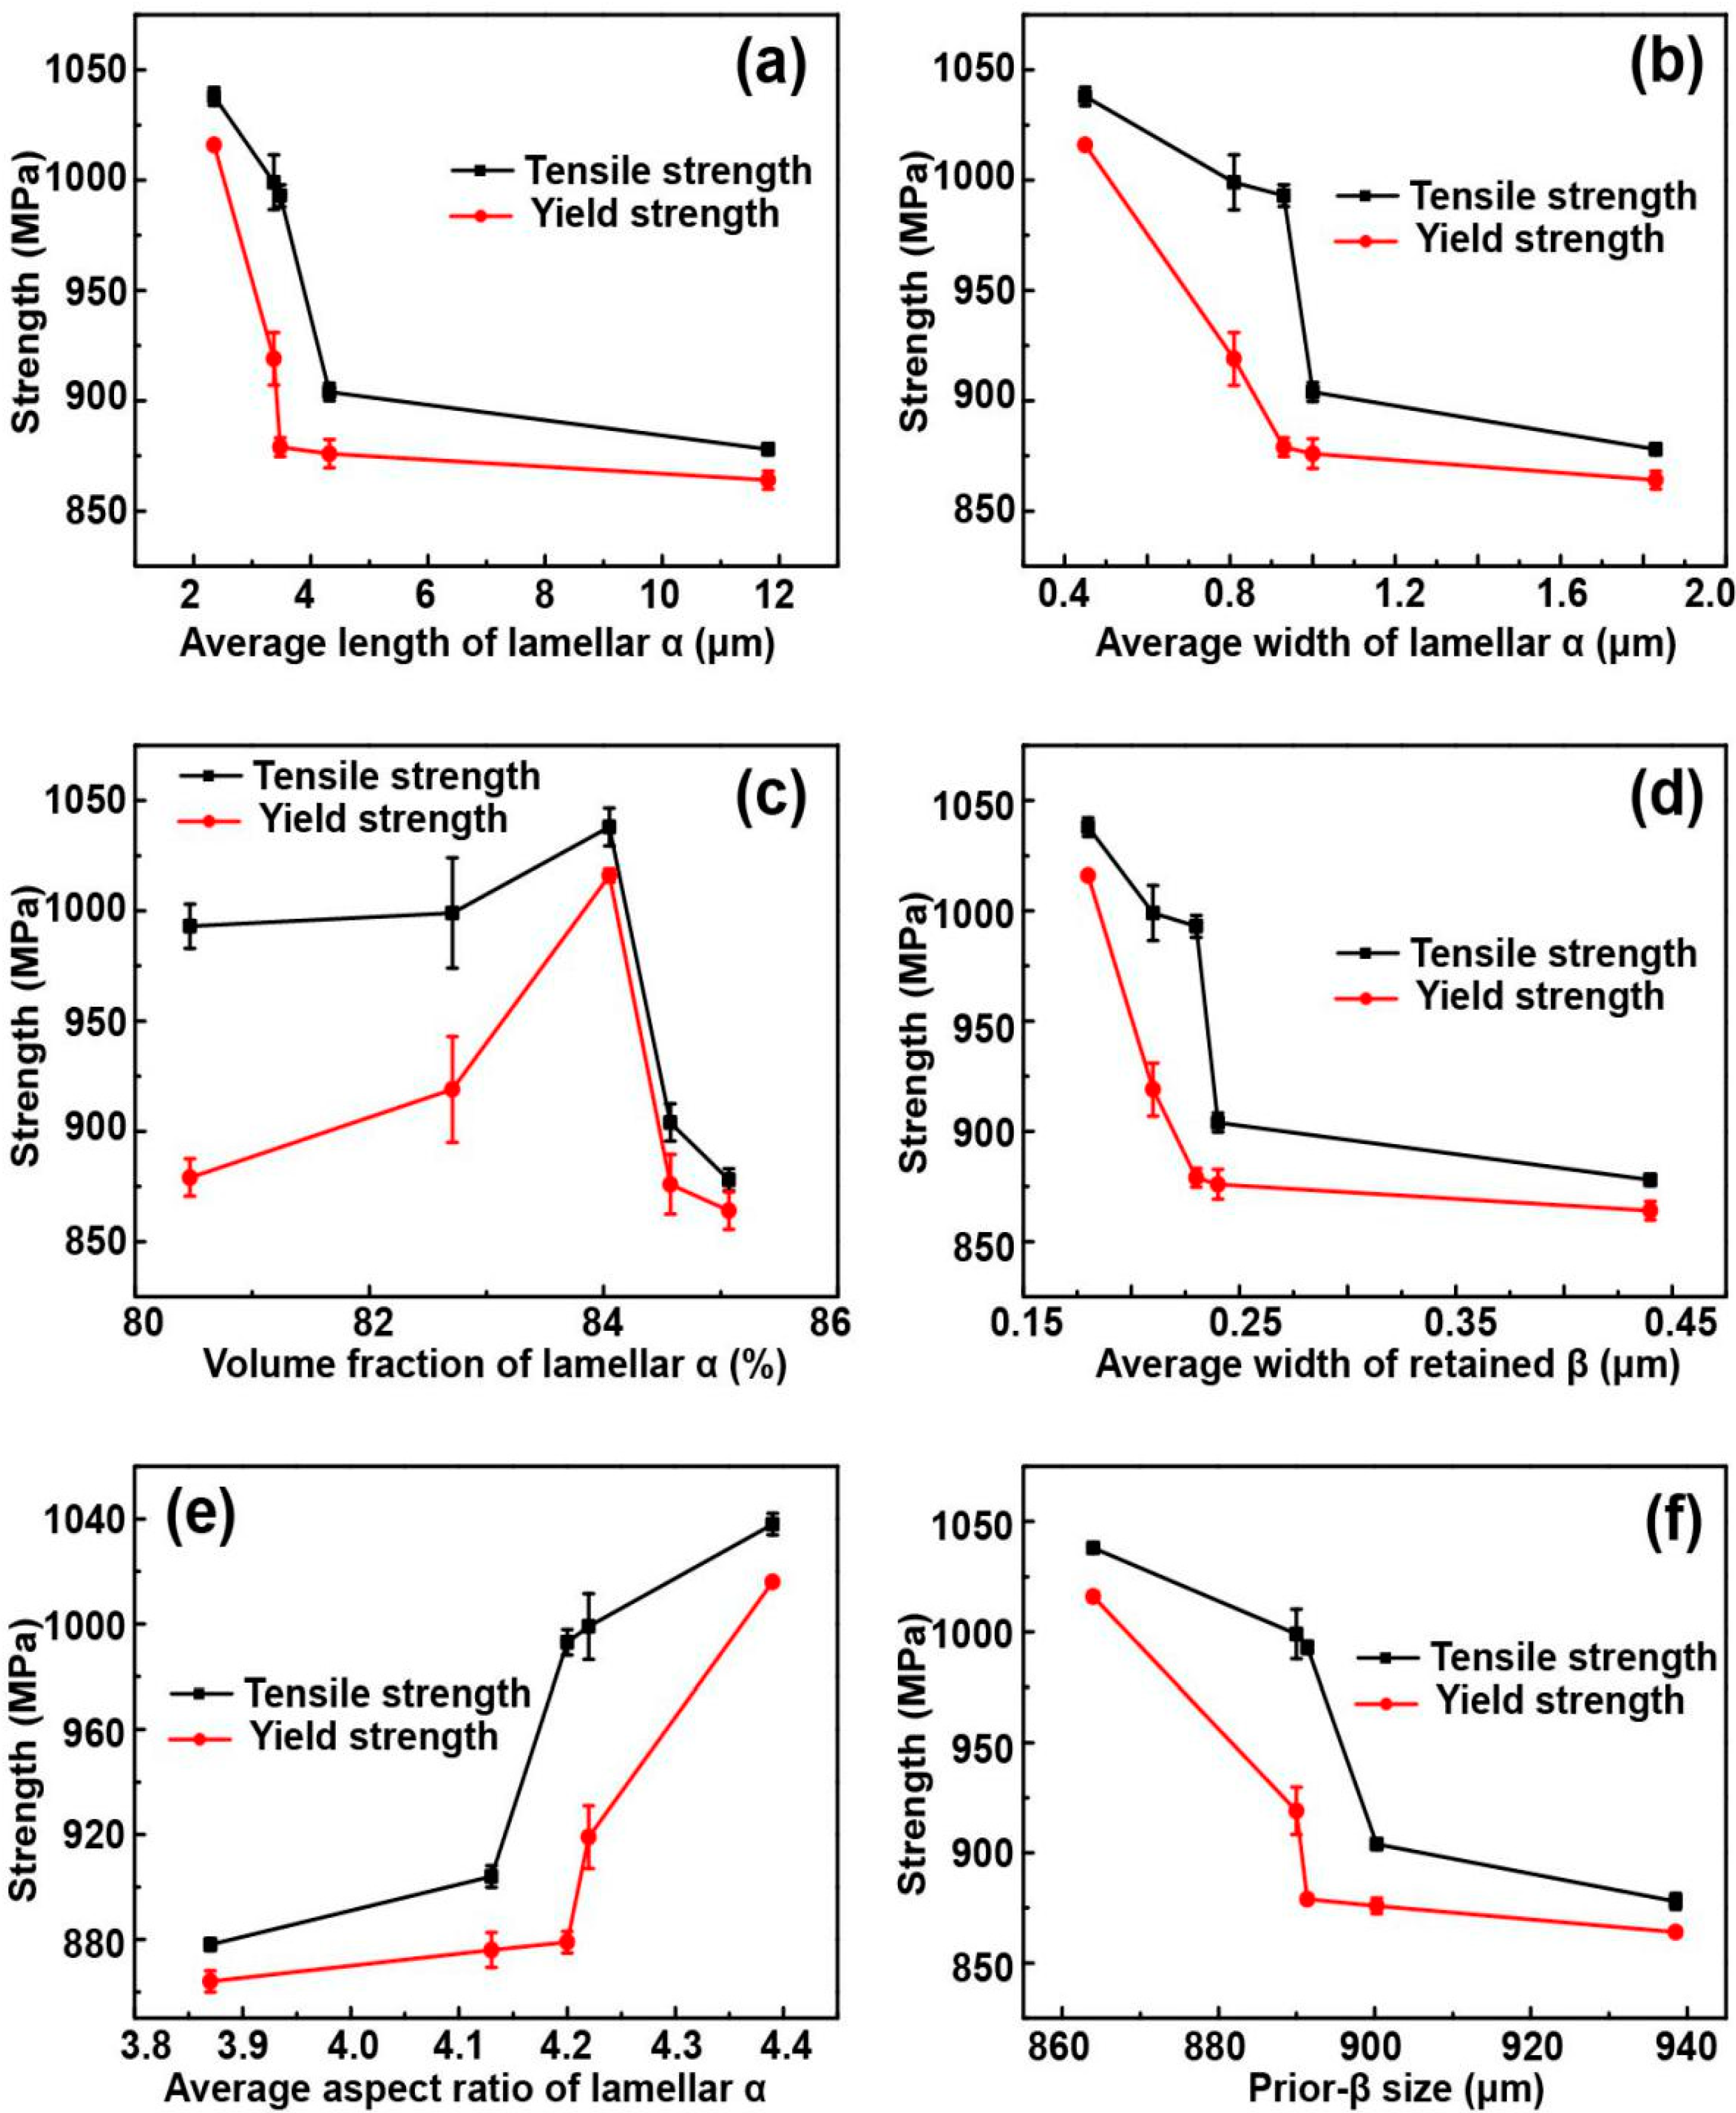
3.3. Discussion on Correlation between Microstructure and Mechanical Properties

Figure 13 depicts the correlation between microstructural features and strength. Tensile and yield strength decreased as the length and width of α, the width of the retained β, and the prior-β size increased. However, tensile and yield strength increased with the aspect ratio of α. The effect of the α fraction on strength was complicated. The TC4F with ~84 vol % α showed the highest strength values. The α phase strengthening is actually the α/β phase interface strengthening. The large area of the α/β-phase interface contributed to high strength values. In this work, due to differences in α-phase width, a high α-phase fraction did not mean a large area of the α/β-phase interface. The α/β-phase interface could be suggested by the α-fraction-to-width ratio. Figure 14 shows the plots for strength and α-fraction-to-width ratio vs. the α fraction. Variations in strength and α-fraction-to-width ratio were consistent. Therefore, the TC4F with the highest areas of α/β-phase interface had the highest strength value, although the α fraction was not maximal.
Figure 15 depicts the relationship between microstructural features and elongation. The dependence of elongation on the microstructure was not obvious compared to that of strength. Figure 16 shows the relationship between microstructural features and fracture toughness. A coarse lamellar α, wide retained β, and large prior-β grain were beneficial to fracture toughness (see Figure 16a,b,d). The elongated fine-α lamellae might have caused stress concentration at the lamellar tips. The greater the aspect ratio of α was, the lower the fracture toughness that was exhibited (Figure 16e). Fracture toughness changed nonmonotonically with the α fraction. The TC4F with ~84 vol % α exhibited the lowest fracture toughness. The reason for this low fracture toughness could be because it had the highest area of α/β-phase interface.
Therefore, optimal comprehensive mechanical performance could be assessed on the basis of the above analysis. Optimal performance was obtained from Sample 1 with respect to tensile strength, yield strength, elongation, and fracture toughness, which were measured at 999 and 919 MPa, 10.4%, and 94.4 MPa·m1/2, respectively. Performance was generated by β-annealing at 1005 °C for 70 min, followed by air cooling to room temperature, aging at 722 °C for 2 h, and air cooling to room temperature again (treatment for Sample 1).
Figure 17 compares the combinations of yield strength/fracture toughness of the heat-treated samples in this work with BASCA heat-treated TC4 [24]. The fracture toughness of TC4F was superior to that of TC4. The fracture toughness of BASCA heat-treated TC4 was below 80 MPa·m1/2, while the fracture toughness of TC4F could reach 110 MPa·m1/2. This further demonstrates that fracture toughness was improved in TC4F through the addition of Fe. Thus, the TC4F shows promise in marine and aeronautical applications.

4. Conclusions

1. The heat-treatment procedure had a significant effect on the microstructure. A higher aging temperature facilitated the growth of the α phase. The cooling period after solution treatment mainly affected the size of the precipitated α phase during the subsequent aging process. The higher the cooling rate was, the smaller the α-phase size was.
2. Aging temperature and cooling rate had an impact on mechanical properties. High aging temperatures and low cooling rates led to low strength, and high plasticity and fracture toughness.
3. Tensile and yield strength decreased as the length and width of α, the width of retained β, and prior-β size increased. However, strengths increased with the aspect ratio of lamellar α. Fracture toughness showed the opposite tendency, that is, it increased as the length and width of α, the width of the retained β, and prior-β size increased, and as the aspect ratio of lamellar α decreased. The effect of the α fraction on strength and fracture toughness was complex. The TC4F alloy with ~84 vol % α exhibited the highest strength and lowest fracture toughness because it had the highest area of α/β-phase interface. The dependence of plasticity on the microstructure was not obvious compared to that of the strength and fracture toughness.
4. Optimal comprehensive mechanical performance was achieved via β-annealing at 1005 °C for 70 min, followed by air cooling to room temperature, aging at 722 °C for 2 h, and air cooling to room temperature again. Tensile strength, yield strength, elongation, and fracture toughness reached values of 999 and 919 MPa, 10.4%, and 94.4 MPa·m1/2, respectively.

Author Contributions

Conceptualization, H.C. and Y.C.; methodology, F.C. and G.X.; validation, F.C. and G.X.; formal analysis, Y.L.; investigation, Y.L.; data curation, Y.L.; writing—original-draft preparation, Y.L.; writing—review and editing, F.C.; visualization, F.C. and G.X.; project administration, Y.C. and H.C.; funding acquisition, F.C. and H.C. All authors have read and agreed to the published version of the manuscript.

Funding

This research was funded by the National Natural Science Foundation of China, grant number 51801101; and by the Primary Research and Development Plan of Jiangsu Province, grant number BE2019119.

Conflicts of Interest

The authors declare no conflict of interest.

References

  1. Leyens, C. Advanced materials and coatings for future gas turbine applications. In Proceedings of the 24th International Congress of the Aeronautical Sciences, Yokohama, Japan, 29 August–3 September 2004. [Google Scholar]
  2. Nalla, R.K.; Ritchie, R.O.; Boyce, B.L.; Campbell, J.P.; Peters, J.O. Influence of microstructure on high-cycle fatigue of Ti-6Al-4V: Bimodal vs. lamellar structures. Metall. Mater. Tran. A 2002, 33, 899–918. [Google Scholar] [CrossRef]
  3. Kermanpur, A.; Amin, H.S.; Ziaei-Rad, S.; Mosaddeghfar, M. Failure analysis of Ti-6Al-4V gas turbine compressor blades. Eng. Fail. Anal. 2008, 15, 1052–1064. [Google Scholar] [CrossRef]
  4. Leyens, C.; Peters, M. Titanium and Titanium Alloys: Fundamentals and Applications; Wiley-VCH: Weinheim, Germany, 2003. [Google Scholar]
  5. Sen, I.; Tamirisakandala, S.; Miracle, D.B.; Ramamurty, U. Microstructural effects on the mechanical behavior of B-modified Ti–6Al–4V alloys. Acta Mater. 2007, 55, 4983–4993. [Google Scholar] [CrossRef]
  6. Meier, M.L.; Lesuer, D.R.; Mukherjee, A.K. The effects of the α/β phase proportion on the superplasticity of Ti-6Al-4V and iron-modified Ti-6Al-4V. Mater. Sci. Eng. A 1992, 154, 165–173. [Google Scholar] [CrossRef]
  7. Fuwen, C.; Yulei, G.; Guanglong, X.; Yuwen, C.; Hui, C.; Lian, Z. Improved fracture toughness by microalloying of Fe in Ti-6Al-4V. Mater. Design. 2020, 185, 108251. [Google Scholar]
  8. Shen, G.; Furrer, D. Manufacturing of aerospace forgings. Mater. Process. Tech. 2000, 98, 189–195. [Google Scholar] [CrossRef]
  9. Liu, C.; Liu, D.; Zhang, X.; Liu, D.; Ma, A.; Ao, N.; Xu, X. Improving fatigue performance of Ti-6Al-4V alloy via ultrasonic surface rolling process. Mater. Sci. Tech. 2019, 35, 1555–1562. [Google Scholar] [CrossRef]
  10. Carroll, B.E.; Palmer, T.A.; Beese, A.M. Anisotropic tensile behavior of Ti–6Al–4V components fabricated with directed energy deposition additive manufacturing. Acta Mater. 2015, 87, 309–320. [Google Scholar] [CrossRef]
  11. Baufeld, B.; Van der Biest, O.; Gault, R. Additive manufacturing of Ti–6Al–4V components by shaped metal deposition: Microstructure and mechanical properties. Mater Design. 2010, 31, S106–S111. [Google Scholar] [CrossRef]
  12. Tan, X.; Kok, Y.; Tan, Y.J.; Descoins, M.; Mangelinck, D.; Tor, S.B.; Leong, K.F.; Chua, C.K. Graded microstructure and mechanical properties of additive manufactured Ti–6Al–4V via electron beam melting. Acta Mater. 2015, 97, 1–16. [Google Scholar] [CrossRef]
  13. Zhao, X.; Li, S.; Zhang, M.; Liu, Y.; Timothy, B.; Wang, S.; Hao, Y.; Yang, R.; Murr, L.E. Comparison of the microstructures and mechanical properties of Ti–6Al–4V fabricated by selective laser melting and electron beam melting. Mater. Design. 2016, 95, 21–31. [Google Scholar] [CrossRef]
  14. Harun, W.S.W.; Manam, N.S.; Kamariah, M.S.I.N.; Sharif, S.; Zulkifly, A.H.; Ahmad, I.; Miura, H. A review of powdered additive manufacturing techniques for Ti-6Al-4V biomedical applications. Powder Technol. 2018, 331, 74–97. [Google Scholar] [CrossRef]
  15. Bermingham, M.J.; McDonald, S.D.; StJohn, D.H.; Dargusch, M.S. Segregation and grain refinement in cast titanium alloys. Int. J. Mater. Res. 2009, 24, 1529–1535. [Google Scholar] [CrossRef]
  16. Lütjering, G.; Williams, J.C. Titanium; Springer Science & Business Media: Berlin/Heidelberg, Germany, 2007. [Google Scholar]
  17. Donachie, M.J. Titanium: A Technical Guide; ASM International: Cleveland, OH, USA, 2000. [Google Scholar]
  18. Banerjee, S.; Mukhopadhyay, P. Phase Transformations: Examples from Titanium and Zirconium Alloys; Elsevier: Amsterdam, The Netherlands, 2007. [Google Scholar]
  19. Guo, P.; Zhao, Y.; Zeng, W.; Hong, Q. The effect of microstructure on the mechanical properties of TC4-DT titanium alloys. Mat. Sci. Eng. A. 2013, 563, 106–111. [Google Scholar] [CrossRef]
  20. Securities Association of China (SAC). Method of β Transus Temperature Determination of Titanium Alloys; Securities Association of China: Beijing, China, 2010. [Google Scholar]
  21. Boyer, R.R. Titanium and Its Alloys: Metallurgy, Heat Treatment and Alloy Characteristics. Encyclopedia of Aerospace Engineering; John Wiley & Sons, Ltd.: Hoboken, NJ, USA, 2010. [Google Scholar]
  22. American Society for Testing and Materials (ASTM). Standard Test Methods for Tension Testing of Metallic Materials; American Society for Testing and Materials International: West Conshohocken, PA, USA, 2009. [Google Scholar]
  23. American Society for Testing and Materials (ASTM). Standard Test Method for Linear-Elastic Plane-Strain Toughness KIC of Metallic Materials; American Society for Testing and Materials International: West Conshohocken, PA, USA, 2006. [Google Scholar]
  24. Welsch, G.; Boyer, R.; Collings, E.W. Materials Properties Handbook: Titanium Alloys; ASM International: West Conshohocken, PA, USA, 1993. [Google Scholar]
Figure 1. Optical-microscope (OM) image of as-received TC4F.
Metals 10 00854 g001
Figure 2. OM images of TC4F after treatment. Samples (a) 1, (b) 2, (c) 3, (d) 4 and (e) 5.
Metals 10 00854 g002
Figure 3. Phase-indexing image of Sample 4 after heat treatment taken by electron backscatter diffraction (EBSD). Regions with hexagonal close-packed (HCP) Kikuchi diffraction pattern identified as α phase and represented in blue; those with body-centered cubic (BCC) pattern identified as β phase and represented in red.
Metals 10 00854 g003
Figure 4. Backscattered scanning-electron-microscope (SEM) images of TC4F after treatment. Samples (a) 1, (b) 2, (c) 3, (d) 4, and (e) 5. Dark lamellar areas, α phase; light ones, β phase.
Metals 10 00854 g004
Figure 5. Distribution of microstructural features of TC4F Sample 1 after treatment. (a) Length of lamellar α, (b) width of lamellar α, (c) width of retained β, and (d) aspect-ratio distribution of lamellar α. Microstructural features followed Gaussian distribution. Most probable values of α length, width, aspect ratio, and retained β were ~4, ~0.85, ~5, and ~0.175 μm, respectively.
Metals 10 00854 g005
Figure 6. Distribution of microstructural features of TC4F Sample 2 after treatment. (a) Length of lamellar α, (b) width of lamellar α, (c) width of retained β, and (d) aspect-ratio distribution of lamellar α. Microstructural features followed Gaussian distribution. Most probable values of α length, width, aspect ratio, and retained β were ~3, ~0.9, ~3, and ~0.25 μm, respectively.
Metals 10 00854 g006
Figure 7. Distribution of microstructural features of TC4F Sample 3 after treatment. (a) Length of lamellar α, (b) width of lamellar α, (c) width of retained β, and (d) aspect-ratio distribution of lamellar α. Microstructural features followed Gaussian distribution. Most probable values of α length, width, aspect ratio, and retained β were ~2, ~0.45, ~4, and ~0.20 μm, respectively.
Metals 10 00854 g007
Figure 8. Distribution of microstructural features of TC4F Sample 4 after treatment. (a) Length of lamellar α, (b) width of lamellar α, (c) width of retained β, and (d) aspect-ratio distribution of lamellar α. Microstructural features followed Gaussian distribution. Most probable values of α length, width, aspect ratio, and retained β were ~3, ~1.2, ~4, and ~0.20 μm, respectively.
Metals 10 00854 g008
Figure 9. Distribution of microstructural features of TC4F Sample 5 after treatment. (a) Length of lamellar α, (b) width of lamellar α, (c) width of retained β, and (d) aspect-ratio distribution of lamellar α. Microstructural features followed Gaussian distribution. Most probable values of α length, width, aspect ratio, and retained β were ~10, ~2.0, ~4, and ~0.4 μm, respectively.
Metals 10 00854 g009
Figure 10. Statistical microstructural features of TC4F after heat treatments. (a) Average length of lamellar α, (b) average width of lamellar α and retained β, (c) volume fraction of lamellar α, and (d) average prior-β size.
Metals 10 00854 g010
Figure 11. Mechanical properties of TC4F after heat treatments. (a) Strength, (b) elongation, and (c) fracture toughness.
Metals 10 00854 g011
Figure 12. SEM images of fracture surface of heat-treated TC4F. Samples (a) 1, (b) 2, (c) 3, (d) 4, and (e) 5.
Metals 10 00854 g012
Figure 13. Variations in strength and microstructural features. (a) Average length, (b) average width, and (c) volume fraction of lamellar α; (d) average width of retained β; (e) average aspect ratio of lamellar α; (f) prior-β size.
Metals 10 00854 g013
Figure 14. (a) Yield strength and α-fraction-to-width ratio varied with volume fraction of lamellar α. (b) Tensile strength and α-fraction-to-width ratio varied with volume fraction of lamellar α. Yield and tensile strengths were more closely related to α-fraction-to-width ratio.
Metals 10 00854 g014
Figure 15. Variations in elongation and microstructural features. (a) Average length, (b) average width, and (c) volume fraction of lamellar α; (d) average width of retained β; (e) average aspect ratio of lamellar α; and (f) prior-β size.
Metals 10 00854 g015
Figure 16. Variations in fracture toughness and microstructural features. (a) Average length, (b) average width, and (c) volume fraction of lamellar α; (d) average width of retained β; (e) average aspect ratio of lamellar α; and (f) prior-β size.
Metals 10 00854 g016
Figure 17. Comparison of mechanical properties BASCA heat-treated TC4F and TC4 [24].
Metals 10 00854 g017
Table 1. Chemical composition of as-received Fe-microalloyed Ti–6Al–4V (TC4F).
TiAlVFeCNOHSi
Balance6.204.140.5370.0200.0200.130.0010.016
Table 2. Heat-treatment procedures.
Sampleβ-Annealing Cooling after β-AnnealingAging Cooling after Aging
11005 °C for 70 minAir cooling to room temperature722 °C for 2 hAir cooling to room temperature
21005 °C for 70 minAir cooling to room temperature732 °C for 2 hAir cooling to room temperature
31100 °C for 40 minWater cooling to room temperature712 °C for 2 hAir cooling to room temperature
41100 °C for 40 minAir cooling to room temperature712 °C for 2 hAir cooling to room temperature
51100 °C for 40 minFurnace cooling to aging temperature712 °C for 2 hAir cooling to room temperature
Table 3. Statistical microstructural features of TC4F after heat treatments.
SampleAverage Width of Lamellar α
/μm
Average Length of Lamellar α
/μm
Average Width of Retained β
/μm
Average Aspect Ratio of Lamellar αVolume Fraction of Lamellar α/%Average Prior-β Size
/μm
10.81 ± 0.023.37 ± 0.210.21 ± 0.044.22 ± 0.1382.71 ± 1.63890.00 ± 2.48
20.93 ± 0.103.48 ± 0.030.23 ± 0.034.20 ± 0.3380.47 ± 1.87891.39 ± 4.32
30.45 ± 0.052.35 ± 0.500.18 ± 0.014.39 ± 0.3284.05 ± 0.96863.97 ± 7.23
41.00 ± 0.044.32 ± 0.600.24 ± 0.024.13 ± 0.1684.57 ± 0.29900.26 ± 6.34
51.83 ± 0.3411.81 ± 0.200.44 ± 0.023.87 ± 0.3785.07 ± 1.16938.53 ± 12.22
Table 4. Tensile properties of TC4F alloy after different heat treatments.
SampleTensile Strength
/MPa
Yield Strength
/MPa
Elongation
/%
Fracture Toughness
/MPa·m1/2
1 999 35 + 15 919 31 + 17 10. 4 2 . 4 + . 3 94. 4 2 . 0 + 7 . 4
2 993 13 + 7 879 8 + 9 10. 7 1 . 5 + 3 . 1 96. 4 5 . 0 + 2 . 1
3 1038 8 + 9 1016 4 + 2 4. 0 1 . 0 + . 8 89. 8 6 . 8 + 2 . 9
4 904 7 + 10 876 18 + 9 5. 8 0 . 7 + 2 . 4 99. 4 7 . 9 + 1 . 7
5 878 5 + 5 864 6 + 11 6. 8 0 . 6 + . 7 109. 9 0 . 9 + . 5

