Article

Assessment of Chip Breakability during Turning of Stainless Steels Based on Weight Distributions of Chips †

1
Department of Materials Science and Engineering, KTH Royal Institue of Technology, Brinellvägen 23, 10044 Stockholm, Sweden
2
Department of R&D, Ovako, 81382 Hofors, Sweden
3
Department of R&D Verification of Component and Material, AB Sandvik Coromant, Mossvägen 10, 81181 Sandviken, Sweden
*
Author to whom correspondence should be addressed.
This paper is an extended version of paper published in the Conference SPS2018, Stockholm, Sweden, 16–18 May 2018.
Metals 2020, 10(5), 675; https://doi.org/10.3390/met10050675
Submission received: 15 April 2020 / Revised: 16 May 2020 / Accepted: 18 May 2020 / Published: 21 May 2020
(This article belongs to the Special Issue Metal Machining—Recent Advances, Applications and Challenges)

Abstract

:
Currently, the available evaluation methods for determining the chip breakability in the industry are mainly based on subjective visual assessment of the chip formation by an operator during machining or on chips that were collected after the tests. However, in many cases, these methods cannot give us accurate quantitative differences for evaluation of the chip breakability of similar steel grades and similar sets of machining parameters. Thus, more sensitive methods are required to obtain more detailed information. In this study, a new method for the objective assessment of chip breakability based on quantitative determination of the weight distribution of chips (WDC) was tested and applied during machining of stainless steels without Ca treatment (316L) and with Ca treatment (316L + Ca). The obtained results show great consistencies and the reliability of this method. By using the WDC method, significant quantitative differences were obtained by the evaluation of chips, which were collected during the machining process of these two similar grades of steel at various cutting parameters, while, visually, these chips look very similar. More specifically, it was found that the Ca treatment of steel can improve the chip breakability of 316L + Ca steel in 80% of cutting trials, since a fraction of small light chips (Type I) from this steel increased and a fraction of large heavy chips (Type III) decreased accordingly. Moreover, the WDCs that were obtained at different cutting parameters were determined and compared in this study. The obtained results can be used for the optimization of chip breakability of each steel at different cutting parameters. The positive effect of Ca treatment of stainless steel was discussed in this study based on consideration of the modification of different non-metallic inclusions and their effect on the chip breakability during machining.

1. Introduction

During the last six decades, steelmakers have developed a considerable amount of new steel grades with low-level impurities, which significantly improved the mechanical properties of steel. However, the production industry also faces the increasing challenge during machining these high-quality steels, because of the increased tool wear, difficult-break chips, and the significantly reduced tool life, which increases the consumption of time, energy, and money in machining operations [1,2].
Non-metallic inclusions (NMIs) play a significant role with respect to the mechanical properties and machinability of steels. Non-metallic inclusions, especially large inclusions, are generally harmful to the property of the steel, by reducing mechanical properties, like toughness, fatigue life, and corrosive resistance, which may increase the failure probability of the final product [3,4]. For example, MnS will result in the anisotropy of mechanical property. It will also provide the origin for fatigue crack and corrosion. [1,5] From another side, because of different properties of NMIs, such as hardness and thermal expansions, as compared to the metal matrix, the NMIs will have different roles during the machining of materials. The effect of different inclusions on machinability characteristics (such as tool life, tool wear, chip breakability, etc.) was evaluated in many studies [1,6,7,8,9,10,11]. For instance, NMIs could act as a source of stress concentrations, which is beneficial for a crack formation making the chip easy to break. However, some hard inclusions will damage the tool surface and increase the tool wear [1,7,12]. It is reported that some NMIs (such as sulfides and Ca modified oxides) are beneficial for improved steel machinability [6,7,8,9,10,11]. These NMIs can help to improve the steel machinability in two ways: (1) as a source of stress concentrations, which decrease the cutting force and increase the chip breakability and (2) as a lubricant (constant tool protection layer) in the contact zone between the cutting tool and material, which reduces the abrasive and chemical wear of the tool and extends the tool life. Thus, it is necessary to modify NMIs in steels during steelmaking to obtain favorable machinability properties, while the mechanical properties are not affected in a negative manner.
Machinability is a complex concept that can be described by a wide range of parameters and factors. A large number of criteria, such as tool wear (TW), tool life (TL), cutting forces (CF), chip characteristics (CC), and surface roughness (SR), have been developed to evaluate the machinability of different workpiece materials [1]. Among them, chip breakability has an important impact on the easiness and operation of the machining process. If long composite chips, which combine distinct size and shape chip segments, are obtained in the machining, the production efficiency will be threatened when chips stuck in the rotating cutting tool or the chuck. Thus, chips with shapes, like short broken corkscrews or spirals, are preferred during the machining operation [13]. Chip breakage can take place in three different stages. Chip breakage for a material with a low ductility is preferred to take place during the chip formation phase. If the material has a low mechanical strength, chip breakage is more likely to happen during the chip curl phase. Additionally, when the formed chip is long and contacted with the workpiece surface or tool flank face, it is possible to break [14].
Today, there are several methods for evaluating the chip breakability. One common method that is applied in the industry is to use chip breaking curves made by visual inspections during the longitudinal turning operation. The operators defined the transition point between acceptable and unacceptable chip breakages, based on their subjective experience. Another test is the chip chart, which suggests appropriate cutting parameters to obtain a satisfactory chip breakage, which is supplied from the cutting tool companies [13]. Photos of chips that are collected from different cutting parameters are put together and compared. There are some other complex evaluation methods to determine the chip breakability, like a fuzzy rule-based system, to describe chip breakability performance [15]. However, when it comes to the problem of the sensitive quantitative comparison of similar steel grades (such as modified steels and reference steels) or during optimization of chip breakability of steel at different cutting parameters, the results from these methods often look quite similar. Therefore, it is difficult to conclude which of the two materials that has the better chip breakability or to decide the optimized machining parameters. In the previous study [16], a quantitative method of evaluation of chip breakability, which was based on measurement of weight distribution of chips (WDC) obtained during machining of two similar stainless steels, was tested. The obtained results showed a clear difference in chip breakability for investigated steels. However, the weight of chips during machining depends not only on the quality of steel, but also on the method and parameters of machining (such as the cutting speed, feed rate, and cutting depth). Therefore, only the measurement of WDC cannot be applied for the accurate evaluation and comparison of chip breakability in the cases when the machining is carried out at different parameters. Thus, more systematic investigations are necessary in order to improve the accurate quantitative assessment of chip breakability of steels during machining at different parameters.
The present study aims to develop and test a sensitive and quantitative evaluation method that is based on measurements of the chip weights to estimate the chip breakability of different steels and comparison of obtained results with the results obtained by using the standard chip charts. Here, the weight distributions of chips that were obtained at different cutting parameters were investigated and compared for industrial 316 stainless steels produced without and with Ca-treatment.

2. Materials and Methods

2.1. Workpiece Materials and Cutting Tool

This study investigated one Ca treated 316L continuous casting stainless steel (316L + Ca) and one reference stainless steel without Ca treatment (316L) from industrial trials. The only difference between the two trials is that there was a CaSi wire addition at the end of ladle treatment for the 316L + Ca steel. Their chemical compositions are given in Table 1. The results of mechanical tests and impact tests show that there is no significant difference in mechanical properties between the two materials (around +2.2% for Young’s modulus and +10% for impact test in the transversal direction for 316L + Ca steel as compared to 316L steel).
CNMG120408-MM 2025 cemented carbide inserts (Sandvik Coromant, Gimo, Sweden), with CVD coating (Ti (C, N) + Al2O3 + TiN), were used for the machining testings.

2.2. Conventional Evaluations of Chip Breakability

Conventional chip breakability evaluations were conducted during longitudinal turnings for 36 operations in two different cutting speeds (130 m/min and 180 m/min). A flood coolant (7–9% Hocut 4160 Emulsion, Barcelona, Spain) was applied during the turning test.
The first six operations were used for the visual inspection to make chip breaking curves with six different cutting depths (ap = 0.5, 0.75, 1, 2, 3, and 4 mm). It was started with the first fixed depth of cut (0.5 mm), then the feed rate was slowly increased until chips changed from long chips to short chips, and then this feed rate was recorded. Subsequently, the depth of cut was increased to the next one and increased the feed slowly again. Repeat the previous operations for all six depths of cuts. Afterwards, a chip breaking curve was drawn with ap versus fn.
The next 30 operations were used for making chip charts. Each operation corresponded to one combination of the following machining parameters shown in Table 2.
Broken chips from each set of cutting parameters were collected by a collector close to the cutting operation during the adequate time for a representative amount separately. Subsequently, photographs for each set of chips were placed in a chart with fn as the x-axis and ap as the y-axis. In addition, based on visual subjective evaluation of the operator, all sets of short chips, which have one arc or two and more connected arcs, were marked as acceptable.

2.3. Chip Weight Measurement

The chips that were obtained from longitudinal turnings with similar sizes and shapes in the chip charts were compared by weight in this study. For each set of cutting parameters, more than 100 chips were randomly collected and weighted individually. An analytical balance with yield readability to four decimal places to the right of the decimal point (up to 0.0001 g) was applied for measurements. The chips were classified into three groups, according to the weights and shapes. Thereafter, the percentage of the number of each group were calculated and finally summarized.

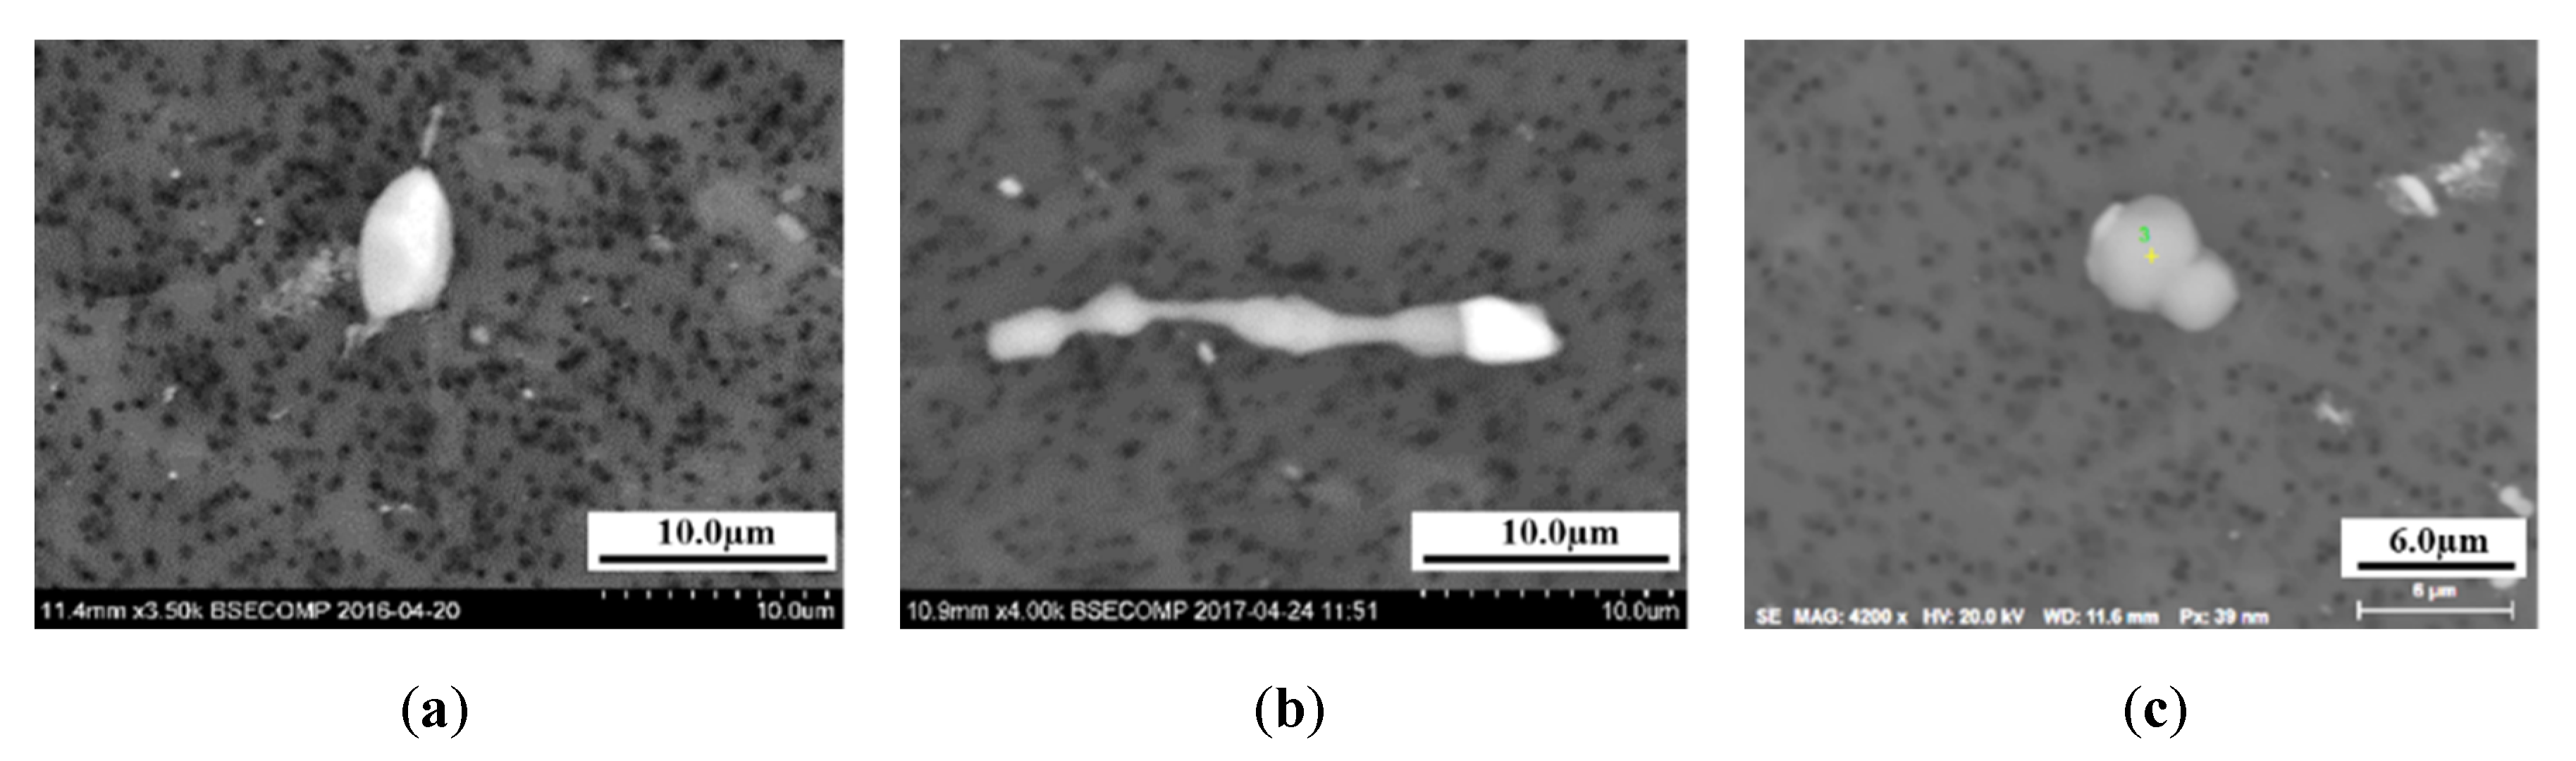
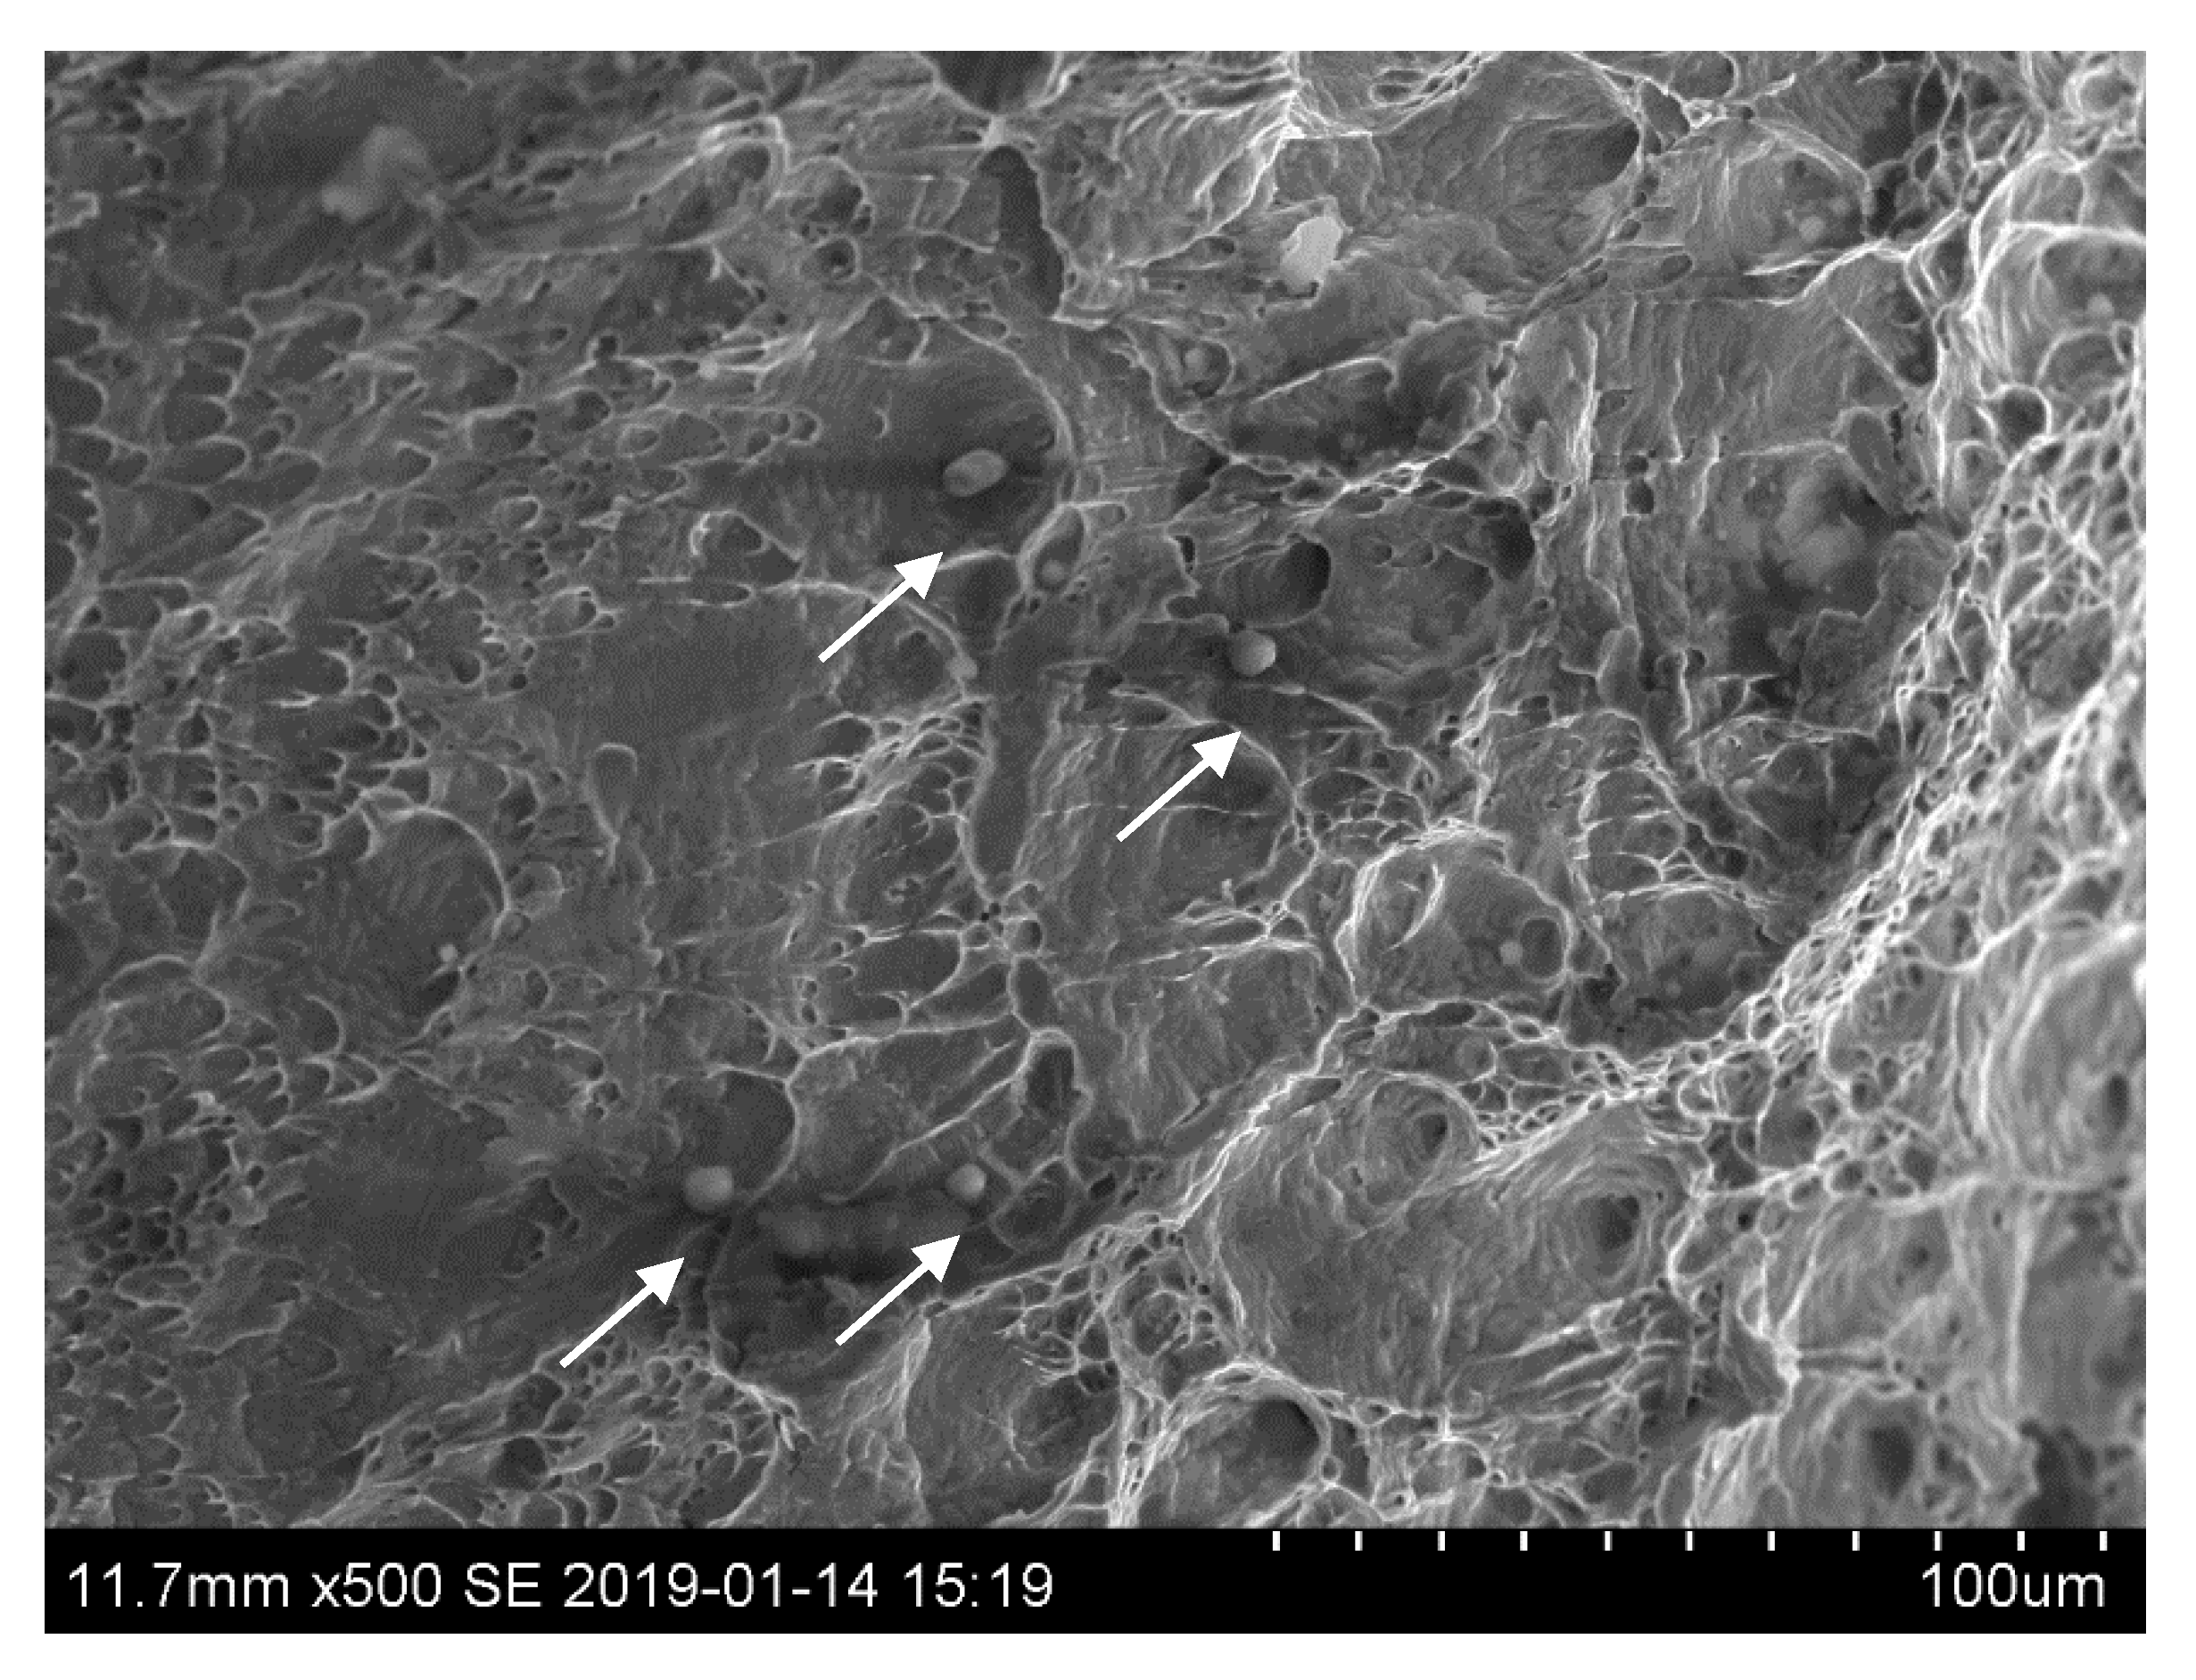
2.4. Investigation of Non-metallic Inclusions

The non-metallic inclusions in the two steels were extracted using electrolytic extraction. During the electrolytic extraction process, the steel samples were partially dissolved, while inclusions did not dissolve. Accordingly, the inclusions were easily collected by a filtration process and investigated using a scanning electron microscope (SEM, S3700N-Hitachi, Hitachi High-Technologies Corporation, Tokyo, Japan) combined with an energy dispersive spectroscopy (EDS, Bruker, Karlsruhe, Germany).
In addition, the fracture sections of chips obtained from the previous cutting tests were also observed by using the SEM (S3700N-Hitachi, Hitachi High-Technologies Corporation, Tokyo, Japan).

3. Results and Discussion

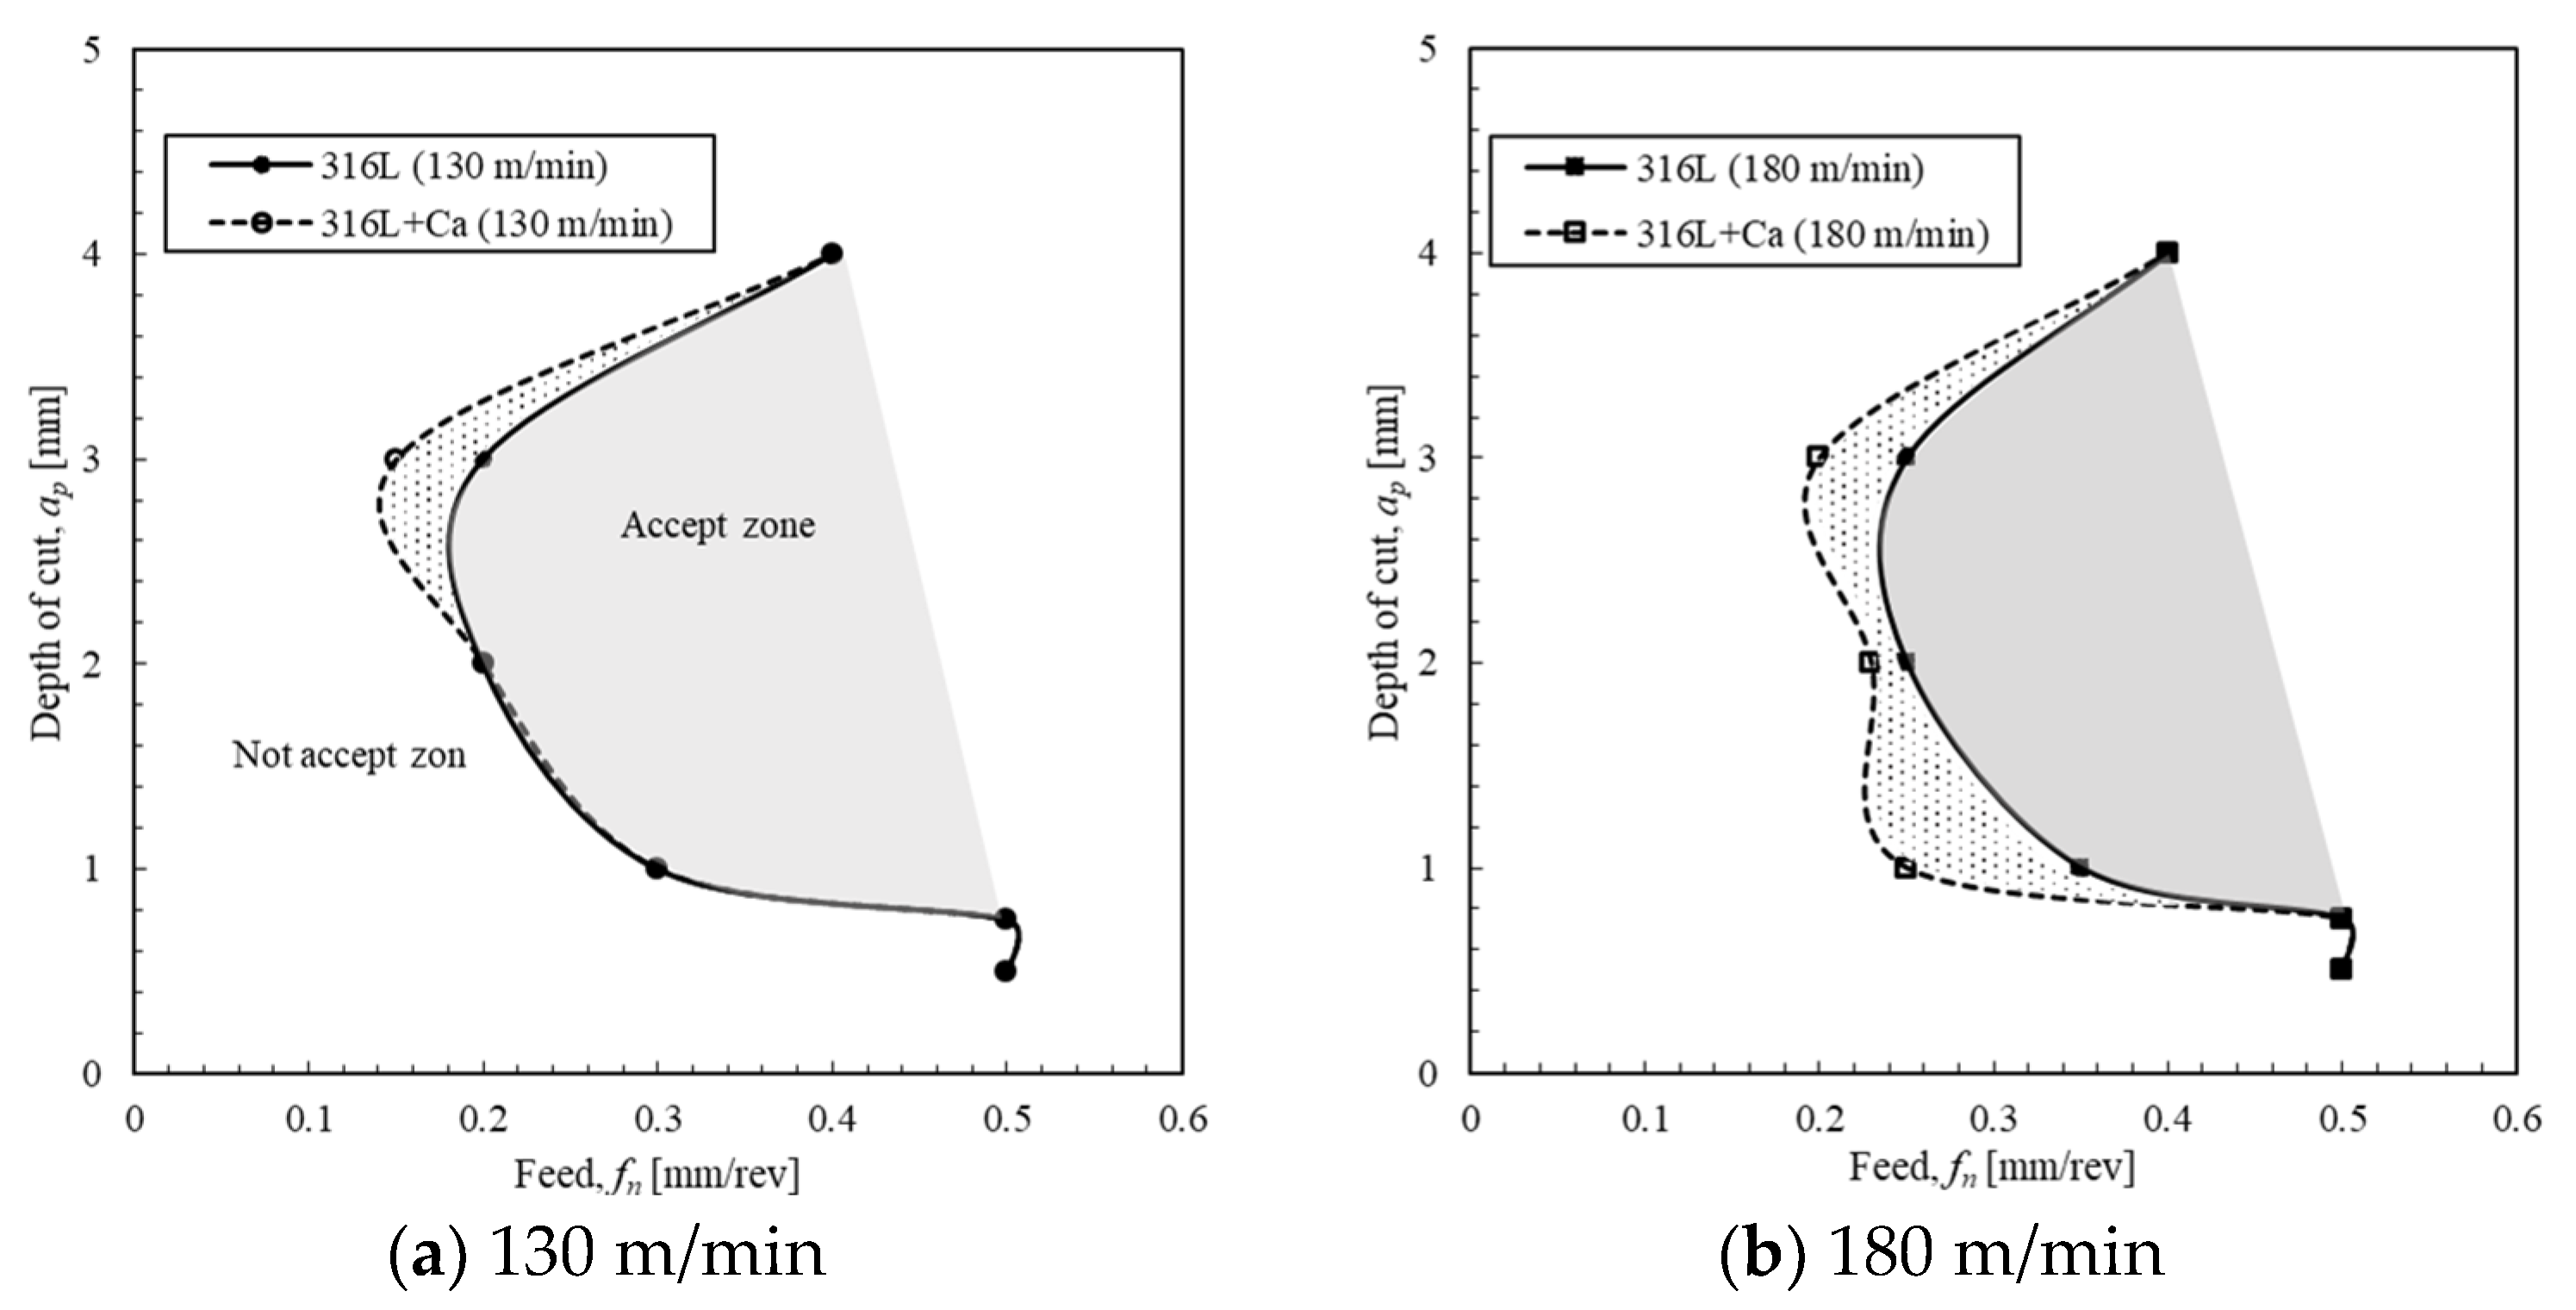
3.1. Evaluations by Conventional Methods

Two different cutting speeds, 130 and 180 m/min, were applied during the longitudinal turnings to study the chip formation ability of the 316L and 316L + Ca steels. Figure 1 shows the chip breaking curves that were obtained at 130 m/min (a) and 180 m/min (b). The point in the graph is the parameter set that the operator thought was a watershed between acceptable chips and unacceptable chips. The right side of the curves in this figure represents good chip formation conditions. From the results of the chip breaking curves, the experimental grade 316L + Ca shows a slightly wider range of cutting parameter combinations (the spotted area) when compared to the reference 316L steel for both cutting speeds. However, for the same cutting parameters in the grey area, the obtained curves cannot show any difference between the two steel grades. In this case, it is difficult to evaluate the differences between the chip breakabilities for the reference and experimental steels at different cutting parameters in the selected area.
Figure 2 shows the results of another chip breakability evaluation method, the chip charts, obtained at a cutting speed of 130 m/min. Chips in the red polygons are acceptable chips. In general, the charts show more detailed information than the chip breaking curves. However, the polygons are visually quite similar, and it is hard to tell the difference between the chips of the reference sample 316L and the experimental 316L + Ca sample based on the same set of cutting parameters. These two steel grades share similar chip breakabilities, according to this chip chart method.
Chips from 5 sets of cutting parameters (blue zone in Figure 2, which were determined from both speeds as being acceptable based on ordinary means) were collected and weighted to better quantitatively evaluate and compare these two materials.

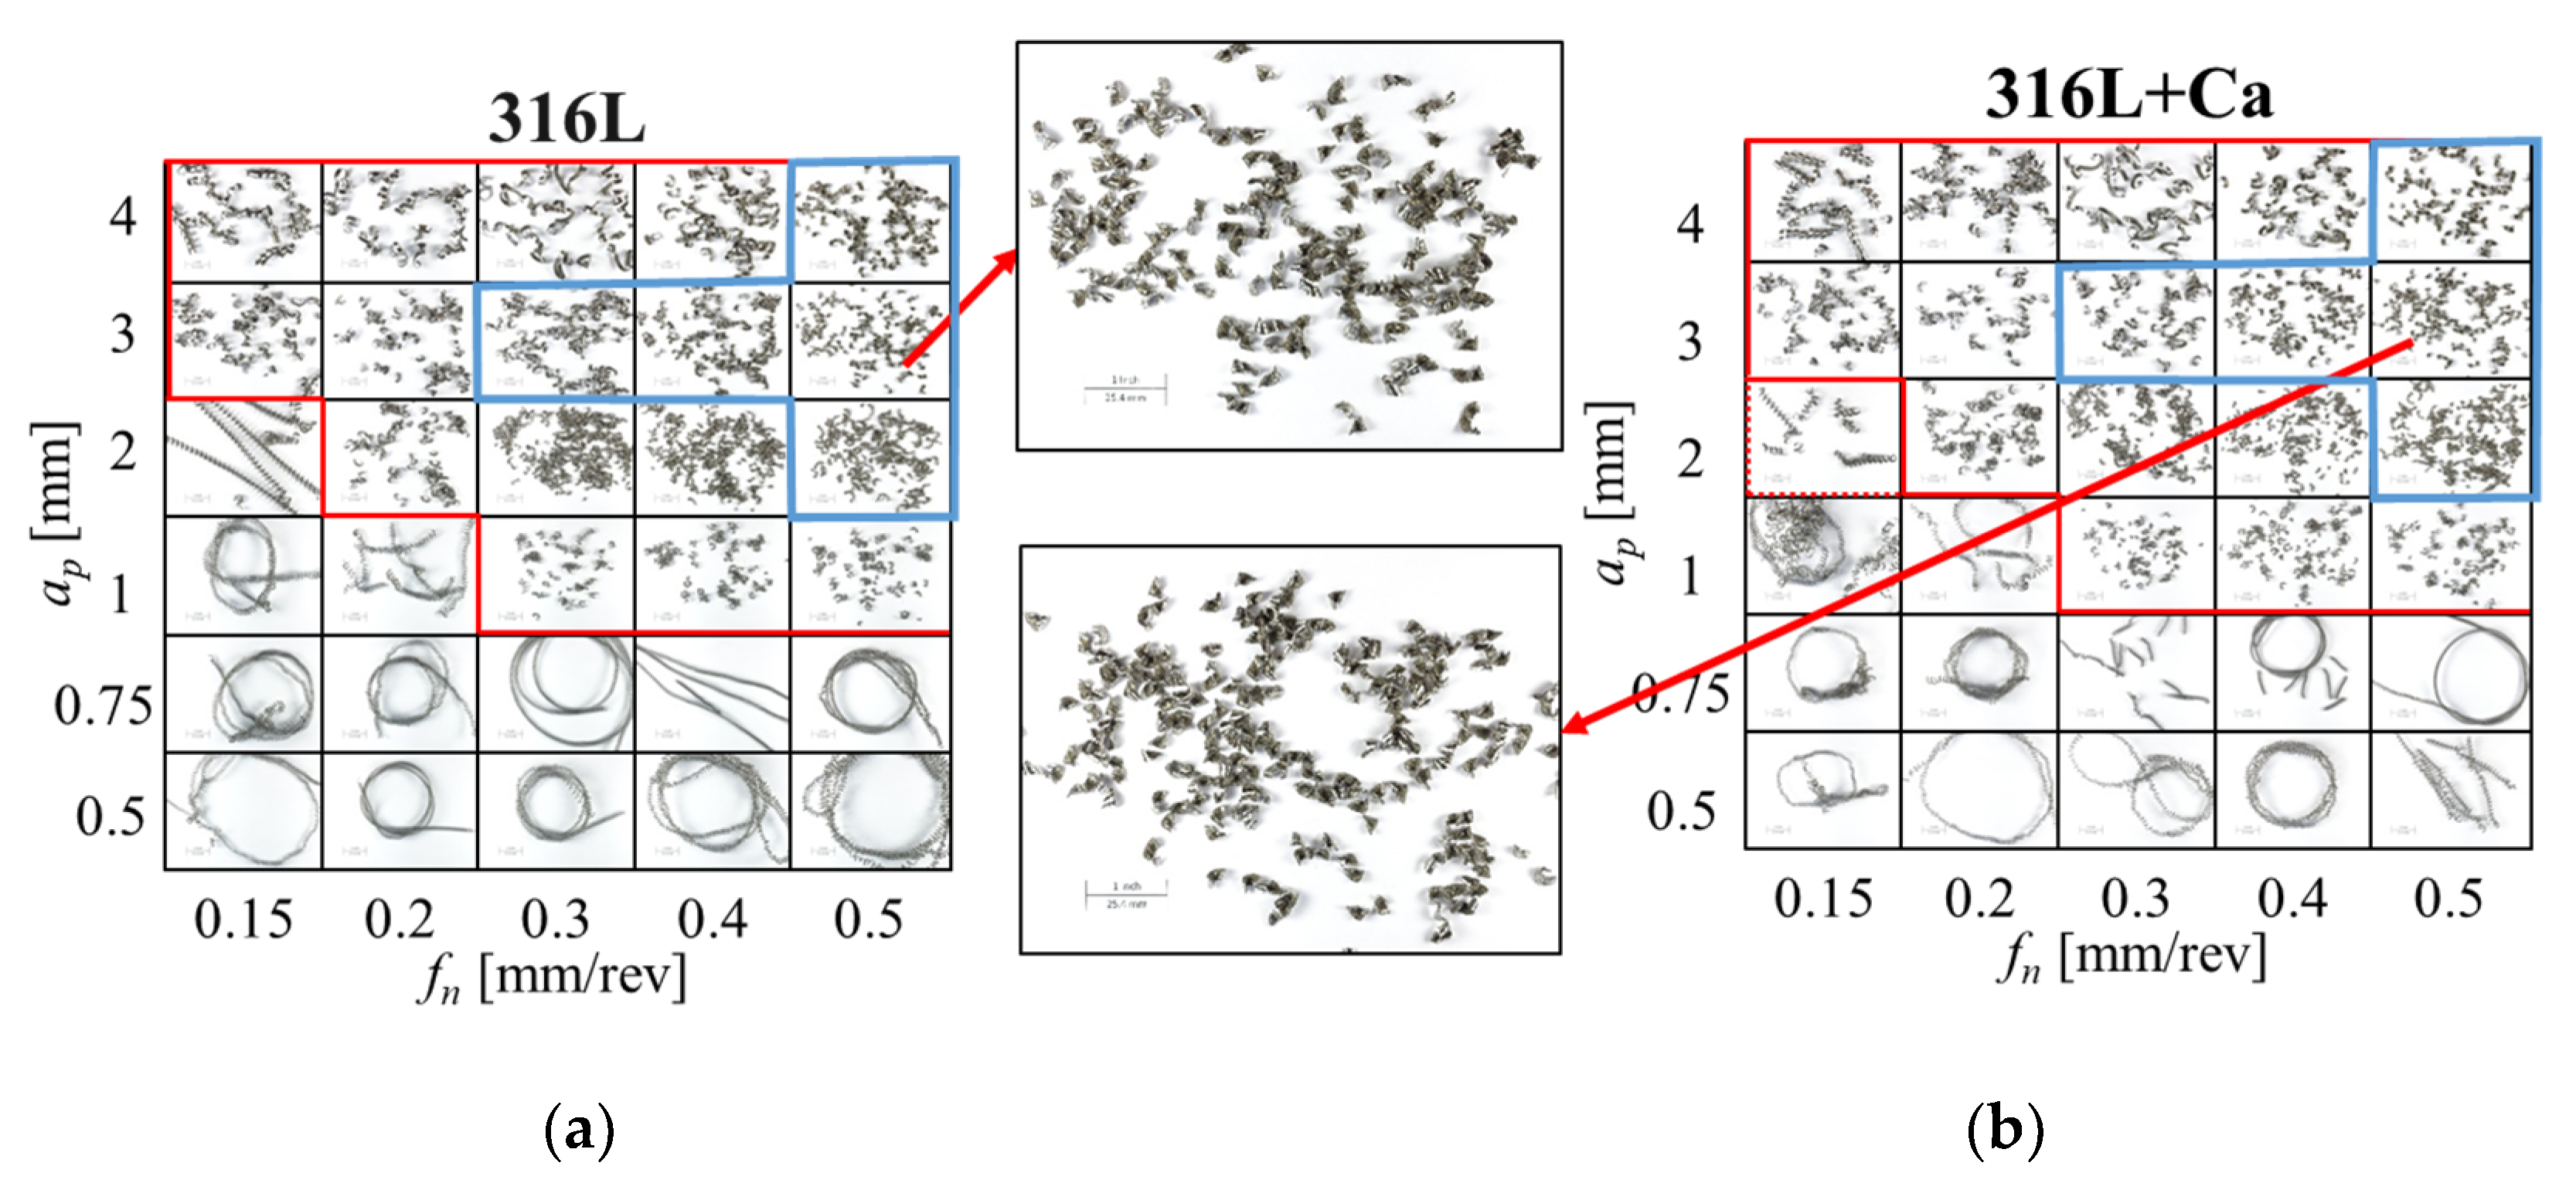
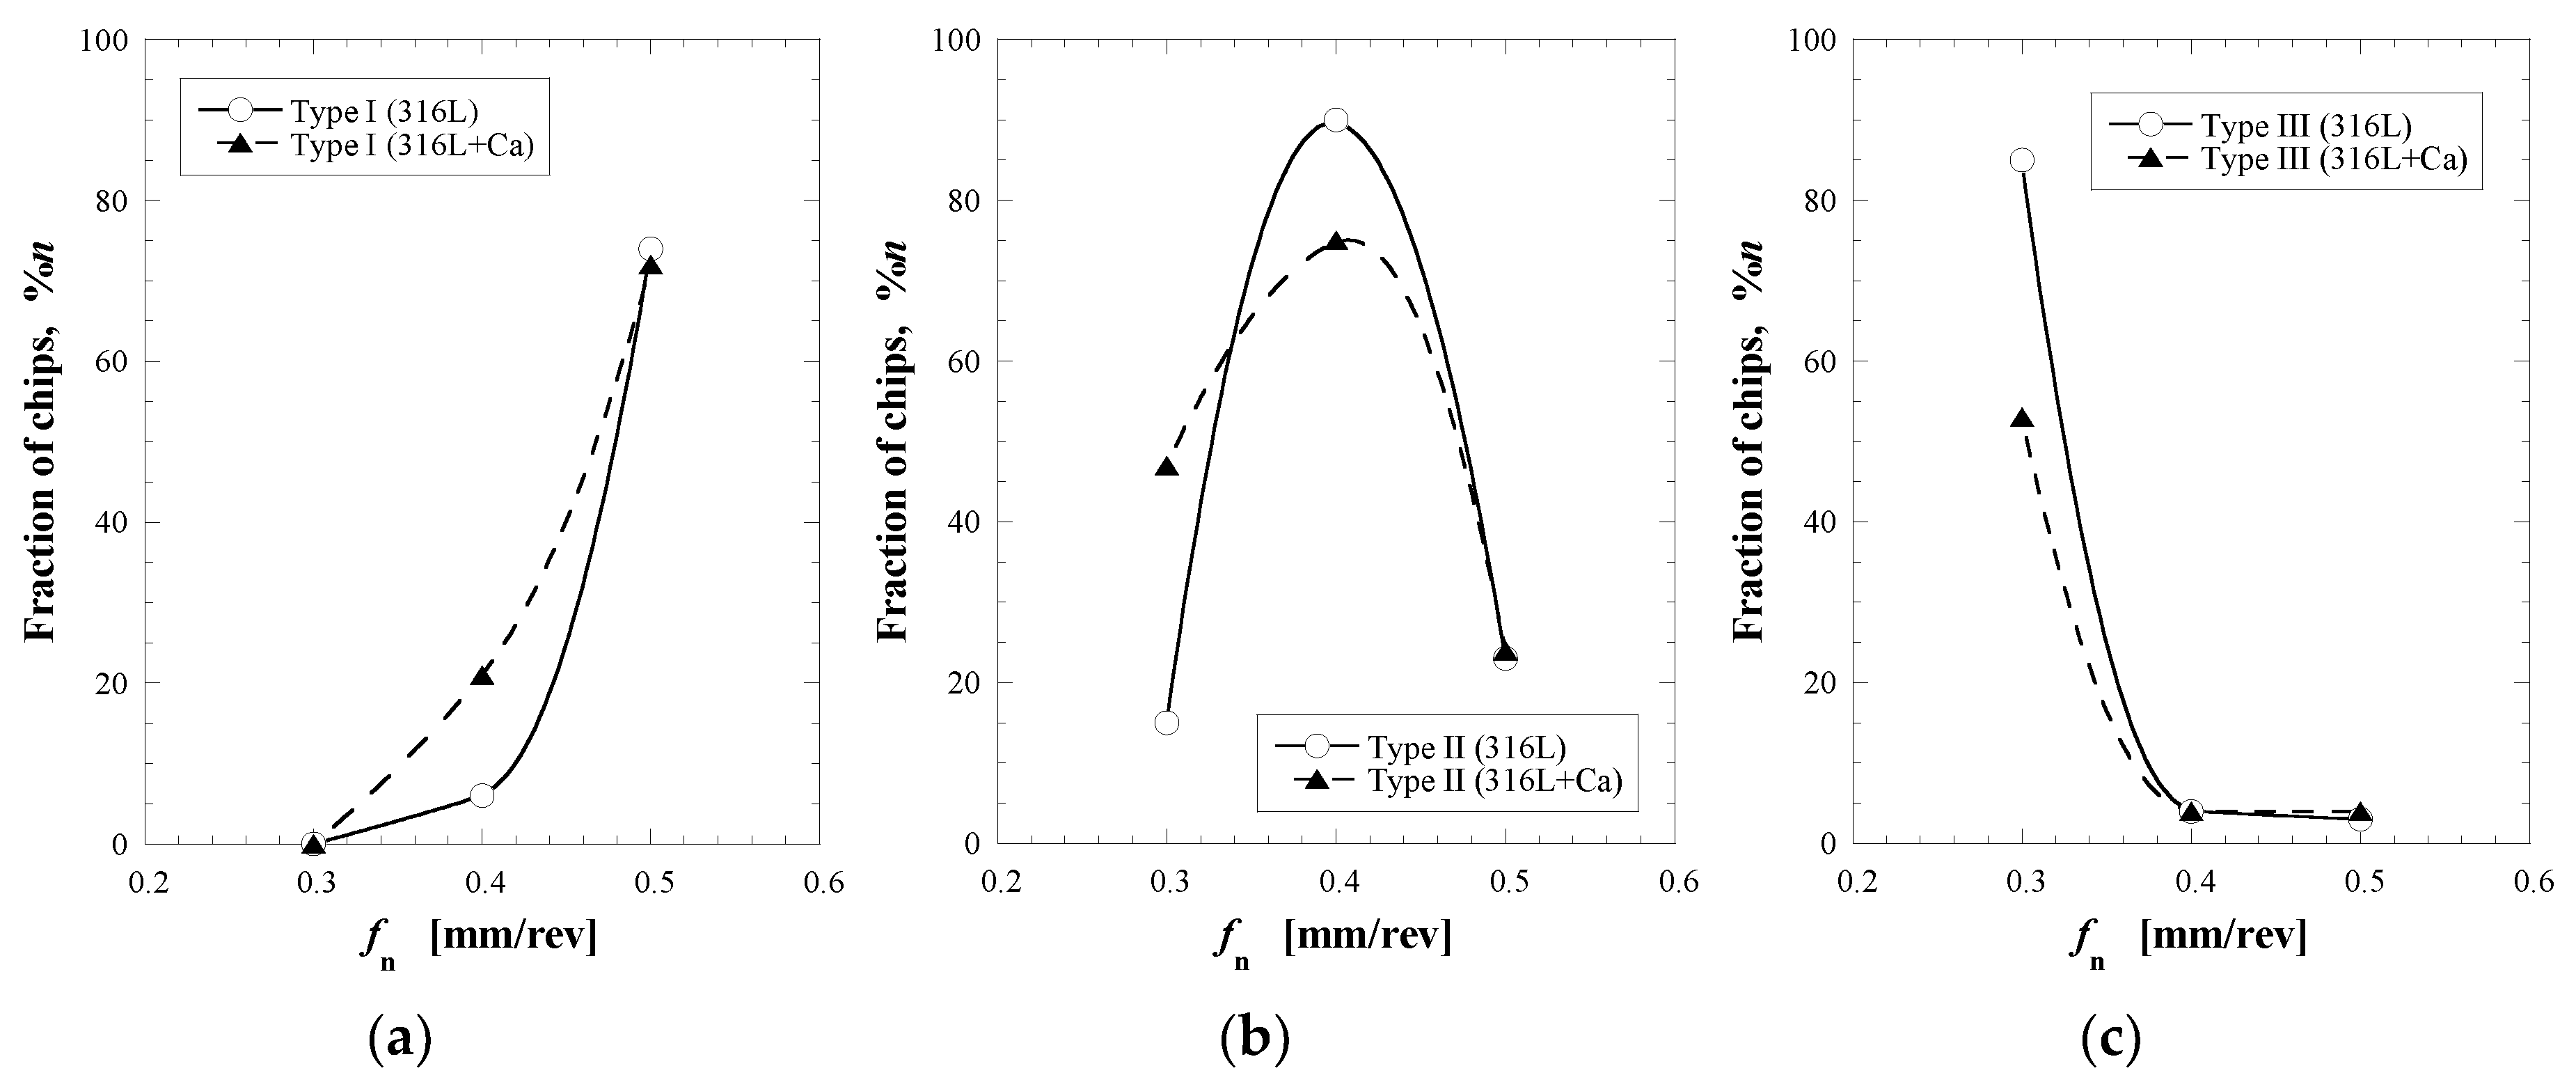
3.2. Classification of Chips

The chips from the accepted area (grey zone in Figure 1), which have good breakability, are mostly the chips with one arc or two and more arcs hard connected in one construction. In this study, a measured weight of each chip was used as a quantitative index for evaluating and comparing the chip breakability. It is apparent that the steel, which has the chips with a small number of arcs and correspondingly a lower weight, has the better chip breakability. Therefore, it can be expected that this steel can have better machinability and lower tool wear, which is beneficial from short broken chips at the selected cutting parameters. The chips could be divided into three groups according to the shapes and weights (as shown in Figure 3): Type I-light chips (<0.2 g) with one arc, Type II-middle chips (0.2–0.4 g) with two-three arcs, and Type III-heavy (>0.4 g) multi-arcs chips, as was classified in the previous study [16].
However, when the feed rate (fn) and cutting depth (ap) change, the thickness and width of chips will also change. As a result, the weight of chips and their corresponding gradation can significantly change. Accordingly, for a quantitative comparison of the chip breakability between different cutting conditions, a unified index should be used. Such an index can be the length of a chip (l) having the same cross-section area (A), which can be determined by using the following equation:
l = Wchip/(ρme·A) = Wchip/(ρme·w·d)
where Wchip is the measured weight of the chip, ρme is the density of the metal chip, A is the undeformed cross-sectional area of the chip, and w and d are the width and depth of the measured chip. In this study, it was assumed that the ρme value is constant for all chips independently on the cutting parameters. The values of w and d cannot be precisely measured for each chip. However, they can approximately be estimated based on the feed rate fn, cutting depth ap and major cutting edge angle κ (the angle between the edge of cutting tools and the longitude direction of role material) using the following equations [13]:
w a p sin κ d f n · sin κ
Hence, the A value can be estimated by the following relationship:
A = w d f n a p
Since the cross-sectional area (A) of chips are proportional to the feed rate (fn) and cutting depth (ap), these cutting parameters were used in this study to evaluate the unified index of the chip weight (IWchip) and classification of chips that were obtained at different cutting conditions:
I W c h i p = W c h i p / ( a p f n )
Table 3 shows the classification of chips depending on shape, weight, and IWchip index: Type I: one-arc chips with IWchip smaller than 0.13; Type II: chips having two or three arcs with IWchip 0.13–0.27; Type III: multi-arc chips (usually at least 3 curves) with IWchip values larger than 0.27.

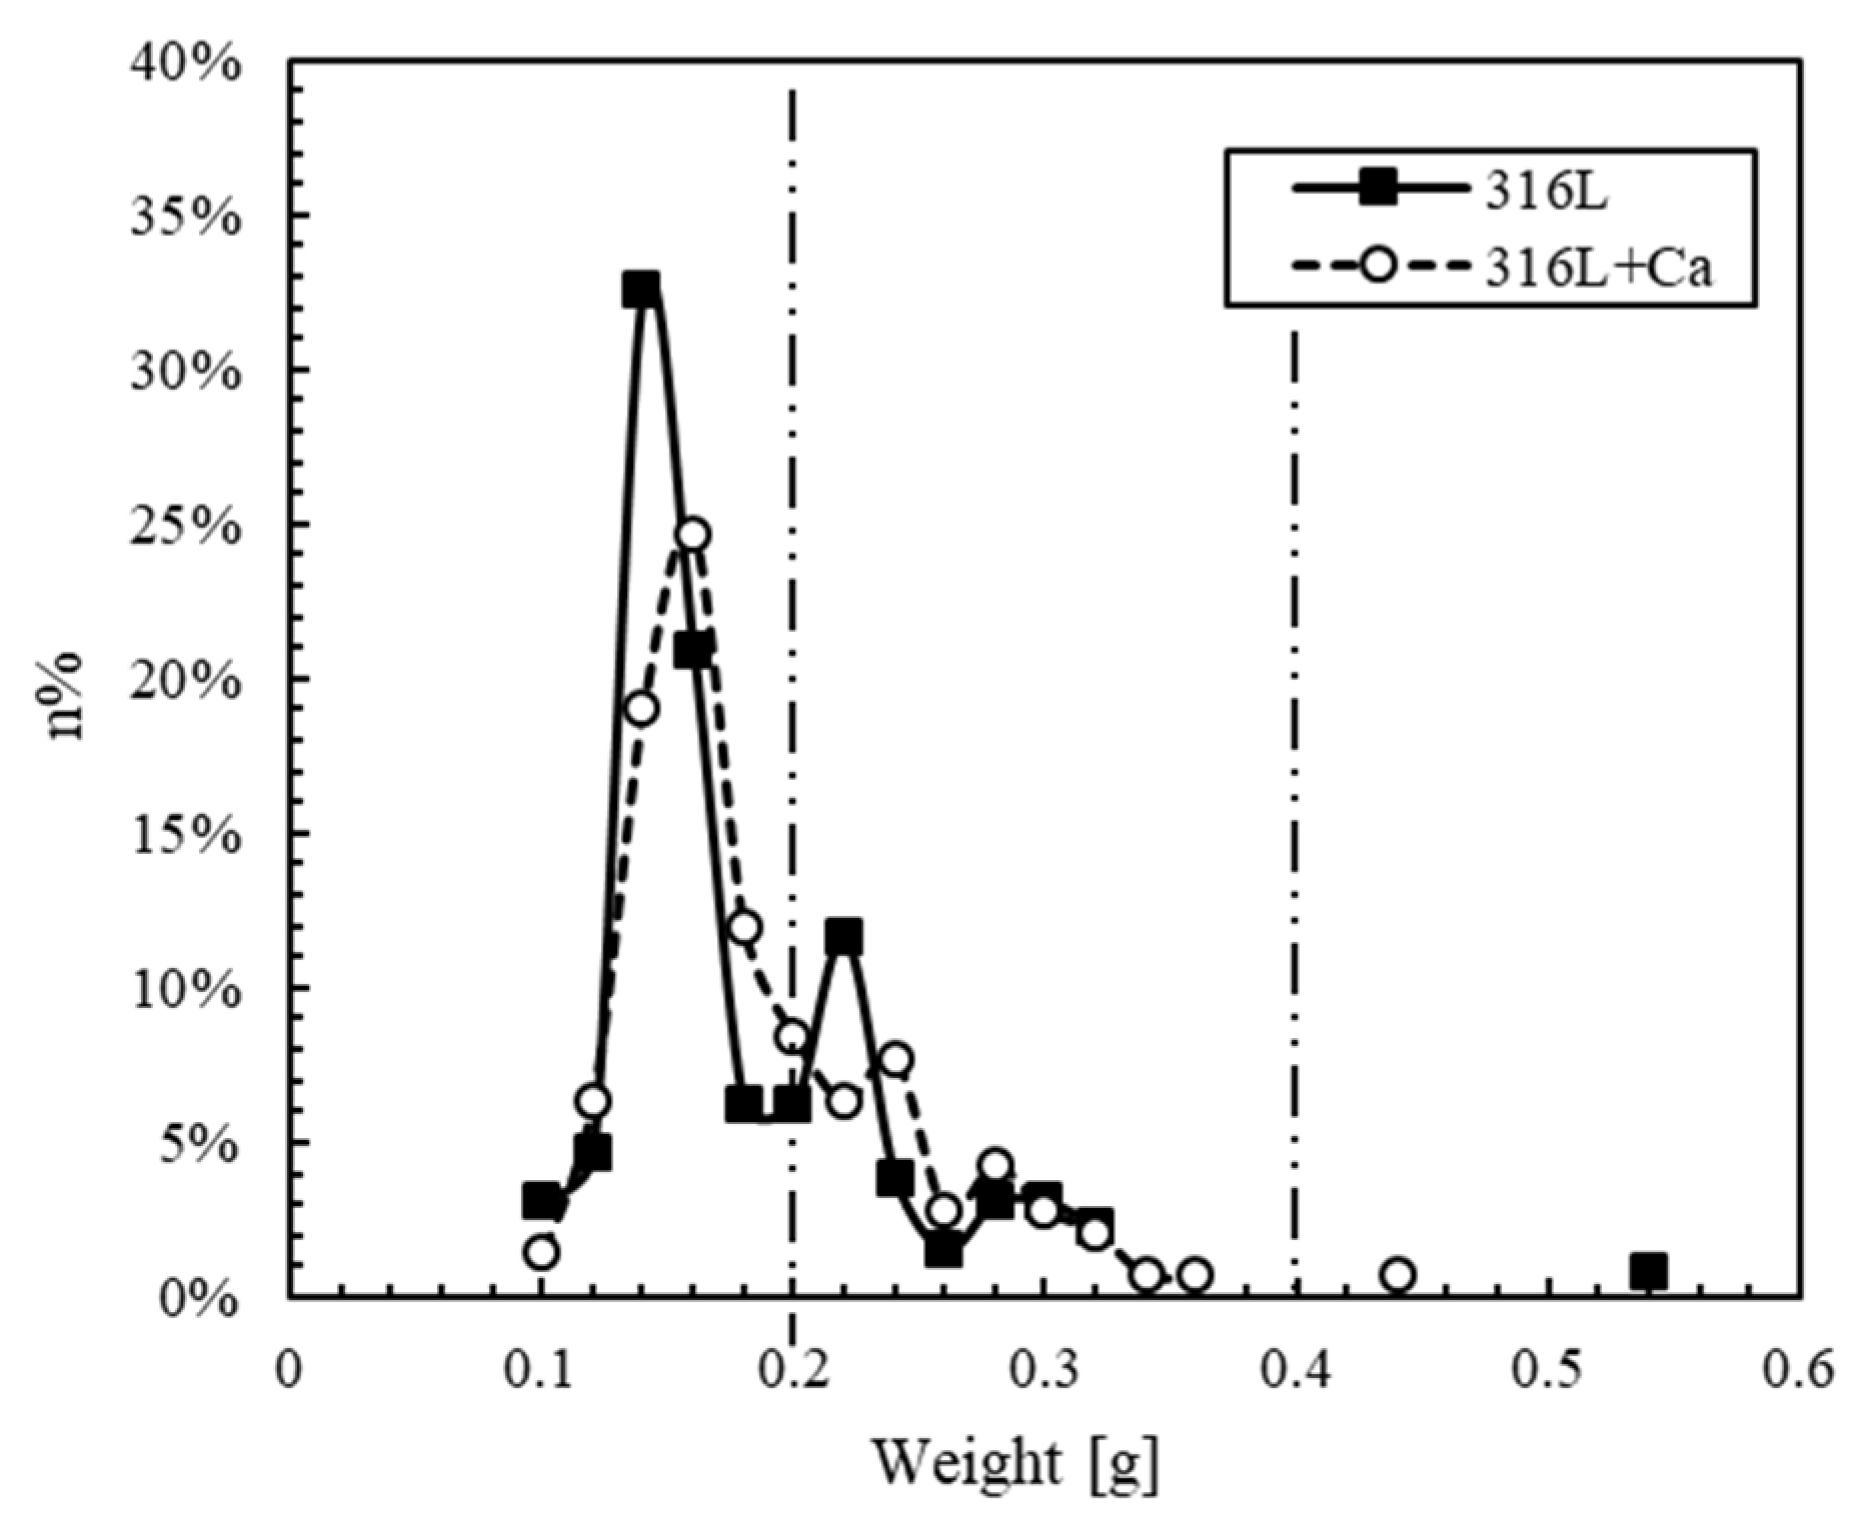
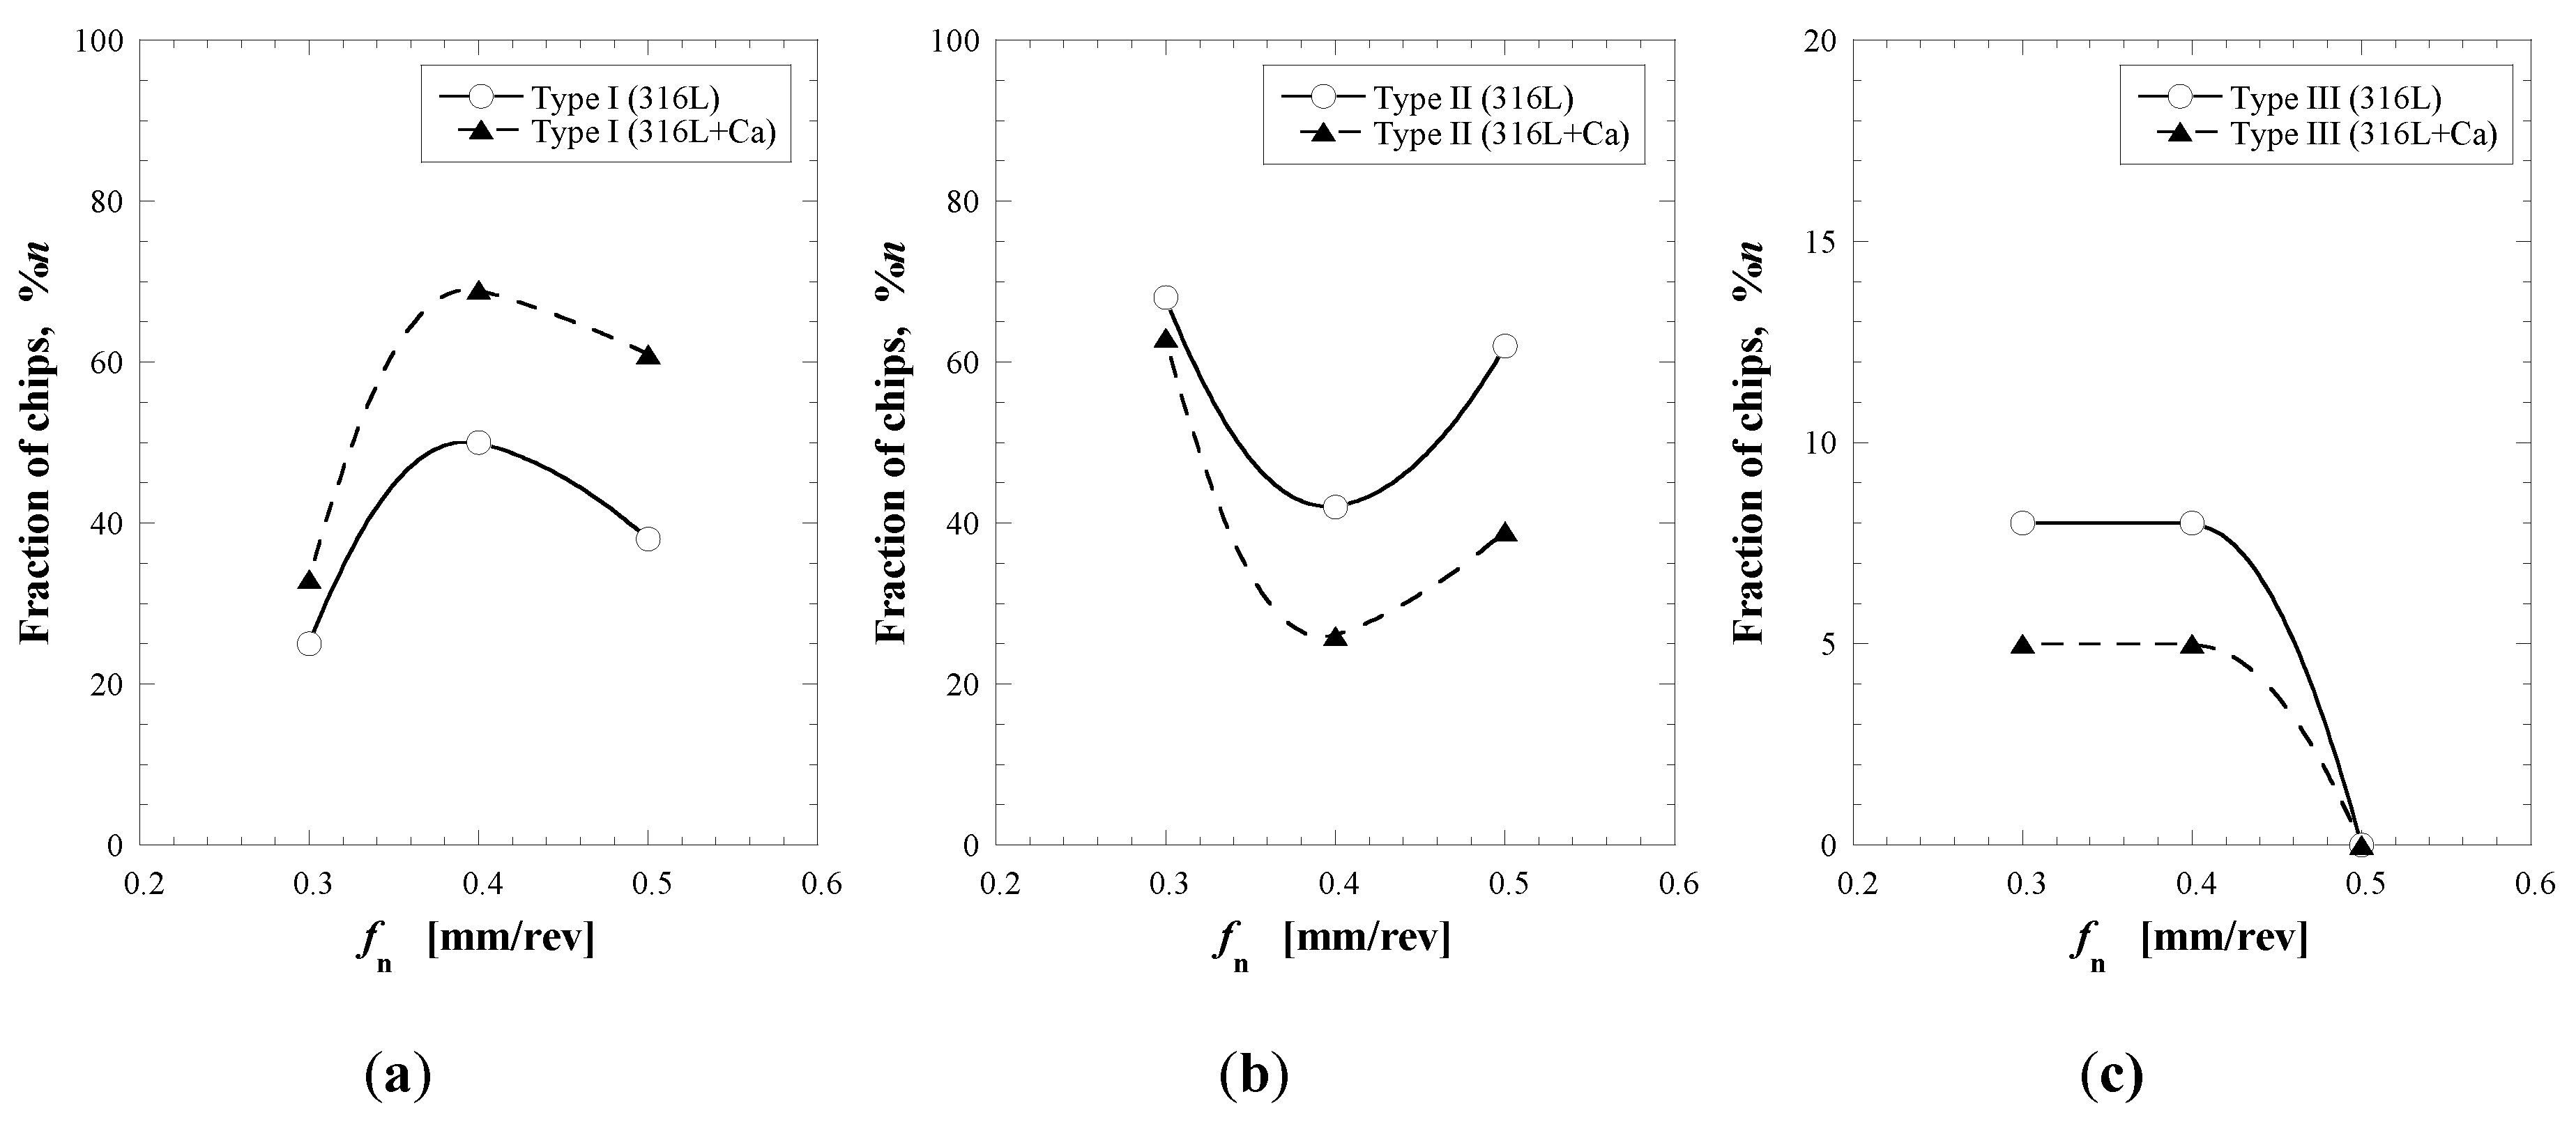
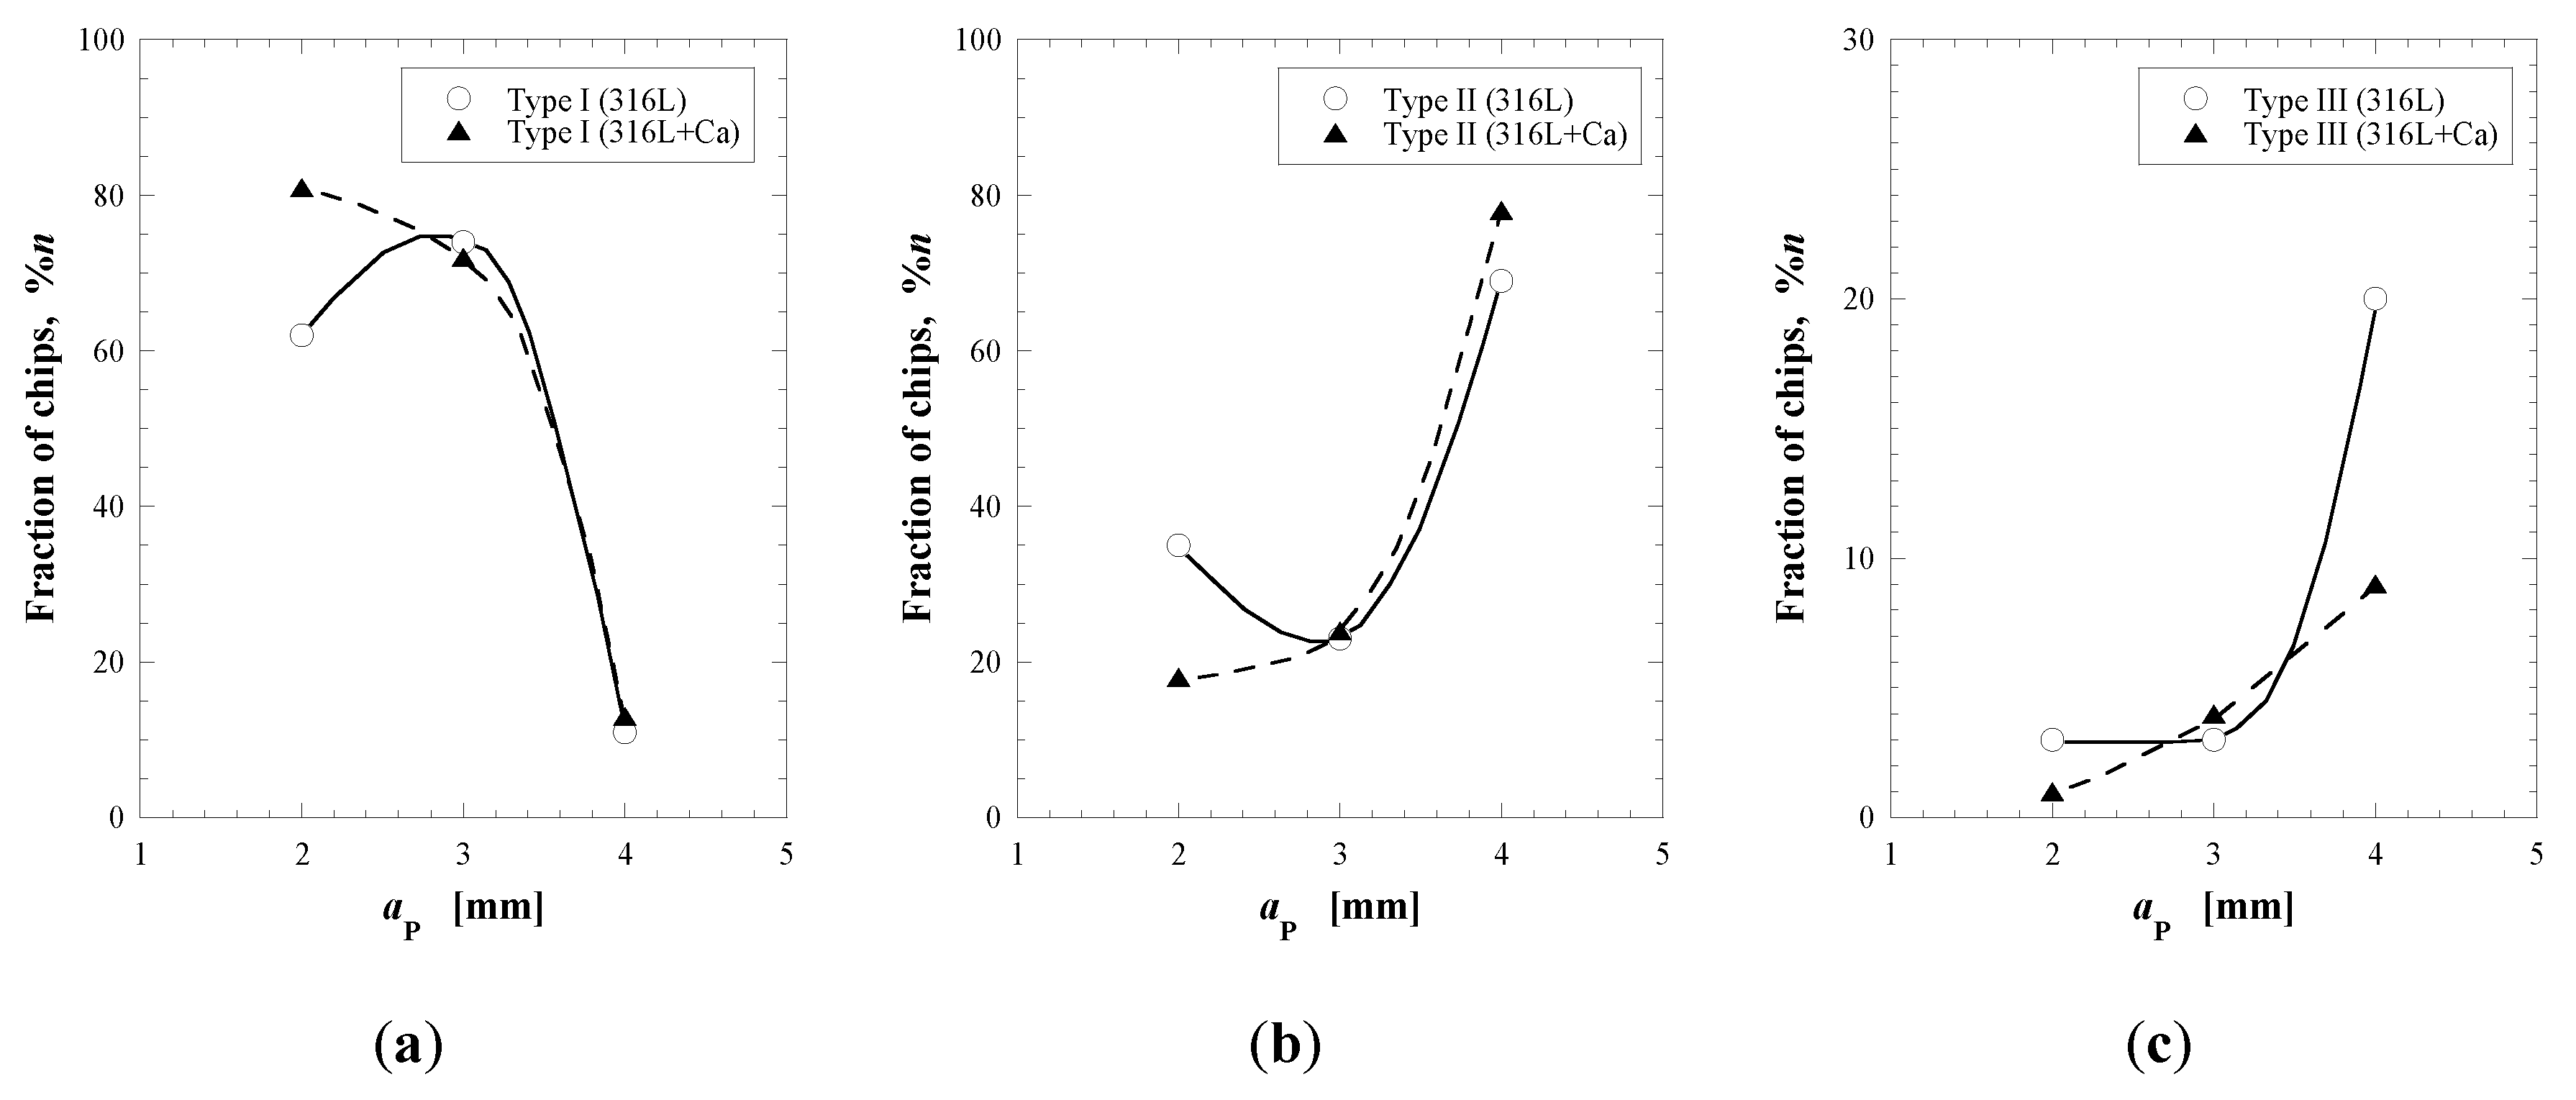
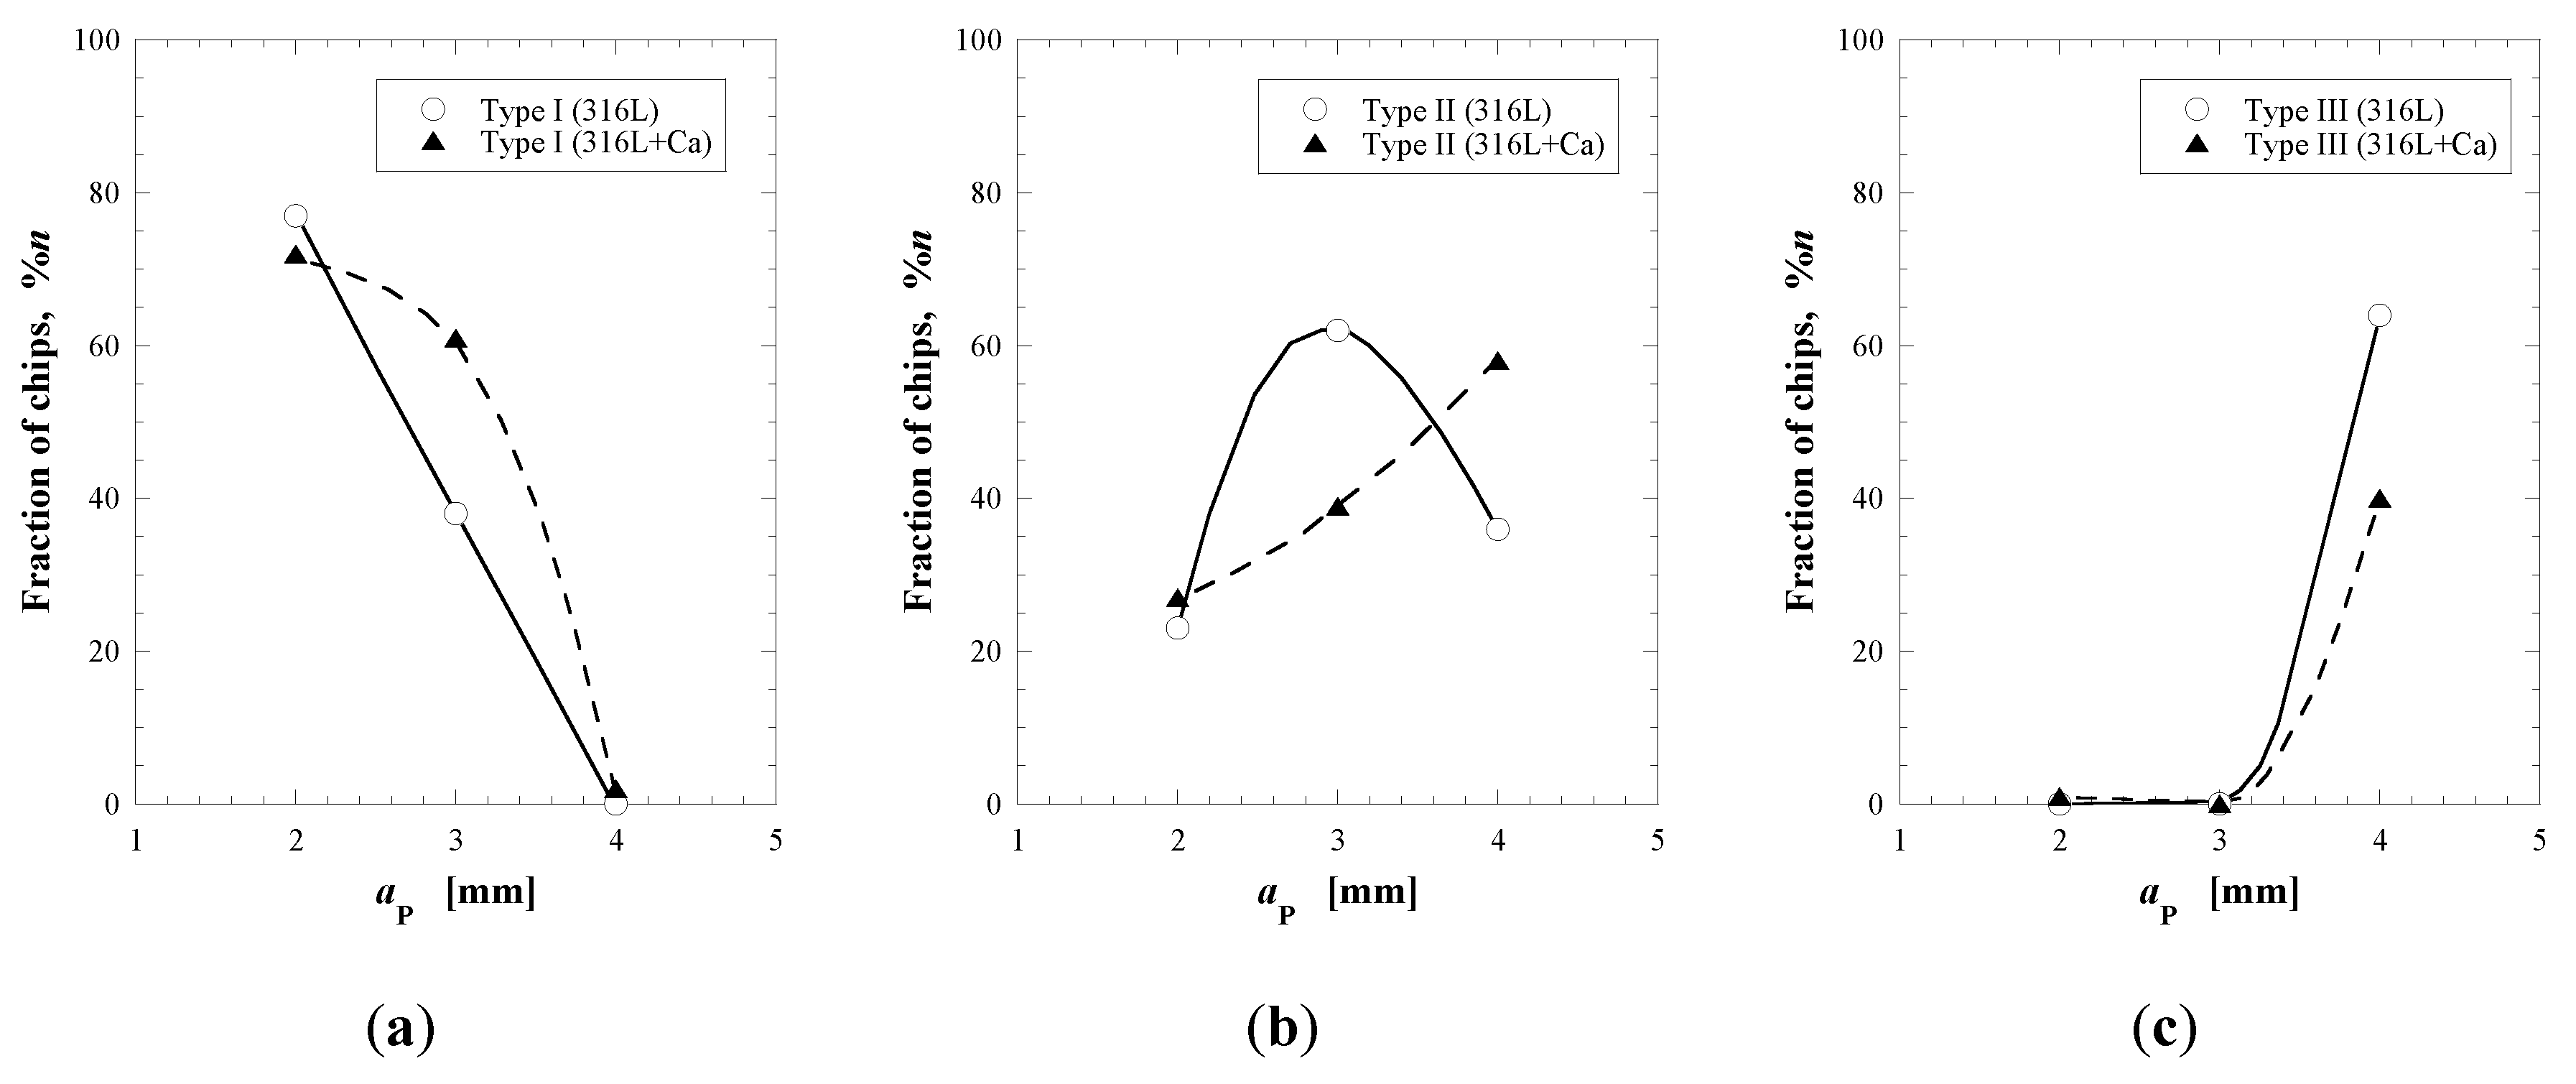
3.3. Chip Distributions

Table 4 shows the results of the weight distribution of chips from 10 sets of cutting parameters corresponding to the blue zone in Figure 2. It was found that a clearer difference in chip breakability, as compared to conventional breakability test methods, could be detected for the 316L and 316L + Ca steels. The results show that compared to the 316L steel, the frequency of large Type III chips (IWchip > 0.27) is significantly smaller for the 316L + Ca steel. Especially in sets 1, 5, and 10, the frequency of Type III chips decreases by 11–32%. On the other hand, it is also evident that the number of small Type I chips (IWchip < 0.13) in the 316L + Ca steel increases for most cutting parameter sets. It is especially clear in sets 2, 4, 7, and 8, in which the frequency increases by 15–23%. The frequency of Type II chips is quite scatted. However, an obvious improvement of chip breakability was quantitatively detected for the 316L + Ca steel for the cutting parameters in set 2, 4, and 6–8 (due to significant increase of the number of small chips (Type I) and decrease of the number of middle size chips (Type II)) and in set 1, 5 and 10 (due to the significant decrease of the number of large chips (Type III)). No clear difference between the 316L and 316L + Ca materials is found between sets 3 and 9. It might be due to that, for cases where Type I chips are in the majority (more than 70%, in sets 3 and 9) in both steels, no clear difference could be detected. Thus, it can be concluded that a Ca treatment is beneficial for the chip breakability in most cases according to the obtained results (in 80% of trials in this study: sets 1, 2, 4–8, 10).
The weight distributions of chips for 316L and 316L + Ca steels at different feeds with a fixed cutting depth (ap = 3 mm) are shown in Figure 4 and Figure 5 for cutting speeds of 130 and 180 m/min, respectively. The obtained results correspond to sets 1–3 and 6–8 in Table 4. It can be seen that, at the same cutting parameters, the experimental 316L + Ca steel led to the production of a larger fraction of small Type I chips in most cases (sets 6–8 at Vc = 180 m/min and set 2 at Vc = 130 m/min and fn = 0.4 mm/rev). Moreover, the chips of a 316L + Ca steel from set 1 (fn = 0.3 mm/rev) at the low cutting speed show an increase of Type II chips instead and a decrease of large Type III chips. However, no clear benefits of using a Ca-treatment steel was detected in the case of set 3 (Vc = 130 m/min, fn = 0.5 mm/rev).
Although the chips obtained from different feed rates look visually quite similar in the chip charts, the percentage of the small Type I chips in both steels increases drastically with an increased feed rate (fn) at both cutting speeds. This is true for all sets, except for set 8 (Vc = 180 m/min, fn = 0.5 mm/rev). Moreover, it should be pointed out that an increase of the cutting speed from 130 up to 180 m/min promotes an increase of the fraction of small Type I chips for both steels, except for the cutting conditions in set 8. This can be connected with some increase of temperature in the local cutting zone with an increase of feed rate and cutting speed during cutting [17,18]. However, a too high temperature in the cutting zone during the higher cutting speed might significantly decrease the chip breakabilities, as was obtained for the set eight cutting parameters (Vc = 180 m/min, fn = 0.5 mm/rev). This negative effect might be due to the increased plasticity of the steel matrix and inclusions, resulting in too few formations of void around inclusions in the cutting zone where the temperature is too high. This can decrease the possibility of chip breaking.
On the other hand, the fraction of the small Type I chips significantly decreases in most cases for both steels with an increased cutting depth (ap) at the fixed feeding rate (fn = 0.5 mm/rev). This is shown in Figure 6 and Figure 7 at cutting speeds of 130 and 180 m/min, respectively, for the sets 3–5 and 8–10 in Table 4. At the same time, the fraction of large Type III chips tends to increase with increased cutting depths. It shows that, with a larger cutting depth, the breadth of chips is wider and the helical radius is larger, so the chips need a larger length to break. In this case, the Ca-treatment and increased cutting speed did not show clear benefits for the chip breaking with respect to the small Type I chips, except for in sets 4 and 8. However, the frequency of large Type III chips in the 316L + Ca steel is smaller than that in the 316L steel in sets 4 and 8.
Overall, based on obtained results, it can be concluded that this weighting method can provide more detailed chip breakability differentiations of similar steel grades for different sets of cutting parameters.

3.4. The Difference of the Non-Metallic Inclusions in Two Steel Grades

The difference in chip breakability between these two steel grades 316L and 316L + Ca comes from the difference of the non-metallic inclusion content in the steels. The investigation results of non-metallic inclusions in the 316L + Ca sample show a significant increase of the amount (on ~40%) of two kinds (undeformed and elongated) of Al2O3-CaO-SiO2-MgO oxide inclusions (as shown in Figure 8a,b), while the 316L sample contains mainly MnS inclusions and quite a small amount (4.4%) of Al2O3-MgO-MnO oxide inclusions (as shown in Figure 8c), according to a previous study [19]. More details of the evaluation of the non-metallic inclusions can be found in the previous paper [19]. The difference between oxide and sulfide inclusions with respect to plasticity at different temperatures lead to a different effect on the chip breakability for different sets of cutting parameters. For example, the hardness of pure MnS at 800 °C is only 20% of that at room temperature, whereas the hardness of silicate inclusions with a composition 34–40% SiO2-29–40% Al2O3-28% MnO-3% TiO at 800 °C drops to only 10% of that at room temperature [20]. Many of undeformed Al2O3-CaO-SiO2-MgO oxide inclusions were found in some big dimples of the fracture section of the broken chips of the 316L + Ca steel, which is supposed to contribute to the void nucleation and be beneficial for chip breaking for the current cutting conditions, as shown in Figure 9 (the arrows marked). A more systematic study of the mechanism of contributions of this kind inclusions on chip breakability will be considered in a separate paper.

4. Conclusions

The focus of this study is to develop an alternative method for quantitative assessments of the chip breakability during machining of similar steels at acceptable cutting conditions, which are difficult to obtain while using conventional evaluation methods. Based on the results obtained in this study, the conclusions were summarized as follows:
1. It is hard to quantitatively differentiate the chip breakability of the 316L and 316L + Ca workpieces by using conventional visual subjective evaluation methods, because the chips obtained at different feed rates or different cutting depths often visually look very similar in the chip chart. However, the unified index of chip weight (IWchip) and chip distributions can be used for a differentiation and quantitative estimation of the chip breakability for these two steel grades.
2. In most cases, the Ca treated steel (316L + Ca) workpieces show a considerably improved chip breakability at the same cutting parameters when compared to the conventional reference 316L steel. In these cases, the fraction of small chips (Type I) in the Ca-treated steel can be increased by 8–32%, while the fraction of large chips (Type III) can be decreased by 11–32%. However, if the fraction of the small chips is more than 70%, no clear difference could be detected between these two steel grades.
3. Although the chips obtained from different feed rates look visually similar in the chip charts, the fraction of the small chips (Type I) in both steel grades increases with an increased feed rate (fn) and cutting speed. However, the fraction of small chips can significantly decrease at the higher cutting speed (180 m/min), larger feeding rate (0.5 mm/rev), and at an increased cutting depth (ap).
4. The difference in chip breakability between the 316L and 316L + Ca steels derives from the different non-metallic inclusion contents in these two steel grades. More undeformed oxide NMIs, which could contribute to voids nucleation and be beneficial for chip breakability, were found in large dimples on the fracture section of the chips that were obtained from 316L + Ca steels.

Author Contributions

Conceptualization, A.K., P.G.J. and H.D.; methodology, T.B., H.D. and A.K.; formal analysis and material preparation, S.L.; investigation, H.D.; writing—original draft preparation, H.D.; writing—review and editing, A.K., P.G.J., T.B. and S.L.; supervision, A.K. and P.G.J. All authors have read and agreed to the published version of the manuscript.

Funding

This research received no external funding.

Acknowledgments

Hongying Du would like to thank Nils Stavlid for the assistance and contribution of discussion. Hongying Du also acknowledges the financial support and cooperation from VINNOVA, Jernkontoret, China Scholarship Council (CSC) and all other colleagues who participated in this study.

Conflicts of Interest

The authors declare no conflict of interest.

References

  1. Ånmark, N.; Karasev, A.; Jönsson, P.G. The effect of different non-metallic inclusions on the machinability of steels. Materials 2015, 8, 754–783. [Google Scholar] [CrossRef] [PubMed]
  2. Sousa, V.F.C.; Silva, F.J.G. Recent Advances in Turning Processes Using Coated Tools—A Comprehensive Review. Metals 2020, 10, 170. [Google Scholar] [CrossRef] [Green Version]
  3. Schäfer, B.J.; Sonnweber-Ribic, P.; ul Hassan, H.; Hartmaier, A. Micromechanical Modeling of Fatigue Crack Nucleation around Non-Metallic Inclusions in Martensitic High-Strength Steels. Metals 2019, 9, 1258. [Google Scholar] [CrossRef] [Green Version]
  4. Jamil, M.; Khan, A.M.; Hegab, H.; Sarfraz, S.; Sharma, N.; Mia, M.; Gupta, M.K.; Zhao, G.; Moustabchir, H.; Pruncu, C.I. Internal Cracks and Non-Metallic Inclusions as Root Causes of Casting Failure in Sugar Mill Roller Shafts. Materials 2019, 12, 2474. [Google Scholar] [CrossRef] [PubMed] [Green Version]
  5. Temmel, C.; Ingesten, N.G.; Karlsson, B. Fatigue Anisotropy in Cross-rolled, Hardened Medium Carbon Steel Resulting from MnS Inclusions. Metall. Mater. Trans. A 2006, 37, 2995–3007. [Google Scholar] [CrossRef]
  6. Akasawa, T.; Sakurai, H.; Nakamura, M.; Tanaka, T.; Takano, K. Effects of free-cutting additives on the machinability of austenitic stainless steels. J. Mater. Process. Technol. 2003, 143–144, 66–71. [Google Scholar] [CrossRef]
  7. Fang, X.D.; Zhang, D. An investigation of adhering layer formation during tool wear progression in turning of free-cutting stainless steel. Wear 1996, 197, 169–178. [Google Scholar] [CrossRef]
  8. Wang, Y.; Yang, J.; Bao, Y. Effects of non-metallic inclusions on machinability of free-cutting steels investigated by nano-indentation measurements. Metall. Mater. Trans. A 2015, 46, 281–292. [Google Scholar] [CrossRef]
  9. Qi, H.S.; Mills, B. On the formation mechanism of adherent layers on a cutting tool. Wear 1996, 198, 192–196. [Google Scholar] [CrossRef]
  10. Ånmark, N.; Björk, T.; Ganea, A.; Ölund, P.; Hogmark, S.; Karasev, A.; Jönsson, P.G. The effect of inclusion composition on tool wear in hard part turning using PCBN cutting tools. Wear 2015, 334–335, 13–22. [Google Scholar] [CrossRef]
  11. Gutnichenko, O.; Bushlya, V.; Zhou, J.M.; Stahl, J.E. Tool Wear and Vibrations Generated When Turning High-chromium White Cast Iron with pcBN Tools. Wear 2017, 390–391, 253–269. [Google Scholar] [CrossRef]
  12. Gouveia, R.M.; Silva, F.; Reis, P.; Baptista, A.M. Machining Duplex Stainless Steel: Comparative Study Regarding End Mill Coated Tools. Coatings 2016, 6, 51. [Google Scholar] [CrossRef] [Green Version]
  13. Ståhl, J.-E. Metal Cutting—Theories and Models, 1st ed.; Division of Production and Materials Engineering, Lund University: Lund, Sweden, 2012. [Google Scholar]
  14. Buchkremer, S.; Klocke, F.; Veselovac, D. 3D FEM simulation of chip breakage in metal cutting. Int. J. Adv. Manuf. Tech. 2016, 82, 645–661. [Google Scholar] [CrossRef]
  15. Fang, X.D.; Fei, J.; Jawahir, I.S. A hybrid algorithm for predicting chip form/chip breakability in machining. Int. J. Mach. Tool Manu. 1996, 36, 1093–1107. [Google Scholar] [CrossRef]
  16. Du, H.; Karasev, A.; Stavlid, N.; Björk, T.; Lövquist, S.; Jönsson, P.G. Using chip weight distribution as a method to define chip breakability during machining. Procedia Manuf. 2018, 25, 309–315. [Google Scholar] [CrossRef]
  17. Kara, F.; Aslantaş, K.; Çiçek, A. Prediction of cutting temperature in orthogonal machining of AISI 316L using artificial neural network. Appl. Soft Comput. 2016, 38, 64–74. [Google Scholar] [CrossRef]
  18. Monkova, K.; Monka, P.P.; Sekerakova, A.; Hruzik, L.; Burecek, A.; Urban, M. Comparative Study of Chip Formation in Orthogonal and Oblique Slow-Rate Machining of EN 16MnCr5 Steel. Metals 2019, 9, 698. [Google Scholar] [CrossRef] [Green Version]
  19. Du, H.; Karasev, A.; Sundqvist, O.; Jönsson, P.G. Modification of Non-Metallic Inclusions in Stainless Steel by Addition of CaSi. Metals 2019, 9, 74. [Google Scholar] [CrossRef] [Green Version]
  20. Gove, K.B.; Charles, J.A. The high-temperature hardness of various phases in steel. Met. Tech. 1974, 1, 279–283. [Google Scholar] [CrossRef]
Figure 1. Chip breaking curve at cutting speeds of 130 m/min (a) and 180 m/min (b).
Metals 10 00675 g001
Figure 2. Chip charts of (a) the reference sample (316L) and (b) the experimental sample (316L + Ca) at a cutting speed of 130 m/min, reproduced from Ref. [16].
Metals 10 00675 g002
Figure 3. Distribution of chip weight with a step of 0.02 g at the following cutting parameters: v = 130 m/min, ap = 3 mm, fn = 0.5 mm/rev.
Metals 10 00675 g003
Figure 4. Chip weight distributions for Type I (a), Type II (b) and Type III (c) chips obtained at an ap value of 3 mm and a cutting speed of 130 m/min.
Metals 10 00675 g004
Figure 5. Chip weight distributions for Type I (a), Type II (b) and Type III (c) chips obtained at an ap value of 3 mm and a cutting speed of 180 m/min.
Metals 10 00675 g005
Figure 6. Chip weight distributions for Type I (a), Type II (b), and Type III (c) chips obtained at an fn value of 0.5 mm/rev and a cutting speed of 130 m/min.
Metals 10 00675 g006
Figure 7. Chip weight distributions for Type I (a), Type II (b), and Type III (c) chips obtained at an fn value of 0.5 mm/rev and a cutting speed of 180 m/min.
Metals 10 00675 g007
Figure 8. Typical non-metallic inclusions (NMI) investigated by using scanning electron microscope (SEM) after electrolytic extraction: undeformable oxides (a), elongated oxides (b) in 316L + Ca steel, and undeformed oxides (c) in 316L steel.
Metals 10 00675 g008
Figure 9. Oxide NMIs found in the large dimples on the fracture section of the chips obtained during machining of the 316L + Ca steel.
Metals 10 00675 g009
Table 1. Composition of samples of the reference steel (316L) and the Ca-treated steel (316L + Ca).
Steel GradeCa-TreatedCSiMnCrNi SO Ca Al
(mass %) (mass ppm)
316LNo 0.020.381.6016.8211.18 7020-40
316L + CaYes0.010.461.5816.8611.14 90592840
Table 2. The cutting data used for chip breakability curves and chip charts.
Type of TestFeed Rates (fn) (mm/rev)Cutting Depths (ap) (mm)Cutting Speed (m/min)
Chip breakability curves0.15, 0.2, 0.3, 0.4, 0.50.5, 0.75, 1, 2, 3, 4 130, 180
Chip chart0 → 0.5 (continuous)0.5, 0.75, 1, 2, 3, 4 130, 180
Table 3. Classification of different chips.
Type of ChipsI II III
Photograph Metals 10 00675 i001 Metals 10 00675 i002 Metals 10 00675 i003
IWchip<0.130.13–0.27>0.27
Table 4. Summary of results based on weighting measurements and calculated IWchip.
Set12345678910
Speed (m/min)130130130130130180180180180180
ap (mm)3332433324
fn (mm/rev)0.30.40.50.50.50.30.40.50.50.5
Type I in 316L-6%74%62%11%25%50%38%77%0%
Type I in 316L + Ca-21%72%81%13%33%69%61%72%2%
Δ (Type I)-+15%−2%+19%+2%+8%+19%+23%−5%+2%
Type II in 316L15%90%23%35%69%68%42%62%23%36%
Type II in 316L + Ca47%75%24%18%78%63%26%39%27%58%
Δ (Type II)+32%−15%+1%−17%+9%−5%−16%−23%+4%+22%
Type III in 316L85%4%3%3%20%8%8%-0%64%
Type III in 316L + Ca53%4%4%1%9%5%5%-1%40%
Δ (Type III)−32%0%+1%−2%−11%−3%−3%-+1%−24%

