Article

Increase in Total Elongation Caused by Pure Shear Deformation in Ultra-Fine-Grained Cu Processed by Equal-Channel Angular Pressing

Department of Materials Science and Engineering, Tokyo Institute of Technology, 4259-J2-63 Nagatsuta, Yokohama 226-8502, Japan
*
Author to whom correspondence should be addressed.
Metals 2020, 10(5), 654; https://doi.org/10.3390/met10050654
Submission received: 3 May 2020 / Revised: 15 May 2020 / Accepted: 16 May 2020 / Published: 19 May 2020

Abstract

:
Ultra-fine-grained (UFG) Cu shows little total elongation in tensile tests because simple shear deformation is concentrated in narrow regions during the initial stage of plastic deformation. Here, we attempted to improve the total elongation of UFG Cu obtained by equal-channel angular pressing. By making shallow dents on the side surfaces of the plate-like specimens, this induced pure shear deformation and increased their total elongation. During the tensile tests, we observed the overall and local deformation of the dented and undented UFG Cu specimens. Using three-dimensional digital image correlation, we found that the dented specimens showed suppression of thickness reduction and delay in fracture by enhancement of pure shear deformation. However, the dented and undented specimens had the same ultimate tensile strength. These results provide us a new concept to increase total elongation of UFG materials.

1. Introduction

The strength of metallic materials can be improved by grain refinement. One way to produce grain refinement is severe plastic deformation (SPD), which can reduce grain size to the submicron regime [1], producing ultra-fine-grained (UFG) materials. Generally, there is a trade-off relationship in materials between strength and ductility—increasing one decreases the other. UFG materials, following this trade-off, have very high tensile strength and poor ductility [2,3,4,5,6]. For UFG materials, the local deformation occurs during the initial stage of plastic deformation owing to early plastic instability. When materials are deformed severely, large shear deformation occurs under the effects of previously processed microstructures and form shear bands [7,8]. Thus, local deformation of UFG materials is mainly caused by shear bands, and shear band localization leads to fracture. That is, their poor ductility has been attributed to the occurrence of shear band localization [9] during the initial stage of plastic deformation [7].
Equal channel angular pressing (ECAP) is a popular SPD processing method [1,10]. During local deformation in tensile tests for as-ECAPed materials, the evolution of shear band localization and fracture occur along the shear direction of the final ECAP (ECAP-SD) due to the fact of their microstructural characteristics [4,11]. Segal has reviewed that simple shear deformation significantly promotes shear band localization, but pure shear deformation restrains it [9,12]. Considering these characteristics of shear deformation, predominant pure shear deformation during local deformation is promising to increase total elongation. Previous works have attempted to increase the tensile elongation of UFG materials by applying a heat treatment after SPD [6,9,13] or by adding alloying elements [2,14,15,16,17]. However, few studies have attempt to increase total elongation by suppressing the occurrence of shear band localization by simple shear deformation.
The purpose of this present study was to increase the total elongation by causing pure shear deformation that suppresses shear band localization. In our previous study [18], processing notches on the side surfaces of plate-like specimens obtained by equal-channel angular pressing (ECAP) could induce simple shear deformation between them. In the present study, we attempted the occurrence of the wide region of pure shear deformation by applying this method. The occurrence of in-plane shear deformation in plate specimens does not cause local thickness reduction even if in-plane shear deformation is not uniform deformation. However, shear band localization causes localized thickness reduction and fracture due to the evolution of many micro-shear bands [7]. Measuring surface displacements alone is insufficient to evaluate the contribution of in-plane pure-shear-deformation to reduce shear band localization. To evaluate shear band localization, we used three-dimensional digital image correlation (3D-DIC) in the present study.

2. Materials and Methods

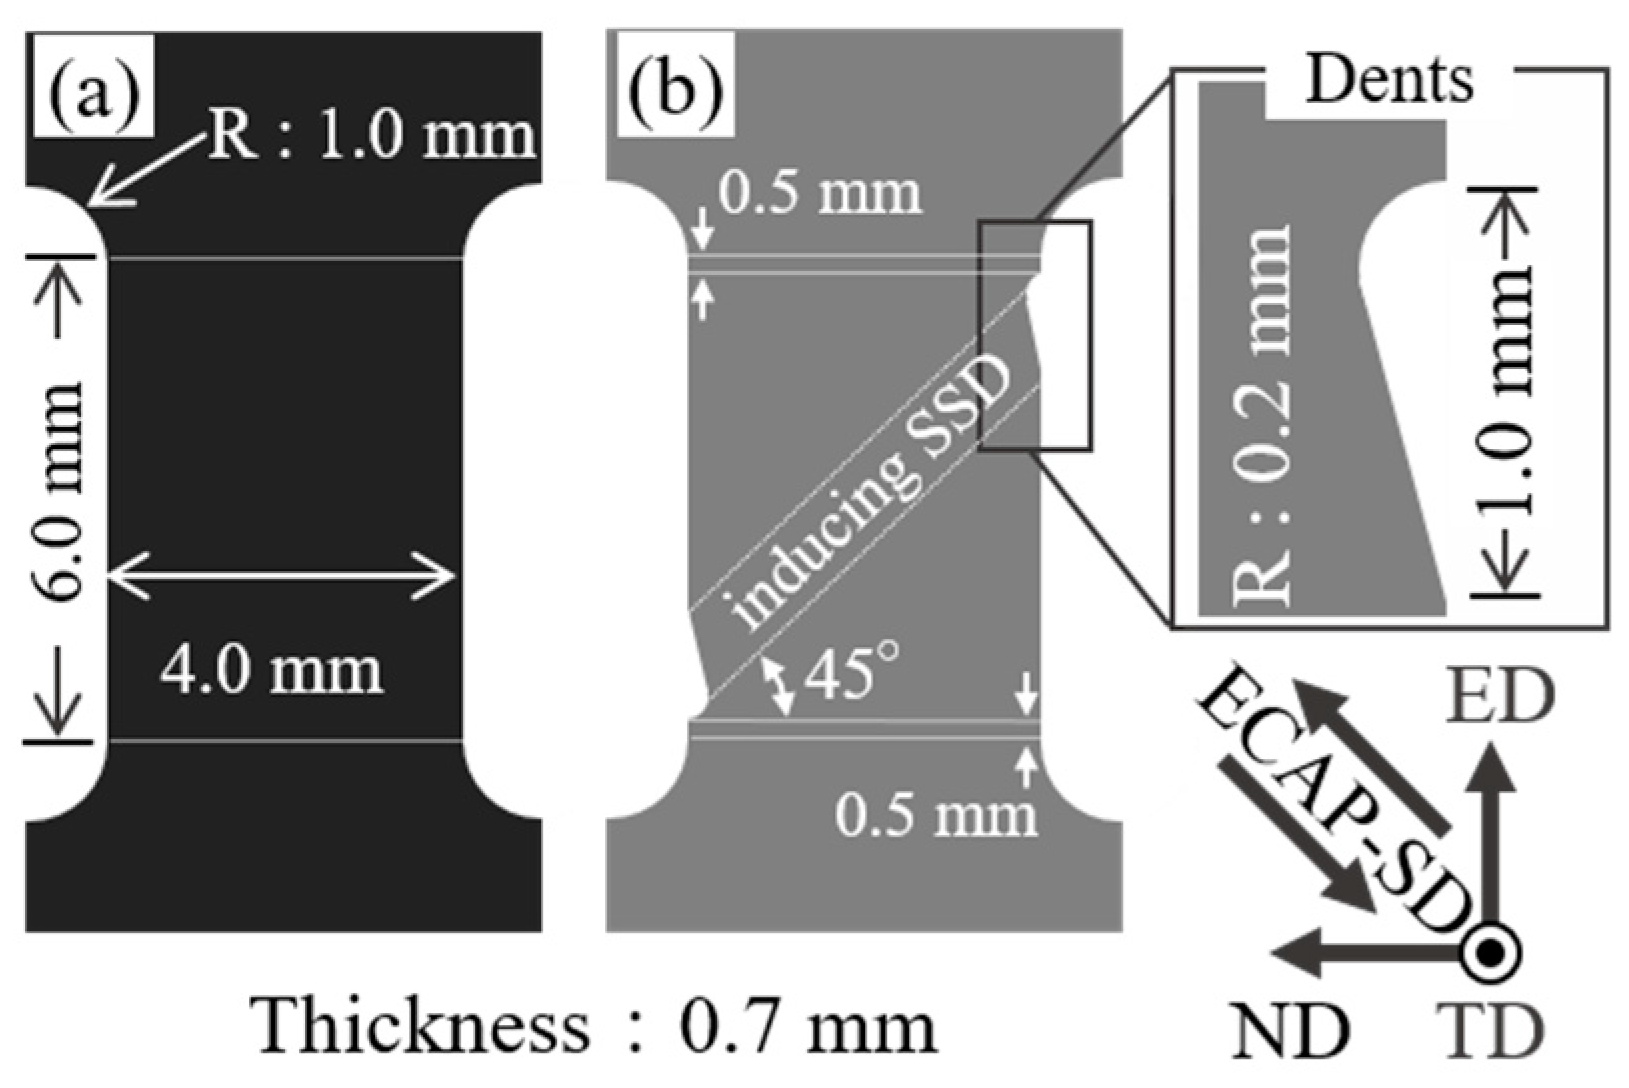
2.1. ECAP Processing and Plate-Like Tensile Specimens

Commercially pure Cu (99.99%) rods, 10 mm in diameter and 60 mm in length, were produced by ECAP. Before ECAP, pure Cu rods were washed with dilute nitric acid and annealed at 873 K for 3600 s to produce homogeneously recrystallized microstructures. ECAP was done in eight passes under route Bc [19]. After ECAP, the average grain size was about 0.4 µm. Tensile specimens were cut with a cross-sectional area of 0.7 mm × 4 mm and a gauge length of 6 mm by electric discharge machining as shown in Figure 1a.

2.2. Adding Dents

It is known that as-ECAP specimens are prone to be deformed by simple shear along the direction of ECAP-SD during tensile deformation [4]. Moreover, it is shown that the notches on side surfaces on plate specimens cause large in-plane simple-shear-deformation between them [18]. To generate simple shear deformation in two directions, we paid attention to both of the above reasons of simple-shear-deformation. However, to induce pure shear deformation in wide regions, we produced specimens with semi-teardrop-shaped dents, as shown in Figure 1b, by electric discharge machining as with Section 2.1. We made these dents to induce simple shear deformation along the direction intersecting ECAP-SD, and the inclination angle between the tensile direction and the region of inducing simple shear deformation was 45°. By this processing, during local deformation, simple shear deformation may simultaneously occur in both of the directions along and intersecting ECAP-SD.

2.3. Tensile Tests

Tensile tests were performed at room temperature using a tensile testing machine (Minebea NMB TG-50 kN, Nagano, Japan) operating at an initial strain rate of 8.3 × 10⁻⁴ s−1. To quantify the deformation during tensile tests, the specimen surfaces (TD-planes) were spray-painted with fine speckle patterns, and the patterns were observed by digital image correlation (DIC). Videos of these patterns were recorded with two cameras at two frames per second during the tensile tests. Using 3D-DIC with two cameras, we also measured the displacements normal to the observation surfaces of the specimens. Unlike 2D-DIC [20,21], 3D-DIC can measure three-dimensional displacements by parallax [22] and evaluate thickness reduction during tensile tests. These images were analyzed by using the correlation algorithm from ARAMIS (GOM GmbH, Braunschweig, Germany). Each camera had a resolution and focal length of 18.3 pixels/mm and 1500 mm, respectively.

3. Results and Discussion

3.1. Mechanical Properties

Evaluation of correct stress–strain curves of these dented specimens is difficult, because they have non-uniform cross-sectional areas. Thus, we evaluated the specimen deformation by the apparent stress σap and strain εap. The apparent stress σap is given by:
σap = F/S,
where F is the tensile testing load and S is the cross-sectional area without dents. The apparent strain εap is:
εap = uDIC/l0,
where uDIC is the displacement between gauge marks along the tensile direction measured by DIC, and l0 is the initial length between the gauge marks of the specimen. In evaluating the elongation of each specimen, we used the total elongation εap-f, which is εap at a fracture point. Figure 2a,b show the σap-εap curves and the results of εap-f, respectively. As shown in Figure 2a, the ultimate tensile strength (UTS) for each specimen was 415–430 MPa, showing that the dents did not affect strength. In contrast, Figure 2b shows that the dented specimens had a higher total elongation εap-t than the undented specimens. Overall, making dents on the sides of the specimens increased their total elongation without decreasing their strength.

3.2. Analysis of Shear Strain

By measuring the deformation for each specimen during tensile tests by DIC, we evaluated how the added dents influenced local deformation. To evaluate the extent of shear band, we used the shear strain ε12, which is based on the coordinate system transformed with a counterclockwise rotation of 45° around the TD axis. Figure 3a,b show the ε 12 for the undented and dented specimens in the initial stages of local deformation (εap = 0.060), respectively. As shown in Figure 3a with two black dashed lines, the region of large ε12 for the undented specimen is roughly along ECAP-SD. In contrast, as shown in Figure 3b, the large ε12 regions for the dented specimen is roughly along the direction intersecting ECAP-SD. Because we made the wider dents in the present study, the regions of shear deformation of the dented specimen were wider than those of the specimens in our previous research having shallow notches [18]. However, unlike our expectations as mentioned in Section 2.2, shear strain did not concentrate in the region between the dents. The angle of inclination of the tensile axis and this region is larger than 45° for the dented specimens. The same thing can be said for the undented specimens. The reason why these angles are larger than 45° is explained by the effect of normal stress discussed in previous studies [8,23].
To analyze the deformation of these specimens more quantitatively, we assessed the components u1,2 and u2,1 of the displacement gradient tensor, which satisfy:
ε12 = (u1,2 + u2,1)/2.
Figure 3c–f shows how u1,2 and u2,1 vary on the top surface during the initial stages of local deformation for the dented and undented specimens, respectively. Comparing Figure 3c,e, the amounts of u2,1 were larger than those of u1,2 for the undented specimen. These results show that large simple shear deformation along ECAP-SD was caused for undented specimens during the initial stage of local deformation. Furthermore, this comparison provides that the shear strain shown in Figure 3a was due to the simple shear deformation principally. That is, for the undented specimen, only the simple shear deformation (u2,1) developed the shear band during the initial stage of local deformation. In contrast, a comparison of Figure 3d,f shows that the amounts of u1,2 and u2,1 of the dented specimen were due to the comparable deformation. Also, comparing Figure 3c,d, the u1,2 of the undented specimen was smaller than that of the dented specimen. This indicates that processing dents enables to induce simple shear deformation between them. On the other hand, the u2,1 of the undented specimen was larger than that of the dented specimen as shown in Figure 3e,f. As shown by these results, the dents caused large simple shear deformation along the direction intersecting ECAP-SD; that is, a dented specimen causes simple shear deformation in two directions, i.e., pure shear deformation.
During the late stage of local deformation (εap = 0.155) for the undented specimen, as shown in Figure 4a, large shear deformation was caused along ECAP-SD as well as that during the initial stage of local deformation. Figure 4e also shows that large simple shear deformation was caused along ECAP-SD. The large u1,2 in the regions shown in Figure 4c seems to have resulted from chuck binding. For the dented specimen as shown in Figure 4b, unlike that during the initial stage of local deformation as shown in Figure 3b, shear deformation developed along ECAP-SD in narrow regions. These show that the shear band was localized along ECAP-SD regardless of the specimen’s shape during the late stage of local deformation. However, the shear strain of the dented specimen was smaller than undented specimen. As for u1,2 and u2,1, Figure 4d,f show that u2,1 was larger than u1,2 and concentrated in narrow regions.
Comparing the components u1,2 and u2,1 of the displacement gradient tensor, we can say that dented specimens cause pure shear deformation of u1,2u2,1 in wide regions during the initial stage of local deformation. This pure shear deformation leads to symmetrical deformation of the specimens with respect to the tensile axis. However, simple shear deformation leads to asymmetrical deformation with respect to the tensile axis. When this simple shear deformation becomes dominant, the specimens are fractured by localized deformation and stress concentration [9,12]. In other words, the occurrence of pure shear deformation can delay the fracture of the specimens by suppressing the localization of the deformation and stress concentration. These results imply that inducing pure shear deformation during the initial stage of local deformation contributes to increase total elongation for dented specimens. In the next sections, we evaluate the thickness reduction and shear strain concentration and discuss the suppression of shear band localization by using dented specimens.

3.3. Changes of Thickness

Using the parallax effect [22] of two cameras, we measured the change ∆L of the position of the top surface (TD plane and the x1x2 plane in Figure 3 and Figure 4) along the thickness direction (the x3 axis) with respect to the position of the cameras. The measurements were made during tensile tests. The change ∆L corresponds to the half of thickness change of the specimens. This is because the center of the specimens along the x3 axis was kept constant during plastic tensile deformation, and thickness reduction may be symmetrical for the top and its back surfaces. The positive direction of the x3 axis is the inside to outside direction for the top surface of specimen. Hence ∆L decreases when thickness reduction occurs.
The ∆L values were almost the same at various positions on the top surface during uniform plastic deformation up to UTS. Local variations of ∆L occurred when deformation exceeded the state of UTS. We, hence, defined ∆L = 0 when the specimens were at the state of UTS and measured the variation of ∆L during the subsequent plastic deformation. After the state of UTS, measured values of ∆L for each specimen show that the region of the largest reduction in ∆L corresponds to the region of the largest shear strain. We measured such ∆L as ∆LZ at the locations of most concentrated shear strain. Figure 5 shows the relationship between ∆LZ and the increment of apparent strain after UTS (εap-UTS). As shown in Figure 5, the tensile specimens showed no significant difference in ∆LZ during the initial stage of local deformation. However, the dented specimens showed less ∆LZ than the undented specimens after approximately εap-UTS = 0.1. As shown in Figure 5 with broken lines, the undented specimens had εap-UTS values of 0.121 and 0.125, while the dented specimens had larger εap-UTS values of 0.155 and 0.168. As these results show, dented specimens enable to restrain thickness reduction during the late stage of local deformation. This is one indication of the consequences of the delay in the shear band localization due to the induced pure shear deformation during the initial stage of local deformation.

3.4. Comparison of Shear-Strain Range

To evaluate the degree of shear strain concentration on the surfaces of the dented and undented specimens, the ε12 values were measured along the solid and dashed lines shown in Figure 6a. These measurements were based on Figure 4a,b, which show the ε12 of each specimen during the late stage of local deformation. Figure 6b–d show the typical line-scan results for lines labelled from Figure 6a, respectively. We fit this result with the Lorentzian function, described by:
ε12(x) = h/(1 + (xu)2/w2),
where h is the peak value of ε12, w is the full width at half-maximum, and u is the peak position. As shown in Figure 6b, the Lorentz function fits well to the value of ε12 in all positions of the undented specimen. However, this function does not fit well to some results of the dented specimen due to the presence of two peak points as shown by the insets in Figure 6c,d.
The reason why some experimental results are deviated from Equation (4) is the occurrence of simple shear deformation along two directions, which are ECAP-SD and the direction intersecting ECAP-SD (u1,2, and u2,1). That is, these results show the occurrence of pure shear deformation and the suppression of shear strain concentration in narrow regions for the dented specimen.
Figure 7 shows the relationship between the two fitting parameters, u and h, which indicates the location of the most concentrated shear strain and the peak value of ε12, respectively. As shown in Figure 7, h values of the undented specimen are generally larger than those of the dented specimen. This result indicates that undented specimens easily cause large shear strain due to the occurrence of simple shear deformation in only one direction (u2,1), while the dented specimens could restrain the occurrence of large shear strain by pure shear deformation.
However, Figure 7 shows that both specimens have nearly equal u values, that is, their deformation behavior is similar during the late stage of local deformation. These results indicate that the processing dents only changes the deformation behavior from simple shear deformation to pure shear deformation during the initial stage, and shear band localization occurs along ECAP-SD regardless of specimen shape during the late stage. Thus, processing dents for plate specimens affects the deformation behavior in the initial stage of local deformation but not one in the late stage and the fracture behavior.

3.5. Local Deformation Behavior

On the basis of the experimental results obtained in the present study, we show the schematics of the local deformation for the undented and dented specimens in Figure 8. For the undented specimens, shear bands develop along ECAP-SD by simple shear deformation during the initial stage of local deformation. The dominant simple-shear deformation in the initial stage cause shear band localization early. Furthermore, the occurrence of many micro-shear bands in narrow regions due to the shear strain concentration causes a rapid decrease in plate thickness and eventually leads to fracture [8]. On the other hand, for the dented specimens, the shear bands developed from each of the two dents during the initial stage of local deformation. That is, the dented specimens have pure-shear-deformation zone owing to simple shear deformation in the two directions as shown in Figure 8. This extensive pure shear deformation enables to delay shear band localization. As a result of this, the delay of shear stress concentration [9,12] may cause a gradual decrease in plate thickness in the late stage owing to the suppression of the occurrence of micro-shear bands causing thickness reduction [7,24] in narrow regions, and the dented specimens are thus able to increase total elongation compared to the undented specimens.
In the present study, the dented specimens increase total elongation without decrease in UTS. Also, the stress–strain curves of both specimens are very similar until the initial stage of local deformation, and they have very high reproducibility. These results indicate the development of shear bands play a major role in local deformation for both shapes of specimens regardless of processing the dents. Furthermore, for the dented specimen, the results that the amount of simple shear deformation induced by these dents is u1,2u2,1 show that the concentration of simple shear deformation only between the dents (u1,2) did not occur. That is, developing shear bands in two directions to the same degree is important to increase total elongation. This method of increasing total elongation of UFG materials may be used in conjunction with other methods (a heat treatment or adding alloying elements). In this case, it is necessary to investigate the most suitable shape of dents according to the properties of the materials.

4. Conclusions

We attempted to increase the total elongation in tensile tests for pure UFG copper produced by ECAP. To do this, we modified the shape of the plate specimens to cause pure shear deformation effectively, which suppressed their shear band localization. By using 3D-DIC, we measured local thickness reduction of specimens during tensile deformation. Main conclusions are as follows:
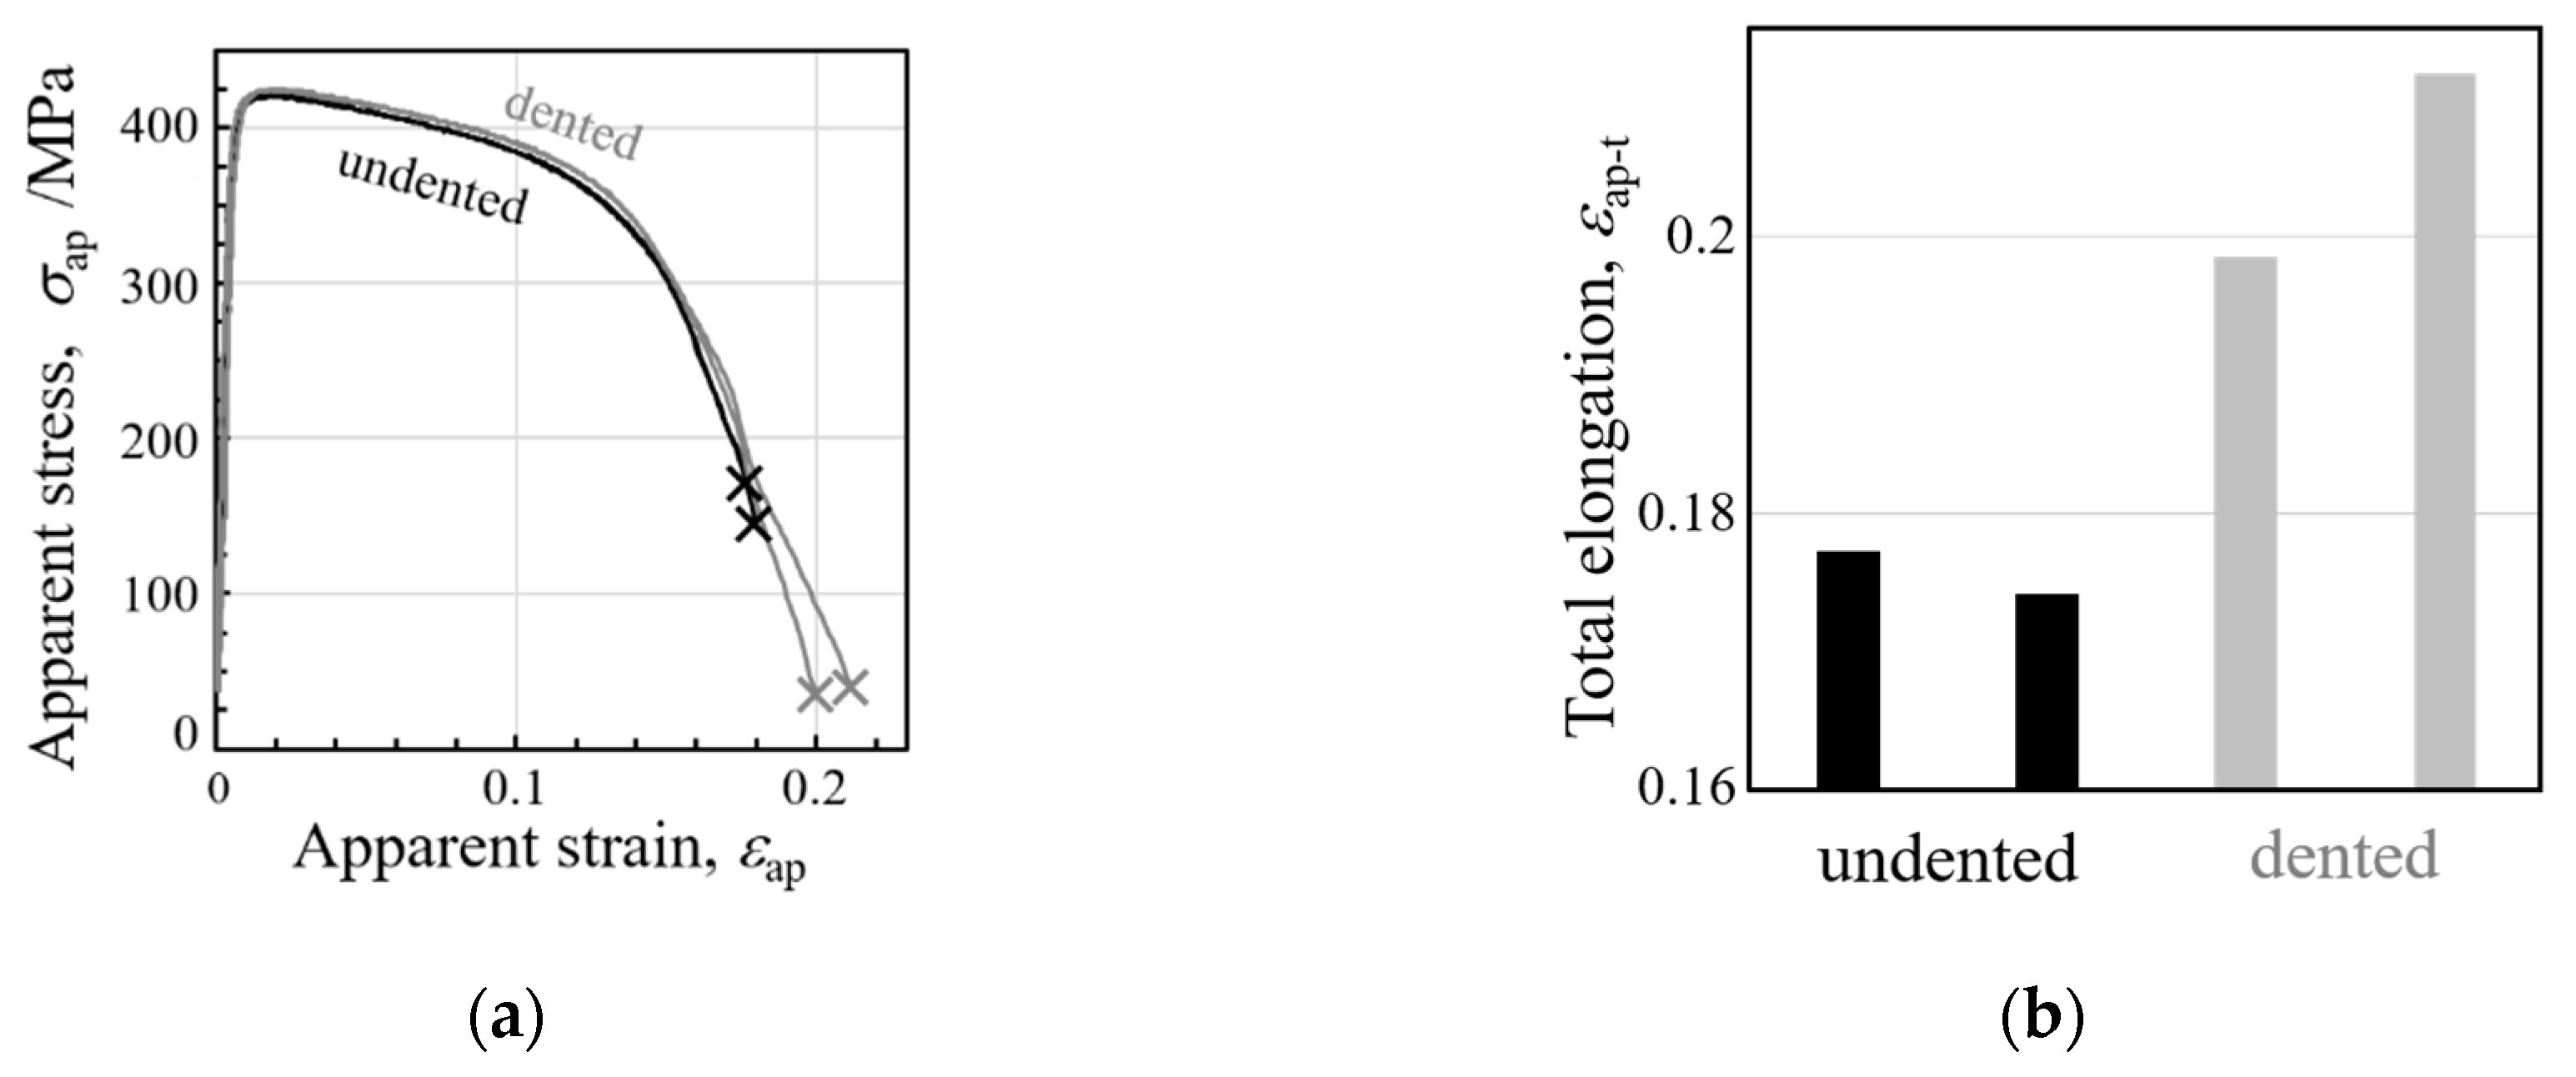
  • To increase the total elongation, we added dents to both sides of the plate specimens. The dented specimens had ~20% higher total elongation than the undented specimens, and the dents did not decrease the strength. This method provides us with a new concept to increase total elongation of UFG materials.
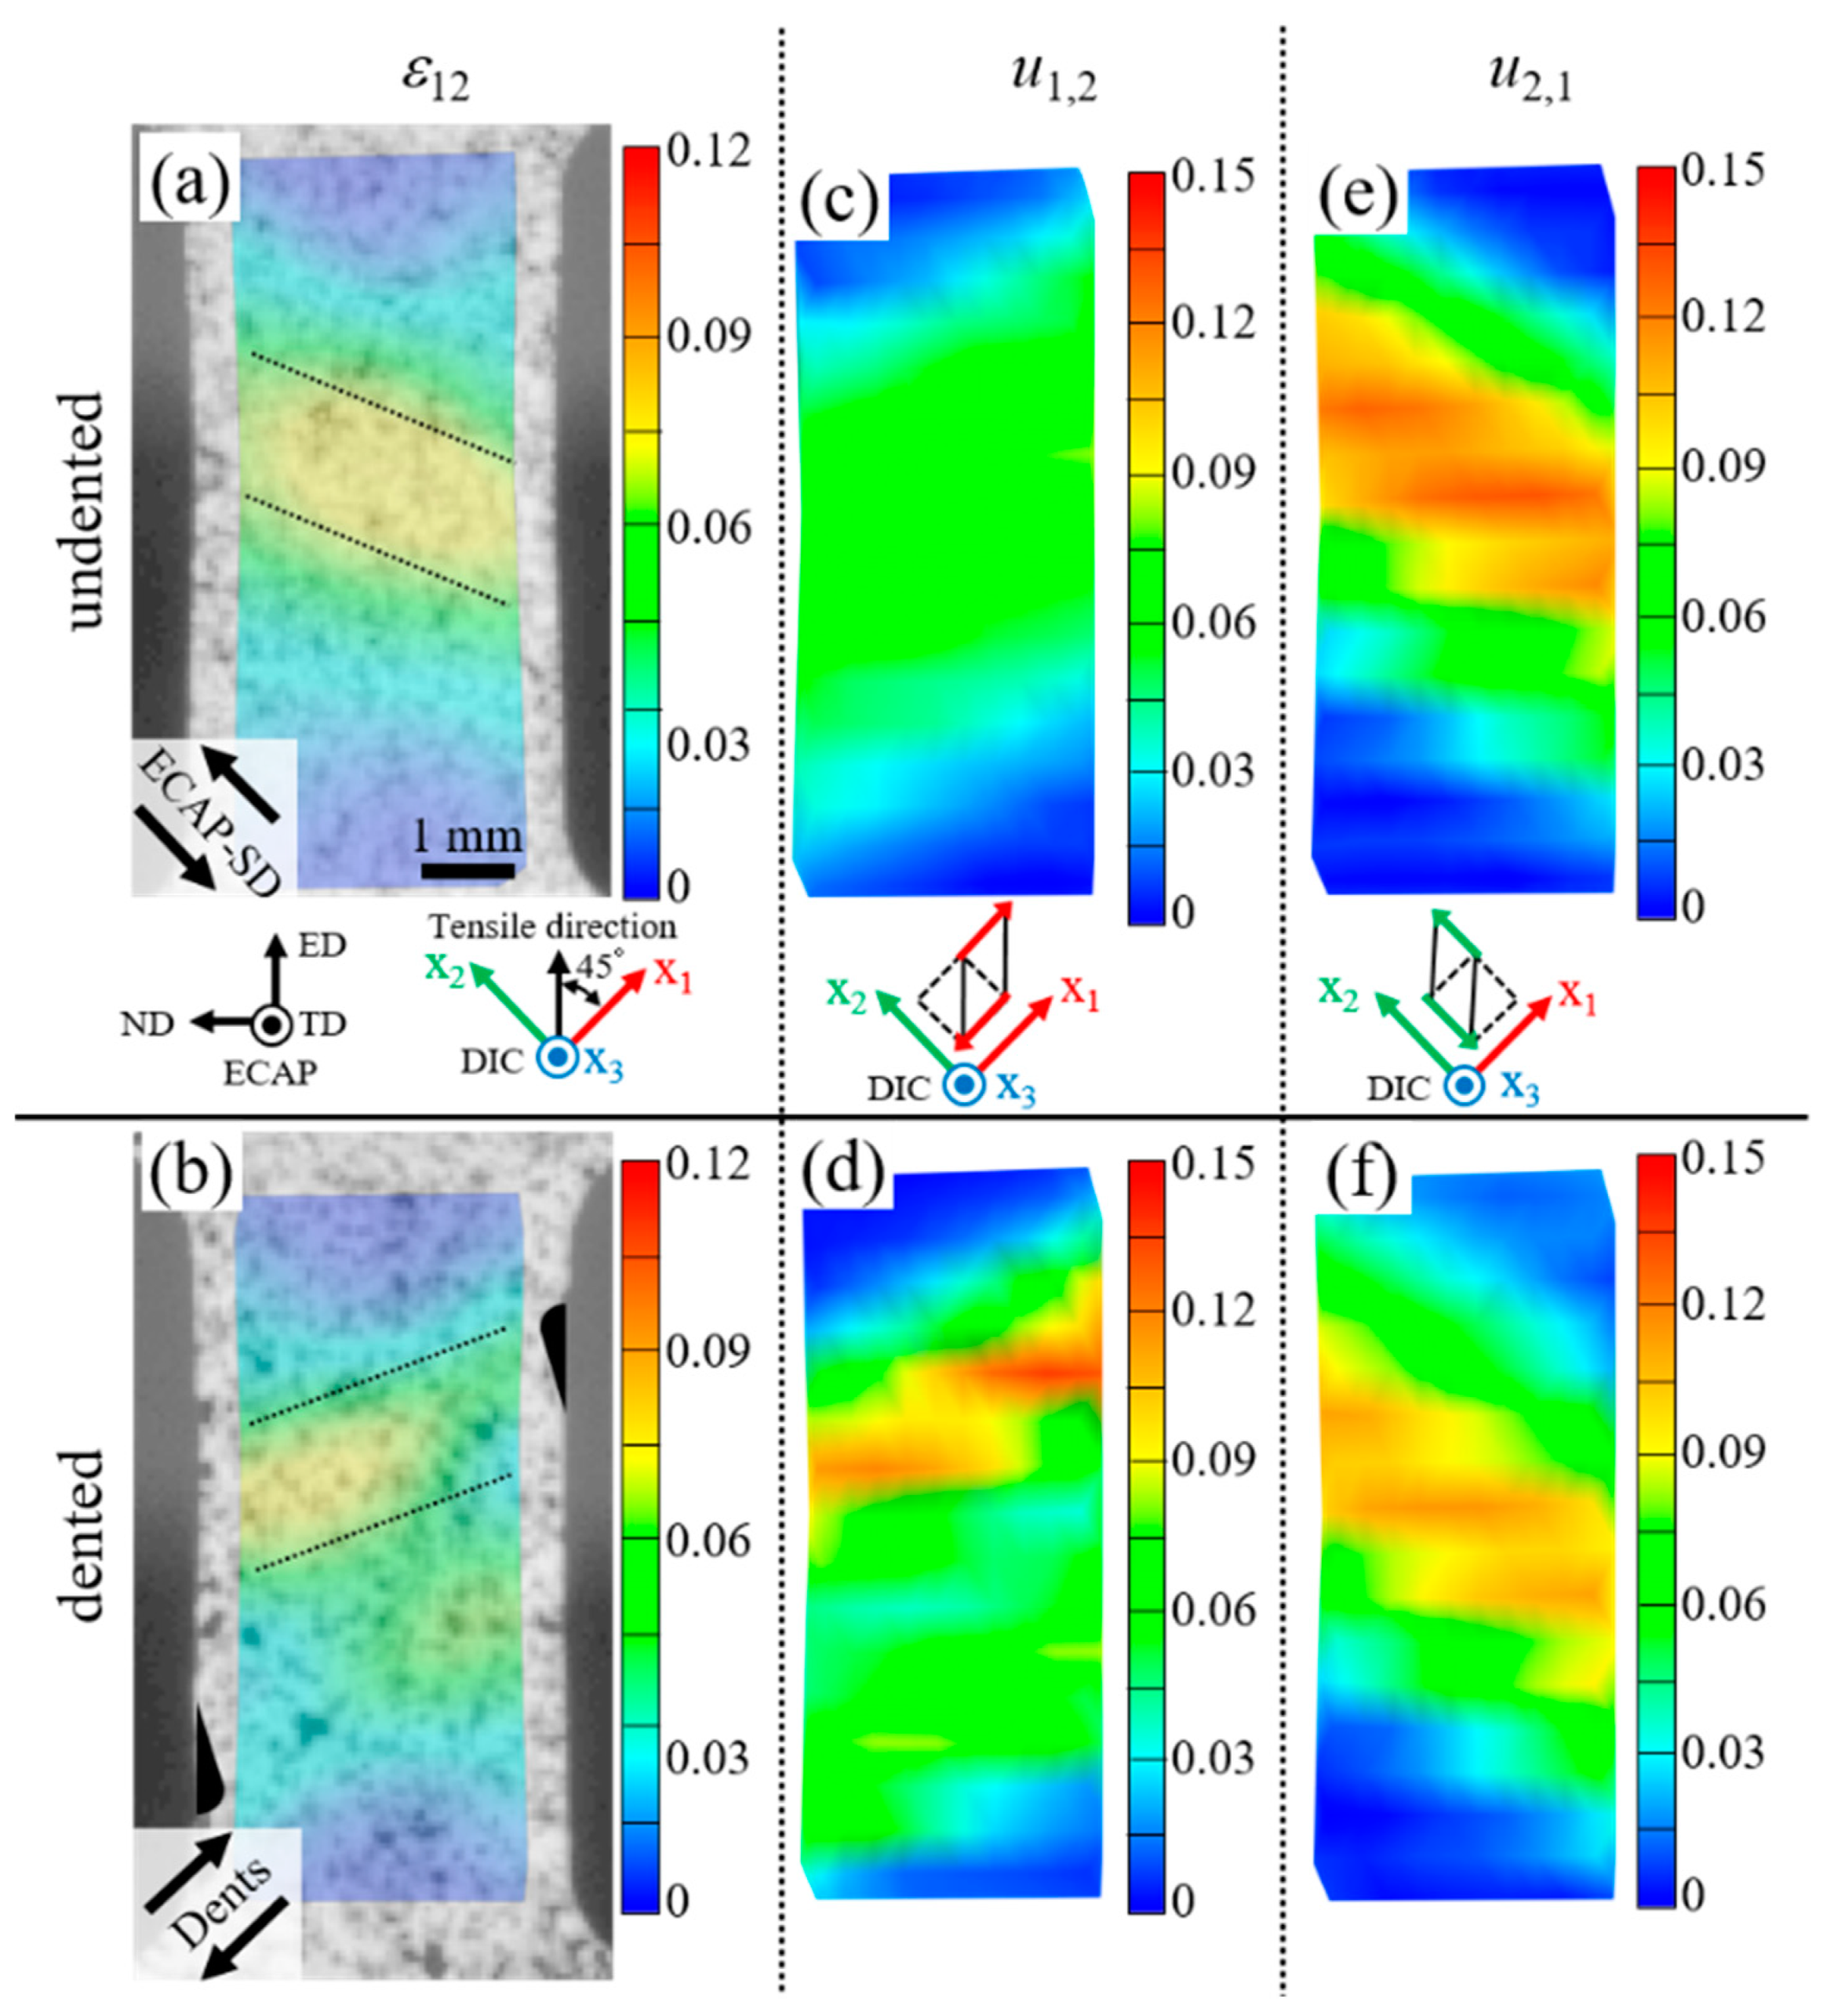
  • During the initial stage of local deformation, simple shear deformation only along ECAP-SD occurred for the undented specimen. In contrast, simple shear deformation in two directions occurred for the dented specimen. The evaluation of the shear strain concentration during the late stage of local deformation by fitting to a Lorentz function shows that the localization of shear strain is reduced in the dented specimen than in the undented specimen. These results indicate that the occurrence of shear deformation in two directions, i.e., pure shear deformation, during the initial stage of local deformation might suppress the shear band localization and increase total elongation.
  • By using 3D-DIC to measure the displacement normal to specimen surface, we found a relationship between the decrease in ∆LZ and increase in total elongation. This is due to the suppression of evolution of many micro-shear bands in narrow regions which cause a rapid decrease in plate thickness. The fact that there is no significant difference in the shape of stress–strain curves for either specimen suggests that processing the dents affects only shear deformation behavior during local deformation.

Author Contributions

Conceptualization, R.M. and S.O.; methodology, R.M., N.N. and S.O.; investigation, R.M.; validation, R.M., N.N. and S.O.; formal analysis, R.M., N.N. and S.O.; data curation, R.M.; writing—original draft preparation, R.M. and S.O.; writing—review and editing, R.M. and S.O.; All authors have read and agreed to the published version of the manuscript.

Funding

This research received no external funding.

Acknowledgments

The authors would like to thank Takumi Nagasoko for technical assistance with the experiments.

Conflicts of Interest

The authors declare no conflict of interest.

References

  1. Azushima, A.; Kopp, R.; Korhonen, A.; Yang, D.Y.; Micari, F.; Lahoti, P.; Groche, G.D.; Yanagimoto, J.; Tsuji, N.; Rosochowski, A.; et al. Severe plastic deformation (SPD) processes for metals. CIRP Ann. Manuf. Tschnol. 2008, 57, 716–735. [Google Scholar] [CrossRef]
  2. Koch, C.C. Optimization of strength and ductility in nanocrystalline and ultrafine grained metals. Scr. Mater. 2003, 49, 657–662. [Google Scholar] [CrossRef]
  3. Zhu, Y.T.; Liao, X. The fundamentals of nanostructured materials processed by severe plastic deformation. Nat. Mater. 2004, 3, 58–63. [Google Scholar] [CrossRef]
  4. Fang, D.R.; Zhang, Z.F.; Wu, S.D.; Huang, C.X.; Zhang, H.; Zhao, N.Q.; Li, J.J. Effect of equal channel angular pressing on tensile properties and fracture modes of casting Al–Cu alloys. Mater. Sci. Eng. A 2006, 426, 305–313. [Google Scholar] [CrossRef]
  5. Valiev, R.Z.; Sergueeva, A.V.; Mukherjee, A.K. The effect of annealing on tensile deformation behavior of nanostructured SPD titanium. Scr. Mater. 2003, 49, 669–674. [Google Scholar] [CrossRef]
  6. Zhao, Y.H.; Bingert, J.F.; Topping, T.D.; Sun, P.L.; Liao, X.Z.; Zhu, Y.T.; Lavernia, E.J. Mechanical behavior, deformation mechanism and microstructure evolutions of ultrafine-grained Al during recovery via annealing. Mater. Sci. Eng. A 2020, 772, 138706. [Google Scholar] [CrossRef]
  7. Yang, K.; Ivanisenko, Y.; Caron, A.; Chuvilin, A.; Kurmanaeva, L.; Scherer, T.; Valiev, R.Z.; Fecht, H.-J. Mechanical behaviour and in situ observation of shear bands in ultrafine grained Pd and Pd–Ag alloys. Acta Mater. 2010, 58, 967–978. [Google Scholar] [CrossRef]
  8. Fang, D.R.; Duan, Q.Q.; Zhao, N.Q.; Li, J.J.; Wu, S.D.; Zhang, Z.F. Tensile properties and fracture mechanism of Al–Mg. Mater. Sci. Eng. A 2007, 459, 137–144. [Google Scholar] [CrossRef]
  9. Segal, V.M. Deformation mode and plastic flow in ultra fine grained metals. Mater. Sci. Eng. A 2005, 406, 205–216. [Google Scholar] [CrossRef]
  10. Segal, V.M. Materials processing by simple shear. Mater. Sci. Eng. A 1995, 197, 157–164. [Google Scholar] [CrossRef]
  11. Orlov, D.; Vinogradov, A. The control of texture to improve high-cyclic fatigue performance in copper after equal channel angular pressing. Mater. Sci. Eng. A 2011, 530, 174–182. [Google Scholar] [CrossRef]
  12. Segal, V.M. Severe plastic deformation simple shear versus pure shear. Mater. Sci. Eng. A 2002, 338, 331–344. [Google Scholar] [CrossRef]
  13. Furui, M.; Xu, C.; Aida, T.; Inoue, M.; Anada, H.; Langdon, T.G. Superplasticity in a Mg-8 mass%Li Two-Phase Alloy Processed by an ECAP Method. J. Jpn. Inst. Met. 2006, 70, 729–734. [Google Scholar] [CrossRef] [Green Version]
  14. Qu, S.; An, X.H.; Yang, H.J.; Huang, C.; Yang, X.G.; Zang, Q.S.; Wang, Z.G.; Wu, S.D.; Zhang, Z.F. Microstructural evolution and mechanical properties of Cu–Al alloys subjected to equal channel angular pressing. Acta Mater. 2009, 57, 1586–1601. [Google Scholar] [CrossRef]
  15. Tian, Y.Z.; Zhao, L.J.; Park, N.; Liu, R.; Zhang, P.; Zhang, Z.J.; Shibata, A.; Zhang, Z.F.; Tsuji, N. Revealing the deformation mechanisms of Cu-Al alloys with high strength and good ductility. Acta Mater. 2016, 110, 61–72. [Google Scholar] [CrossRef]
  16. Koizumi, T.; Kuroda, M. Grain size effects in aluminum processed by severe plastic deformation. Mater. Sci. Eng. A 2018, 710, 300–308. [Google Scholar] [CrossRef]
  17. Tański, T.; Snopiński, P.; Pakieła, W.; Borek, W.; Prusik, K.; Rusz, S. Structure and properties of AlMg alloy after combination of ECAP and post-ECAP ageing. Arch. Civ. Mech. Eng. 2016, 16, 325–334. [Google Scholar] [CrossRef]
  18. Matsutani, R.; Miyajima, Y.; Onaka, S. Refinement and coarsening of grains caused by tensile-shear tests in ultra-fine grained cu processed by severe plastic deformation. Mater. Trans. 2019, 60, 751–757. [Google Scholar] [CrossRef] [Green Version]
  19. Iwahashi, Y.; Horita, Z.; Nemoto, M.T.; Langdon, G. Two-dimensional digital image correlation for in-plane displacement and strain measurement. Acta Mater. 1998, 46, 3317–3331. [Google Scholar] [CrossRef]
  20. Pan, B.; Qian, K.; Xie, H.; Asundi, A. Two-dimensional digital image correlation for in-plane displacement and strain measurement. Meas. Sci. Technol. 2009, 20, 062011. [Google Scholar] [CrossRef]
  21. Yu, X.; Li, L.; Qin, D.; Liu, S.; Li, Y. Improvement on dynamic fracture properties of magnesium alloy AZ31B through equal channel angular pressing. Eng. Fract. Mech. 2017, 181, 87–100. [Google Scholar] [CrossRef]
  22. Sutton, M.A.; Yan, J.H.; Tiwari, V.; Schreier, H.W.; Orteu, J.J. The effect of out-of-plane motion on 2D and 3D digital. Opt. Laser Eng. 2008, 46, 746–757. [Google Scholar] [CrossRef] [Green Version]
  23. Zhang, Z.F.; Eckert, J. Unified tensile fracture criterion. Phys. Rev. Lett. 2005, 94, 094301. [Google Scholar] [CrossRef] [PubMed] [Green Version]
  24. Sabirov, I.; Estrin, Y.; Barnett, M.R.; Timokhina, I.; Hodgson, P.D. Tensile deformation of an ultrafine-grained aluminium alloy: Micro shear banding and grain boundary sliding. Acta Mater. 2008, 56, 2223–2230. [Google Scholar] [CrossRef]
Figure 1. Schematics of the specimen shapes. The coordinate axes of ECAP (TD: transverse direction, ND: normal direction, ED: extrusion direction, ECAP-SD: shear direction of final ECAP) are also shown. (a) The undented specimen. (b) The dented specimen, which had semi-teardrop-shaped dents on both sides. An enlarged view of the dent is also shown. The two dents were intended to produce simple shear deformation (SSD) in the region shown by the white dashed lines.
Metals 10 00654 g001
Figure 2. (a) Tensile results of the undented and dented specimens showing the relationship between the apparent stress εap and strain εap. The “X” marks are the fracture points of each specimen. (b) Total elongation εap-t of the undented and dented specimens.
Metals 10 00654 g002
Figure 3. Maps of shear deformation on the surface during the initial stage of local deformation (εap = 0.060). The coordinate systems of ECAP and DIC are also shown. (a,b) show ε12 in the undented and dented specimens, respectively; (b) shows the initial position of dents and the direction of simple shear deformation caused by the dents; (c,d) show u1,2 in the undented and dented specimens, respectively; (e,f) show u2,1 in the undented and dented specimens, respectively; (c,e) show schematics of simple shear deformation described by u1,2 and u2,1, respectively.
Metals 10 00654 g003
Figure 4. Maps of shear deformation on the surface during the late stage of local deformation (εap = 0.155). The coordinate systems of ECAP and DIC are also shown. (a,b) show ε12 in the undented and dented specimens, respectively; (b) shows the direction of simple shear deformation intended by the dents; (c,d) show u1,2 in the undented and dented specimens, respectively; (e,f) show u2,1 in the undented and dented specimens, respectively; and (c,e) show schematics of simple shear deformation described by u1,2 and u2,1, respectively.
Metals 10 00654 g004
Figure 5. Changes in thickness of the dented and undented specimens. The broken line shows ∆LZ = −0.09 mm.
Metals 10 00654 g005
Figure 6. (a) Solid lines and broken lines show the positions where the line scan measuring ε12 was done. Solid lines (a) show the positions where the line scans are shown in (b,c), and (d,b) The result of the undented specimen. u and h are the peak position and the position where the maximum ε12 was measured, respectively. (c,d) show the results for the left and right sides of the dented specimen, respectively. Enlarged views show the regions out of the fitting curve.
Metals 10 00654 g006
Figure 7. Fitting parameters u and h for the dented and undented specimens.
Metals 10 00654 g007
Figure 8. Schematic illustrations of deformation behavior for undented and dented specimens. (PSD: pure shear deformation).
Metals 10 00654 g008

