Abstract
Changes in the reactor pressure vessel (RPV) material properties due to neutron irradiation are monitored by means of surveillance specimen programs, which are used for realistic evaluation of the RPVs’ lifetime. Due to a limited number of surveillance specimens, the evaluation of reconstitution methods by various welding techniques after Charpy impact tests is of great importance. Time-of-flight (TOF) neutron diffraction method was used to determine the residual stress distributions and microstructural changes in Charpy specimens welded by arc stud, electron, and laser beam welding techniques. The lowest level of the residual stress in weld seams regions was found for the specimen welded by electron beam with optimal parameters as compared to other techniques. At the same time, this specimen exhibits the maximal level of microstrain, which points to high dislocation density in the material. The corresponding contributions to the yield strength due to various strengthening mechanisms were estimated.
1. Introduction
The control of the reactor pressure vessel (RPV) metal condition during its lifetime and guarantee of the reactor vessel integrity under normal operating conditions, as well as during any design accidents is one of the vital problems of modern nuclear power engineering. This is a prerequisite for the safe operation of a shell-type nuclear reactor. During the reactor operation, the RPVs are exposed to intense neutron irradiation, which results in reactor vessel steel deterioration and severe changes in its physical and mechanical properties manifested mainly as increased brittleness. For this reason, special monitoring programs are used to control the RPV metal condition by means of surveillance specimens, which are located near reactor vessel and are made of the same material. The monitoring program defines the number of surveillance specimens, the periodicity of their extraction, testing method, the data registration, and processing. In order to characterize the irradiation-induced changes in RPV material, the mechanical Charpy impact test is used to classify the brittle or ductile state of a metal. Surveillance specimens program based on results of their mechanical tests provides verification of the project design characteristics of brittle fracture resistance, evaluation of the RPV functionality, and the material testing maintenance of its operation over the whole project period.
The results of mechanical tests and monitoring data of radiation exposure quite often indicate the possibility of extending the lifetime of RPV. However, support of reactor vessel operation beyond the project period usually is not provided within the regular program since the surveillance capsules usually contain a limited number of Charpy specimens as well as tensile specimens, and sometimes fracture toughness specimens. In this connection, the problem of surveillance specimens’ reconstitution after mechanical tests using various types of welding techniques becomes especially important. Instead of disposing of the tested materials, the specimens are reconstituted by welding method and returned to the reactor for further irradiation. The aim of such a reconstitution is to increase the number of irradiated RPV steel specimens to obtain representative and reliable data, which are used to estimate the radiation embrittlement of RPV material for confirmation or prolongation of its operation lifetime [1,2,3]. In practice, several techniques [4,5,6] such as arc stud welding (ASW), electron beam welding (EBW), laser beam welding (LBW) are used for reconstitution technology. The test surveillance Charpy-V type specimens were welded according to ASTM E1253-13 standard for reconstitution of Charpy-sized specimens and ISO 13919-1:1996 standard for electron and laser beam welding.
In order to maintain the representativeness of the data, the reconstitution procedure by welding technique should not significantly modify the structure and mechanical properties of the material. Nevertheless, in each welded joint the heat cycle of the welding process leads to structural changes and residual stress formation. Usually residual stresses are formed in welded structures as the result of differential contractions, which occur as the weld metal solidifies and cools down to the ambient temperature. The residual stress level also depends on the clamping method and welding parameters. The use of a lower heat input, e.g., electron or laser beam welding, allows one to reduce residual stress level occurring during welding. The study of the mechanisms of welding stresses and deformations has essential importance for solving the following problems: (i) assessing the probability of cracking in welded joints; (ii) the analysis of residual stress distribution; and level and their influence on the strength of a welded structure; (iii) for answers to questions concerned with the issue of dimensional tolerance and deviations in the welded structure.
There are various ways of determining residual stresses using numerical techniques [7,8,9] or direct experimental measurements [10]. Over many years, internal residual stresses in materials have been studied using non-destructive experimental methods, such as X-ray [11], magnetic and ultrasonic methods [12]. However, all these methods have certain limitations. For example, the X-ray diffraction can be used for studying residual stresses only near the material surface due to the small penetration depth. The magnetic and ultrasonic methods results are significantly affected by the material texture. The residual stress investigation by neutron diffraction receive a lot of attention due to high penetration depth of neutrons (up to two to three centimeters for steels and up to ten centimeters for aluminum), high spatial resolution, applicability for multiphase materials, the non-destructive character of the method, possibility to characterize materials microstructure, and defects (microstrain, coherently scattering crystallite size, dislocation density, etc.) [13]. In recent years, some authors have investigated welding residual stresses combining experimental methods (contour method or neutron diffraction) with computational modeling [14,15,16,17].
Therefore, the main aim of the current research was the experimental determination and comparison of residual stresses and microstrain distributions in the test Charpy specimens reconstituted by various welding techniques.
2. Materials and Methods
2.1. Welding Techniques for Surveillance Charpy-V Type Specimens Reconstitution
The material used in current study was a non-irradiated low-alloy structural steel 18MND5 widely used in nuclear industry for RPV manufacturing. The chemical composition of 18MND5 ferritic steel is given in Table 1. Each specimen was welded from the central part (insert) with 10 mm × 10 mm × 10 mm dimension and two end tabs with 10 mm × 10 mm × 22.5 mm dimensions. Thus, the reconstituted surveillance specimens had dimensions of 10 mm × 10 mm × 55 mm (Figure 1).

Table 1.
Chemical composition of 18MND5 steel (wt%).
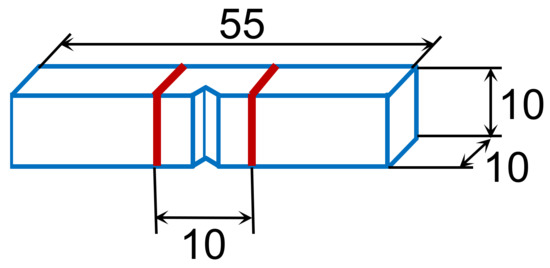
Figure 1.
Layout of the standard size Charpy specimen (10 mm × 10 mm × 55 mm) after reconstitution by welding technique with two weld seams and V-notch at the center of the specimen.
For residual stresses studies, two test surveillance Charpy specimens (EBW1 and EBW2) were produced using electron-beam welding unit ESW300/15-60 (Leybold-Heraeus, Köln, Germany). The laser beam welding experiments were carried out using a 45 kW continuous wave CO2 laser with 20 L/min of protective He gas [6]. In between the specimens, slices of RPV material were introduced in order to prevent material flow at the specimen edges. For the current study, one LBW1 specimen with standard size inset of 10 mm and one LBW2 specimen with non-standard size inset of 15 mm were prepared.
Additionally, one ASW specimen was produced using arc stud welding. The specimen consisted of two parts, and therefore, had one weld seam. During EBW, ASW, and LBW processes, temperature control measurements were carried out with K-type thermocouples of 1 mm diameter, brazed into dummy inserts positioned at the outer positions in the specimen rig. The signals from the thermocouples were recorded with a multi-channel data acquisition system. A list of all studied specimens and welding parameters are presented in Table 2.
Table 2.
Studied specimens and welding parameters.
2.2. Residual Stresses Measurements by Neutron Diffraction
In this paper, the residual stresses in Charpy test samples were studied by time-of-flight (TOF) neutron diffraction method, which allows to investigate the structure of polycrystalline materials and determine the lattice strains along each [hkl] direction. The neutron diffraction method is very similar to the X-ray technique. However, in contrast to the characteristic X-ray radiation, the energy spectrum of thermal neutrons has a continuous (Maxwellian distribution) character. The velocity of thermal neutrons is rather small and this gives the opportunity to analyze the neutron energy using its time-of-flight during the experiment at a pulsed neutron source. Depending on the neutron wavelength, the peak position on the time-of-flight scale is defined by the condition:
where L is the total flight distance from a neutron source to detector, v is the neutron velocity, λ is the neutron wavelength, m is the neutron mass, h is Planck’s constant, d is the interplanar spacing, and θ is the Bragg angle.
Thus, on two-axis diffractometer at a neutron source with continuous flux (nuclear reactor), the strain is determined by the change in the scattering angle −Δθ⋅cotθ. When using the TOF method at a pulsed neutron source, the crystal lattice strain is determined by the relative change in the neutron time of flight Δt/t.
The essence of the neutron diffraction method for studying stresses is rather simple, and in conventional experimental design, consists of incident and scattered neutron beam shaping using diaphragms or radial collimators and definition of a small scattering volume (gauge volume) in the bulk of the specimen (Figure 2a). Internal stresses existing in a material cause corresponding crystal lattice strains, which in turn, results in shifts of Bragg peaks in the diffraction spectrum. This gives direct information on changes in interplanar spacing in a gauge volume, which can be easily transformed into data on internal stresses, using known Young’s modulus and Poisson’s ratio of a material.
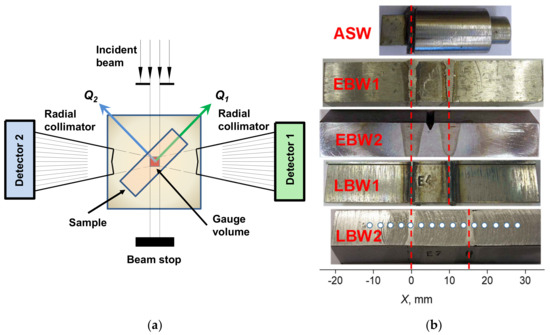
Figure 2.
(a) Scheme of the experiment for residual stress investigation in a bulk object. Incident and scattered (at the scattering angles 2θ = ± 90°) neutron beams are restricted by diaphragm and radial collimators shaping a small gauge volume within the specimen [18]. Measurement of neutron diffraction spectra by ± 90°-detectors allows simultaneous determination of the lattice strains in two mutually orthogonal directions. (b) The investigated Charpy specimens reconstituted by various welding techniques. Weld seams positions are indicated by vertical dash lines. For LBW2, specimen scan points are shown. The similar scans were performed for all studied specimens.
The experiments were carried out on high-resolution Fourier stress diffractometer (FSD) at the IBR-2 pulsed neutron source in Frank Laboratory of Neutron Physics of the Joint Institute for Nuclear Research, Dubna, Russia [18]. The FSD diffractometer was specially designed for residual stress studies in bulk industrial components and new advanced materials. On FSD, a special correlation technique is used to achieve a high-resolution level of the diffractometer-a combination of the fast Fourier chopper for the primary neutron beam intensity modulation and the reverse time-of-flight (RTOF) method for data acquisition [19]. This allows to obtain high-resolution neutron diffraction spectra (Δd/d ≈ 2·× 10−3 for backscattering detector and Δd/d ≈ 4·× 10−3 for ± 90°-detectors at d = 2 Å) with the fairly short flight distance (~6.6 m) between Fourier chopper and neutron detectors [20].
During the experiment on the FSD neutron diffractometer, a small gauge volume with dimensions of 2 mm × 2 mm × 10 mm was defined in the depth of the studied specimen using radial collimator in front of the 90° detector. The specimen was scanned by defined gauge volume in the middle part across the weld region assuming the coincidence the directions of the main components of residual strain tensor with the specimen principal axes (Figure 2b). Thus, orienting specimen axes in consecutive order along neutron scattering vector Q direction and moving it in the required directions, three main components of residual strain tensor were measured at each scan point. All main diffraction peaks of the neutron TOF-spectra were indexed in the frame of the body-centered cubic structure with the space group Im3m and the lattice constant a0 ≈ 2.866 Å. The experimentally obtained neutron diffraction patterns were processed using full profile analysis based on the Rietveld method [21] in order to obtain the lattice parameter values and the diffraction peak broadening parameters. The crystal lattice strain was determined as
where a is the measured lattice parameter and a0 is the lattice parameter for a stress-free reference material.
The components of the residual stress tensor were determined from the measured residual strain components according to the Hooke’s law:
where ii = X, Y, Z, σii and εii are components of the stress and strain tensors, respectively, E is Young’s modulus and ν is Poisson’s ratio.
3. Results and Discussion
3.1. Residual Stresses Distributions in Reconstituted Charpy Specimens
The residual stress distributions exhibit alternating sign characters for all studied Charpy specimens (Figure 3). The typical error values for residuals stresses are estimated as ΔσErr ≈ 20–30 MPa.
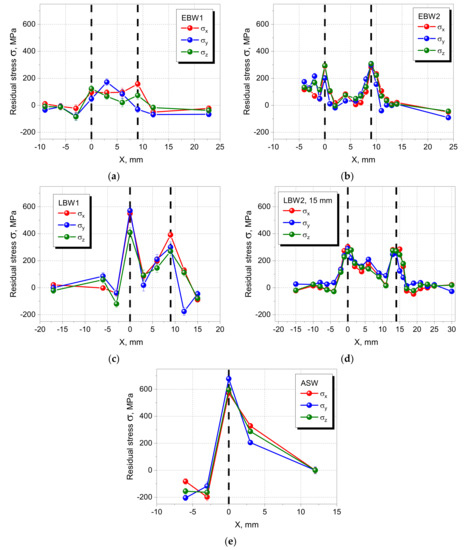
Figure 3.
Residual stress distributions vs. scan coordinate X in test Charpy specimens reconstituted by various welding techniques. Specimens studied: EBW1 (a), EBW2 (b), LBW1 (c), LBW2 (d) and ASW (e). Centers of weld seams are at X = 0 and X = 9 mm (X = 14 mm for LBW2), except ASW specimen with one weld seam at X = 0 mm. Thick vertical dash lines indicate weld seams positions.
The EBW specimens demonstrate the residual stress level varying from −85 MPa to 172 MPa for EBW1 and from −91 MPa to 308 MPa for EBW2, correspondingly. The inequality observed in the stress level for EBW1 and EBW2 specimens can be explained by different beam current values used during welding procedure: I = 50 mA for EBW1 and I = 75 mA for EBW2. The higher beam current value leads to higher amount of introduced heat during EBW process, and consequently, to the higher values of residual stress level. The similar discrepancy between two LBW specimens was found, which can be explained by difference in heat input. The LBW1 specimen with standard size inset of 10 mm exhibits quite high stress level (from −175 MPa to 570 MPa), while for the LBW2 specimen with non-standard size inset of 15 mm, the reduced stress level (from −47 MPa to 303 MPa) was observed. The ASW specimen exhibits highest stress level varying from −204 MPa to 678 MPa.
Maxima of residual stress distributions coincide quite well with the positions of weld seams, except the EBW1 specimen, where smoother stress distribution is observed. It should be noted that in the middle part of the EBW2, LBW1, and LBW2 specimens, a reduced level of residual stresses is observed between weld seams positions, while for EBW1 specimen, no stresses relaxation was detected. As expected, for all specimens the residual stresses are falling down in regions distant from the weld zone.
Recently the residual stresses in similar Charpy specimens welded by electron beam were investigated using constant wavelength neutron diffraction [22]. The data obtained in this research confirmed the presence of noticeable residual stresses in Charpy specimens reconstituted by electron beam welding. It was found that residual stresses distribution exhibits maxima at weld seams positions with maximal stress values of 430–550 MPa. Welding residual stresses may greatly impair mechanical properties of a material causing brittle fractures, reducing fatigue strength and corrosion resistance, diminishing the stability limit, etc. As it was demonstrated in [23,24] the residual stresses level can affect the results of Charpy impact tests. In this research work, the residual stress distributions in Charpy specimens manufactured by the arc welding technique were investigated by X-ray diffraction method. The maximal level of residual stresses in studied specimens was ~300–350 MPa. From results of complementary Charpy impact tests, the decrease in absorbed energy by approximately 15% with corresponding increase in residual stresses was reported.
3.2. Diffraction Peak Broadening Analysis
During neutron experiments, diffraction peaks in spectra measured from investigated Charpy specimens exhibited additional broadening. In accordance to [25], the peak broadening effect was more pronounced at the centers of the welded joints due to the change in the material microstructure during weld process (Figure 4a). For further analysis, the individual diffraction peaks were fitted by Voigt function using the least-squares method (Figure 4b).
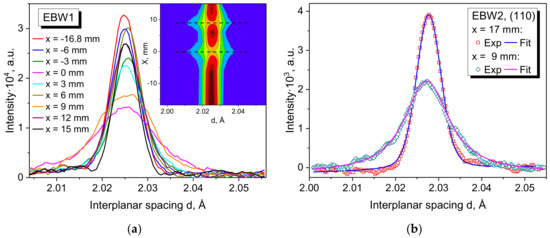
Figure 4.
(a) The diffraction peak (110) shape changes during scan across weld seams for EBW1 specimen. Inset: 3D intensity map of the neutron diffraction pattern near (110) reflection during scan across weld seams. The dashed lines indicate the positions of the weld seams centers. (b) The result of diffraction peak (110) fit with a Voigt function at weld seam center (X = 9 mm), and in the base material (X = 17 mm).
It is remarkable that in the sample regions remote from the weld seam zone, the main contribution to the total peak width gives the Gaussian component of the peak. At the same time, in the weld centers and heat-affected zone (HAZ) regions, the Lorentzian component is predominant (Figure 5a), which can be explained by influence of the small sizes of crystallites on the peak broadening effect. In order to determine contributions to the total peak width from crystal lattice microstrain and from crystallites size, the Williamson–Hall type dependencies Δd2(d2) were plotted for all measured spectra (Figure 5b). The careful analysis of the peak broadening Δd2(d2) revealed characteristic anisotropic deviations from the linear dependence. The effect is more pronounced for (h00) and (hhh) reflections. Usually, such a deviation is associated with anisotropic microstrain, caused by elastic stress fields near the dislocations in the material. In this case, the anisotropic peak broadening effect is defined by variations in the dislocation contrast factor [26]. T. Ungár et al. [27] proposed a model that takes into account the given anisotropy for non-textured polycrystalline materials with cubic symmetry. Within this approach, the anisotropic diffraction peak broadening depends on the dislocation contrast factor as follows:
where K = 2sinθ/λ = 1/d is scattering vector, ΔK = (Δd/d)⋅K = Δd/d2 is the peak width at half maxima with subtracted instrument resolution function, ⟨D⟩ is the crystallite size, M is the constant determined by the effective radius of the dislocation cut-off, ρ is the dislocation density, b is the Burgers vector, is the average dislocation contrast factor, are the higher order residual terms, A and B are constants related to the elastic constants of the crystal, the effective radius of the dislocation cut-off and type of dislocations (edge or screw), H2 = (h2k2 + h2l2 + k2l2)/(h2 + k2 + l2)2 is orientation factor, h, k, l are the Miller indices, q is a experimentally determined parameter of edge/screw dislocation ratio, is the average dislocation contrast factor for the (h00) reflection and is determined by the elastic parameters of the material.
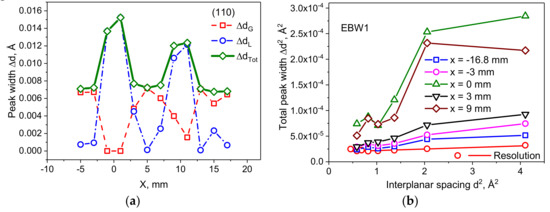
Figure 5.
(a) The diffraction peak (110) width for EBW2 specimen vs. scan coordinate X. The contributions of Gaussian (ΔdG) and Lorentzian (ΔdL) components to the total peak width (ΔdTot) are shown. (b) The dependence of total peak width Δd2 vs. d2 for spectra measured at different scan points on the specimen. The effect of dislocation contrast factor variation is especially pronounced for the points corresponding to the weld seams centers at X = 0 and X = 9 mm. For comparison, the dependence measured with standard material and corresponding to the instrument resolution function is shown.
The least square fit within the given model provides a satisfactory description of the anisotropic diffraction peak broadening. In this case, the experimental values of the peak broadening β2 agree very well with the corresponding model curve (Figure 6a). It should be emphasized that by using parameters obtained from least square fit, it is possible to construct model curves with different values of anisotropic microstrain defined by corresponding orientation factors H2 (cf. Figure 5b and Figure 6b for X = 9 mm).
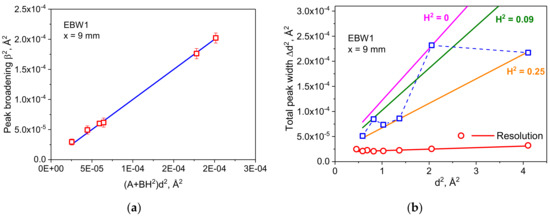
Figure 6.
(a) The dependence of peak broadening β2 vs. (A+BH2)·d2 at the weld seam center (X = 9 mm). Squares designate experimental values, and the continuous line corresponds to the least square fit. (b) The dependence of total peak width Δd2 vs. d2 at the weld seam center (X = 9 mm). The continuous lines were plotted using the least square fit results and correspond to microstrain with different values of anisotropy factor H2.
The volume-weighted crystallite size was estimated from analysis of (110) and (220) line profiles according to the Warren-Averbach approach (Figure 7a) [28]. The spherical crystallite shape is assumed and the crystallite-size distribution is taken as a lognormal distribution:
where μ and σ are adjustable parameters. In this case the volume-weighted average domain size can be calculated from the parameters of the lognormal distribution as: ⟨D⟩V = (3/4)exp(μ + 7/2σ2).
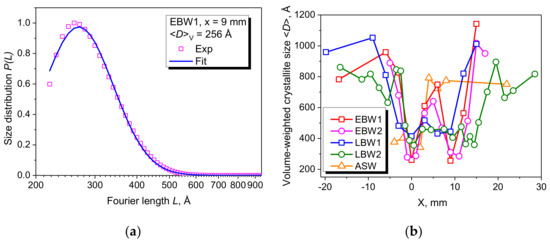
Figure 7.
(a) Distribution of crystallite sizes fitted with lognormal function. (b) Volume-weighted crystallite sizes ⟨D⟩V vs. coordinate X.
The distribution of estimated volume-weighted crystallite sizes ⟨D⟩V versus scan coordinate X is shown in Figure 7b. The effect of small crystallite size causing Lorentzian type peak broadening is clearly seen at the weld seam centers at X = 0 and X = 9 mm (X = 14 mm for LBW2 specimen).
In order to characterize material microstructure, the mean value of residual microstrain ε, averaged over all orientations (hkl) and corresponding to mean value of orientation factor <H2> = 0.2, was calculated for each Charpy specimen using parameters obtained within the described-above model (Figure 8). As it was expected, the positions of maxima in the microstrain distributions are in good agreement with the positions of the weld centers for all studied specimens. In contrast with residual stress distribution, the maximal level of microstrain is highest for EBW specimens: ε ≈ 3.9 × 10⁻³ for EBW1 and ε ≈ 3.2 × 10⁻³ for EBW2. The maximal microstrain levels for LBW and ASW specimens are ε ≈ 2.4 × 10⁻³ and ε ≈ 2.9 × 10⁻³, respectively. In areas distant from the weld seams, a significantly lower microstrain level was observed (ε ≈ 1·× 10−3), which appears to be the result of manufacturing of initial steel material. At the same time, there is a noticeable difference in the magnitude of the maxima at ~20% for EBW1 and ~14% for EBW2 specimens, which can be explained by partial relaxation of microstrain due to annealing during sequential electron beam welding of one seam after the other (see [7]). It is remarkable that for LBW1 and LBW2 specimens only partial relaxation of microstrain in the middle part between weld seams is observed while for the other specimens (EBW1, EBW2, and ASW) it falls down to values typical for non-welded material ~1 × 10⁻³.
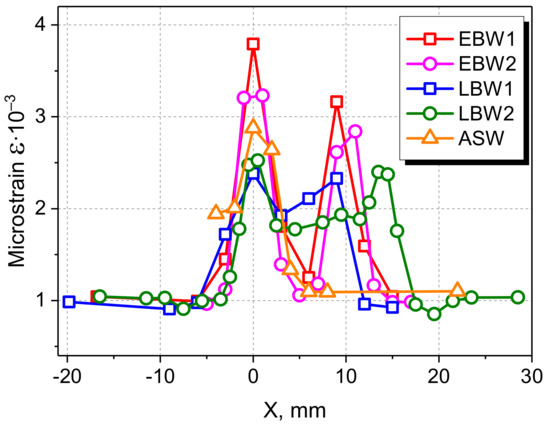
Figure 8.
Lattice microstrain distributions vs. scan coordinate X for all investigated Charpy specimens. The weld seams centers are located at X = 0 mm and X = 9 mm (X = 14 mm for LBW2).
The observed change in microstrain level at weld region is confirmed by a ~2.5 times increase in material microhardness (Figure 9). Apparently, the elevated level of microhardness is a result of forming of martensitic (or martensitic-bainitic) structure in the weld region and HAZ. Usually this process is followed by increase in dislocation density in material, which in turn causes the anisotropic diffraction peak broadening.
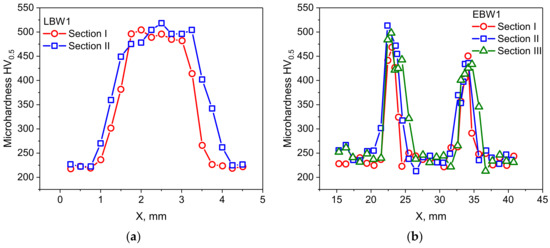
Figure 9.
Microhardness distributions for EBW1 (a) and LBW1 (b) specimens along the weld depth. Section I-8 mm from top surface, Section II-5 mm from top surface, Section III-2 mm from top surface.
In addition, the dislocation density was estimated within the above-mentioned model [27] for all studied Charpy specimens. Similarly to microstrain, the distribution of the dislocation density exhibits quite high values at weld seam centers, reaching a maximal level of 2.9 × 10¹⁵ m−2 for EBW1, 2.1 × 10¹⁵ m−2 for EBW2, 1.2 × 10¹⁵ m−2 for LBW, and 1.7 × 10¹⁵ m−2 for ASW specimens, respectively. In regions away from weld seams it decreases sharply down to ~2 × 10¹⁴ m−2 (Figure 10). As it is evident from Figure 5b, where the dependences of total peak width Δd2 vs. d2 for welded Charpy specimens and for standard material are compared, the existing peak broadening effects can be reliably measured on the FSD diffractometer, which allows one to get realistic estimates of dislocation densities and crystallite sizes. In our previous experiments with series of plastically deformed austenitic specimens, it was shown that values of dislocation density obtained from neutron TOF diffraction data within T. Ungár’s method are confirmed well by TEM results [29]. Additionally, these TOF neutron diffraction results were verified by diffraction experiments with the same material performed on the neutron diffractometer with constant wavelength [30].
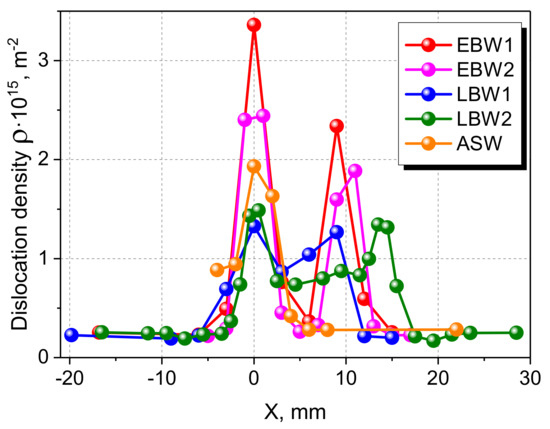
Figure 10.
Dislocation density distributions vs. scan coordinate X for all investigated Charpy specimens. The weld seams centers are located at X = 0 mm and X = 9 mm (X = 14 mm for LBW2).
Mechanical properties of materials are largely dependent on their microstructure, i.e., grain size, the number and type of defects, residual stresses, presence of impurity phases, topology of grain boundaries, the crystallographic texture, etc. Knowledge of microstructural parameters is widely used to tailor the mechanical properties of materials through various strengthening mechanisms. In general, strengthening mechanisms in metals can include dislocation strengthening, solid solution strengthening and alloying, precipitation hardening, grain boundary strengthening, and transformation hardening. In the current study, we consider only the dislocation and grain boundary strengthening mechanism in the material due to the welding process, as making the greatest contributions to the increase in yield strength [31]. The analysis of other possible strengthening mechanisms in weld regions will be a task for the next experimental studies.
The dislocation density is one of the crucial microstructural parameters affecting the yield strength, and as it was demonstrated above, it can be evaluated by diffraction peak profile analysis. Thus, the contribution of the dislocations to the materials yield strength Δσρ can be estimated using the well-known Taylor equation:
where M is the Taylor factor corresponding to the texture, b is Burgers vector, α is a geometrical constant between 0 and 1, and G is the shear modulus of the material.
Another factor influencing the yield strength is restriction of the free path of dislocations by grain boundaries of the polycrystalline material. The corresponding grain boundary strengthening can be estimated from the Hall–Petch equation:
where ΔσHP is yield strength increase due to grain boundary strengthening, K is material specific strengthening coefficient, D is grain size in a material.
Using the dislocation density distributions, the increase in the yield strength Δσρ due to dislocation strengthening relative to the value for the reference specimen of 18MND5 steel was estimated from Equation (6) with the following parameters: b = 0.2485 nm, M = 3.06, G = 80 GPa, and α = 0.3 [32,33]. The contribution to the yield strength increase due to the grain boundary strengthening ΔσHP relative to the reference material was estimated from crystallite size distributions using Equation (7) and the Hall–Petch coefficient for martensite K = 0.21 MPa/m1/2 [34] (Figure 11). Therefore, considering only dislocation and grain boundary strengthening for studied Charpy specimens and assuming a linear contribution of the strengthening mechanisms, the total yield strength can be obtained as Δσ = σ0 + Δσρ + ΔσHP, where σ0 is the sum of the lattice friction stress and the solid solution initial contribution and which is assumed to be typical for the initial material. The obtained values can be compared with the yield strength σin = 517 MPa for initial 18MND5 low alloyed steel reported in [35].
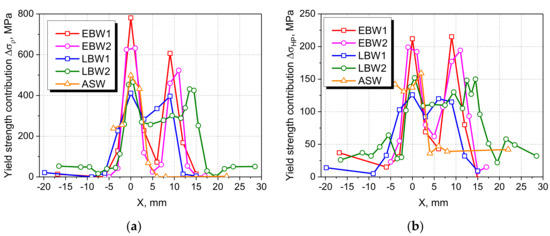
Figure 11.
Contribution to the yield strength due to due to dislocation Δσρ (a) and grain boundary ΔσHP (b) strengthening vs. scan coordinate X.
A similar approach used recently in [36] demonstrated the reliability of the yield strength estimates from the dislocation density and grain size values obtained with help of the X-ray diffraction peak profile analysis. In this work, the microstructure of low-carbon low-alloy steel was examined by X-ray diffraction and electron backscatter diffraction (EBSD) in the different states of the material (quenched, cold rolled, and annealed). Using the combination of the Hall-Petch and Taylor equations, dislocation and grain boundary strengthening contributions to the materials yield strength were estimated. The obtained results correlate well with yield strength values obtained experimentally from stress–strain curves of the material in the three different states.
The yield strength increase values Δσ as well as maximal residual stress values σmax at weld seam centers are rather high (Table 3) and indicate a significant change of the mechanical properties in weld zone and HAZ as compared to the base material. Additionally, yield strength increase due to dislocation Δσρ and grain boundary ΔσHP strengthening as well as total yield strength increase Δσ at the notch positions were estimated from measured distributions (Figure 12). An analysis of the obtained results showed that the ductile-brittle transition temperature TDBTT shows a clearly noticeable dependence on the total yield strength increase values Δσ estimated at notch positions (Figure 13). The similar correlation was found for ductile-brittle transition temperature TDBTT dependence vs. maximal value of residual stress σmax at weld seam centers. Based on these results, it can be concluded that during reconstitution of Charpy samples by the welding technique, it is necessary to avoid high residual stresses in welds and significant thermal effects at the notch area that is exposed to direct mechanical shock during impact tests. Otherwise, this can affect the impact test results and lead to an undesired shift of the ductile-brittle transition temperature TDBTT.
Table 3.
Ductile-brittle transition temperature TDBTT, maximal value of residual stress σmax, yield strength increase due to dislocation Δσρ, and grain boundary ΔσHP strengthening, total yield strength increase Δσ = Δσρ + ΔσHP estimated at weld seams positions and at the notch positions.
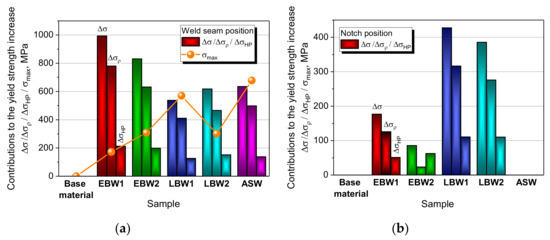
Figure 12.
Contributions to the yield strength increase due to dislocation Δσρ and grain boundary ΔσHP strengthening, total yield strength increase Δσ and maximal value of residual stress σmax at weld seam centers (a) and at notch position (b).
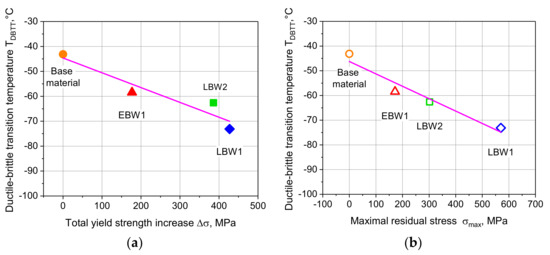
Figure 13.
Ductile-brittle transition temperature TDBTT vs. total yield strength increase Δσ estimated at notch position (a) and vs. maximal residual stress at weld seam center (b).
Finally, the FWHM parameters (full width at half maximum) for total yield strength increase Δσ distributions were estimated (Figure 14). The obtained FWHM values characterize the dimensions of HAZ zones and noticeable microstructural changes were observed. The narrowest HAZ zones were found in EBW and LBW2 joints while LBW1 and ASW joints exhibit most broad HAZ zones. It is noteworthy that such behavior is qualitatively consistent with the distribution of maximal value of residual stress σmax at weld seam centers. Most likely, this effect is defined by amount of introduced heat during welding process.
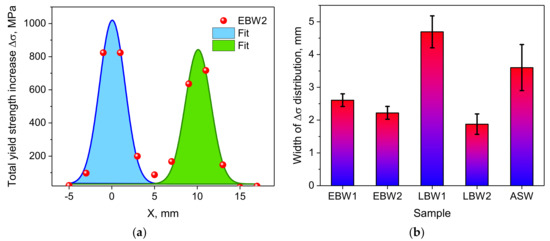
Figure 14.
(a) Distribution of the total yield strength increase Δσ = Δσρ + ΔσHP for EBW2 specimen fitted with two Gaussians. (b) Estimated FWHMs of yield strength increase Δσ distributions.
4. Conclusions
Residual stress levels and microstructural changes in the unirradiated RPV surveillance specimens, reconstituted by electron and laser beam welding and arc stud welding techniques, were investigated by high-resolution neutron TOF diffraction. The experiments have shown that the level of residual stress and dislocation density in welds can be quite high and this fact should be considered when choosing an appropriate welding technique. The main conclusions of the study are the following:
(1) Residual stress distributions along scan coordinate exhibit sharp maxima at weld seams positions. EBW technique with optimal parameters (specimen EBW1) provides relatively low residual stress level with maxima of ~172 MPa while after LBW and ASW processes significantly higher stresses generated (max. 302 ÷ 678 MPa) due to higher heat flow. The observed maxima in residual stress distributions in weld region are confirmed by a ~two-times increase in microhardness values. It should be noted that the level of residual stresses depends strongly on the welding conditions, making it possible to optimize the parameters of the welding process.
(2) On the contrary, the lowest microstrain level is observed in LBW and ASW joints, which can be explained by stronger annealing effect at higher heat flow. The distribution of microstrain with characteristic peak values at weld seams positions is similar to one for residual stress. Anisotropy of the diffraction peak widths points to the dislocation origin of their broadening. The results of the diffraction peak profile analysis show that dislocation density is within the range from 1.2 × 10¹⁵ m−2 to 2.9 × 10¹⁵ m−2 at weld seam positions depending on the type of welding and it is about ~2 × 10¹⁴ m−2 outside of the weld region.
(3) From the obtained values of dislocation density and crystallite sizes, the corresponding contributions to the yield strength due to dislocation Δσρ and grain boundary ΔσHP strengthening were calculated according to Taylor and Hall–Petch equations. The obtained values yield strength increase Δσ at the notch position show that the mechanical characteristics for the base metal and weld are significantly different, which may affect the impact test results. The results of previous studies support the hypothesis about the dependence of Charpy impact test results on residual stress state and local microstructural parameters (yield strength increase due to dislocations and grain boundaries). Further experimental studies are needed to fully understand the origin and mechanism of this dependence.
Author Contributions
Conceptualization, G.B. and P.P.; formal analysis, G.B., P.P.; investigation, G.B., P.P.; writing, G.B. and Bulgarian National Scientific Fund under Grant DN 07/26. All authors have read and agreed to the published version of the manuscript.
Funding
The work was supported by the Bulgarian Nuclear Regulatory Agency and Bulgarian National Scientific Fund under Grant DN 07/26.
Acknowledgments
The authors are grateful to I.V. Papushkin for experimental assistance. The authors acknowledge neutron beamtime from FLNP, JINR (Dubna, Russia) and Bulgarian National Scientific Fund under Grant DN 07/26.
Conflicts of Interest
The authors declare no conflict of interest.
References
- Van Walle, E. Mechanical Test Specimens, Reconstitution of. Encycl. Mater. Sci. Technol. 2001, 5265–5268. [Google Scholar] [CrossRef]
- Gutiérrez-Solana, F.; Cicero, S. The knowledge and its application: Materials Engineering and Structural Integrity. Brief review of the Spanish case and contributions from Prof. Elices. Eng. Fail. Anal. 2009, 16, 2705–2720. [Google Scholar] [CrossRef]
- De Backer, F.; Gutiérrez-Solana, F. Influence of the specimen configuration and the insert material on fracture toughness characterisation with reconstituted specimens. Nucl. Eng. Des. 1999, 188, 231–240. [Google Scholar] [CrossRef]
- Van Walle, E.; Scibetta, M.; Valo, M.J.; Viehrig, H.-W.; Richter, H.; Atkins, T.; Wootton, M.; Keim, E.; Debarberis, L.; Horsten, M. Reconstitution techniques qualification and evaluation to study ageing phenomena of nuclear pressure vessel materials (RESQUE). Nucl. Eng. Des. 2001, 209, 67–77. [Google Scholar] [CrossRef]
- Manahan, M.P.; Williams, J.; Martukanitz, R.P. Laser Weld Reconstitution of Conventional Charpy and Miniaturized Notch Test (MNT) Specimens. In Small Specimen Test Techniques Applied to Nuclear Reactor Vessel Thermal Annealing and Plant Life Extension; Corwin, W.R., Haggag, F., Server, W., Eds.; American Society for Testing and Materials: Philadelphia, PA, USA, 1993; pp. 62–76. [Google Scholar] [CrossRef]
- Petrov, P.I.; Scibetta, M.; Puzzolante, J.L.; van Walle, E. Reconstitution of Charpy-V Specimens with CO2-Laser Welding. In Small Specimen Test Techniques: Fourth Volume; ASTM STP 1418; Sokolov, M.A., Landes, J.D., Lucas, G.E., Eds.; American Society for Testing and Materials: West Conshohocken, PA, USA, 2002; pp. 464–476. [Google Scholar] [CrossRef]
- Goldak, J.; Akhlaghi, M. Computational Welding Mechanics; Springer: New York, NY, USA, 2005. [Google Scholar]
- Sepe, R.; Armentani, E.; Lamanna, G.; Caputo, F. Evaluation by FEM of the influence of the preheating and post-heating treatments on residual stresses in welding. Key Eng. Mater. 2015, 627, 93–96. [Google Scholar] [CrossRef]
- Sepe, R.; Laiso, M.; De Luca, A.; Caputo, F. Evaluation of residual stresses in butt welded joint of dissimilar material by FEM. Key Eng. Mater. 2017, 754, 268–271. [Google Scholar] [CrossRef]
- Rossini, N.S.; Dassisti, M.; Benyounis, K.Y.; Olabi, A. Methods of measuring residual stresses in components. Mater. Des. 2012, 35, 572–588. [Google Scholar] [CrossRef]
- Noyan, I.C.; Cohen, J.B. Residual Stress–Measurement by Diffraction and Interpretation; Springer: Berlin, Germany, 1987. [Google Scholar]
- Javadi, Y.; Sadeghi, S.; Najafabadi, M.A. Taguchi optimization and ultrasonic measurement of residual stresses in the friction stir welding. Mater. Des. 2014, 55, 27–34. [Google Scholar] [CrossRef]
- Bokuchava, G.D.; Papushkin, I.V.; Tamonov, A.V.; Kruglov, A.A. Residual stress measurements by neutron diffraction at the IBR-2 pulsed reactor. Rom. J. Phys. 2016, 61, 491–505. [Google Scholar]
- Woo, W.; An, G.B.; Em, V.T.; De Wald, A.T.; Hill, M.R. Through-thickness distributions of residual stresses in an 80 mm thick weld using neutron diffraction and contour method. J. Mater. Sci. 2015, 50, 784–793. [Google Scholar] [CrossRef]
- Genchev, G.; Doynov, N.; Ossenbrink, R.; Michailov, V.; Bokuchava, G.; Petrov, P. Residual stresses formation in multi-pass weldment: A numerical and experimental study. J. Constr. Steel Res. 2017, 138, 633–641. [Google Scholar] [CrossRef]
- Sepe, R.; Wiebesiek, J.; Sonsino, C.M. Numerical and experimental validation of residual stresses of laser-welded joints and their influence on the fatigue behavior. Fatigue Fract. Eng. Mater. Struct. 2020, 43, 1126–1141. [Google Scholar] [CrossRef]
- Citarella, R.; Carlone, P.; Sepe, R.; Lepore, M. DBEM crack propagation in friction stir welded aluminum joints. Adv. Eng. Softw. 2016, 101, 50–59. [Google Scholar] [CrossRef]
- Bokuchava, G. Neutron Fourier Stress Diffractometer FSD at the IBR-2 pulsed reactor. Crystals 2018, 8, 318. [Google Scholar] [CrossRef]
- Bokuchava, G. Correlation RTOF diffractometry at long-pulse neutron source: I. Data acquisition in list-mode. Nucl. Instrum. Methods Phys. Res. A 2020, 964, 163770. [Google Scholar] [CrossRef]
- Balagurov, A.M.; Bokuchava, G.D.; Kuzmin, E.S.; Tamonov, A.V.; Zhuk, V.V. Neutron RTOF diffractometer FSD for residual stress investigation. Z. Krist. 2006, 23, 217–222. [Google Scholar] [CrossRef]
- Rietveld, H.M. A profile refinement method for nuclear and magnetic structures. J. Appl. Cryst. 1969, 2, 65–71. [Google Scholar] [CrossRef]
- Mikula, P.; Vrána, M. Residual Stress Investigations of Electron Beam Welds on Samples Prepared by Reconstitution Method. Appl. Mech. Mater. 2014, 486, 147–150. [Google Scholar] [CrossRef]
- Radaj, D. Heat Effects of Welding: Temperature Field, Residual Stress, Distortion; Springer: Berlin/Heidelberg, Germany, 1992; Chapter 3; ISBN 978-3-642-48642-5. [Google Scholar] [CrossRef]
- Yang, Z.; Lee, Y. Effect of the welding residual stress redistribution on impact absorption energy. J. Weld. Join. 2015, 33, 72–79. [Google Scholar] [CrossRef][Green Version]
- Bokuchava, G.D.; Petrov, P.; Papushkin, I.V. Application of Neutron Stress Diffractometry for Studies of Residual Stresses and Microstrains in Reactor Pressure Vessel Surveillance Specimens Reconstituted by Beam Welding Methods, Journal of Surface Investigation. X-ray. Synchrotron Neutron Tech. 2016, 10, 1143–1153. [Google Scholar] [CrossRef]
- Bokuchava, G.D. Materials microstructure characterization using high resolution TOF neutron diffraction. Rom. J. Phys. 2016, 61, 903–925. [Google Scholar]
- Ungár, T.; Dragomir, I.; Révész, Á.; Borbély, A. The contrast factors of dislocations in cubic crystals: The dislocation model of strain anisotropy in practice. J. Appl. Crystallogr. 1999, 32, 992–1002. [Google Scholar] [CrossRef]
- Warren, B.E.; Averbach, B.L. The Effect of Cold-Work Distortion on X-Ray Patterns. J. Appl. Crystallogr. 1950, 21, 595–599. [Google Scholar] [CrossRef]
- Bokuchava, G.D.; Papushkin, I.V.; Bobrovskii, V.I.; Kataeva, N.V. Evolution in the dislocation structure of austenitic 16Cr-15Ni-3Mo-1Ti steel depending on the degree of cold plastic deformation, Journal of Surface Investigation: X-ray. Synchrotron Neutron Tech. 2015, 9, 44–52. [Google Scholar] [CrossRef]
- Voronin, V.I.; Valiev, E.Z.; Berger, I.F.; Goschitskii, B.N.; Proskurnina, N.V.; Sagaradze, V.V.; Kataeva, N.F. Neutron diffraction analysis of Cr–Ni–Mo–Ti austenitic steel after cold plastic deformation and fast neutrons irradiation. J. Nucl. Mater. 2015, 459, 97–102. [Google Scholar] [CrossRef]
- HajyAkbarya, F.; Sietsma, J.; Böttger, A.J.; Santofimia, M.J. An improved X-ray diffraction analysis method to characterize dislocation density in lath martensitic structures. Mater. Sci. Eng. A 2015, 639, 208–218. [Google Scholar] [CrossRef]
- Huang, M.; Rivera-Díaz-del-Castillo, P.E.J.; Bouaziz, O.; van der Zwaag, S. Modelling strength and ductility of ultrafine grained BCC and FCC alloys using irreversible thermodynamics. Mater. Sci. Technol. 2009, 25, 833–839. [Google Scholar] [CrossRef]
- Delincé, M.; Bréchet, Y.; Embury, J.D.; Geers, M.G.D.; Jacques, P.J.; Pardoen, T. Structure-property optimization of ultrafine-grained dual-phase steels using a microstructure-based strain hardening model. Acta Mater. 2007, 55, 2337–2350. [Google Scholar] [CrossRef]
- Shibata, A.; Nagoshi, T.; Sone, M.; Morito, S.; Higo, Y. Evaluation of the block boundary and sub-block boundary strengths of ferrous lath martensite using a micro-bending test. Mater. Sci. Eng. A 2010, A527, 7538–7544. [Google Scholar] [CrossRef]
- Beleznai, R.; Szávai, S. Analysis of warm prestressing effect on fracture toughness of reactor pressure vessel steels. Strength Mater. 2010, 42, 120–123. [Google Scholar] [CrossRef]
- Szabó, P.J.; Field, D.P.; Jóni, B.; Horky, J.; Ungár, T. Bimodal Grain Size Distribution Enhances Strength and Ductility Simultaneously in a Low-Carbon Low-Alloy Steel. Metall. Mater. Trans. A 2015, 46, 1948–1957. [Google Scholar] [CrossRef]
© 2020 by the authors. Licensee MDPI, Basel, Switzerland. This article is an open access article distributed under the terms and conditions of the Creative Commons Attribution (CC BY) license (http://creativecommons.org/licenses/by/4.0/).