Article

Process Performance Analysis and Improvement for the Manufacture of 6063 Aluminum Alloy

Department of Business Administration, Asia University, Wufeng, Taichung 41354, Taiwan
Metals 2020, 10(5), 605; https://doi.org/10.3390/met10050605
Submission received: 3 April 2020 / Revised: 3 May 2020 / Accepted: 4 May 2020 / Published: 8 May 2020
(This article belongs to the Special Issue Aluminum Alloys and Aluminum Matrix Composites)

Abstract

:
As industrial manufacturing technologies continuously improve, many conventional industrial materials are struggling to meet the needs of today’s industries. Aluminum alloys are currently the most extensively used non-ferrous metal in the industry, whose properties include corrosion resistance, high strength, and high ductility. As a result, they are widely used in many products, such as doors and windows, vehicles, and electronics. Pure aluminum though, is a very soft, silver-white metal, so to increase its strength, aluminum alloy manufacturers add in various chemical elements (such as magnesium, silicon, and zinc) according to international standards, and then adjust the proportions based on customer needs. If the chemical element composition does not meet specification requirements, it will affect the quality of the aluminum alloy product or even delay delivery and subsequently impact the operational performance of the manufacturer. To ensure and increase aluminum alloy quality, this study used a combined Six Sigma quality index (SSQI), Qpc, to develop a multi-characteristic quality analysis model (MCQAM) with five steps for the aluminum alloy industry. A practical example with a manufacturer specializing in producing 6063 aluminum alloys in Taiwan is given to demonstrate the effectiveness and feasibility of this proposed approach. The result shows that the proposed method not only effectively improves the quality of 6063 aluminum alloy, but also enhances its performance and capability (that is, corrosion resistance increases by 17%, strength increases by 8%, and stiffness increases by 3%). Finally, future works are also discussed in this context.

1. Introduction

Ever since the mutual and corresponding relationships among the structural compositions and properties of industrial materials were discovered, industrial materials have been widely discussed by scientists and practitioners, which has led to the development of a series of theories and applications in materials science [1,2]. Engineers can apply their knowledge of materials science to production and processing processes and create materials with certain properties by adjusting various process parameters. Aluminum is currently the most widely used non-ferrous metal in the industry and has a number of excellent properties, such as good thermal and electrical conductivity as well as infinite recyclability. However, pure aluminum is a very soft metal and has poor mechanical strength. Increasing its strength requires certain elements to be added, such as copper, magnesium, silicon, and zinc, to form harder aluminum alloys. Aluminum alloys therefore have low specific weight, good mechanical properties, high strength, and good resistance to corrosion. As a result, they are widely used in many products, such as doors and windows, vehicles, aerospace equipment, water vessels, and electronics.
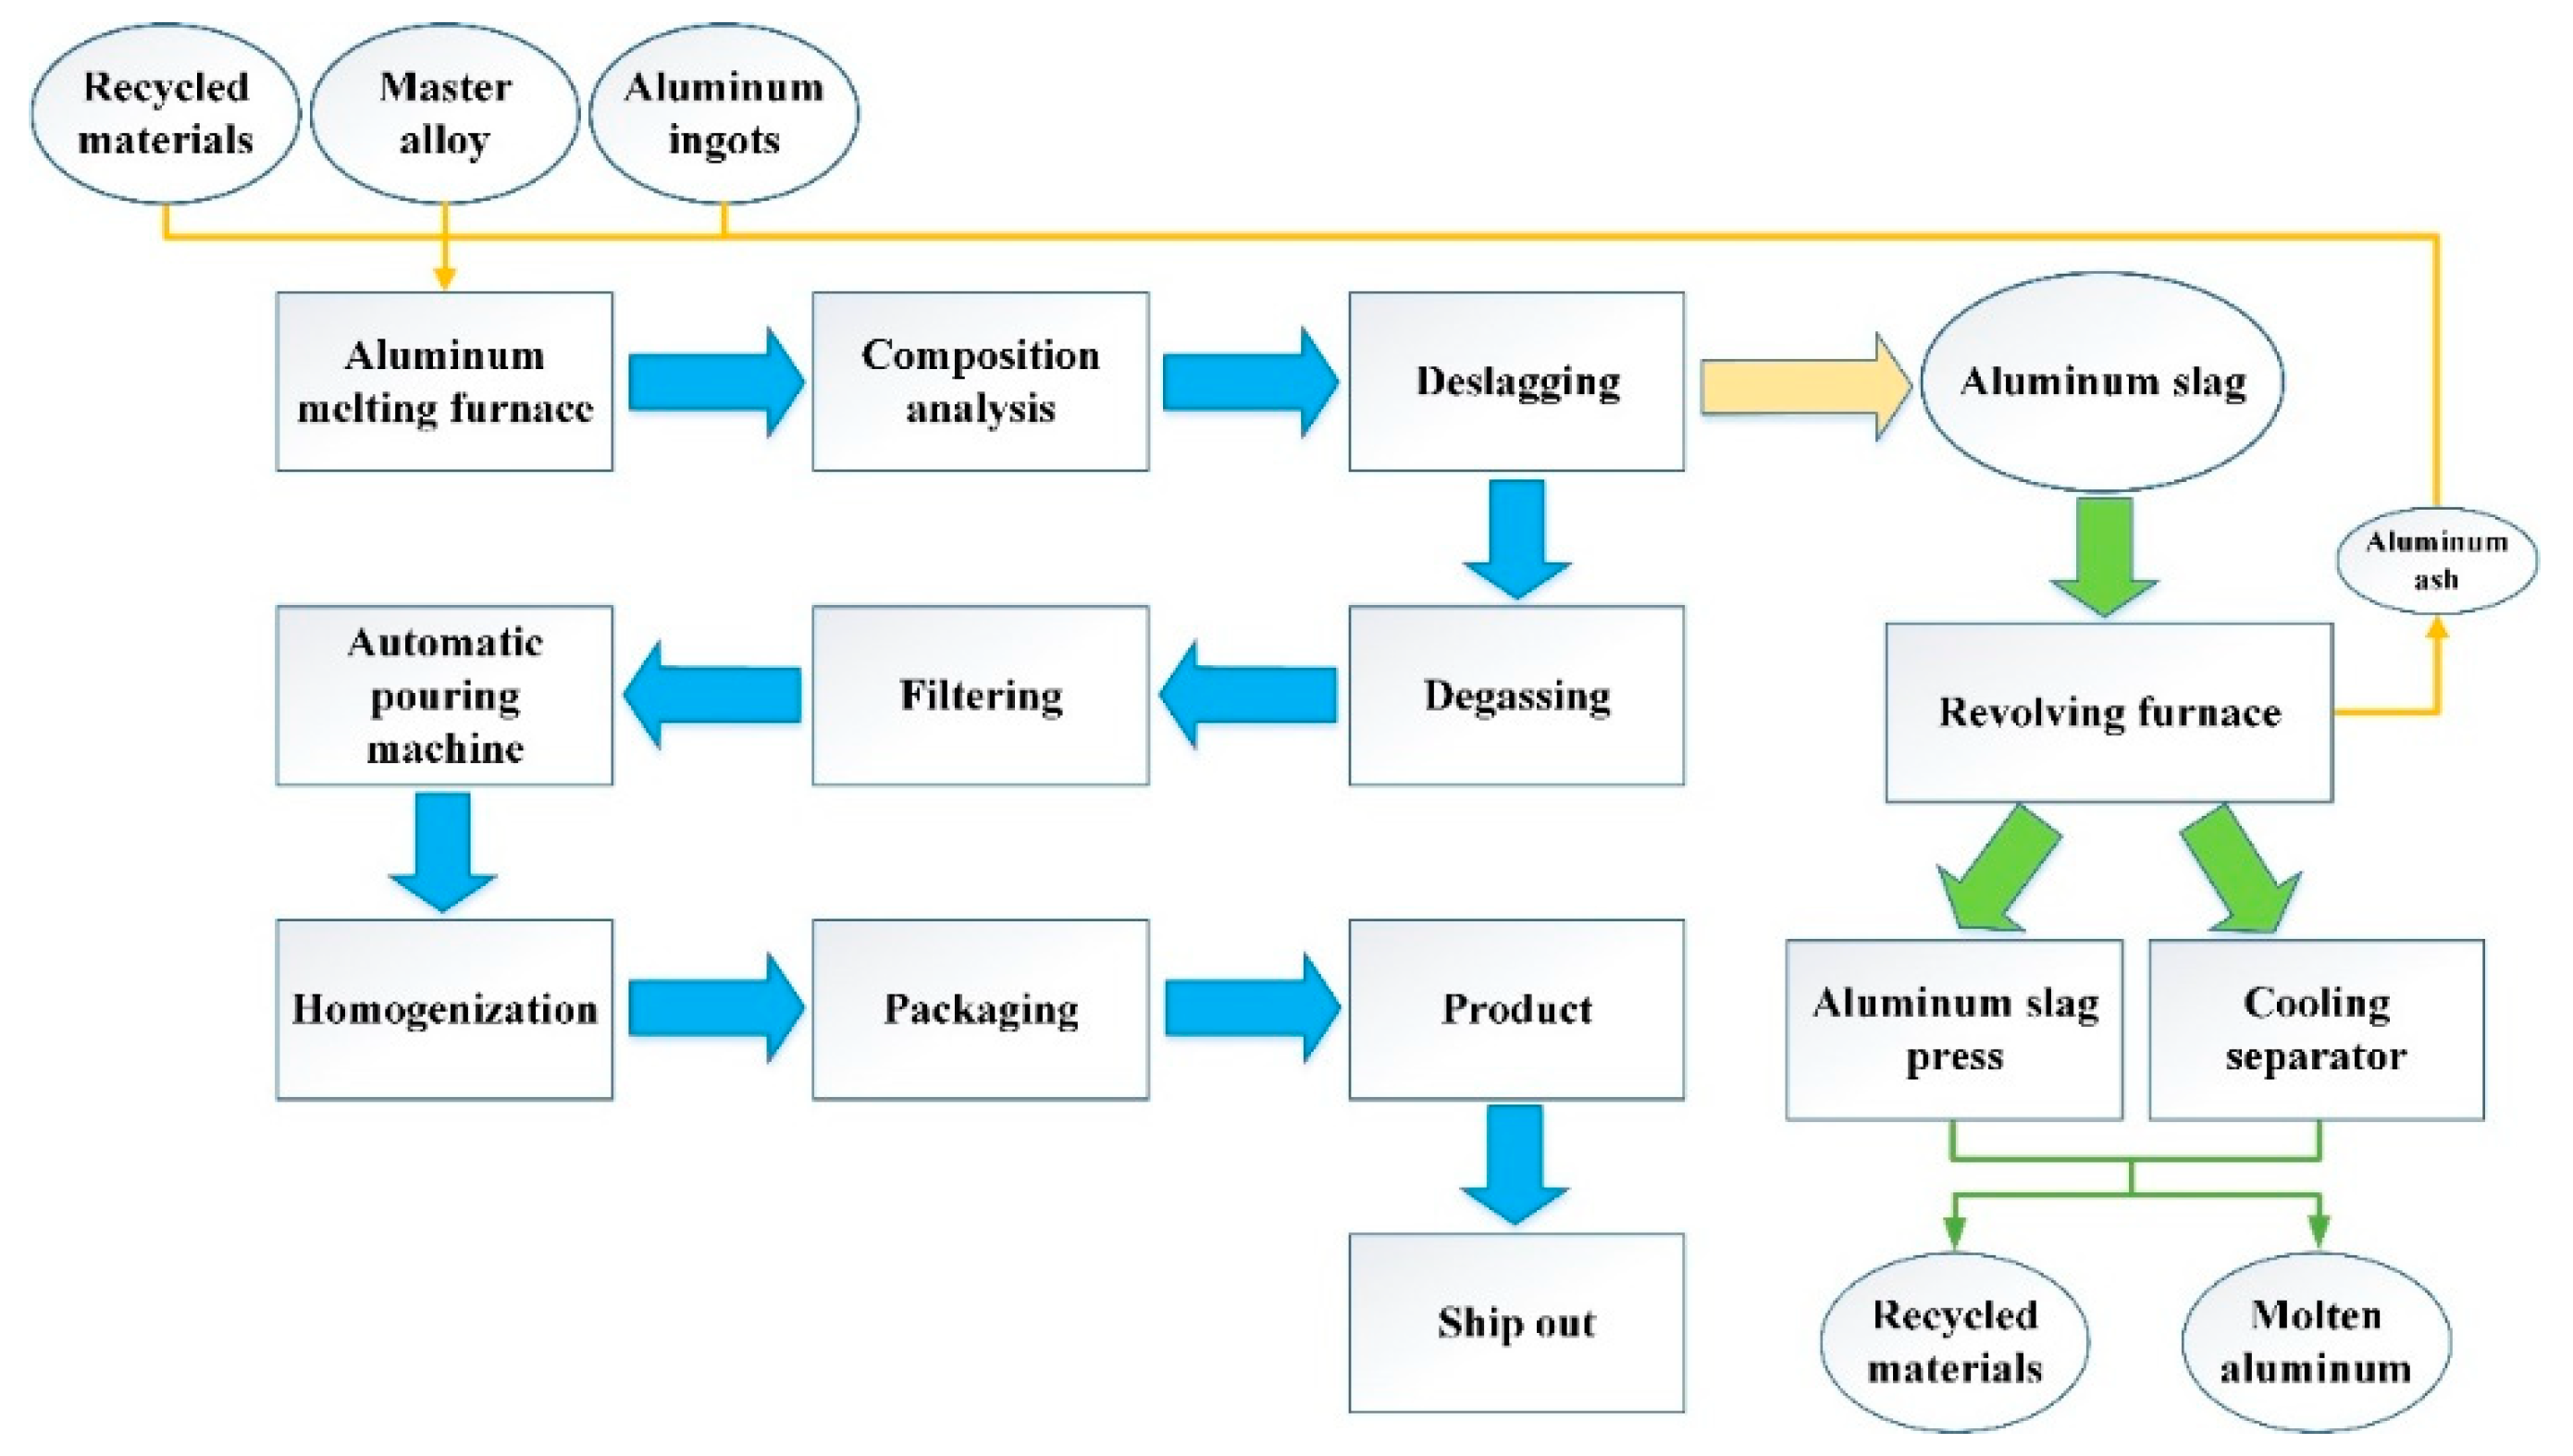
Aluminum alloys are made by smelting aluminum ingots and adding various alloys or chemical elements (such as magnesium, silicon, and zinc), the proportions of which depend on the specification requirements. The aluminum ingot casting process includes composition analysis, deslagging, degassing, filtering, refining, casting, and multiple sample tests. The final product can then be packaged and delivered to the customer. Figure 1 displays the manufacturing process of aluminum alloys.
Similar to steel, aluminum alloys are given numbers and divided into several series. For example, the 6000 series of aluminum alloys have good corrosion resistance, strength, and weldability, while the 7000 series have the highest strengths of all aluminum alloys but are difficult to weld and have poor resistance to corrosion. Among these aluminum alloy products, aluminum alloy 6063 is a typical alloy used for extrusion and is currently widely used for the frames of doors, windows, and curtain walls in buildings. Table 1 presents the chemical composition of 6063 aluminum alloy that is generally used in international standards, as well as the content ranges of each chemical element. Aluminum alloy manufacturers can adjust the amounts of the chemical elements to meet customer needs and control the properties and functions of the aluminum alloys.
Aluminum alloy processing and manufacturing factories generally use various processing methods to recast or smelt aluminum alloys and then change them into products of other forms. To ensure the high safety, assembly performance, and corrosion resistance of the products of aluminum alloy processing, aluminum alloy manufacturers must focus on using a set of effective approaches to increase the quality of aluminum alloys and reduce the defect rates of the production processes. As mentioned previously, aluminum alloys contain multiple chemical components. If the element contents do not meet the specification standards, the quality of the resulting aluminum alloy will be affected. Therefore, it is essential for manufactures to monitor the amounts of elements added to the aluminum alloys in order to gain a reputation and increase their market share.
Process capability indices (PCIs) are a simple and convenient way of quantifying product quality. They can be used to determine whether the processing conditions of a product meet the required specification levels and they also offer several advantages. For example, PCIs can confirm how production processes are performing with regard to product design requirements [3], lower the costs incurred by poor products or services [4], gauge the current process quality conditions [5], and improve product quality [6]. Past studies have developed many new PCIs, or used PCIs, to measure the process capabilities or quality levels of materials/products. For example, Ouyang et al. [7] presented a hybrid method based on PCI Cpm, entropy method, and technique for order of preference by similarity to ideal solution (TOPSIS) to analyze the product quality in a quick release for bicycles. Chen et al. [8] developed a new process improvement capability index CPIM based on the cost of improving index Cpm for the evaluation and selection of suppliers. Jeang [9] proposed a new PCI Cpmc for the offline quality management in a wheel mounting assembly. Liao et al. [10] introduced a new PCI to test the process performance for a process following the Gamma process distribution for the electronics industry. Yen et al. [11] used two unilateral PCIs, Cpu and Cpl, to construct a variable repetitive group sampling plan for the thin-film transistor-liquid crystal display (TFT-LCD) industry. Dalalah and Hani [12] applied the means of a signal-to-noise ratio (SNR) model to deal with gauge measurement errors in estimating the actual PCI ACp and the observed PCI OCp in an engine shaft diameter. Nikzad et al. [13] applied three classical PCIs, Cp, Cpk, and Spk, to assess the capability of a process in an automobile brake system. Wu et al. [14] utilized the index Cpk to develop two types of variables quick switching sampling systems for the quality measurement and assurance in an integrated circuit (IC) packaging company. Tiwari and Singh [15] presented a new PCI for two correlated quality characteristics jointly following the bivariate exponential distribution for the computer industry. Finally, Otsuka and Nagata [16] introduced a quality design method using four PCIs-Cp, Cpk, Cc, and Cpm-to measure the product performance in a virtual assembly case.
After a product has undergone research, development, design, process planning, and manufacturing, it generally has several crucial quality characteristics. Aluminum alloy 6063 has 10 quality characteristics (see Table 1), and only when the quality performance of all of these quality characteristics meets the levels required by the customer will the product be regarded as a qualified product [17]. In practice, quality managers have to analyze the quality performance of multiple quality characteristics through multiple PCIs, which could result in an expenditure of time and resources, and even lead to misjudgment. To solve this problem, researchers have proposed using multi-characteristic quality analysis models (MCQAMs) to assess and determine whether the quality performance of quality characteristics meets the levels required by customers [18,19,20,21,22]. An MCQAM combines multiple PCIs and visualizes quality management activities so that quality managers can have a clear picture of how the entire process of assessing product quality is conducted and gain reference for improving quality in the future. This study thus aimed to develop an MCQAM suitable for the aluminum alloy industry so that quality managers can swiftly and effectively gauge the quality performance of aluminum alloys and identify quality characteristics that do not meet the requirements. We first employed the Six Sigma quality indices (SSQIs) proposed by [19] and reconstructed a combined SSQI, Qpc. Next, we used the proposed Qpc to create a new MCQAM to gauge and analyze the quality performance of 6063 aluminum alloy products.
The manufacture and processing of aluminum alloy is a series of complicated procedures since it needs to meet certain specifications, such as mold design, process flow, low expenditure of resources, and an eco-environment. The choice of manufacture and processing is decided by the standards of the processing technology, such as the production cost, the quantity, and the primary quality of the components. Through the approach proposed in this paper, manufacturers of aluminum alloy could focus on quality inspection and the improvement of products instead of the subtle differences in the analysis of chemical elements. Only when the quality is unstable-such as out of the specification that the manufacturers or customers require, or the defect rate of the end product is too high-would manufacturers need to discuss the weathering adjusting of the components and the proportion of the added chemical elements with their design department. Accordingly, unnecessary rework, inspection, and analysis will reduce efficiently.
The remainder of this paper is structured as follows. Section 2 presents the PCI Qpc, which is suitable for the aluminum alloy industry, and explains how the index corresponds to quality defect rates. Moreover, an MCQAM is developed to determine whether the quality performance of an aluminum alloy product meets the required level. Section 3 uses a manufacturer in Taiwan that specializes in producing 6063 aluminum alloys to verify the effectiveness of the proposed approach. Section 4 contains the conclusions.

2. Materials and Methods

2.1. A Qpc for the Aluminum Alloy Industry

In quality management, Six Sigma is also an effective way of determining product quality performance. Ouyang et al. [7] examined the correlation between PCIs and different sigma levels of quality. However, determining whether the quality level of a product meets the customer requirements requires complex calculations, which can be inconvenient in practical applications. For this reason, Chen et al. [19], Yang and Chen [22], and Chang et al. [23] proposed SSQIs for the quality assurance associated with unilateral and bilateral specification products. As shown in Table 2, the SSQI values indicate the quality level, whereas the classical PCI values do not. A PCI can be used only to identify the range of quality levels that a given process can achieve. For example, if Cpk = 1.3, then the resulting quality level is 5 to 6σ. In comparison, if Qpk = 3, then the resulting quality level is 3σ. Moreover, the SSQIs hold one-to-one mathematical relationships with the process yield instead of an approximate solution (that is, 2Φ(3Cpk) − 1 ≤ Yield < Φ(3Cpk)). Obviously, SSQIs can be used to determine the level of the quality with a high degree of precision, thereby giving manufacturers control over the process quality.
Therefore, the SSQIs proposed are employed to develop the Qpc, an assessment index for the 10 quality characteristics of aluminum alloys, which is defined as follows:
Q p c j = { USL j μ j σ j + 1.5 , j = 1 , 2 , , 8 Min { Q p j 1 , Q p j 2 } , j = 9 , 10
where Q p c j 1 = USL j μ j σ j + 1.5 , Q p c j 2 = μ j LSL j σ j + 1.5 , USL is the upper specification limit, LSL is the lower specification limit, μ is the process mean, and σ is the process standard deviation.
In practice, μ and σ are population parameters that require sample data to be estimated; hence, let x ¯ and s, respectively, be the observed μ and σ in a given number of observations (n). The sample statistics, sample mean x ¯ and sample standard deviation s, are estimates for the process population parameters μ and σ, respectively. Therefore, the estimator of Qpc for the 6063 aluminum alloys can be presented as the following:
Q ^ p c j = { USL j x ¯ j s j + 1.5 , j = 1 , 2 , , 8 Min { Q ^ p c j 1 , Q ^ p c j 2 } , j = 9 , 10
where Q ^ p c j 1 = USL j x ¯ j s j + 1.5 , Q ^ p c j 2 = x ¯ j LSL j s j + 1.5 .
Based on the definitions of Six Sigma, the μ of the smaller-the-better (STB) or larger-the-better (LTB) quality characteristics may shift 1.5σ to the left or right of the target value T, as well as for the nominal-the-best (NTB) quality characteristics, |μT| = 1.5σ. Therefore, when a quality characteristic meets the h sigma level, we have the following:
Q p c j 1 = USL j μ j σ j + 1.5 = h σ j 1.5 σ j + 1.5 σ j σ j = h
Q p c j 2 = μ j LSL j σ j + 1.5 = h σ j 1.5 σ j + 1.5 σ j σ j = h
Clearly, when the index value resulting from the calculations is h, then the quality level of the quality characteristic is or higher, i.e., Q p c j Q p c j ( h ) = h .
When manufacturers analyze and determine the quality of a product, they generally set a lower limit that must be reached. If an aluminum alloy manufacturer requires an overall quality level of , then the quality levels of all the 10 quality characteristics of the 6063 aluminum alloy must be higher than in order to meet the requirements as a whole. In other words, if the quality level of the 10 quality characteristics is h , then h must be greater than h. To discuss the relationship between h and h , we define the events E j and E j :
{ E j :   Q u a l i t y   c h a r a c t e r i s t i c   m e e t s   t h e   r e q u i r e m e n t E j :   Q u a l i t y   c h a r a c t e r i s t i c   d o e s   n o t   m e e t s   t h e   r e q u i r e m e n t
Thus, the yield and defect rate of the STB quality characteristics are
P ( E j ) p j = Φ ( Q p c j 1.5 )   and   P ( E j ) q j = 1 Φ ( Q p c j 1.5 )
and the yield and defect rate of the NTB quality characteristics are
P ( E j ) p j = 2 Φ ( Q p c j 1.5 ) 1   and   P ( E j ) q j = 2 2 Φ ( Q p c j 1.5 )
Let
q = 1 Φ ( h 1.5 )
Then,
p j = P ( E j ) = { 1 q ,   j = 1 , 2 , , 8 1 2 q ,   j = 9 , 10   and   q j = P ( E j ) = { q ,   j = 1 , 2 , , 8 2 q ,   j = 9 , 10
Based on DeMorgan’s theorem and Boole’s inequality, the overall yield of the aluminum alloy products, y T , can be expressed as the following:
P ( j = 1 10 E j ) j = 1 10 P ( E j ) = 12 q
y T = P ( j = 1 10 E j ) = 1 P ( j = 1 10 E j ) 1 12 q
If the quality of the aluminum alloy product is required to reach the level, then y T Φ ( h 1.5 ) + Φ ( h + 1.5 ) 1 and q = 1 Φ ( h 1.5 ) . Thus, the minimum quality level h is
Φ ( h 1.5 ) + Φ ( h + 1.5 ) 1 = 1 12 Φ ( h 1.5 ) h = Φ 1 { 1 [ 2 [ Φ ( h 1.5 ) + Φ ( h + 1.5 ) ] 12 ] } + 1.5
To make the proposed approach more convenient for aluminum alloy manufacturers to use, we present the minimum quality level h and the number of defects per million opportunities (DPMO) corresponding to each quality level h in Table 3.

2.2. An MCQAM for the Aluminum Alloy Industry

The MCQAM, a tool that is simple and easy to use, enables quality managers to acquire a clear understanding of the quality assessment activities and operation methods so that they can analyze and evaluate the performance of the quality characteristics. It can also be used to make decisions on improving quality levels [20]. We thus use index Qpc to construct an MCQAM (Figure 2) to gauge the quality performance of the various quality characteristics of aluminum alloys. The proposed MCQAM includes five steps, which are described as follows:
Step 1: Confirm the overall quality level required and find the corresponding minimum quality level in Table 3.
Step 2: Determine the USL and LSL for each quality characteristic of the aluminum alloy.
Step 3: Collect the data and construct the histogram. After that, compute the sample mean x ¯ and the sample standard deviation s for each quality characteristic of the aluminum alloy.
Step 4: Compute the Q ^ p c j values for each quality characteristic of the aluminum alloy.
Step 5: Determine whether the quality performance of all of the quality characteristics meets the required quality levels. If so, then continue production. If not, then stop production and initiate quality improvement initiatives.
Step 6: Compare the before and after improvements by implementing the proposed approach.

3. Results

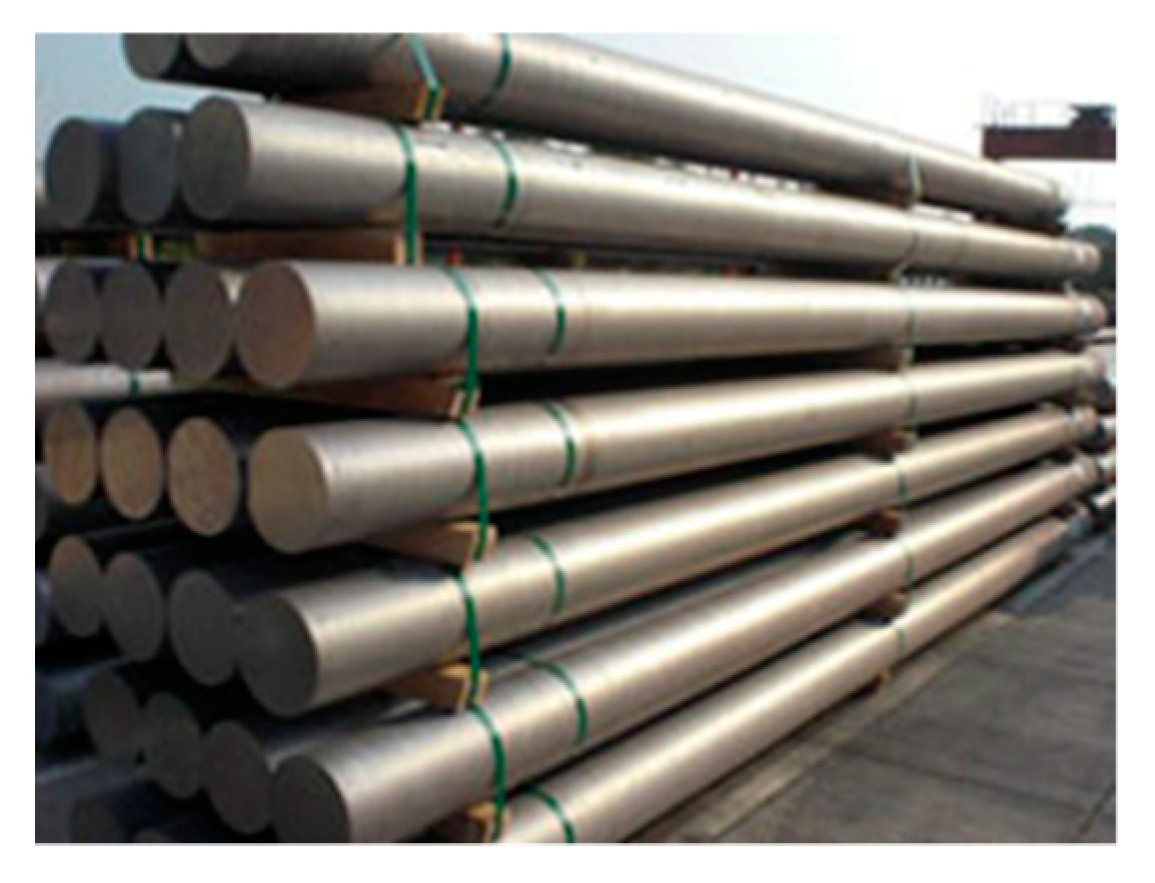
Company H is a manufacturer that mainly produces aluminum alloy products. Aluminum alloy rods are one of the crucial products that this manufacturer makes (Figure 3). These rods are made of various aluminum alloys containing different chemical elements. Company H uses the chemical composition in international standards for their 6063 aluminum alloy (Table 1) and adjusts the amounts of each chemical element based on their customers’ needs and product features. Table 4 shows one of the adjusted 6063 aluminum alloy proportions used based on the requirements of downstream customers, including eight STB quality characteristics and two NTB quality characteristics.
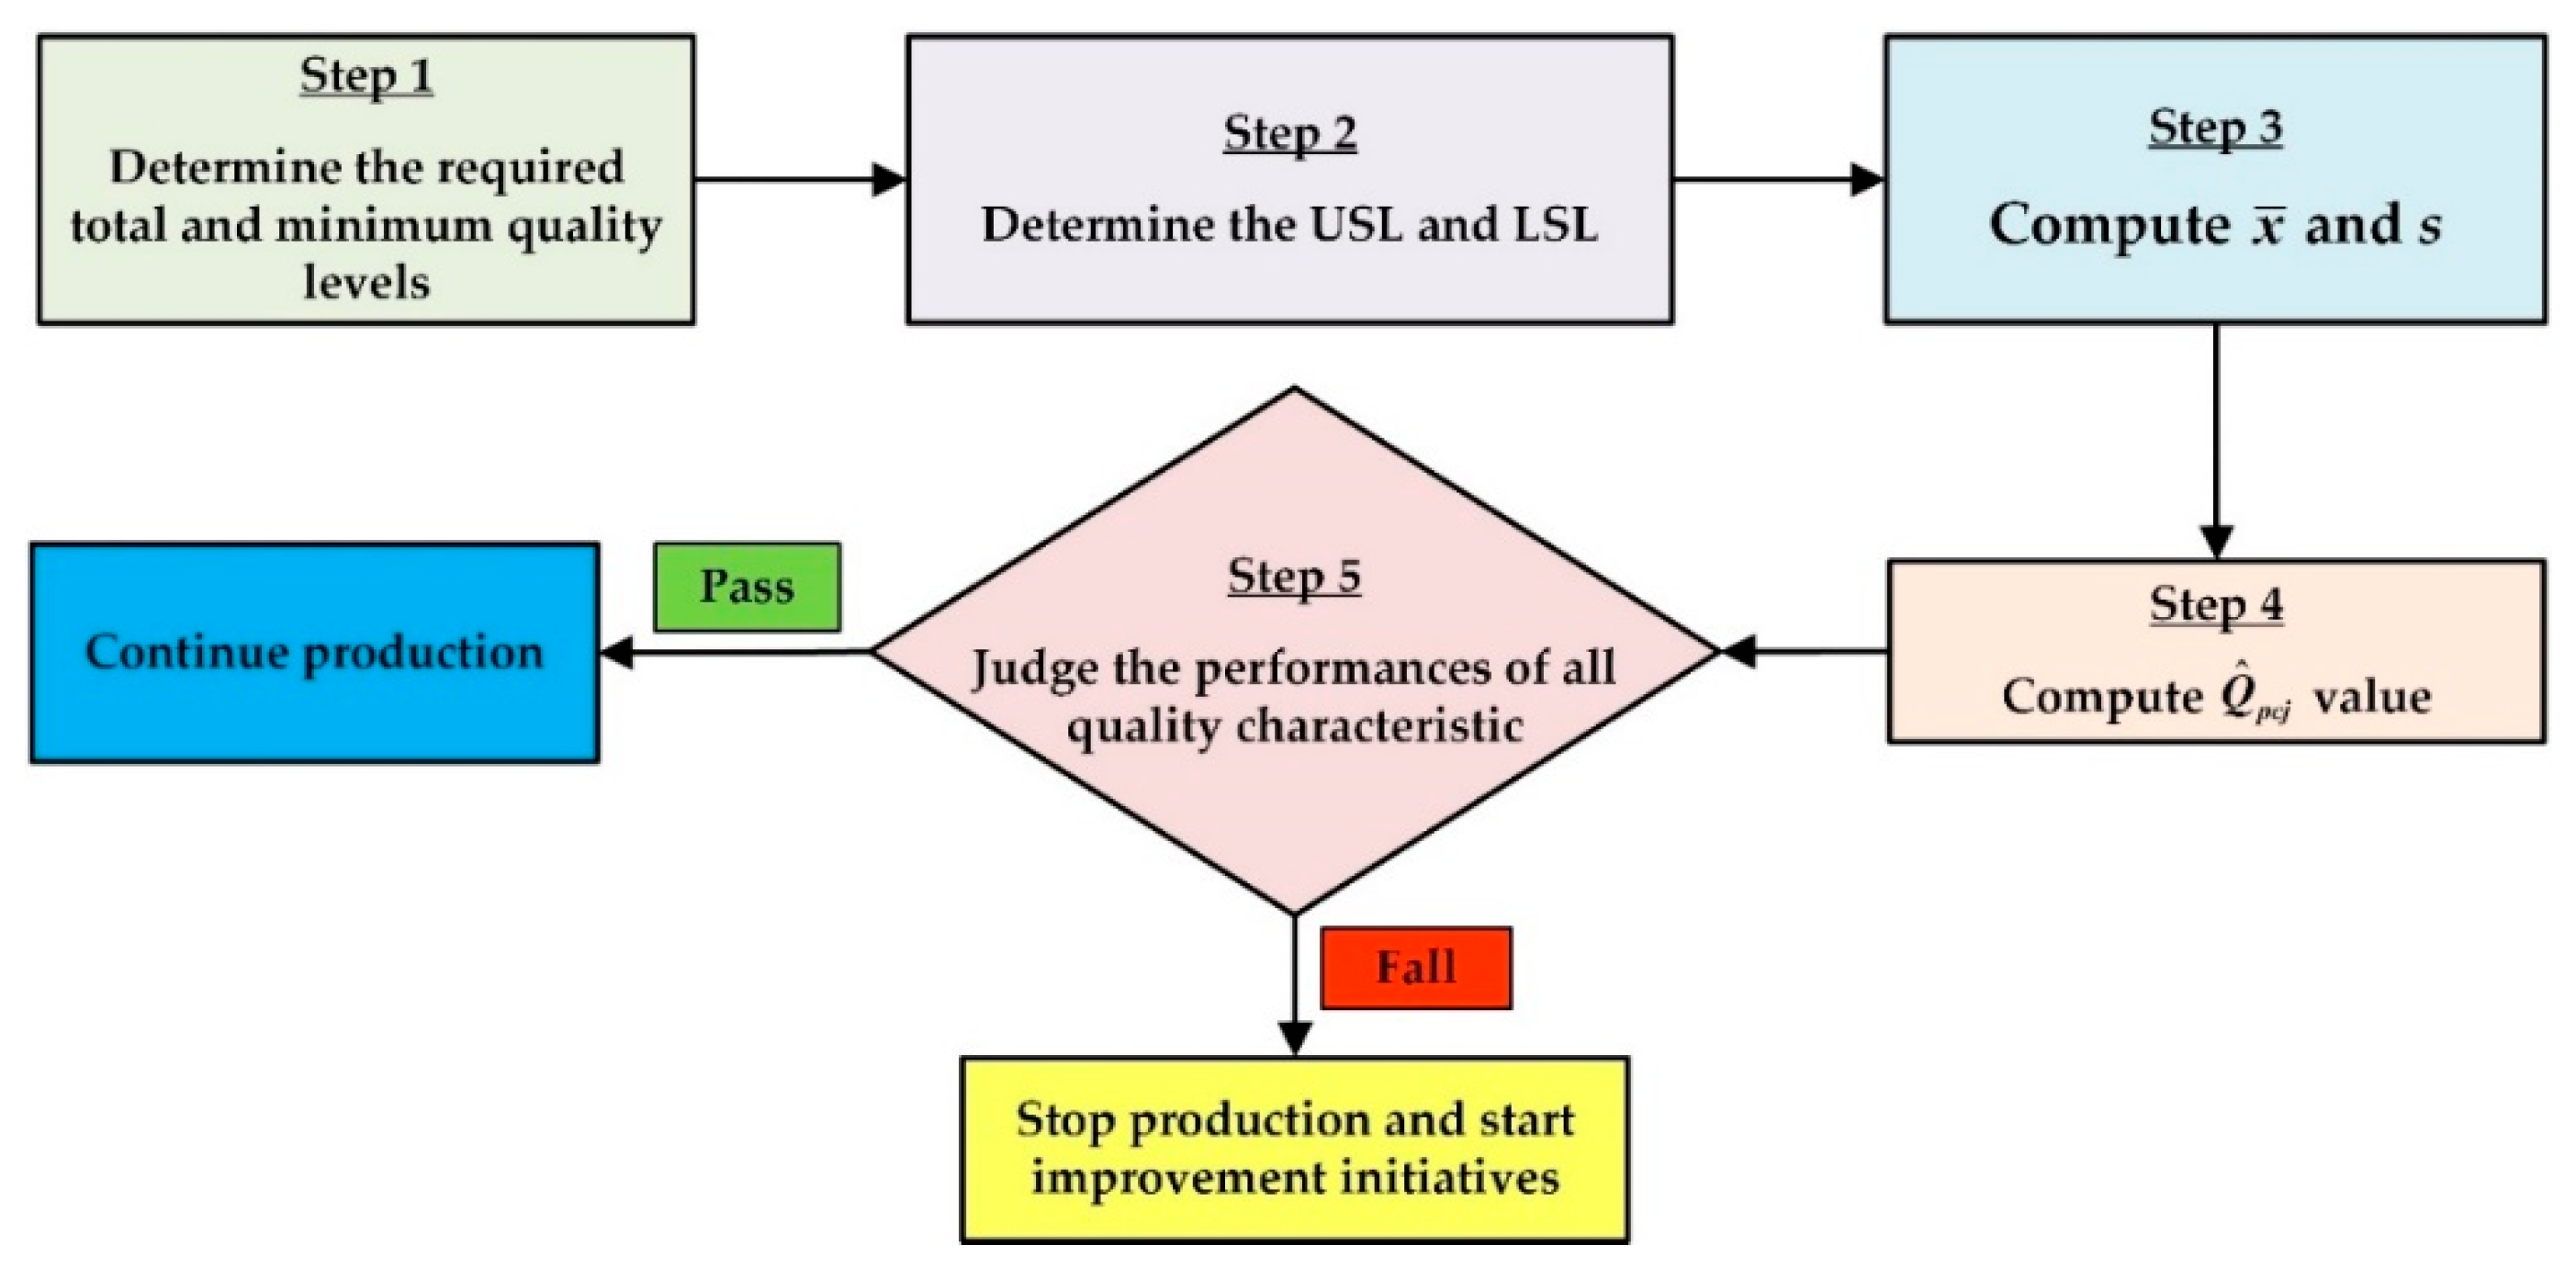
The continuous progress in industrial manufacturing technologies and the needs of consumers for diverse products in small batches have led to increasingly intense competition in the aluminum alloy industry in recent years. To gain the trust of customers in their products and to create brand value, Company H was in urgent need of an effective way to increase the quality and efficiency of aluminum alloy production, and thereby achieve the goals of low waste, prompt delivery, safety, and reliability. We therefore used the MCQAM developed in Section 3 to analyze the quality performance of the 10 quality characteristics of the 6063 aluminum alloy rods produced by Company H, as follows:
Step 1: Company H confirmed that the overall quality level required was 5σ (i.e., h = 5) by downstream customers; therefore, based on Table 2, h = 5.452 .
Step 2: See Table 4 for the USL and LSL for each quality characteristic of the adjusted 6063 aluminum alloy rods produced by Company H.
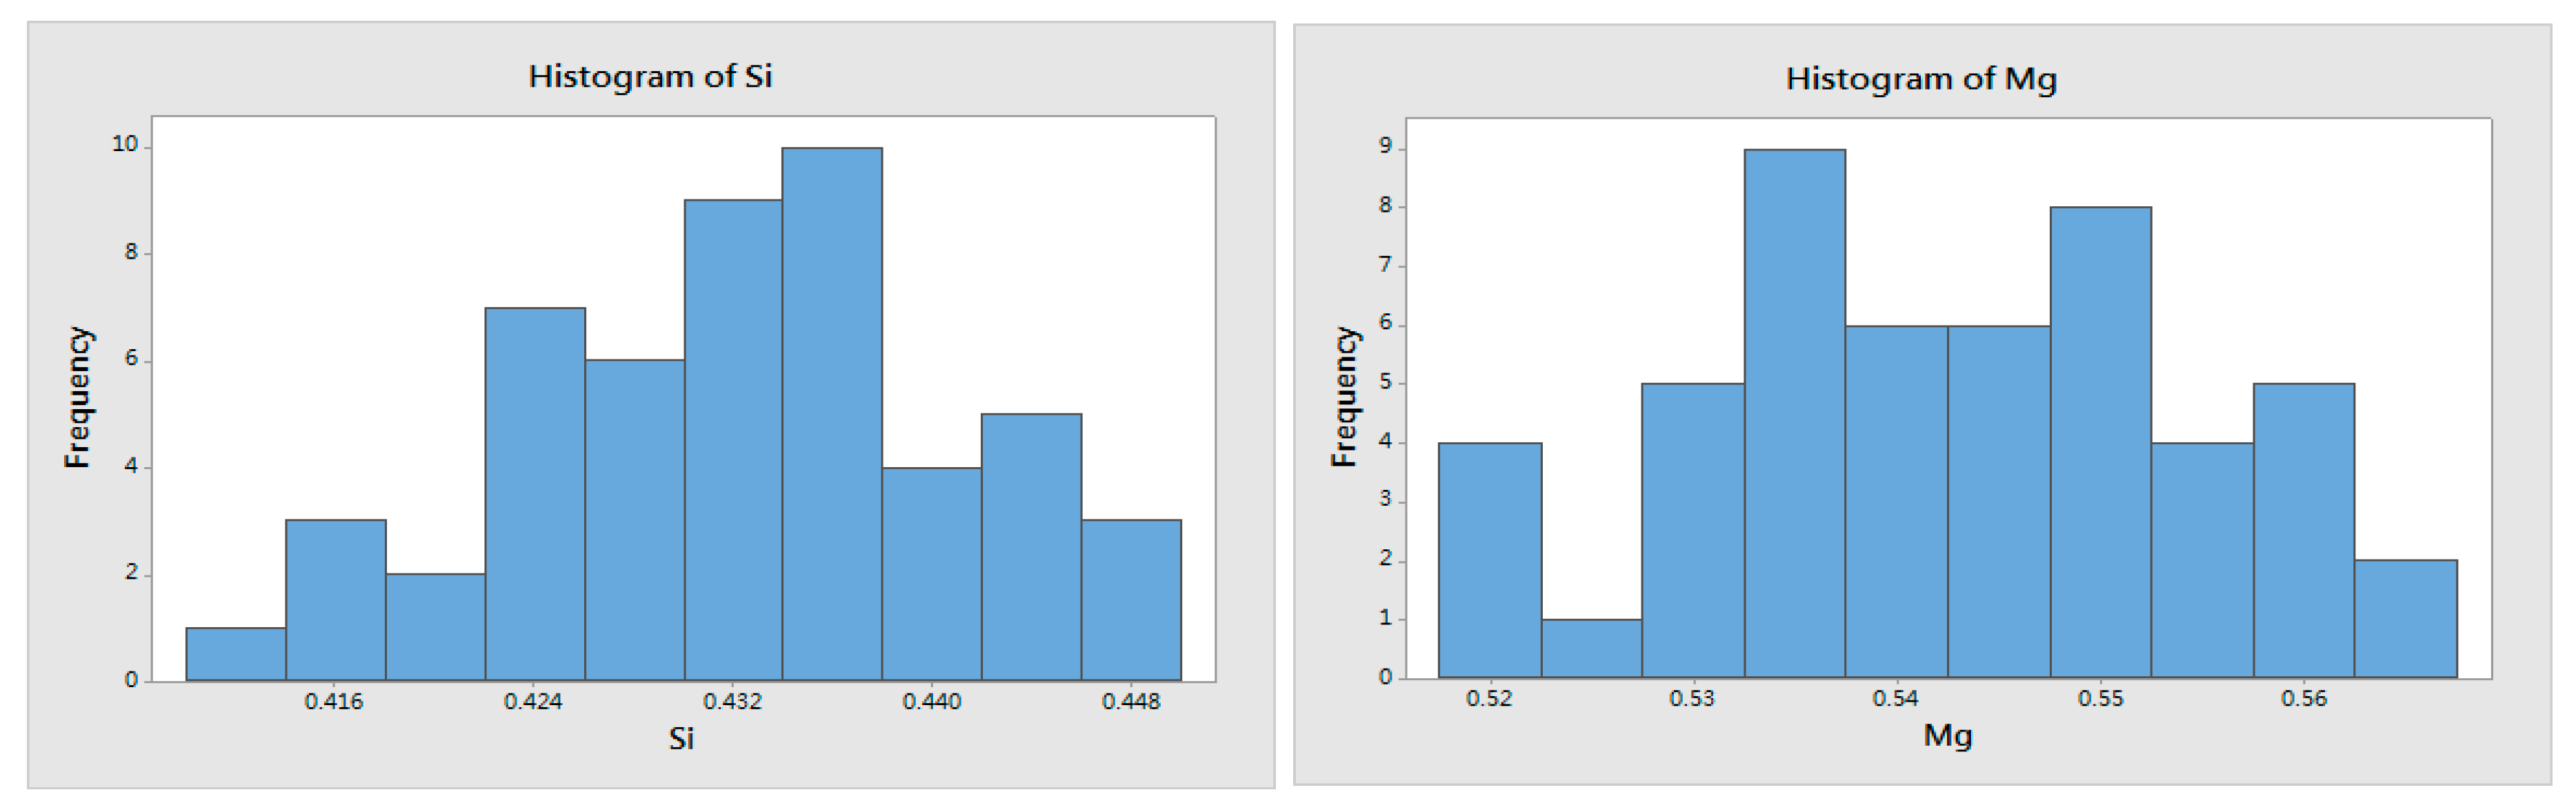
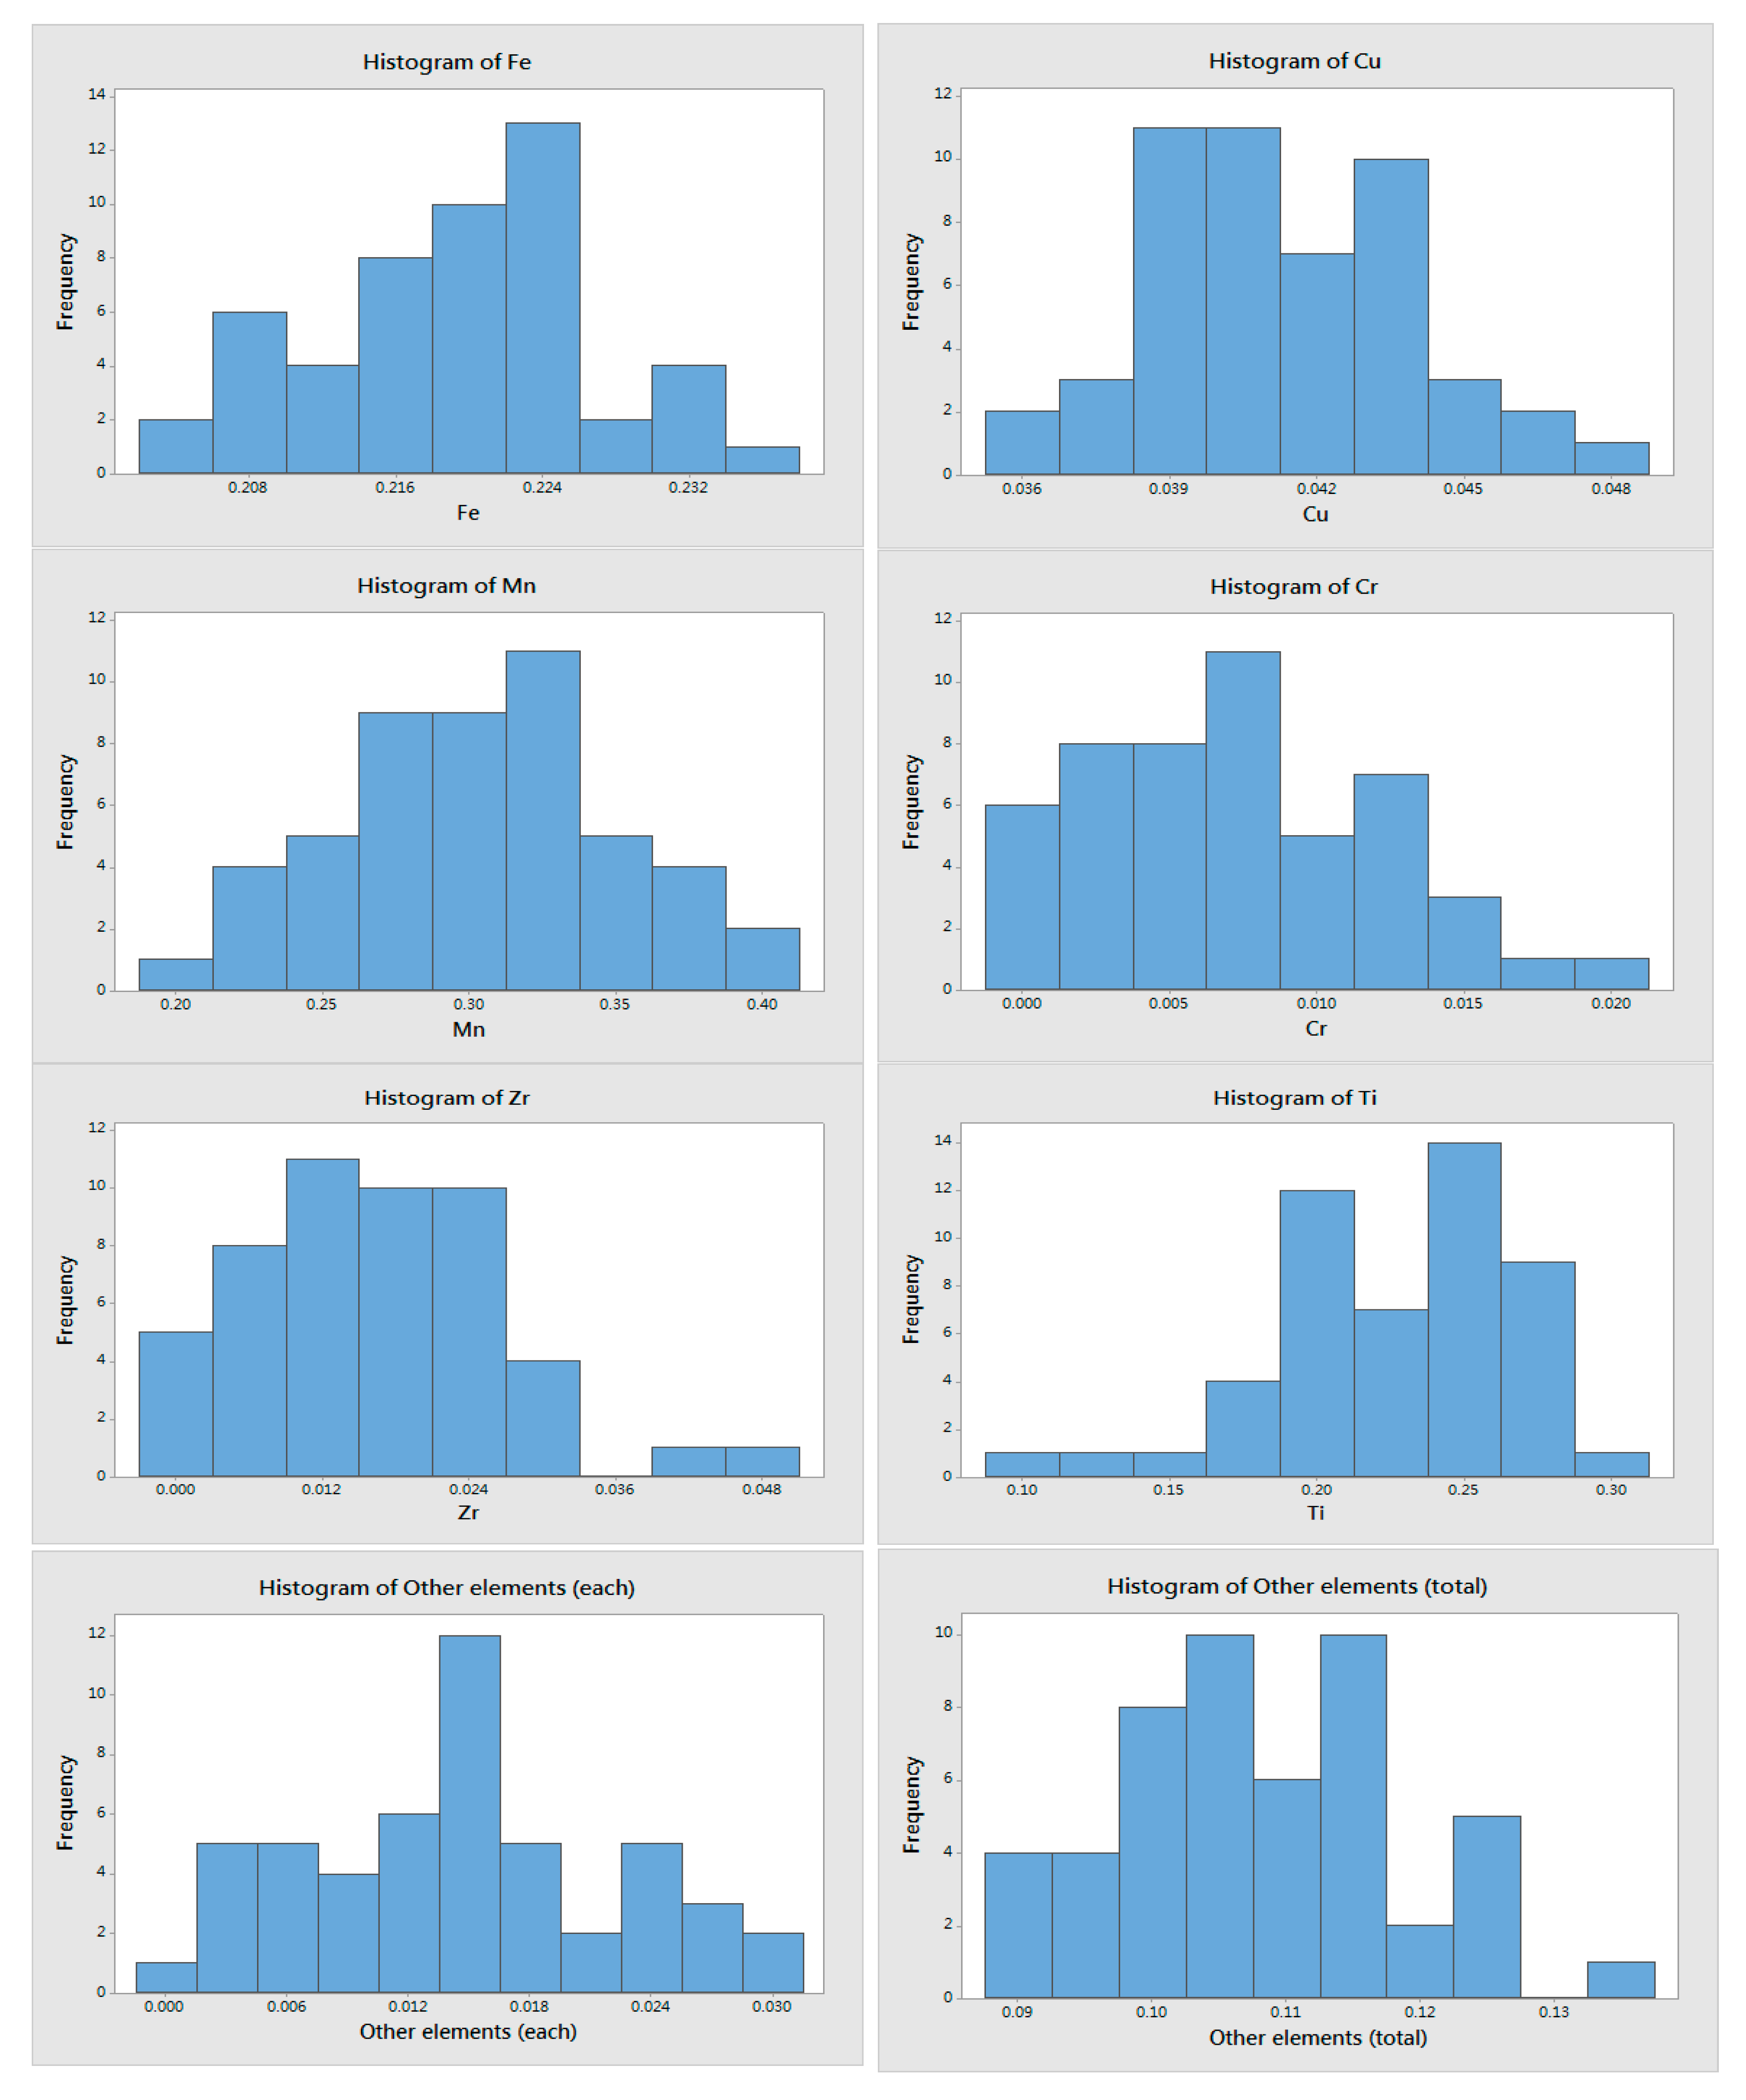
Step 3: Figure 4 shows the histograms with the random sample of size 50, and Table 4 lists the x ¯ and s for each quality characteristic of the adjusted 6063 aluminum alloy rods produced by Company H.
Step 4: See Table 5 for the Q ^ p c j for each quality characteristic of the adjusted 6063 aluminum alloy rods produced by Company H.
Step 5: Based on Table 5, three of the quality characteristics of the adjusted 6063 aluminum alloy rods produced by Company H did not meet the required quality level, including one NTB quality characteristic ( Mg = Q ^ p c 2 = 5 ) and two STB quality characteristics ( Cu = Q ^ p c 4 = 4.5 and Zr = Q ^ p c 7 = 4.9 ). Since copper influences the corrosion resistance of the aluminum alloy product, zirconium affects the stiffness, and magnesium impacts the strength and corrosion resistance, Company H must cease the production for these three quality characteristics and determine how production quality can be improved. It is revealed in Table 4 that the defective quality characteristics “Mg” and “Cu” may be caused by process mean x ¯ , and quality characteristic “Zr” may be caused by process standard deviation s. Practically, problems of process mean x ¯ are usually related to the lack of training for production staff. On the other hand, problems of process standard deviation s are related to the production equipment or measuring instruments. Therefore, Company H has engaged in increasing the frequency of the production staff’s training in professional knowledge and expertise, as well as in purchasing new measurement instruments.
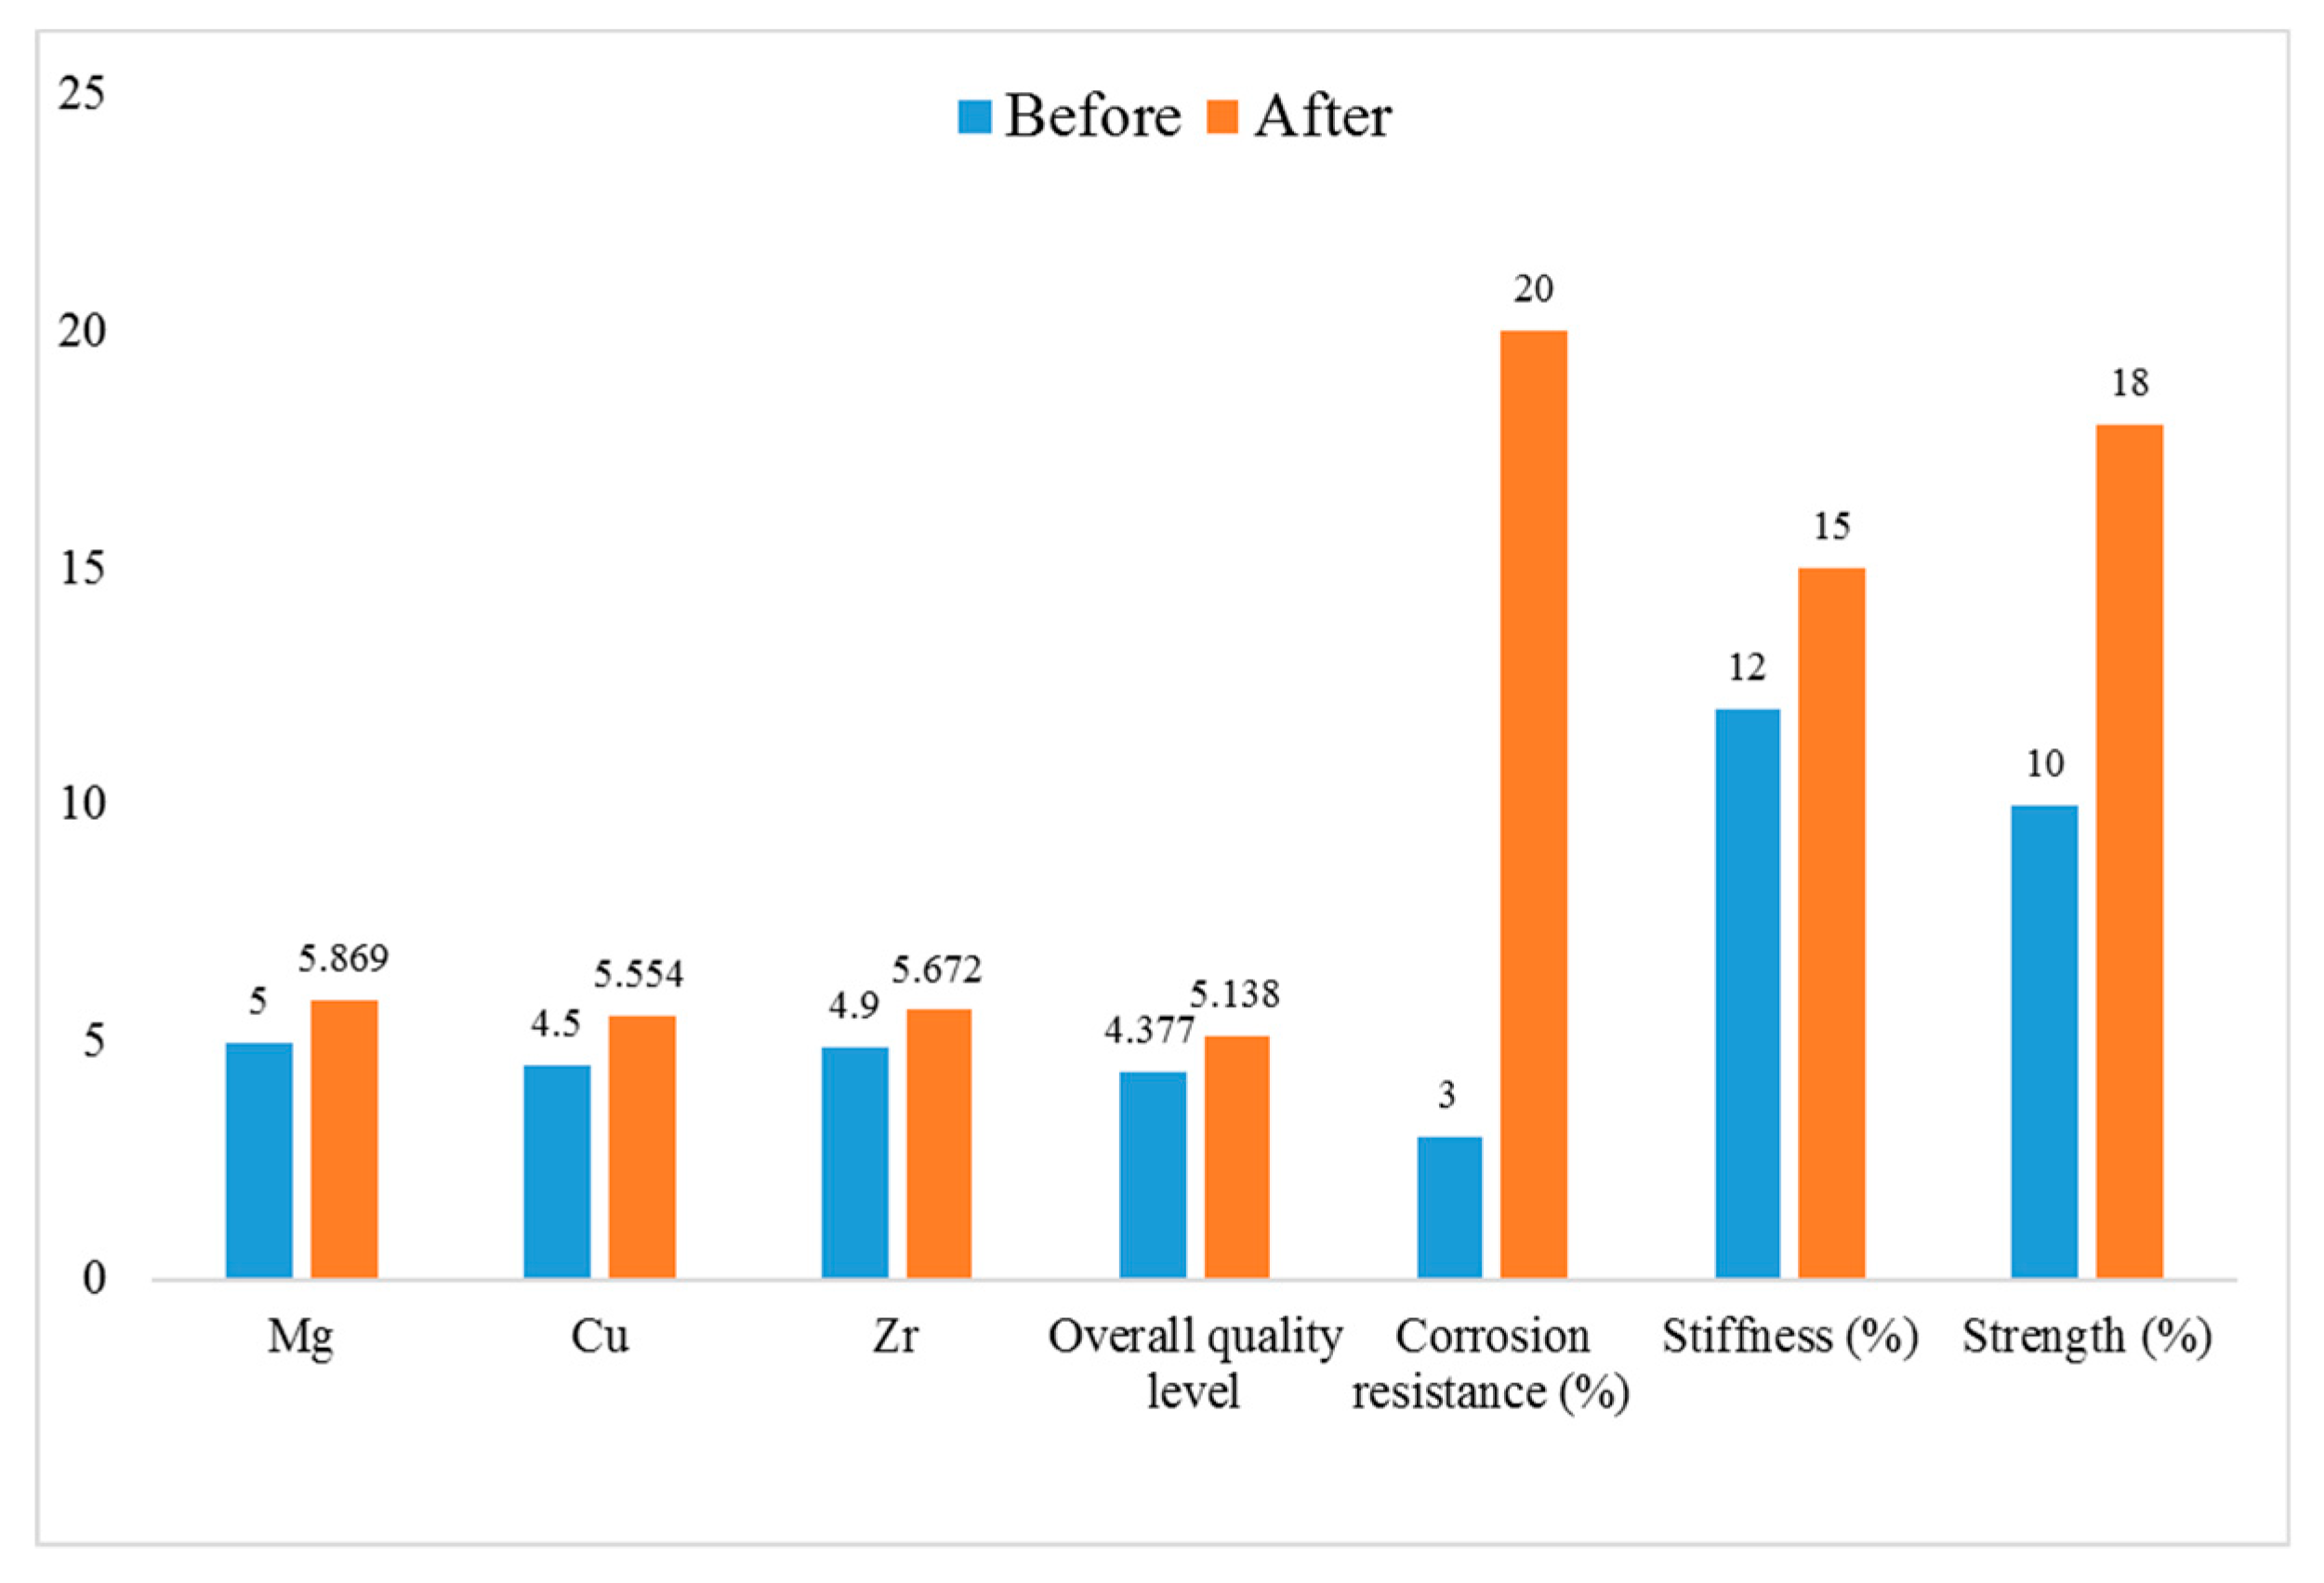
Step 6: Figure 5 shows the performance of the 6063 aluminum alloy before and after improvement. As shown in Figure 5, three unqualified characteristics (Mg, Cu, and Zr) are improved up to 5.452σ, and the overall quality level is increased from 4.377 to 5.138σ. Besides, improvements of quality also elevate the efficiency (stiffness, strength, corrosion resistance) of the 6063 aluminum alloy produced by Company H, especially in terms of corrosion resistance, which improved up to 17%. Accordingly, the proposed approach is not only applicable in evaluating and improving the quality and efficiency of aluminum alloys, but also attaining the goal of continuous improvements.

4. Conclusions

Aluminum alloys have many excellent properties, such as light mass, high rigidity, high strength, good heat dissipation, electromagnetic shielding, and infinite recyclability. They are superior to industrial plastic in many ways, and as a result are widely applied in various industries, including construction, household appliances, and mechanical hardware. Chemical elements such as magnesium, copper, and manganese must be added during the production of aluminum alloys, and suitable processing is needed to give aluminum alloys resistance to wear or corrosion. If the amounts of added chemical elements do not meet the specification requirements, it will affect the performance and functions of the product. In severe cases, it may even cause safety incidents and quality issues during the production process or the subsequent product manufacturing processes.
To increase the quality of aluminum alloys, this study proposed Qpc, an SSQI for STB and NTB quality characteristics, and developed an MCQAM with five steps. The application of the proposed approach to Company H, a manufacturer specializing in producing aluminum alloys, revealed that three of the 10 quality characteristics of the 6063 aluminum alloy rods that they produce (copper, magnesium, and zirconium) did not meet the required quality levels. However, through the improvement, the quality of the 60603 aluminum alloy rods produced by Company H achieved 5.138σ, which meets customers’ requirements, and avoids postponed delivery. Moreover, the improvements of the quality enhance the performance (stiffness, strength, corrosion resistance) of the products, and elevate their commercial value and competitiveness. In order to attain the goal of continuous improvement, Company H can create a knowledge base of methods or suggestions for an effective process improvement to serve as a valuable reference in the future.
The proposed approach can effectively determine whether the quality performance of aluminum alloys meets the required quality levels. However, this paper did not explore the interactions among the chemical elements and the effects brought by the composition and proportion. For example, Mg increases the strength via both the solution strengthening and the precipitations of the Mg-Si intermetallic phase. Therefore, the effect brought by different proportions of specific elements on the production quality could be analyzed in future work. Future studies can also extend this approach to other aluminum alloy products or manufacturing industries to increase its applicability. Furthermore, it can be used to examine the asymmetric processes and quality measurement issues of inspection equipment.

Funding

This research received no external funding.

Conflicts of Interest

The authors declare no conflict of interest.

References

  1. Rémi Viroulaud, R.; Światowska, J.; Seyeux, A.; Zanna, S.; Tardelli, J.; Marcus, P. Influence of surface pretreatments on the quality of trivalent chromium process coatings on aluminum alloy. Appl. Surf. Sci. 2017, 423, 927–938. [Google Scholar] [CrossRef]
  2. Dhanalakshmi, S.; Rameshbabu, T. Multi-Aspects optimization of process parameters in CNC turning of LM 25 alloy using the Taguchi-Grey approach. Metals 2020, 10, 453. [Google Scholar] [CrossRef] [Green Version]
  3. Ahmad, S.; Alatefi, M.; Alkahtani, M.; Anwar, S.; Sharaf, M.; Abdollahian, M. Bibliometric analysis for process capability research. Qual. Technol. Quant. Manag. 2018, 16, 459–477. [Google Scholar] [CrossRef]
  4. Dey, S.; Saha, M.; Maiti, S.S.; Jun, C.H. Bootstrap confidence intervals of generalized process capability index Cpyk for Lindley and power Lindley distributions. Commun. Stat.-Simul. Comput. 2018, 47, 249–262. [Google Scholar] [CrossRef]
  5. Park, C.; Dey, S.; Ouyang, L.; Byun, J.H.; Leeds, M. Improved bootstrap confidence intervals for the process capability index Cpk. Commun. Stat.-Simul. Comput. 2018. [Google Scholar] [CrossRef]
  6. Yang, C.M.; Lin, K.P.; Chen, K.S. Confidence interval based fuzzy evaluation model for an integrated-circuit packaging molding process. Appl. Sci. 2019, 9, 2623. [Google Scholar] [CrossRef] [Green Version]
  7. Ouyang, L.Y.; Chen, K.S.; Yang, C.M.; Hsu, C.H. Using a QCAC–Entropy–TOPSIS approach to measure quality characteristics and rank improvement priorities for all substandard quality characteristics. Int. J. Prod. Res. 2014, 52, 3110–3124. [Google Scholar] [CrossRef]
  8. Chen, K.S.; Yang, S.L.; Chen, H.T. Process improvement capability index with cost—A modeling method of mathematical programming. Appl. Math. Model. 2015, 39, 1577–1586. [Google Scholar] [CrossRef]
  9. Jeang, A. Robust product design and process planning in using process capability analysis. J. Intell. Manuf. 2015, 26, 459–470. [Google Scholar] [CrossRef] [Green Version]
  10. Liao, M.Y.; Pearn, W.L.; Liu, Y.L. Assessing the actual Gamma process quality—A curve-fitting approach for modifying the non-normal flexible index. Int. J. Prod. Res. 2015, 53, 4720–4734. [Google Scholar] [CrossRef]
  11. Yen, C.H.; Chang, C.H.; Aslam, M. Repetitive variable acceptance sampling plan for one-sided specification. J. Stat. Comput. Simul. 2015, 85, 1102–1116. [Google Scholar] [CrossRef]
  12. Dalalah, D.; Hani, D.B. On the actual and observed process capability indices: A signal-to-noise ratio model. Measurement 2016, 81, 241–250. [Google Scholar] [CrossRef]
  13. Nikzad, E.; Amiri, A.; Abbasi, B. Residuals based process capability indices for two-stage processes. J. Ind. Eng. Int. 2017, 13, 239–247. [Google Scholar] [CrossRef] [Green Version]
  14. Wu, C.W.; Lee, H.I.; Liu, S.W.; Shih, M.H. Capability-based quick switching sampling system for lot disposition. Appl. Math. Model. 2017, 52, 131–144. [Google Scholar] [CrossRef]
  15. Tiwari, V.; Singh, N.K. Process capability index for bivariate exponentially distributed quality characteristics and its sampling properties. Commun. Stat.-Theory Methods 2017, 46, 11099–11109. [Google Scholar] [CrossRef]
  16. Otsuka, A.; Nagata, F. Quality design method using process capability index based on Monte-Carlo method and real-coded genetic algorithm. Int. J. Prod. Econ. 2018, 204, 358–364. [Google Scholar] [CrossRef]
  17. Yang, C.M.; Chen, K.S.; Hsu, C.H. Developing a multi-quality characteristic analysis model to measure the quality of quick-release bicycle hubs. J. Chin. Inst. Eng. 2019, 42, 309–318. [Google Scholar] [CrossRef]
  18. Yu, K.T.; Chen, K.S. Testing and analysing capability performance for products with multiple characteristics. Int. J. Prod. Res. 2016, 54, 6633–6643. [Google Scholar] [CrossRef]
  19. Chen, K.S.; Chen, H.T.; Chang, T.C. The construction and application of Six Sigma quality indices. Int. J. Prod. Res. 2017, 55, 2365–2384. [Google Scholar] [CrossRef]
  20. Lin, Y.T.; Chang, T.C.; Chen, K.S. A novel approach to evaluating the performance of physical Fitness by combining Statistical Inference with the Radar Chart. J. Test. Eval. 2018, 46, 1498–1507. [Google Scholar] [CrossRef]
  21. Chen, K.S.; Yu, C.M.; Hsu, T.H.; Cai, S.R.; Chiou, K.C. A model for evaluating the performance of the bearing Manufacturing Process. Appl. Sci. 2019, 9, 3105. [Google Scholar] [CrossRef] [Green Version]
  22. Yang, C.M.; Chen, K.S. Two-phase selection framework that considers production costs of suppliers and quality requirements of buyers. Int. J. Prod. Res. 2019, 57, 6351–6368. [Google Scholar] [CrossRef]
  23. Chang, T.C.; Chen, K.S.; Yu, C.M. Process quality assessment model of hand tools: A case study on the handle of ratchet torque wrench. Int. J. Reliab. Qual. Saf. Eng. 2016, 23, 1650017. [Google Scholar] [CrossRef]
Figure 1. Manufacturing process of aluminum alloys.
Metals 10 00605 g001
Figure 2. Multi-characteristic quality analysis model (MCQAM).
Metals 10 00605 g002
Figure 3. Aluminum alloy rods.
Metals 10 00605 g003
Figure 4. Histograms for each quality characteristic of the adjusted 6063 aluminum alloy rods.
Metals 10 00605 g004aMetals 10 00605 g004b
Figure 5. Comparison of the performance before and after the improvement.
Metals 10 00605 g005
Table 1. Chemical composition of 6063 aluminum alloy in international standards.
Chemical ElementContent (%)
Silicon (Si)0.20–0.60
Iron (Fe)<0.35
Magnesium (Mg)0.45–0.90
Copper (Cu)<0.10
Manganese (Mn)<0.10
Chromium (Cr)<0.10
Zirconium (Zr)<0.10
Titanium (Ti)<0.10
Other elements (each)<0.05
Other elements (total)<0.15
Table 2. Process capability index (PCI) and Six Sigma quality index (SSQI) values corresponding to various quality levels.
Quality LevelPCI (Cpk, Cpu, Cpl)SSQI (Qpk, Qpu, Qpl)
6σ1.5006
5σ1.1675
4σ0.8334
3σ0.5003
Table 3. Minimum quality level ( h ) and DPMO corresponding to different quality levels.
Quality Level (h)Minimum Quality Level (h′)DPMO
3σ3.78376.62378
4σ4.5802.32469
5σ5.4520.02492
6σ6.5020.00004
Note: DPMO: defects per million opportunities.
Table 4. Adjusted 6063 aluminum alloy rods’ composition used by Company H.
CodeQuality CharacteristicTypeUSLLSL x ¯ s
N1Silicon (Si)NTB0.470.410.4320.009
N2Magnesium (Mg)NTB0.560.500.5420.012
S1Iron (Fe)STB0.25-0.2190.007
S2Copper (Cu)STB0.05-0.0410.003
S3Manganese (Mn)STB0.50-0.3040.049
S4Chromium (Cr)STB0.03-0.0070.005
S5Zirconium (Zr)STB0.05-0.0160.010
S6Titanium (Ti)STB0.40-0.2280.042
S7Other elements (each)STB0.05-0.0150.008
S8Other elements (total)STB0.15-0.1080.010
Note: NTB: nominal-the-better; STB: smaller-the-better; USL: upper specification limit; LSL: lower specification limit.
Table 5. The Q ^ p c j of the adjusted 6063 aluminum alloy rods produced by Company H.
CodeQuality Characteristic Q ^ p c j Quality Level
N1Silicon (Si) Q ^ p c 1 = 5.722 Qualified
N2Magnesium (Mg) Q ^ p c 2 = 5.000 Not qualified
S1Iron (Fe) Q ^ p c 3 = 5.929 Qualified
S2Copper (Cu) Q ^ p c 4 = 4.500 Not qualified
S3Manganese (Mn) Q ^ p c 5 = 5.500 Qualified
S4Chromium (Cr) Q ^ p c 6 = 6.100 Qualified
S5Zirconium (Zr) Q ^ p c 7 = 4.900 Not qualified
S6Titanium (Ti) Q ^ p c 8 = 5.595 Qualified
S7Other elements (each) Q ^ p c 9 = 5.875 Qualified
S8Other elements (total) Q ^ p c 10 = 5.700 Qualified

