Abstract
In this work, the formation and thermal stability of the ω-Ti(Fe) phase that were produced by the high-pressure torsion (HPT) were studied in two-phase α-Ti + TiFe alloys containing 2 wt.%, 4 wt.% and 10 wt.% iron. The two-phase microstructure was achieved by annealing the alloys at 470 °C for 4000 h and then quenching them in water. Scanning electron microscopy (SEM) and X-ray diffraction (XRD) were utilized to characterize the samples. The thermal stability of the ω-Ti(Fe) phase was investigated using differential scanning calorimetry (DSC) and in situ high-temperature XRD. In the HPT process, the high-pressure ω-Ti(Fe) phase mainly formed from α-Ti. It started to decompose by a cascade of exothermic reactions already at temperatures of 130 °C. The decomposition was finished above ~320 °C. Upon further heating, the phase transformation proceeded via the formation of a supersaturated α-Ti(Fe) phase. Finally, the equilibrium phase assemblage was established at high temperatures. The eutectoid temperature and the phase transition temperatures measured in deformed and heat-treated samples are compared for the samples with different iron concentrations and for samples with different phase compositions prior to the HPT process. Thermodynamic calculations were carried out to predict stable and metastable phase assemblages after heat-treatments at low (α-Ti + TiFe) and high temperatures (α-Ti + β-(Ti,Fe), β-(Ti,Fe)).
1. Introduction
Titanium and titanium-base alloys are promising materials for numerous engineering applications, because they have several outstanding properties [1]. In particular, binary Ti–Fe alloys are in the focus of ongoing research as materials for biomedical applications, because they possess excellent corrosion resistance, high wear resistance, biocompatibility, and appropriate mechanical properties, for instance, a low elastic modulus in comparison with other biocompatible metallic materials [2,3,4]. Furthermore, the binary intermetallic phase TiFe has been presented as a possible material for solid-state hydrogen storage applications [5,6]. Some methods of severe plastic deformation (SPD), such as ball milling and high-pressure torsion (HPT), were utilized to reduce the surface oxidation and to activate the material in order to improve the hydrogen storage properties of TiFe [7,8]. Originally, the SPD methods were utilized to generate bulk nanocrystalline materials that show, in many cases, better physical and mechanical properties than their microcrystalline counterparts [9,10]. Later, it turned out that the unique properties are also facilitated by diffusive and displacive (martensitic) phase transformations, which occur in the material during the HPT process [11,12,13]. However, the mechanism of the phase transformations and the influence of the initial microstructure on the phases formed after HPT are not fully understood yet.
In the unary Ti system, titanium exists in three modifications: as hexagonal α-Ti (space group (SG) P63/mmc) that is stable at low temperatures, as cubic β-Ti (SG: Imm), which is stable at high temperatures, and as hexagonal ω-Ti (SG: P6/mmm), which is stable at high pressures. In the binary Ti–Fe system, two intermediate intermetallic phases TiFe (SG: Pmm) and TiFe2 (SG: P63/mmc) are formed in addition to the phases that are summarized above and in addition to α-Fe/δ-Fe (SG: Imm) and γ-Fe (SG: Fmm). Furthermore, at least two metastable phases, which are formed during a martensitic transformation upon quenching from the bcc-type β-(Ti,Fe) solid solution, were reported in the Ti-rich part of the Ti–Fe system. The first one is a close-packed hexagonal α´-Ti phase (SG: P63/mmc) [14,15,16,17], which is observed in Ti-rich alloys (>95 wt.% Ti), the other one is the so-called athermal ω-Ti(Fe) phase that exists and in a limited compositional range between 97 wt.% and 95 wt.% Ti [18,19,20,21,22]. For higher Fe concentrations (and lower Ti contents), β-(Ti,Fe) is retained as a metastable phase in the alloys.
Phase transitions and respective transformation pathways that were induced by high-pressure torsion were reported for Ti-rich Ti–Fe alloys containing 1–10 wt.% Fe in different initial states (as-cast [23] and heat-treated [24,25,26,27,28]), and, thus, for different phase compositions prior to the HPT process. The as-cast alloys contained a mixture of α-Ti and β-(Ti,Fe) that were partially transformed into ω-Ti(Fe) during the HPT process. The heat treatments were performed almost exclusively above the eutectoid temperature of ~595 °C (β-(Ti,Fe) ⇌ α-Ti + TiFe) [14], i.e., in the single-phase β-(Ti,Fe) or in the two-phase α-Ti + β-(Ti,Fe) regions. After annealing, the samples were quenched in water. The retained amount of the high-pressure ω-Ti(Fe) phase after HPT and the transformation pathway varied, depending on the initial phase fractions and the chemical compositions of the quenched phases [26]. Heat-treated alloys with Fe contents below 4 wt.% contained α′-Ti martensite and/or metastable β-(Ti,Fe) after quenching [24,25,26,27,28]. During HPT, α′-Ti and β-(Ti,Fe) transformed partially to ω-Ti(Fe).
The Fe content in β-(Ti,Fe) depends on the overall Fe concentration in the Ti–Fe alloys and it can vary in a relatively broad range. However, if β-(Ti,Fe) contains ~4 wt.% Fe, athermal ω-Ti(Fe) can be formed within the β-(Ti,Fe) grains after quenching [28,29]. The phase transformation β-(Ti,Fe) → ω-Ti(Fe) is promoted for an iron content about 4 wt.% Fe, because both crystal structures possess a strong orientation relationship (OR) {111}β||(0001)ω and ⟨10⟩β||⟨110⟩ω [18,22], and because the atomic distances within the habitus planes match perfectly together at this composition. Thus, this phase transformation proceeds diffusionless by shearing the crystal structure of β-(Ti,Fe) in the HPT process [26]. For lower Fe contents (≤2 wt.% Fe), the HPT process induces an incomplete ω-Ti(Fe) phase transition [25,28], because the transition of α′-Ti to ω-Ti(Fe) dominates the phase transformation process, which involves the redistribution of iron atoms between α′-Ti and ω-Ti(Fe). The mass transfer impedes finally the phase transformation [26,28].
So far, the thermal stability of HPT-induced ω-Ti(Fe) was predominantly investigated in the samples, which were annealed above the eutectoid temperature (~595 °C) prior to the HPT process and that contained α-Ti, β-(Ti,Fe) and ω-Ti(Fe) in different ratios after the HPT treatment [27,28]. In these samples, the HPT-induced ω-Ti(Fe) phase transformed upon heating at 380 °C into a supersaturated hexagonal α-Ti(Fe) phase. Above 600 °C, α-Ti(Fe) decomposed into the equilibrium phases α-Ti and β-(Ti,Fe), whose fraction varied with the overall composition of the alloy [27].
The thermal stability of ω-Ti(Fe) that was generated by HPT in samples annealed below the eutectoid temperature, i.e., in the α-Ti + TiFe two-phase region, was not investigated in detail yet. Thus, only very little is known regarding the phase transformations in the Ti–Fe alloys with this phase composition. Still, in Reference [24], the binary alloy Ti-4Fe (4 wt.% Fe) was heat-treated below the eutectoid temperature at 470 °C for 750 h and subsequently subjected to HPT. After initial annealing, this alloy contained a mixture of the α-Ti and TiFe phases, which partially transformed into ω-Ti(Fe). Thus, the HPT-deformed microstructure consisted of α-Ti, TiFe and ω-Ti(Fe). In the present work, the HPT-induced formation of ω-Ti(Fe) in initially two-phase alloys (α-Ti + TiFe) is more systematically studied and the stability of the metastable ω-Ti(Fe) phase is investigated upon heating. The transformation pathway was derived from the results of in situ high-temperature X-ray diffraction (HTXRD) and thermal analysis (TA). The experiments were complemented by pressure-dependent thermodynamic calculations that were based on the CalPhaD (calculation of Phase Diagrams) approach, which helped to understand the phase transformations in this system during deformation and heating.
2. Materials and Methods
In the frame of the present work, three alloy compositions (Ti-2Fe, Ti-4Fe, and Ti-10Fe) were prepared and investigated. The numerical values give the iron concentrations in wt.%. The alloys were produced by induction melting of pure materials (Ti: 99.9% and Fe: 99.97%) in vacuum. The cast rod-shaped samples (10 mm in diameter) were cut into the disks of 0.7 mm thickness, which were polished, etched, and annealed for 4000 h at 470 °C in vacuum and subsequently quenched in water. The annealing was carried out in sealed fused silica ampoules, which were evacuated up to the pressure of 4 × 10⁻⁴ Pa. The heat-treated samples were deformed by high-pressure torsion (HPT, five rotations) in a Bridgeman anvil-type press (Klement, Lang, Austria). The HPT process was carried out at an ambient temperature, at a pressure of 7 GPa and with the deformation speed of 1 rpm while using a computer-controlled HPT device.
The oxygen content in the samples was determined using carrier gas hot extraction (CGHE) after the HPT process and after the HTXRD measurements. For the CGHE analyses, the GALILEO G8 device (Bruker AXS, Karlsruhe, Germany) was used. The measurements were performed in a graphite crucible while using He as the carrier gas. Before each measurement, the samples were dipped in diluted HCl acid to remove oxide layers from the sample surface. The spatial distribution of the phases was obtained from the scanning electron micrographs for both heat-treated and deformed states. The SEM images were recorded while using back-scattered electrons (SEM/BSE) with the JSM-7800 F (JEOL, Tokyo, Japan) microscope operating at the accelerating voltage of 20 kV. The grain-size distributions of the phases were determined using electron backscatter diffraction (EBSD) that was performed with an EDAX/EBSD system. The analysis of the data was done while utilizing the OIM Analysis software (version 8, AMETEK/EDAX TSL, Mahwah, NJ, USA). The phase identification in the heat-treated and HPT deformed samples was performed by means of X-ray diffraction (XRD) in a D8 Advanced (Bruker AXS, Germany) diffractometer. The diffractometer worked in the Bragg–Brentano geometry, and it was equipped with a sealed X-ray tube with Co anode (wavelength of CoKα1 = 0.178897 nm), with a Johannson-type monochromator in the primary beam that suppressed the spectral line CoKα2 and with a LynxEye one-dimensional detector. The ex situ XRD patterns were analyzed using the Rietveld method [30,31] (whole pattern refinements), as implemented in the TOPAS [32] software package (version 5, Bruker AXS, Karlsruhe, Germany).
The HTXRD experiments were performed at a constant heating rate of 10 K/min in the temperature range between room temperature and 750 °C using a θ-θ Bruker D8 Advance diffractometer (Bruker AXS, Germany) that utilized the Bragg–Brentano geometry, CuKα radiation (wavelengths: 0.154056 nm and 0.154437 nm), a LynxEye XE one-dimensional detector (Bruker AXS, Germany) and the high-temperature chamber MTC HighTemp+ (Bruker AXS, Germany). During the HTXRD measurements, the samples were placed on a resistively heated tantalum strip that was surrounded by an additional Ta radiation heater to reduce the temperature gradients in the sample. A type D thermocouple (W-Re3/W-Re25), which was contacted on the heating strip below the sample position, was used to measure the sample temperature. The sample was placed on a (100)-oriented sapphire plate in order to avoid reactions between the sample and the Ta heater. The chamber was evacuated to a pressure of ~7 × 10⁻³ Pa to reduce the oxidation of the sample. The HTXRD patterns were recorded in a 2θ range between 33° and 45° with a step size of 0.02° in order to speed up the measurement and reduce the difference in the annealing time and in the temperature during the acquisition of individual diffraction patterns. The temperature difference between the beginning and the end of each measurement was 20 K at the acquisition time of 120 s per diffraction pattern.
Differential scanning calorimetry (DSC) was utilized to determine phase transformation temperatures in the heat-treated samples before and after the HPT process. For DSC, the samples were placed in a platinum crucible with a thin Al2O3 inlet to avoid reactions of the samples with the Pt crucible. The measurements were performed in inert Ar atmosphere (99.999% + Varian cleaning system) while using the differential scanning calorimeter DSC Pegasus 404C (Netzsch, Selb, Germany). Before each experiment, the calorimeter was evacuated and back-filled with Ar several times to remove the remaining oxygen from the DSC chamber. The measurements were done in the temperature range between 35 °C and 1100 °C using the same heating rate of 10 K/min as used for the HTXRD measurements. The temperatures that were recorded in the DSC device were calibrated using melting points of pure metals (In, Sn, Al and Au).
3. Results
3.1. Characterization of the Initial State of the Samples
After annealing at 470 °C, i.e., below the temperature of the eutectoid reaction β ⇌ α-Ti + TiFe, the alloys Ti-2Fe, Ti-4Fe, and Ti-10Fe show a two-phase α-Ti + TiFe microstructure (see Figure 1a–c). Some TiFe particles were ordered in chains along the boundaries of the α-Ti grains (see, for example, Figure 1a). This phenomenon is called incomplete or complete grain boundary wetting by a second solid phase and it has been previously observed in various Ti-based alloys [23,33,34,35,36,37]. In the corresponding SEM/BSE micrographs, the TiFe grains appear to be bright due to a higher Fe content and, thus, a higher mean atomic number of TiFe as compared to α-Ti. Moreover, no coarse-grain microstructure of TiFe was observed, even though the samples were annealed for 4000 h at 470 °C. The averaged grain sizes of α-Ti, determined using EBSD were (3.1 ± 2.0) µm, (3.0 ± 2.0) µm, and (1.4 ± 1.0) µm in the alloys Ti-2Fe, Ti-4Fe, and Ti-10Fe, respectively. The sizes of the TiFe grains were (0.6 ± 0.2) µm, (0.7 ± 0.3) µm, and (2.1 ± 1.0) µm in the same samples. The limited growth of the α-Ti and TiFe grains can be explained by either very slow recrystallization and grain-growth kinetics or by very slow diffusion velocities at the heat-treatment temperature of 470 °C. The phase fractions of α-Ti and TiFe were concurrently determined from the whole XRD patterns using the Rietveld method and from the chemical composition of the respective alloy using the lever rule for comparison (see Table 1) [14].
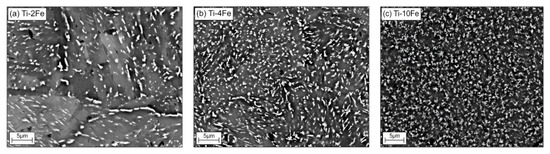
Figure 1.
Initial microstructures of samples Ti-2Fe (a), Ti-4Fe (b), and Ti-10Fe (c) annealed at 470 °C for 4000 h. The white grains belong to TiFe, the gray areas to α-Ti.

Table 1.
Comparison of the phase fractions in the samples annealed at 470 °C for 4000 h, which were determined from the X-ray diffraction (XRD) measurements and calculated using the thermodynamic description of the binary Ti–Fe system by application of the lever rule. All of the phase amounts are given in wt.%. The uncertainty of the XRD phase analysis utilizing Rietveld refinement falls generally within a range of 1% to 3%.
Upon the Rietveld refinement, the lattice parameters of α-Ti and TiFe were calculated in addition to the phase composition that was fit together with the degree of the preferred orientation {0001} of the α-Ti crystallites. The March–Dollase model described this texture, which was probably caused by the foregoing sample preparation and annealing [38]. Applying this model, the phase fractions obtained from XRD for Ti-2Fe and Ti-4Fe agree very well with the phase fractions calculated from the chemical composition (Table 1). In alloy Ti-10Fe; however, the apparent texture was much more complex, because bad grain statistics caused the differences in diffracted intensities. Consequently, it was not possible to describe the texture satisfactorily using the March–Dollase model, which led to a larger uncertainty in the calculated phase fractions of α-Ti and TiFe (see Table 1). Assuming that the equilibrium state was achieved in all samples, the chemical compositions of α-Ti and TiFe are the same for all of investigated alloys (independent of the iron content). The lattice parameters of α-Ti and TiFe were aα-Ti = 0.2951(2) nm, cα-Ti = 0.4691(2) nm and aTiFe = 0.2978(2) nm, respectively. The obtained lattice parameters aα-Ti and cα-Ti correspond to the maximum Fe content in α-Ti at 470 °C. The lattice parameter aTiFe agrees with the reference value for TiFe [39].
The phase transition temperatures of the annealed alloys were determined by means of DSC upon heating at the heating rate of 10 K/min and they are shown in Figure 2. The endothermic heat effect registered at ~584 °C corresponds to the eutectoid reaction β ⇌ α-Ti + TiFe that was detected in all of the samples, but with different extents. The increase of the heat amount with increasing Fe content is related to a higher amount of TiFe taking part in the eutectoid reaction. The β-transus temperatures (marked by crosses in Figure 2) decrease with an increasing Fe content, because the eutectoid point is located at higher iron contents (between 11 wt.% and 14 wt.% Fe) [14,40,41,42,43].
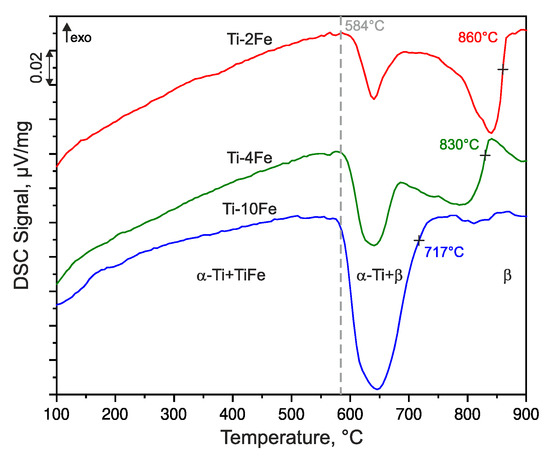
Figure 2.
Differential scanning calorimetry (DSC) heating curves of alloys Ti-2Fe, Ti-4Fe, and Ti-10Fe measured with the heating rate of 10 K/min. The DSC curves were shifted vertically for better visibility. The dashed line indicates the temperature of the eutectoid reaction β ⇌ α-Ti + TiFe. The crosses indicate the β-transus temperatures (solvus temperatures of the β phase), which were determined as inflection points of the respective DSC curve.
3.2. Characterization of the Deformed Samples after HPT Process
Microstructural changes in the HPT-deformed alloys were characterized while using SEM (Figure 3a–c). Apparently, the TiFe phase (white grains) is only slightly affected by the HPT process, because the α-Ti matrix mainly absorbed the deformation energy. After HPT, the grains of the α-Ti matrix are strongly refined. This behavior is expected, because the intermetallic compound TiFe is much harder (481 ± 44 HV0.025 [44]) than the soft α-Ti matrix (~180 HV0.5 [45]). Still, the chains of the TiFe precipitates, which were initially ordered in the annealed samples, were destroyed (compare the micrographs in Figure 1 and Figure 3). The oxygen content within the deformed samples measured while using CGHE was very low, namely 0.0049(3) wt.%, 0.0055(3) wt.%, and 0.0024(3) wt.% for the alloys Ti-2Fe, Ti-4Fe, and Ti-10Fe, respectively.
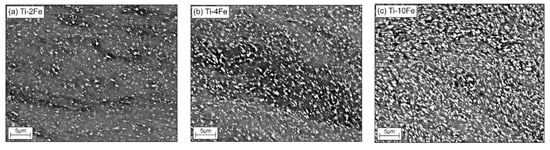
Figure 3.
Microstructures of the high-pressure torsion (HPT) samples Ti-2Fe (a), Ti-4Fe (b), and Ti-10Fe (c) as seen by SEM/BSE. Prior to the HPT process, the samples were annealed at 470 °C for 4000 h. The white grains are TiFe, the gray areas correspond to the α-Ti and ω-Ti(Fe) phases.
The phase analysis using XRD confirmed that the HPT process produced ω-Ti(Fe). The comparison of the phase fractions in the annealed (Table 1) and HPT-treated samples (Table 2) shows that the amount of TiFe only decreased slightly, while the amount of α-Ti was drastically reduced during the HPT process. Thus, the ω-Ti(Fe) phase predominantly developed from α-Ti. In the alloys Ti-2Fe and Ti-4Fe, approximately 50 wt.% of α-Ti, was transformed into ω-Ti(Fe). Higher Fe contents and, consequently, a higher amount of the TiFe phase present in the respective alloys impede the HPT-induced phase transition, as can be seen on the lower relative amount of ω-Ti(Fe) in alloy Ti-10Fe (Table 2). As the lattice parameters of α-Ti in the annealed samples does not depend on the chemical composition of the alloy (see Section 3.1) the HPT-induced phase transformation α-Ti + TiFe → ω-Ti(Fe) + TiFe must be impeded by a higher amount of TiFe because the concentration of Fe in α-Ti is the same.
Table 2.
Phase fractions (wt.%) in HPT-deformed samples, as determined using XRD. nα→ω = ω/(α + ω) is the fraction of α-Ti, which transformed to ω-Ti(Fe). The errors of the XRD phase analysis (1% to 3%) were estimated based on the goodness of fit.
After the HPT treatment, the line positions of the α-Ti(Fe) and TiFe phases were found to be shifted towards lower diffraction angles in all alloys. Such an increase of the unit cell volume of the phases after the deformation by HPT was already detected in earlier observations [24,25,26]. A large amount of defects and lattice distortions are generated during the severe plastic deformation in the HPT process [9,46], which lead to an increase of the lattice parameter of α-Ti and TiFe were aα-Ti = 0.2956(1) nm, cα-Ti = 0.4694(1) nm, and aTiFe = 0.2982(1) nm, respectively. The refined lattice parameters of ω-Ti(Fe), aω-Ti(Fe) = 0.4620(1) nm and cω-Ti(Fe) = 0.2829(1) nm, obey the relationship
which indicates that the crystal structure of ω-Ti(Fe) is pseudo-cubic. Consequently, the XRD lines and from ω-Ti(Fe) are located at the same position. Because of the orientation relationship and between the hexagonal ω phase and the cubic bcc lattice [18,22,47,48], the lattice parameters of ω-Ti(Fe) can be expressed in terms of a cubic bcc lattice parameter
with abcc = 0.3267(1) nm. After HPT deformation, a satisfying agreement between the measured and refined XRD data was achieved, even for Ti-10Fe, when the preferred orientation was implemented into the Rietveld refinement using TOPAS [32], as described above. It was found that the α-Ti phase possesses a {0001} texture, which is, however, almost negligible for Ti-2Fe.
3.3. Thermal Stability of ω-Ti(Fe) Produced by the HPT Process
Complementary DSC and high-temperature XRD measurements were performed for the description of the thermal stability of the deformation-induced ω-Ti(Fe) phase. The DSC curves of the HPT-deformed samples were recorded upon heating at the heating rate of 10 K/min, and they are shown in Figure 4. The HTXRD patterns (Figure 5) were measured at the same heating rate (10 K/min). For HTXRD, the sample temperatures were calibrated with the aid of the initial temperature at the beginning of the measurements (25 °C) and while using the temperature of the endothermic effect at 562 °C that corresponds to the eutectoid reaction β ⇌ α-Ti + TiFe and the transformation of the intermetallic phase TiFe. The transformation of TiFe can be detected by both techniques, DSC and XRD. The reaction temperature should be the same for all of the investigated alloys due to the invariance of the eutectoid reaction. Therefore, the same temperature calibration procedure can be applied to all investigated alloys.
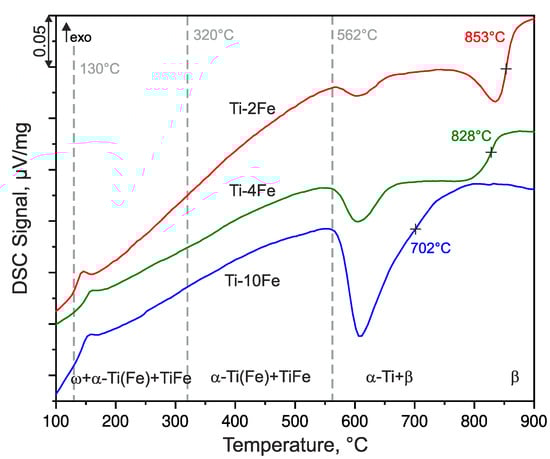
Figure 4.
DSC heating curves of alloys Ti-2Fe, Ti-4Fe, and Ti-10Fe measured with the heating rate of 10 K/min. The dashed lines at 130 °C and 320 °C indicate the beginning and the end of the ω back-transformation as concluded from high-temperature X-ray diffraction (HTXRD). The dashed line at 562 °C marks the eutectoid reaction β-(Ti,Fe) ⇌ α-Ti(Fe) + TiFe. The temperatures marked by crosses indicate the β-transus temperatures (solvus temperatures of the β phase), which were determined as inflection points of the respective DSC curves.
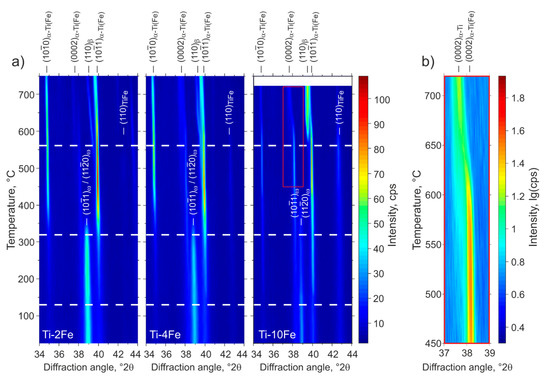
Figure 5.
Low-angle part of the HTXRD patterns of Ti-2Fe, Ti-4Fe, and Ti-10Fe that were originally annealed for 4000 h at 470 °C and subjected to HPT. The positions of diffraction lines originating from the phases α-Ti(Fe), β, ω and TiFe are indicated by markers at the top or inside the figures. The temperature axes of the HTXRD measurements were calibrated according to the DSC measurements as described in the text. The dashed lines in (a) indicate the transformation temperatures upon heating from Figure 4. (b) illustrates the change of the 0002 line position in Ti-10Fe (see inset in (a)) at high temperatures.
Prior to the DSC and HTXRD measurements, all of the samples contained a mixture of α-Ti(Fe), TiFe and ω-Ti(Fe). The denotation α-Ti(Fe) emphasizes an increased iron solubility in α-Ti, due to (i) the HPT process and (ii) the reconversion of ω-Ti(Fe) → α-Ti(Fe) upon heating. These phenomena will be discussed in detail below. The first DSC effect observed upon heating was an exothermic peak occurring at approx. 130 °C (Figure 4), which was accompanied by the sharpening of the originally extremely broad XRD lines from α-Ti(Fe) (Figure 5). Concurrently, the XRD lines from α-Ti(Fe) became more intense at the expense of the XRD lines from ω-Ti(Fe), which indicates the onset of the reconversion of ω-Ti(Fe) to α-Ti(Fe). At 320 °C, the phase transition ω-Ti(Fe) → α-Ti(Fe) proceeds tremendously. The transition is completed at temperatures that were slightly above ~350 °C. In contrast to HTXRD, DSC did not recognize the end of the decomposition of ω-Ti(Fe), because it is not accompanied with a noticeable thermal effect. The ω-Ti(Fe) → α-Ti(Fe) transition is a continuous process, thus the heat release is spread over a broad temperature range.
After the decomposition of ω-Ti(Fe), all of the samples exhibited a two-phase microstructure containing hexagonal α-Ti(Fe) and cubic TiFe. The appearance of an additional diffraction line (0002 of α-Ti, c.f., Figure 5) at lower diffraction angles and the presence of anisotropic (hkl-dependent) line broadening upon further heating indicate changes in the Fe concentration in the α-Ti(Fe) phase. The incorporation of Fe into the hexagonal α-Ti lattice mainly leads to a reduction of the lattice parameter cα-Ti, while the lattice parameter aα-Ti remains nearly unaffected [25,27]. Accordingly, the diffraction line 0002, which appears at temperatures above 400 °C, and that is located at a lower diffraction angle in Figure 5b, corresponds to the equilibrium α-Ti phase that only exhibits a negligible solubility for Fe [14]. On the other side, the hexagonal α-Ti(Fe) phase, which is present in all alloys after the HPT process and that is formed by the back-transformation of ω-Ti(Fe), should possess increased iron solubility.
At the temperature of 562 °C, the mixture of α-Ti, α-Ti(Fe) and TiFe transforms via an eutectoid reaction into a two-phase mixture of β-(Ti,Fe) and α-Ti (Figure 5). In the DSC measurements (Figure 4), the temperature of the eutectoid reaction was determined from its onset point. Above the eutectoid temperature, the amount of β-(Ti,Fe) continuously increases with further heating. The transus temperatures of β-(Ti,Fe) determined using DSC depends on the iron content in the respective alloy (Figure 4). A comparison of the eutectoid temperature and the β-(Ti,Fe)-transus temperatures that were measured for the heat-treated (Figure 2) and severe plastically deformed samples (Figure 4) reveals that both temperatures are slightly shifted towards lower values after the HPT process. Figure 6 shows a comparison of the transition temperatures measured by DSC before and after HPT.
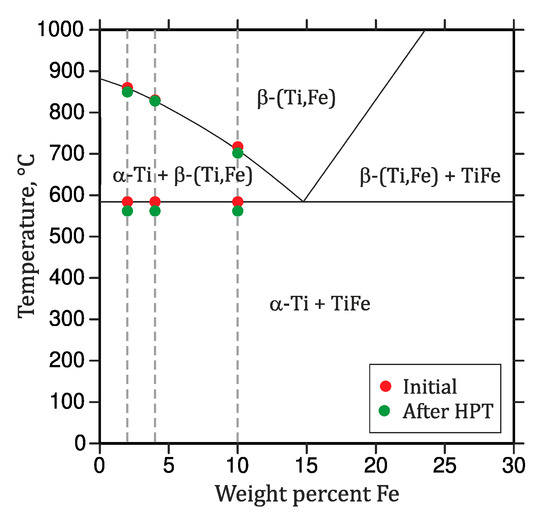
Figure 6.
Partial phase diagram of the Ti-rich corner of the binary Ti–Fe system. The circles indicate the measured phase transition temperatures (DSC) of the samples in the initial state (red) and after deformation by HPT (green).
The sequence of the phase transitions is illustrated on the temperature dependence of the integral intensities of the XRD lines measured for individual phases (Figure 7), i.e., , , , and //. For ω-Ti(Fe) and α-Ti(Fe), the sums of the integral intensities of the measured lines were considered. For convenience, the integral intensities were converted into the phase compositions by normalizing the phase composition of the respective alloy to the phase composition from Table 2. This ‘external standard’ method neglects the effect of the possible changes in the preferred orientation of crystallites due to the sample recrystallization and the effect of the Debye–Waller factor on the phase composition, as the corresponding factors influencing the diffracted intensities are assumed to remain constant. However, it gives a good overview of the phase transitions, as can be seen from the almost monotonous and definitely reasonable trend of the TiFe phase fraction.
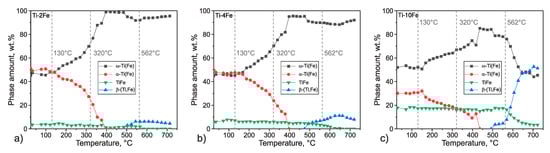
Figure 7.
Temperature dependences of the phase composition in alloys Ti-2Fe (a), Ti-4Fe (b), and Ti-10Fe (c) obtained from the HTXRD measurements carried out upon heating. The integral intensities were normalized to the phase compositions at the initial state of samples after HPT (Table 2). The intensities of the diffraction lines 100, 0002, and 101 of α-Ti and α-Ti(Fe), and 101 and 110 of ω-Ti(Fe) were summed up. The temperature axes of the HTXRD measurements were calibrated according to the DSC measurements.
The beginning of the transformation ω-Ti(Fe) → α-Ti(Fe), which was observed during the DSC measurement as an exothermic effect at 130 °C, results in a rapid decrease of the ω-Ti(Fe) phase fraction and in a concurrent increase of the α-Ti(Fe) phase fraction. In alloy Ti-4Fe, the DSC peak from the exothermal effect is slightly shifted towards higher temperatures. Upon further heating, ω-Ti(Fe) continuously transforms into α-Ti(Fe). Above a temperature of 400 °C, all of the alloys exhibit a two-phase microstructure containing the hexagonal α-Ti(Fe) and the cubic TiFe phase. The phase amount of TiFe increases with increasing Fe content in the alloy. At temperatures above 500 °C and below the eutectoid temperature, the supersaturated α-Ti(Fe) releases iron, which is subsequently solved in the cubic β-(Ti,Fe) phase. Thus, β-(Ti,Fe) was formed by this process already below the eutectoid temperature. At 562 °C, the eutectoid reaction occurs and TiFe transforms into the equilibrium phases α-Ti + β-(Ti,Fe). A further temperature increase should lead to a continuously increasing phase amount of β-(Ti,Fe) and a decreasing amount of α-Ti. This behavior was not observed during the HTXRD measurements, which is caused by the proceeding oxidation of the samples, which stabilizes α-Ti. Therefore, the results of HTXRD measurements can be compared with the results of the DSC measurements only up to temperatures of ~650 °C. In the alloys Ti-2Fe, Ti-4Fe, and Ti-10Fe that were subjected to HTXRD, the CGHE analysis revealed the oxygen concentrations of 0.0374(3) wt.%, 0.0262(3) wt.%, and 0.0032(3) wt.%, respectively, which are much higher than prior to HTXRD.
3.4. Thermodynamic Calculations
A pressure-dependent thermodynamic description of the binary Ti–Fe system was generated with the aid of the CalPhaD (Calculation of Phase Diagrams) approach for a better understanding of the experimental observations and especially for validation of the phase stabilities and reverse transformation of ω-Ti(Fe) to α-Ti [49]. The details of the thermodynamic calculations will be described elsewhere [50]. Exemplarily, the temperature-pressure (t–p) phase diagram is shown for alloy Ti-4Fe (see Figure 8a). Figure 8b illustrates the effect of the chemical composition for the hydrostatic pressure of 10 GPa. In contrast to unary t–p phase diagrams, which solely contain single-phase regions, two-phase regions can be present in those binary t–p phase diagrams (calculated for a given binary composition). The black lines represent either solvus lines or three-phase equilibria, with varying pressure and temperature. The presence of two-phase regions become obvious if a binary t–p phase diagram (Figure 8a) is compared with a t–w(Fe) phase diagram (Figure 8b). In Figure 8a, the vertical dashed line marks the pressure value of 10 GPa in Figure 8b the alloy composition of Ti-4Fe.
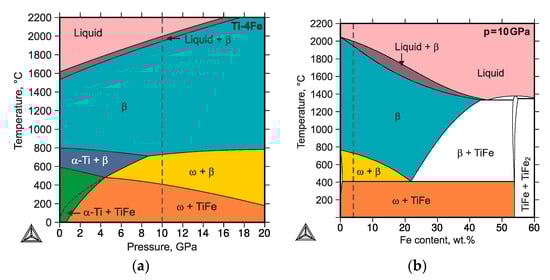
Figure 8.
(a) Temperature-pressure phase diagram calculated for the composition Ti-4Fe (wt.%) and (b) temperature–composition phase diagram calculated for the pressure of 10 GPa. The vertical dashed lines mark the pressure value of 10 GPa (in (a)) and the alloy composition of Ti-4Fe (in (b)). The black dashed line in the bottom left corner of panel (a) indicates the metastable extension of the β-(Ti,Fe) + ω-Ti(Fe) region.
For an ambient temperature, the thermodynamic calculations revealed that the α-Ti + TiFe two-phase mixture, which is stable at ambient pressure, transforms at the pressure of ~0.8 GPa into a two-phase mixture of ω-Ti(Fe) and TiFe. Thus, the applied pressure during the HPT (7 GPa) should be sufficient for initiating the phase transformation of α-Ti + TiFe to ω-Ti(Fe) + TiFe. The high-pressure phase persists, even after the HPT process, being stabilized by the interaction with other phases that are present in the HPT samples.
In alloys that were annealed at high temperatures (800 °C) and subsequently quenched [26], the high-temperature phase assemblage was retained for the iron contents ≥4 wt.%. In that case, the transformation pathway was found to proceed from β-(Ti,Fe) or from an α-Ti + β-(Ti,Fe) mixture to a β-(Ti,Fe) + ω-Ti(Fe) mixture [26,28,29]. However, it was also reported that minor amounts of α-Ti are preserved after the HPT process. The initiation of the ω-Ti(Fe) transformation was found to be very easy, which means that the phase transformation should already occur at low pressures [26]. The metastable extension of the β-(Ti,Fe) + ω-Ti(Fe) region was thermodynamically calculated in order to predict this behavior (see black dashed line in Figure 8a) by suspending the formation of the TiFe phase. Thermodynamic calculations revealed that the phase transformation into the high-pressure phase assemblage should occur at room temperature already at the atmospheric pressure. This indicates that the transformation to the high-pressure ω-Ti(Fe) phase should already occur at very low pressures using HPT, which was also experimentally observed [26]. It is worth noting that the CalPhaD calculations reflect the equilibrium state in the samples under hydrostatic pressures, which is far away from the sample state that is generated in the HPT process. The main features of the HPT process are (i) the large portion of torsional stain, which mainly induces shear stresses and (ii) the short process times at ambient temperatures. However, the predicted transformations pathways are comparable with those experimentally observed—the trends are correct.
4. Discussion
4.1. HPT-Induced Formation of ω-Ti(Fe) in Samples Containing α-Ti As a Dominant Phase
The ω-Ti(Fe) phase can be produced in different ways in a HPT process. In previous studies, in which Ti-rich Ti–Fe samples were heat treated at temperatures above the eutectoid reaction [25,26,27,28], ω-Ti(Fe) was formed either from a single β-(Ti,Fe) phase or from a mixture of α′-Ti(Fe) martensite and β-(Ti,Fe). In Reference [26], it was shown that the iron concentration and the phase composition prior to the HPT process influence strongly the amount of the HPT-induced ω-Ti(Fe). For 4 wt.% of Fe, the transformation β-(Ti,Fe) → ω-Ti(Fe) already occurred at low pressures and it was almost completed after few HPT rotations, because the coincidence of the lattice parameters of pseudo-cubic ω-Ti(Fe) with the lattice parameter of β-(Ti,Fe) facilitates the diffusionless phase transition at this particular Fe concentration. For 2 wt.% Fe, still approximately 80% of the sample was transformed to ω-Ti(Fe) [26]. In the current study, the fractions of the ω-Ti(Fe) phase in samples Ti-2Fe and Ti-4Fe (~50%, c.f., Table 2) were significantly lower than the amount of ω-Ti(Fe) in samples with the same Fe content that were annealed at high temperatures [26]. The phase fractions of ω-Ti(Fe) produced in samples with 10 wt.% Fe are very similar for different annealing temperatures and, therefore, for different phase compositions prior to the HPT process.
The microstructure characterization using XRD and SEM confirmed that all of the samples under study (Ti-2Fe, Ti-4Fe, and Ti-10Fe) contained α-Ti and TiFe after annealing at 470 °C for 4000 h. The HPT induced the formation of the high-pressure ω-Ti(Fe) phase, which also remained stable at ambient conditions. The ω-Ti(Fe) phase was mainly produced from severely plastically deformed α-Ti, which absorbed the majority of the deformation energy. The TiFe grains were only slightly affected by the HPT process. Still, the TiFe precipitates, which were ordered in chains along the grain boundaries of the α-Ti phase in the annealed samples, were more randomly distributed after the HPT treatment, and the amount of crystalline TiFe was slightly reduced (c.f., Table 1 and Table 2). After the long-term annealing, i.e., under thermodynamically equilibrium conditions, α-Ti can accommodate approximately 9.4 × 10⁻³ wt.% Fe. This means that α-Ti is practically free of iron in the samples that were annealed at 470 °C and that the ω-Ti(Fe) formation in these samples should be inhibited by the lack of iron in the parent phase. On the other hand, the shift of the diffraction line 0002α-Ti(Fe) towards lower diffraction angles, which is visible in Figure 5, indicates that the iron content in back-transformed α-Ti(Fe) varies upon heating and, consequently, ω-Ti(Fe) did not originate from pure α-Ti, but from supersaturated α-Ti(Fe) like in the samples from Reference [27].
Two approaches were used in order to estimate the iron content in ω-Ti(Fe). In the first one, the iron content in ω-Ti(Fe) was determined from the phase fractions before and after the HPT process. This approach is based on the assumptions that the application of pressure does not significantly change the homogeneity range of TiFe and that the residual hexagonal α-Ti(Fe), which is still present after HPT, contains the same amount of iron, like the high-pressure ω-Ti(Fe) phase. In the second approach, the iron content was estimated from the measured lattice parameter of ω-Ti(Fe) and from the Vegard dependence of aω-Ti(Fe) known from literature.
The phase amount of α-Ti(Fe) is significantly reduced due to the formation of ω-Ti(Fe) (compare Table 1 and Table 2). However, the HPT process also reduced the amount of TiFe. Even though the decrease of the phase fraction of TiFe after HPT is small, their variation falls outside the estimated error limit. Using the law of the mass conservation, the initiation of the phase transitions due to HPT can be expressed, as follows:
In Equation (3), (in wt.%) and (in wt.% of Fe) are the fractions of the involved phases (α, TiFe and ω) and their chemical compositions in the sample state (initial, after HPT), respectively. While assuming a constant chemical composition of TiFe before and after HPT (), and the same chemical composition of α-Ti(Fe) and ω-Ti(Fe) in HPT processed samples (), Equation (3) can be written as:
For 9.4 × 10⁻³ wt.% Fe, 53.6 wt.% Fe, and for the phase compositions, according to Table 1 and Table 2, the Fe content in ω-Ti(Fe) was determined to be 1 wt.%.
The comparison of the lattice parameters was used as a complementary approach for the estimation of the iron content in ω-Ti(Fe). In commercially pure HPT-deformed Ti samples, the lattice parameters of ω-Ti were aω-Ti = 0.4627 nm and cω-Ti = 0.2830 nm [25]. The lattice parameters of ω-Ti(Fe) measured for the iron-containing alloys in this study were aω-Ti(Fe) = 0.4620(1) nm and cω-Ti(Fe) = 0.2829(1) nm. This confirms that iron atoms that are dissolved in the ω-Ti(Fe) phase lead to a reduction of the elementary cell volume, as already stated in References [25,26]. Moreover, the change of aω-Ti(Fe) is larger than the change of cω-Ti(Fe). At the iron contents of 4 wt.%, the pseudo-cubic lattice parameter of ω-Ti(Fe) coincides with the lattice parameter of β-(Ti,Fe) [26]. The whole dependence of the lattice parameter of β-(Ti,Fe) on the iron content was described in References [14,26,29]. The lattice parameters aω-Ti(Fe) = 0.4603(6) nm and cω-Ti(Fe) = 0.2819(1) nm containing 4 wt.% Fe were calculated using Equation (2) from the lattice parameter of β-(Ti,Fe) with the same amount of Fe (abcc = 0.3255(2) nm) [29]. Assuming a linear dependence of the lattice parameter aω-Ti(Fe) on the Fe concentration between Fe-free ω-Ti and ω-Ti(Fe) containing 4 wt.% Fe, the iron content in the sample under study was estimated to be approximately 1.2 wt.%. This value is in good agreement with the iron concentration of ~1 wt.% that was concluded from the difference in the phase fractions before and after the HPT deformation. The lattice parameter aω-Ti(Fe) was used for the estimation of the Fe concentration in ω-Ti(Fe), because it is more sensitive to the iron concentration than cω-Ti(Fe).
4.2. Thermal Stability of the HPT-Deformed Microstructure
At ambient conditions, all of the HPT-deformed samples contained a mixture of three phases, i.e., α-Ti(Fe), TiFe and ω-Ti(Fe). The phase amounts were different, depending on the alloy composition. Upon heating, a relatively large exothermal DSC effect was registered at ~130 °C (onset temperature). However, in alloy Ti-4Fe, the beginning of the exothermal DSC effect was less abrupt than for the other alloys (compare Figure 4). The exothermal effect is related with the initiation of the decomposition process of the pressure-induced ω-Ti(Fe) phase and with the release of the deformation energy. Similar observations have already been made for pure Ti [51] and for Ti-1Fe [23]. At a temperature of ~320 °C, the phase amount of ω-Ti(Fe) decreases abruptly. Between 400 °C and 450 °C, this metastable phase completely disappeared (Figure 7). In a previous study [27] that was devoted to the investigation of the thermal stability of ω-Ti(Fe) in HPT deformed metastable β-(Ti,Fe) and α-Ti + β-(Ti,Fe) alloys, a cascade of exothermal DSC effects was observed between 150 °C and 450 °C. These effects originated from the gradual transformations of ω-Ti(Fe) to α-Ti(Fe) and from the defect annihilation and recrystallization processes [27]. Moreover, the strongest exothermal effect was observed at around 380 °C, whereas the released heat increases with increasing iron content within the investigated alloys. These results demonstrate that ω-Ti(Fe) possesses a lower thermal stability, if it is formed from α-Ti (present work) than if it is formed from β-(Ti,Fe). The differences in the phase composition of the HPT samples might cause this difference in the stability of the pressure-induced ω-Ti(Fe) phase, but also by the differences in the iron concentration in ω-Ti(Fe), because ω-Ti(Fe) originating from β-(Ti,Fe) possesses a higher Fe concentration than ω-Ti(Fe) stemming from α-Ti(Fe). The ω-Ti(Fe) phase, which was formed from the α-Ti + TiFe two-phase alloys contained approximately 1 wt.% Fe after HPT, whereas the ω-Ti(Fe) generated from metastable β-(Ti,Fe) alloys was found to contain ~4 wt.% Fe [26,27,28].
In the intermediate range between 400 °C and 562 °C, all of the alloys exhibit a two-phase α-Ti(Fe) + TiFe microstructure. At ~500 °C, which is still below the eutectoid reaction temperature, a shift of the line 0002 from α-Ti(Fe) towards lower diffraction angles was detected by HTXRD, together with the appearance of diffraction lines of β-(Ti,Fe). This phenomenon was already observed in former studies [27,29], where it was assigned to a variation of the iron solubility in the α-Ti(Fe) phase. The decomposition of the supersaturated α-Ti(Fe) phase to the equilibrium α-Ti phase is related to the shift of the diffraction line 0002α-Ti(Fe) towards smaller diffraction angles. In the present work, this effect is much less pronounced, because the phase amount of ω-Ti(Fe) only approaches approx. 50% after the HPT process. A pronounced endothermic heat effect corresponding to the eutectoid reaction β-(Ti,Fe) ⇌ α-Ti + TiFe was registered at ~584 °C in the annealed, but not deformed, samples. The eutectoid reaction temperature is in good agreement with References [14,40,41,42,43], where this reaction was reported between 583 °C and 590 °C. After the HPT deformation, the measured temperature of the eutectoid reaction was found to be lowered to ~562 °C. The same behavior was observed for the β-(Ti,Fe)-transus temperature. Thus, strong deformations and/or small grain sizes of the α-Ti(Fe) and TiFe phases, which are characteristic microstructural features after the HPT process, lead to a shift of the equilibrium reaction temperatures towards lower values. Moreover, the development of the phase fractions upon heating (Figure 7) shows, in contrast to the phase diagram (Figure 6), that the phase amount of β-(Ti,Fe) does not continuously increase. At temperatures above 600 °C in the HTXRD measurements, the phase amount of β-(Ti,Fe) stagnated, and even decrease in Ti-2Fe and Ti-4Fe. The reason for that behavior is a slight oxidation of the samples during the HTXRD measurement. The CGHE measurements revealed increased oxygen content inside the samples after the HTXRD measurements (see Section 3.2), which confirms that the oxidation of the samples at high-temperatures, even under high vacuum, could not be prevented. Oxygen is an element stabilizing the α-Ti phase [52]. Therefore, α-Ti is stabilized at temperature above 600 °C and, thus, no single-phase β-(Ti,Fe) state was generated inside the samples upon further heating in the HTXRD device.
5. Conclusions
The high-pressure torsion (HPT) treatment of two-phase Ti–Fe alloys consisting of a mixture of α-Ti and TiFe led to the formation of the high-pressure ω-Ti(Fe) phase mainly at the expense of α-Ti. The concentration of iron in ω-Ti(Fe), which was ~1 wt.%, was alternatively estimated from the difference in the phase fractions before and after the HPT process and from the measured lattice parameters of ω-Ti(Fe). The overall iron concentration in the samples (2 wt.%, 4 wt.%, and 10 wt.% Fe) primarily influenced the amount of TiFe, which inhibited the phase transition α-Ti → ω-Ti(Fe) to some extent, in particular in sample containing 10 wt.% Fe. The comparison with previous investigations, which were carried out on samples that were annealed above the eutectoid reaction, i.e., on samples mainly containing β-(Ti,Fe), has shown that the high-pressure ω-Ti(Fe) phase can be much more easy produced from β-(Ti,Fe) than from α-Ti. Thermodynamic calculations confirmed this experimental finding. The combination of in situ high-temperature X-ray diffraction and differential scanning calorimetry revealed that ω-Ti(Fe) starts to decompose exothermically already at 130 °C. Still, it survives up to ~320 °C, where its amount tremendously decreases. The thermal stability of ω-Ti(Fe) in the samples under study was lower than in the alloys, which were annealed above the eutectoid reaction. Nevertheless, the decomposition pathway via a supersaturated α-Ti(Fe) phase was also observed in the present work.
Author Contributions
Conceptualization, M.J.K., D.R. and B.B.S.; methodology, A.K., M.J.K. and B.B.S.; software, M.J.K. and M.R..; validation, M.J.K. and M.R.; formal analysis, M.J.K. and M.R.; investigation, M.J.K. and M.R.; resources, D.R. and H.H.; writing—original draft preparation, M.J.K. and M.R.; writing—review and editing, O.F., D.R., B.B.S., J.I.; supervision, O.F. and D.R.; funding acquisition, J.I., O.F., H.H., B.B.S. and D.R. All authors have read and agreed to the published version of the manuscript.
Funding
This research was funded by the German Research Foundation (grant numbers RA 1050/20-1, IV 98/5-1, HA 1344/32-1, FA 999/1-1), Russian Foundation for Basic Research (grant number 18-03-00067) and State tasks of the Russian federal ministry of education and science (grant number n/a), and by the Karlsruhe Nano Micro Facility.
Acknowledgments
The authors would like to thank Alena Gornakova from the Institute of Solid State Physics (Russian Academy of Sciences) for her assistance in the preparation of the alloys, Th. Kreschel from the Institute of Iron and Steel Technology (TU Bergakademie Freiberg) for the determination of the oxygen content in the samples by means of carrier hot gas extraction method, and Ch. Schimpf and A. Walnsch from the Institute of Materials Science (TU Bergakademie Freiberg) for conventional X-ray measurements and SEM/EBSD investigations.
Conflicts of Interest
The authors declare no conflict of interest.
References
- Lütjering, G.; Williams, J.C. Titanium, 2nd ed.; Springer: Berlin/Heidelberg, Germany, 2007; ISBN 978-3-540-71397-5. [Google Scholar]
- Ehtemam-Haghighi, S.; Prashanth, K.G.; Attar, H.; Chaubey, A.K.; Cao, G.H.; Zhang, L.C. Evaluation of mechanical and wear properties of TixNb7Fe alloys designed for biomedical applications. Mater. Des. 2016, 111, 592–599. [Google Scholar] [CrossRef]
- Abdelrhman, Y.; Gepreel, M.A.-H.; Kobayashi, S.; Okano, S.; Okamoto, T. Biocompatibility of new low-cost (α+β)-type Ti-Mo-Fe alloys for long-term implantation. Mater. Sci. Eng. C 2019, 99, 552–562. [Google Scholar] [CrossRef] [PubMed]
- Zhang, L.-C.; Chen, L.-Y. A review on biomedical titanium alloys: Recent progress and prospect. Adv. Eng. Mater. 2019, 21, 1801215. [Google Scholar] [CrossRef]
- Sandrock, G. A panoramic overview of hydrogen storage alloys from a gas reaction point of view. J. Alloy. Compd. 1999, 293, 877–888. [Google Scholar] [CrossRef]
- Sujan, G.K.; Pan, Z.; Li, H.; Liang, D.; Alam, N. An overview on TiFe intermetallic for solid-state hydrogen storage: Microstructure, hydrogenation and fabrication processes. Crit. Rev. Solid State Mater. Sci. 2019, 1–18. [Google Scholar] [CrossRef]
- Edalati, K.; Akiba, E.; Horita, Z. High-pressure torsion for new hydrogen storage materials. Sci. Technol. Adv. Mater. 2018, 19, 185–193. [Google Scholar] [CrossRef]
- Emami, H.; Edalati, K.; Matsuda, J.; Akiba, E.; Horita, Z. Hydrogen storage performance of TiFe after processing by ball milling. Acta Mater. 2015, 88, 190–195. [Google Scholar] [CrossRef]
- Valiev, R.Z.; Islamgaliev, R.K.; Alexandrov, I.V. Bulk nanostructured materials from severe plastic deformation. Prog. Mater. Sci. 2000, 45, 103–189. [Google Scholar] [CrossRef]
- Zhilyaev, A.P.; Langdon, T.G. Using high-pressure torsion for metal processing: Fundamentals and applications. Prog. Mater. Sci. 2008, 53, 893–979. [Google Scholar] [CrossRef]
- Bachmaier, A.; Pippan, R. High-Pressure Torsion Deformation Induced Phase Transformations and Formations: New Material Combinations and Advanced Properties. Mater. Trans. 2019, 60, 1256–1269. [Google Scholar] [CrossRef]
- Mazilkin, A.; Straumal, B.; Kilmametov, A.; Straumal, P.; Baretzky, B. Phase transformations induced by severe plastic deformation. Mater. Trans. 2019, 60, 1489–1499. [Google Scholar] [CrossRef]
- Sauvage, X.; Chbihi, A.; Quelennec, X. Severe plastic deformation and phase transformations. J. Phys. Conf. Ser. 2010, 240, 12003. [Google Scholar] [CrossRef]
- Murray, J.L. The Fe-Ti (iron-titanium) system. Bull. Alloy Phase Diagr. 1981, 2, 320–334. [Google Scholar] [CrossRef]
- Dobromyslov, A.V.; Elkin, V.A. Martensitic transformation and metastable β-phase in binary titanium alloys with d-metals of 4–6 periods. Scr. Mater. 2001, 44, 905–910. [Google Scholar] [CrossRef]
- Levi, I.; Shechtman, D. The microstructure of rapidly solidified Ti-Fe melt-spun ribbons. Metall. Trans. A 1989, 20, 2841–2845. [Google Scholar] [CrossRef]
- Stupel, M.M.; Ron, M.; Weiss, B.Z. Phase identification in titanium-rich Ti-Fe system by Mössbauer spectroscopy. J. Appl. Phys. 1976, 47, 6–12. [Google Scholar] [CrossRef]
- Banerjee, S.; Mukhopadhyay, P. Phase Transformations; Elsevier Science: Amsterdam, The Netherlands, 2007. [Google Scholar]
- Heo, T.W.; Shih, D.S.; Chen, L.Q. Kinetic pathways of phase transformations in two-phase Ti alloys. Metall. Mater. Trans. A 2014, 45, 3438–3445. [Google Scholar] [CrossRef]
- Matyka, J.; Faudot, F.; Bigot, J. Study of iron solubility in α titanium. Scr. Metall. 1979, 13, 645–648. [Google Scholar] [CrossRef]
- Nosova, G.I.; D’yakonova, N.B.; Lyasotskii, I.V. Metastable phases of electron type in titanium alloys with 3d-metals. Met. Sci. Heat Treat. 2006, 48, 427–432. [Google Scholar] [CrossRef]
- Sikka, S.K.; Vohra, Y.K.; Chidambaram, R. Omega phase in materials. Prog. Mater. Sci. 1982, 27, 245–310. [Google Scholar] [CrossRef]
- Straumal, B.B.; Kilmametov, A.R.; Ivanisenko, Y.; Gornakova, A.S.; Mazilkin, A.A.; Kriegel, M.J.; Fabrichnaya, O.B.; Baretzky, B.; Hahn, H. Phase transformations in Ti-Fe alloys Induced by high-pressure torsion. Adv. Eng. Mater. 2015, 17, 1835–1841. [Google Scholar] [CrossRef]
- Straumal, B.B.; Kilmametov, A.R.; Ivanisenko, Y.; Mazilkin, A.A.; Valiev, R.Z.; Afonikova, N.S.; Gornakova, A.S.; Hahn, H. Diffusive and displacive phase transitions in Ti-Fe and Ti-Co alloys under high pressure torsion. J. Alloy. Compd. 2018, 735, 2281–2286. [Google Scholar] [CrossRef]
- Kilmametov, A.; Ivanisenko, Y.; Straumal, B.; Mazilkin, A.A.; Gornakova, A.S.; Kriegel, M.J.; Fabrichnaya, O.B.; Rafaja, D.; Hahn, H. Transformations of α’ martensite in Ti-Fe alloys under high pressure torsion. Scr. Mater. 2017, 136, 46–49. [Google Scholar] [CrossRef]
- Kilmametov, A.R.; Ivanisenko, Y.; Mazilkin, A.A.; Straumal, B.B.; Gornakova, A.S.; Fabrichnaya, O.B.; Kriegel, M.J.; Rafaja, D.; Hahn, H. The α → ω and β → ω phase transformations in Ti-Fe alloys under high-pressure torsion. Acta Mater. 2018, 144, 337–351. [Google Scholar] [CrossRef]
- Kriegel, M.J.; Kilmametov, A.; Rudolph, M.; Straumal, B.B.; Gornakova, A.S.; Stöcker, H.; Ivanisenko, Y.; Fabrichnaya, O.; Hahn, H.; Rafaja, D. Transformation pathway upon heating of Ti-Fe alloys deformed by high-pressure torsion. Adv. Eng. Mater. 2018, 20, 1700933. [Google Scholar] [CrossRef]
- Chong, Y.; Deng, G.; Shibata, A.; Tsuji, N. Microstructure Evolution and Phase Transformation of Ti-1.0 wt%Fe Alloy with an Equiaxed α + β Initial Microstructure during High-Pressure Torsion and Subsequent Annealing. Adv. Eng. Mater. 2019, 21. [Google Scholar] [CrossRef]
- Kriegel, M.J.; Kilmametov, A.; Klemm, V.; Schimpf, C.; Straumal, B.B.; Gornakova, A.S.; Ivanisenko, Y.; Fabrichnaya, O.; Hahn, H.; Rafaja, D. Thermal stability of athermal ω-Ti(Fe) produced upon quenching of β-Ti(Fe). Adv. Eng. Mater. 2019, 21, 1800158. [Google Scholar] [CrossRef]
- Rietveld, H.M. Line profiles of neutron powder-diffraction peaks for structure refinement. Acta Crystallogr. 1967, 22, 151–152. [Google Scholar] [CrossRef]
- Rietveld, H.M. A profile refinement method for nuclear and magnetic structures. J. Appl. Crystallogr. 1969, 2, 65–71. [Google Scholar] [CrossRef]
- Coelho, A.A. TOPAS, Version 5; Bruker AXS GmbH: Karlsruhe, Germany, 2014. [Google Scholar]
- Gornakova, A.S.; Prokofiev, S.I.; Kolesnikova, K.I.; Straumal, B.B. Formation regularities of grain-boundary interlayers of the α-Ti phase in binary titanium alloys. Russ. J. Non-Ferr. Met. 2016, 57, 229–235. [Google Scholar] [CrossRef]
- Gornakova, A.S.; Prokofiev, S.I.; Straumal, B.B.; Kolesnikova, K.I. Growth of (αTi) grain-boundary layers in Ti-Co alloys. Russ. J. Non-Ferr. Met. 2016, 57, 703–709. [Google Scholar] [CrossRef]
- Gornakova, A.S.; Straumal, B.B.; Nekrasov, A.N.; Kilmametov, A.; Afonikova, N.S. Grain Boundary Wetting by a Second Solid Phase in Ti-Fe Alloys. J. Mater. Eng. Perform. 2018, 27, 4989–4992. [Google Scholar] [CrossRef]
- Gornakova, A.S.; Straumal, B.B.; Prokofiev, S.I. Coarsening of (αTi) + (βTi) Microstructure in the Ti-Al-V Alloy at Constant Temperature. Adv. Eng. Mater. 2018, 20, 1800510. [Google Scholar] [CrossRef]
- Gornakova, A.S.; Straumal, A.B.; Khodos, I.I.; Gnesin, I.B.; Mazilkin, A.A.; Afonikova, N.S.; Straumal, B.B. Effect of composition, annealing temperature, and high pressure torsion on structure and hardness of Ti–V and Ti-V-Al alloys. J. Appl. Phys. 2018, 125, 82522. [Google Scholar] [CrossRef]
- March, A. Mathematische Theorie der Regelung nach der Korngestalt bei affiner Deformation. Z. Krist. 1932, 81, 285–297. [Google Scholar]
- Thompson, P.; Reilly, J.J.; Hastings, J.M. The application of the Rietveld method to a highly strained material with microtwins TiFeD1.9. J. Appl. Crystallogr. 1989, 22, 256–260. [Google Scholar] [CrossRef]
- Kubaschewski, O. IRON—Binary Phase Diagrams; Springer: Berlin/Heidelberg, Germany, 1982; ISBN 978-3-662-08026-9. [Google Scholar]
- Bo, H.; Wang, J.; Duarte, L.; Leinenbach, C.; Liu, L.B.; Liu, H.S.; Jin, Z.P. Thermodynamic re-assessment of Fe-Ti binary system. Trans. Nonferrous Met. Soc. China 2012, 22, 2204–2211. [Google Scholar] [CrossRef]
- Jonsson, S. Assessment of the Fe-Ti system. Metall. Trans. 1998, 29, 361–370. [Google Scholar] [CrossRef]
- Hari Kumar, K.C.; Wollaiits, P.; Delaey, L. Thermodynamic reassessment and calculation of Fe-Ti phase diagram. Calphad 1994, 18, 223–234. [Google Scholar] [CrossRef]
- Schlieter, A.; Kühn, U.; Eckert, J.; Löser, W.; Gemming, T.; Friák, M.; Neugebauer, J. Anisotropic mechanical behavior of ultrafine eutectic TiFe cast under non-equilibrium conditions. Intermetallics 2011, 19, 327–335. [Google Scholar] [CrossRef]
- Kao, Y.L.; Tu, G.C.; Huang, C.A.; Liu, T.T. A study on the hardness variation of α-and β-pure titanium with different grain sizes. Mater. Sci. Eng. A 2005, 398, 93–98. [Google Scholar] [CrossRef]
- Ungár, T.; Schafler, E.; Hanák, P.; Bernstorff, S.; Zehetbauer, M. Vacancy production during plastic deformation in copper determined by in situ X-ray diffraction. Mater. Sci. Eng. A 2007, 462, 398–401. [Google Scholar] [CrossRef]
- Devaraj, A.; Nag, S.; Srinivasan, R.; Williams, R.E.A.; Banerjee, S.; Banerjee, R.; Fraser, H.L. Experimental evidence of concurrent compositional and structural instabilities leading to ω precipitation in titanium-molybdenum alloys. Acta Mater. 2012, 60, 596–609. [Google Scholar] [CrossRef]
- Hickman, B.S. The formation of omega phase in titanium and zirconium alloys: A review. J. Mater. Sci. 1969, 4, 554–563. [Google Scholar] [CrossRef]
- Lukas, H.; Fries, S.G.; Sundman, B. Computational Thermodynamics: The Calphad Method; Cambridge University Press: Cambridge, UK, 2007; ISBN 9780521868112. [Google Scholar]
- Kriegel, M.J.; Fabrichnaya, O. Pressure dependent modelling of the phase stabilities in the binary Ti-Fe system. Calphad 2020. in preparation. [Google Scholar]
- Ivanisenko, Y.; Kilmametov, A.; Rösner, H.; Valiev, R.Z. Evidence of α → ω phase transition in titanium after high pressure torsion. Int. J. Mater. Res. 2008, 99, 36–41. [Google Scholar] [CrossRef]
- Polmear, I.; StJohn, D.; Nie, J.-F.; Qian, M. (Eds.) Light Alloys, 5th ed.; Butterworth-Heinemann: Boston, MA, USA, 2017; ISBN 978-0-08-099431-4. [Google Scholar]


© 2020 by the authors. Licensee MDPI, Basel, Switzerland. This article is an open access article distributed under the terms and conditions of the Creative Commons Attribution (CC BY) license (http://creativecommons.org/licenses/by/4.0/).