Article

Preparation and Mechanical Properties of ZK61-Y Magnesium Alloy Wheel Hub via Liquid Forging—Isothermal Forging Process

1
School of Materials Science and Engineering, Harbin Institute of Technology, Harbin 150001, China
2
Department of Civil Engineering, Harbin Institute of Technology, Weihai 264209, China
3
School of Materials Science and Engineering, Harbin Institute of Technology, Weihai 264209, China
4
Beijing North Vehicle Group Co. Ltd., Beijing 100072, China
*
Authors to whom correspondence should be addressed.
Metals 2020, 10(3), 385; https://doi.org/10.3390/met10030385
Submission received: 26 February 2020 / Revised: 14 March 2020 / Accepted: 15 March 2020 / Published: 18 March 2020

Abstract

:
A ZK61-Y magnesium (Mg) alloy wheel hub was prepared via liquid forging—isothermal forging process. The effects of Y-element contents on the microstructure and mechanical properties of liquid forging blanks were investigated. The formation order of the second phase was I-phase (Mg3Zn6Y) → W-phase (Mg3Zn3Y2) → Z-phase (Mg12ZnY) with the increase of the Y-element content. Meanwhile, the I-phase and Z-phase formed in the liquid forging process were beneficial to the grain refinement. The numerical simulation of the isothermal forging process was carried out to analyze the effects of forming temperature on the temperature and stress field in the forming parts using the software Deform-3D. Isothermal forging experiments and post heat treatments were conducted. The influence of isothermal forging temperature, heat treatment temperature and preservation time on the microstructure and mechanical properties of the forming parts were also studied. The dynamic recrystallization (DRX), second-phase hardening, and work hardening account for the improvement of properties after the isothermal forging process. The forming part forged at 380 °C displayed the outstanding properties. The elongation, yield strength, and ultimate tensile strength were 18.5%, 150 MPa and 315 MPa, respectively. The samples displayed an increased elongation and decreased strength after heat treatments. The 520 °C—1 h sample possessed the best mechanical properties, the elongation was 25.5%, the yield stress was 125 MPa and the ultimate tensile strength was 282 MPa. This can be ascribed to the recrystallization and the elimination of working hardening. Meanwhile, the second phase transformation (I-phase → W-phase → Mg2Y + MgZn2), dissolution, and decomposition can be observed, as well.

1. Introduction

As the crisis of resource and environment become more and more intensive, the requirement for energy conservation and emission reduction in transportation vehicles is growing insistently [1,2]. Mg, as a promising material, has attracted more attention due to its high specific strength, low density, good recyclability, and low cost [3,4,5]. Recently, the Mg alloys containing rare-earth elements are proposed, such as the Mg-Zn-Zr-Y alloys possessing higher strength, better plasticity, and corrosion resistance [6,7,8,9,10]. Kishida et al. [11] prepared the Mg–Zn–Y ternary alloys containing highly-ordered Mg–Zn–Y LPSO phases with Zn, Y-rich compositions prepared and investigated the crystal structures of the 18R-, 14H-, and 10H-type Mg–Zn–Y LPSO/OD phases with the perfect in-plane order of the Zn6Y8 atomic clusters identical to that of the Mg–Al–Gd LPSO/OD phases. Takagi et al. [12] performed micro-double-shear tests in the temperature range of 298 K–673 K to quantify the temperature dependence of prismatic slip in a long-period stacking ordered Mg85Zn6Y9. They found that the prismatic slips were promoted through cross-slip onto the basal plane over the transition temperature. Mahmudi et al. [13] examined the effects of adding 2 wt % yttrium (Y) element on the thermal stability, microstructural evolution, and mechanical properties of an Mg–4Zn alloy. Addition of yttrium led to simultaneous refinement of the microstructure and improvement in both shear strength and microstructural stability of Mg–4Zn at high temperature. The addition of yttrium (Y) facilitates the formation of the I-phase (Mg3Zn6Y), W-phase (Mg3Zn3Y2), and Z-phase (Mg12ZnY) [14]. The I-phase with octahedron quasicrystal structure forms at the grain boundary, which is detrimental to the alloy properties [15,16]. However, the I-phase with quasicrystal structure facilitates the alloy mechanical properties after the hot deformation process [17]. The Z-phase with long-period stacking ordered structure (LPSO) can inhibit the dislocation slip and greatly strengthen the alloy [18,19].
At present, the application of Mg alloy mainly concentrates on the traditional casting and plastic forming processes [20]. However, there are some defects in the casting process, such as cold shut, shrinkage cavity, eutectic phase and coarse grains, which will deteriorate alloy mechanical properties. Meanwhile, the poor plastic deformation of the Mg alloy, because of its close-packed hexagonal structure, limits its applications in plastic forming process [21,22,23,24]. It is a critical challenge to explore a suitable forging process for engineering applications of Mg alloys. Minárik et al. [25] researched the ECAP process of WE43 alloy without LPSO phase, and weak texture and exceptional grain refinement were obtained due to the massive particle induced dynamic recrystallization. In Verma’s work [26], large true strain (up to ~4.7) through hybrid severe plastic deformation (HSPD) technique was imparted to Mg-4Zn-4Gd alloy, to study the effect of hybrid severe plastic deformation with large true strain (~4.7) on crystallographic evolution such as CDRX and grain refinement mechanism of ZV44 Mg alloy, especially the behaviour of nonbasal planes are explored. Liquid forging process, also known as squeeze casting, based on casting and forging combines the advantages of two kinds of processes [27,28,29]. Compared with casting, a high forming pressure is fully applied to the liquid metal. The gas in the liquid metal is eliminated under the high pressure, which will effectively avoid the shrinkage cavity and porosity. Compared with traditional forging, this forming process can significantly improve production efficiency, enhance product performance, and reduce material loss [30,31,32,33].
In this paper, a ZK61-Y magnesium (Mg) alloy wheel hub was prepared via liquid forging-isothermal forging process. The blanks were fabricated via liquid forging process, and the effects of Y element contents on the microstructure and mechanical properties of the blanks were investigated. The numerical simulation of the isothermal forging process was carried out using the software Deform-3D. Furthermore, the isothermal forging experiments were conducted to study the effects of the isothermal forging temperature on the microstructure and mechanical properties of forming parts. The post heat treatments were conducted to investigate the microstructure evolution during heat treatments.

2. Material and Experiment Procedure

2.1. Materials

The experimental material selected in this paper was ZK61-Y Mg alloy, prepared using ZK61 alloy (provided by Northeast Light Alloy Co.,Ltd., Harbin, China) and Mg-30%Y master alloy (provided by Yueyang Aerospace New Materials Co., Ltd., Yueyang, China). The composition of the ZK61 alloy and Mg-30%Y master alloy measured by X-ray fluorescence spectrometer (AXIOS-PW4400, PANalytical B.V., Almelo, Netherlands) are illustrated in Table 1 and Table 2.

2.2. Liquid Forging Procedure

The blanks were prepared by liquid forging procedure. The dimension of the blank was Φ 150 mm × 160 mm with an inner diameter of 56 mm. The ZK61 alloy was melted in a well resistance furnace at 700 °C under 0.25% SF6-CO2 protection gas. The Mg-30%Y master alloy was added after the ZK61 alloy melted completely, and stirred with the speed of 60 rpm until the master alloy melted completely. Before the liquid forging procedure, the liquid alloy was held for 15 min at 700 °C, and the mold was preheated to 220 °C. In order to demold conveniently, the graphite was sprayed on the mold surface. The schematic and image of the liquid forging mold are shown in Figure 1. During the forming process, the liquid alloy was poured into the mold, and then the punch moved down to press the liquid alloy with a pressure of 130 MPa at a dwell time of 40 s. The experimental parameters for blanks with different Y-element contents are shown in Table 3.

2.3. Isothermal Forging Procedure

The blanks used in the isothermal forging procedure were Mg-1YL alloy and the dimension of the forming part after isothermal forging procedure was Φ 181 mm × 96 mm with an inner diameter of 84 mm. The numerical simulation of the isothermal forging process was carried out using the software Deform-3D (version V6, Scientific Forming Technologies Corporation, Columbus, OH, USA). The adaptive meshing method was adopted to mesh the geometry model. After meshing, the total number of elements was 251584. The mesh size was set as 1.5 mm. The blank temperatures were set as 320 °C, 340 °C, 360 °C, and 380 °C, the movement speed of the upper mold was 10 mm/s, the heat transfer coefficient between workpiece and mold was 11 N/(s·mm·°C). Coulomb friction was used for simulating the contact and the friction coefficient was set as 0.30. The forming temperatures were 320 °C, 340 °C, 360 °C, and 380 °C, the forging velocity was 10 mm/s, the forging pressure was 300 MPa. Before the isothermal forging procedure, the blanks and molds were preheated to the appropriate temperatures, and then the graphite was sprayed on the mold surface, which would facilitate demolding. The schematic and images of the isothermal forging molds are shown in Figure 2.

2.4. Post Heat Treatment

The post solution treatments were conducted on the forming parts after liquid forging—isothermal forging process. The solution treatment parameters are shown in Table 4.

2.5. Properties Test

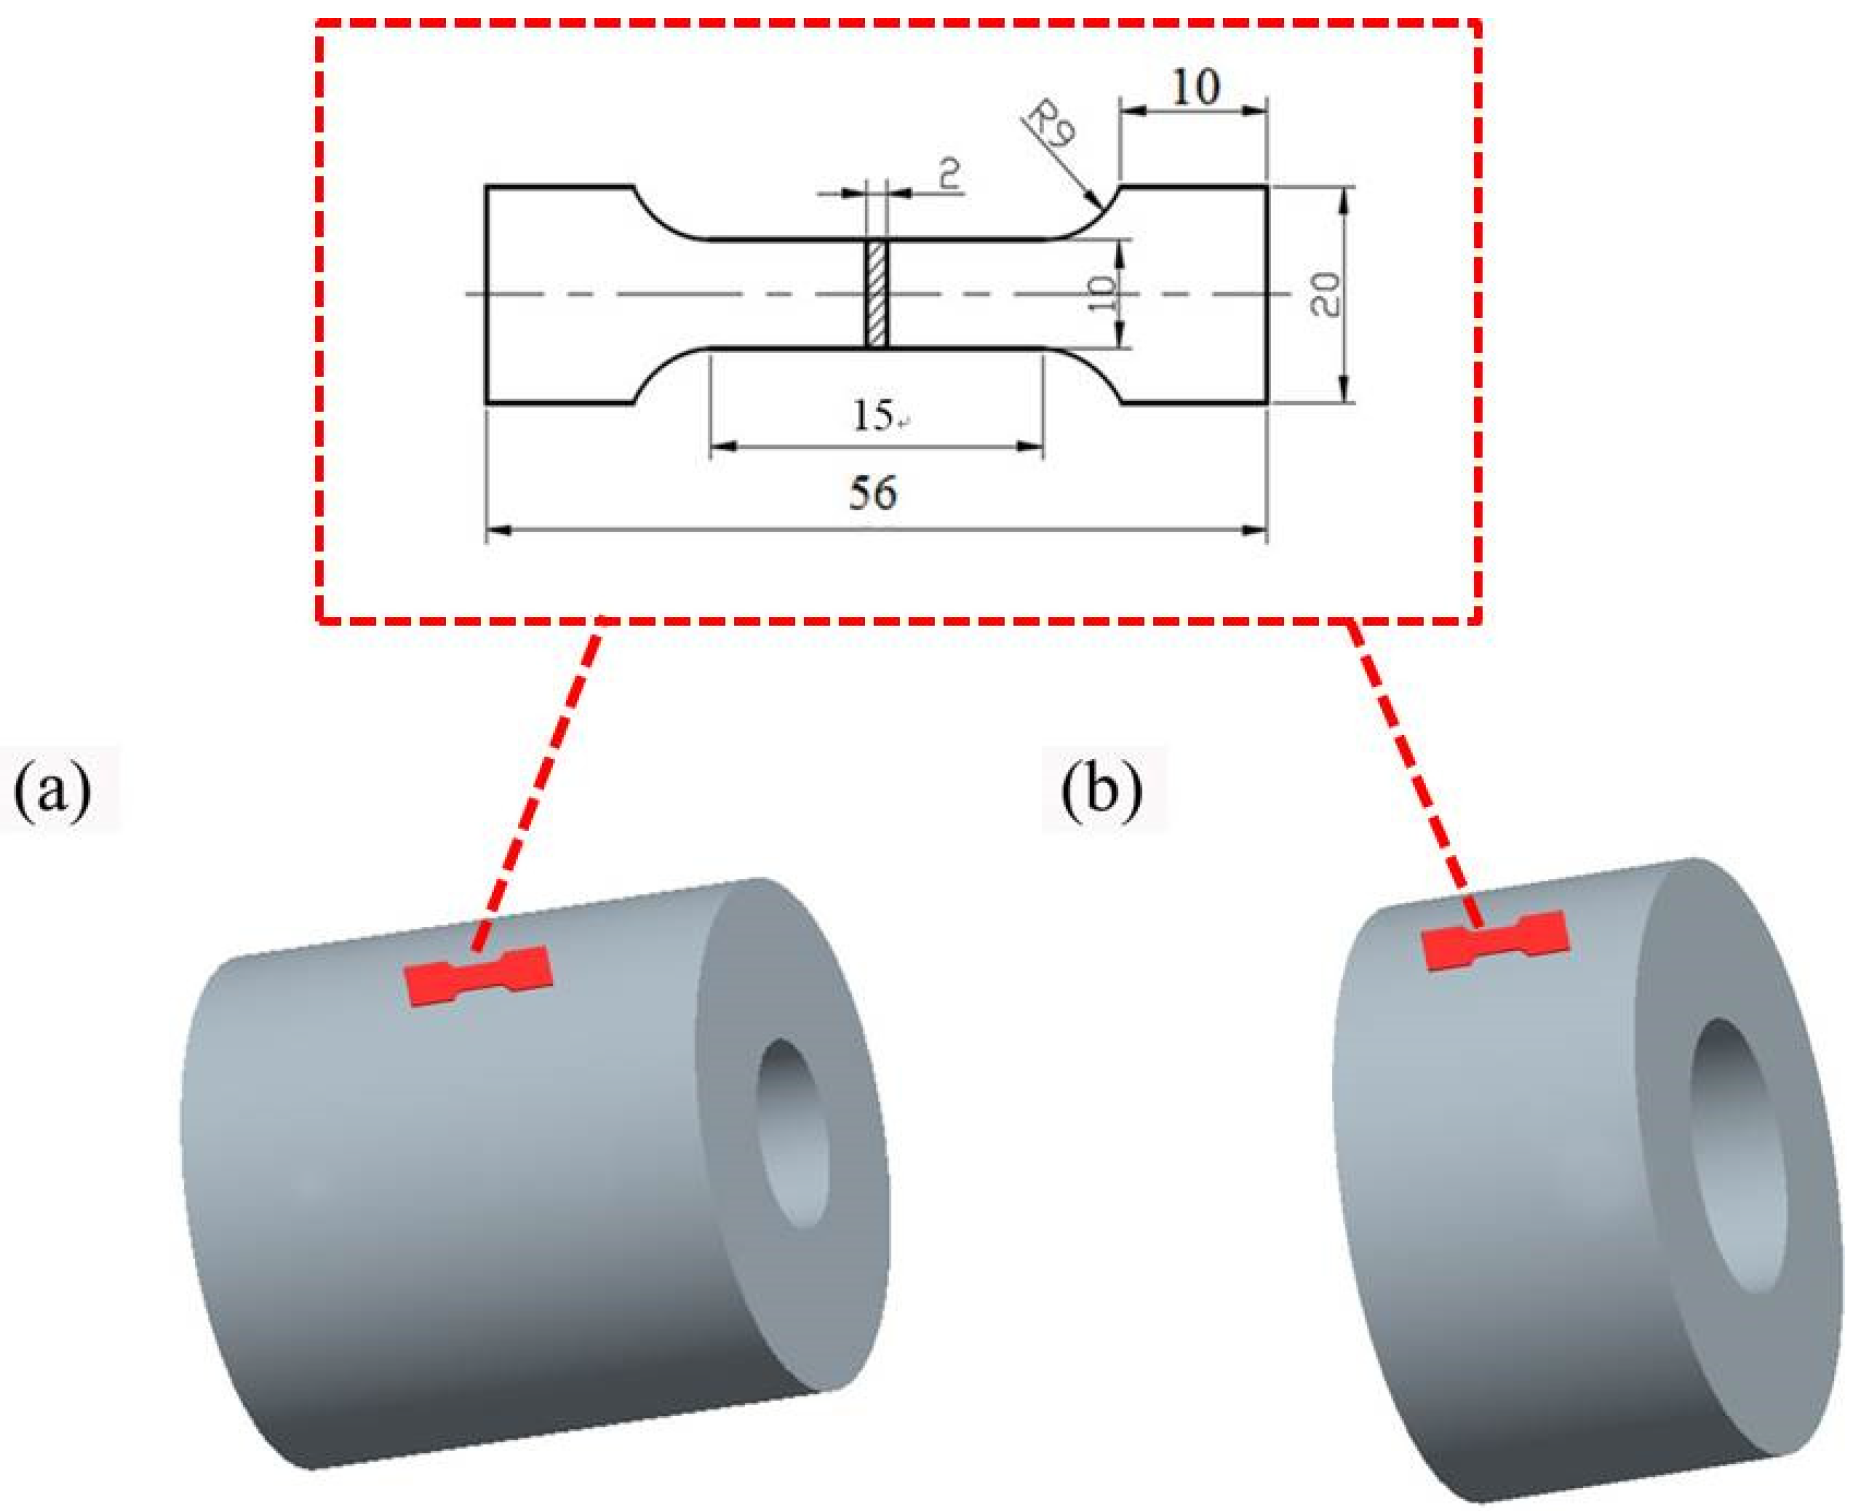
The microstructure observation was conducted by the optical microscope (OM, Olympus-PEM-3, Olympus, Tokyo, Japan), scanning electron microscope (SEM, Merlin Compact, ZEISS, Oberkochen, Germany) with Oxford X-ray energy dispersive spectrometer (EDS), and a transmission electron microscopy (TEM, Talos F200, FEI, Hillsboro, OR, USA). The specimens for OM and SEM observation were electron-etched with the solution of 1 g picric acid, 25 mL alcohol, 5 mL glacial acetic acid. The thin samples for TEM analysis were grinded to 50 μm and then were prepared by the ion polishing system. The phase analysis was determined using a D/MAX-RB X-ray diffraction (XRD, Rigaku Corporation, Tokyo, Japan) system with Cu Kα radiation. The tube voltage and current were 40 kV and 40 mA, respectively. The tensile sample dimension and sampling positions were shown in Figure 3. The uniaxial tensile tests at room temperature were conducted using the test machine (SHIMADZU AGX-plus, SHIMADZU, Kyoto, Japan) at the tensile rate of 0.5 mm/min. Three specimens taken from one part were tested to get an average value.

3. Results and Discussion

3.1. Microstructure and Properties of the Liquid Forging Blanks with Different Y-Element Contents

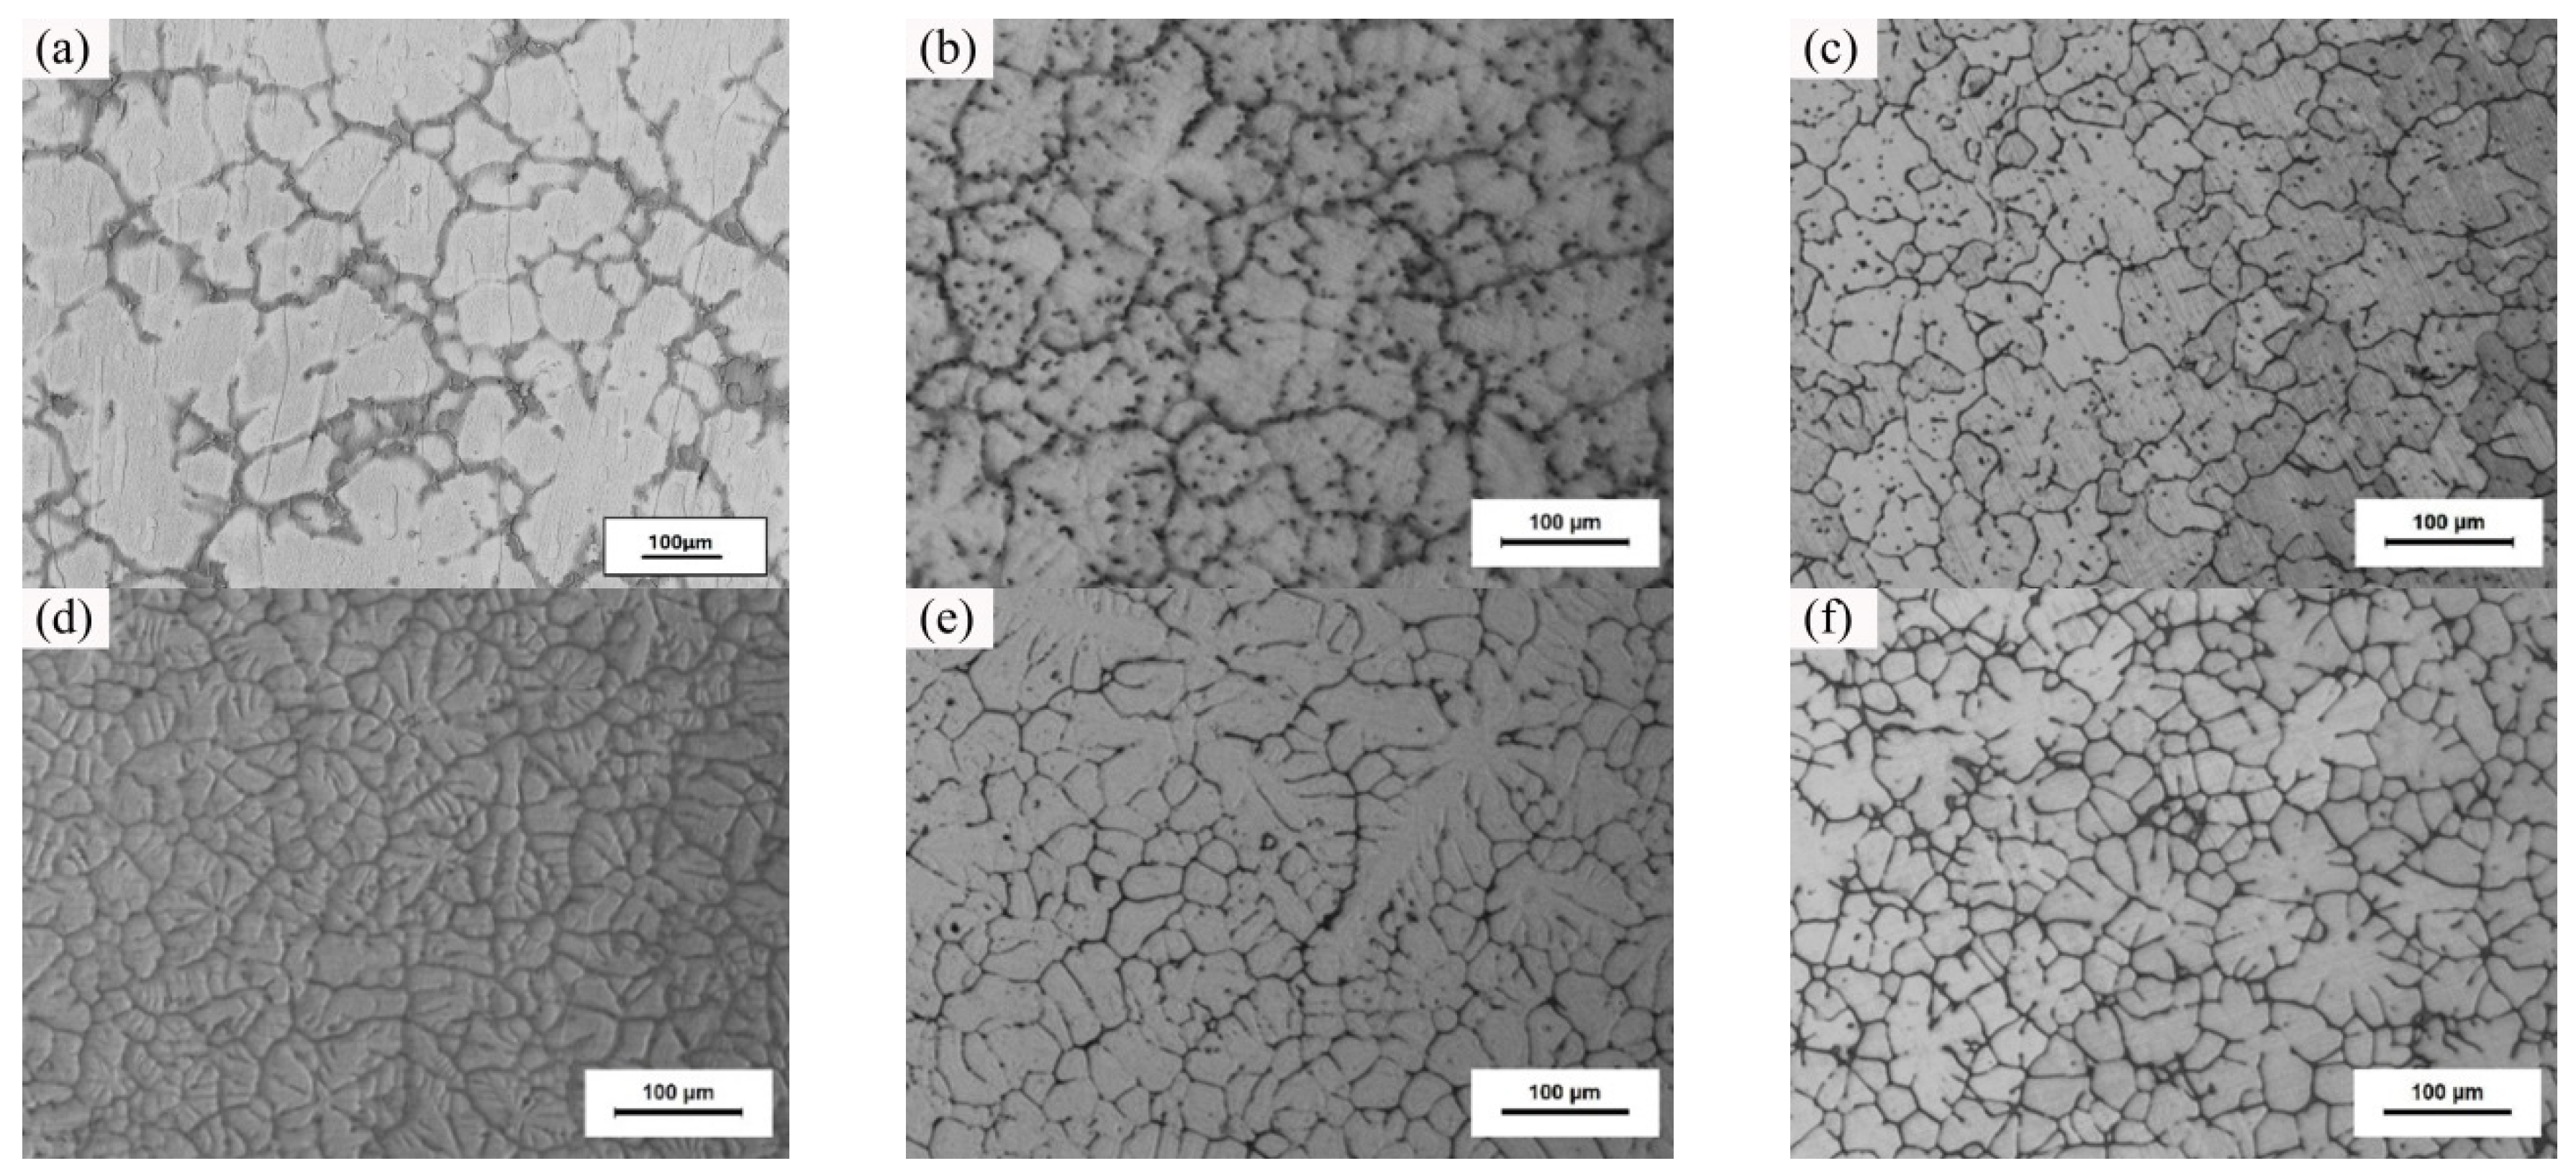
Figure 4 shows the optical microstructure of the gravity casting part and the liquid forging parts with different Y-element contents. Compared with Mg-0YG (Figure 4a), the Mg-0YL alloy microstructure with refined grains is more dense, and the dendritic crystal transforms into the equiaxed crystal after the liquid forging process, as shown in Figure 4b. The undercooling of liquid alloy increases due to the application of pressure, which increases the nucleation rate of alloy and prevents the dendrites formation. In addition, the solidification of liquid alloy under the pressure reduces some defects such as shrinkage cavity and porosity. The coarse grains can be observed in Mg-0YL alloy without Y-element addition. There are few second phases that generate at the slender grain boundary, as shown in Figure 4b. The grains are refined and some dendrites are detected with the addition of Y-element, as shown in Figure 4c. Figure 4d,e demonstrates that the grain sizes of the Mg-2YL and Mg-3YL increase as the content of Y-element increase, and some small grains can be observed. This can be attributed to the fact that the dendrites are broken up during the liquid forging process. The grain sizes of Mg-4YL decreases obviously, and more second phases precipitating at the grain boundary can be observed, as illustrated in Figure 4f.
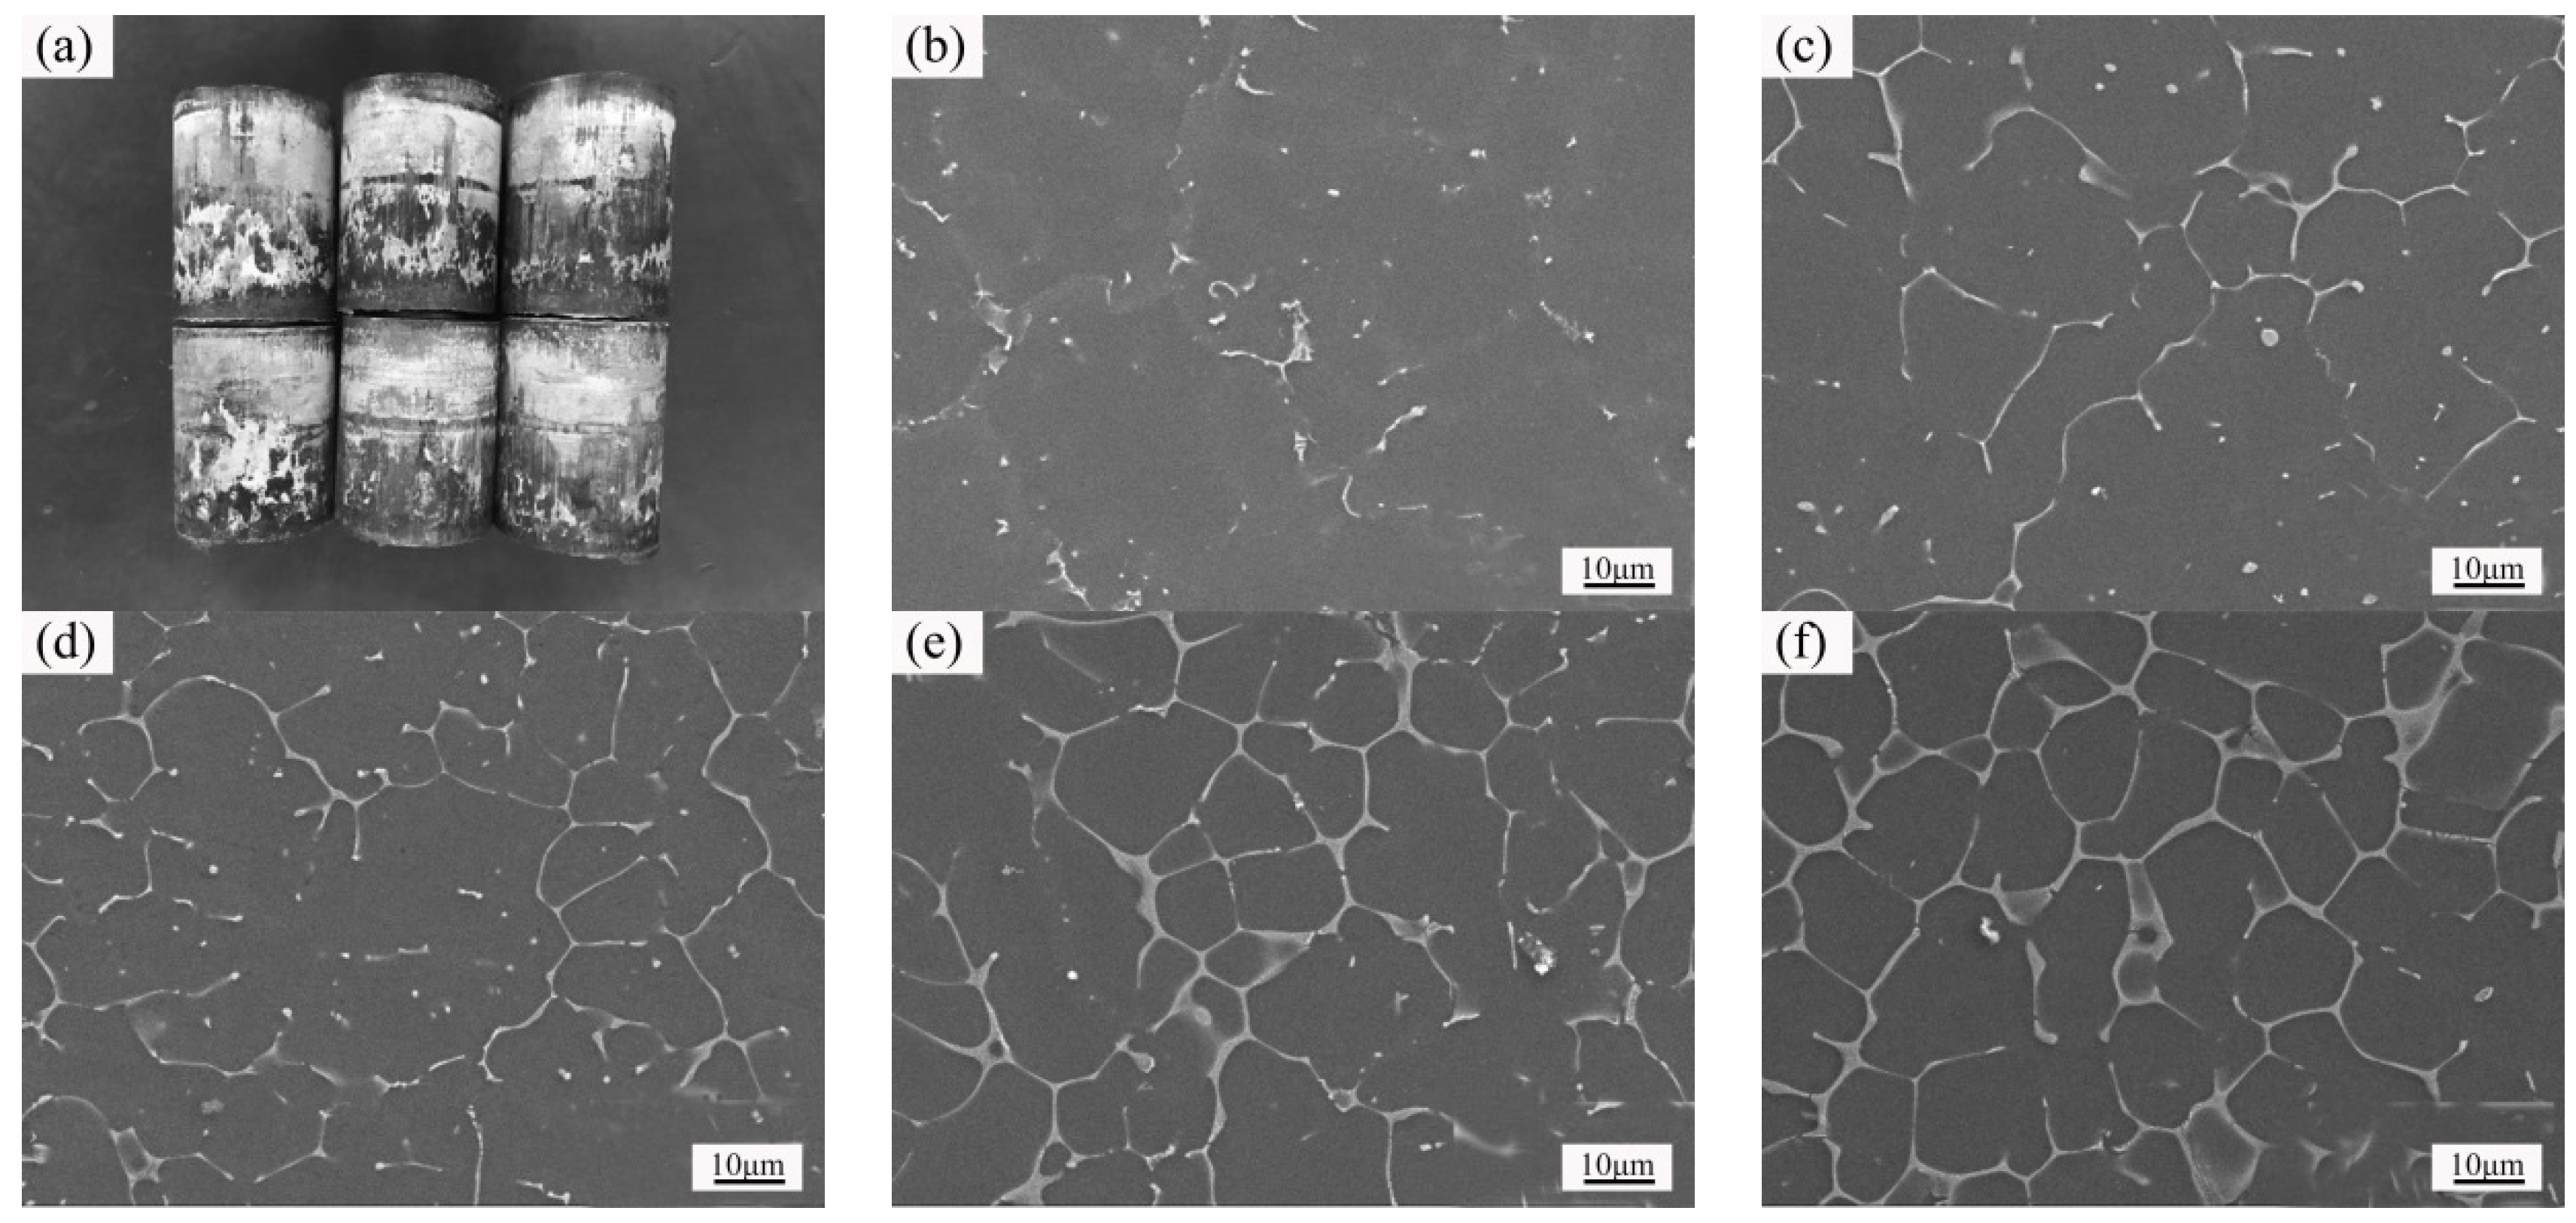
Figure 5a shows the image of the liquid forging parts, which have an outward appearance. Figure 5b–f shows the SEM microstructure of the liquid forging parts with different Y-element contents, which demonstrate that the grain sizes decrease and the second phases increase as the addition of Y-element increases. Figure 5b shows the microstructure of ZK61 alloy without Y-element, in which the coarse grains can be observed. This can be ascribed to that there are fewer second phases containing Mg and Zn that generate at the grain boundary. However, the grain boundary becomes coarse and the second phases increase as the Y-element increases, as shown in Figure 5c–f. Meanwhile, the constitutional undercooling increases as the Y-element increases due to the enrichment of Zn and Y at the grain boundary during the solidification process, which will facilitate dendrites growth.
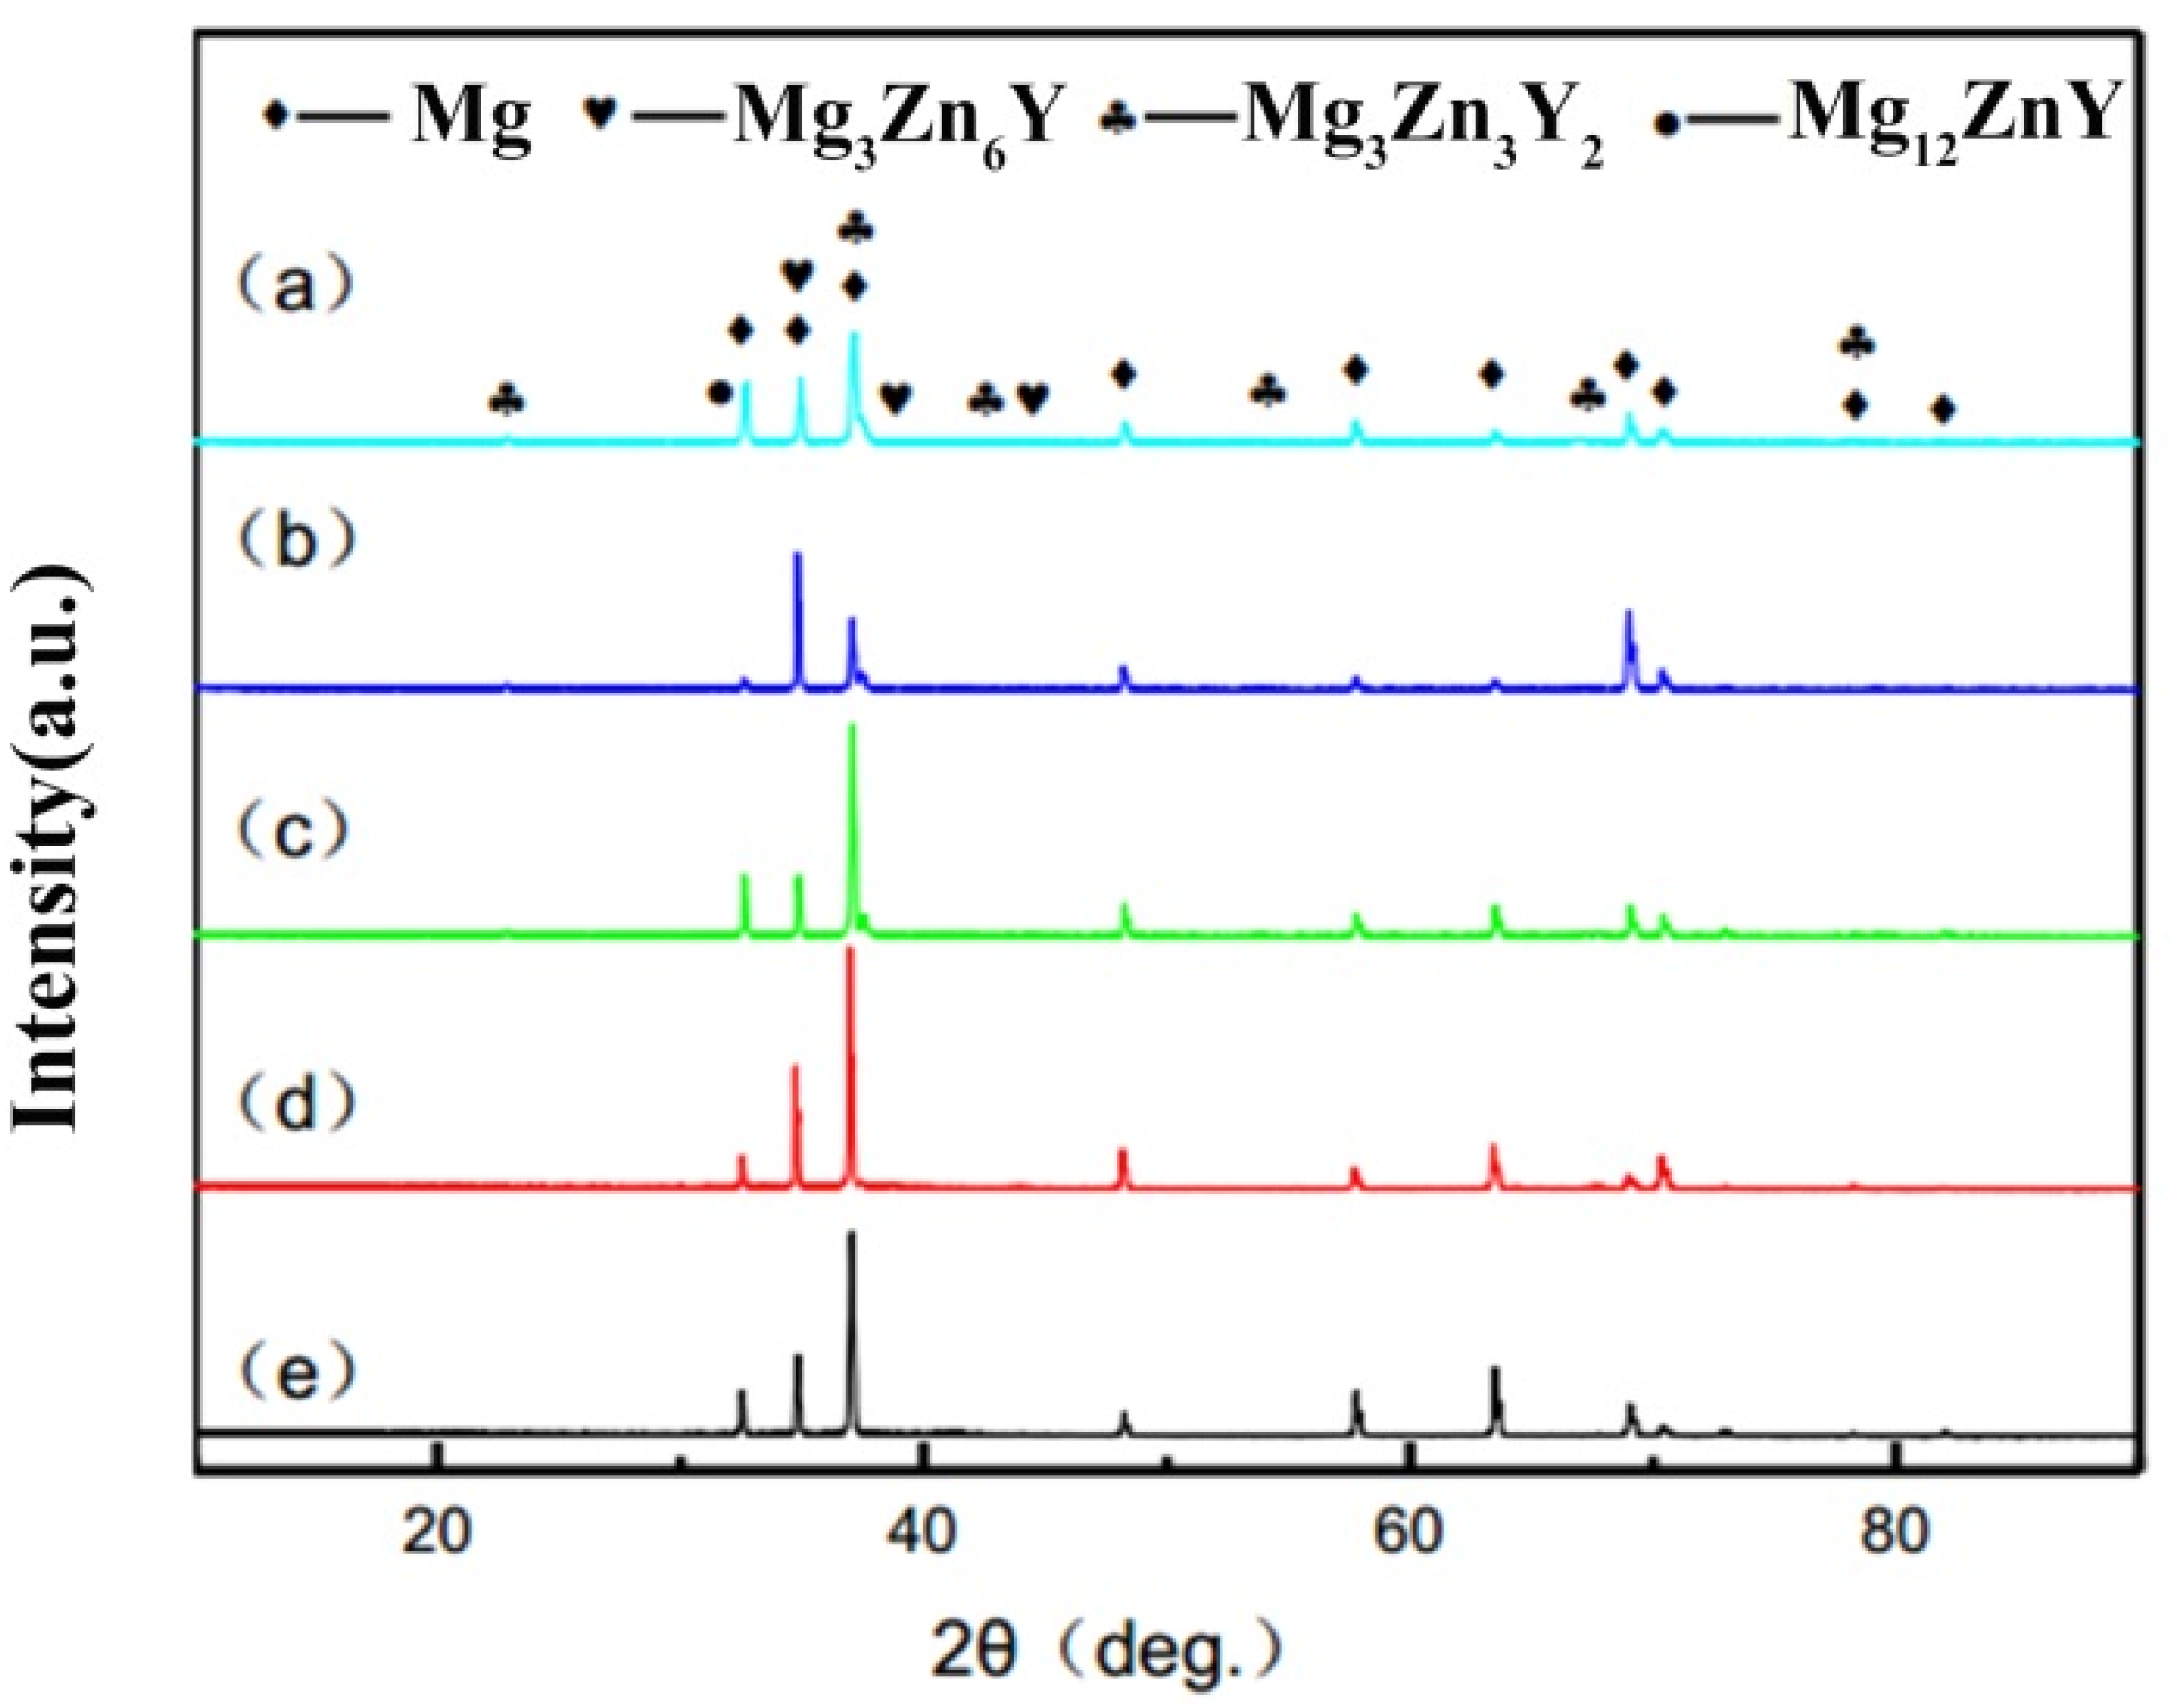
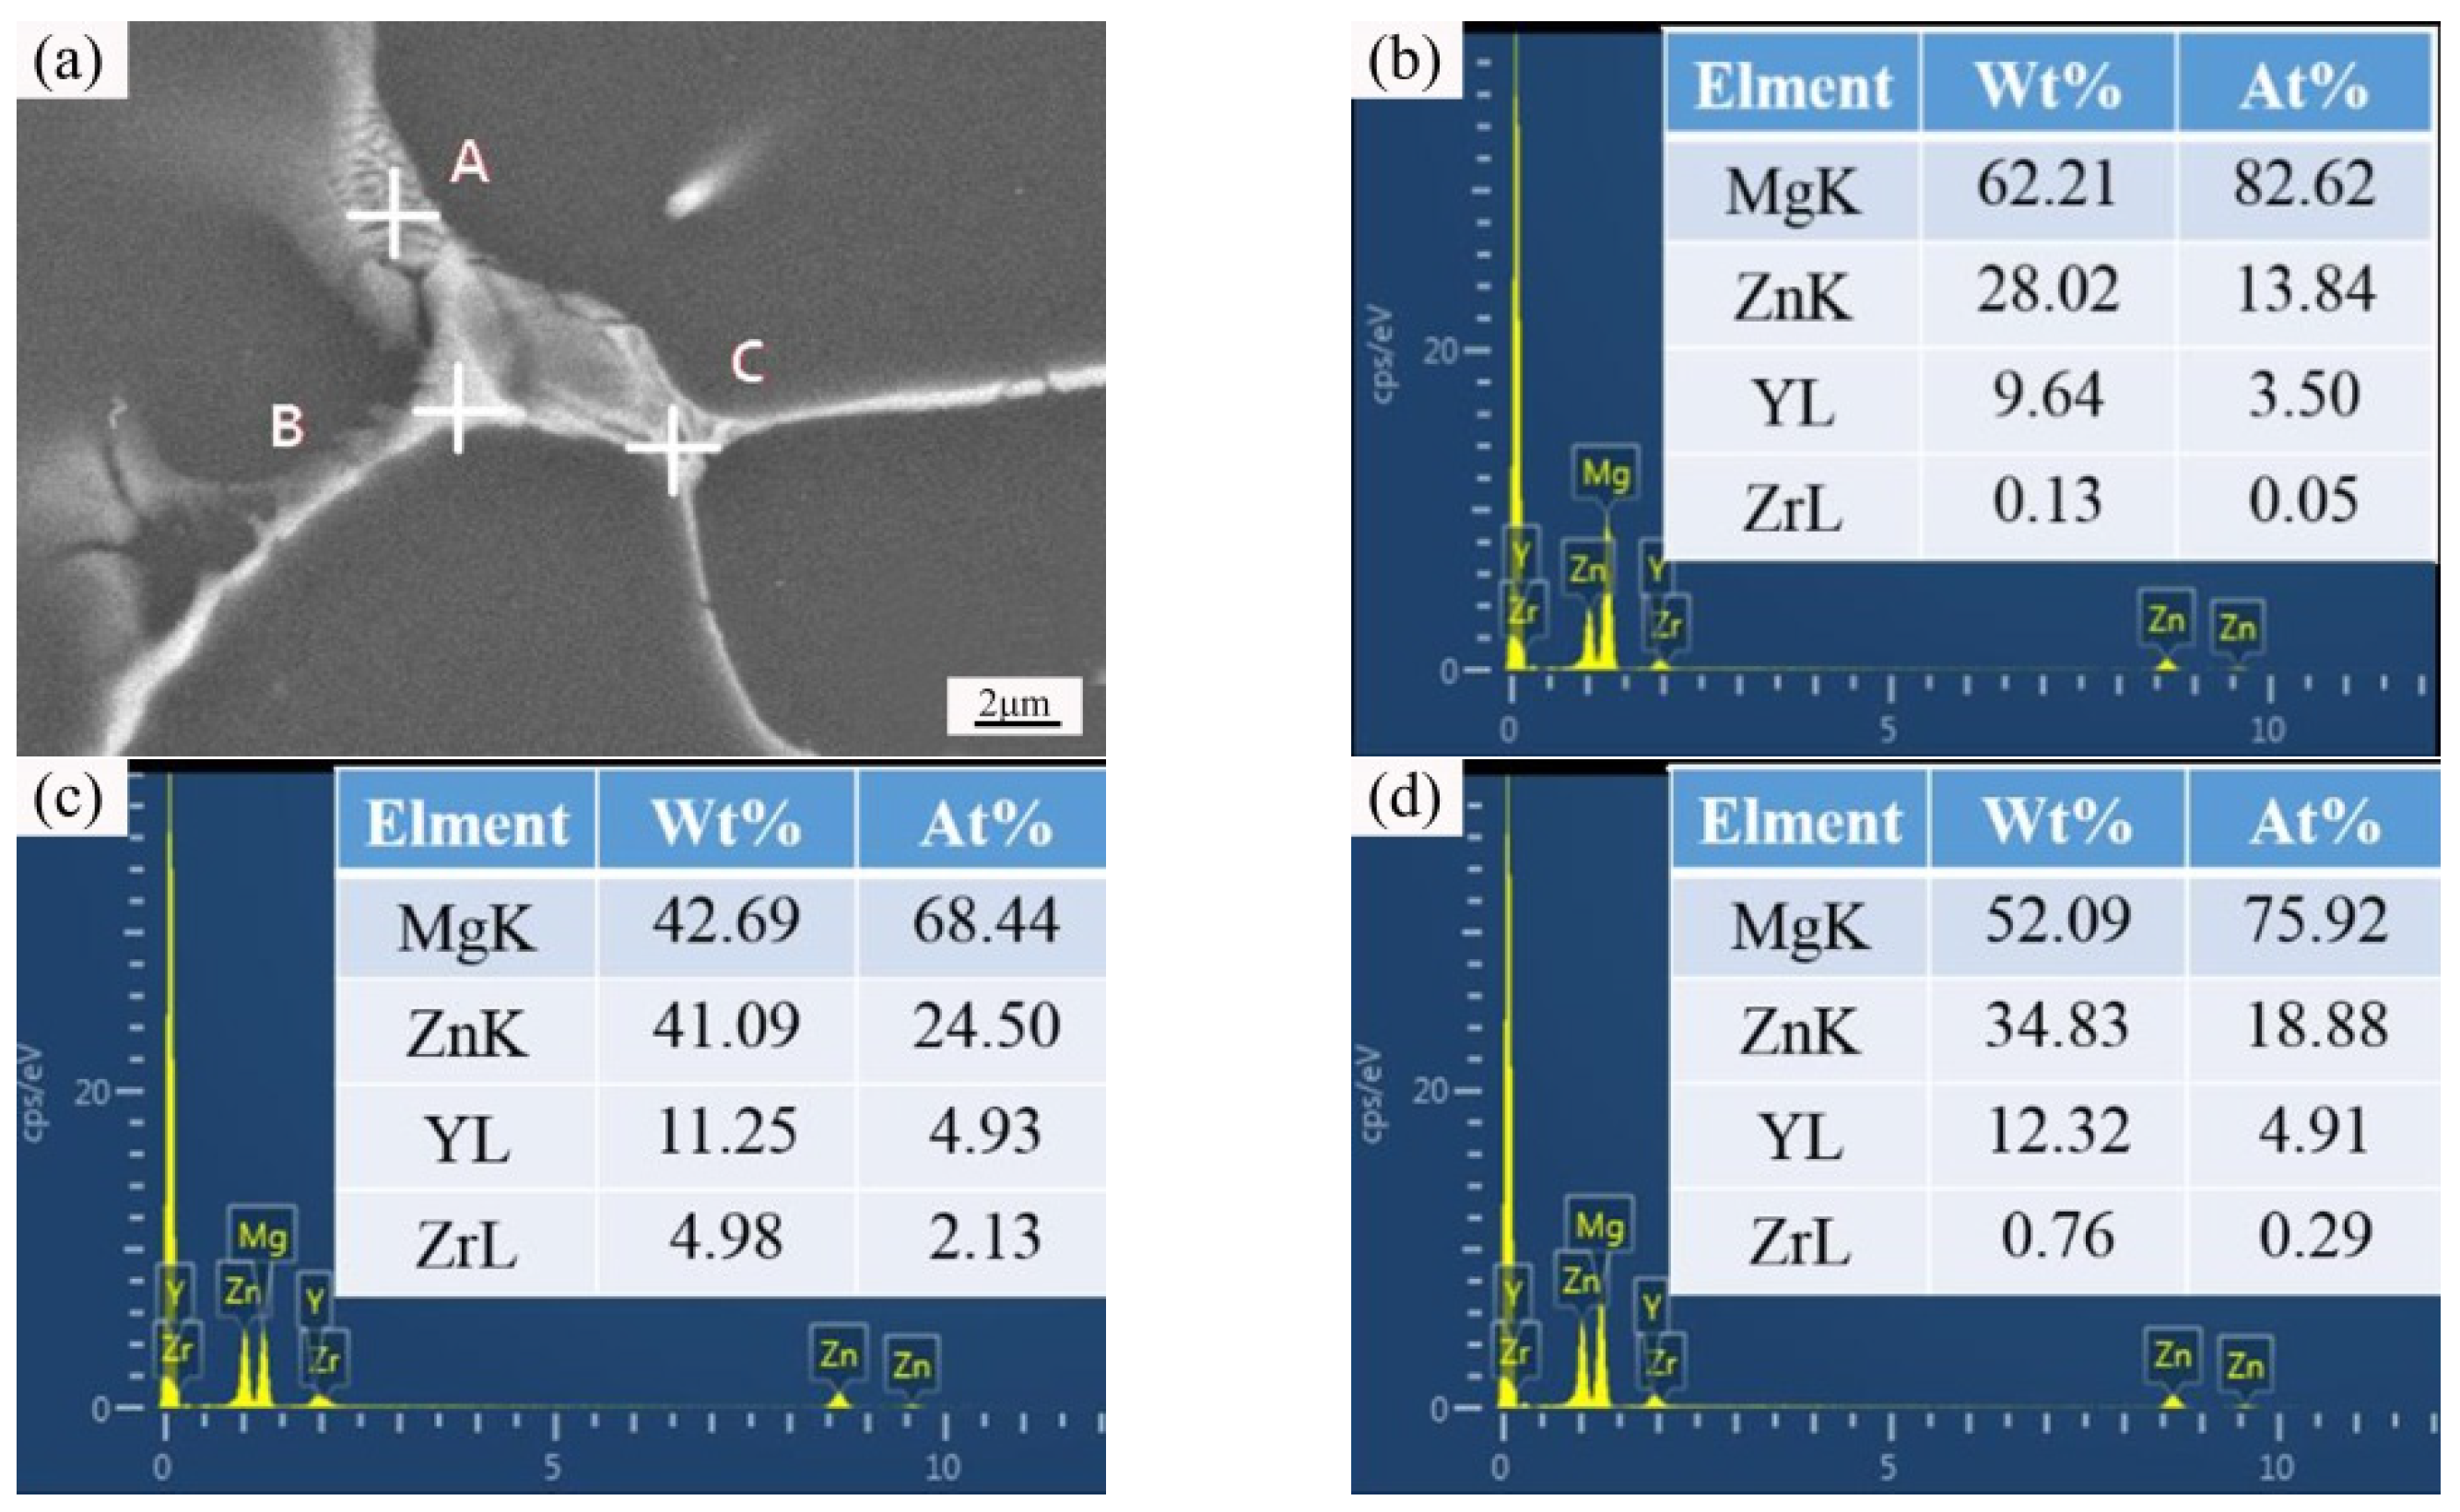
The XRD patterns of the liquid forging parts with different Y-element contents are shown in Figure 6. The I-phase (Mg3Zn6Y), W-phase (Mg3Zn3Y2), and Z-phase (Mg12ZnY) can be detected in Mg-1YL, Mg-2YL, Mg-3YL, and Mg-4YL, but there are delicate differences in the diffraction peaks intensity of these three phases in different samples. Mg-1YL are mainly composed of I-phase and less W-phase. The diffraction peak intensity of I-phase is weakened and that of W-phase is strengthened as the Y-element increases. Additionally, there are minor Z-phase that can be detected in Mg-4YL. Furthermore, in theory, there should be the Mg-Zn phase generating in the samples due to the high content of Zn after the forming of Mg-Zn-Y ternary phase. while it is difficult to be detected by the XRD test. This can be ascribed to the low content and micro-dimension of Mg-Zn phase. Figure 7 shows the SEM microstructure and EDS analysis of Mg-1YL. The typical stripy eutectic structure containing I-phase and α-Mg can be observed in Figure 7a. Figure 7b,c demonstrates the EDS analysis of the spots A, B, and C in Figure 7a. Table 5 indicates that the Zn and Y atom ratios of the spots A, B, and C are 3.95, 4.96, and 3.84, respectively, which are comparable to that in I-phase. The results indicate that the second phases in Mg-1YL are mainly I-phase.
The tensile properties of the liquid forging parts with different Y-element contents are shown in Table 6. The elongation values of the samples firstly increase and then decrease as the Y-element increases, and the value reaches the peak when the Y-elements content is 1 wt %. The highest yield stress is 125 MPa when the Y-elements content is 4 wt %, however, the elongation declines to 11%. The sample with a 4 wt % Y-element displays the highest ultimate tensile strength of 231 MPa. When the Y-element content is 1 wt %, the second phase is mainly I-phase. The I-phase is beneficial to the grain refinement and the pinning effect on the dislocation and grain boundary, which will facilitate the samples mechanical properties. The second phases are mainly W-phase with cubic crystal system as the Y-element content increases, which has no positive effects on the strength of alloy. Additionally, the mechanical properties of the alloy reduce obviously when the content of W-phase in the alloy increases.
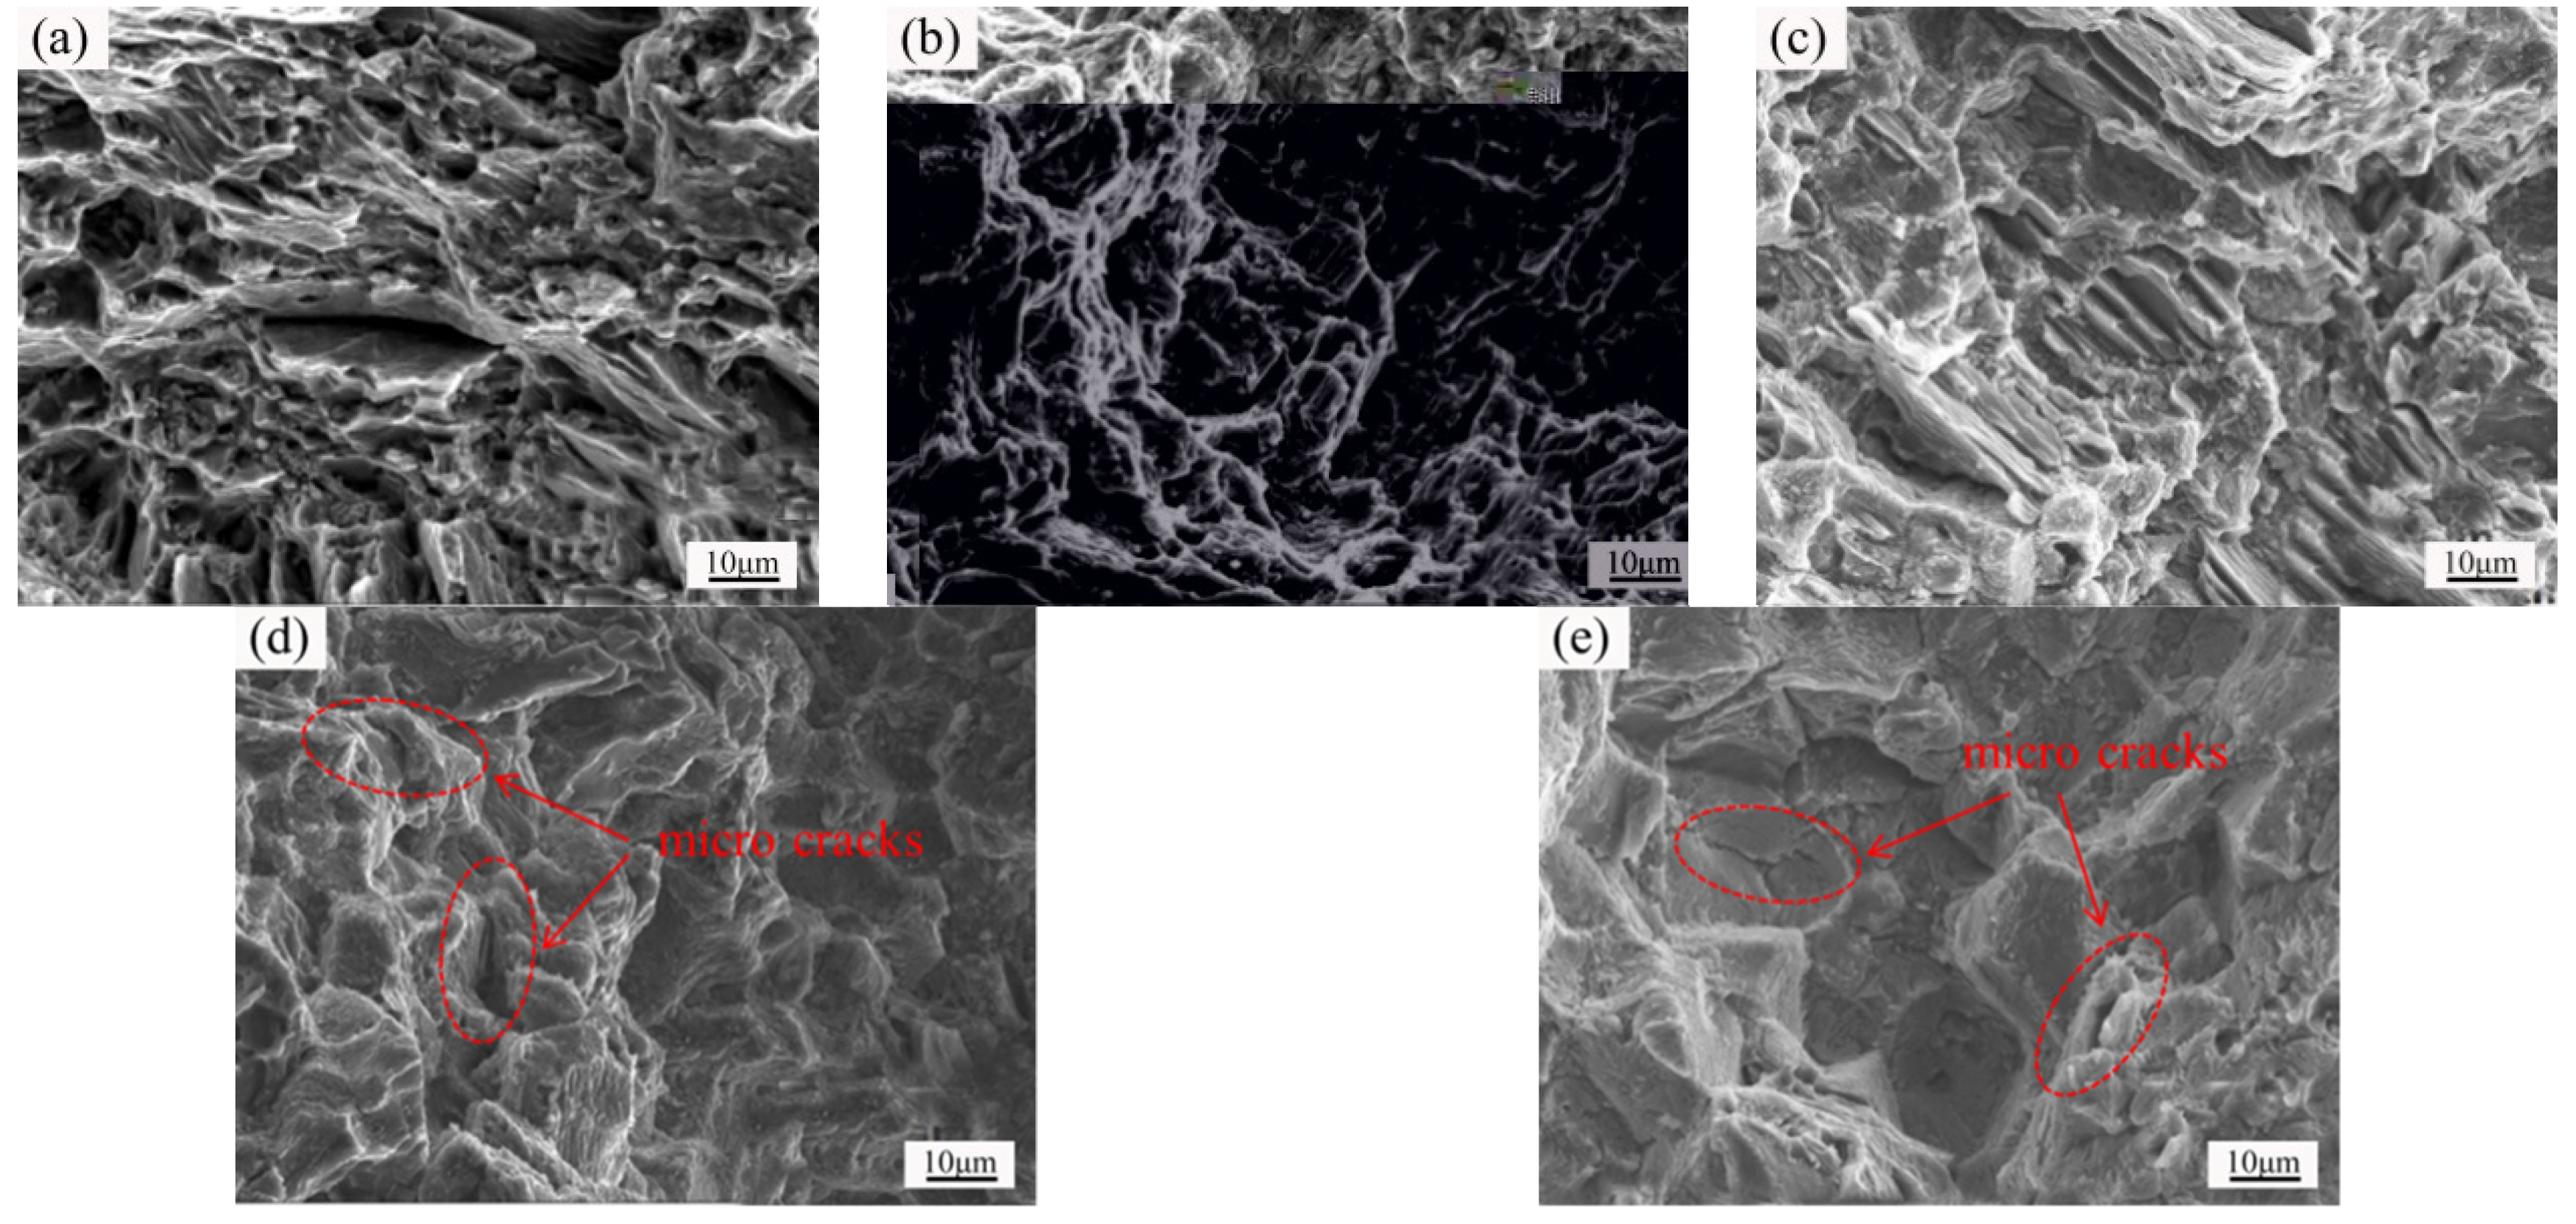
Figure 8 shows the fracture morphology of the tensile samples with different Y-element contents. The cleavage steps and tongue-shaped patterns can be observed in Mg-0YL (Figure 8a), which indicates the brittle fracture. Figure 8b shows the Mg-1YL fracture morphology, there are some river-type patterns, tearing edges, and small dimples that can be observed, which is a typical quasi-cleavage fracture. In Figure 8c, some obvious lamellar structures can be found. This can be attributed to the fact that some liquid alloys are not solidified and micro cracks generate during the deformation process due to the deformation rate difference between the incompletely solidified liquid alloy and solidified alloy. These micro cracks will extend during the solidification process, which will also increase the internal residual stress. Figure 8d,e demonstrates that the fracture types of Mg-3YL and Mg-4YL are a brittle intergranular fracture, at the same time some micro cracks can be observed at the grain boundary. The constitutional undercooling increases as the Y-element increases due to the enrichment of Zn and Y at the grain boundary (as shown in Figure 5), which will cause the liquid alloy to centralize towards the grain boundary during the liquid forging process. Due to the deformation rate difference between the incompletely solidified liquid alloy and solidified alloy, uneven deformation and a large amount of residual stress will form at the grain boundary enriched with liquid alloy. Meanwhile, the existence of W-phase is detrimental to the alloy ductility, as well.

3.2. Simulation Analysis of the Isothermal Forging Procedure

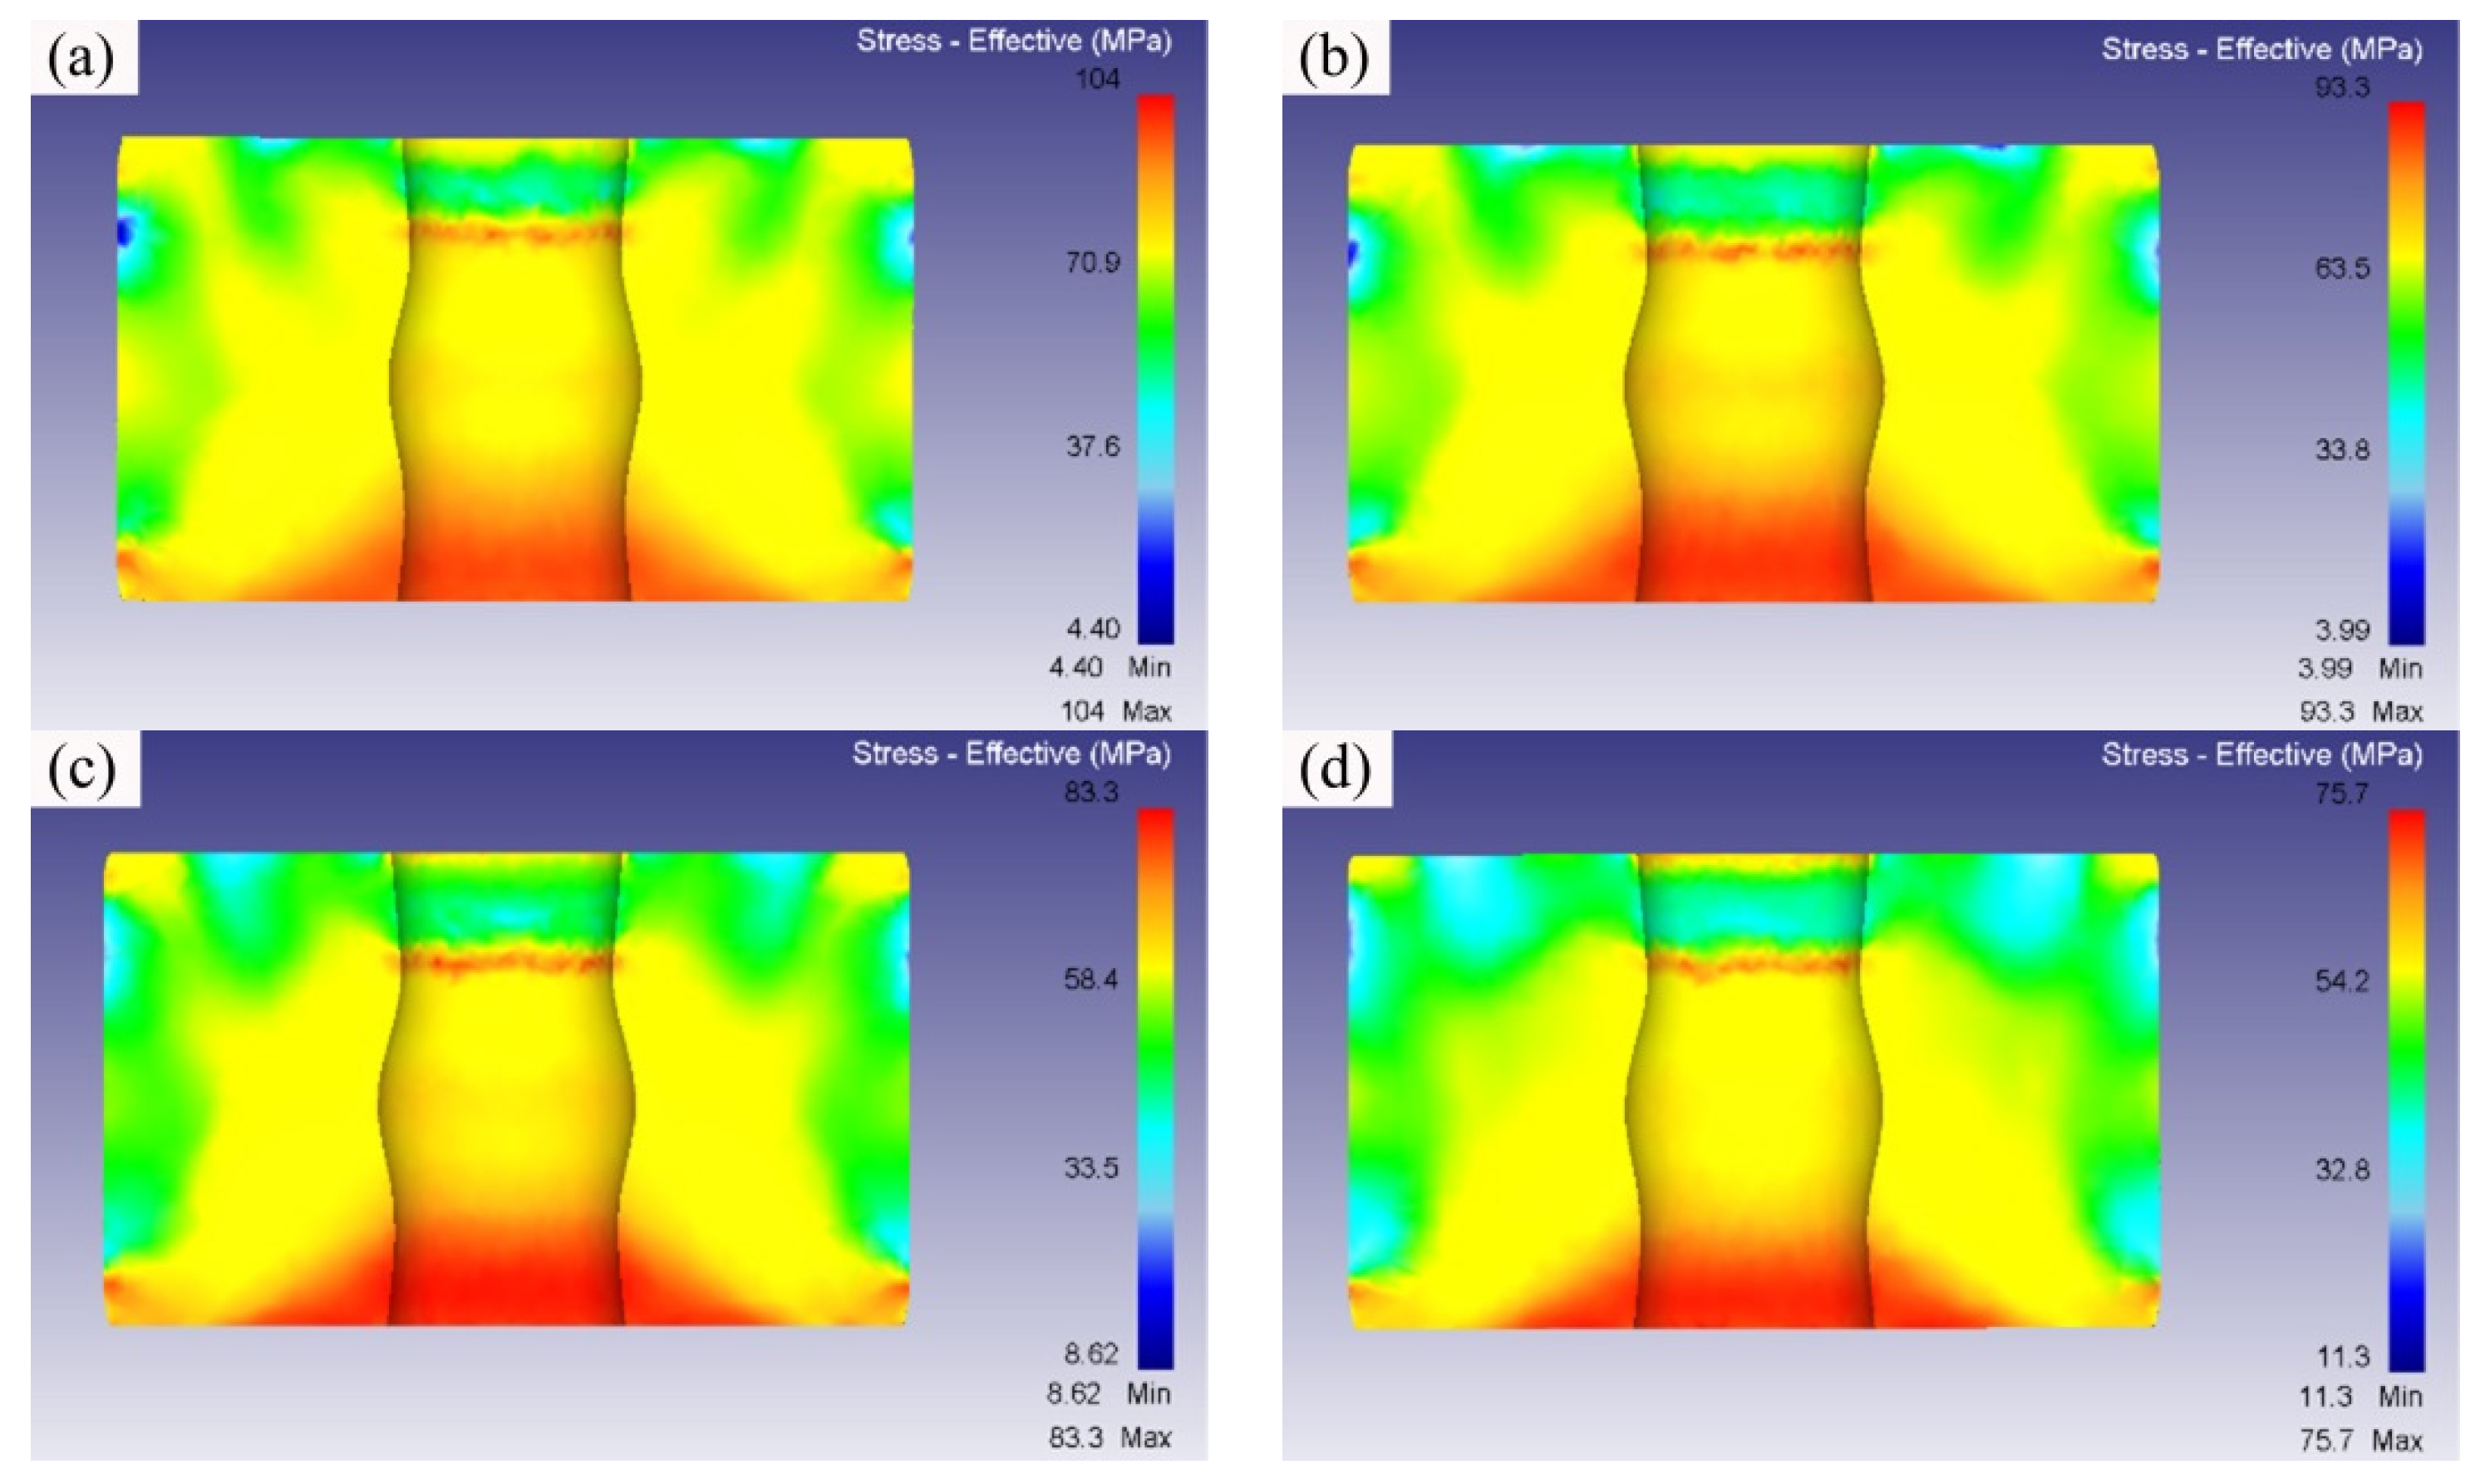
Figure 9 shows the stress distributions of the isothermal forging parts at different temperatures. The effective stress in the forming parts gradually decreases as the forming temperatures are elevated during the isothermal forging process. The max effective stresses in the isothermal forging parts are 104 MPa, 93.3 MPa, 83.3 MPa, and 75.7 MPa at the forming temperatures of 320 °C, 340 °C, 360 °C, and 380 °C, respectively. The max effective stress mainly concentrates on the center bottom of the forming part, where it is the critical point in the isothermal forging process.
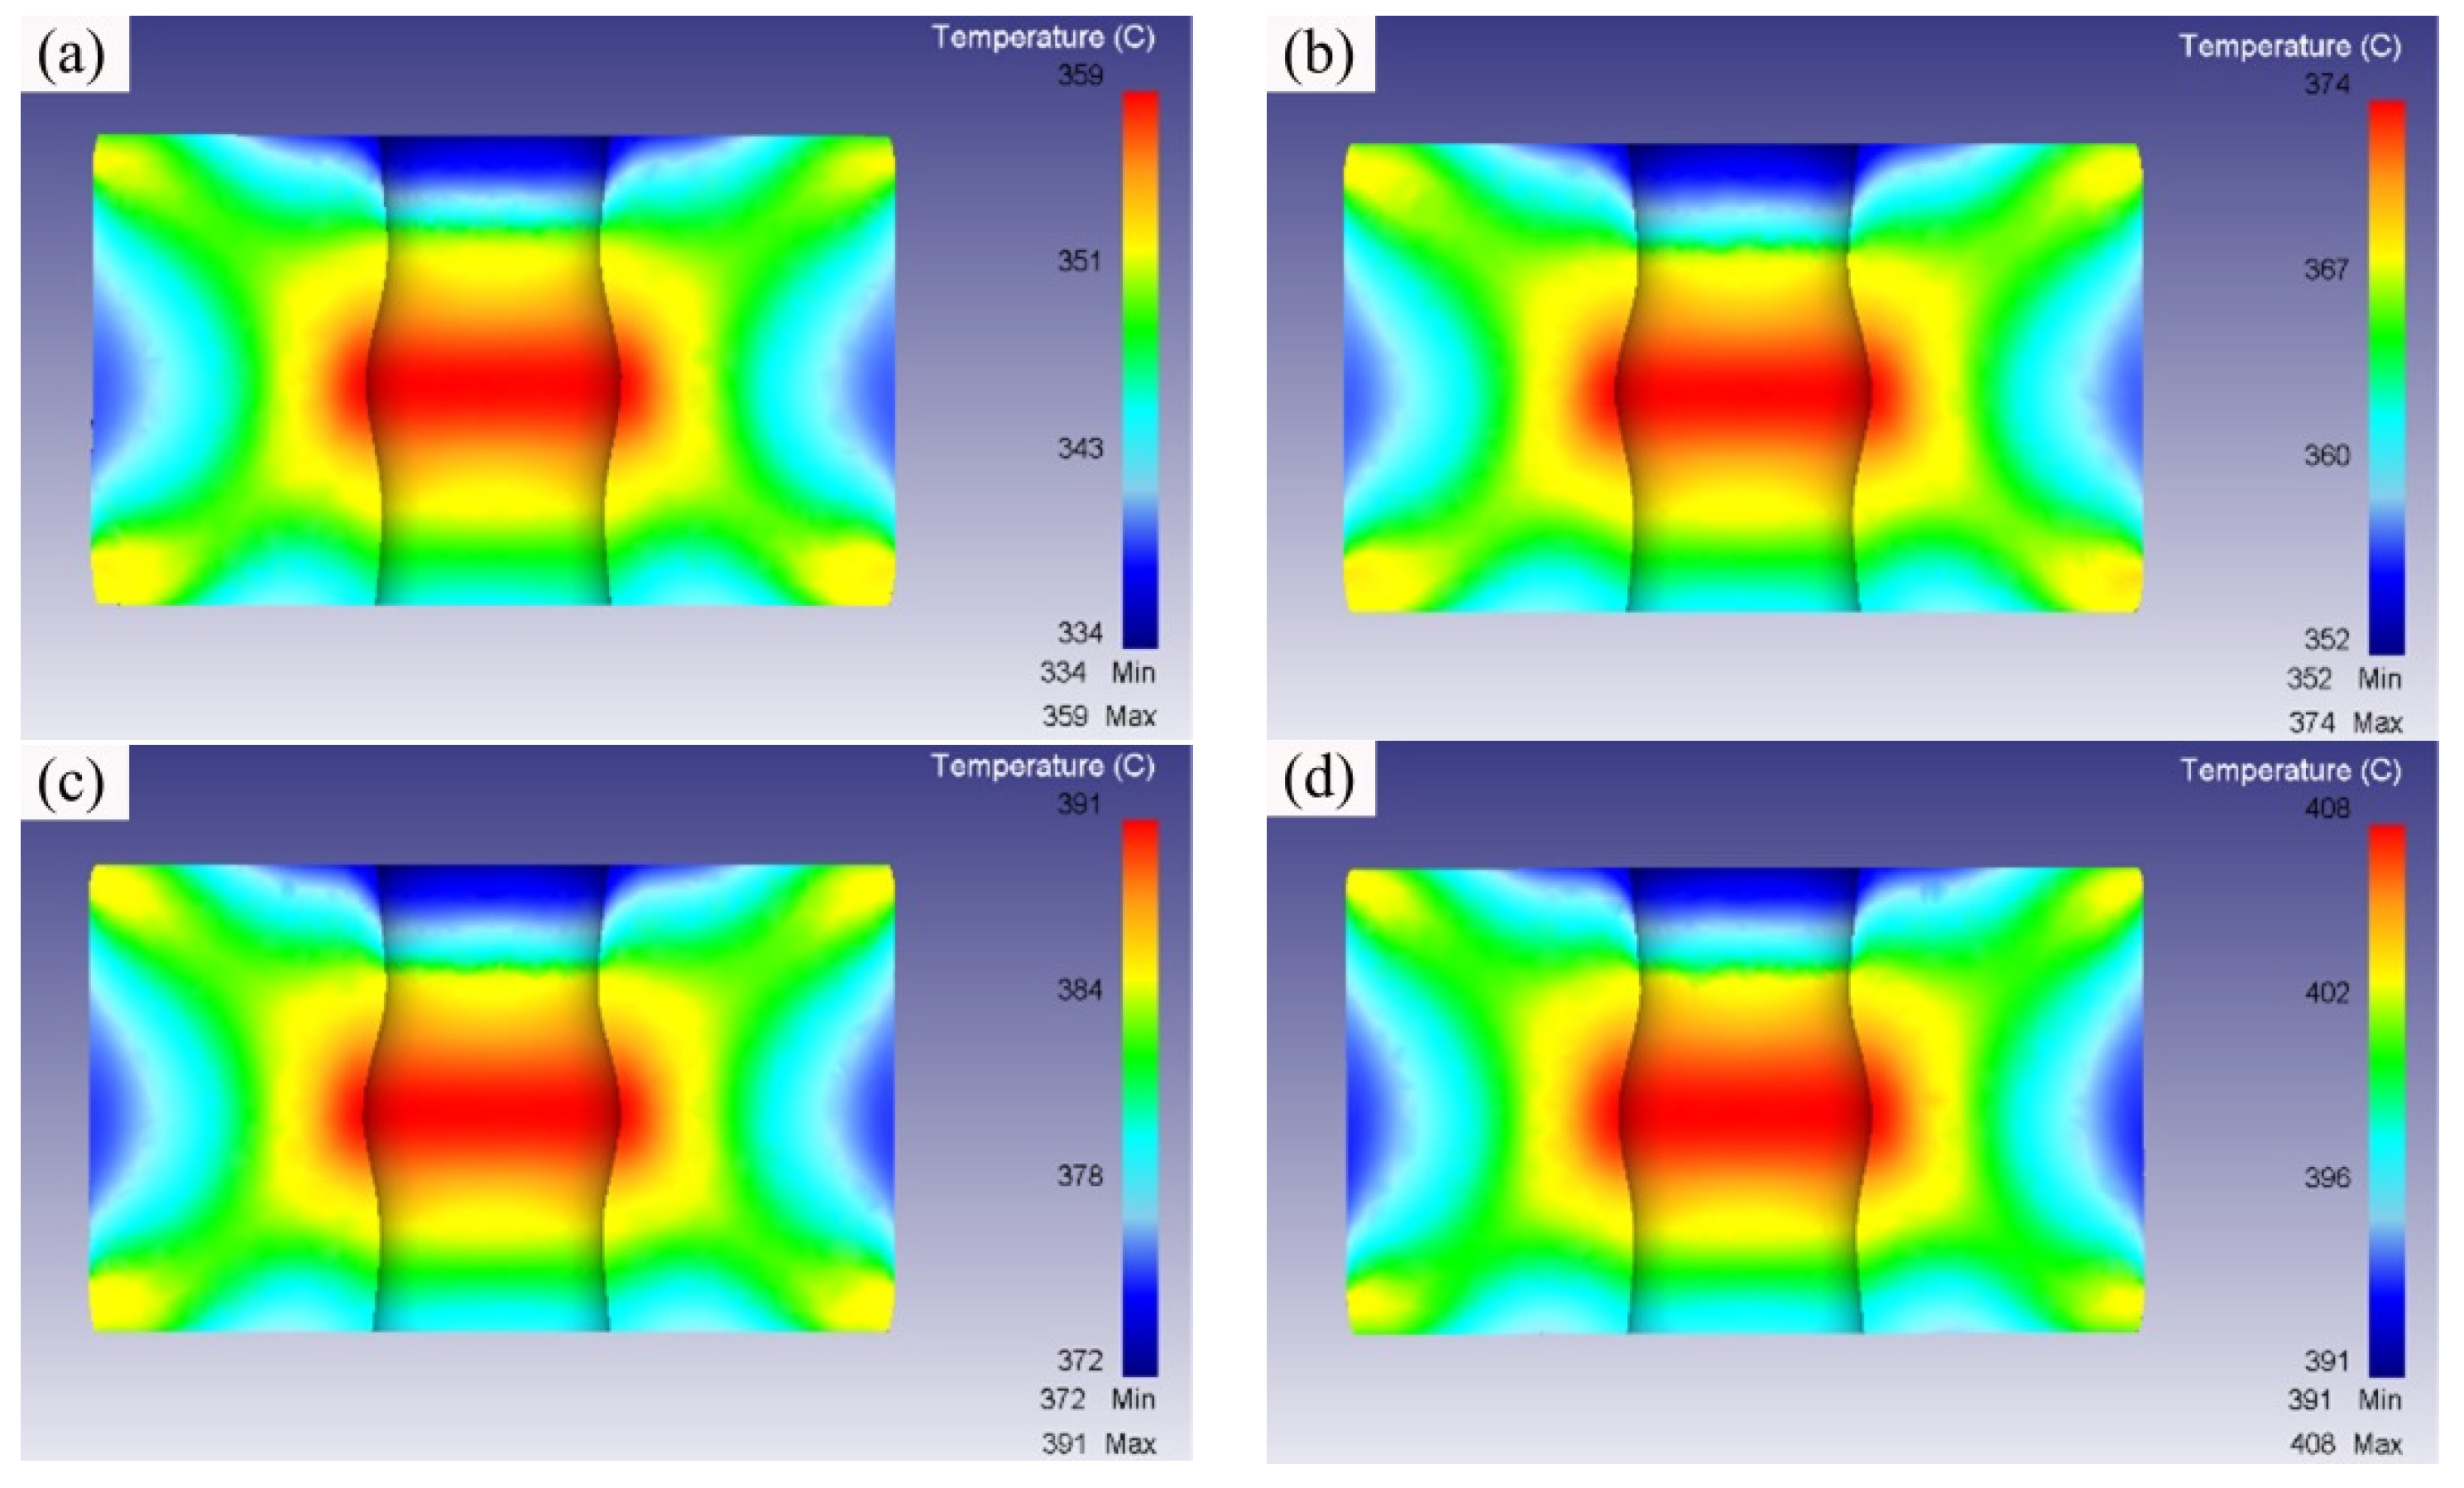
Figure 10 shows the temperature distributions of the isothermal forging parts at different temperatures. The temperatures in the forming parts increase as the forming temperatures are elevated during the isothermal forging process. The highest temperatures in the isothermal forging parts are 359 °C, 374 °C, 391 °C, and 408 °C when the forming temperatures are 320 °C, 340 °C, 360 °C, and 380 °C, respectively. The central position of the forming part displays the highest temperature due to the largest deformation in the isothermal forging process. The upside and bottom of the forming part have a lower temperature, this can be ascribed to the lower deformation rate and the heat loss due to the contact with upper and bottom die. Thus, it is of vital importance to keep temperature balance inside the forming parts during the isothermal forging process.

3.3. Microstructure and Properties of the Isothermal Forging Parts at Different Temperatures

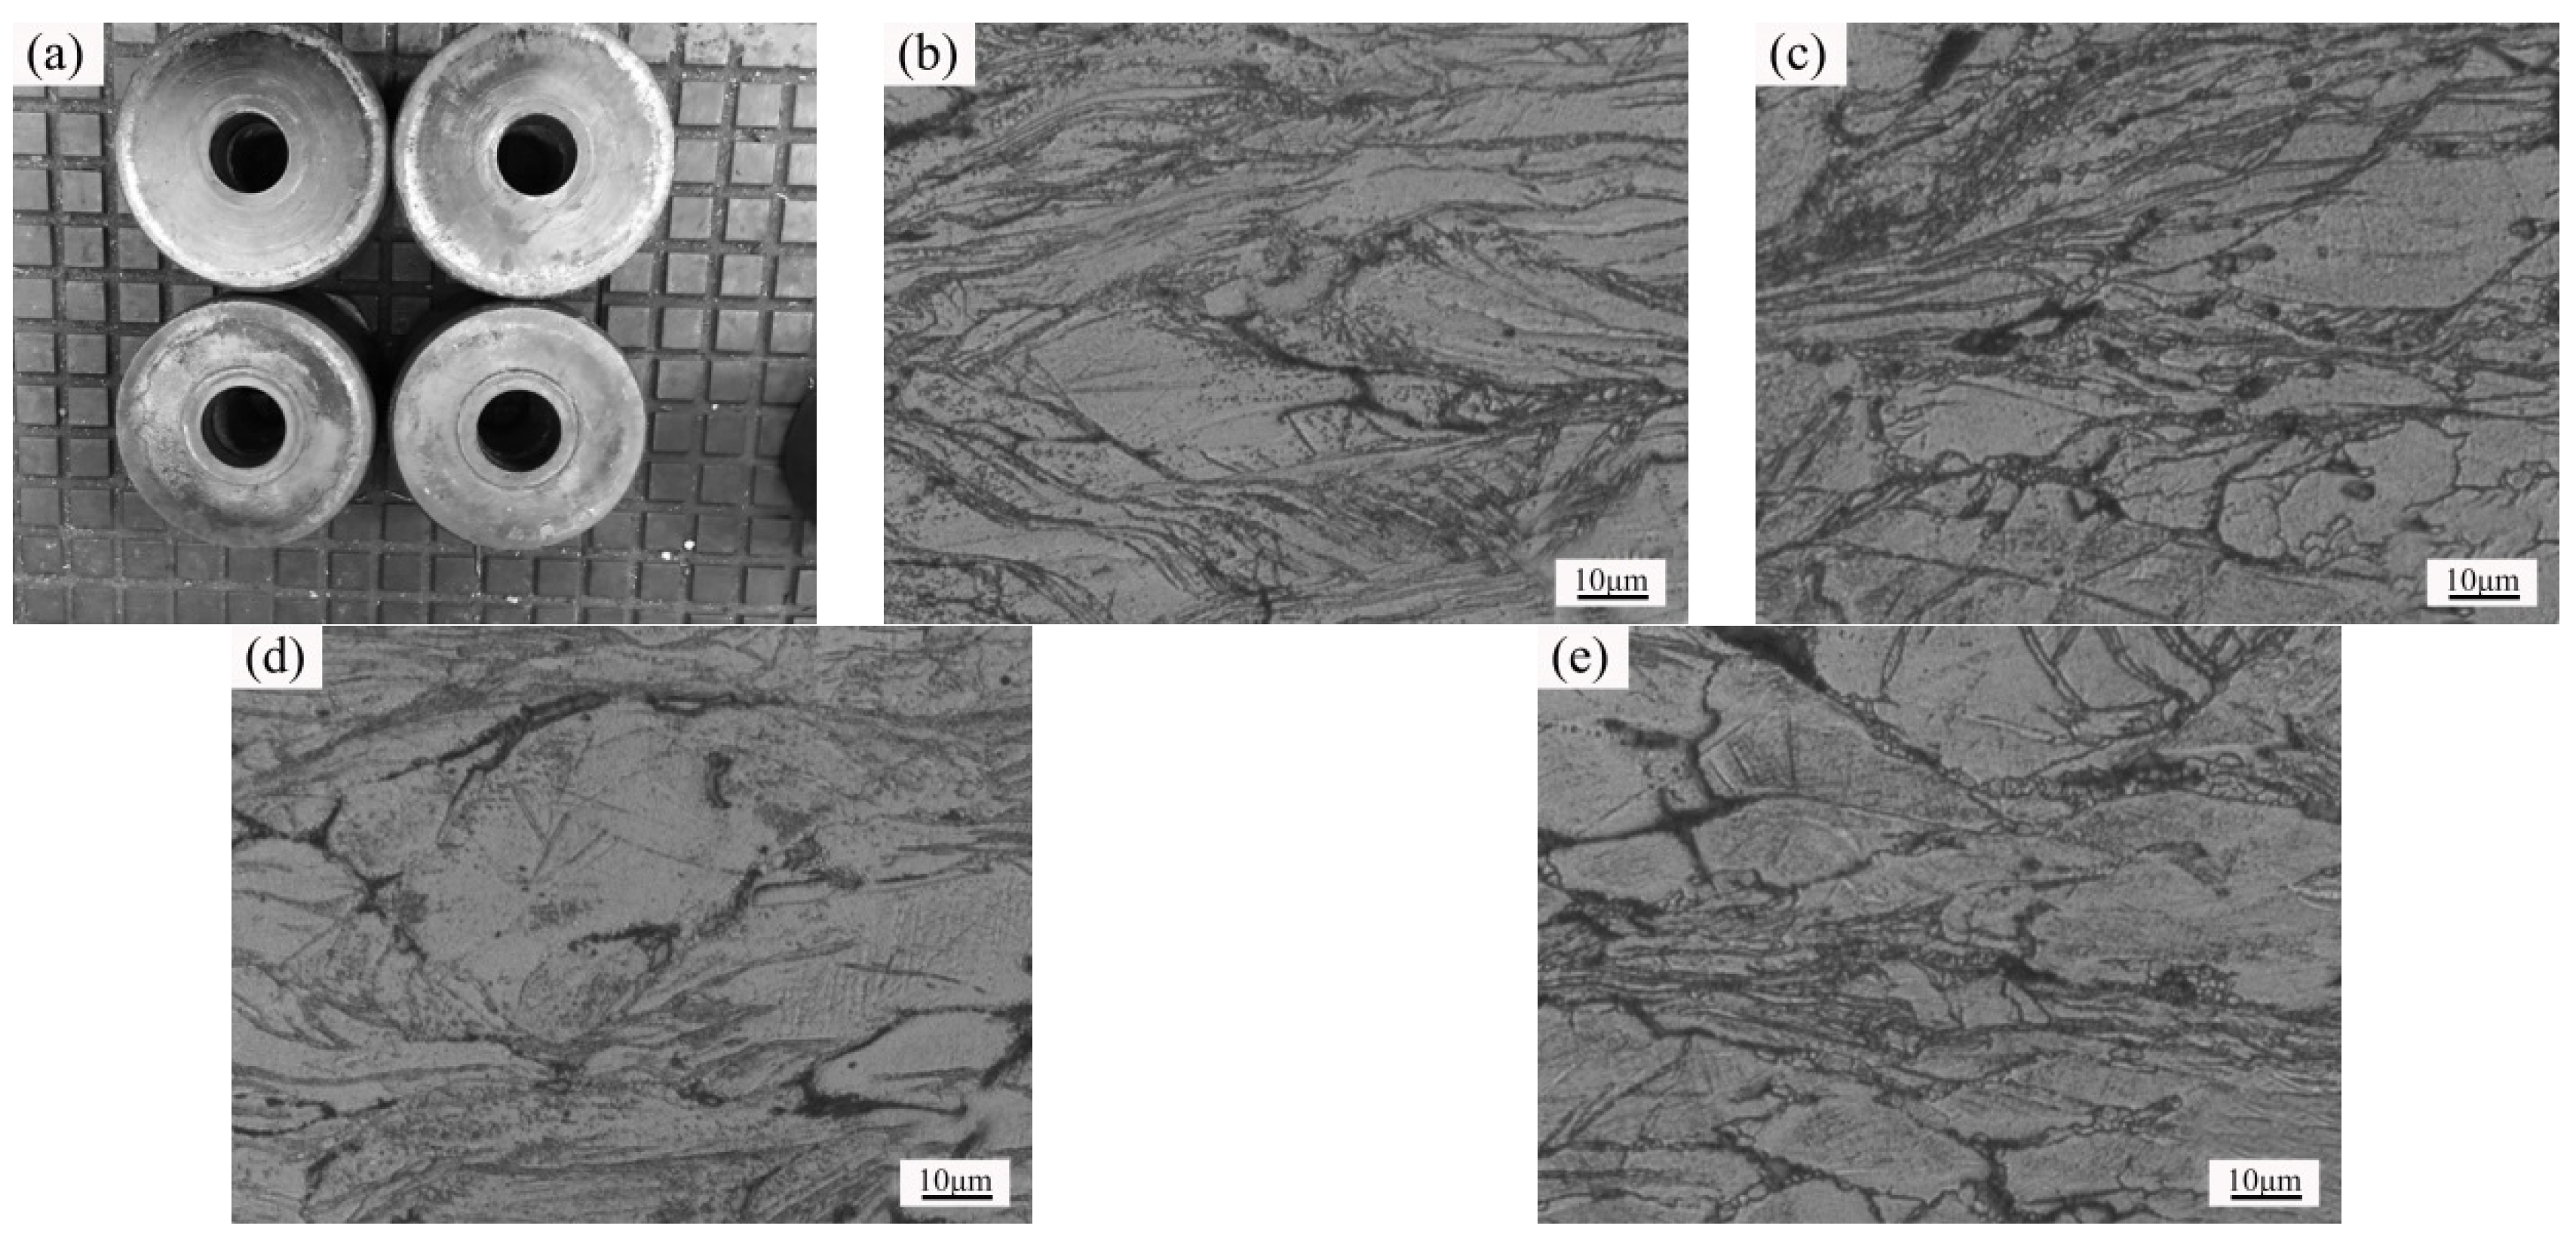
The picture and optical microstructure of the isothermal forging parts at different temperatures are shown in Figure 11. The isothermal forging parts display high quality appearances with the specified dimensions, as shown in Figure 11a. The metallographic structures with obvious deformation and the dendrites perpendicular to the deformation direction can be observed in Figure 11b–e. The dendrites are still obvious when the forming temperature is 320 °C, as shown in Figure 11b. However, the dendrites gradually decrease and the grain deformation is more homogenous as the forming temperature is elevated. Meanwhile, there are some recrystallization grains that can be observed when the temperature reaches up to 340 °C, as shown in Figure 11c. The increase of temperature will facilitate the dynamic recrystallization process, but the grains in the forming parts have a tendency to grow up at the same time, which is detrimental to the performance of forming parts.
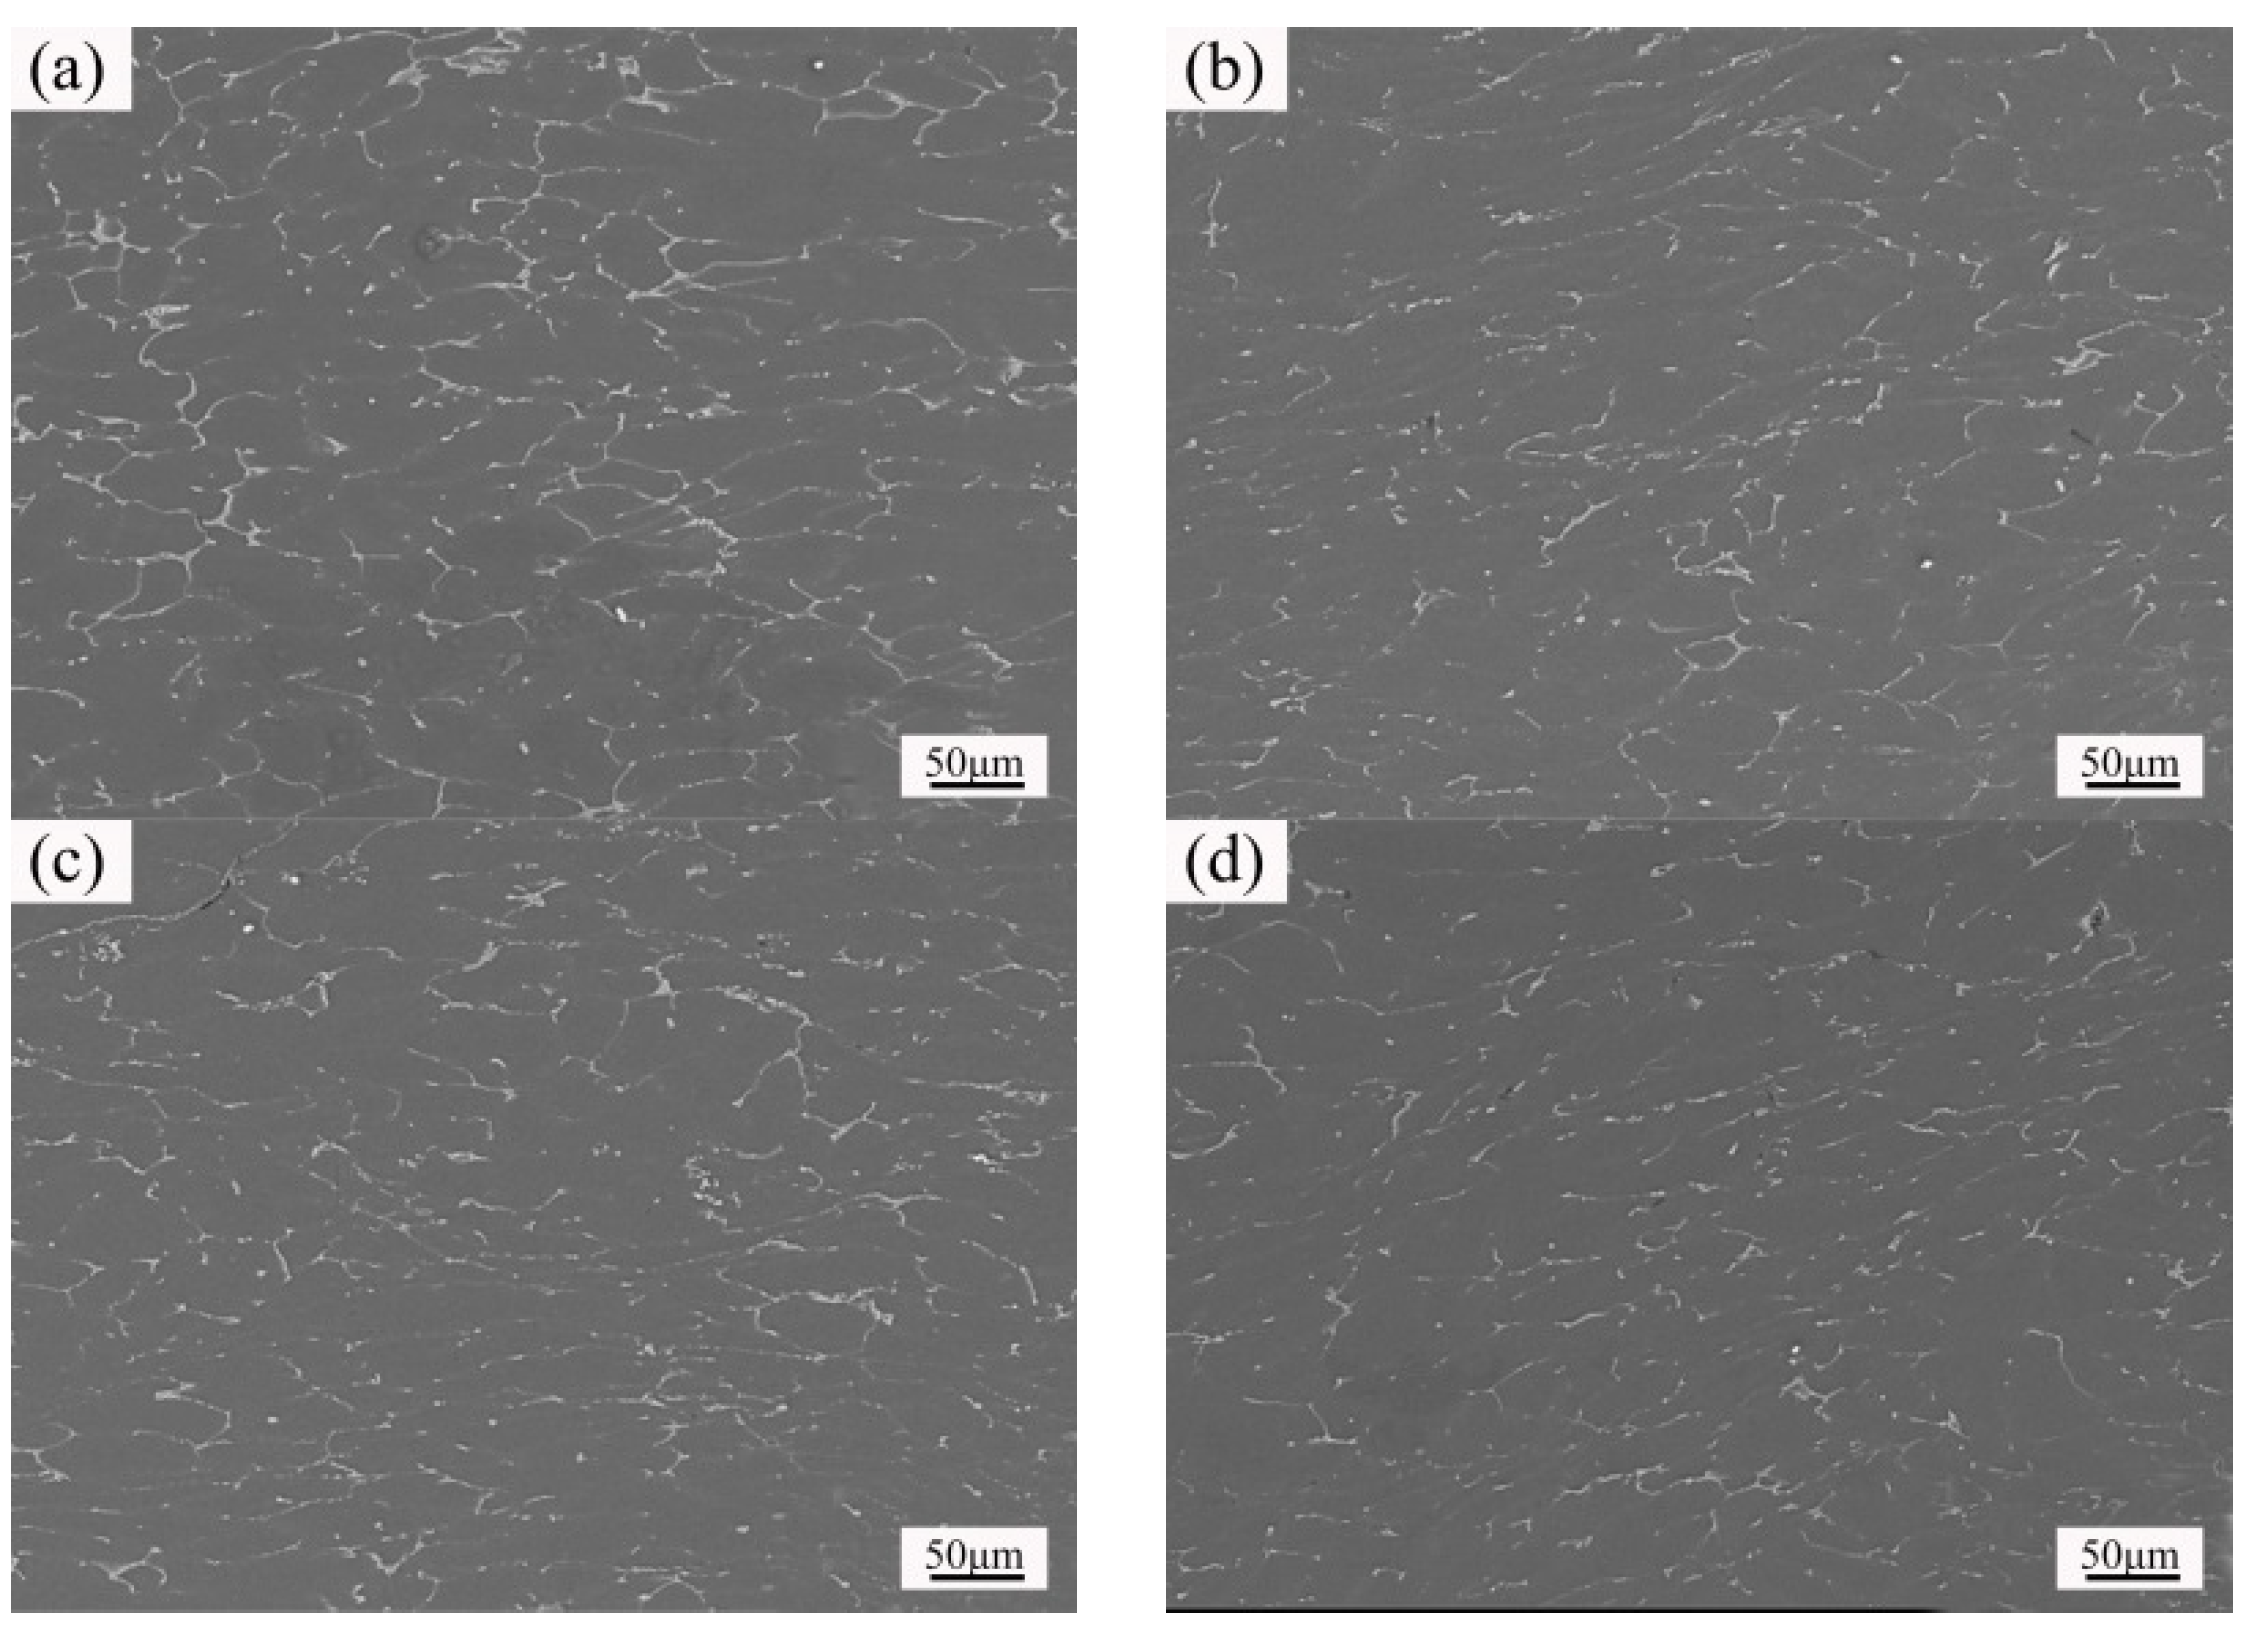
Figure 12 shows the SEM microstructure of the isothermal forging parts at different temperatures. The second phases with different sizes, shapes and distributions, and some grains with different deformation can be observed. The second phases are uniform at the temperature of 320 °C. Some second phases perpendicular to the deformation direction are lengthened, while there are still some second phases that only have small deformation, as shown in Figure 12a. The microstructure of the forming parts tends to be more uniform, and some dispersed granular second phases can be observed with the increase of forming temperature, as shown in Figure 12b,c. When the forming temperature is elevated to 380 °C, the granular second phases dispersive in grains are obvious, and the grain boundary is thinner, as demonstrated in Figure 12d. This can be attributed to the alloy elements diffusion from grain boundary to grain interior due to the increase of forming temperature.
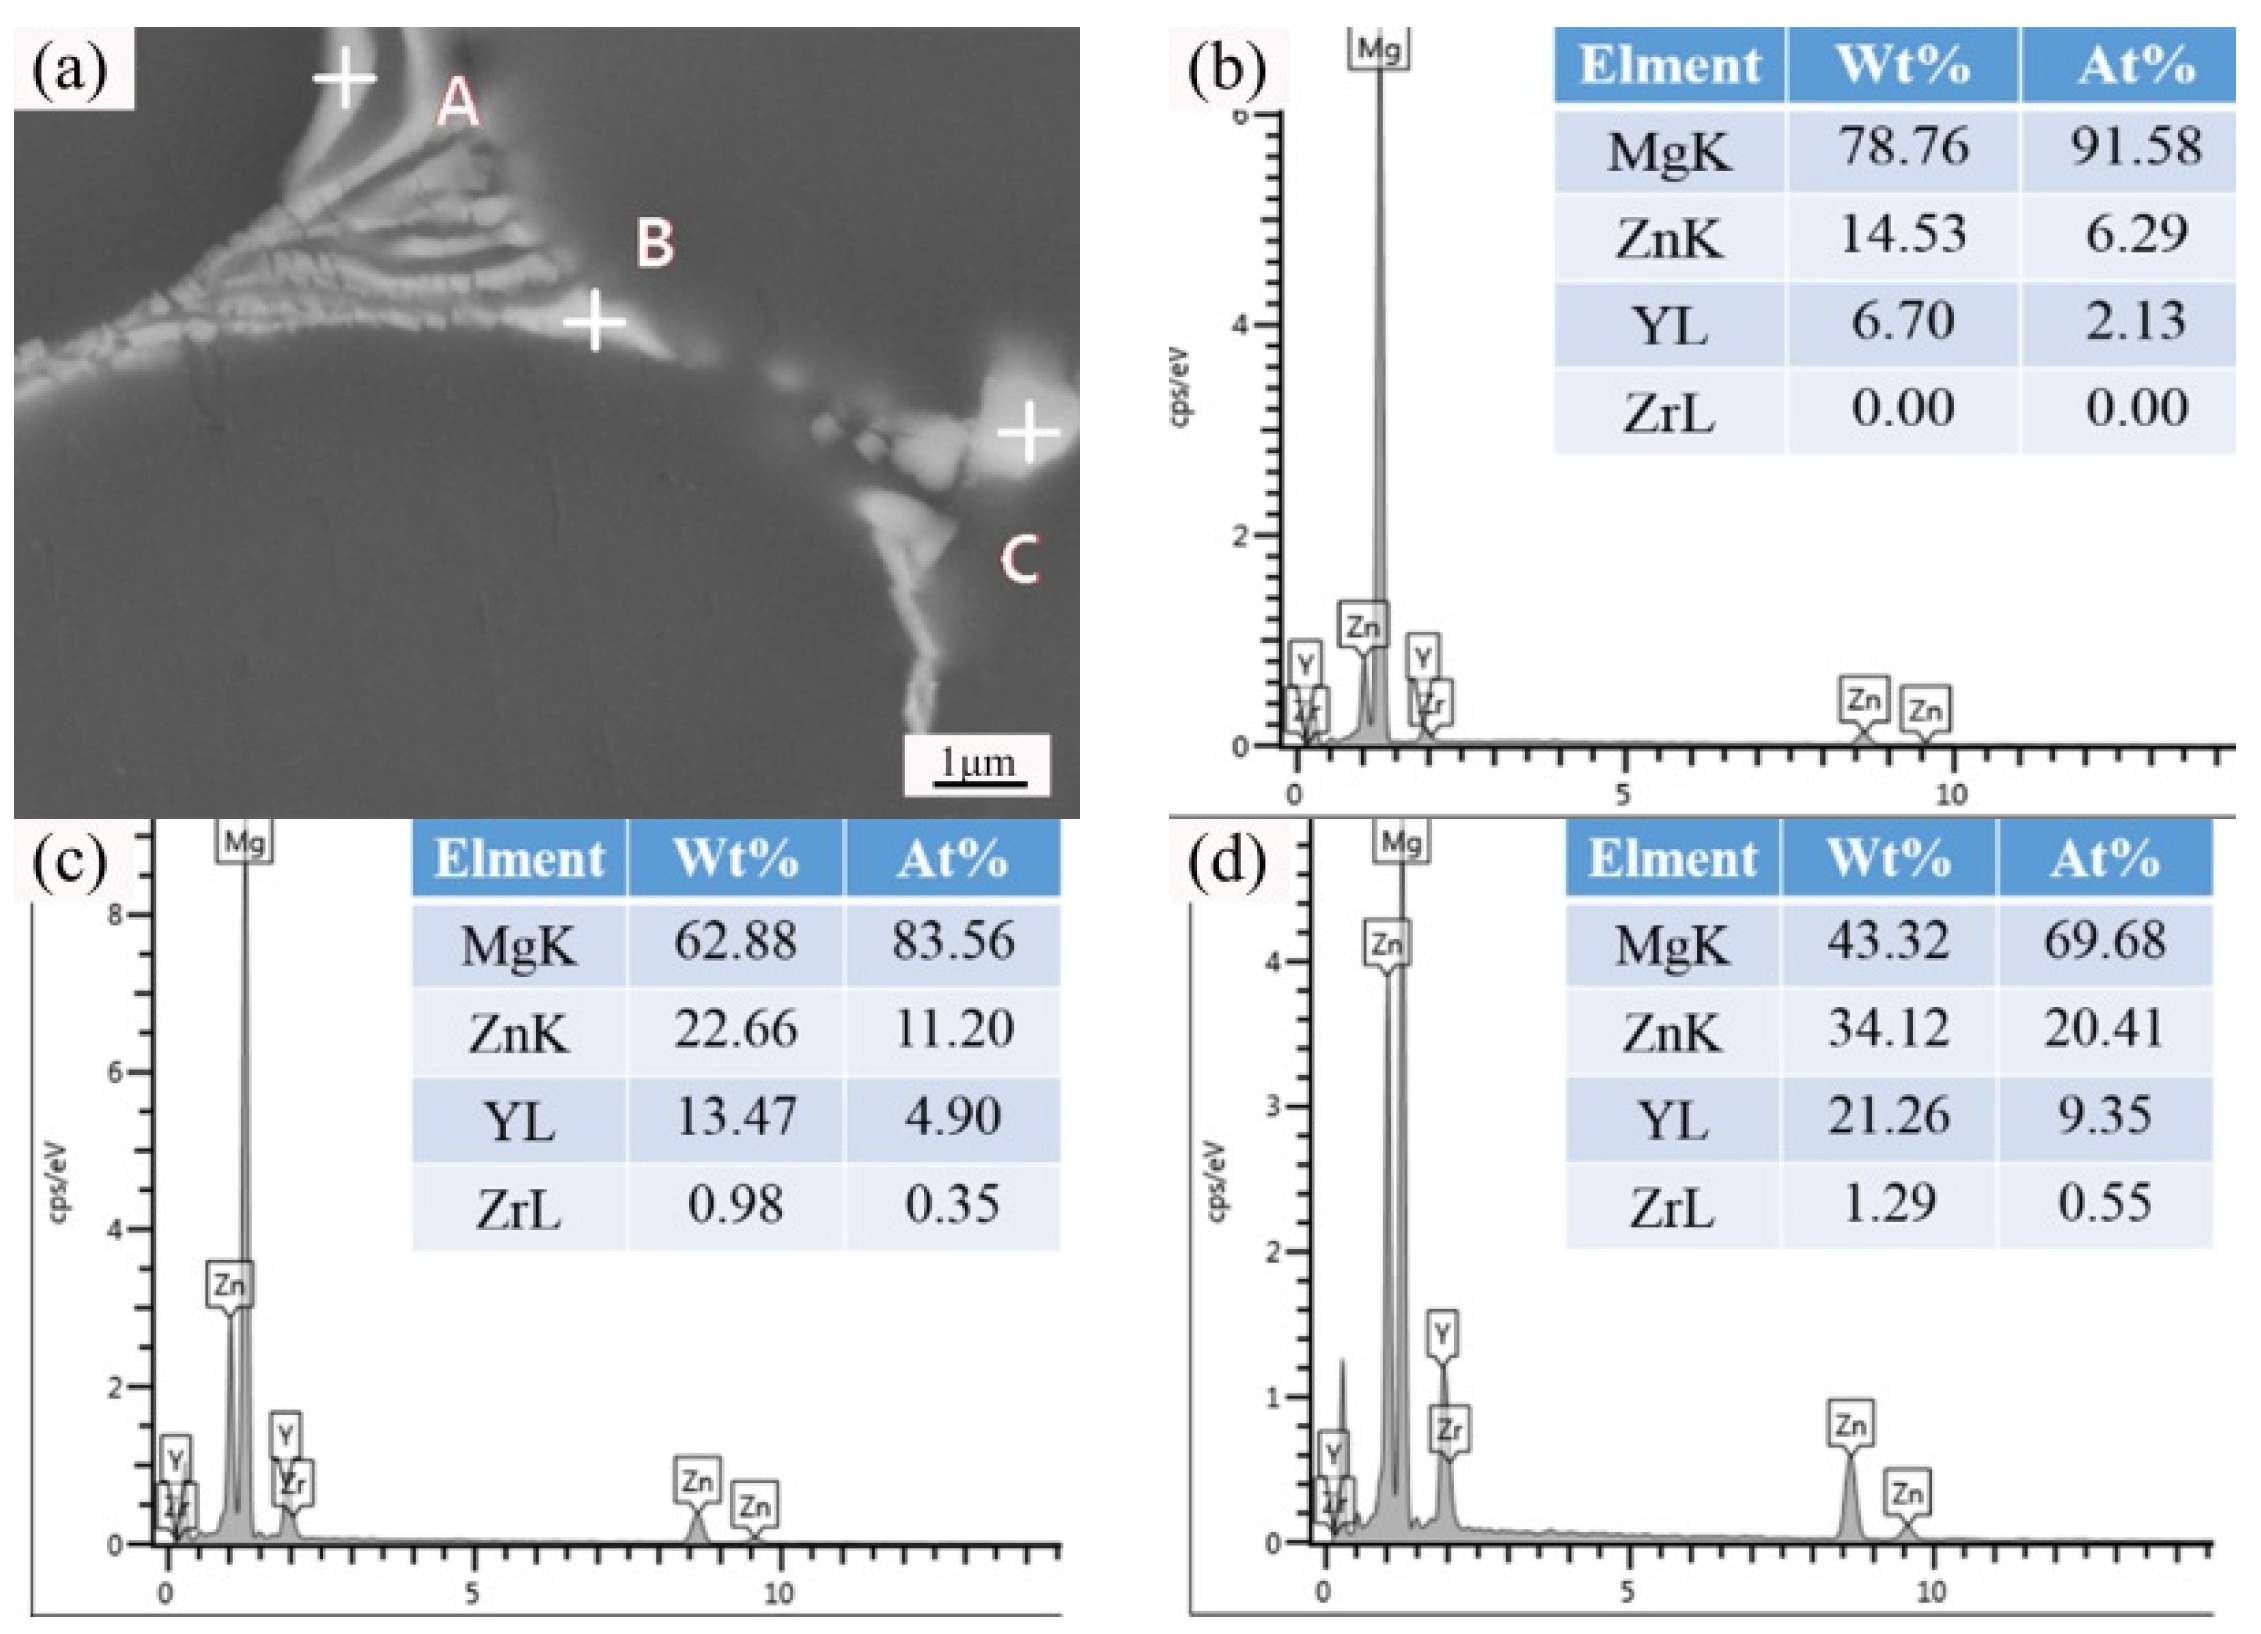
Figure 13 shows the SEM microstructure and EDS analysis of the isothermal forging parts at 380 °C. The coarse second phases mainly have been broken into small fish-bone phases and fine granular phases, as shown in Figure 13a. Figure 13b–d demonstrates the EDS analysis results of spots A, B, and C in Figure 13a. Table 7 indicates that the Zn and Y atom ratios of the spots A, B, and C are 2.95, 2.28, and 2.18, respectively, which are comparable to that in W-phase. The results indicate that the second phases transform from I-phase to W-phase after the isothermal forging process. This can be attributed to the fact that the diffusion rate of Y atoms is slower than that of Zn and Mg atoms due to the bigger atom radius. The W-phase can form from the I-phase enriched with Y-element during the isothermal forging process.
The tensile properties of the isothermal forging parts at different temperatures are shown in Table 8. The results demonstrate that the properties of the liquid forging parts have a significant improvement after the isothermal forging process. Meanwhile, the properties of the isothermal forging parts improve with the increase of forming temperature. The forming part prepared at 380 °C displays the outstanding properties, the elongation, yield stress, and ultimate tensile strength are 18.5%, 150 MPa and 315 MPa, respectively. This can be attributed to the increase of recrystallization grains due to the improvement of driving force for dynamic recrystallization with the increase of forming temperature. Furthermore, the W-phase transformed from I-phase disperses within the grains, which have the effects of dispersion strengthening. On the other hand, massive second phases dispersive along the grain boundary can enhance the pinning effect on grain boundary. The decomposition of coarse second phases and uniform structures will facilitate the samples elongation.
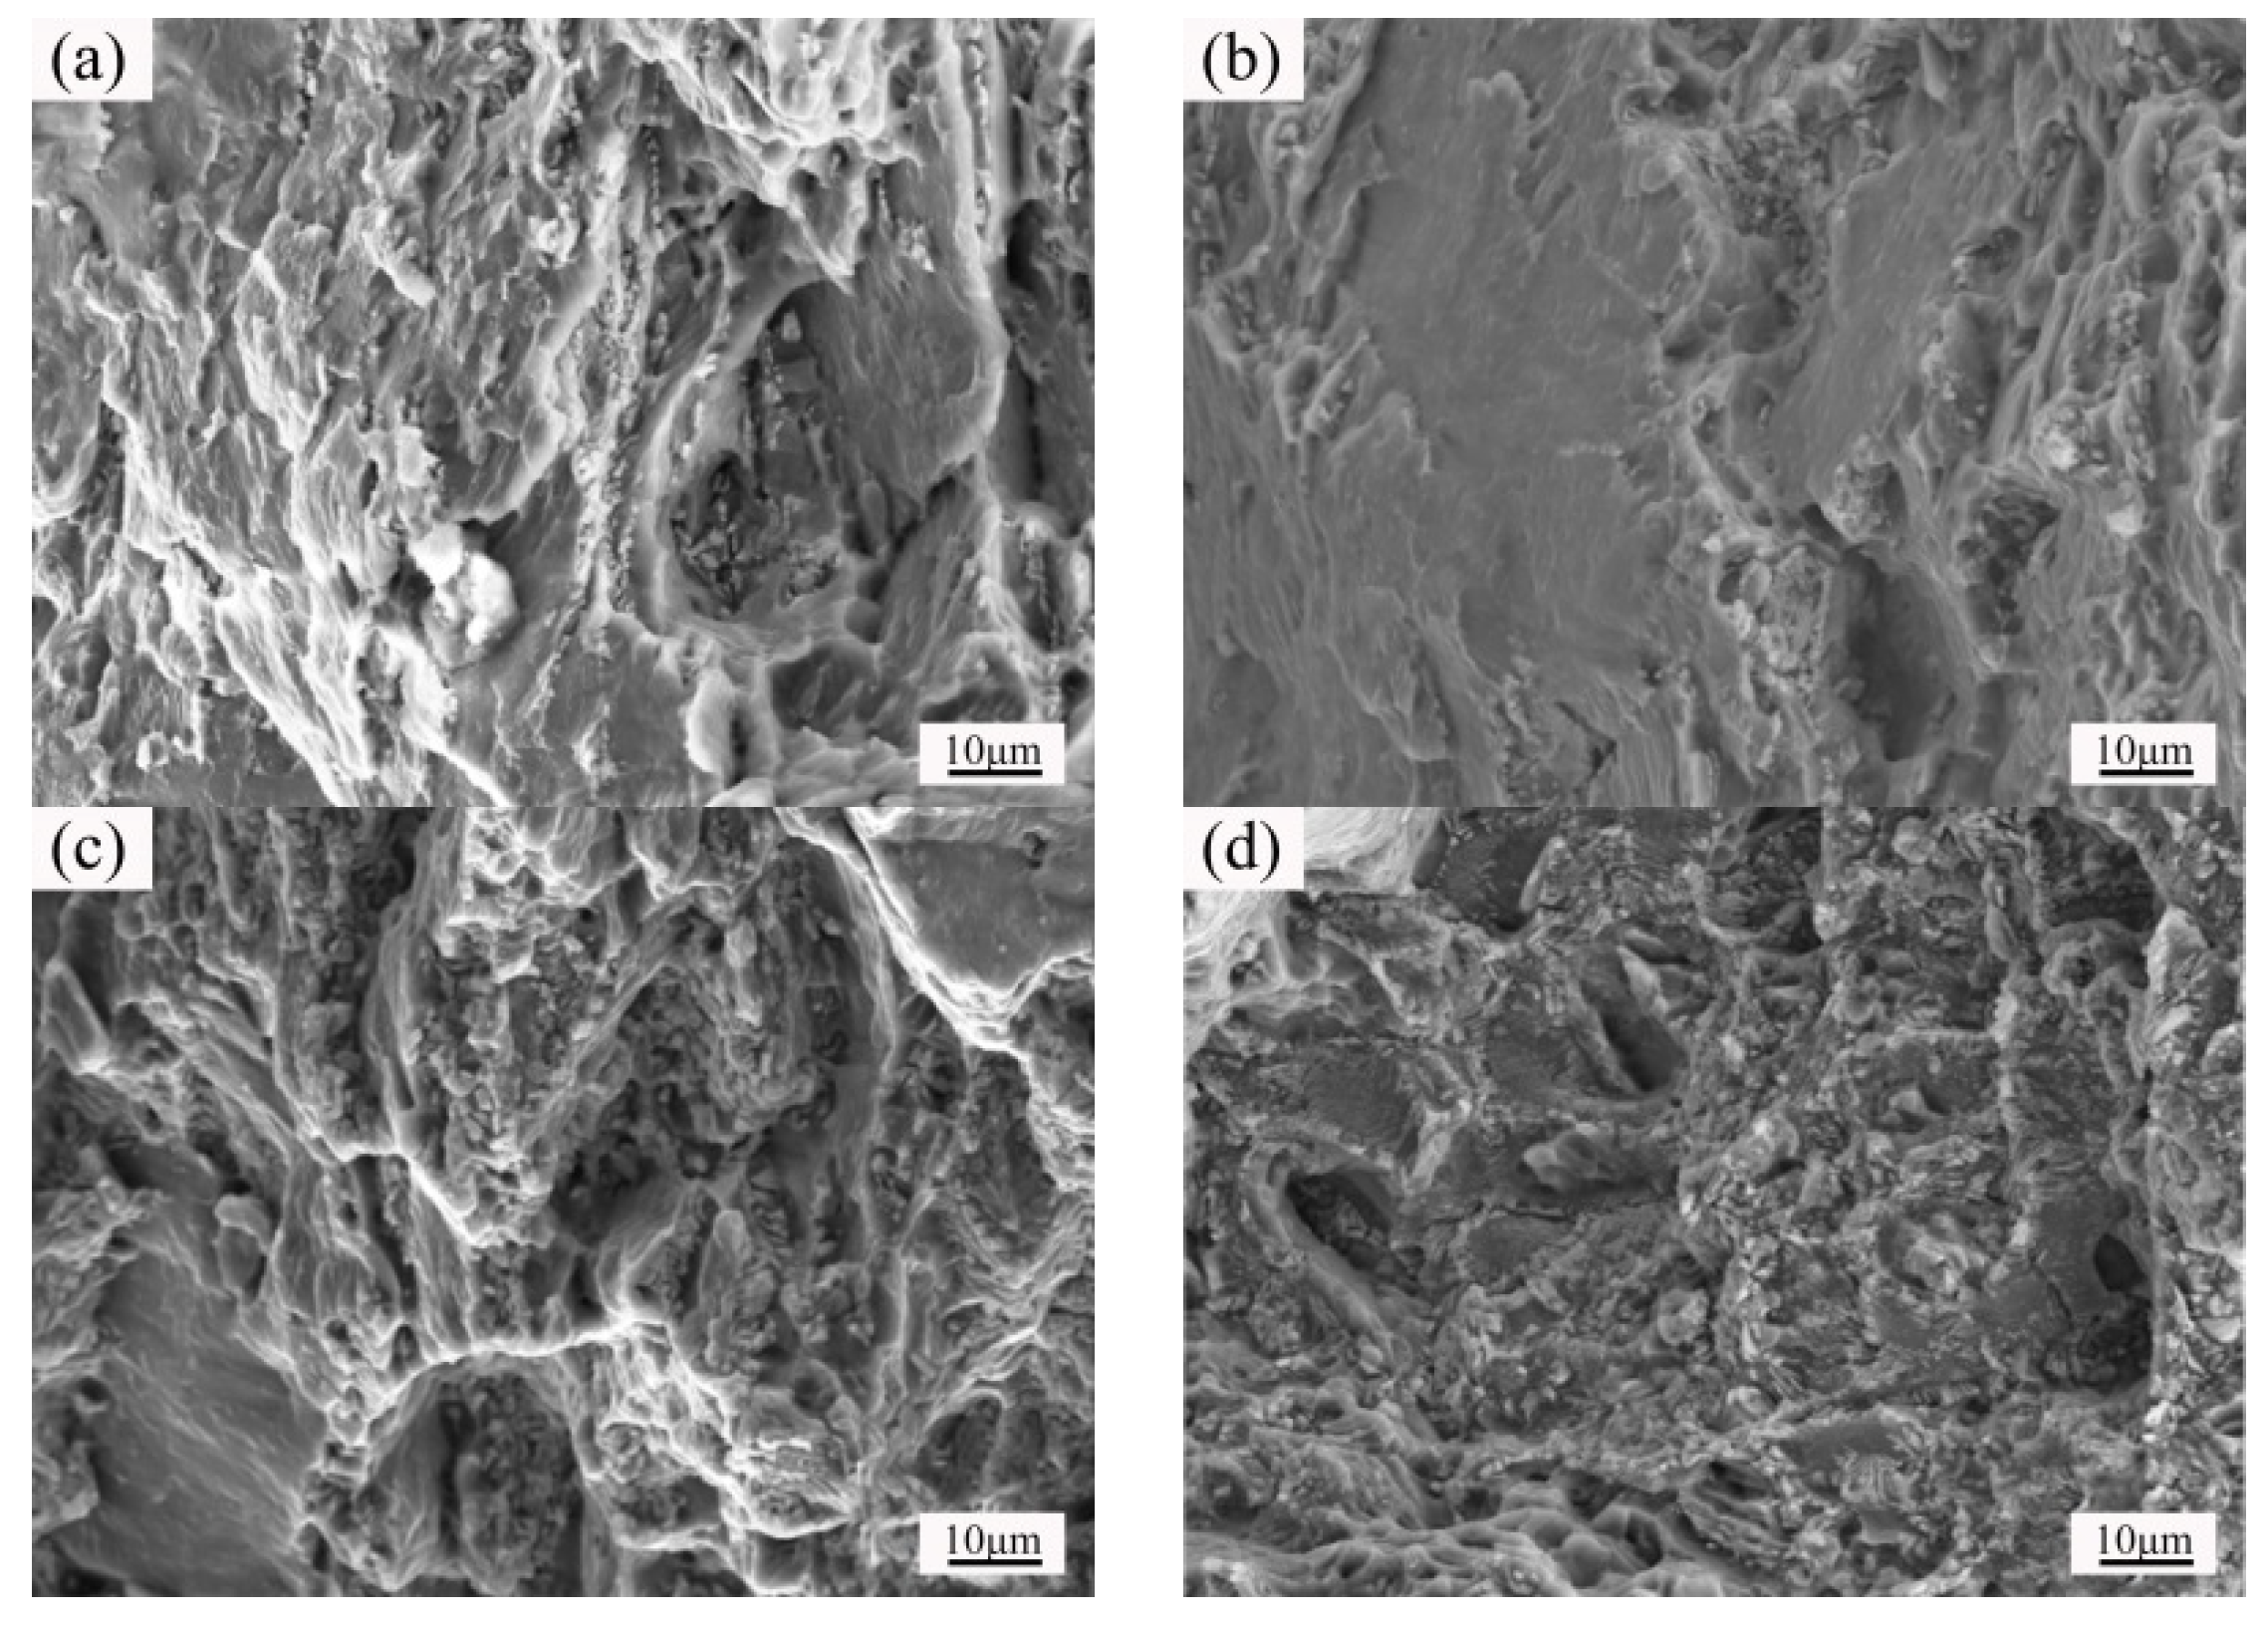
Figure 14 shows the fracture morphology of the isothermal forging parts at different temperatures. In Figure 14a,b, the cleavage steps and tongue-shaped patterns can be observed, which indicates the brittle cleavage fracture. There are some river-type patterns, tearing edges, and small dimples belonging to the typical quasi-cleavage fracture that can be detected, as shown in Figure 14c. The fracture of the samples prepared at 380 °C is quasi-cleavage fracture, as well. Meanwhile, more granular phases can be observed, as illustrated in Figure 14d. This may be ascribed to the second phase spherification at the grain boundary due to the diffusion of Zn and Y into the grains.

3.4. Microstructure and Properties of the Isothermal Forging Parts after Post Heat Treatments

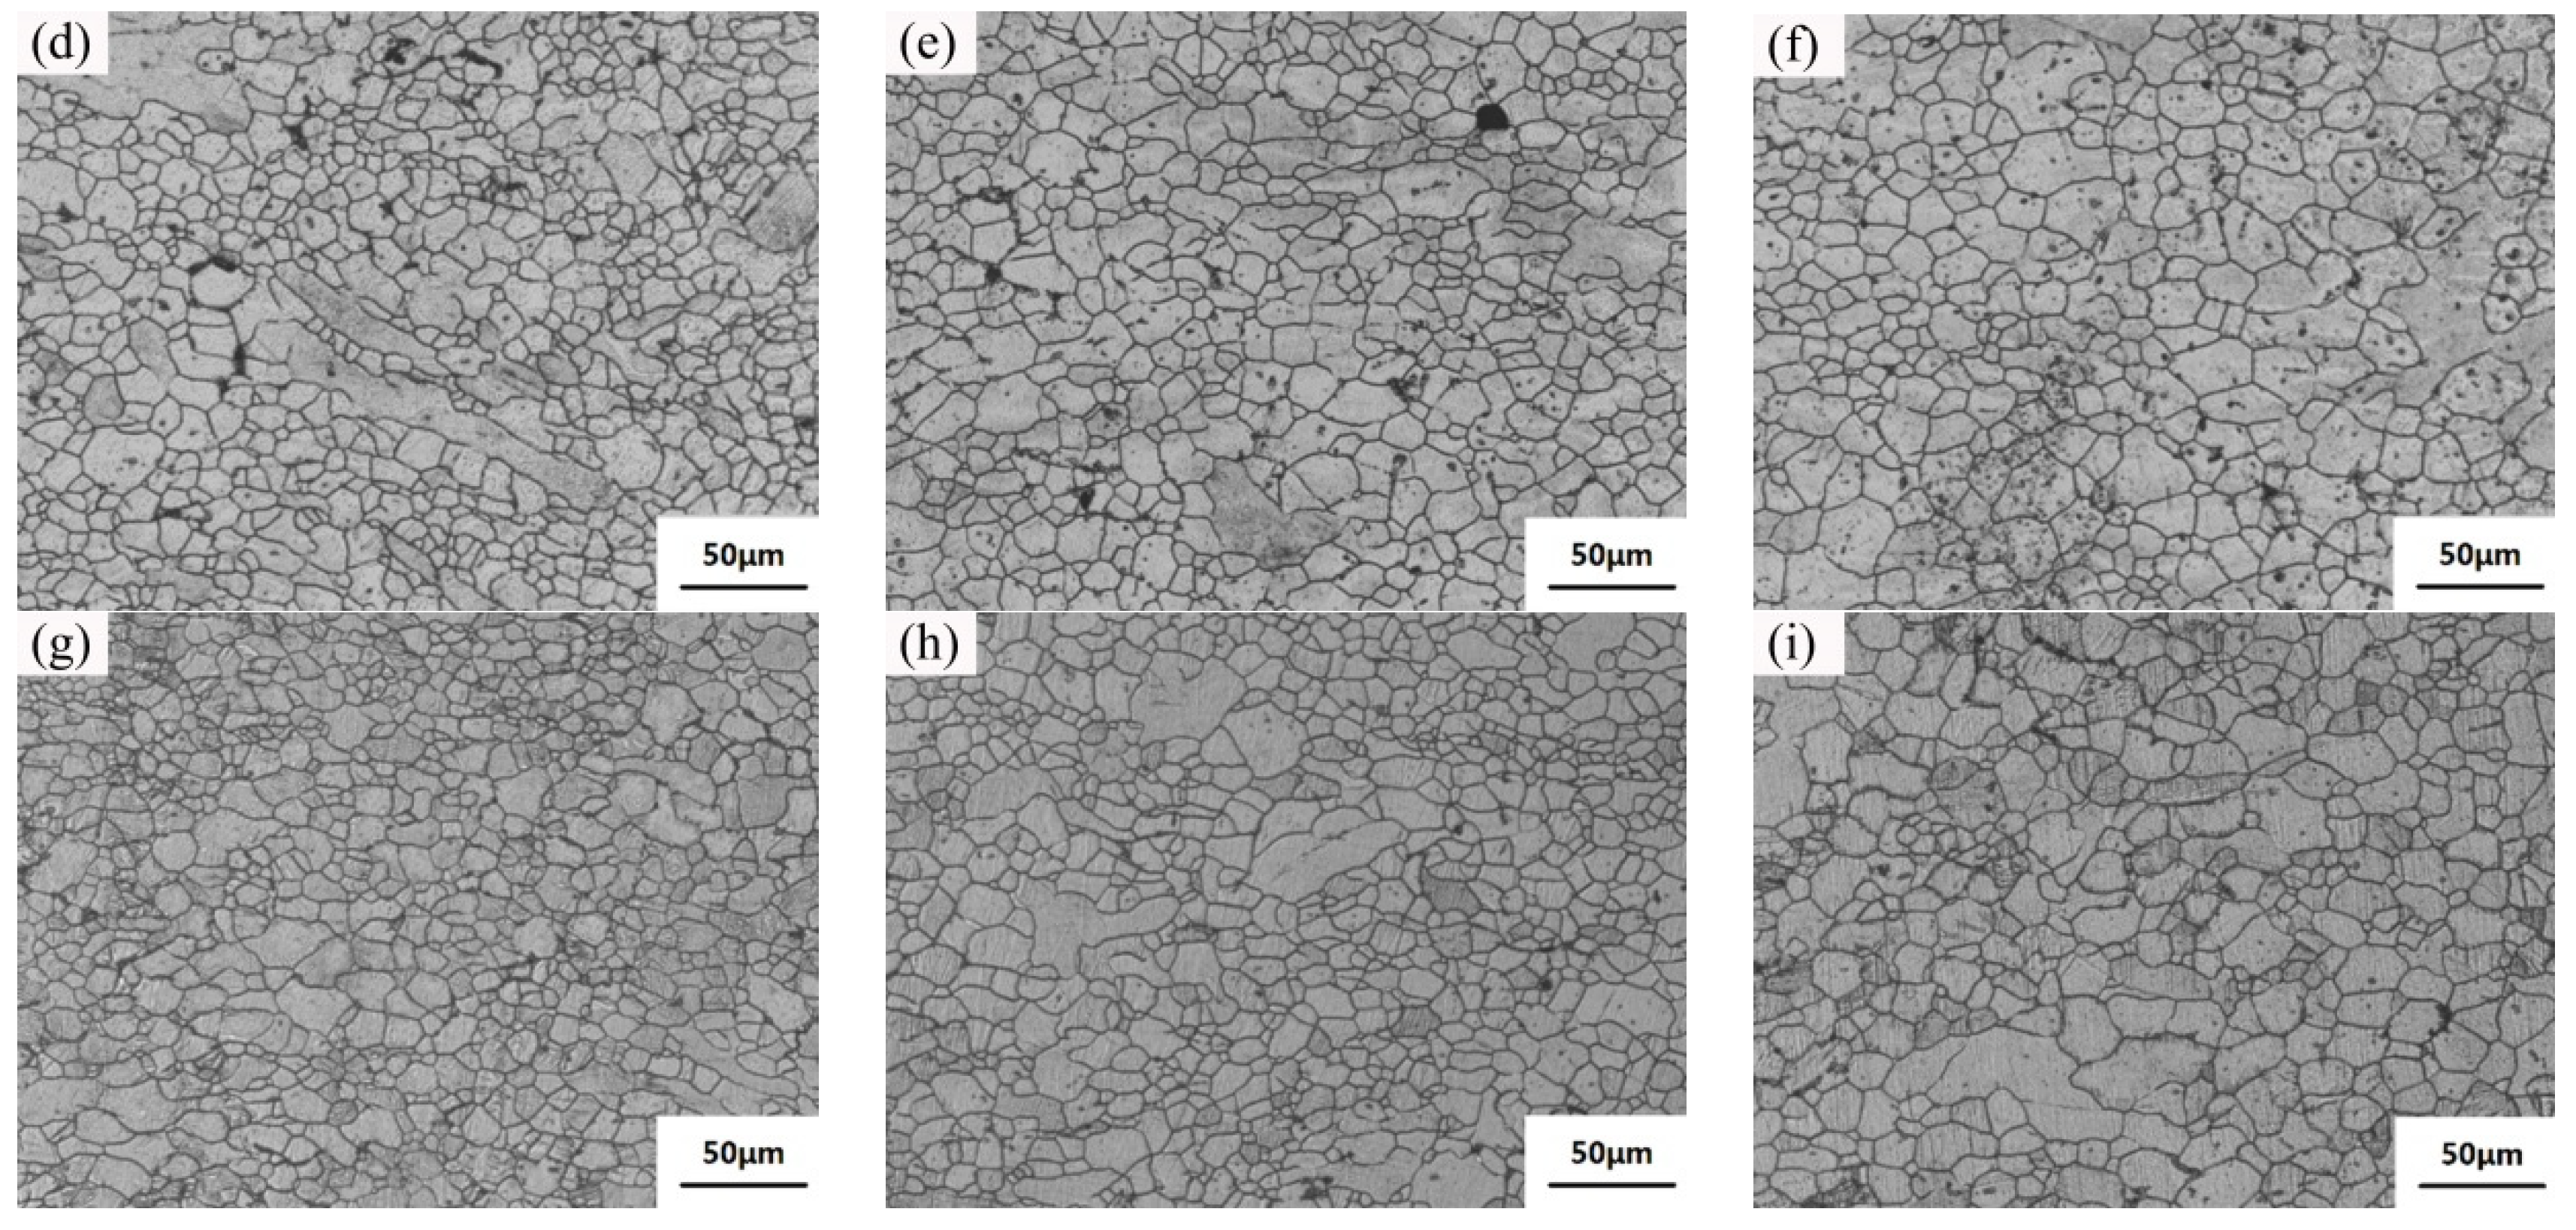
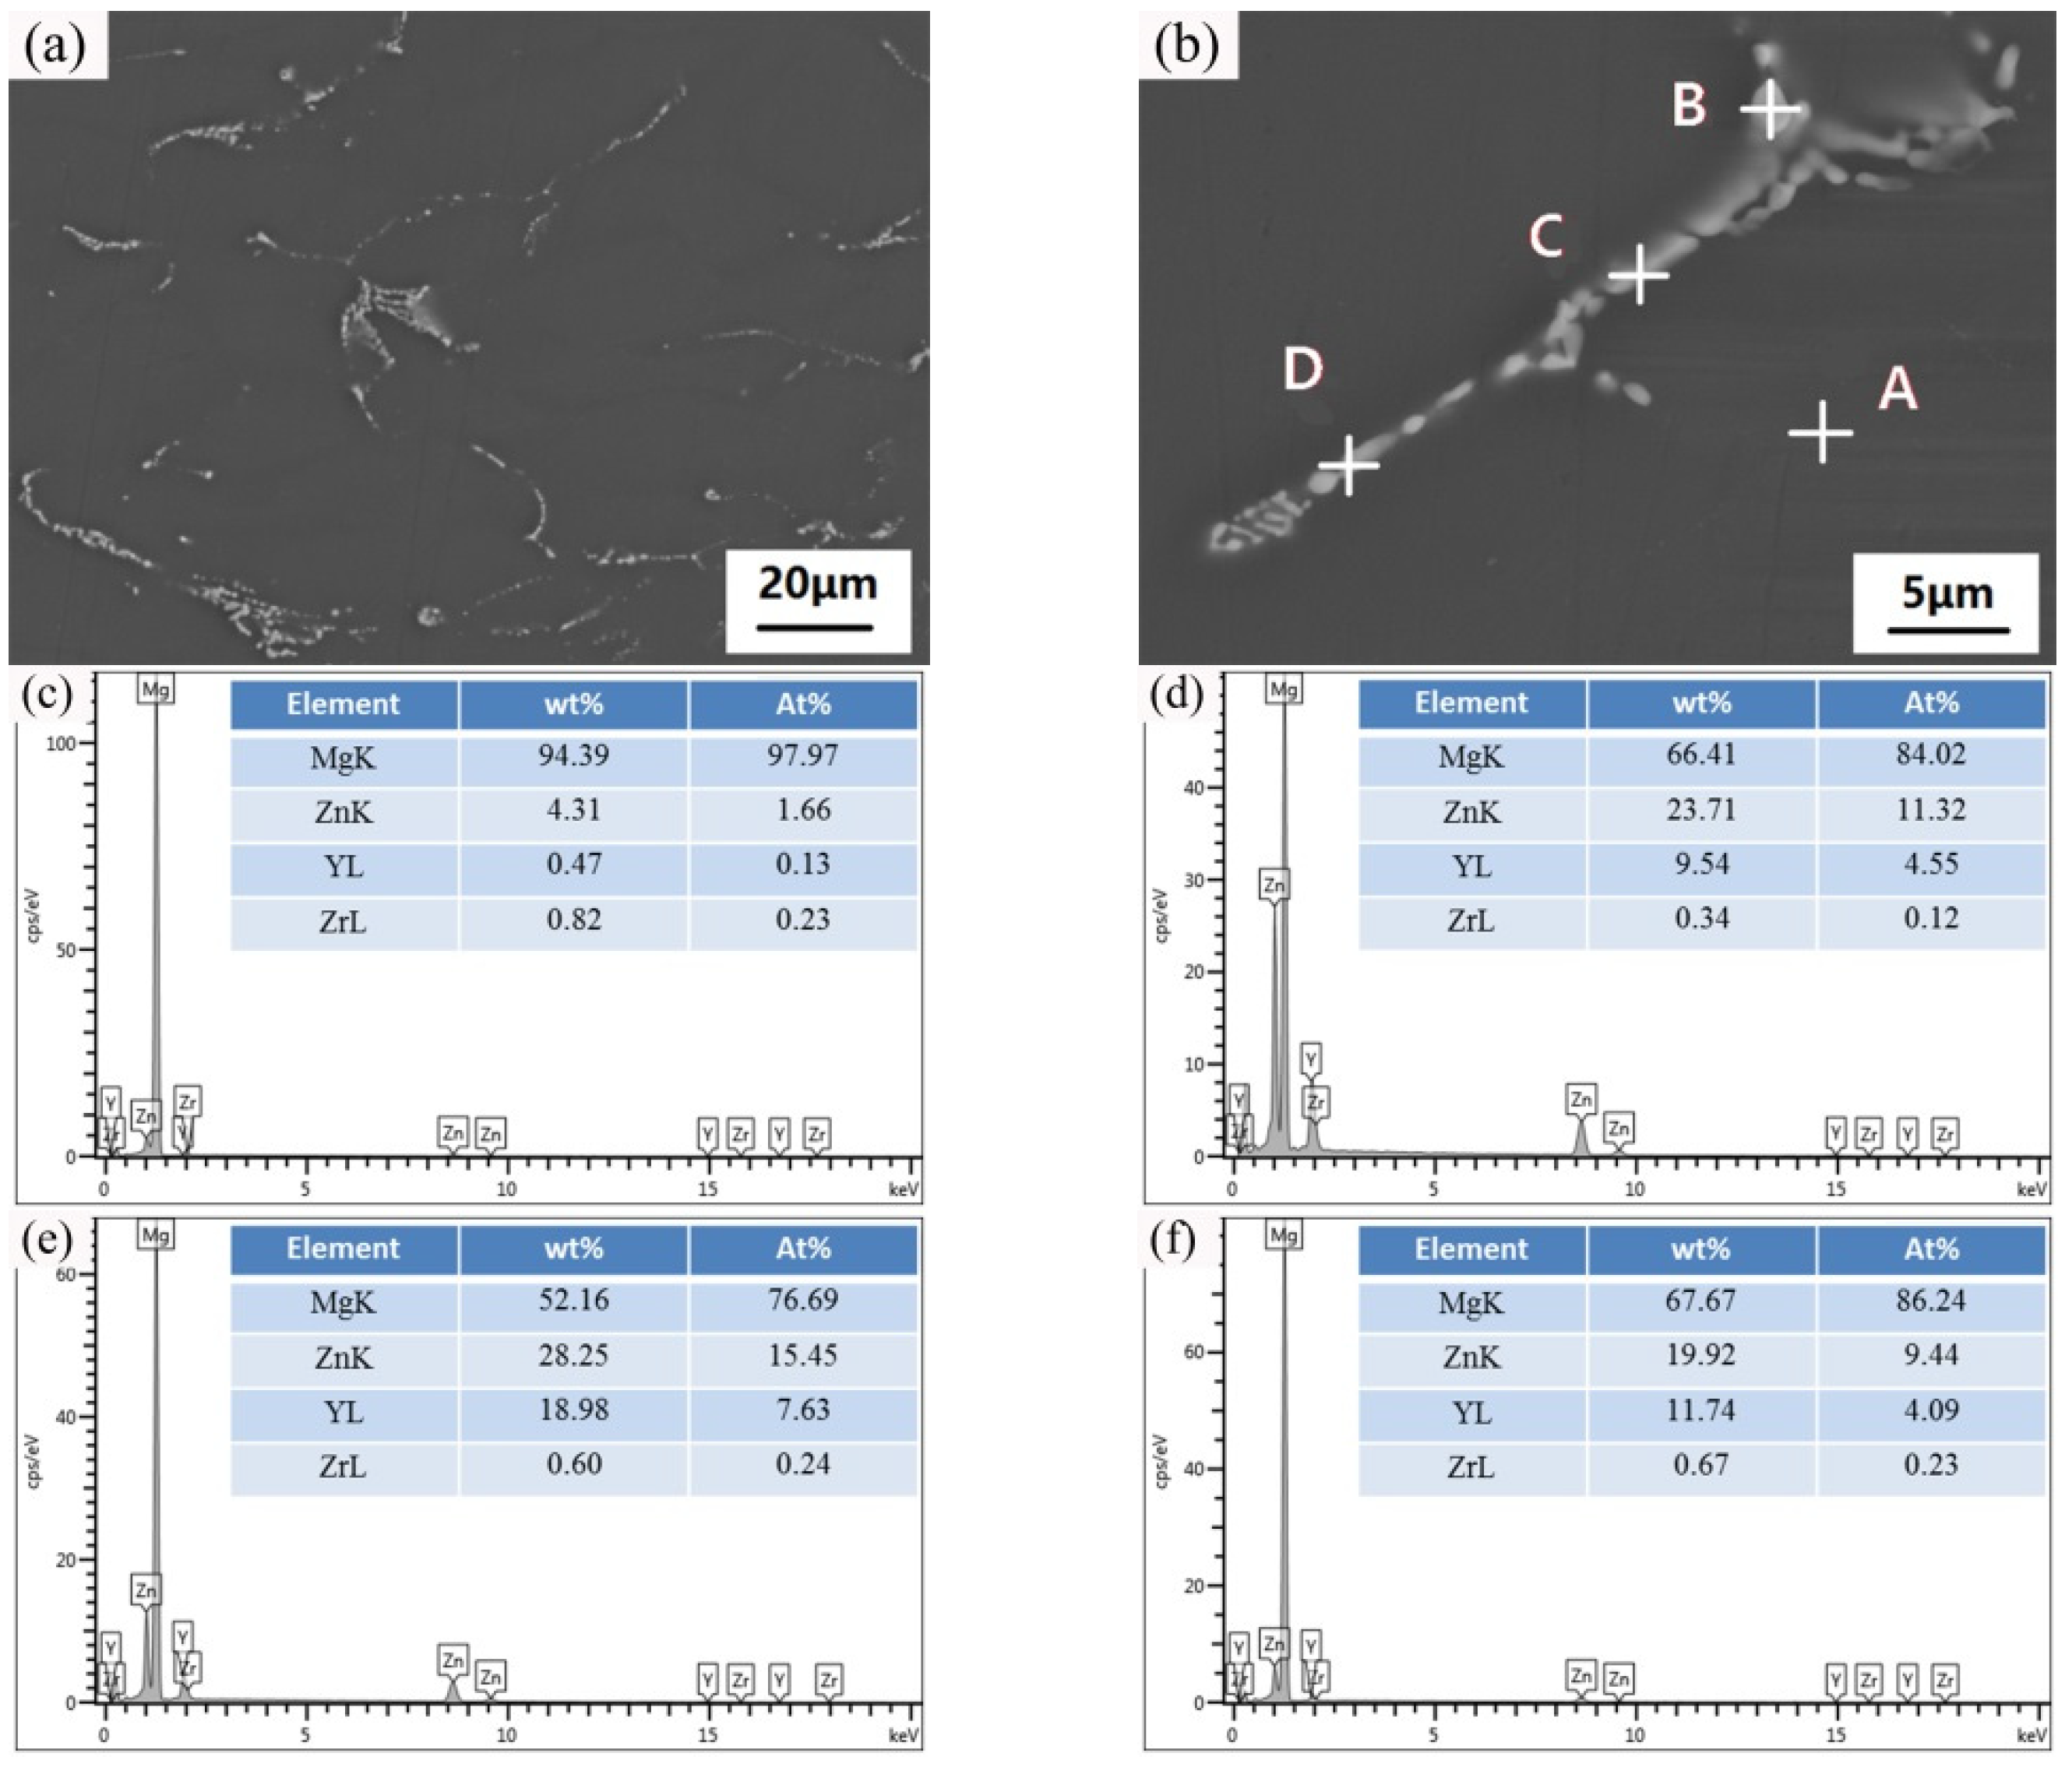
Figure 15 shows the optical microstructure of the samples after post heat treatments. The recrystallization grains increase as the solution time is prolonged at 440 °C, as shown in Figure 15a–c. However, the recrystallization is insufficient, there are amounts of deformed structures that can be observed. Figure 15e demonstrates that the recrystallization is almost complete in the samples after the heat treatment at 480 °C for 2 h. The recrystallization grains grow up and have a tendency to transform into hexagon as the solution time increases, as shown in Figure 15f. Figure 15g–i demonstrates the microstructure of the samples after post heat treatments at 520 °C for 1 h, 2 h, and 3 h, respectively. There is no deformation structure that can be observed indicating the complete recrystallization. The size of the recrystallization grain is larger than that of the samples at 440 °C and 480 °C due to the higher treatment temperature. Figure 6 shows the SEM microstructure and EDS analysis of the sample after 520 °C—1 h heat treatment. The second phases with a continuous strip-shape decompose into granular phases and have a tendency of spherification, as shown in Figure 16a,b. Figure 16c demonstrates the EDS analysis results of Mg matrix (spot A). Figure 16d–f shows the EDS analysis of spots B-D. Table 9 indicates that the Zn and Y atom ratios are 2.48, 2.02, and 2.30, respectively, which are comparable to that in W-phase. Thus, the second phases are still mainly W-phase.
The tensile properties of the samples after post heat treatments are shown in Table 10. The 520 °C—1 h sample possesses the best mechanical properties, the elongation is 25.5%, the yield stress is 125 MPa, and the ultimate tensile strength is 282 MPa. This can be attributed to the complete recrystallization and the decomposition of coarse second phases. The recrystallization grains have a small size and the uniform distribution, which is consistent with Figure 15h. The recrystallization process has a significate effect on the improvement of samples elongation through eliminating the stress concentration which forms during the tensile testing. However, the elongation of the samples has a slight decrease as the solution time increases at 520 °C. This can be ascribed to the growth of recrystallization grains and the generation of MgZn2 and Mg2Y block phase. In terms of the ultimate tensile strength, the 440 °C—1 h sample displays a perfect strength. This is mainly due to the massive deformation structure and the minor recrystallization. Then, the ultimate tensile strength of the samples decreases with the development of recrystallization, and the 480 °C—2 h sample has the lowest ultimate tensile strength. The ultimate tensile strength of the 480 °C—3 h, 520 °C—1 h, 520 °C—2 h, and 520 °C—3 h increase due to the transformation of W-phase from I-phase and the generation of MgZn2 and Mg2Y block phase.
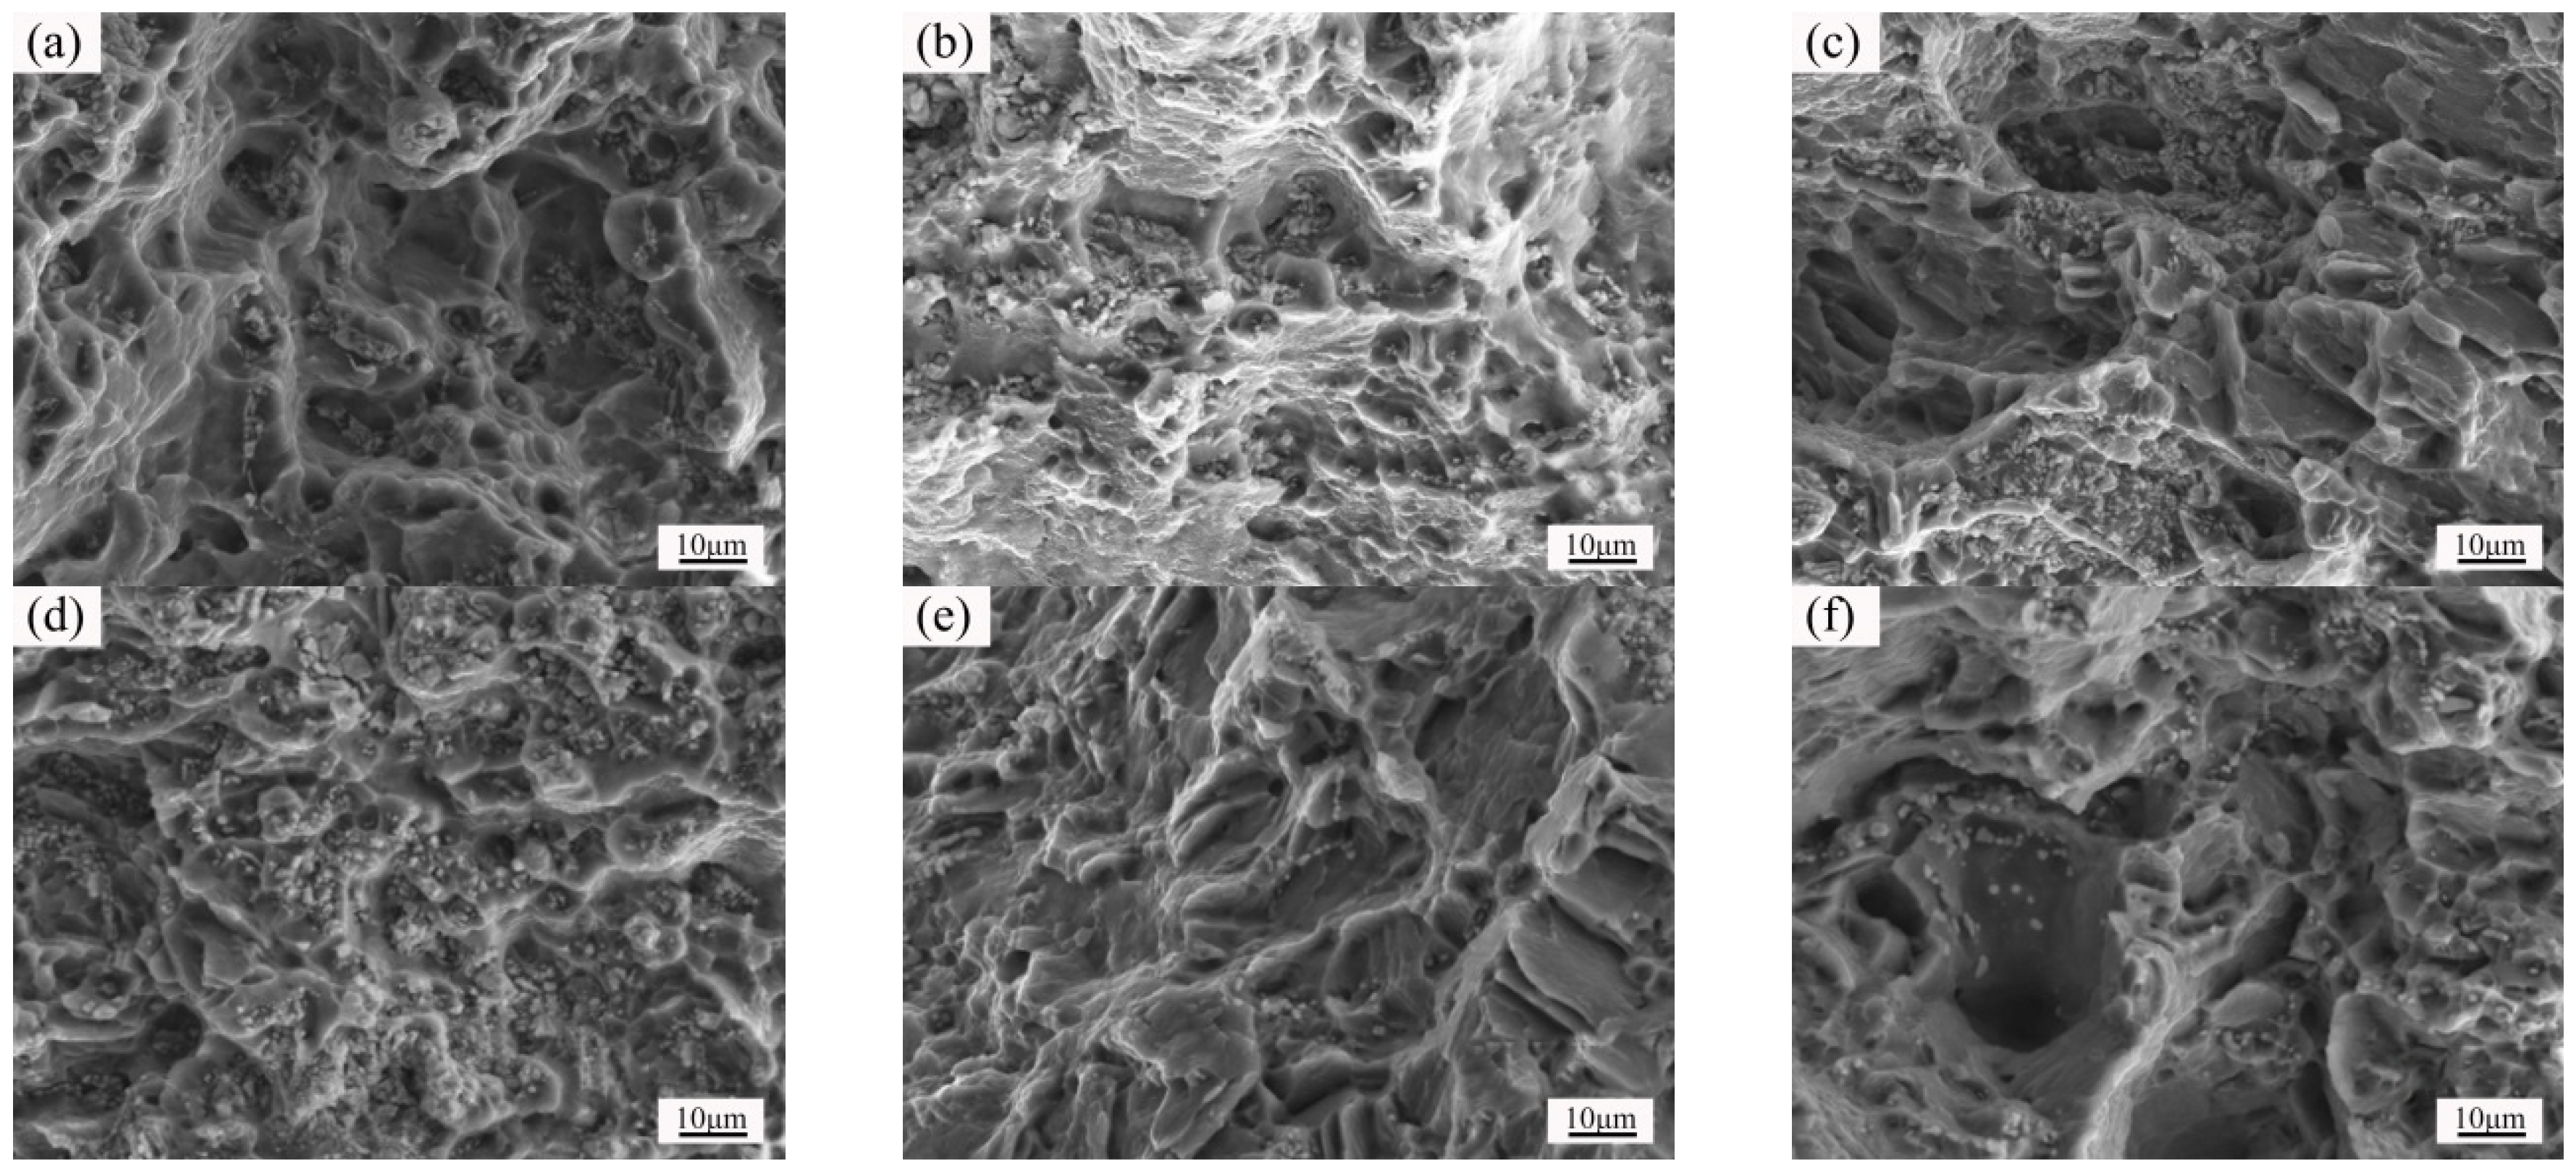
Figure 17 demonstrates the fracture morphology of the isothermal forging parts after post heat treatments. There are some river-type patterns, tearing edges, and small dimples that can be detected in all fracture morphology, as shown in Figure 17a–i, which indicates that the fracture of the samples after post heat treatments is the typical quasi-cleavage fracture. Meanwhile, more granular phases can be observed as the solution temperature and time increase. This may be ascribed to the granular phases decomposed from the strip-shaped second phases and the solution of Zn and Y elements into the grains.

3.5. Strengthening Mechanism of the Isothermal Forging Process

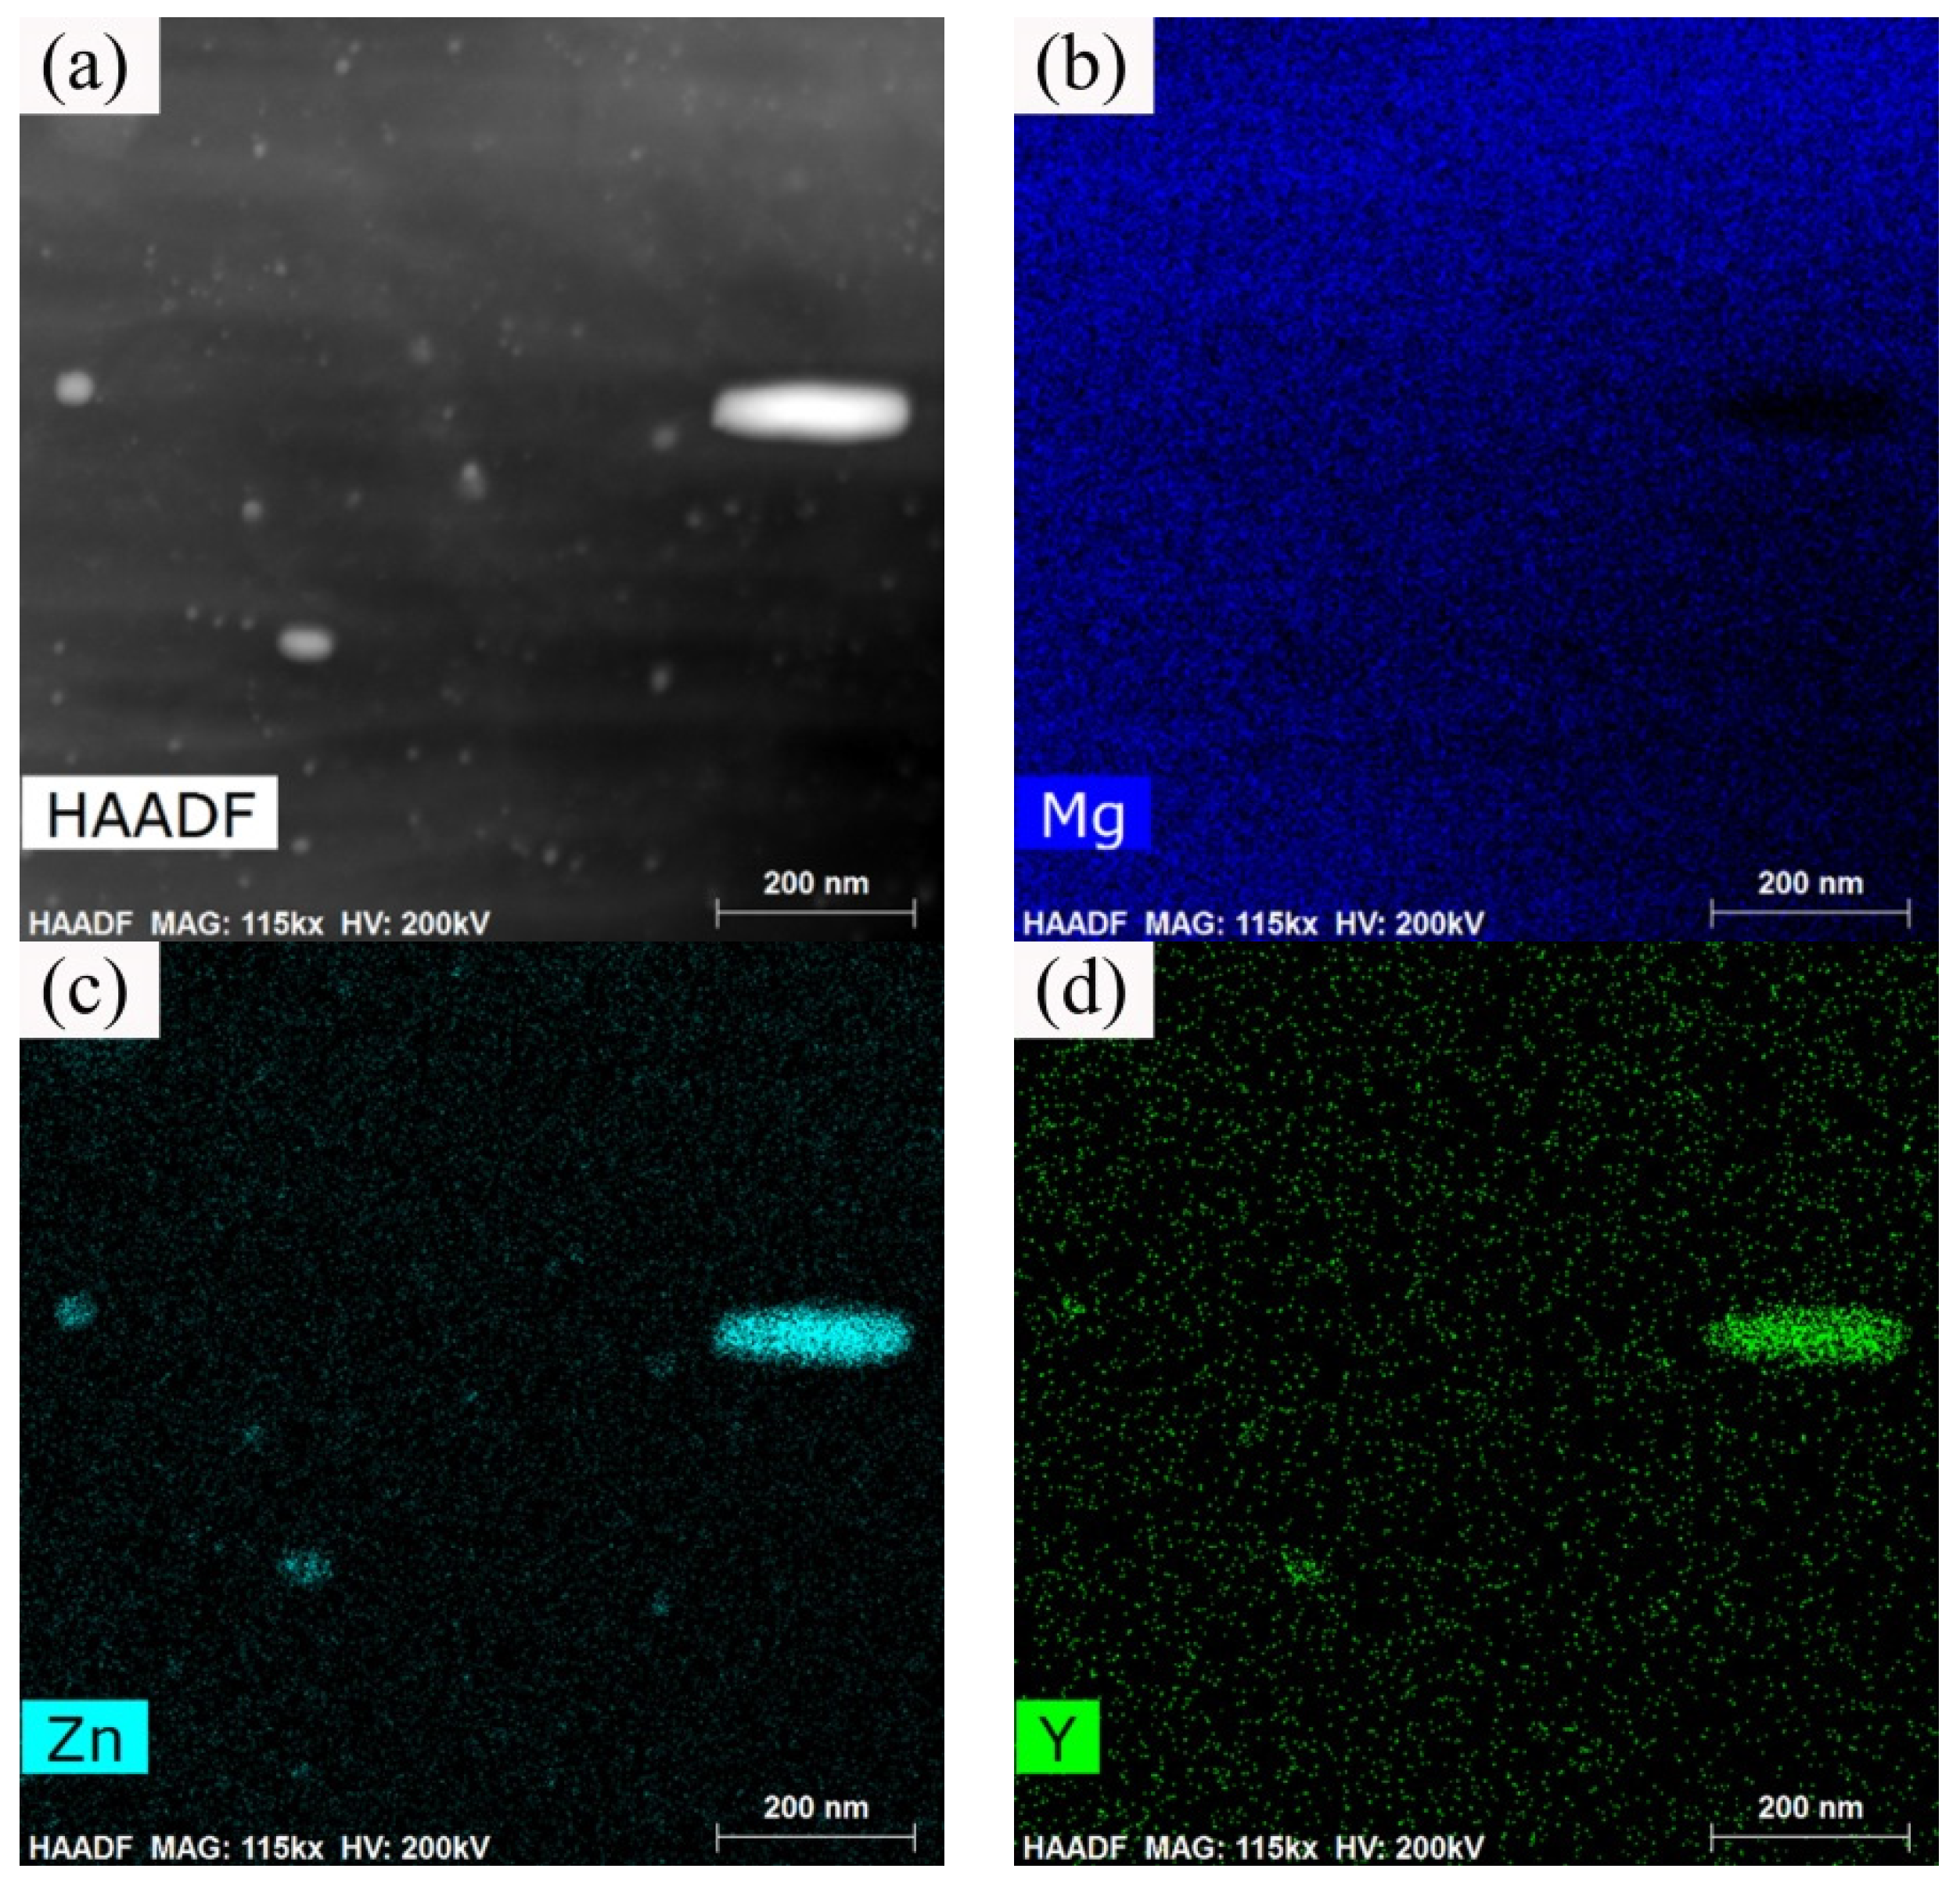
Figure 18 shows the high-angle annular dark field (HAADF) images and EDS analysis of Mg-1YL isothermal forged at 380 °C. There are a lot of little precipitate phases with the dimensions of 5 nm–10 nm that can be observed, as shown in Figure 18a. The EDS analysis results demonstrate that these precipitate phases mainly contain Mg and Zn elements, which indicates that these precipitate phases are Mg-Zn binary phases. These precipitate phases dispersed in the grains enhance the resistance of dislocation slip and improve the alloy strength through dispersion strengthening. Meanwhile, there are some Mg-Zn-Y ternary granular phases with the dimensions of 40 nm–200 nm that can be observed, which is also beneficial to the alloy strength.
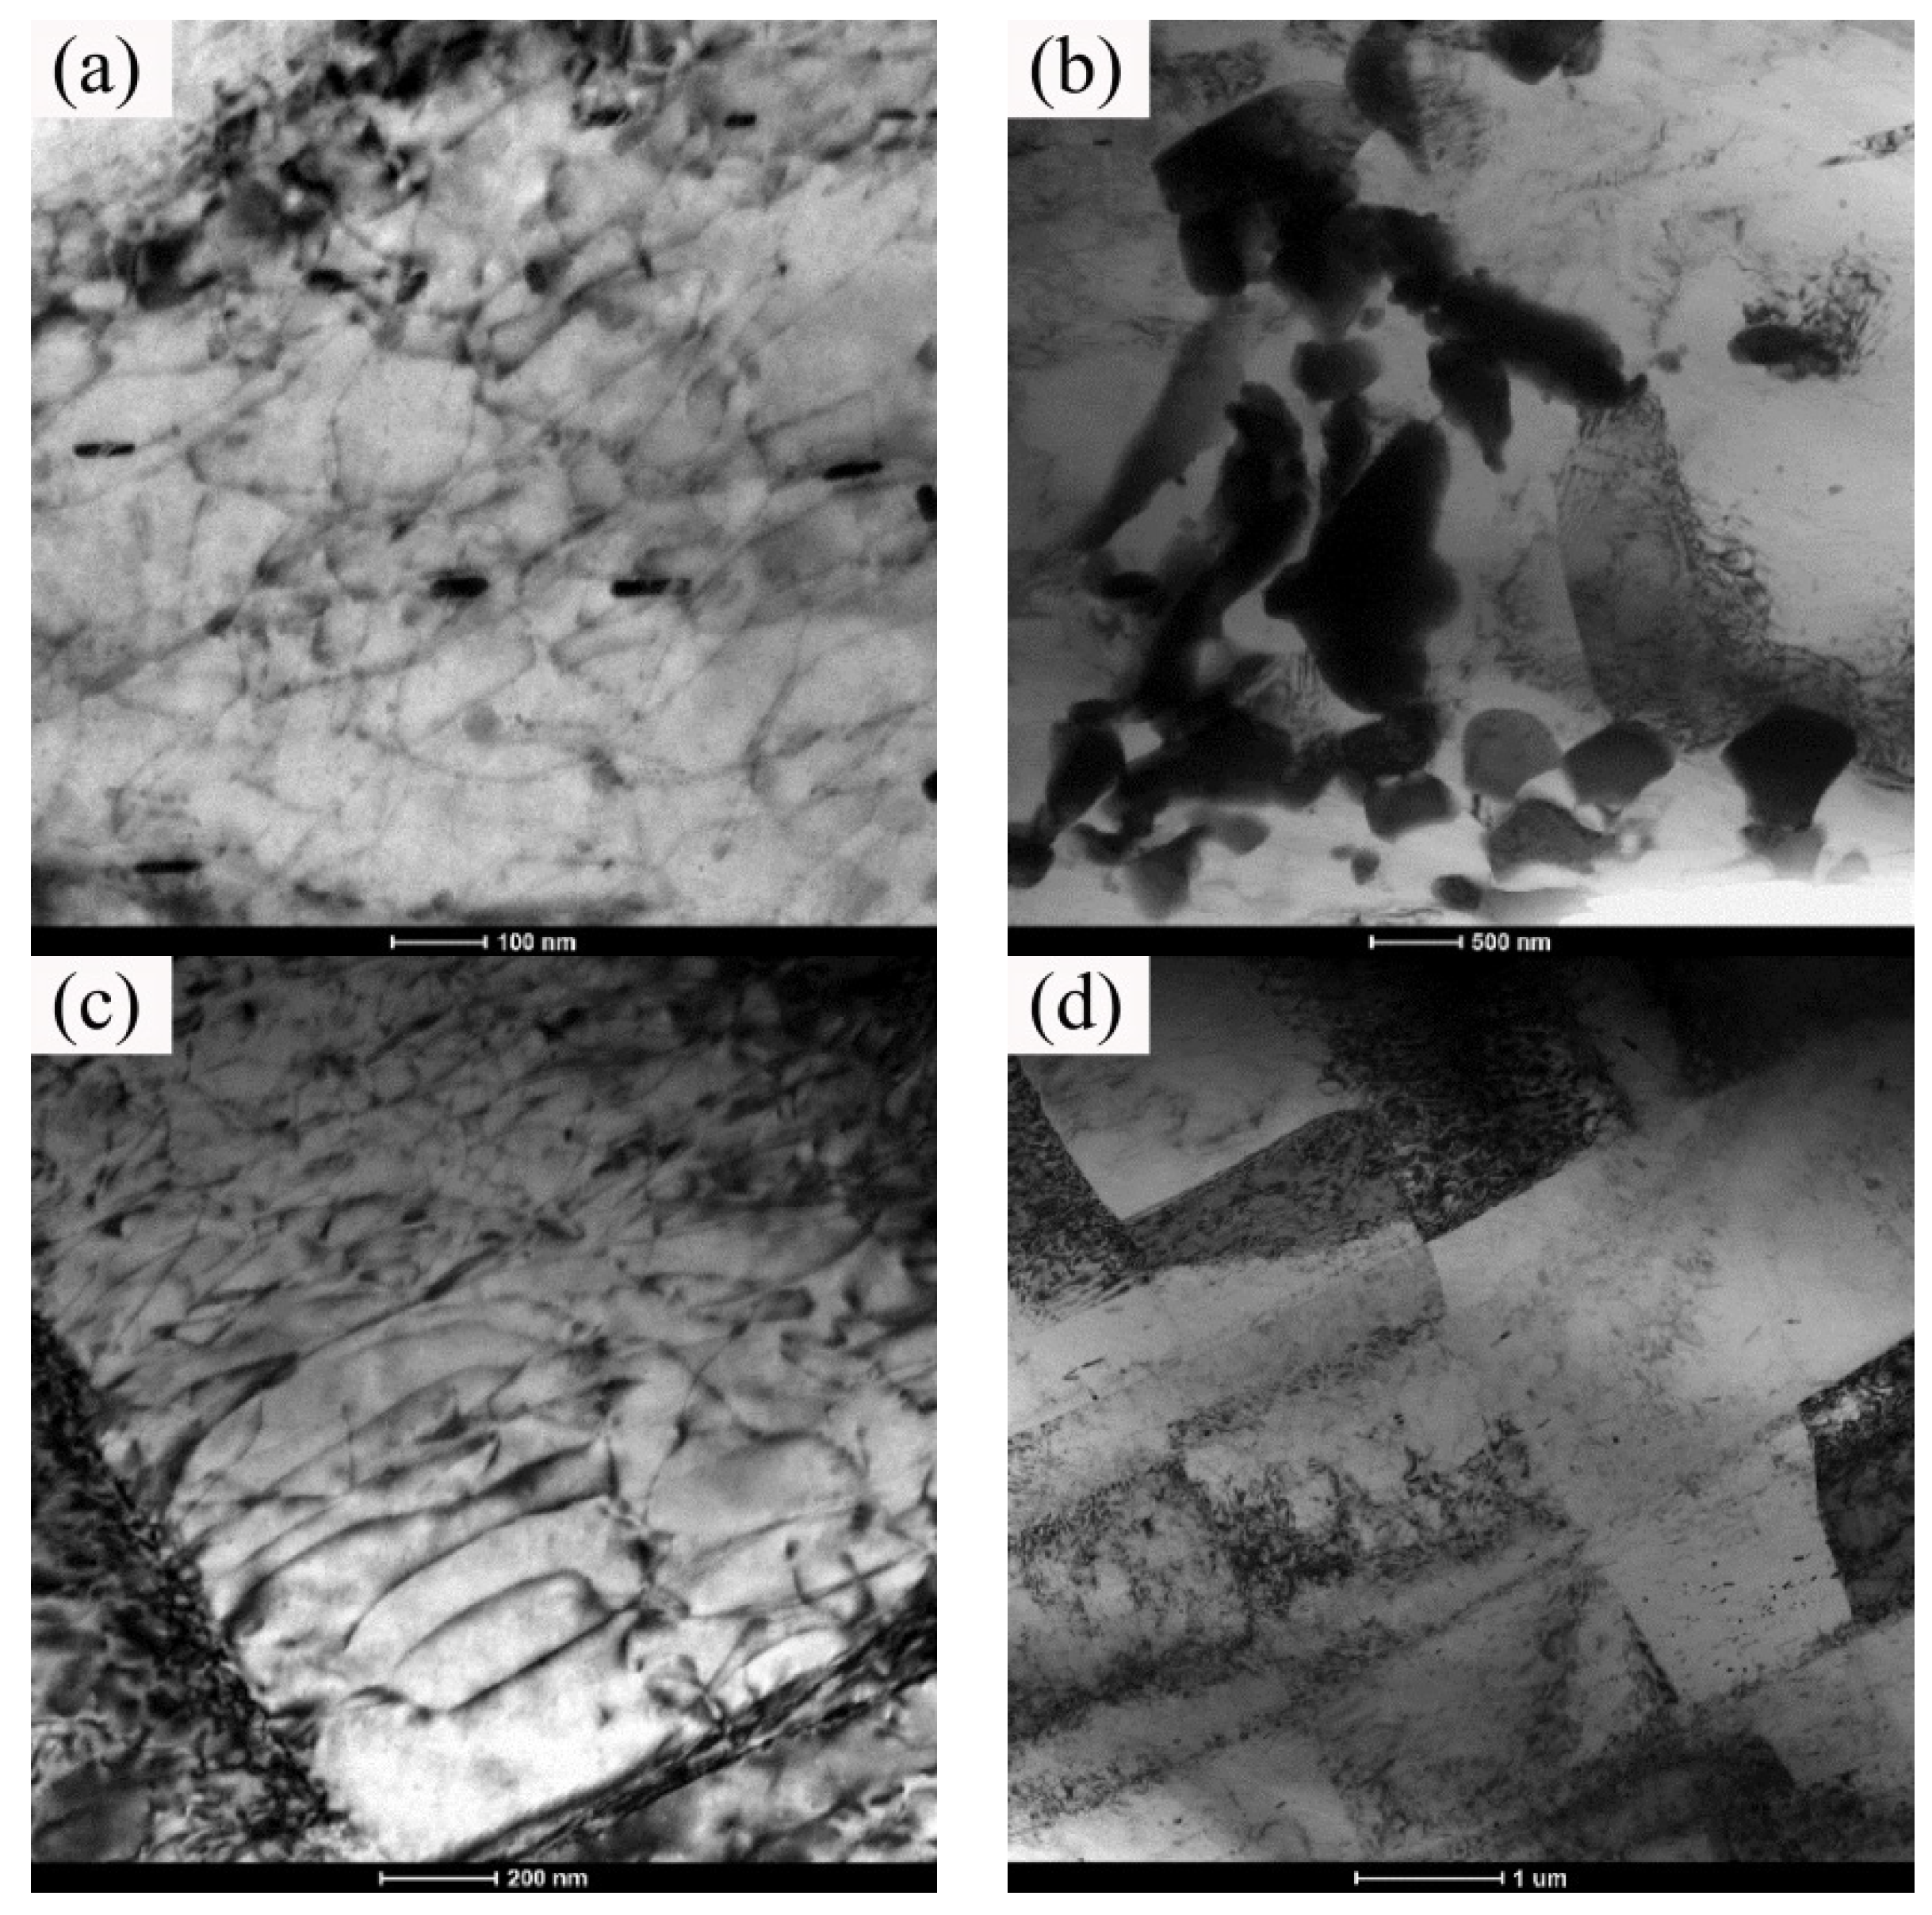
Figure 19 shows the TEM bright field images of Mg-1YL isothermal forged at 380 °C. The second phases cut through by the dislocations can be observed in Figure 19a. An elastic stress field generates around the second phases when the dislocations cut through the second phases due to the specific volume difference between the second phase and matrix. Additionally, the interaction between the stress filed and the dislocations will facilitate the alloy strength. The dislocation pile-up around the second phases can be observed in Figure 19b. During the isothermal forging process, the block second phases are broken into granular phases, which will hinder the basal and nonbasal dislocation slip effectively. The decomposition of the block second phases will also increase the fraction of the particles and decrease the distance between particles, as the Orowan mechanism illustrates, which will enhance the alloy strength.
The matrix with dense dislocations and the tangles, curls, and pilling between dislocations can be observed, as shown in Figure 19c,d. Meanwhile, the dislocations intersect with each other, which will enhance the resistance of dislocation slip. On the other hand, the work hardening capacity of Mg alloy increases due to the addition of Y-element. This can be illustrated using the Hollomon equation [34] as follows:
S = Ken
where S is the true stress, e is the true strain, n is the strain hardening exponent, and K is the work hardening coefficient, respectively. The strain hardening exponent (n) increases with the decrease of stacking fault energy. This can be attributed to the fact that the dislocation cross-slip is difficult with low stacking fault energy, and thus the stress concentration is inclined to form around the dispersed second phases. The addition of Y-element will reduce the stacking fault energy, which is beneficial to the alloy properties.

4. Conclusions

  • The undercooling of liquid alloy increased due to the application of pressure during the liquid forging process, which refined the grains and prevented the dendrites formation. The Mg-1YL displayed the best properties with the elongation of 16.0%, the yield stress of 104 MPa, and the ultimate tensile strength of 232 MPa. The constitutional undercooling increased as the Y-element increased, which would facilitate dendrites growth. The formation order of the second phase was I-phase (Mg3Zn6Y) → W-phase (Mg3Zn3Y2) → Z-phase (Mg12ZnY) with the increasing of the Y-element content. Meanwhile, the I-phase and Z-phase formed in the liquid forging process were beneficial to the grain refinement.
  • The numerical simulation results indicated that the effective stress decreased and the temperature increased as the forming temperatures were elevated during the isothermal forging process. The forming part forged at 380 °C displayed the outstanding properties. The elongation, yield strength, and ultimate tensile strength were 18.5%, 150 MPa and 315 MPa, respectively. The DRX, second-phase hardening, and work hardening were the reasons for the properties improvement after the isothermal forging process.
  • The elongation increased and the strength decreased after heat treatments for the forming parts. This can be ascribed to the recrystallization, the weakening of pinning effect of second phases, and the elimination of working hardening. Meanwhile, the second phase transformation (I-phase → W-phase → Mg2Y + MgZn2), dissolution, and decomposition can be detected, as well. The 520 °C—1 h sample possessed the superior mechanical properties, in which the elongation was 25.5%, the yield stress was 125 MPa, and the ultimate tensile strength was 282 MPa.

Author Contributions

Conceptualization, H.Z. and Z.D.; methodology, Y.Q.; software, H.W.; validation, Y.Q., H.Z., and Z.D.; formal analysis, L.C. (Lili Chen); investigation, G.C. and H.W.; resources, Z.D.; data curation, G.C.; writing—original draft preparation, Y.Q.; writing—review and editing, Y.Q.; visualization, H.W.; supervision, L.C. (Lihua Chen); project administration, L.C. (Lili Chen); funding acquisition, H.Z. All authors have read and agreed to the published version of the manuscript.

Funding

This research was funded by the National Natural Science Foundation of China, grant number 51875121 and Natural Science Foundation of Shandong Province, grant number ZR2019MEE039.

Conflicts of Interest

The authors declare no conflict of interest.

References

  1. Kim, Y.J.; Kim, S.H.; Lee, J.U.; Choi, J.O.; Kim, H.S.; Kim, Y.M.; Kim, Y.; Park, S.H. Effects of cold pre-forging on microstructure and tensile properties of extruded AZ80 alloy. Mater. Sci. Eng. A 2017, 708, 405–410. [Google Scholar] [CrossRef]
  2. Pan, H.C.; Ren, Y.P.; Fu, H.; Zhao, H.; Wang, L.Q.; Meng, X.Y.; Qin, G.W. Recent developments in rare-earth free wrought magnesium alloys having high strength: A review. J. Alloy Compd. 2016, 663, 321–331. [Google Scholar] [CrossRef]
  3. Meng, S.; Yu, H.; Zhou, J.; Han, H.; Li, Y.; Dong, L.; Nan, X.; Li, Z.; Shin, K.S.; Zhao, W. Enhancing the Mechanical Properties of AZ80 Alloy by Combining Extrusion and Three Pass Calibre Rolling. Metals 2020, 10, 249. [Google Scholar] [CrossRef] [Green Version]
  4. Meng, X.R.; Wu, R.Z.; Zhang, M.L.; Wu, L.B.; Cui, C.L. Microstructures and properties of superlight Mg-Li-Al-Zn wrought alloys. J. Alloy Compd. 2009, 486, 722–725. [Google Scholar] [CrossRef]
  5. Zhang, Z.Q.; Liu, X.; Wang, Z.K.; Le, Q.C.; Hu, W.Y.; Bao, L.; Cui, J.Z. Effects of phase composition and content on the microstructures and mechanical properties of high strength Mg-Y-Zn-Zr alloys. Mater. Des. 2015, 88, 915–923. [Google Scholar] [CrossRef]
  6. Liu, H.; Huang, H.; Sun, J.P.; Wang, C.; Bai, J.; Ma, A.B.; Chen, X.H. Microstructure and Mechanical Properties of Mg–RE–TM Cast Alloys Containing Long Period Stacking Ordered Phases: A Review. Acta Metall. Sin. (Engl. Lett.) 2018, 32, 269–285. [Google Scholar] [CrossRef] [Green Version]
  7. Liu, K.; Meng, J.A. Microstructures and mechanical properties of the extruded Mg-4Y-2Gd-xZn-0.4Zr alloys. J. Alloy Compd. 2011, 509, 3299–3305. [Google Scholar] [CrossRef]
  8. Wu, C.M.L.; Yu, D.Q.; Law, C.M.T.; Wang, L. Properties of lead-free solder alloys with rare earth element additions. Mater. Sci. Eng. R 2004, 44, 1–44. [Google Scholar] [CrossRef]
  9. Zhu, Y.M.; Morton, A.J.; Nie, J.F. The 18R and 14H long-period stacking ordered structures in Mg-Y-Zn alloys. Acta Mater. 2010, 58, 2936–2947. [Google Scholar] [CrossRef]
  10. Li, B.; Teng, B.G.; Xu, W.C. Hot Deformation Characterization of Homogenized Mg-Gd-Y-Zn-Zr Alloy during Isothermal Compression. JOM 2019, 71, 4059–4070. [Google Scholar] [CrossRef]
  11. Kishida, K.; Nagai, K.; Matsumoto, A.; Yasuhara, A.; Inui, H. Crystal structures of highly-ordered long-period stacking-ordered phases with 18R, 14H and 10H-type stacking sequences in the Mg-Zn-Y system. Acta Mater. 2015, 99, 228–239. [Google Scholar] [CrossRef]
  12. Takagi, K.; Yamasaki, M.; Mine, Y.; Takashima, K. Temperature dependence of prismatic slip in a single-crystalline long-period stacking ordered Mg–Zn–Y alloy. Scr. Mater. 2020, 178, 498–502. [Google Scholar] [CrossRef]
  13. Mehrabi-Mehdiabadi, M.; Mahmudi, R. Effects of yttrium addition on microstructural stability and elevated temperature mechanical properties of a cast Mg-Zn alloy. J. Alloy Compd. 2020, 820, 153083. [Google Scholar] [CrossRef]
  14. Wu, J.; Ikeda, K.; Shi, Q.; Chiu, Y.L. Kink boundaries and their role in dynamic recrystallisation of a Mg-Zn-Y alloy. Mater. Charact. 2019, 148, 233–242. [Google Scholar] [CrossRef] [Green Version]
  15. Chen, Q.; Xia, X.S.; Yuan, B.G.; Shu, D.Y.; Zhao, Z.D.; Han, J.C. Hot workfability behavior of as-cast Mg-Zn-Y-Zr alloy. Mater. Sci. Eng. A 2014, 593, 38–47. [Google Scholar] [CrossRef]
  16. Luo, Z.P.; Sui, H.X.; Zhang, S.Q. On the stable Mg-Zn-Y quasicrystals. Metall. Mater. Trans. A 1996, 27, 1779–1784. [Google Scholar] [CrossRef]
  17. Bae, D.H.; Lee, M.H.; Kim, K.T.; Kim, W.T.; Kim, D.H. Application of quasicrystalline particles as a strengthening phase in Mg-Zn-Y alloys. J. Alloy Compd. 2002, 342, 445–450. [Google Scholar] [CrossRef]
  18. Li, C.Q.; Xu, D.K.; Zeng, Z.R.; Wang, B.J.; Sheng, L.Y.; Chen, X.B.; Han, E.H. Effect of volume fraction of LPSO phases on corrosion and mechanical properties of Mg-Zn-Y alloys. Mater. Des. 2017, 121, 430–441. [Google Scholar] [CrossRef]
  19. Xu, C.; Nakata, T.; Qiao, X.G.; Zheng, M.Y.; Wu, K.; Kamado, S. Effect of LPSO and SFs on microstructure evolution and mechanical properties of Mg-Gd-Y-Zn-Zr alloy. Sci. Rep. 2017, 7, 40846. [Google Scholar] [CrossRef]
  20. Liu, X.Q.; Zhao, D.S.; Ye, L.; Zhuang, Y.L.; Gao, S.B.; Wang, J.B. Effect of Er contents on the microstructure of long period stacking ordered phase and the corresponding mechanical properties in Mg-Dy-Er-Zn alloys. Mater. Sci. Eng. A 2018, 718, 461–467. [Google Scholar] [CrossRef]
  21. Kim, W.J.; Hwang, B.G.; Lee, M.J.; Park, Y.B. Effect of speed-ratio on microstructure, and mechanical properties of Mg-3Al-1Zn alloy, in differential speed rolling. J. Alloys Compd. 2011, 509, 8510–8517. [Google Scholar] [CrossRef]
  22. Li, B.; Teng, B.G.; Luo, D.G. Effects of Passes on Microstructure Evolution and Mechanical Properties of Mg-Gd-Y-Zn-Zr Alloy during Multidirectional Forging. Acta Metall. Sin. (Engl. Lett.) 2018, 31, 1009–1018. [Google Scholar] [CrossRef] [Green Version]
  23. Zhang, C.C.; Wang, C.; Zha, M.; Wang, H.Y.; Yang, Z.Z.; Jiang, Q.C. Microstructure and tensile properties of rolled Mg-4Al-2Sn-1Zn alloy with pre-rolling deformation. Mater. Sci. Eng. A 2018, 719, 132–139. [Google Scholar] [CrossRef]
  24. Inao, D.; Mori, A.; Tanaka, S.; Hokamoto, K. Explosive Welding of Thin Aluminum Plate onto Magnesium Alloy Plate Using a Gelatin Layer as a Pressure-Transmitting Medium. Metals 2020, 10, 106. [Google Scholar] [CrossRef] [Green Version]
  25. Minárik, P.; Veselý, J.; Král, R.; Bohlen, J.; Kubásek, J.; Janeček, M.; Stráská, J. Exceptional mechanical properties of ultra-fine grain Mg-4Y-3RE alloy processed by ECAP. Mater. Sci. Eng. A 2017, 708, 193–198. [Google Scholar] [CrossRef]
  26. Verma, R.; Jayaganthan, R.; Nath, S.K.; Srinivasan, A. Effect of multiaxial forging followed by hot rolling on non-basal planes and its influence on tensile and fracture toughness behaviour of Mg–4Zn–4Gd alloy. Mater. Sci. Eng. A 2020, 774, 138890. [Google Scholar] [CrossRef]
  27. Li, N.; Xing, S.M.; Bao, P.W. Microstructure and Mechanical Properties of Nodular Cast Iron Produced by Melted Metal Die Forging Process. J. Iron Steel Res. Int. 2013, 20, 58–62. [Google Scholar] [CrossRef]
  28. Wang, D.Y.; Du, L.J.; Liu, Y.W.; Qi, Y.S.; Du, Z.M. Effects of variable-cavity liquid forging on microstructure and mechanical properties of Mg-Zn-Y-Zr alloy. Mater. Charact. 2019, 151, 96–102. [Google Scholar] [CrossRef]
  29. Qi, Y.; Chen, L.; Chen, G.; Li, K.; Li, C.; Du, Z. Preparation and Properties of Special Vehicle Cover via a Novel Squeeze Casting Quantitative Feeding System of Molten Metal. Metals 2020, 10, 266. [Google Scholar] [CrossRef] [Green Version]
  30. Chen, G.; Chang, X.; Zhang, J.; Jin, Y.; Sun, C.; Chen, Q.; Zhao, Z. Microstructures and Mechanical Properties of In-Situ Al3Ti/2024 Aluminum Matrix Composites Fabricated by Ultrasonic Treatment and Subsequent Squeeze Casting. Met. Mater. Int. 2019. [Google Scholar] [CrossRef]
  31. Fang, X.G.; Lu, S.L.; Zhao, L.; Wang, J.; Liu, L.F.; Wu, S.S. Microstructure and mechanical properties of a novel Mg-RE-Zn-Y alloy fabricated by rheo-squeeze casting. Mater. Des. 2016, 94, 353–359. [Google Scholar] [CrossRef]
  32. Wang, K.; Kopp, R.; Hirt, G. Investigation on forming defects during thixo-forging of aluminum alloy AlSi7Mg. Adv. Eng. Mater. 2006, 8, 724–730. [Google Scholar] [CrossRef]
  33. Zheng, C.K.; Zhang, W.W.; Zhang, D.T.; Li, Y.Y. Low cycle fatigue behavior of T4-treated Al-Zn-Mg-Cu alloys prepared by squeeze casting and gravity die casting. T. Nonferr. Metal. Soc. 2015, 25, 3505–3514. [Google Scholar] [CrossRef]
  34. Selin, M. Comparing Three Equations Used for Modeling the Tensile Flow Behavior of Compacted Graphite Cast Irons at Elevated Temperatures. Metall. Mater. Trans. A 2010, 41, 2805–2815. [Google Scholar] [CrossRef]
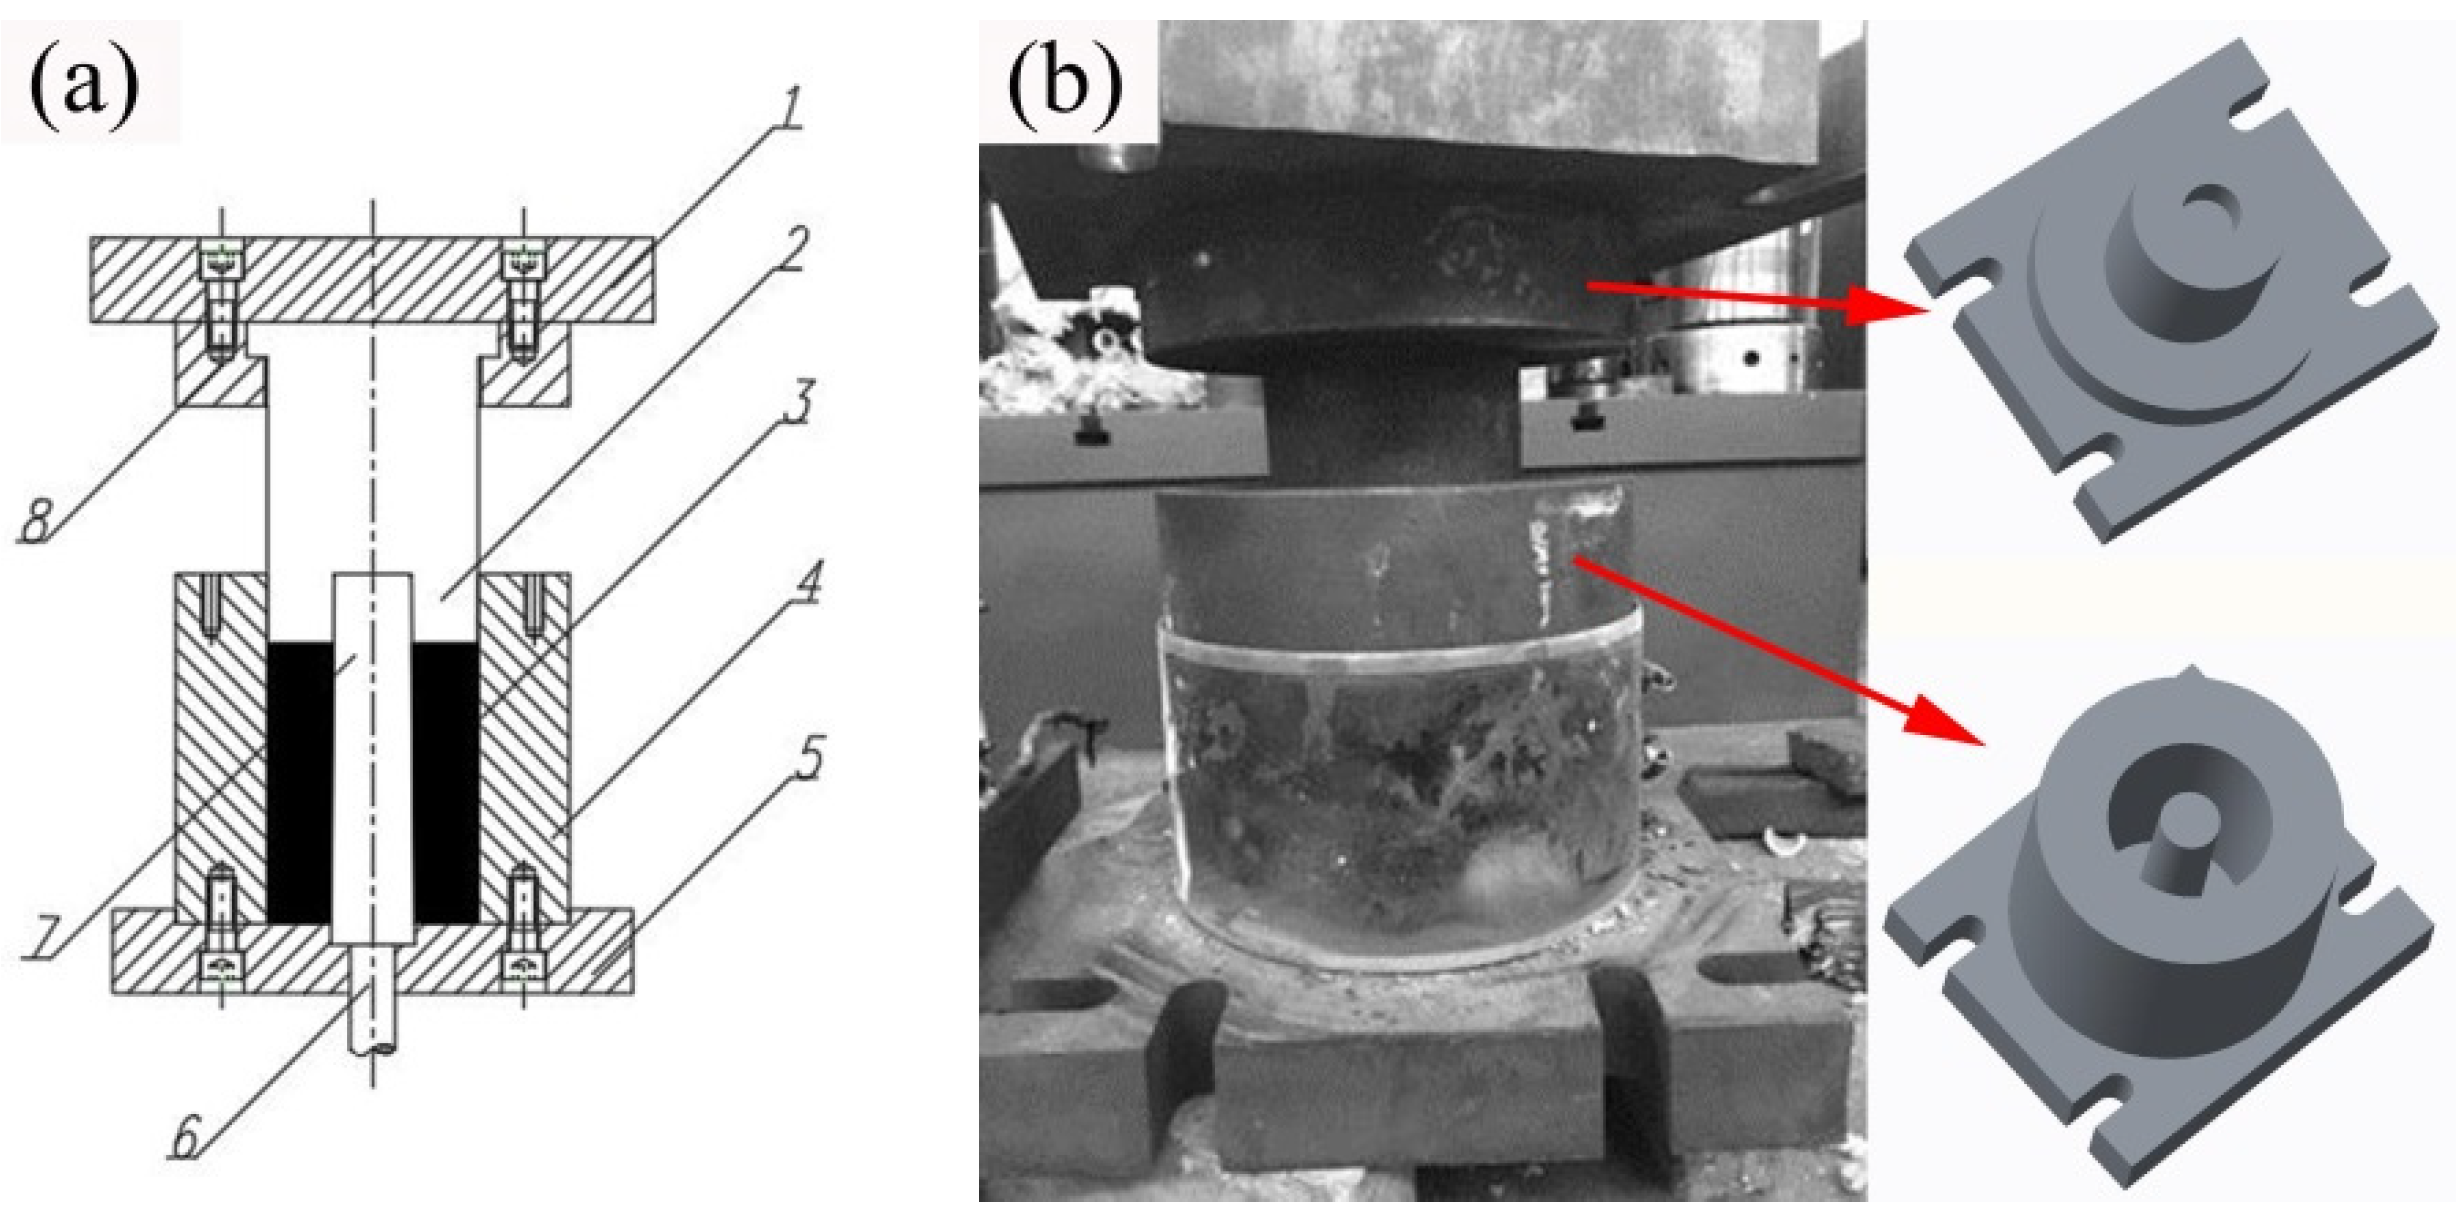
Figure 1. Schematic (a) and images (b) of the liquid forging mold; 1—upper plate, 2—punch, 3—liquid alloy, 4—lower mold, 5—lower plate, 6—ejector rod, 7—mold core, 8—upper padding plate.
Metals 10 00385 g001
Figure 2. Schematic (a) and images (b) and (c) of the isothermal forging mold; 1—upper plate, 2—lantern ring, 3—lower plate, 4—forging part.
Metals 10 00385 g002
Figure 3. The schematic and sampling positions of the tensile samples: (a) Liquid forging part, (b) isothermal forging part.
Metals 10 00385 g003
Figure 4. The optical microstructure of the gravity casting part and the liquid forging parts with different Y-element contents: (a) Mg-0YG, (b) Mg-0YL, (c) Mg-1YL, (d) Mg-2YL, (e) Mg-3YL, (f) Mg-4YL.
Metals 10 00385 g004
Figure 5. The image and SEM microstructure of the liquid forging parts with different Y-element contents: (a) Parts image, (b) Mg-0YL, (c) Mg-1YL, (d) Mg-2YL, (e) Mg-3YL, (f) Mg-4YL.
Metals 10 00385 g005
Figure 6. XRD patterns of the liquid forging parts with different Y-element contents: (a) Mg-0YL, (b) Mg-1YL, (c) Mg-2YL, (d) Mg-3YL, (e) Mg-4YL.
Metals 10 00385 g006
Figure 7. (a) SEM microstructure and EDS analysis of Mg-1YL: (b) Spot A, (c) Spot B, (d) Spot C.
Metals 10 00385 g007
Figure 8. Fracture morphology of the tensile samples with different yttrium contents of: (a) Mg-0YL, (b) Mg-1YL, (c) Mg-2YL, (d) Mg-3YL, (e) Mg-4YL.
Metals 10 00385 g008
Figure 9. Stress distributions of the forming parts at different temperatures of: (a) 320 °C, (b) 340 °C, (c) 360 °C, (d) 380 °C.
Metals 10 00385 g009
Figure 10. Temperature distribution of the forming parts at different temperatures of: (a) 320 °C, (b) 340 °C, (c) 360 °C, (d) 380 °C.
Metals 10 00385 g010
Figure 11. Picture and optical microstructure of the isothermal forging parts at different temperatures of: (a) Parts picture, (b) 320 °C, (c) 340 °C, (d) 360 °C, (e) 380 °C.
Metals 10 00385 g011
Figure 12. The SEM microstructure of the isothermal forging parts at different temperatures of: (a) 320 °C, (b) 340 °C, (c) 360 °C, (d) 380 °C.
Metals 10 00385 g012
Figure 13. The SEM microstructure (a) and EDS analysis of the isothermal forging parts at 380 °C: (b) Spot A, (c) Spot B, (d) Spot C.
Metals 10 00385 g013
Figure 14. Fracture morphology of the isothermal forging parts at different temperatures of: (a) 320 °C, (b) 340 °C, (c) 360 °C, (d) 380 °C.
Metals 10 00385 g014
Figure 15. Optical microstructure of the samples after post heat treatments of: (a) 440 °C—1 h, (b) 440 °C—2 h, (c) 440 °C—3 h, (d) 480 °C—1 h, (e) 480 °C—2 h, (f) 480 °C—3 h, (g) 520 °C—1 h, (h) 520 °C—2 h, (i) 520 °C—3 h.
Metals 10 00385 g015aMetals 10 00385 g015b
Figure 16. SEM microstructure (a), (b), and EDS analysis of the samples after 520 °C—1 h heat treatment: (c) Spot A, (d) Spot B, (e) Spot C, (f) Spot D.
Metals 10 00385 g016
Figure 17. Fracture morphology of isothermal forging parts after post heat treatments: (a) 440 °C—1 h, (b) 440 °C—2 h, (c) 440 °C—3 h, (d) 480 °C—1 h, (e) 480 °C—2 h, (f) 480 °C—3 h, (g) 520 °C—1 h, (h) 520 °C—2 h, (i) 520 °C—3 h.
Metals 10 00385 g017aMetals 10 00385 g017b
Figure 18. HAADF images (a) and EDS results of Mg-1YL isothermal forged at 380 °C: (b) Mg, (c) Zn, (d) Y.
Metals 10 00385 g018
Figure 19. TEM bright field images of Mg-1YL isothermal forged at 380 °C: (a,b) Second phases and the dislocations, (c,d) dense dislocations with tangles and curls.
Metals 10 00385 g019
Table 1. The composition of ZK61 alloy (wt %).
ElementZnZrMnFeAlSSiMg
Content6.060.670.020.040.04<0.01<0.01Bal.
Table 2. The composition of Mg-30%Y alloy (wt %).
ElementMgYSiOthers
Content70.6628.970.25Bal.
Table 3. The experimental parameters of Mg-30%Y alloy blanks.
No.Y-element Content (wt %)Procedure
Mg-0YG0Gravity Casting
Mg-0YL0Liquid Forging
Mg-1YL1Liquid Forging
Mg-2YL2Liquid Forging
Mg-3YL3Liquid Forging
Mg-4YL4Liquid Forging
Table 4. The solution treatment parameters of Mg-30%Y alloy forming parts.
TreatmentTemperature/°CDwell Time/h
Solution4401, 2, 3
Solution4801, 2, 3
Solution5201, 2, 3
Table 5. Atom ratios (at%) for different elements of each spot in Figure 7a.
PositionMgZnYZr
Spot A82.6213.843.500.05
Spot B68.4424.504.932.13
Spot C75.9218.884.910.29
Table 6. Tensile properties of liquid forging parts with different yttrium contents.
Y-Element Content (wt %)Elongation (δ/%)Yield Stress (σs/MPa)Ultimate Tensile Strength (σb/MPa)
09.5103220
116.0104232
212.595217
311.597228
411.0125231
Table 7. Atom ratios (at%) for different elements of each spot in Figure 13a.
PositionMgZnYZr
Spot A91.586.292.130
Spot B83.5611.204.900.35
Spot C69.6820.419.350.55
Table 8. Tensile properties of the isothermal forging parts at different temperatures.
Temperature (°C)Elongation (δ/%)Yield Stress (σs/MPa)Ultimate Tensile Strength (σb/MPa)
3208.5142283
34010.0142308
36010.5147300
38018.5150315
Table 9. Atom ratios (at%) for different elements of each spot in Figure 16b.
PositionMgZnYZr
Spot A97.971.660.130.23
Spot B84.0211.324.550.12
Spot C76.6915.457.630.24
Spot D86.249.444.090.23
Table 10. Tensile properties of the samples after post heat treatments.
SamplesElongation (δ/%)Yield Stress (σs/MPa)Ultimate Tensile Strength (σb/MPa)
440 °C—1 h19.5113282
440 °C—2 h19.0116269
440 °C—3 h18.5114274
480 °C—1 h19.0121273
480 °C—2 h18.5123268
480 °C—3 h25.0122280
520 °C—1 h25.5125282
520 °C—2 h25.0126273
520 °C—3 h23.5123280