Review

Specific Features of Structure Transformation and Properties of Amorphous-Nanocrystalline Alloys

Structure Research Lab., Institute of Solid State Physics RAS, Chernogolovka 142432, Russia
*
Author to whom correspondence should be addressed.
Metals 2020, 10(3), 358; https://doi.org/10.3390/met10030358
Submission received: 6 February 2020 / Revised: 3 March 2020 / Accepted: 4 March 2020 / Published: 9 March 2020
(This article belongs to the Special Issue Recent Advancements in Metallic Glasses)

Abstract

:
This work is devoted to a brief overview of the structure and properties of amorphous-nanocrystalline metallic alloys. It presents the current state of studies of the structure evolution of amorphous alloys and the formation of nanoglasses and nanocrystals in metallic glasses. Structural changes occurring during heating and deformation are considered. The transformation of a homogeneous amorphous phase into a heterogeneous phase, the dependence of the scale of inhomogeneities on the component composition, and the conditions of external influences are considered. The crystallization processes of the amorphous phase, such as the homogeneous and heterogeneous nucleation of crystals, are considered. Particular attention is paid to a volume mismatch compensation on the crystallization processes. The effect of changes in the amorphous structure on the forming crystalline structure is shown. The mechanical properties in the structure in and around shear bands are discussed. The possibility of controlling the structure of fully or partially crystallized samples is analyzed for creating new materials with the required physical properties.

Graphical Abstract

1. Introduction

Metallic alloys in an amorphous state (amorphous alloys or metallic glasses) were obtained for the first time by rapid melt quenching in 1960 [1]. The new material was of great interest, since it was determined at once that the properties of alloys in an amorphous state differ from those of crystalline materials of the same composition (for example, see [2]). Although many years have passed, interest in amorphous alloys persists. So far, there have not been any reliable models of an amorphous structure. There are a number of questions related to evolution of its structure and properties, as well as the possibility of obtaining nanocrystalline materials by thermal and deformation action on amorphous alloys. The properties of nanocrystalline materials and composite amorphous-nanocrystalline materials also differ from those of amorphous and traditional crystalline materials. Depending on chemical composition, nanocrystalline metallic materials are characterized by good plasticity and high viscosity, high strength and hardness, low moduli of elasticity, higher diffusion coefficients, as well as larger values of thermal expansion coefficient and better magnetic properties as compared with traditional crystalline materials [3,4,5,6]. Partially crystalline alloys containing nanocrystals have hysteresis magnetic properties at the level of the best crystalline and amorphous alloys; at the same time, they have high saturation induction comparable to that of the best high-silicon electrical steel. Light Al-based amorphous-nanocrystalline alloys have high strength, with the values of yield strength able to reach 1.6 GPa [7] at good plasticity.
This review analyzes changes in the structure of the amorphous phase from preparation to the initial stages of crystallization. The transformation of a homogeneous amorphous phase into a heterogeneous phase, the dependence of the scale of inhomogeneities on the component composition, and the conditions of external influences are considered. The effect of changes in the amorphous structure on the forming crystalline structure is shown. The crystallization processes of the amorphous phase, such as the homogeneous and heterogeneous nucleation of crystals, are considered. Particular attention is paid to an important feature of the processes of crystal formation in the amorphous phase, namely, compensation for volume mismatch. In the study of crystallization of metal glasses, this issue is usually not given sufficient attention. Meanwhile, the way of compensating for the volume mismatch has a decisive influence on the forming crystalline structure. When crystals form in the liquid phase (melt solidification), the difference in the specific volume of the liquid and solid phases is quickly compensated due to the high mobility of atoms at high temperatures. In the amorphous phase, such a process is hampered due to significantly lower diffusion coefficients at room temperature or crystallization temperature, which does not exceed 500 °C for most amorphous alloys, that is noticeably lower than the melting temperature. As will be shown below, in this case, volume mismatch can be compensated by changing the sequence of formation of crystalline phases, changing the morphology of the crystals formed, the formation of nanocrystals with subsequent recrystallization, or the formation of pores. Data on the influence of thermal or deformation effects on the parameters of the crystal structure are presented. The effect of plastic deformation on the formation of nanocrystals and the features of the mechanical properties of the amorphous phase near the zones of plastic deformation localization are shown. In conclusion, there is evidence of the possibility of restoring the amorphous structure using the cryogenic cycling method.
Studies of the structure and crystallization processes of metal glasses were carried out on a lot of systems. The main attention in this review is focused on the alloys of such compositions in which the above features are most clearly manifested.

2. Structural Changes Occurring during Heating and Deformation

An amorphous state is unstable, and the amorphous phase decays with the formation of the crystalline phases under heat treatment. In a number of cases, transformation of the structure is more complex, and the structure changes of the amorphous phase are observed before the crystallization onset: separation to regions differing in the chemical composition and short-range order. At the same time, a heterogeneous, amorphous structure is formed. The formed amorphous regions generally do not have a sharp interface, the transition may exhibit peculiarities of spinodal decomposition [8,9]. Structure changes in metallic glasses before the crystallization onset were discovered in a large number of alloys [10,11,12,13,14,15,16,17,18]. A lot of works [19,20,21,22,23,24,25,26] are devoted to the study of the separation of the amorphous phase and heterogeneous amorphous structure formation.
A heterogeneous amorphous structure can be observed both in an initial state immediately after melt quenching and after various external actions: heat treatment, deformation, irradiation, and others. For example, as-prepared amorphous Pd-Au-Si alloy is uniform, but regions differing in the chemical composition were formed in the sample after annealing at 400 °C [10]. In amorphous (Mo0.6Ru0.4)100-xBx such regions were revealed before the crystallization onset [15], and in amorphous Fe67Co18B14Si1 alloy having a uniform amorphous structure after the quenching, heating to 400–600 K resulted in the formation of regions enriched with boron and regions with Fe–Co composition [16]. Of course, regions with different chemical compositions are characterized by different radii of the first coordination sphere (different shortest distances between the atoms) and, correspondingly, different short-range order. Thus, short-range order in the amorphous phase, of course, depends on the chemical composition, and it changes with the composition change. An amorphous structure can change significantly with the change in the component concentration; for example, the structure of amorphous (Zr0.667Ni0.333)1-xBx alloy changes with boron concentration change from 0 to 25 at.% [12]. It was shown that short range order type changes when x ≈ 0.05. In Fe-Zr system, the phase diagram of which contains two eutectic regions (at 10 and 76 at.% of Zr), the formation of the amorphous phases is possible near each of the eutectic points. Naturally, the amorphous Fe-based phase and amorphous Zr-based phase will differ from each other in the radius of the first coordination sphere and short-range order.
The amorphous phase structure can change significantly not only under heating, but under deformation. Structure changes under deformation action were discovered at the beginning of the investigation of amorphous alloys. In [27], it was found out that under rolling of amorphous Pd80Si20 alloys, a shift of the first peak of the structure factor towards smaller angles occurs, which indicates a change in the radius of the first coordination sphere. The studies showed also that the plastic deformation of metallic glasses at low temperatures and moderate loads is strongly localized, occurring in narrow regions, with shear bands, almost not affecting the main part of the amorphous phase. In these bands the structure, of course, should change.
Notably, in another group of works [28,29,30], the authors of which showed by the example of amorphous Zr-based alloys that in the absence of plastic deformation, tension leads to the change of a distance between the atoms, with these changes depending on the applied stress orientation. Amorphous Zr-based alloys become brittle and hardly undergo plastic deformation, that is why the mentioned works considered the region of elastic deformation only. Later the investigations of structure changes under plastic deformation were carried out for Pd40Ni40P20 alloy. The authors of [31] found out that after rolling deformation the amorphous alloy structure becomes anisotropic: after deformation, the distance between the atoms along the rolling direction increases, while that in a perpendicular direction almost does not change. The observed effect decreases with time. The structure change is accompanied by a decrease in the transverse sound velocity in the deformed samples compared with the initial samples. All the obtained results [28,29,30,31] are an evidence of the elliptical nature of the first coordination “sphere” in the deformed samples. Based on the studies carried out using X-ray radiation with different wavelengths [31], it was also discovered that the structure changes are more pronounced in a subsurface region of the sample where deformation is maximum. Thus, the structure of the deformed samples may differ in cross-section. Structure changes during deformation were observed also under the use of small-angle X-ray scattering. Thus, for example, in Pd80Si20 alloy, deformation of 20% resulted in a significant increase in the intensity of small-angle scattering [32], and in Fe40Ni40P14B6 alloy [33], the existing inhomogeneities with a size of 32 Å increased up to 35 Å after 2-h annealing at 100 °C. Changes in the amorphous phase structure bring changes in the physical properties: the Curie temperature increase [34] or there is an emergence of two Curie temperature values (in the case of separation of the amorphous phase and formation of areas differing in the chemical composition and type of short-range order [35]), embrittlement [36,37], etc.

3. Formation of Nanoglasses

As was shown, both heat treatment and deformation can result in the formation of a heterogeneous amorphous structure. In recent years, the term “nanoglasses” has been used to describe a heterogeneous amorphous structure. Although, as stated above, a heterogeneous amorphous structure was observed in a number of systems by a lot of researchers, the term “nanoglass” was introduced in the work by Gleiter [38] quite recently. Today nanoglasses are the particular focus in world scientific literature. These materials, which differ from homogeneous amorphous, and nanocrystalline materials in the structure, can display unique functional properties: mechanical, magnetic, catalytic, and others.
For the first time nanoglasses were synthesized as a bulk sample by consolidation of amorphous powders under pressure. However, the samples obtained by this method had small geometric sizes, and under their obtaining it was extremely difficult to avoid oxidation of the surface of amorphous nanoparticles and formation of micropores embrittling the samples. Action on an amorphous alloy obtained by melt quenching in the form of a ribbon, can be used as an alternative method of obtaining nanoglasses. The method of obtaining metallic glasses by melt quenching onto a moving substrate is one of the main methods of obtaining. Thereby ribbons with a thickness of 10–50 µm, width of several millimeters to tens of centimeters, and length of several meters are formed. Such alloys have significantly large sizes for both investigation of the structure and properties and use in industry. As stated above, heterogeneity regions resulting in a nanoglass state can be formed in the amorphous phase under different actions: heat treatment of different types, deformation (rolling, hydrostatic, and quasi-hydrostatic compression, high-pressure torsion, and others) at different temperatures, and irradiation. The separation of the amorphous phase can occur at different scales. Thus, for example, the heating of metallic Zr40Ti10Cu50 glass before the onset of crystallization results in the separation of an amorphous matrix at the scale of about several nanometers [39], which subsequently results in the formation of a composite amorphous–nanocrystalline structure with an extremely small grain size (2–5 nm). At the same time, the separation scale is significantly larger in a number of other systems. It was found that, in the Fe90Zr10 alloy [9], long-term low-temperature annealing (at a temperature of 100 °C) leads to the decomposition of the amorphous phase with the size of the heterogeneity regions of about 25 nm. In the annealed Ni70Mo10P20 alloy [17], heterogeneities sized of about 30 nm are formed below the glass transition temperature; and in Ni70Mo10B20 metallic glass [40] after annealing above the glass transition temperature, regions of an amorphous phase of different compositions up to 50 nm in size are formed.
The irradiation of amorphous alloys, for example, by fast neutrons, can also lead to the formation of an inhomogeneous amorphous structure consisting of regions and different short-range orders. When the amorphous Pd80Si20 alloy was irradiated with fast neutrons with a dose of 5 × 10²⁰ neutrons/cm2, the formation of structural inhomogeneities was observed, which are clusters with increased electron density, surrounded by boundary regions with a reduced electron density. The diameter of the clusters together with the shell was 10–20 Å [41]. Irradiation can lead not only to the formation of inhomogeneities, but also to their reduction. For example, amorphous alloys (Mo60Ru40)82B18 and Fe40Ni40P14B6 became brittle after isothermal annealing, which is associated with the formation of inhomogeneities. After irradiation, the plasticity returned to its original value.
The peculiarities of structure and properties of nanoglasses are being investigated in alloys of different compositions [42,43,44,45,46,47].

4. Processes of Crystallization of Amorphous Alloys

Both homogeneous amorphous alloys and nanocrystals crystallize at an increase in the temperature, with the parameters of the formed structure (morphology, phase composition, sizes of structural components, etc.) depending on both heat treatment conditions and sample history.
Crystallization of amorphous (Ni70Mo30)90B10 alloy [48] is an example of the typical transformation from an amorphous to a nanocrystalline state. Figure 1 illustrates bright-field (a) and dark-field (b) images of the microstructure of (Ni70Mo30)90B10 sample which was annealed for 144 h at 873 K. One can see that the nanocrystals nucleate uniformly over the sample and are randomly distributed over an amorphous matrix. An average nanocrystal size is 16 nm. Figure 2 shows a high-resolution image of the structure of (Ni65Mo35)90B10 alloy sample annealed at 873 K for 72 h. A characteristic feature of the nanocrystal arrangement in an amorphous matrix is that the nanocrystals do not have regions contacting with each other. The crystals are isolated from each other by the regions of an amorphous matrix. The minimum thickness of a layer of the amorphous phase between the nanocrystals is ~2 nm.
The fraction of the crystalline phase increases gradually during heat treatment. The formed nanocrystals are a solid solution of Mo in Ni. A nanocrystal size is several nanometers. As annealing duration increases, the grain size increases insignificantly, and then almost does not change. The composition of regions of the amorphous matrix changes at that; it gets enriched with components which are insoluble or have limited solubility in nanocrystals (Mo, B). A composition change of the amorphous phase leads to a change in its crystallization temperature, which results in the completion of nanocrystal growth. Such component redistribution resulting in a composition change in intercrystalline regions of the amorphous phase was observed in alloys of other compositions (Fe-Zr-B, Fe-Si-B-Cu-Nb) [49,50]. In some cases, the dependence of nanocrystal size on the distance from the surface was observed under the crystallization of the ribbons of amorphous alloys [51]. Thus, for example, in the subsurface regions of the above mentioned (Ni70Mo30)90B10 alloy annealed for 72 h at 873 K, an average size of the nanocrystalline phase grains is 20 nm and decreases to 17 nm at a depth of about 8 µm. The revealed difference in the size of nanocrystals (and their lattice parameter) along the sample depth is related to different chemical compositions of the subsurface and deep regions of the alloy.
A nanocrystalline alloy is two-phase; the structure consists of an amorphous matrix and nanocrystals uniformly distributed over the matrix, which have no direct contact with each other. The detailed studies of crystallization processes of amorphous alloys of Ni-Mo-B system [52,53] showed that the lattice parameters of nanocrystals with the fcc lattice in this system change depending on the isothermal annealing duration. The analysis of changes occurring demonstrated that, under primary crystallization, the composition of formed crystals differs from matrix composition, the composition of the remaining amorphous phase changes as crystallization proceeds. In the case of the alloys under study, the amorphous phase gets enriched with a refractory component. On the other hand, the composition of the crystals precipitated during annealing also undergoes some changes. Changes in the nanocrystal composition lead to changes in the lattice parameters. The dissolution of Mo in Ni leads to an increase in the lattice parameter of a solid solution, and dissolution of B leads to its decrease. As is well known [54], at 873 K the equilibrium concentration of Mo in Ni is 17 at.%, and that of B is less than 1 at.%. At the moment of formation, nanocrystals are a supersaturated solid solution of Mo and B in Ni. Under isothermal exposure, codiffusion of Mo and B from nanocrystals occurs as grains grow. Due to different chemical compositions of initial alloys at the initial moment, the compositions of nanocrystals in the alloys also turn to be different. Different values of supersaturation of solid solution nanocrystals with Mo and B result in different values of the lattice parameter, starting with exposure for 5 h. The maximum value of the lattice parameter is observed in the case of the highest content of Mo in (Ni65Mo35)90B10 alloy and the minimum content of B in (Ni70Mo30)95B5 alloy. At an increase in the concentration of B in (Ni70Mo30)90B10 alloy as compared with (Ni70Mo30)95B5 alloy or a decrease in the concentration of Mo in (Ni70Mo30)90B10 alloy as compared with (Ni65Mo35)90B10 alloy, nanocrystals are formed with a low value of the lattice parameter. The codiffusion of Mo and B into the surrounding matrix occurs under annealing. Loss of the highest amount of Mo (together with B) from the nanocrystals in (Ni65Mo35)90B10 alloy (as compared with other alloys) leads to an insignificant decrease in the lattice parameter. Since a lower amount of Mo leaves from the nanocrystals in (Ni70Mo30)90B10 alloy, one should expect the lattice parameter to increase due to B diffusion into the amorphous matrix, occurring at the same time, which is observed in the experiment.
The formed nanocrystalline structure in the above alloys has high thermal stability. The analysis carried out demonstrated that the nanocrystalline structure exists until the nanocrystals are isolated from each other by the amorphous phase. As previously stated, the amorphous matrix is enriched with B and a refractory component (Mo) and has an increased stability as compared with that of the amorphous phase of an initial composition. As soon as the amorphous matrix between the crystals disappears, they begin to grow rapidly. Such a case is shown in Figure 3 and Figure 4. Figure 3 displays bright-field (a) and dark-field (b) images of a large crystal. Figure 4 demonstrates a high-resolution electron microscope image of the crystals contacting with each other. One can see that in this case the boundary is a region with a thickness of several Å, which divides two adjacent crystals. An arrow marks the region of a direct contact of the nanocrystals with each other.

5. Heterogeneous Nucleation

Another group of nanocrystalline alloys under the most extensive study is light Al-based alloys. These alloys are light high-strength materials, which opens up extensive possibilities of their practical application. These alloys also crystallize by the nucleation and growth mechanism, and nanocrystals are formed by the primary crystallization reaction. Nanocrystal growth under the primary crystallization was investigated in a number of works, and it was shown, for example, for alloys of Al-Ni-Ce system [55] that it is diffusion-controlled. In literature, there are controversial data on the mechanisms of nanocrystal nucleation. There are literature data [56] stating that the process of Al nanocrystal nucleation is homogeneous. According to [57], this process is heterogeneous.
It is known that the homogeneous crystallization related to the fluctuation nucleation of nuclei with a critical size can take place only above the glass transition temperature Tg. At T < Tg, the viscosity of an amorphous phase is too high for such fluctuations, and nucleation can occur by heterogeneous mechanism only [58]. In light metallic glasses, it is difficult to define in which temperature range relative to Tg the process of nucleation occurs since the value of Tg in these alloys is unknown. Consequently, it is impossible to conclude correctly on the nucleation mechanism, based on the temperature range of the transformation.
To conclude reliably on the mechanism of nucleation under nanocrystallization, the data on nanocrystal distribution over size under different durations of isothermal exposure and the corresponding analysis of the distribution are required. This issue was studied in most details for alloys of Al86Ni11Yb3 system [59]. As a result of primary crystallization, a structure is formed in an alloy, which consists of an amorphous matrix containing Al fcc crystals randomly distributed over it. Al fcc crystals have a size of several nanometers. An example of this structure is shown in Figure 5. Al nanocrystals are generally isolated by the amorphous matrix from each other.
A change in the average nanocrystal size measured by dark-field electron microscope images depending on the exposure duration is presented in Figure 6. The average size changes from 8 nm (under exposure for 5 min) to 12 nm (under exposure for 60 min). As one can see, the sharpest changes in the average nanocrystal size occur at initial transformation stages. The experimentally obtained nanocrystal distributions over size for exposures for 5 and 15 min are illustrated in Figure 7. Note that the fraction of the smallest crystals may be too low due to difficulty of the observation. This is particularly important for the obtained distribution over size under exposure for 5 min, when the distribution is shifted towards the region of small sizes.
The obtained experimental distributions of nanocrystals over size have some specific features. To analyze the features, let us consider theoretically possible crystal distributions over size and compare them with those observed experimentally. Figure 8 shows all the possible size distributions of crystals, which crystallize by the nucleation and growth mechanisms, for homogeneous and heterogeneous nucleation [60].
If one compares these distributions with those observed experimentally, it is clear that heterogeneous nucleation with a latent period takes place in the alloys under study. This is indicated by the following:
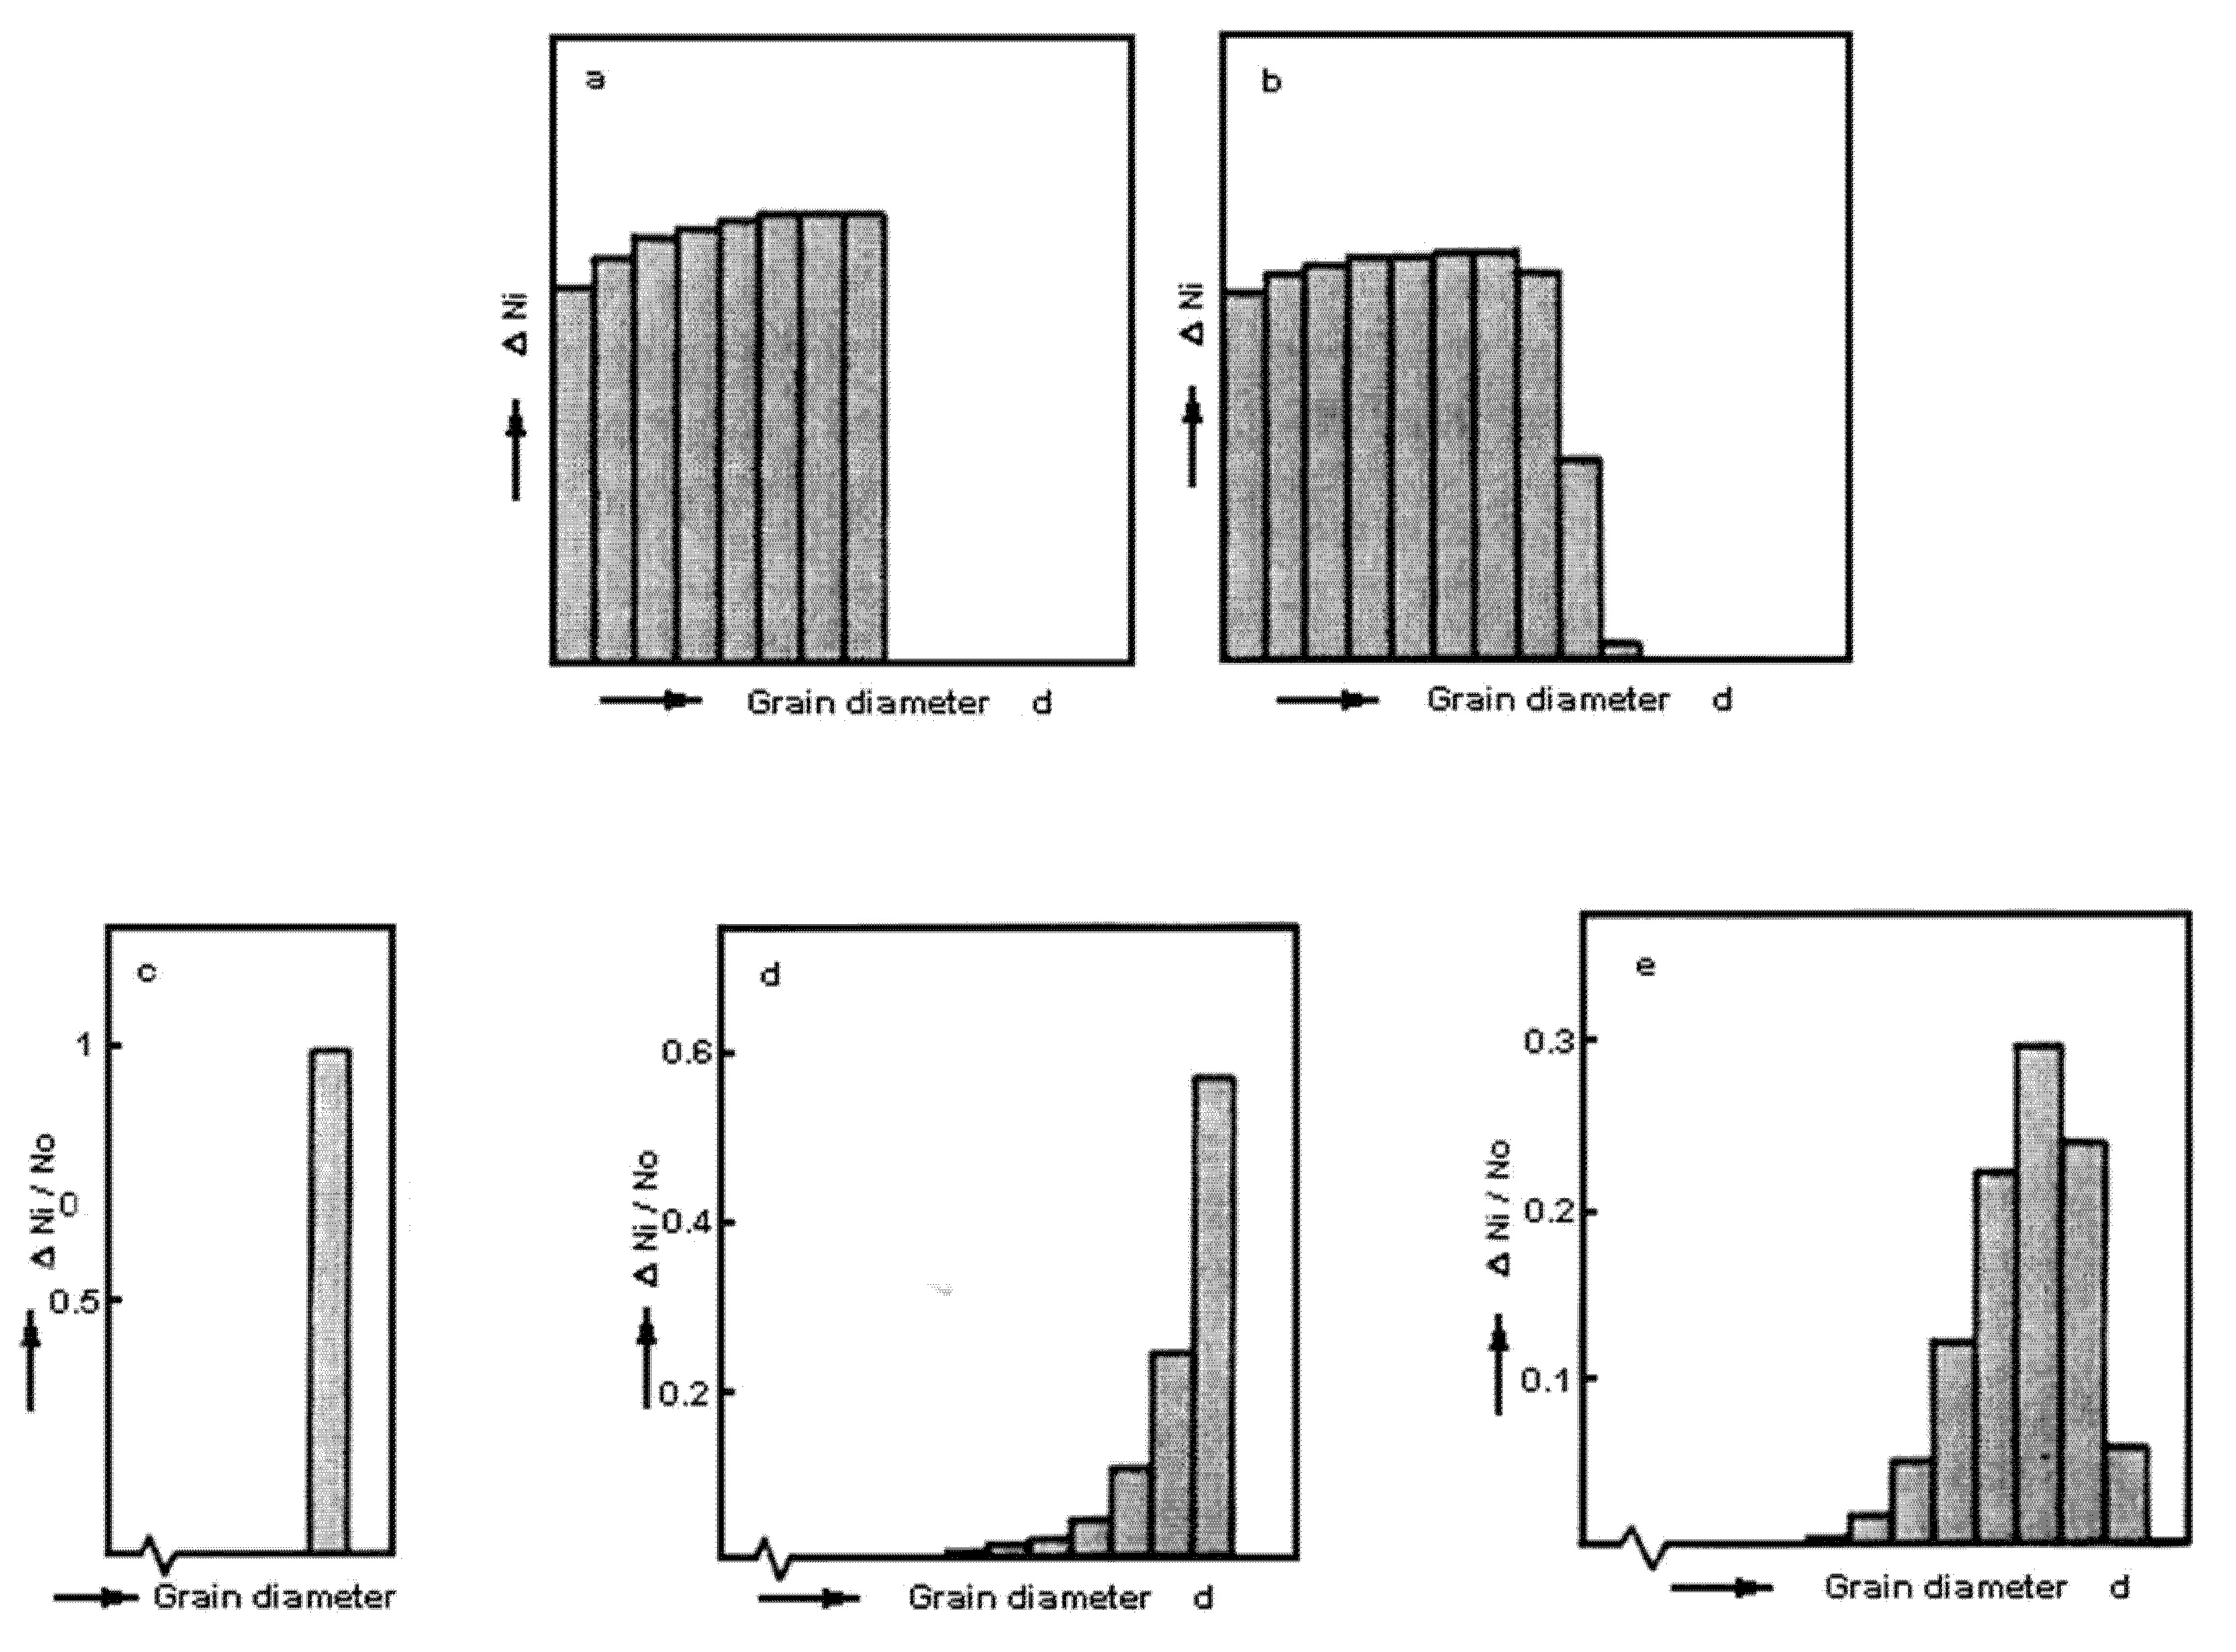
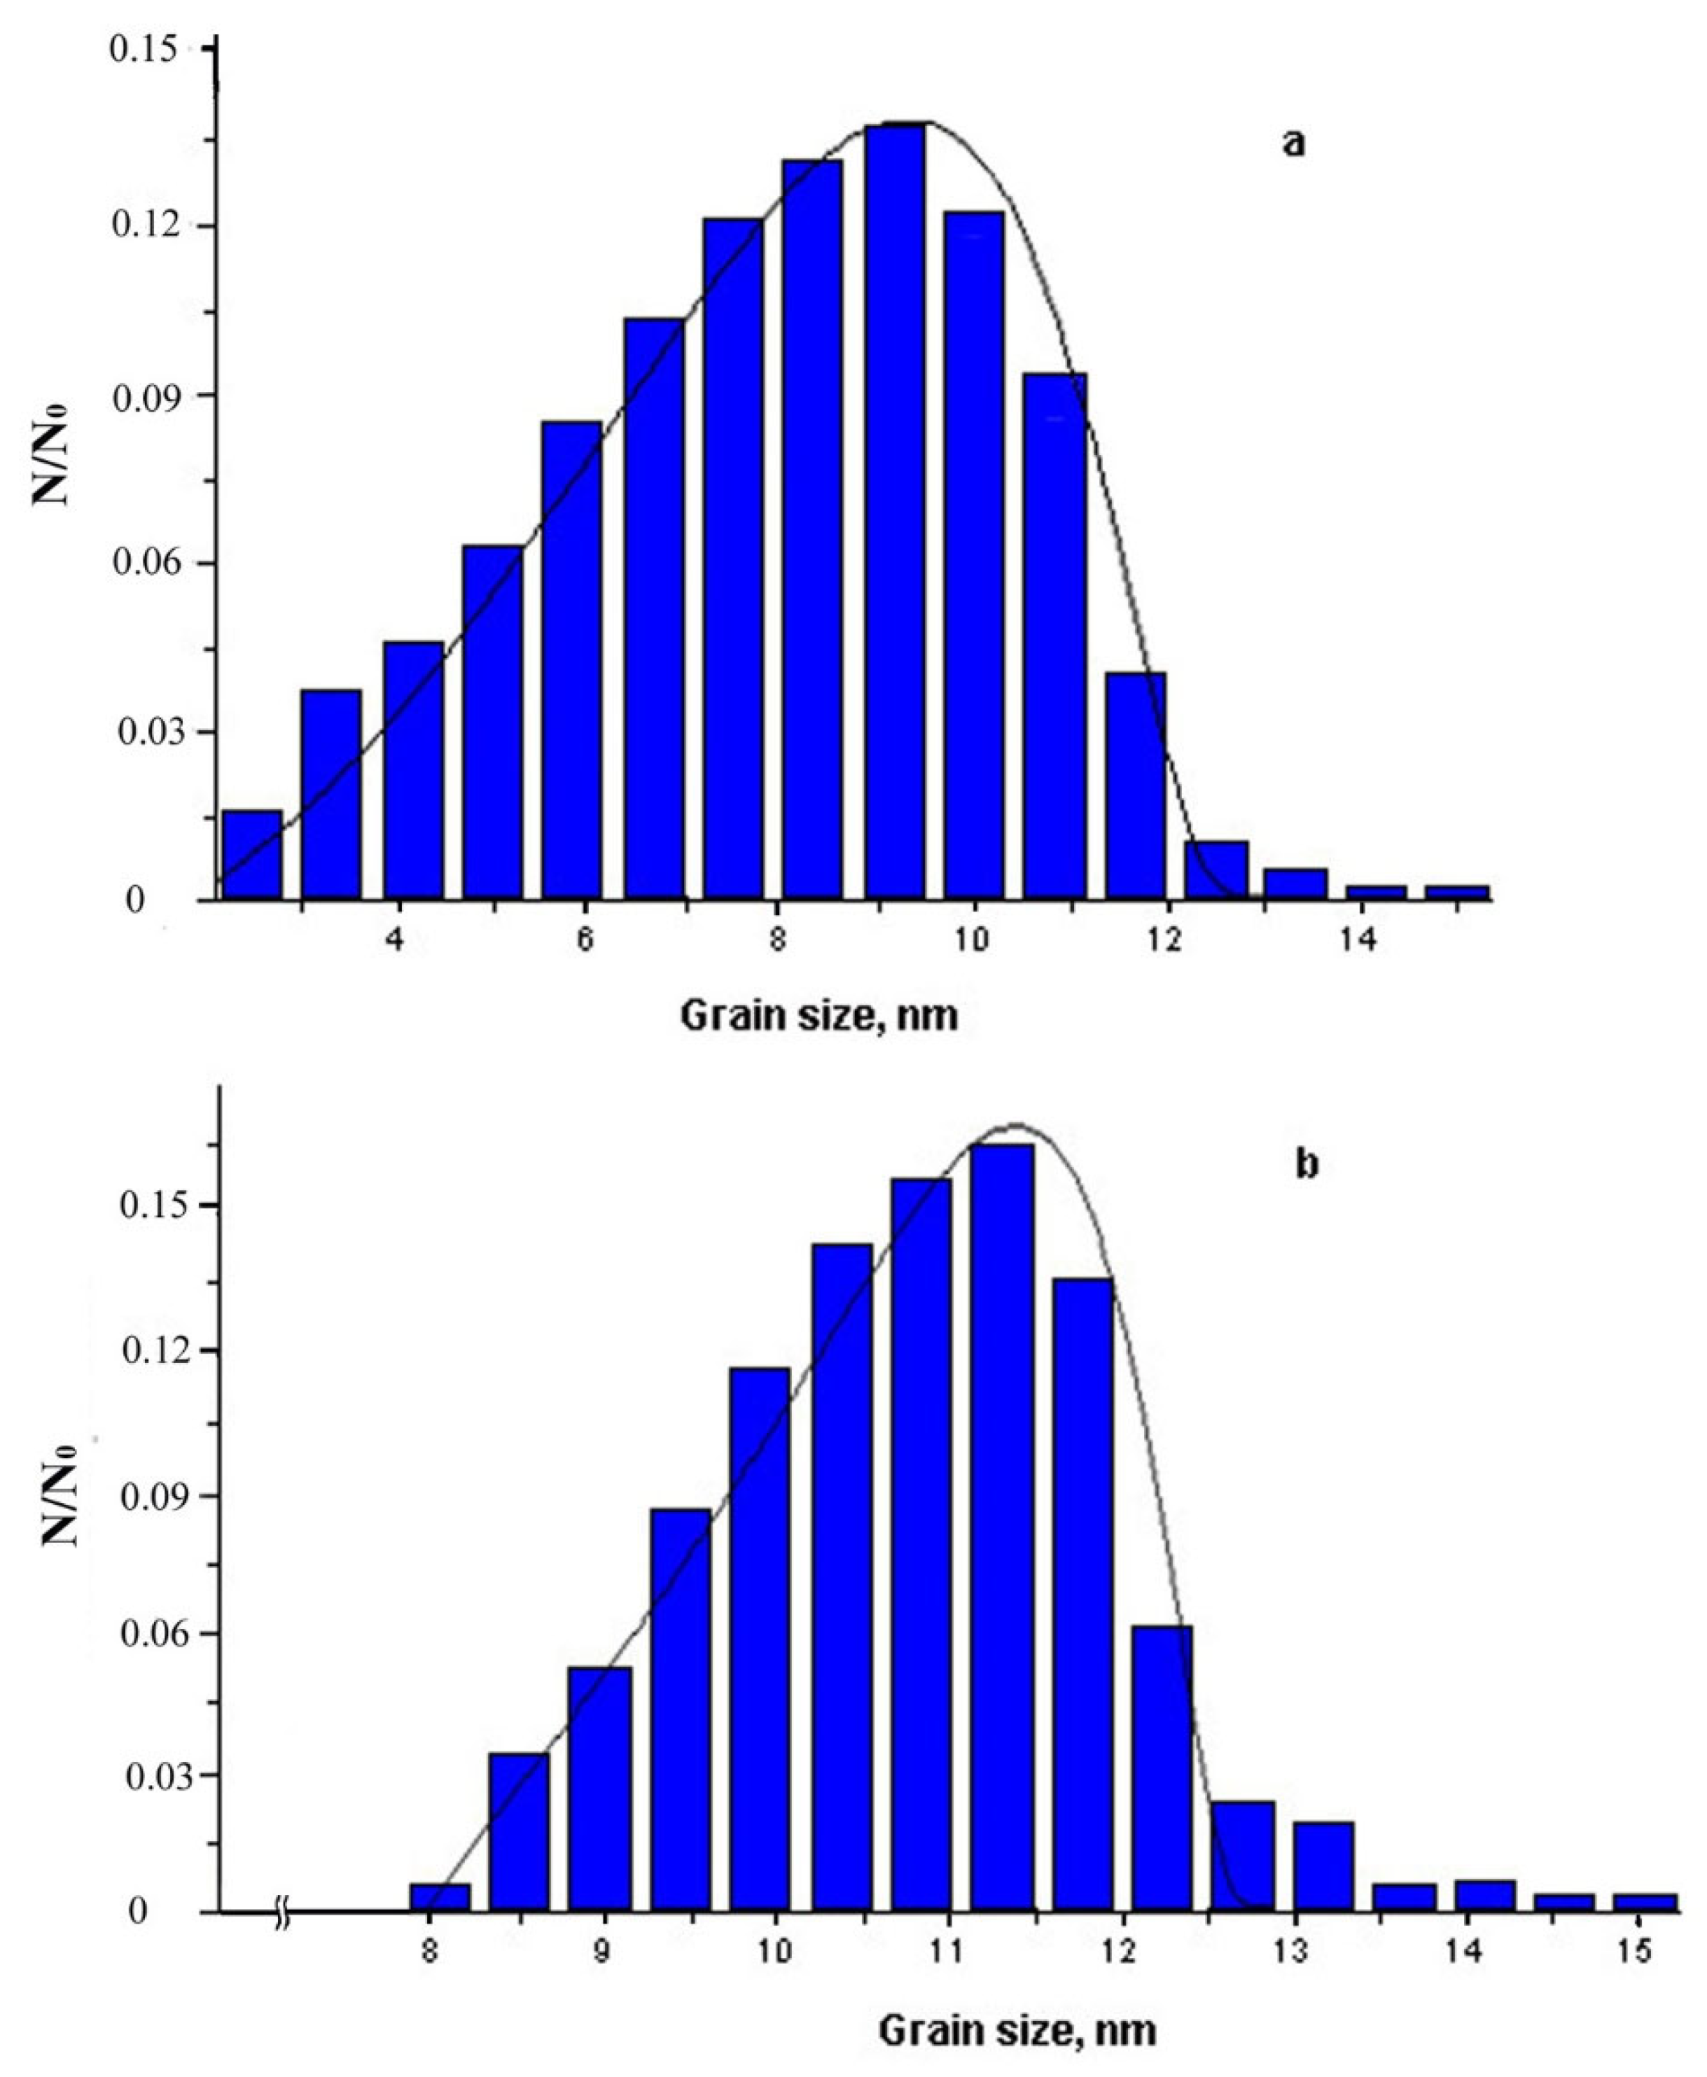
  • the absence of small crystals in the distribution under exposure for 15 min;
  • a significant decrease in the region of small sizes under exposure for 5 min;
  • a gradual decrease in the large particle fraction (the right branch of the distribution), which is typical for the nonstationary rate of nucleation of the nanocrystals (with the latent period).
Thus, at the annealing beginning, there is a time period (τ), during which the stationary distribution of subcritical nuclei over size is reached that corresponds to classical theory. According to [61], in this case, the time-dependent rate of nucleus formation I(t) is determined by the equation
I(t) = Ist{1 + 2∑(−1)nexp[−n2(t/τ)]}
where the summation is performed over n in the range between 1 and ∞, τ is the latent period which increases sharply with decreasing temperature, and Ist is the nucleation rate under stationary conditions, which in turn is described by the equation
Ist = I0·exp(−LΔGc /RT)·exp(−QN/RT)
where L is the Loschmidt number, QN is the activation energy of transfer of an atom through the crystallization front surface, ΔGc is the free energy necessary for the formation of a critical nucleus. Equation (2) is an approximate solution of the Fokker–Planck equation which was obtained for the first time in [62].
At strong supercooling, the value of ΔGc is very low, then
Ist = I0 exp( −QN/RT).
Let us examine the growth of the formed nanocrystals. Since, in the case under consideration, the concentration gradient of other alloy components arises in the amorphous matrix in front of growing Al nanocrystals, the matrix gets enriched with Ni and Yb, the atoms of which diffuse over larger distances. Then, the growth rate of the formed crystals decreases with annealing duration. At the same time, it is known [58] that under primary crystallization, the radius of the growing crystals depends parabolically on the duration of isothermal exposure. In our case, the growth of the crystals is determined by the bulk diffusion of Ni and Yb components in the amorphous matrix
R = α (Dt)0.5
where D is the bulk diffusion coefficient, t is the time of isothermal exposure, R is the radius of a growing crystal, and α is the dimensionless parameter of an order of unity. Meanwhile, we consider the parameter α to be independent of the fraction of the crystalline phase.
This time dependence of the crystal size results in that nanocrystal distribution over size in the case of heterogeneous nucleation becomes narrower with time. Thus, for the distribution shown in Figure 7a the dispersion was 15.76 nm2, and for that presented in Figure 7b it was 4.96 nm2. In principle, the Ostwald coalescence described by the Lifshitz–Slyozov theory [63] can also lead to narrowing of the histograms of nanocrystal distribution over size and shift it.
In order to specify the heterogeneous mechanism of nanocrystal nucleation and growth during isothermal exposure, it is necessary to perform computer calculations and plot the histograms of nanocrystal distribution over size for heterogeneous nucleation and diffusion-controlled growth with the purpose of comparing them with the experimental data.
To carry out these calculations using Equations (1)–(4), it is necessary to know the following parameters:
N0, which is the number of nuclei, limited under heterogeneous crystallization;
τ, which is the latent period (duration of the nonstationary stage);
Ist, which is the rate of nucleation under stationary conditions;
I0, which is the constant determining the stationary rate of nucleus formation, and
QN, which is the activation energy of transfer of an atom through the crystallization front surface.
The value of I0 can be considered to be 3 × 1030 m s−1; such a value is typical of the nucleation of Al nanocrystals in alloys of Al-Ni-REM systems [56]. The value of N0 can be calculated from the experimental data as follows. Under exposures for more than 30 min, the fraction of the crystallize phase does not significantly change (it is about 0.23). An average size of the nanocrystals is about 12 nm. Then, the number of nanocrystals, N0 (by assuming that all the regions of heterogeneous nucleation are implemented and by neglecting the possible nanocrystal coalescence), will be about 2 × 10²³ m−3. Such an estimate agrees well with the known literature data. Thus, in [56], it is reported that under nanocrystallization N0 can reach 1025 m−3. According to [64], in order to estimate nanocrystal distribution over size it is necessary to divide the time of isothermal exposure into short time intervals Δt and to calculate the number of nanocrystals crystallized during each interval Δt. Then, for heterogeneous crystallization at the limited number N0 of active nuclei
Ni = I (t)(1 − xi−1)(1 − N0−1∑Nj)Δt,
where the summation is performed over j in the range between 1 and i at ∑Nj ≤ N0; Ni = 0 for all the other values of i. xi is the volume fraction of a material crystallized during the time interval Δt by the mechanism of primary crystallization (R = (Dt)1/2):
xi ≈ D3/2 ∑Nj {Δt(i + 1 − j)}3/2,
where the summation is performed over j in the range between 1 and i.
The shape and location of the theoretical curve on the axes of size distribution depend on the values of the parameters substituted into the formulas. The correction of the parameters QN and τ and the diffusion coefficient (D) enables the best approximation of the theoretical curve to the distribution obtained experimentally.
The two experimental curves of nanocrystal distribution over size for Al86Ni11Yb3 alloy, presented above, should be compared with those calculated theoretically. When estimating both histograms, one should use the same crystallization parameters. A change in their shape and location should be related to the different process durations (5 and 15 min) only. This requirement is rather rigid. It was shown that both experimental curves can correspond quite well to the theoretical ones at the same values of QN and τ, but different diffusion coefficients D (Figure 9). For good correspondence of the curves, the diffusion coefficient D should diminish with a rise in the exposure time (and, correspondingly, in the fraction of the formed crystalline phase). A decrease in D under primary crystallization of amorphous alloys is rather usual at in increase in the crystallized material fraction [58]. The same phenomenon is apparently observed in the case under consideration. From the comparison of calculated and experimental data it follows that at 473 K the effective coefficient of diffusion of Ni and Yb in amorphous Al86Ni11Yb3 alloy is 1.4 × 10⁻¹⁹ m2s−1, and the latent period is 150 s. Since usually the diffusion coefficient of Ni is significantly higher than that of Yb, one may suppose that it is the Yb removal rate from growing crystal that limits the nanocrystal growth. Then, the obtained diffusion coefficient value is related to Yb diffusion. The value of Yb diffusion coefficient which is 1.4 × 10⁻¹⁹ m2s−1 at 473 K seems to be rather realistic. If one compares it with the available data on the diffusion coefficients of rare-earth metals in Al-based alloys, their similarity should be noted. Thus, the diffusion coefficient of Y in Al88Fe7Y5 alloy is 9 × 10⁻²⁰ m2s−1 at 518 K [65]. This value was obtained using the Frank approach, where it is assumed that the parameter α in the equation R = α (Dt)0.5 is 1.5.
Note that Hono et al. [66] detected a rise in the Ce concentration in front of growing Al nanocrystals under the crystallization of alloys of Al-Ni-Ce systems, while Ni was distributed uniformly over the amorphous phase. Considering the similarity of the properties of Ce and Yb atoms, the above assumption on the ratio of the diffusion coefficients of Ni and Yb elements seems to be rather reasonable.
Another difference between the experimental and calculated distributions over size is, as one can clearly see in Figure 9, a “tail” of large particles presented in the experimental histograms. The existance of larger particles is probably related to the presence of a small amount of the so-called “frozen-in crystallization centers” in as-prepared alloy. The formation of crystals is facilitated in this case. The particles grow earlier (up to the completion of the latent period of attaining the stationary distribution of subcritical nuclei over size) and reach larger sizes. The particles grow earlier (by the end of the latent period of reaching the stationary distribution of subcritical nuclei) and grow to larger sizes.
When calculating above, it was assumed that the parameter α in the equation R = α (Dt)0.5 determines the time dependence of the radius of a growing crystal under primary crystallization, independently of the composition of the residual amorphous matrix. Therefore, when it turned out that the rate of crystal growth decreases with time more sharply than it follows from the dependence R = α (Dt)0.5, an agreement between the calculations and the experiment was reached by decreasing the diffusion coefficient with the process duration. However, it seems to be expedient to consider another approach which relates a more significant than it follows from the equation R = α (Dt)0.5 decrease in the growth rate with time to a decrease in the driving force of the process. If one takes into account a change in the matrix composition, according to the Ham’s approach [67] the time dependence of the size will be determined as
R(t) = [2(Cm − C(t))/Cm − Cp]1/2 (D t)1/2
where Cm and Cp are the concentration of a redistributed component in an amorphous matrix and precipitate at the interface; C(t) = C0/1 − x(t) is the concentration of a component in an amorphous matrix the time t after the process onset.
Ham’s model considers a sequence of the identical particles; the initial sizes of a growing particle are negligibly small, the concentration of an admixture (alloying element) in a matrix near the particle is constant along the entire interface, at the interface the condition of diffusion equilibrium is satisfied, and an average size of the particle is about a half of the distance between the particles at the moment of reaction completion (i.e., at their maximum quantity). In [68], an expression was obtained which relates Cm, C(t), Cp, t, and R0 to each other, where R0 is the distance between the particle centers.
(D t /(R0)2) [(C0 − Cm)/ (Cm −Cp)]1/3 = (1/6) ln [(u2 + u + 1)/(u2 − 2u + 1)] − (1/3)1/2 tan−1 [(2u + 1)/31/2],
where u3 = 1 − C(t)/C0.
When obtaining this expression, it was assumed that C(t = 0) = C0, the initial radius of a particle is zero.
The essence of this consideration is that at an early crystallization stage the enrichment of a matrix is low due to the concentration redistribution, (C(t) ≈ C0) and R ~ (Dt)1/2. At times corresponding to the final stages of the reaction, an average matrix composition approaches Cm and dR/dt → 0. The rate of precipitate growth converges to zero since the driving force of the precipitate process converges to zero. Taking into account the concentration dependence of the parameter α, the dependences of an average size of Al nanocrystals in Al86Ni11Yb3 alloy were calculated. N0 was 2 × 10²³, D = 1 × 10⁻¹⁹ m2 s−1, x(t), the fraction of a crystallized material, was determined. The obtained results are demonstrated in Figure 9, where the results of the calculations based on Ham’s approach are marked with a solid line and the experimental points are shown as rhombi. It is seen that a good agreement between the calculated and experimental data is observed. Note also that, in this case, the correspondence is observed when using one value of the diffusion coefficient for all durations of isothermal exposure in calculations. This value almost coincides with that obtained earlier. A slight difference is caused only by the coefficients used in the estimates. In the first case we assumed R = (Dt)1/2 and in the second case we calculated R = α (Dt)1/2, where
α = [2(Cm − C(t))/Cm − Cp]1/2.
In principle, Ham′s analysis is related to binary systems. However, based on the data presented in [69] one can consider it to be rather applicable to the case of light three-component alloys.
One should also analyze a possible effect of the Ostwald coalescence on the observed histograms of nanocrystal distribution over size. In the Lifshitz–Slyozov theory, the evolution of crystal sizes is described by the following equation:
R3R03 = 8 D σ Vm C(∞) t / 9 N k T
where R is the average particle size, R0 is the initial average size, Vm is the molar volume of precipitates, σ is the energy of the particle-matrix interface, C(∞) is the equilibrium solubility of a component at a great distance from a particle, k is the Boltzmann constant, and N is the Avogadro number.
The maximum growth rate caused by the coalescence is
(dR/dt)max = 8 D σ Vm C(∝) / 27 N k T R2
The maximum growth rate estimated by Equation (11), which was caused by the coalescence, was about 0.2 nm/h (for 473 K, R ≈ 4 nm after the exposure for 5 min, and D =1.4 × 10⁻¹⁹ m2/s). For R ≈ 5.5 nm (after the exposure for 15 min), the maximum growth rate is <0.03 nm/h. One can see that these rates are insignificant in the considered time interval of the nucleation and evolution of the nanocrystals (exposure for up to 60 min). Ardell [70] made the corrections in Equation (8), allowing for the volume fraction of crystals. Ardell obtained an equation which differs from the Lifshitz–Slyozov equation in the parameter K, which is the function of the crystal volume fraction only:
R3R03 = 8 K D σ Vm C(∞) t / 9 N k T
K = 1 at zero volume fraction of precipitates, K ≈ 6 at 15% fraction (exposure of the alloy under investigation for 5 min), and K = 10 at 25% fraction, which approximately corresponds the exposure for 15 min in our case. Then, the maximum growth rates caused by the coalescence are ~1 nm/h and 0.3 nm/h for nanocrystals in the alloy after the exposure for 5 and 15 min, respectively. Note that these estimates are too high since the diffusion coefficient decreases with time (in this calculation, the dependence of the parameter α in the equation dR/dt = (α/2)(D/t)1/2 on the crystalline phase fraction was considered, and it was taken to be constant and equal to 1). The obtained values can be regarded as the estimates “above” the values of an instantaneous growth rate (under the exposure for 5 and 15 min) decreasing with time. Therefore, in this case, even consideration of the parameter K related to the volume fraction of precipitates does not make these rates significant for the evolution of nanocrystal distribution over size.
Furthermore, in the Lifshitz–Slyozov theory it is considered that the system is in equilibrium, ib this case the formation and growth of particles of the second phase do not occur due to the matrix (the fraction of particles of the second phase is constant). Thus, a change in the nanocrystal size, caused by coalescence processes, which is described by the Lifshitz–Slyozov theory, may be significant after the completion of nanocrystal growth from the amorphous phase during the existence of metastable equilibrium of the nanocrystals – amorphous matrix. For coalescence processes to occur, this equilibrium should be persist for a long time, and no further crystallization of the amorphous phase should take place. It is important to note that the particle distributions over size were obtained for the stages at which a metastable equilibrium between the amorphous and nanocrystalline phases was not reached yet and the fraction of the nanocrystalline phase continued to increase.
Thus, nanocrystal nucleation under the crystallization of amorphous Al86Ni11Yb3 alloy occurs by the heterogeneous mechanism from “frozen-in” crystallization centers. A good agreement between the experimental data on a change in the nanocrystal size with the time of isothermal annealing and the calculations by the method described above was observed also for alloys of Al-Ni-Y system [71].

6. Some Features of Nanocrystal Formation (Free Volume)

The interrelation of an amorphous state and the crystalline phases emerging under its decay would be more evident if under crystallization there were no effects having a significant influence on the formed structure. The bulk crystallization effect belongs to these effects. The point is that the density of amorphous metallic alloys is 1–5% lower than their density in a crystalline state. Larger differences in the density of the amorphous phase and the arisen crystalline phases are observed in the case when the amorphous phase has semiconductor properties, for example, in the Al–Ge system. Therefore, it seems to be important to study how the compensation of bulk phase mismatch occurs under crystallization and how this affects the formed structure.
Several methods of the compensation of bulk mismatch are possible:
  • using elastic deformation;
  • by viscous flow of an amorphous matrix;
  • by plastic deformation of the crystalline phases;
  • due to diffusion escape of excess volume with formation of pores in the reaction front and/or diffusion of the elementary carriers of free volume to the surface and their annihilation on it;
  • by disruption.
Obviously, since the densities of the amorphous and emerged crystalline phases differ, elastic stresses and, consequently, deformation of both the crystalline and amorphous phases occur in the front. The values of the elastic stresses and deformation can determine the relative position of the phases, their morphology and structure, as well as the formation sequence. Obviously, the methods of compensation of the bulk effect act in an integrated way.
Let us consider some examples which demonstrate different methods of the bulk effect compensation.

6.1. Dependence of the Sequence of Phase Formation and Crystal Morphology on the Bulk Effect Demonstration in Alloys of Fe-B, Fe-Co-Si-B Systems

As stated in [72], the method of compensation of bulk mismatch under crystallization can determine the morphology of precipitates. In order to investigate the bulk effect demonstration, a comparative study of crystallization in the samples of “thick” (with an initial thickness) and “thin” cross-sections was carried out. Polished samples for electron microscopy are meant by thin cross-sections. Under the in-situ studies of crystallization in an electron microscope column, phase transformations are usually investigated in samples with a thickness of ≈100 nm. The thin cross-sections were studied to get rid of the influence of effects related to thick cross-sections on crystallization. The remoteness of the sinks of elementary free volume carriers from the reaction front, difficulty of the compensation of bulk mismatch, and others belong to these effects.
The investigations of samples of Fe100−xBx (16 < x < 20) alloys showed [73] that at the first stage of crystallization of samples of all the studied compositions, α-Fe crystals (or rather crystals of a solid solution of B in α-Fe) are precipitated. In the thin cross-sections, precipitates of α-Fe have the form of commas, needles, plates, differing in the thickness, of an irregular shape with a length of several tens of nanometers and thickness of 5–10 nm (Figure 10). Precipitate chains are formed, and a correlation in the arrangement of first and subsequent precipitates is observed. Then, grains of Fe3B arise, and a structure consisting of Fe and Fe3B grains is formed.
Under the crystallization of ribbons with an initial thickness, the sequence of phase precipitation and morphology of the precipitates differ. At the first stage, in alloys of a hypoeutectic composition (at.% of B < 17.5), as well as in the thin cross-sections, α-Fe crystals are the first to nucleate and grow. They have faceting and form crystallites with a distinctly dendritic shape (Figure 11). The crystallites are randomly distributed over the amorphous matrix, and no correlation in their arrangement is observed. At the second crystallization stage, colonies are formed, which consist of α-Fe and Fe3B.
Thus, in hypoeutectic alloys, primary α-Fe crystals were not formed in the thick cross-sections. In the thin cross-sections, α-Fe crystals were always first to be precipitated. In the thick cross-sections, colonies were formed, which consisted of α-Fe and Fe3B, while in the thin cross-sections no colonies (i.e., simultaneous formation of α-Fe and Fe3B) were observed, and Fe3B grains emerged at the second crystallization stage. Fully crystallized samples of thick cross-sections contained dendritic α-Fe crystals and colonies consisting of α-Fe and Fe3B, and in the thin cross-sections there was a structure consisting of Fe and Fe3B grains.
It is reasonable to relate the observed difference in the morphology and arrangement of crystals in the thin and thick cross-sections to the proximity in thin surface cross-sections. In the thick cross-sections, the compensation of the bulk effect occurs, most probably, with the viscous flow of a matrix and deformation of precipitates and a matrix, and in some cases, probably, with the formation of micropores in the reaction front.
The formed α-Fe crystals in the thick cross-sections grow anisotropically in the field of tensile stresses, which explains their growth in the {111} planes in the {110} direction, but not in the close-packed {110}, as was observed in [74]. In the case of thin cross-sections, the compensation of the bulk effect has time to proceed by the diffusion of excess volume carriers to the surface due to proximity of the surface. Deformation fields around α-Fe have lower values, and the crystal shape is more equilibrium than that in the case of thick cross-sections. According to the literature data, the density of Fe crystals is 7.48 × 10³ kg m−3 [74], and that of Fe3B is 7.48 × 10³kg m−3 [75]. The density of amorphous Fe83B17 alloy is 7.31103 kg m−3 [75]. Consequently, under the formation of the same fraction of these phases, the arisen level of stresses, related to crystallization, will be higher in the case of Fe formation than that in the case of Fe3B formation. However, the compensation of bulk mismatch and, consequently, a decrease in the internal stresses are carried out more easily in the thin cross-sections. Therefore, the formation of primary Fe crystals and Fe3B occurs in all the alloys under study after the completion of Fe precipitation. The formation of colonies in the thick cross-sections, which have a complex structure and structural components nano-sized in two directions, may be associated, in this case, with a decrease in the stress level in the crystallization front and avoidance of the disturbance of material continuity.
In principle, there can be another explanation of the effects observed, i.e., chemical composition change in the thin cross-sections as compared with the thick ones. However, the study of distribution of element concentrations over sample depth, performed by Auger electron spectroscopy, did not reveal any significant differences.

6.2. Formation of a Nanocrystalline Structure as Demonstration of the Bulk Effect

A vivid demonstration of the influence of the bulk crystallization effect on the morphology and structure of the formed phases is the formation of a nanocrystalline structure in Al32Ge68 alloy. A feature of this material is that Al and Ge phases are formed under the decomposition of Al32Ge68 alloy, with Al being less dense and Ge being denser than the amorphous matrix. In this case, one could expect the formation of a specific structure in the region of the crystallization front. One can assume that the compensation of the bulk effects (with opposite signs) of phase formation should lead to the formation of a highly dispersed mixture of two formed phases in the reaction front in order to avoid the disturbance of sample continuity. In this case, bulk effects with opposite signs will be compensated, and the sample can remain continuous. The studies carried out [76] demonstrated that at an initial crystallization stage a nanocrystalline structure is formed, the nanocrystal size is about 10 nm. Crystallization begins in the depth and propagates to the sample edge. The formed nanocrystalline structure is very unstable. At that, equilibrium phases of Al and Ge are formed. Recrystallization under isothermal exposure occurs very quickly; the nanocrystalline region is followed immediately by the region of larger crystals. According to the data of differential scanning calorimetry, crystallization proceeds in one stage. Thus, at initial crystallization stages, a nanocrystalline structure is formed, which was detected near the crystallization front only. A significant grain growth occurs at a distance of 100 nm from the front.
The formation of a nanocrystalline structure, as a consequence of the compensation of bulk mismatch under the amorphous phase crystallization, is caused by the necessity of elastic stress compensation at a nanolevel in the crystallization front in order to avoid the disturbance of material continuity (the emergence of additional free surfaces under the decomposition will increase the free energy of a system and can make this process unprofitable). In this case, such demonstration of the bulk mismatch compensation is related to large differences in the density of an initial amorphous phase and formed crystalline phases. The specific molar volume of an amorphous matrix is, according to different data, within the limits of (11.2–12.6) 10−6 m3mol−1, and that of crystalline Al and Ge is 10.0 × 10⁻⁶ m3mol–1 and 13.6 × 10⁻⁶ m3mol−1, respectively. That is, the density of an amorphous matrix is in an intermediate position between Al and Ge densities, and the difference is approximately 20% for both elements. Thus, the formation of one phase under crystallization results in a very high level of stresses in the reaction front, which is compensated immediately under the formation of the second phase. Thereby, one succeeds in avoiding sample decomposition. The formation of phases in a nanocrystalline state results in the stress compensation not only at macrolevel, but at the microlevel (nanolevel). An important fact is that the amorphous phase exists in a narrow concentration rage only, and precipitation of one of the phases will result in a change in its composition and, consequently, to the decomposition. Therefore, the simultaneous formation of two phases is observed, and their size is determined by the necessity of compensation of the bulk effect of phase formation in order to preserve the sample continuity.
The formed nanocrystalline structure turns to be very unstable. In this structure, the area of interphase interfaces and the corresponding energy are high, that is why grain coarsening is necessary to diminish the free energy of the system, which happens in reality. In this case, nothing impedes the coalescence processes: the nanocrystals are separated by high-angle boundaries, but not by the special low-energy ones, and there is no layer of an amorphous matrix isolating the crystals from each other. Under the formation of a nanocrystals by the primary crystallization mechanism, the amorphous matrix changes its composition as the nanocrystals nucleate and grow. In the case of amorphous Al-Ge alloy, this process is impossible. The reason is that, as stated, the amorphous alloy of Al32Ge68 nominal content has a very narrow concentration region of existence [77], and the layers of an amorphous phase with a changed composition cannot exist between the grains. Consequently, there are no obstacles to coalescence, and the nanocrystalline structure will decompose easily. Al should be the leading phase here, for which the corresponding homologous temperature is lower. As shown experimentally, the prevailing growth of Al crystals is observed under the nanocrystalline phase separation.

6.3. Compensation of Structural Mismatch by Pore Fformation and Nanocrystal Formation in the Shear Bands

A number of works, for example, [78,79,80] were devoted to the study of shear band formation and structure in amorphous alloys. Plastic deformation in alloys is strongly localized and is realized by the formation and propagation of different shear bands. The rate of shear band propagation does not depend on the deformation rate in a range of 2 × 10⁻⁴–10−2 s−1. High shear stresses are localized in shear bands, as a result, a large amount of free volume is concentrated in them; the shear bands have more random structure compared to the surrounding amorphous phase [78,81]. The structure of the main part of an amorphous matrix also can change under deformation; it becomes anisotropic under certain conditions [29,30,31]. The number of shear bands depends on the alloy chemical composition and deformation conditions. Their size can be from several tens of nanometers to several micrometers in width and from tens to hundreds of micrometers in length.
As a result of plastic deformation, the amorphous phase structure becomes non-uniform: an amorphous structure in the region of a shear band differs from the structure in a surrounding amorphous matrix. The relaxation of a structure in the shear band can lead to different effects.
In literature there are several models which describe the processes responsible for the shear band formation. All of them include, to varying degrees, the concept of free volume. Thus, for example, in the work by Spaepen [82] it is assumed that the motion of a material in a shear band consists of the formation and disappearance of free volume regions. An interest in shear bands is caused by several factors. Firstly, a lot of mechanical properties of amorphous alloys depend on the presence and characteristics of shear bands. Secondly, as was demonstrated in [83,84,85], the nucleation of nanocrystals begins in shear bands or their vicinity. In [86], it was demonstrated that pores also grow in shear bands (Figure 12). The arrow indicates the reflex in which the dark-field image is obtained.
The analysis of pore growth kinetics (Figure 13) allowed estimating the effective diffusion coefficient. When calculating, it was assumed that pores grow due to diffusion of free volume from a shear band to the bulk of the surrounding matrix. It was determined that the diffusion coefficient decreases with time at room temperature RT (from 3 × 10⁻²⁴ m2/s for ageing for 1.78 × 10⁷ s, to 7 × 10⁻²⁵ m2/s for ageing for 2.95 × 10⁷ s). A decrease in the diffusion coefficient with time is caused by free volume depletion in shear zones adjacent to pores. As mentioned above, shear bands can be the regions of facilitated nanocrystal formation. The formation of nanocrystals in a shear band can be observed in Figure 12.
A number of experimental results also are an evidence of high diffusion coefficient values in these regions. In [30,87] the formation of nanocrystals was observed in deformation bands under the subsequent exposure of samples at room temperature. The preferred crystallization in shear bands was observed also in [88]. The authors found out the preferred nanocrystal formation in shear bands in Al88Y7Fe5 alloy samples deformed by tension. The authors related the nanocrystal formation in shear bands to an increase in the local mass transfer rate in these regions. Similar results were obtained in [89], where the authors demonstrated the formation of Al nanocrystals in rolled amorphous Al85.1Ni6Co2Gd6Si0.9 alloy at room temperature. Figure 14a shows the microstructure of an alloy deformed by multiple rolling. Figure 14b illustrates the microstructure of the same alloy after ageing at room temperature for ~6000 h. In Figure 14a, one can clearly see brighter regions with an extended shape, which are oriented along some direction. The size of the regions is up to 100 nm in length and 20–40 nm in width. These regions have rather sharp boundaries with the amorphous matrix and represent regions (shear bands) with a high level of deformation, i.e., shear bands. They contain a small number of nanocrystals formed during deformation. The surrounding matrix remains amorphous. Thus, the formation of Al nanocrystals under rolling occurred in the places of plastic deformation localization. Under the ageing of a sample at room temperature, its structure changed significantly. In shear bands, the number of nanocrystals increased strongly, and shear bands became completely filled with nanocrystals. Meanwhile, a small number of nanocrystals emerged in other parts of the amorphous matrix, too. The average size of nanocrystals in shear bands increased slightly.
For comparison, Figure 15 shows the microstructure of a sample after rolling and heating to 245 °C. One can see that a considerable number of nanocrystals were formed in the sample during heat treatment; however, it is seen that their major part is concentrated in the region of the shear bands. The rates of diffusion providing a slight growth of Al nanocrystals at about 60 °C were estimated to be 10−24 m2/s. These results agree with the data of [90], where it was demonstrated that the formation of excess volume during plastic flow can lead to an increase in the diffusion coefficient in shear bands by 4–6 orders of magnitude. The formation of nanocrystals in local shear bands in deformed amorphous alloys was observed in both Fe–B alloys (Figure 16) and deformation bands of Al88Ni2Y10 alloy (Figure 12). An important conclusion of the authors of the above works is that high atomic mobility in the zones of plastic deformation localization makes a crucial contribution in the nanocrystallization process stimulated by deformation.

7. Nanocrystal Formation in Amorphous Phase

The parameters of the crystallized structure depend on the processing conditions. As a result, many properties of materials change dramatically with a change in structure. So, for example, the properties of nanocrystalline alloys differ both from the properties of polycrystals and from the properties of amorphous alloys [3,4]. As a rule, the nanocrystalline structure forms by the primary crystallization reaction. The nanocrystalline structure in most cases is two-phase and consists of nanocrystals formed by the primary crystallization reaction, and interlayers of the remaining amorphous phase of a changed composition. The nanocrystalline structure was first obtained in an alloy of the Fe-Cu-Nb-Si-B system, called Finemet [91].
The principle of obtaining a nanocrystalline structure in this alloy was based on the fact that small amounts of copper and niobium were added to the base composition of the amorphous Fe–Si –B alloy. An amorphous Fe–Si–B alloy crystallizes upon heating to form a usual structure with a grain size noticeably exceeding nanosizes. Copper addition leads to the formation of microsegregations, which serve as sites of facilitated nucleation of crystals, and the addition of slowly diffusing niobium helps to slow down the growth of crystals. As a result, during crystallization of the amorphous Fe–Cu–Nb–Si–B alloy, a microstructure with a crystal size of about 10 nm was obtained. Nanocrystalline alloys of the Fe-CuNb–Si–B system have excellent magnetic properties and a huge amount of work has been devoted to their study [92,93,94,95,96,97]. Later, a number of alloys were obtained in the nanocrystalline state by the controlled crystallization of the amorphous phase. To date, the nanostructure has been obtained in a wide group of metal systems; there is a number of data on the parameters of the nanocrystalline structure obtained by different methods [98,99,100,101]. As was mentioned above, depending on chemical composition, nanocrystalline materials have good plasticity and high viscosity, high strength and hardness, low moduli of elasticity, higher diffusion coefficients, larger values of thermal expansion coefficient, and better magnetic properties as compared with traditional crystalline materials. Research on nanocrystalline materials is actively being carried out at the present time.

8. Nanocrystal Formation under Heating and Deformation

As already mentioned, the amorphous phase is crystallized at an increase in the temperature or duration of heat treatment. At that, metastable phases are generally formed at an initial crystallization stage, with some of these phases being formed only under the crystallization of the metallic glasses and not being formed under other conditions [102,103,104]. A transition from the amorphous to the equilibrium state is often carried out by successive structural transformations [35,105]. An important feature of the amorphous phase crystallization is the formation of the crystalline phases at an initial stage, the short-range order of which corresponds to that of these ordered regions. Therefore, a structural state of amorphous phase before beginning of the crystallization can have a decisive effect on the morphology, phase composition, crystallographic characteristics of a structure formed under crystallization. In [106,107,108], the effect of an initial amorphous state on the parameters of a crystalline structure formed under the crystallization of the metallic glasses was investigated. It was determined that deformation or annealing within an amorphous state leads to the formation of a non-uniform amorphous structure (nanoglass). This affects the parameters of a crystalline structure formed under the subsequent treatment. It was shown that the state of the amorphous phase before the crystallization onset can significantly affect the characteristics of the formed crystalline structure. The formation of an inhomogeneous amorphous structure in Al-based alloys accelerates the crystallization processes, affects the nanocrystal size and the fraction of a nanocrystalline component in amorphous-nanocrystalline alloys. The history of samples turned to be important, too, that is, under which conditions nanocrystals were nucleated: under deformation or heat treatment. The investigations of a large group of Al-based alloys shows that the highest fraction of the nanocrystals and the smallest nanocrystal size were observed in the case when the heterogeneous amorphous phase was formed during deformation. Table 1 lists some data on the parameters of the structure formed under the crystallization of the uniform and non-uniform amorphous phases [106,107,108].
As one can see from the table, the largest Al nanocrystals formed under the separation of the amorphous phase and their lowest volume fraction are observed under the crystallization of the homogeneous amorphous phase (without any treatment of the amorphous phase before the crystallization onset). Under nanocrystallization of the heterogeneous amorphous phase with preliminary heat treatment, the listed parameters were intermediate.
Thus, the formation of the nanocrystals depends essentially on the conditions of an action on an amorphous structure, and the use of combined treatments permits obtaining structure with different structural parameters.
Note that the use of heat treatment allows obtaining a nanocrystalline structure not in all systems. For a nanostructure to be formed from the amorphous phase, a high rate of crystal nucleation and a low rate of crystal growth are necessary. This depends, particularly, on the diffusion rate and, of course, cannot be provided in all materials. Severe plastic deformation turned to be the other method, which is effective in view of the nanocrystallization initiation [84,89,102,109,110,111,112,113]. The use of this method enabled obtaining an amorphous-nanocrystalline structure in alloys where it is not formed under the crystallization by heat treatment [112,113]. The formation of a nanostructure under plastic deformation generally occurs in the zones of plastic deformation localization (shear bands) or in the regions surrounding them. The formation of nanocrystals in these regions is caused by high values of the parameters of diffusion mass transfer. The reasons for an increase in the diffusion coefficient by several orders of magnitude are not fully understood yet. In general, an increase in the diffusion coefficient in deformation bands is related to one of the two processes (or their combination): a local strong, but short (~30 ps), increase in the temperature in this region [114,115,116,117,118] and a change in the structure of the amorphous phase in a shear band (an increase in the free volume fraction) [119,120,121,122]. Today, it is unclear which of the reasons constitutes a deciding factor [123]. Both of the factors obviously promote the diffusion acceleration, and one of them can prevail in different cases. The formation of shear bands occurs under the action of shear stresses. Therefore, shear stresses play an important role in nanocrystalline structure formation.

9. Mechanical Properties of Metallic Glasses near Shear Bands

The results above and the available literature data show that a material in shear bands is softened due to high concentration of free volume [78] and a disordered structure. This results in a significant diminution in the diffusion coefficient in an amorphous phase (by several orders of magnitude), and shear bands become the regions of facilitated nanocrystal formation under subsequent heating or even aging at room temperature. Since these factors turn to be important to find out the conditions of the nanocrystal formation [124,125], the issue of definition of the mechanical properties of the material near shear bands has become prominent. As is well known, a thickness of shear bands is from several tens to hundreds of nanometers; steps with the sizes depending on the deformation level and elastic parameters of alloys formed on the sample surface in the places where shear bands come to the surface [78,126]. The mechanical properties of the alloys with shear bands were studied in a number of works by nanoindentation [125,126,127]. At that, it was determined [127] that near a shear band, there is a region of low hardness. The size of this region is more than 100 µm, which is significantly greater than the size of the shear band. In [128] it was found out that both hardness and the Young’s modulus diminish in the shear bands and in the zones around them. However, the size of the region with changed Young’s modulus was smaller than that in [127].
The local distribution of zones with different Young’s moduli in deformed amorphous Al87Ni8La5 alloy was investigated in [128]. PeakForce QNM (DimensionFastScanTM Atomic Force Microscope (AFM), Bruker) was used for the investigation of local mechanical properties. The measurements were performed with standard probes, and the load was varied from 0.3 to 0.85 µN. After the deformation of an amorphous alloy by multiple rolling, it was discovered that non-uniformity of the distribution of local mechanical properties over the alloy surface (non-uniform distribution of the effective Young’s modulus) appears with a rise of the load. At that, the non-uniformity in a band system was also observed. The band thickness is 50–250 nm. Figure 17 shows the maps of mechanical property distribution, observed under different loads (in Figure 17 the bands are marked with arrows). The heterogeneities were most noticeable under the load of 0.85 µN. The values of thickness of the bands, as well as their shape and distribution over the surface, were fully consistent with the shear bands observed on the surface of deformed samples using a scanning electron microscope (Figure 18).
The results obtained in [128] are an evidence that the subsurface region of a deformed amorphous alloy contains a lot of deformation bands, where the material is characterized by a lower Young’s modulus. The size of the zones with lower Young’s modulus is tenths of a micrometer. These zones are distributed uniformly over the sample. The cross-sectional dimensions of such zones (bright bands in Figure 17) can change from tens nanometers up to 0.5 µm. A sharp contrast between the amorphous matrix and deformation bands indicates a significant change in the properties. It should be noted that the properties change insignificantly in the region with a width of several tenths of a micrometer. The difference between these results and the data from [125,126,127] is apparently caused by different deformation level: single shear bands in the mentioned works and numerous shear bands in [128]. Note, however that that the size of the zones with lower Young’s modulus in vicinity of shear bands in amorphous Al87Ni8La5 alloy is noticeably less than that observed in Zr-based alloys. This difference can be caused by different reasons, for example, different deformation conditions (compression of Zr-based alloys and rolling of Al-based alloy) or a different composition of the alloys.

10. Amorphous Structure Rejuvenation

As already mentioned, amorphous alloys have a number of good properties [129,130,131,132,133,134]. Some of them (for example, magnetic properties) can be increased significantly by low-temperature annealing, annealing in a magnetic field, etc. Such treatments, however, often result in the embrittlement of these materials, which limits dramatically the possibilities of their practical application. High-pressure torsion was used to recover plasticity [135,136,137]. It was shown in [137] that the pair distribution function of atoms changes after deformation. This indicates a noticeable redistribution of atoms, leading to structure change. The authors of [137] considered that this structure variation is caused by local heating because of the deformation. A rising degree of structure disordering after deformation was found also in [138].
Last years, a new method for recovery of plasticity was found; it is cycling in a temperature range between room or elevated temperature and the temperature of liquid nitrogen [139]. This method is called rejuvenation. The main idea of cryogenic thermal cycling is a variation of the structure under the action of stresses caused by a non-uniform change in the thermal expansion coefficient (TEC) in a sample. A heterogeneous amorphous phase contains regions with different chemical composition, density, short-range order type, etc. Since such non-uniform regions are characterized by different value of TEC, an abrupt change in the temperature under thermal cycling will induce stresses which cause irreversible local atomic restructurings [140,141]. The researchers succeeded in recovering plasticity in the Zr55Cu30Al10Ni5 alloy by this method [140]. The authors of this work, however, did not reveal any significant changes in the structure. The method of cryogenic cycling aroused a big interest [142,143,144]. The idea of induction of stresses in the alloy with the non-uniform distribution of the thermal expansion coefficients turned to be very promising. The use of this method allowed for the observation of a structural change in inhomogeneous amorphous Zr46Cu38Al8Ag8 alloy [145], as well as completely recovering the amorphous phase in partially crystalline Al88Ni6Y6 and Al87Ni8Gd5 alloys [146,147]. The authors of the latter work used the idea of increasing the difference in the thermal expansion coefficients due to the formation of a small number of nanocrystals in the amorphous phase and the subsequent cryogenic thermal cycling of a structure consisting of the amorphous phase and Al nanocrystals uniformly distributed over it. Figure 19 illustrates the initial parts of the X-ray diffraction patterns of Al88Ni6Y6 alloy before (a) and after (b) the cryogenic thermal cycling (60 cycles). One can see that the intensity of the reflection corresponding to nanocrystals (curve 5) decreases significantly during cryogenic cycling. The authors of [146,147] did not observe any signs of the crystalline phases with an increase in the treatment duration. So, it was shown that the method of cryogenic rejuvenation actually enables recovering an amorphous structure in partially crystalline alloys, thus increasing the plasticity of a material.

11. Possibility of Controlling the Structure of Fully or Partially Crystallized Samples

An important consequence of the investigation results described above is the possibility of controlling a structure formed under crystallization. As shown above, both the phase composition [148] and parameters of the formed structure [106,107,108] depend on the history of a sample and the crystallization conditions. Also, it was found out that, for example, in amorphous alloys of Ni–Mo–P and Ni–Mo–B systems, quite different crystalline structures arise under the crystallization above or below the glass transition temperature [149,150,151]. This difference is caused by different structures of the amorphous phase in these temperature ranges. When carrying out crystallization under the conditions when it is preceded by separation of the amorphous phase, one can form a nanocrystalline structure which will not be formed under conventional annealing (for example, in Ni-Mo-B system [40]). Another example is ferromagnetic Fe72Al5P10Ga2C6B4Si1 alloy with good magnetic properties, where a nanocrystalline structure is formed above the glass transition temperature only [152,153]. These structures also include the so-called SS-phase which was discovered under the crystallization of a number of Fe-, Co-, Ni-, and Pd-based amorphous alloys in 1976 [154], when there was no term “nanostructures”. Another example is [155], where the possibility of obtaining an amorphous sample with the crystalline surface (Figure 20) or a crystalline sample with the amorphous surface (Figure 21) was demonstrated by an amorphous alloy of Fe-B-P system. The materials obtained by this approach will be characterized by different physical properties. The latter example shows how the knowledge of processes occurring within an amorphous state and under the crystallization of amorphous alloys allows obtaining different types of structures.

12. Conclusions

Summarizing the above, the following should be noted.
  • The transformation of a homogeneous amorphous phase into a heterogeneous phase, including the scale of inhomogeneities and the effect of external influences, are considered.
  • The influence of amorphous structure changes on the forming crystalline structure is shown.
  • The crystallization processes of the amorphous phase, such as homogeneous and heterogeneous nucleation of crystals, are considered.
  • Possible way of compensation for volume mismatch (changing the sequence of formation of crystalline phases, crystal morphology, formation of nanocrystals or pores) is analyzed.
  • Nanocrystal formation is described.
  • The effect of plastic deformation on the formation of nanocrystals and mechanical properties of the amorphous phase near the shear bands are shown.
  • The possibility of restoring the amorphous structure is discussed.
The results presented above represent a serious step in developing the conception of the structure, its evolution, and some properties of amorphous and partially crystalline materials. The results of numerous studies show that the processes of crystallization of metallic glasses have a number of features, and different actions on a uniform amorphous structure can initiate processes resulting in the formation of materials with various structural parameters. These changes in the phase composition, microstructure, crystallization mechanism, as well as in the morphology and size of crystals, naturally affect the properties, which are important for the production of novel materials with the required physical properties.

Author Contributions

A.A. and G.A. conceived and designed the experiments; A.A. performed the experiments by all electron microscopy methods, studied mechanical properties etc., G.A. performed the experiments using X-ray diffraction methods, analyzed the data; both authors discussed the date and wrote the paper. All authors have read and agreed to the published version of the manuscript.

Funding

This research received no external funding.

Acknowledgments

The authors thank their colleagues from the Institute of Solid State Physics of the Russian Academy of Sciences for a useful discussion of the results.

Conflicts of Interest

The authors declare no conflict of interest.

References

  1. Willens, R.H.; Klement, W.; Duwez, P. Continuous series of metastable solid solutions in silver-copper alloys. J. Appl. Phys. 1960, 31, 1136–1137. [Google Scholar] [CrossRef]
  2. He, Y.; Poon, J.F.; Shiflet, G.Y. Synthesis and properties of metallic glasses that contain aluminum. Science 1988, 241, 1640. [Google Scholar] [CrossRef]
  3. Gleiter, H. Nanocrystalline materials. Prog. Mater. Sci. 1989, 33, 223. [Google Scholar] [CrossRef] [Green Version]
  4. Birringer, R. Nanocrystalline materials. Mater. Sci. Eng. A 1989, 117, 33–43. [Google Scholar] [CrossRef]
  5. Abrosimova, G.E.; Aronin, A.S.; Kir’janov, Y.V.; Gloriant, T.F.; Greer, A.L. Nanostructure and microhardness of Al86Ni11Yb3 nanocrystalline alloy. NanoStructured Mater. 1999, 12, 617–620. [Google Scholar] [CrossRef]
  6. Inoue, A.; Ochiai, T.; Horio, Y.; Masumoto, T. Formation and mechanical properties of amorphous Al-Ni-Nd alloys. Mater. Sci. Eng. A 1994, 179, 649. [Google Scholar] [CrossRef]
  7. Kim, Y.H.; Inoue, A.; Masumoto, T. Increase in mechanical strength of Al–Y–Ni amorphous alloys by dispersion of nanoscale fcc-Al particles. Mater. Trans. JIM 1991, 32, 331–338. [Google Scholar] [CrossRef] [Green Version]
  8. Chou, C.-P.; Turnbull, D. Transformation behavior of Pd-Au-Si metallic glasses. J. Non Cryst. Solids 1975, 17, 169–188. [Google Scholar] [CrossRef]
  9. Abrosimova, G.E.; Aronin, A.S. Phase segregation in the Fe90Zr10 amorphous alloy under heating. Phys. Solid State 1998, 40, 1603–1606. [Google Scholar] [CrossRef]
  10. Chen, H.S.; Turnbull, D. Formation, stability and structure of palladium-silicon based alloy glasses. Acta Metal. 1969, 17, 1021. [Google Scholar] [CrossRef]
  11. Osamura, K. SAXS study on the structure and crystallization of amorphous metallic alloys. Colloid. Polym. Sci. 1981, 259, 677. [Google Scholar] [CrossRef]
  12. Terauchi, H. Heterogeneous structure of amorphous materials. J. Phys. Soc. Jap. 1983, 52, 3454–3459. [Google Scholar] [CrossRef]
  13. Osamura, K. Structure and mechanical properties of a Fe90Zr10 amorphous alloy. J. Mater. Sci. 1984, 19, 1917. [Google Scholar] [CrossRef]
  14. Mak, A.; Samwer, K.; Johnson, W.L. Evidence for two distinct amorphous phases in (Zr0.667Ni0.333)1−xBx alloys. Phys. Lett. A 1983, 98, 353. [Google Scholar] [CrossRef]
  15. Mehra, M.; Schulz, R.; Johnson, W.L. Structural studies and relaxation behavior of (Mo0.6Ru0.4)100-xBxmetallic glasses. J. Non Crystall. Solids 1984, 61, 859–864. [Google Scholar] [CrossRef]
  16. Nagarajan, T.; Asari, U.C.; Srinivasan, S.; Sridharan, V.; Narayanasamy, A. Amorphous phase separation in METGLAS 2605CO. Hyperfine Interact. 1987, 34, 491. [Google Scholar] [CrossRef]
  17. Abrosimova, G.E.; Aronin, A.S.; Ignat’eva, E.Y.; Molokanov, V.V. Phase decomposition and nanocrystallization in amorphous Ni70Mo10P20 alloy. J. Magn. Magn. Mater. 1999, 203, 169–171. [Google Scholar] [CrossRef]
  18. Abrosimova, G.E.; Aronin, A.S. Evolution of the amorphous-phase structure in metal-metal type metallic glasses. J. Surf. Investig. 2015, 9, 887–893. [Google Scholar] [CrossRef]
  19. Marcus, M.A. Phases separation and crystallization in amorphous Pd-Si-Sb. J. Non Cryst. Solids 1979, 30, 317–335. [Google Scholar] [CrossRef]
  20. Yavari, A.R. New amorphous Pb60Pd40 with split first X-ray halo and possible unmixing. Inter. J. Rapid Solidif. 1986, 2, 47–54. [Google Scholar]
  21. Inoue, A.; Bizen, Y.; Kimura, H.M.; Yamamoto, Y.; Tsai, A.P. Development of compositional short-range ordering in an Al50Ge40Mn10 amorphous alloy upon annealing. J. Mater. Sci. Lett. 1987, 6, 811–814. [Google Scholar] [CrossRef]
  22. Inoue, A.; Yamamoto, M.; Kimura, H.M.; Masomoto, T. Ductile aluminum-based amorphous alloys with two separated phases. J. Mater. Sci. Lett. 1987, 6, 194–196. [Google Scholar] [CrossRef]
  23. Yavari, A.R. On the structure of metallic glasses with double diffraction halos. Acta Metall. 1988, 36, 1863–1872. [Google Scholar] [CrossRef]
  24. Kűndig, A.A.; Ohnuma, M.; Ping, D.H.; Ohkubo, T.; Hono, K. In situ formed two-phase metallic glass with surface fractal microstructure. Acta Mater. 2004, 52, 2441–2448. [Google Scholar] [CrossRef]
  25. Mattern, N.; Kühn, U.; Gebert, A.; Gemming, T.; Zinkevich, M.; Wendrock, H.; Schultz, L. Microstructure and thermal behavior of two-phase amorphous Ni–Nb–Y alloy. Scr. Mater. 2005, 53, 271–274. [Google Scholar] [CrossRef]
  26. Han, J.H.; Mattern, N.; Vainio, U.; Shariq, A.; Sohn, S.W.; Kim, D.H.; Eckert, J. Phase separation in Zr56-xGdxCo28Al16 metallic glasses (0 <x <20). Acta Mater. 2014, 66, 262–272. [Google Scholar] [CrossRef]
  27. Masumoto, T.; Maddin, R. Structural stability and mechanical properties of amorphous metals. Mater. Sci. Eng. 1975, 19, 1–24. [Google Scholar] [CrossRef]
  28. Wang, X.D.; Bednarcik, J.; Saksi, K.; Franz, H.; Cao, Q.P.; Jiang, J.Z. Tensile behavior of bulk metallic glasses by in situ x-ray diffraction. Appl. Phys. Lett. 2007, 91, 081913. [Google Scholar] [CrossRef] [Green Version]
  29. Stoica, M.; Das, J.; Bednarcik, J.; Franz, H.; Mattern, N.; Wang, W.H.; Eckert, J. Strain distribution in Zr64.13Cu15.75Ni10.12Al10 bulk metallic glass investigated by in situ tensile tests under synchrotron radiation. J. Appl. Phys. 2008, 104, 013522. [Google Scholar] [CrossRef] [Green Version]
  30. Wang, X.D.; Bednarcik, J.; Franz, H.; Lou, H.B.; He, Z.H.; Cao, Q.P.; Jiang, J.A. Local strain behavior of bulk metallic glasses under tension studied by in situ x-ray diffraction. Appl. Phys. Lett. 2009, 94, 011911. [Google Scholar] [CrossRef] [Green Version]
  31. Abrosimova, G.; Aronin, A.; Afonikova, N.; Kobelev, N. Influence of deformation on the structural transformation of the Pd40Ni40P20 amorphous phase. Phys. Solid State 2010, 52, 1892–1898. [Google Scholar] [CrossRef]
  32. Suzuki, C.K.; Doi, K.; Kohra, K. Small Angle and Vary Small Angle X-ray Scattreing from Amorphous Pd80Si20 before and after Cold Work. Jpn. J. Appl. Phys. 1981, 20, L271–L274. [Google Scholar] [CrossRef]
  33. Walter, J.; Legrand, D.G.; Luborsky, F.E. Small Angle X-ray Scattering from the Amorphous Alloy Fe40Ni40P14B6. Mater. Sci. Eng. 1977, 29, 161–167. [Google Scholar] [CrossRef]
  34. Liebermann, H.H.; Graham, C.D.; Flanders, P., Jr. Changes in curie temperature, physical dimensions, and magnetic anisotropy during annealing of amorphous magnetic alloys. IEEE Trans. Magn. 1977, 13, 1541–1543. [Google Scholar] [CrossRef]
  35. Abrosimova, G.E.; Serebeyakov, A.V.; Sokolovskaya, Z.D. Change of structure and magnetic-properties of amorphous iron base-metal—metalloid alloys during heat-treatment. Fiz. Met. I Metalloved. 1988, 66, 727–730. [Google Scholar]
  36. Chen, H.S. Ductile-brittle transition in metallic glasses. Mater. Sci. Eng. 1976, 26, 79–82. [Google Scholar] [CrossRef]
  37. Naka, M.; Masumoto, T.; Chen, H.S. Effect of metalloidal elements on strength and thermal stability of Fe-base glasses. J. De Phys. C 1980, 41, C8-839–C8-842. [Google Scholar]
  38. Gleiter, H. Nanoglasses: A new kind of noncrystalline materials. Beilstein J. Nanotechnol. 2013, 4, 517–533. [Google Scholar] [CrossRef] [Green Version]
  39. Aronin, A.S.; Abrosimova, G.E.; Gurov, A.F.; Kir’janov, Y.V.; Molokanov, V.V. Nanocrystallization of bulk Zr–Cu–Ti metallic glass. Mater. Sci. Eng. A 2001, 304, 375–379. [Google Scholar] [CrossRef]
  40. Abrosimova, G.; Aronin, A.; Ignatieva, E. Decomposition of amorphous phase in Ni70Mo10B20 alloy above glass transition temperature. Mater. Sci. Eng. A 2007, 449, 485–488. [Google Scholar] [CrossRef]
  41. Doi, K.; Kayano, H.; Masumoto, T. Small-angle scattering from neutron-irradiated amorphous Pd80Si20. J. Appl. Cryst. 1978, 11, 605. [Google Scholar] [CrossRef]
  42. Fang, J.X.; Vainio, U.; Puff, W.; Würschum, R.; Wang, X.L.; Wang, D.; Ghafari, M.; Jiang, F.; Sun, J.; Hahn, H.; et al. Atomic structure and structural stability of Sc75Fe25 nanoglasses. Nano Lett. 2012, 12, 458–463. [Google Scholar] [CrossRef] [PubMed]
  43. Hebert, R.J. Deformation-induced synthesis of Al-based heterogeneous nanoscale microstructures. Rev. Adv. Mater. Sci. 2004, 6, 120–130. [Google Scholar]
  44. Gleiter, H. Are there ways to synthesize materials beyond the limits of today? Metall. Mater. Trans. A 2009, 40, 1499–1509. [Google Scholar] [CrossRef]
  45. Ritter, Y.; Şopu, D.; Gleiter, H.; Albe, K. Structure, stability and mechanical properties of internal interfaces in Cu64Zr36 nanoglasses studied by MD simulations. Acta Mater. 2011, 59, 6588–6593. [Google Scholar] [CrossRef]
  46. Adjaoud, O.; Albe, K. Microstructure formation of metallic nanoglasses: Insights from molecular dynamic simulations. Acta Mater. 2018, 145, 322–330. [Google Scholar] [CrossRef]
  47. Cheng, B.; Trelewicz, J.R. Controlling interface structure in nanoglasses produced through hydrostatic compression of amorphous nanoparticles. Phys. Rev. Mater. 2019, 3, 035602. [Google Scholar] [CrossRef]
  48. Aronin, A.S.; Abrosimova, G.E.; Zver’kova, I.I.; Kir’janov, Y.V.; Molokanov, V.V.; Petrzhik, M.I. The structure of nanocrystalline Ni58.5Mo31.5B10 and structure evolution at heat treatment. Mater. Sci. Eng. A 1997, 226, 536–540. [Google Scholar] [CrossRef]
  49. Zhang, Y.; Hono, K.; Inoue, A.; Sakurai, T. APFIM studies of nanocrystalline microstructural evolution in Fe-2%B(-Cu) amorphous alloys. Mater. Sci. Eng. A 1996, 217, 407–413. [Google Scholar] [CrossRef]
  50. Hono, K.; Ping, D.H.; Ohnuma, M.; Onodera, H. Cu clustering and Si partitioning in the early crystallization stage of an Fe73.5Si13.5B9Nb3Cu1amorphous alloy. Acta Mater. 1999, 47, 997–1006. [Google Scholar] [CrossRef]
  51. Abrosimova, G.E.; Aronin, A.S.; Zver’kova, I.I.; Kir’janov, Y.V.; Shekhtman, V.S. Nanocrystalline Ni58.5Mo31.5B10 and Ni63Mo27B10 alloys: Microstructure and its evolution at annealling. J. Surf. Investig. X Ray Synchrotron Neutron Tech. 1998, 4, 31–39. (In Russian) [Google Scholar]
  52. Abrosimova, G.E.; Aronin, A.S.; Zver’kova, I.I.; Kir’janov, Y.V.; Gurov, A.F. Production, structure and microhardness of nanocrystalline Ni-Mo-B alloys. Phys. Solid State 1998, 40, 8–13. [Google Scholar] [CrossRef]
  53. Abrosimova, G.E.; Aronin, A.S.; Kir’janov, Y.V.; Zver’kova, I.I.; Molokanov, V.V.; Alves, H.; Köster, U. The formation, structure and properties of nanocrystalline Ni-Mo-B alloys. J. Mater. Sci. 1999, 34, 1611–1618. [Google Scholar] [CrossRef]
  54. Hansen, M.; Anderko, K. Constitution of Binary Alloys, 2nd ed.; McGraw-Hill Book Company, Inc.: New York, NY, USA; Toronto, ON, Canada; London, UK, 1958. [Google Scholar]
  55. Nakarato, K.; Kawamura, Y.; Tsai, A.P.; Inoue, A. On the growth of nanocrystalline grains in an aluminum-based amorphous alloy. Appl. Phys. Lett. 1993, 63, 2644–2646. [Google Scholar] [CrossRef]
  56. Greer, A.L. Nanostructured Materials: Science & Technology; Chow, G.M., Ed.; NATO ASI Series; Kluwer Academical Publisher: Dordrecht, The Netherlands; London, UK, 1998; p. 457. [Google Scholar]
  57. Inoue, A.; Tomioke, H.; Masumoto, T. Mechanical properties of ductile Fe-Ni-Zr and Fe-Ni-Zr (Nb or Ta) amorphous alloys containing fine crystalline particles. J. Mater. Sci. 1983, 18, 153–160. [Google Scholar] [CrossRef]
  58. Köster, U.; Herold, U. Glassy Metals II. Atomic Structure and Dynamics, Electronicv Structure, Magnetic Propertie; Beck, H., Gűntherodt, H.-J., Eds.; Springer: Berlin, Germany, 1983. [Google Scholar]
  59. Abrosimova, G.E.; Aronin, A.S.; Kir’janov, Y.V. Formation and structure of nanocrystals in an Al86Ni11Yb3 alloy. Phys. Solid State 2001, 43, 2003–2011. [Google Scholar] [CrossRef]
  60. Köster, U.; Schunemann, M. Rapidly Solidified Alloys; Liebermann, H.H., Ed.; Marcel Dekker Inc.: New York, NY, USA, 1993; p. 303. [Google Scholar]
  61. Christian, J.W. The Theory of Transformation in Metals and Alloys; Part 1; Pergamon Press: Oxford, UK, 1978; ISBN 9780080542775. [Google Scholar]
  62. Kantrowitz, A. Nucleation in very rapid vapor expansions. J. Chem. Phys. 1951, 19, 1097–1100. [Google Scholar] [CrossRef]
  63. Greenwood, G.W. The Mechanism of Phase Transformations in Crystalline Solids; Inst of Metals: London, UK, 1969; p. 103. [Google Scholar]
  64. Galagher, P.C.J. The influence of alloying, temperature, and related effects on the stacking fault energy. Metall. Trans. 1970, 1, 2429–2461. [Google Scholar]
  65. Foley, J.C.; Allen, D.R.; Perepezko, J.H. Analysis of nanocrystal development in Al-Y-Fe and Al-Sm glasses. Scr. Mater. 1996, 35, 655–669. [Google Scholar] [CrossRef]
  66. Hono, K.; Zhang, Y.; Inoue, A.; Sakurai, T. Atom probe studies of nanocrystalline microstructural evolution in some amorphous alloys. Mater. Trans. JIM 1995, 36, 909–917. [Google Scholar] [CrossRef] [Green Version]
  67. Ham, F.S. Theory of diffusion-limited precipitation. J. Phys. Chem. Solids. 1958, 6, 335–351. [Google Scholar] [CrossRef]
  68. Allen, D.R.; Folley, J.C.; Perepezko, J.H. Nanocrystal development during primary crystallization of amorphous alloys. Acta Mater. 1998, 46, 431–440. [Google Scholar] [CrossRef]
  69. Howie, A.; Swann, P.R. Direct measurement of stacking-fault energies from observations of dislocation nodes. Phil. Mag. 1961, 6, 1215–1226. [Google Scholar] [CrossRef]
  70. Ardell, A.Y. The effect of volume fraction on particle coarsening: Theoretical considerations. Acta Metal. 1972, 20, 61–71. [Google Scholar] [CrossRef]
  71. Abrosimova, G.E.; Aronin, A.S.; Barkalov, O.I.; Dement’eva, M.M. Formation of the nanostructure in amorphous alloys of Al-Ni-Y system. Phys. Solid State 2013, 55, 1773–1778. [Google Scholar] [CrossRef]
  72. Kosevich, V.M.; Sokol, A.A. Crystal Growth from Amorphous Phase; International School on Crystal Growth: Suzdal, Russia, 1980; p. 161. (In Russian) [Google Scholar]
  73. Walter, J.L.; Bartram, S.R.; Mella, I. Formation and crystallization of alloys with two amorphous phases. Mat. Sci. Eng. 1978, 36, 193–205. [Google Scholar] [CrossRef]
  74. Vincze, I.; Kemeny, I.; Schaafsma, A.; Lovas, A.; van der Woode, F. Chemical and Topological Short-Range Order in Metallic Glasses; KFKI-90 Hungarian Academy of Sciences: Budapest, Hungary, 1980; pp. 11–15. [Google Scholar]
  75. O`Handley, R.C.; Hasegava, R.; Ray, R.; Chou, C.P. Ferromagnetic properties of some new metallic glasses. Appl. Phys. Lett. 1976, 29, 330–332. [Google Scholar] [CrossRef]
  76. Barkalov, O.I.; Aronin, A.S.; Abrosimova, G.E.; Ponyatovsky, E.G. Formation and structure evolution of the bilk amorpgous Al32Ge68 alloy on heating. J. Non Cryst. Solids 1996, 202, 266–271. [Google Scholar] [CrossRef]
  77. Barkalov, O.I.; Belash, I.T.; Degtyareva, V.F.; Ponyatovsky, E.G. Crystalline and amorphous state of high pressure-treated Al-Ge alloys. Fiz. Tverd. Tela 1987, 29, 1975–1978. [Google Scholar]
  78. Greer, A.L.; Cheng, Y.Q.; Ma, E. Shear bands in metallic glasses. Mater. Sci. Eng. R 2013, 74, 71–132. [Google Scholar] [CrossRef]
  79. Li, J.; Wang, Z.L.; Hufnagel, T.C. Characterization of nanometer-scale defects in metallic glasses by quantitative high-resolution transmission electron microscopy. Phys. Rev. B 2002, 65, 144201. [Google Scholar] [CrossRef] [Green Version]
  80. Glezer, A.; Plotnikova, M.R.; Shalimova, A.V.; Dobatkin, S.V. Megaplastic deformation of amorphous alloys. I. Structure and mechanical properties. Proc. RAS Phys. Ser. 2009, 73, 1302–1309. (In Russian) [Google Scholar]
  81. Stolpe, M.J.; Kruzic, J.; Busch, R. Evolution of shear bands, free volume and hardness during cold rolling of a Zr-based bulk metallic glass. Acta Mater. 2014, 64, 231–240. [Google Scholar] [CrossRef]
  82. Spaepen, F. A microscopic mechanism for steady state inhomogeneous flow in metallic glasses. Acta Metall. 1977, 25, 407–415. [Google Scholar] [CrossRef]
  83. Wang, K.; Fujita, T.; Zeng, Y.Q.; Nishiyama, N.; Inoue, A.; Chen, M.W. Micromechanisms of serrated flow in a Ni50Pd30P20 bulk metallic glass with a large compression plasticity. Acta Mater. 2008, 56, 2834–2842. [Google Scholar] [CrossRef]
  84. Aronin, A.; Abrosimova, G.; Matveev, D.; Rybchenko, O. Structure and Properties Of Nanocrystalline Alloys Prepared By High Pressure Torsion. Rev. Adv. Mater. Sci. 2010, 25, 52–57. [Google Scholar]
  85. Abrosimova, G.E.; Aronin, A.S.; Dobatkin, S.V.; Kaloshkin, S.D.; Matveev, D.V.; Rybchenko, O.G.; Tatiyanin, E.V.; Zverkova, I.I. The formation of nanocrystalline structure in amorphous Fe-Si-B alloy by severe plastic deformation. J. Metastable Nanocrystalline Mater. Ser. 2005, 24, 69–72. [Google Scholar] [CrossRef]
  86. Aronin, A.S.; Louzguine-Luzgin, D.V. On nanovoids formation in shear bands of an amorphous Al-based alloy. Mech. Mater. 2017, 113, 19–23. [Google Scholar] [CrossRef]
  87. Hebert, R.J.; Boucharat, N.; Perepezko, J.H.; Rösner, H.; Wilde, G. Calorimetric and microstructural analysis of deformation induced crystallization reactions in amorphous Al88Y7Fe5 alloy. J. Alloy. Compd. 2007, 434, 18–21. [Google Scholar] [CrossRef]
  88. Wilde, G.; Rösner, H. Nanocrystallization in a shear band: An in situ investigation. Appl. Phys. Lett. 2011, 98, 251904. [Google Scholar] [CrossRef]
  89. Abrosimova, G.; Aronin, A.; Barkalov, O.; Matveev, D.; Rybchenko, O.; Maslov, V.; Tkatch, V. Structural transformations in the Al85Ni6.1Co2Gd6Si0.9 amorphous alloy during multiple rolling. Phys. Solid State 2011, 53, 229–233. [Google Scholar] [CrossRef]
  90. Mazzone, G.; Montone, A.; Antisari, M.V. Effect of plastic flow on the kinetics of amorphous phase growth by solid-state reaction in the Ni-Zr system. Phys. Rev. Lett. 1990, 65, 2019–2023. [Google Scholar] [CrossRef] [PubMed]
  91. Yoshizawa, Y.; Oguma, S.; Yamauchi, K. New Fe-based soft magnetic alloys composed of ultrafine grain structure. J. Appl. Phys. 1988, 64, 6044–6046. [Google Scholar] [CrossRef]
  92. Allia, P.; Baricco, M.; Knobel, M.; Tiberto, P.; Vinai, F. Nanocrystalline Fe73.5 Cu1Nb3Si13.5B9 obtained by direct-current Joule heating. Magnetic and mechanical properties. Philos. Mag. B Phys. Condens. Matter. 1993, 68, 853–860. [Google Scholar] [CrossRef]
  93. Ito, N.; Suzuki, K. Improvement of magnetic softness in nanocrystalline soft magnetic materials by rotating magnetic field annealing. J. Appl. Phys. 2005, 97, 10F503. [Google Scholar] [CrossRef]
  94. Gheiratmand, T.H.; Hosseini, R.M. Finemet nanocrystalline soft magnetic alloy: Investigation of glass forming ability, crystallization mechanism, production techniques, magnetic softness and the effect of replacing the main constituents by other elements. J. Magn. Magn. Mater. 2016, 408, 177–192. [Google Scholar] [CrossRef]
  95. Takenaka, K.; Setyawanm, A.D.; Sharma, P.; Nishiyama, N.; Makino, A. Industrialization of nanocrystalline Fe–Si–B–P–Cu alloys for high magnetic flux density cores. J. Magn. Magn. Mater. 2016, 401, 479–483. [Google Scholar] [CrossRef]
  96. Shuvaeva, E.; Kaloshkin, S.; Churyukanova, M.; Perminov, A.; Khriplivets, I.; Mitra, A.; Panda, A.K.; Roy, R.K.; Premkumar, V.; Zhukova, A. The impact of bending stress on magnetic properties of Finemet type microwires and ribbons. J. Alloy. Compd. 2018, 743, 388–393. [Google Scholar] [CrossRef]
  97. Mikhalitsyna, E.A.; Kataev, V.A.; Larrañaga, A.; Lepalovskij, V.N.; Kurlyandskaya, G.V. Nanocrystallization in FINEMET-Type Fe73.5Nb3Cu1Si13.5B9 and Fe72.5Nb1.5Mo2Cu1.1Si14.2B8.7 thin films. Materials 2020, 13, 348. [Google Scholar] [CrossRef] [Green Version]
  98. Louzguine, D.V.; Inoue, A. Comparative study of the effect of cold rolling on the structure of Al–RE–Ni–Co (RE = rare-earth metals) amorphous and glassy alloys. J. Non Cryst. Solids 2006, 352, 3903–3909. [Google Scholar] [CrossRef]
  99. Kovács, Z.; Henits, P.; Hobor, S.; Révész, A. Nanocrystallization process in amorphous alloys during severe plastic deformation and thermal treatments. Rev. Adv. Mater. Sci. 2008, 18, 593–596. [Google Scholar]
  100. Tkach, V.I.; Rassolov, S.G.; Popov, V.V.; Maksimov, V.V.; Maslov, V.V.; Nosenko, V.K.; Aronin, A.S.; Abrosimova, G.E.; Rybchenko, O.G. Complex crystallization mode of amorphous/nanocrystalline composite Al86Ni2Co5.8Gd5.7Si0.5. J. Non Cryst. Solids 2011, 357, 1628–1631. [Google Scholar] [CrossRef]
  101. Louzguine-Luzgin, D.V.; Bazlov, A.I.; Ketov, S.V.; Inoue, A. Crystallization behavior of Fe- and Co-based bulk metallic glasses and their glass-forming ability. Mater. Chem. Phys. 2015, 162, 197–206. [Google Scholar] [CrossRef]
  102. Herold, U.; Kőster, U. Metastabile Phasen in extreme schnell erstarrten Eisen-Bor-Legierungen. Z Metallk. 1978, 69, 326–332. [Google Scholar]
  103. Khan, Y.; Sostarich, M. Dynamic temperature X-ray diffraction analysis of amorphous Fe80B20. Z Metallk. 1981, 72, 266–268. [Google Scholar]
  104. Abrosimova, G.E.; Aronin, A.S.; Gantmakher, V.F.; Levin, Y.B.; Osherov, M.V. Variation of the electric resistivity of the amorphous Ni-Zr alloy in the initial-stages of crystallization. Fiz. Tverd. Tela 1988, 30, 1424–1430. [Google Scholar]
  105. Abrosimova, G.E.; Aronin, A.S. Phase transformation in Fe-B alloys at heating. Metallofizika 1988, 10, 47–52. (In Russian) [Google Scholar]
  106. Abrosimova, G.; Matveev, D.; Pershina, E.; Aronin, A. Effect of treatment conditions on parameters of nanocrystalline structure in Al-based alloys. Mater. Lett. 2016, 183, 131–134. [Google Scholar] [CrossRef]
  107. Aronin, A.; Matveev, D.; Pershina, E.; Tkatch, V.; Abrosimova, G. The effect of changes in Al-based amorphous phase structure on structure forming upon crystallization. J. Alloy. Compd. 2017, 715, 176–183. [Google Scholar] [CrossRef]
  108. Aronin, A.; Budchenko, A.; Matveev, D.; Pershina, E.; Tkatch, V.; Abrosimova, G. Nanocrystal formation in light metallic glasses at heating and deformation. Rev. Adv. Mater. Sci. 2016, 46, 53–69. [Google Scholar]
  109. Boucharat, N.; Hebert, R.; Rösner, H.; Valiev, R.; Wilde, G. Nanocrystallization of amorphous Al88Y7Fe5 alloy induced by plastic deformation. Scr. Mater. 2005, 53, 823–828. [Google Scholar] [CrossRef]
  110. Valiev, R.Z.; Alexandrov, I.V. Bulk Nanocrystalline Metallic Materials; Akademkniga: Moscow, Russia, 2007; p. 398. (In Russian) [Google Scholar]
  111. Kovacs, Z.; Henits, P.; Zhilyaev, A.P.; Revesz, A. Deformation induced primary crystallization in a thermally non-primary crystallizing amorphous Al85Ce8Ni5Co2 alloy. Scr. Mater. 2006, 54, 1733–1737. [Google Scholar] [CrossRef]
  112. Boucharat, N.; Hebert, R.; Rösner, H.; Valiev, R.; Wilde, G. Synthesis routes for controlling the microstructure in nanostructured Al88Y7Fe5 alloys. J. Alloy. Compd. 2007, 434, 252–254. [Google Scholar] [CrossRef]
  113. Aronin, A.; Abrosimova, G.; Matveev, D.; Pershina, E. Nanocrystal formation, structure and magnetic properties of Fe-Si-B amorphous alloy after deformation. Mater. Lett. 2013, 97, 15–17. [Google Scholar] [CrossRef]
  114. Lewandowski, J.J.; Greer, A.L. Temperature rise at shear bands in metallic glasses. Nat. Mater. 2006, 5, 15–18. [Google Scholar] [CrossRef]
  115. Csontos, A.A.; Shiflet, G.J. Formation and chemistry of nanocrystalline phases formed during deformation in aluminum-rich metallic glasses. Nano Struct. Mater. 1997, 9, 281–289. [Google Scholar] [CrossRef]
  116. Georgarakis, K.; Aljerf, M.; Li, Y.; LeMoulec, A.; Charlot, F.; Yavari, A.R.; Chornokhvostenko, K.; Tabachnikova, E.; Evangelakis, G.A.; Miracle, D.B.; et al. Shear band melting and serrated flow in metallic glasses. Appl. Phys. Lett. 2008, 93, 031907. [Google Scholar] [CrossRef]
  117. Hartley, K.A.; Duffy, J.; Hawley, R.H. Measurement of the temperature profile during shear band formation in steels deforming at high strain rates. J. Mech. Solids. 1987, 35, 283–301. [Google Scholar] [CrossRef] [Green Version]
  118. Li, J.G.; Umemoto, M.; Todaka, Y.; Fujisaku, K.; Tsuchiya, K. The dynamic phase transformation and formation of nanocrystalline structure in SUS304 austenitic stainless steel subjected to high pressure torsion. Rev. Adv. Mater. Sci. 2008, 18, 577–582. [Google Scholar]
  119. Jiang, W.H.; Atzmon, M. The effect of compression and tension on shear-band structure and nanocrystallization in amorphous Al90Fe5Gd5: A high-resolution transmission electron microscopy study. Acta Mater. 2003, 51, 4095–4105. [Google Scholar] [CrossRef]
  120. Kim, J.J.; Choi, Y.; Suresh, S.; Argon, A.S. Nanocrystallization during nanoindentation of a bulk Amorphous metal alloy at room temperature. Science 2002, 295, 654–656. [Google Scholar] [CrossRef] [PubMed]
  121. Rösner, H.; Peterlechler, M.; Kűbel, C.; Schmidt, V.; Wilde, G. Density changes in shear bands of a metallic glass determined by correlative analytical transmission electron microscopy. Ultramicroscopy 2014, 142, 1–9. [Google Scholar] [CrossRef] [PubMed]
  122. Schmidt, V.; Rösner, H.; Peterlechler, M.; Wilde, G. Quantitative measurement of density in a shear band of metallic glass monitored along its propagation direction. Phys. Rev. Lett. 2015, 115, 035501. [Google Scholar] [CrossRef] [PubMed]
  123. Slaughter, S.K.; Kertis, F.; Deda, E.; Gu, X.; Wright, W.J.; Hufnagel, T.C. Shear bands in metallic glasses are not necessarily hot. APL Mater. 2014, 2, 096110. [Google Scholar] [CrossRef] [Green Version]
  124. Abrosimova, G.; Aronin, A. Nanocrystal formation in Al- and Ti-based amorphous alloys at Deformation. J. Alloy. Compd. 2018, 747, 26–30. [Google Scholar] [CrossRef]
  125. Yoo, B.G.; Kim, Y.J.; Oh, J.H.; Ramamurty, U.; Jang, J. On the hardness of shear bands in amorphous alloys. Scr. Mater. 2009, 61, 951–954. [Google Scholar] [CrossRef]
  126. Pan, J.; Chen, Q.; Liu, L.; Li, Y. Softening and dilatation in a single shear band. Acta Mater. 2011, 59, 5146–5158. [Google Scholar] [CrossRef]
  127. Maaß, R.; Samwer, K.; Arnold, W.; Volkert, C.A. A single shear band in a metallic glass: Local core and wide soft one. Appl. Phys. Lett. 2014, 10, 17190. [Google Scholar] [CrossRef] [Green Version]
  128. Abrosimova, G.; Aronin, A.; Fokin, D.; Orlova, N.; Postnova, E. The decrease of Young’s modulus in shear bands of amorphous Al87Ni8Gd5 alloy. Mater. Lett. 2019, 252, 114–116. [Google Scholar] [CrossRef]
  129. Perepezko, J.H. Nucleation-controlled reactions and metastable structures. Prog. Mater. Sci. 2004, 49, 263–284. [Google Scholar] [CrossRef]
  130. Mu, J.; Fu, H.; Zhu, Z.; Wang, A.; Li, H.; Hu, Z.Q.; Zhang, H. Synthesis and properties of Al-Ni-La bulk metallic glass. Adv. Eng. Mater. 2009, 11, 530–532. [Google Scholar] [CrossRef]
  131. Yang, B.J.; Yao, J.H.; Chao, Y.S.; Wang, J.Q.; Ma, E. Developing aluminum-based bulk metallic glasses. Phil. Mag. 2010, 90, 3215–3231. [Google Scholar] [CrossRef]
  132. Du, S.Z.; Li, C.C.; Pang, S.Y.; Leng, J.F.; Geng, H.R. Influences of melt superheat treatment on glass forming ability and properties of Al84Ni10La6 alloy. Mater. Des. 2013, 47, 358–364. [Google Scholar] [CrossRef]
  133. Chunchu, V.J.; Markandeyulu, G. Magnetoimpedance studies in as quenched Fe73.5Si13.5B8CuV3-xAlNbx nanocrystalline ribbons. Appl. Phys. 2013, 113, 17A321. [Google Scholar] [CrossRef]
  134. Xiang, R.; Zhou, S.; Dong, B.; Zhang, G.; Li, Z.; Wang, Y.; Chang, C. Effect of Co addition on crystallization and magnetic properties of FeSiBPC alloys. Progr. Nat. Sci. Mater. Intern. 2014, 24, 649–654. [Google Scholar] [CrossRef] [Green Version]
  135. Meng, F.; Tsuchija, K.; Yokoyama, Y. Reversible transition of deformation mode by structural rejuvenation and relaxation in bulk metallic glass. Appl. Phys. Lett. 2012, 101, 121914. [Google Scholar] [CrossRef]
  136. Tong, Y.; Iwashita, T.; Dmowski, W.; Bei, H.; Yokoyama, Y.; Egami, T. Structural rejuvenation in bulk metallic glasses. Acta Mater. 2015, 86, 240–246. [Google Scholar] [CrossRef] [Green Version]
  137. Dmowski, W.; Yokoyama, Y.; Chuang, A.; Ren, Y.; Umemoto, M.; Tsuchiya, K.; Inoue, A.; Egami, T. Structural rejuvenation in a bulk metallic glass induced by severe plastic deformation. Acta Mater. 2010, 58, 429–438. [Google Scholar] [CrossRef]
  138. Tong, Y.; Dmowski, W.; Bei, H.; Yokoyama, Y.; Egami, T. Mechanical rejuvenation in bulk metallic glass induced by thermo-mechanical creep. Acta Mater. 2018, 148, 384–390. [Google Scholar] [CrossRef]
  139. Guo, W.; Yamada, R.; Saida, J. Rejuvenation and plasticization of metallic glass by deep cryogenic cycling. Intermetallics 2018, 93, 141–147. [Google Scholar] [CrossRef]
  140. Ketov, S.V.; Sun, Y.H.; Nachum, S.; Lu, Z.; Checchi, A.; Beraldin, A.R.; Bai, H.Y.; Wang, W.H.; Louzguine-Luzgin, D.V.; Carpenter, M.A.; et al. Rejuvenation of metallic glasses by non-affine thermal strain. Nature 2015, 524, 200–203. [Google Scholar] [CrossRef] [PubMed] [Green Version]
  141. Hufnagel, T.C. Cryogenic rejuvenation. Nat. Mater. 2015, 14, 87–868. [Google Scholar] [CrossRef] [PubMed]
  142. Bian, X.; Wang, G.; Wang, Q.; Sun, B.A.; Hussain, I.; Zhai, Q.J.; Mattern, N.; Bednarcik, J.; Eckert, J. Cryogenic-temperature-induced structural transformation of a metallic glass. Mater. Res. Lett. 2017, 5, 284–291. [Google Scholar] [CrossRef] [Green Version]
  143. Guo, W.; Shao, Y.M.; Saida, J.; Zhao, M.; Lu, S.L.; Wu, S.S. Rejuvenation and plasticization of Zr-based bulk metallic glass with various Ta content upon deep cryogenic cycling. J. Alloy. Compd. 2019, 795, 314–318. [Google Scholar] [CrossRef]
  144. Guo, W.; Saida, J.; Zhao, M.; Lu, S.; Wu, S. Rejuvenation of Zr-based bulk metallic glass matrix composite upon deep cryogenic cycling. Mater. Lett. 2019, 247, 135–138. [Google Scholar] [CrossRef]
  145. Kang, S.J.; Cao, Q.P.; Liu, J.; Tang, Y.; Wang, X.D.; Zhang, D.X.; Ahn, I.S.; Caron, A.; Jiang, J.Z. Intermediate structural state for maximizing the rejuvenation effect inmetallic glass via thermo-cycling treatment. J. Alloy. Compd. 2019, 795, 493–500. [Google Scholar] [CrossRef]
  146. Abrosimova, G.; Volkov, N.; Van Tuan, T.; Pershina, E.A.; Aronin, A.S. Cryogenic rejuvenation of Al-based amorphous-nanocrystalline alloys. Mater. Lett. 2019, 240, 150–152. [Google Scholar] [CrossRef]
  147. Abrosimova, G.; Volkov, N.; Van Tuan, T.; Pershina, E.A.; Aronin, A.S. Amorphous structure rejuvenation under cryogenic treatment of Al-based amorphous-nanocrystalline alloys. J. Non Cryst. Solids 2020, 528, 119751. [Google Scholar] [CrossRef]
  148. Abrosimova, G.E.; Aronin, A.S. Reversible structure changes in amorphous Fe-B alloys. Int. J. Rapid Solidif. 1991, 6, 29–40. [Google Scholar]
  149. Abrosimova, G.; Aronin, A.; Ignatieva, E. Phase transformation in the Ni70Mo10P20 amorphous alloy at heating. Phys. Met. Metallogr. 2003, 95, 569–574. [Google Scholar]
  150. Abrosimova, G.; Aronin, A.; Ignatieva, E. A metastable phase forming during crystallization of an amorphous Ni70Mo10P20 alloy. Phys. Solid State 2006, 48, 122–128. [Google Scholar] [CrossRef]
  151. Abrosimova, G.; Aronin, A.; Ignatieva, E. Mechanism of crystallization of the Ni70Mo10B20 alloy above the glass transition temperature. Phys. Solid State 2006, 48, 563–569. [Google Scholar] [CrossRef]
  152. Abrosimova, G.; Aronin, A.; Kabanov, Y.P.; Matveev, D.V.; Molokanov, V.V. Magnetic structure and properties of a bulk Fe72Al5P10Ga2C6B4Si1 alloy in the amorphous and nanocrystalline states. Phys. Solid State 2004, 46, 885–890. [Google Scholar] [CrossRef]
  153. Abrosimova, G.; Aronin, A.; Kabanov, Y.P.; Matveev, D.V.; Molokanov, V.V.; Rybchenko, O.G. Effect of thermal treatment on the microstructure and magnetic properties of a bulk amorphous Fe72Al5P10Ga2C6B4Si1 alloy. Phys. Solid State 2004, 46, 2232–2237. [Google Scholar] [CrossRef]
  154. Masumoto, T.; Waseda, Y.; Kimura, H.; Inoue, A. Thermal instability and crystallization characteristics of amorphous metal-metalloid system. Sci. Rep. Res. Inst. Tohoku Univ. 1976, 26, 21–35. [Google Scholar]
  155. Aronin, A.; Ivanov, A.S.; Yakshin, A.E. Increase Of The Near-Surface Crystallization Temperature In A Fe-B-P Amorphous Alloy. Phys. Solid State 1991, 33, 2527–2532. [Google Scholar]
Figure 1. (a) Bright-field and (b) dark-field electron microscope images of the microstructure of (Ni70Mo30)90B10 sample after annealing at 873 K for 144 h.
Metals 10 00358 g001
Figure 2. High-resolution electron microscope image of the microstructure of (Ni70Mo30)90B10 sample after annealing at 873 K for 72 h.
Metals 10 00358 g002
Figure 3. Decomposition of the nanocrystalline phase in (Ni65Mo35)90B10 alloy (873 K, 240 h; (a) bright-field and (b) dark-field images are in the reflection shown in the electron diffraction pattern).
Metals 10 00358 g003
Figure 4. High-resolution image of the structure of annealed (Ni65Mo35)90B10 sample under the decomposition of the nanocrystalline structure. An arrow marks the region of a direct contact of the nanocrystals with each other.
Metals 10 00358 g004
Figure 5. Microstructure of Al86Ni11Yb3 sample after annealing at 473 K for 30 min: (a) bright-field and (b) dark-field images.
Metals 10 00358 g005
Figure 6. Dependence of an average nanocrystal size (triangles) and fraction of the nanocrystals (asterisks) on the duration of annealing at 473 K for Al86Ni11Yb3 sample [59] [reproduced from Physics of The Solid State 2001, 43, 2003 with permission from Pleiadis Publishing, 2020].
Metals 10 00358 g006
Figure 7. Nanocrystal distribution over size after annealling for (a) 5 and (b) 15 min. The theoretical data are marked with solid curves the experimental data are marked with columns [59] [reproduced from Physics of The Solid State 2001, 43, 2003 with permission from Pleiadis Publishing, 2020].
Metals 10 00358 g007
Figure 8. Histograms of the grain distribution over size for (a,b) homogeneous and (c,d,e) heterogeneous nucleation; (b,e) cases of nonstationary nucleation [59]. [reproduced from Physics of The Solid State 2001, 43, 2003 with permission from Pleiadis Publishing, 2020].
Metals 10 00358 g008
Figure 9. Dependence of an average size of the nanocrystals in Al86Ni11Yb3 alloy on the exposure duration at 473 K. The calculated results are marked with a solid line, the experimental values are shown with rhombi [59].
Metals 10 00358 g009
Figure 10. Microstructure of Fe84B16 alloy sample annealed in an electron microscope (in-situ) at 623 K for 90 min: (a) bright-field and (b) dark-field images [reproduced from Mat. Sci. [73]. Eng., 1978, 36, 193 with permission from Elsevier, 2020].
Metals 10 00358 g010
Figure 11. Microstructure of Fe84B16 alloy sample with an initial thickness, annealed for 60 min at 623 K.
Metals 10 00358 g011
Figure 12. Microstructure of deformed Al88Ni2Y10 sample (40%): (a) bright-field and (b) dark-field images.
Metals 10 00358 g012
Figure 13. Shear bands in amorphous Al88Ni2Y10 after deformation at room temperature (a), nanopores (marked with arrows) in shear bands after ageing at room temperature for 1.78 × 10⁷ s (b), nanopores in shear bands after ageing at RT for 2.96 × 10⁷ s (c) [reproduced from Mechanics of Materials, 2017, 113, 19 with permission from Elsevier, 2020] [86].
Metals 10 00358 g013
Figure 14. Microstructure of Al85.1Ni6Co2Gd6Si0.9 alloy sample (a) after rolling and (b) after ageing at room temperature ) [reproduced from Acta Materialia, 2008, 56, 2834 with permission from Elsevier, 2020] [83].
Metals 10 00358 g014
Figure 15. Microstructure of a sample after rolling and heating to 245 °C [reproduced from Physics of The Solid State 2011, 53, 229 with permission from Pleiadis Publishing, 2020] [89].
Metals 10 00358 g015
Figure 16. Nanocrystals in deformed amorphous Fe-B alloy.
Metals 10 00358 g016
Figure 17. Maps of distribution of mechanical properties for Peak Force = 0.85 µN.
Metals 10 00358 g017
Figure 18. SEM image of the surface of deformed Al87Ni8La5 alloy [reproduced from Mater. Let. 2019, 252, 114 with permission from Elsevier, 2020] [128].
Metals 10 00358 g018
Figure 19. An initial part of the X-ray diffraction pattern of Al88Ni6Y6 sample after deformation (a) and after deformation plus cryogenic cycling (b): (1) experimental spectrum, (3,4) diffuse reflections corresponding to 2 amorphous phases, (5) (111) Al nanocrystal reflection, (2) sum of 3–6 lines [reproduced from Mater. Let. 2019, 240, 159 with permission from Elsevier, 2020] [146].
Metals 10 00358 g019
Figure 20. Microstructure of Fe83B10P7 alloy sample partially crystallized in-situ [reproduced from Physics of The Solid State 1991, 33, 2527 with permission from Pleiadis Publishing, 2020 ] [155].
Metals 10 00358 g020
Figure 21. Microstructure of pre-annealed Fe83B10P7 sample partially crystallized in situ [reproduced from Physics of The Solid State 1991, 33, 2527 with permission from Pleiadis Publishing, 2020] [155].
Metals 10 00358 g021
Table 1. The nanocrystal size (D) and the nanocrystalline phase fraction (f) formed in the uniform and non-uniform amorphous phases.
A Structure before the Crystallization Onset After the First Stage ofCrystallization
D, nmf, %
Al87Ni8Y5-
The uniform amorphous phase2318
The non-uniform amorphous phase after heat treatment1520
The non-uniform amorphous phase after rolling deformation1325
Al87Ni8La5-
The uniform amorphous phase3212
The non-uniform amorphous phase after heat treatment3013
The non-uniform amorphous phase after rolling deformation2614
Al87Ni8Gd5-
The uniform amorphous phase2623
The non-uniform amorphous phase after heat treatment24-
The non-uniform amorphous phase after rolling deformation21-
HPT 1 rev622
HPT 5 rev625
Al88Ni10Y2-
The uniform amorphous phase1928
The non-uniform amorphous phase after rolling deformation1835

