Article

Effects of Microstructure, Mechanical and Physical Properties on Machinability of Graphite Cast Irons

1
Faculty of Engineering, University of Alberta, Edmonton T6G 1H9, AB, Canada
2
School of Materials Science and Engineering, Henan University of Science and Technology, Luoyang 471023, China
3
Third Assembly Plant, First Tractor Co. Ltd., Luoyang 471004, China
4
Henan Collaborative Innovation Center of Nonferrous Metals, Luoyang 471023, Henan, China
5
Department of Mechanical Engineering, University of South Florida, Tampa, FL 33620, USA
*
Author to whom correspondence should be addressed.
Metals 2020, 10(2), 285; https://doi.org/10.3390/met10020285
Submission received: 3 February 2020 / Revised: 19 February 2020 / Accepted: 20 February 2020 / Published: 21 February 2020

Abstract

:
Flake (FGI) and spheroidal (SGI) graphite cast irons are often used to produce workpieces, which often need to be machined. Machinability differences under various machining methods are the basis for choosing machining equipment and technology. In this work, FGI and SGI were used to produce tractor front brackets, and the machinability of both materials under turning and drilling processes was compared. The machinability (turning and drilling ability) has been evaluated in terms of machining load, chips shape, surface roughness, and tool temperature. The influence of materials microstructure and thermal conductivity on the machinability was analyzed. In the turning process, the cutting force and its standard deviation of the FGI were larger than the SGI due to the higher volume fraction of pearlite. The surface roughness was similar in both materials. In the drilling process, the even action of the friction and cutting force on the bit turned into similar drilling loads for both materials. Higher friction and lower thermal conductivity caused a higher bit temperature in SGI drilling compared to FGI. The chip breaking was worse in SGI drilling, where the longer chips scratched the internal surface of the holes, resulting in the higher surface roughness.

1. Introduction

General graphite cast iron workpieces are usually machined using automated machining centers. The main influencing factor of the machining efficiency is machinability [1]. Poor machinability leads to frequent replacement of the cutting tools and decreases the machining efficiency. The machinability of materials is generally evaluated in terms of tool wear, surface roughness, and machining load [2]. Nayyar et al. [3] measured the cutting force, cutting temperature, and tool life during turning flake (FGI), compacted (CGI), and spheroidal (SGI) graphite irons. They found that the surface cutting temperature was roughly the same for various cast irons, but the cutting force and tool life were significantly different. SGI with lower hardness and lesser pearlite has a higher cutting force and shorter tool life compared to the FGI. Seker et al. [4] reported that austempering heat treatment of SGI significantly improved the surface quality and resulted in a relatively small change in cutting forces in the turning process. For various cast irons with equal tensile strength, Ren et al. [5] investigated the effects of microstructure and mechanical properties on the cutting force of different cast irons with similar tensile strength in the turning process. Results showed that there is a positive correlation between the cutting force, hardness, and pearlite content for cast irons with equal tensile strength. SGI with lower hardness and less pearlite has lower cutting force compared with FGI. Tooptong et al. [6] compared flank wear when turning FGI, CGI, and SGI under dry conditions. They found the main reason for the poor machinability of CGI and SGI is that the cutting temperature is much higher than FGI. Heck et al. [7] investigated the reason why CGI has poor machinability compared to conventional FGI in the cutting process. The reason is the formation of the MnS layer on the tool surface when machining FGI. The MnS layer acts as a lubricant and prevents the adhesion of workpiece particles. However, this layer cannot form when machining CGI and SGI because the formation of MnS-inclusions is not possible in both materials due to the higher magnesium content, which, in turn, is responsible for the formation of the graphite vermicles and nodules. De Sousa et al. [8] investigated the torque, power consumption, tool life, and surface roughness of continuous ductile iron bars during the milling process. The tool life and torque were different during milling of different regions, but power consumption and surface roughness were not statistically different. Dias et al. [9] researched the effects of gray cast iron matrix structure on the cutting force and tool life in milling operations. They found that the higher pearlite content led to faster tool wear and higher cutting force. Amir et al. [10] examined the influence of microstructure and mechanical properties of compacted graphite iron on tool wear in the face milling process. They found that the microstructure has a significant effect on tool wear. A lower amount of abrasive carbonitride particles and lower content of pearlite reduce tool wear. Da Silva et al. [11] analyzed cutting tools wear during milling of FGI and CGI. The results showed that the workpiece material strongly influenced the tool life and wear. The wear mechanisms of both materials were abrasion and adhesion. Ren et al. [12] investigated the influence of inoculating addition on drill bit wear for drilling flake graphite iron, and optimal combinations of compound inoculants with smallest drill wear were obtained. Meena et al. [13] studied the drilling properties of green austempered ductile iron. Results showed that the specific cutting energy and cutting force coefficients increased with decreasing feed rate and increasing cutting speed. Jan et al. [14] investigated the effects of drill bit wear on the cutting torque and axial force during drilling spheroidal graphite cast iron. The results showed that the small feed and high cutting speed resulted in a loss of cutting ability in the area of accelerated wear. Li et al. [15] investigated the wear mechanism of the dill in the drilling of CGI under dry and minimum quantity lubrication. The results showed that the main wear mechanism of drilling of CGI is adhesion and abrasion. These previous studies mainly focused on the machinability evaluation for only one type of cast iron, or on the machinability comparisons of different cast irons only using a machining method. Perhaps for different cast irons, the machinability of certain cast iron is good under one machining method, and its machinability is bad under another machining method. Then, it is necessary to compare the machinability under different machining methods. Finding out their machinability differences under various machining methods is the basis to choose machining equipment and technology. In addition, contrasting the machinability of FGI and SGI, some literature reports gave inconsistent results. For example, the authors of both [3,7] reported that FGI has a lower cutting force compared to SGI, but the authors of [5] reported that FGI has a higher cutting force. Thus, the machinability comparison of two or more graphite cast irons still needs further research. Meanwhile, the relationships between the machinability and microstructure, and physical properties under various processing conditions require further examination.
This study derived from the actual production problems. A famous tractor manufacturing company originally adopted low-cost FGI to cast tractor front brackets. The FGI brackets sometimes broke during the tractor operation. Then FGI was replaced by SGI with higher strength, and then the brackets no longer broke. However, statistical analysis showed faster drill bit wear during drilling of the SGI brackets. The drill bit life in drilling SGI brackets was only half of FGI. The technical staff of the company guessed that faster drill bit wear could be due mainly to the longer chips. The objective of this study was to compare the machinability (turning and drilling ability) in terms of machining load, chips shape, surface roughness, and tool temperature of the two cast irons used to produce tractor front brackets and to investigate the relationships between the materials machinability, microstructure, and thermal conductivity. The research results will contribute to identifying the reasons for the drill wear difference between the two materials. Furthermore, the results could offer guidance for the structure design of SGI brackets, such as what ratio of ferrite to pearlite in the matrix can make SGI have a good drilling ability (good chip-breaking and low surface roughness).

2. Materials and Experimental Procedures

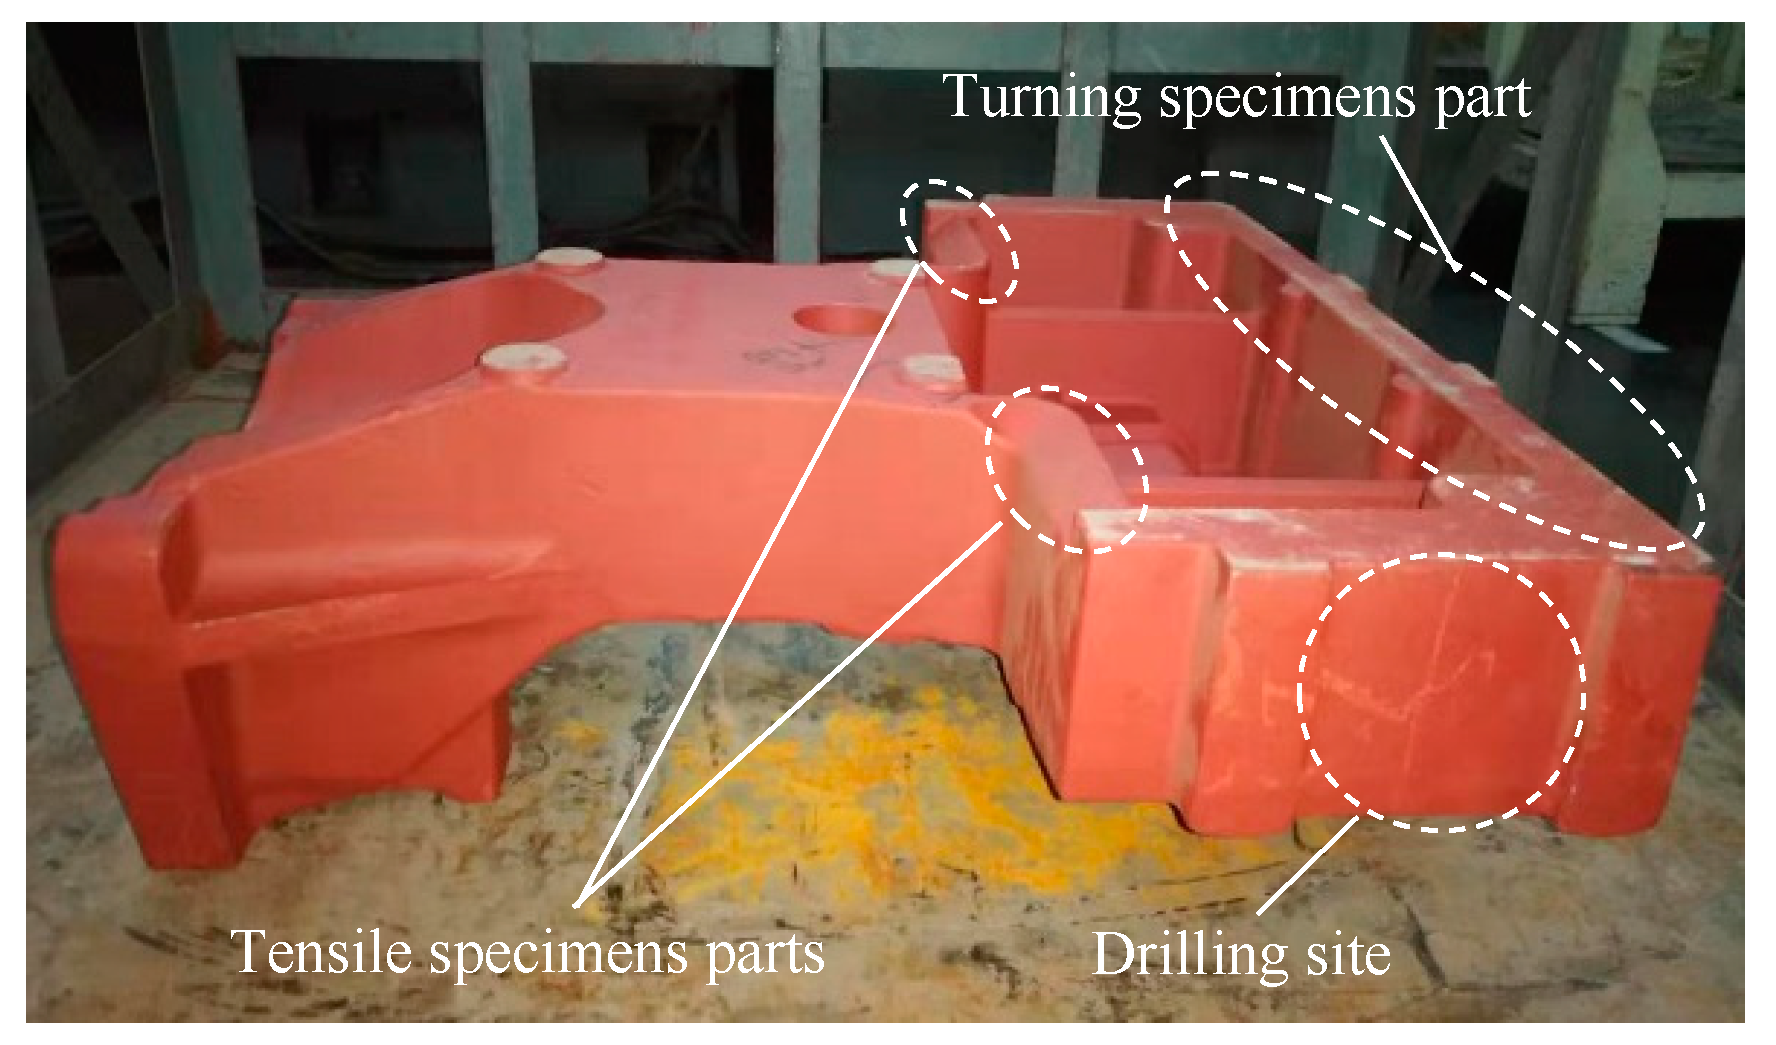
2.1. Tractor front Bracket Castings

Tractor front brackets were cast using flake cast iron HT250 (Chinese grade, equivalent to American No.35 grade) and spheroidal graphite cast iron QT450 (Chinese grade, equivalent to American 65-45-12 grade), respectively. The raw materials of HT250 were ~15 wt.% pig iron, 55 wt.% steel scrap, and the return scrap. The raw materials of QT450 were 35 wt.% pig iron, 35 wt.% steel scrap, and the return scrap. Raw materials were melted in a medium-frequency induction furnace of 10,000 kg capacity. The molding of tractor front brackets of both materials was in a sand mold, and the mold was opened when the front brackets were cooled to room temperature. The inoculation approach of both materials was an in-ladle treatment in front of the furnace. Inoculant was FeSi75 (74.6 wt.% Si, 1.3 wt.% Al, and the remainder Fe; 0.2–1 mm particle size), and was added into molten iron in the amount of 0.4 wt.% for HT250 and 1 wt.% for QT450, respectively. Inoculation and spheroidization treatments of QT450 were carried out simultaneously. La-Mg nodulizer (main composition: 3 wt.% RE, 8 wt.% Mg: 5–10 mm particle size) was used and its addition was 1 wt.%. The tapping and casting temperatures were 1450 °C and 1350 °C for HT250, and 1480 °C and 1370 °C for QT450, respectively.
The qualified front brackets of the two materials were randomly extracted for testing. The front bracket casting and its testing parts (the sampling parts for tensile and turning specimens, and the drilling site) are shown in Figure 1 (700 mm maximum length, 630 mm maximum width, 190 mm maximum thickness). The design and actual (one furnace) chemical composition of HT250 and QT450 materials is listed in Table 1.

2.2. Performance Testing and Microstructure Observations

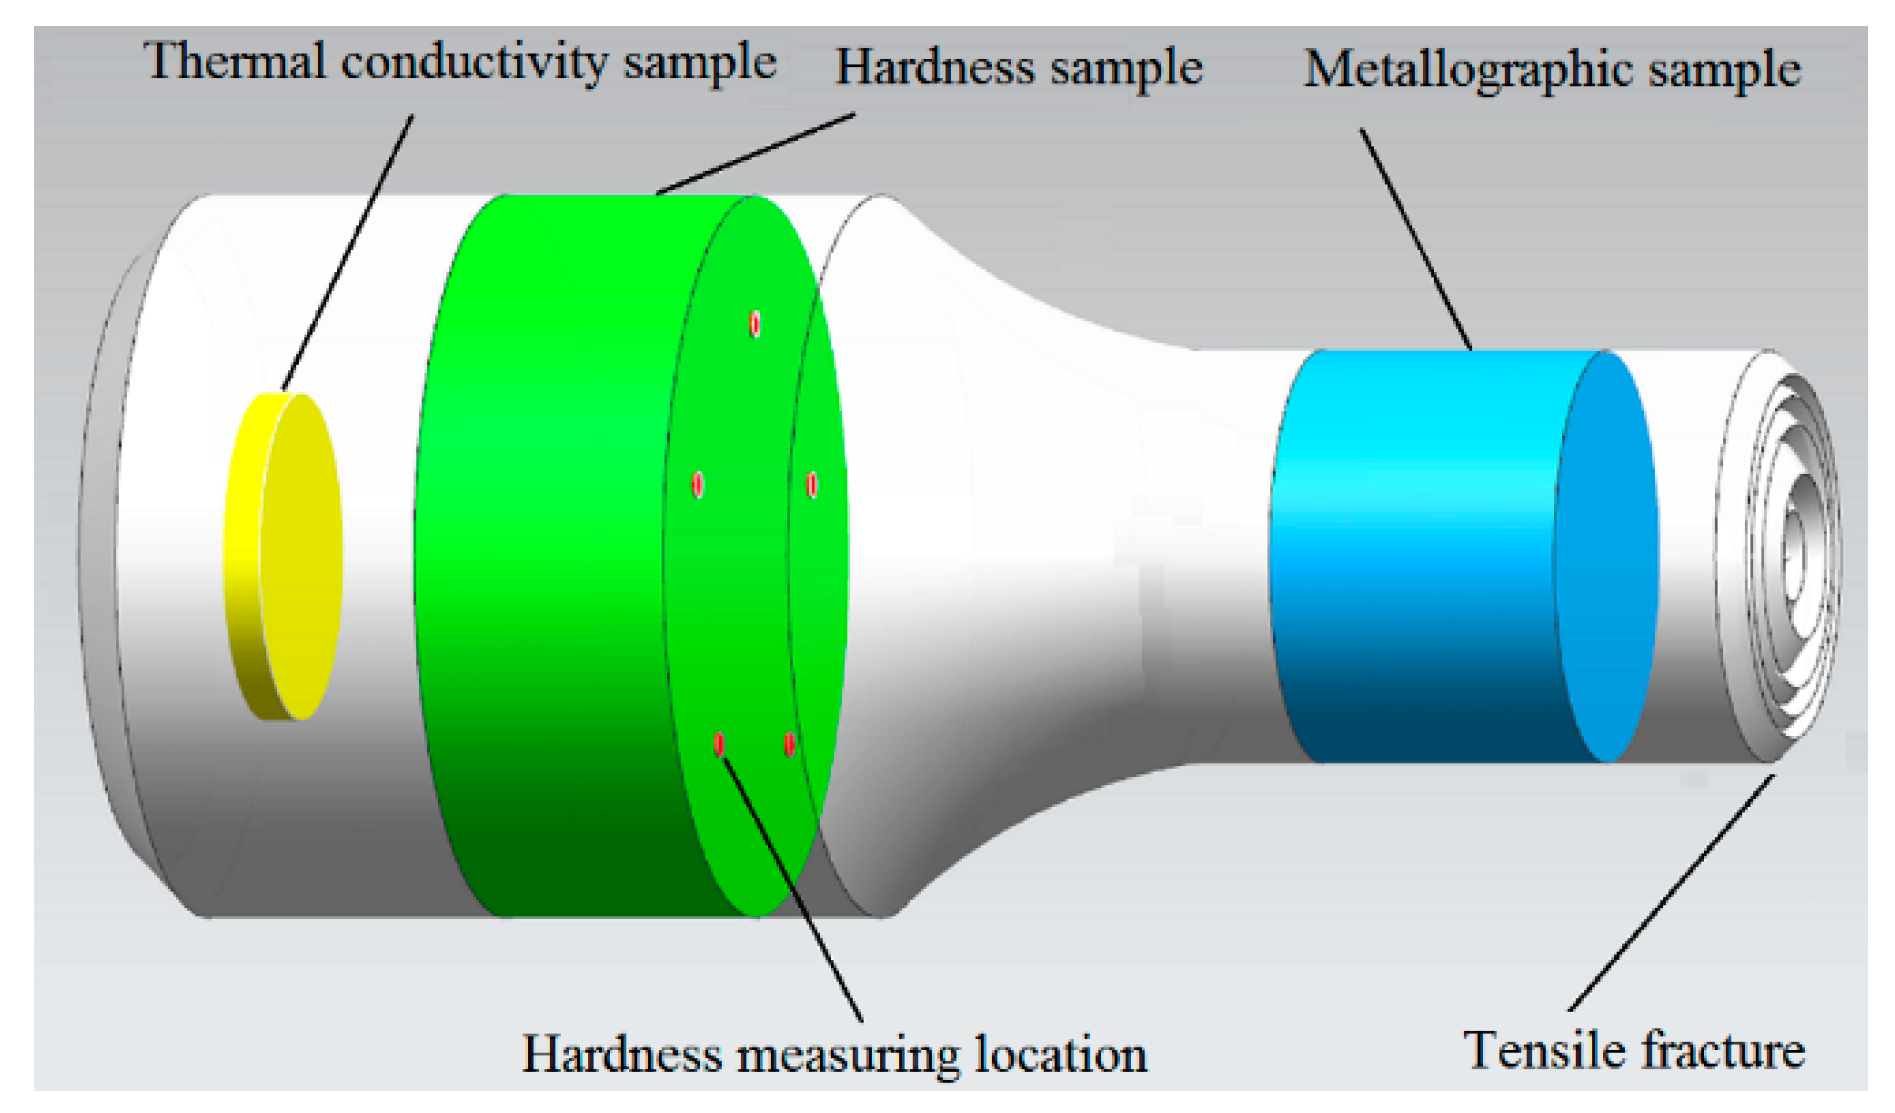
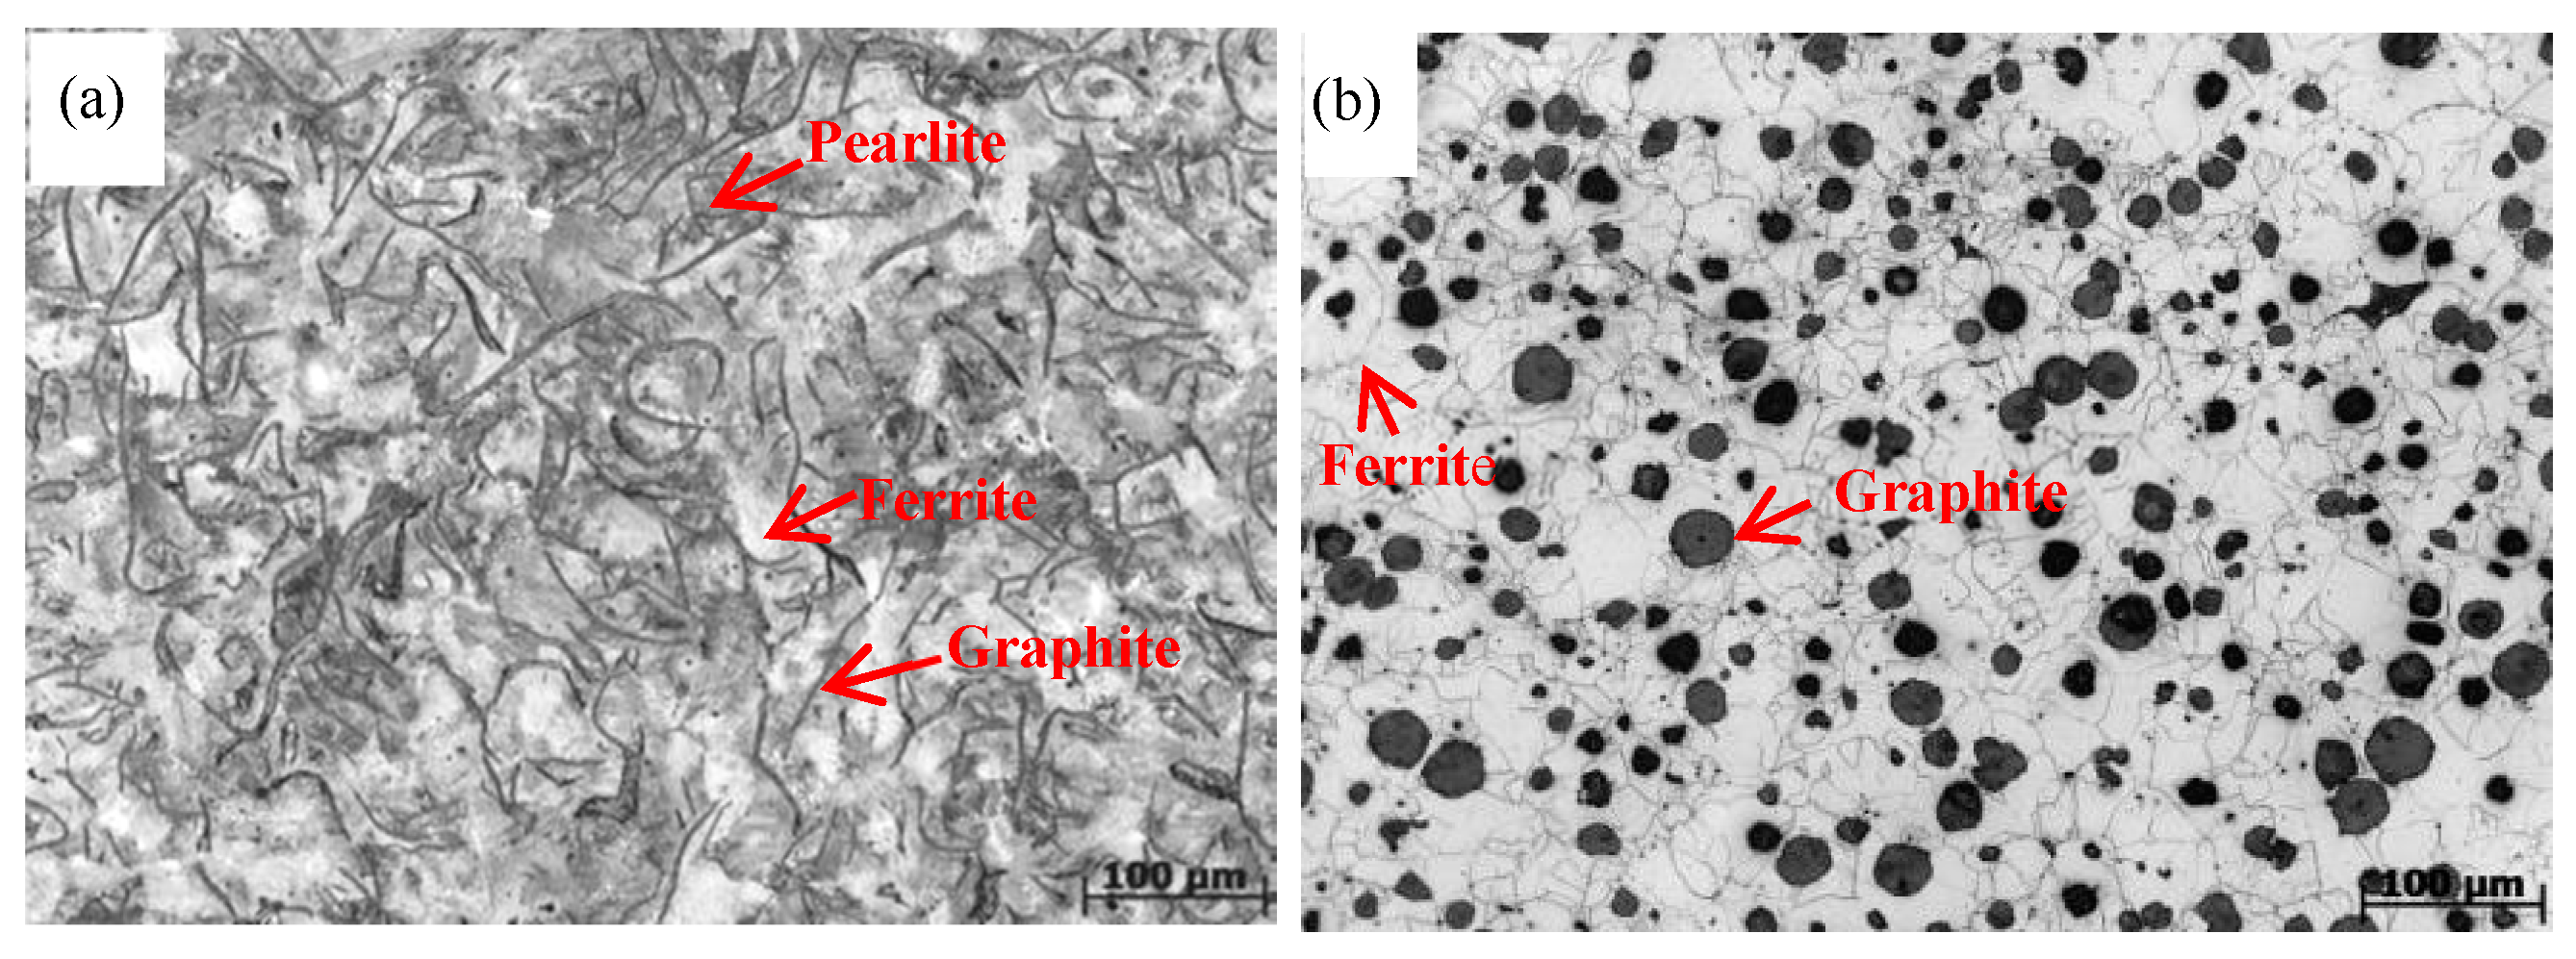
2.2.1. Mechanical and Physical Properties and Microstructure

The tensile specimen blanks were cut from the front bracket castings (as shown in Figure 1) of the two materials and then machined into cylindrical tensile specimens. The sizes of the gauge portions of the tensile specimens for TH250 and QT450 were Φ 16 mm × 30 mm and Φ 10 mm × 50 mm, respectively (National Standards of the People’s Republic of China, GB/T 9439-2010 and GB/T 1348-2009. Chinese standards referred to ASTM A48/A48M-2003 and ASTM A571/A571M-2015). Four tensile specimens were prepared for each of the two materials. The tensile strength was measured using a universal tensile testing machine. The samples for hardness, thermal conductivity, and metallographic testing were cut from the tensile specimen whose tensile strength was the closest to the mean value of the four tensile specimens. Brinell hardness was measured at 5 locations on the sample surface. Samples cutting sites and hardness measurement locations are shown in Figure 2.
The size of thermal conductivity samples was Φ 12.7 mm × 1.5 mm. Thermal conductivity was measured at 323 K, 423 K, 473 K, and 573 K by the DLF-1300 (TA Instruments, Newcastle, PA, USA) pulse laser thermal conductivity instrument. The measurements complied with the National Standards of the People’s Republic of China GB/T 22588-2008. After the samples were heated to the measurement temperature, the sample’s surface was shone by a laser pulse for a short time, and then the temperature change of the surface was detected with an infrared thermometer. Thermal conductivity was calculated according to the temperature change.
The cut metallographic samples were ground and polished with sandpaper and polishing cloth (polishing liquid: water), and then etched with the solution of nitric acid and alcohol (3 vol.% nitric acid). An optical microscope Zeiss Axio Vert A1 (Zeiss, Oberkochen, Germany) equipped with metallographic image analysis software was used to observe and analyze the microstructure.

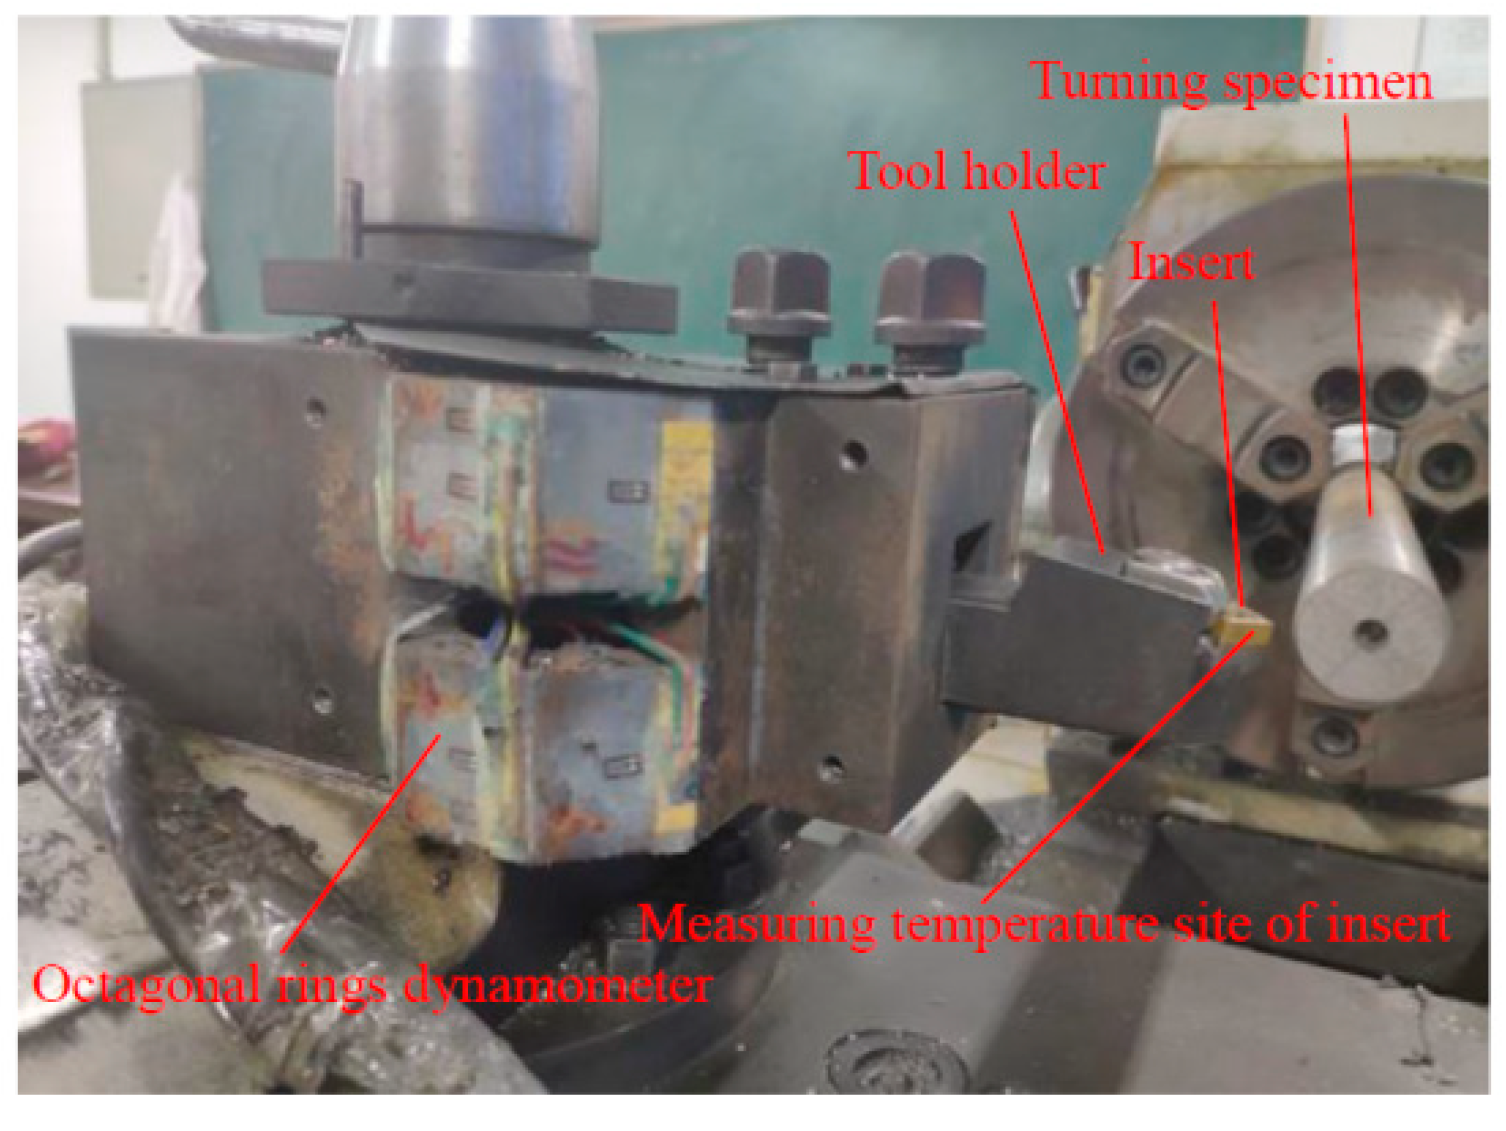
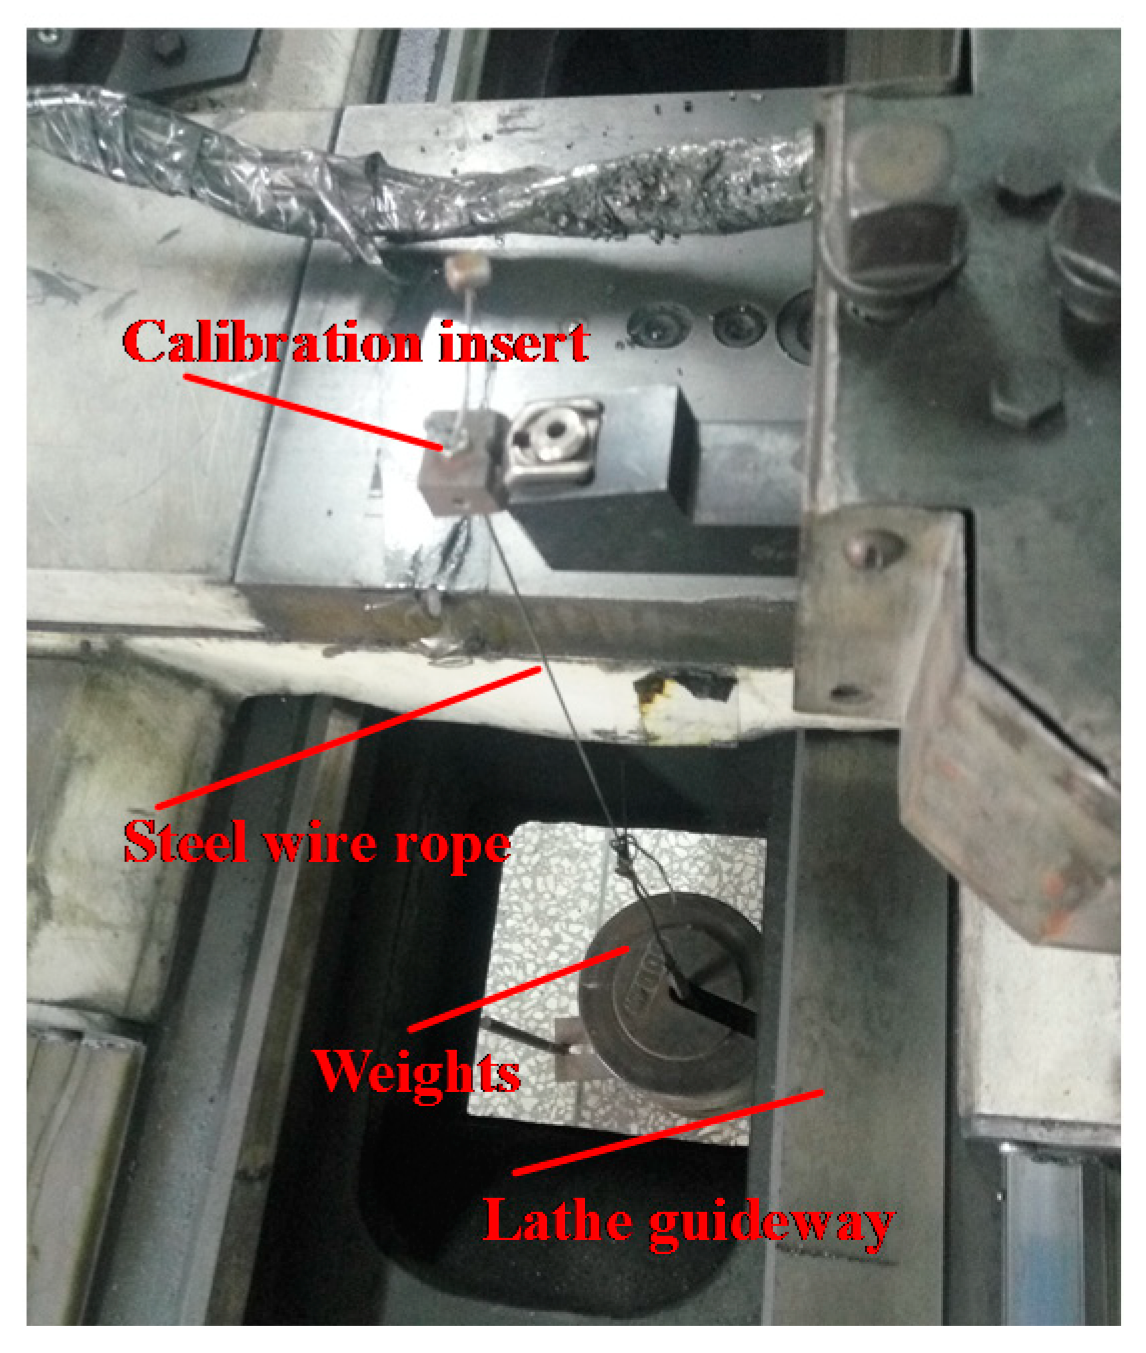
2.2.2. Turning Tests

The turning specimens blanks were cut from the front bracket castings (shown in Figure 1) made from the two materials and then machined into the Φ 28 mm × 285 mm size bar specimens. Two turning specimens were prepared for each of the two materials. In the turning process, the main cutting force was measured in real-time. The used lathe (Shenyang First Machine Tool Factory, Shenyang, China), a cutting tool (Sumitomo Electric Industries Ltd, Osaka, Japan), and measurement system of the cutting force (Donghua Testing Technology Co. Ltd., Taizhou, China) were the same as that in the previous paper [5]. Luis Norberto López de Lacalle et al. [16] adopted the dynamometric table KISTLER 9255B to measure the cutting force. It is a three-component quartz dynamometer for measuring the three orthogonal components of a force and the three induced torques. It has the advantage of convenient application. In our work, an elastomer (octagonal ring dynamometer) and twenty resistance strain gauges were combined together to measure the cutting force. This is a traditional and more economical method. The cutting tool and octagonal ring dynamometer installation are shown in Figure 3. The octagonal ring dynamometer was fixed on the lathe. The tool holder was fixed on the octagonal ring dynamometer and a cutting insert was fastened to the tool holder. Twenty resistance strain gauges were attached on the ring internal surface. Before cutting, measuring force system was calibrated using a slung load method. The insert was replaced by a calibration insert during calibrating. The calibration insert can be loaded by the slung load (as shown in Figure 4). Cutting force was measured according to the operation procedure given in [17], which ensured high measurement precision. The authors of [17] pointed when the cutting force is compared for different materials, a mechanically clamped tool should be used, and the insert can be replaced, but the tool holder should be mounted once only for all subsequent tests. The spindle rotation speed of the lathe was 180 rpm and the feeding rate was 0.51 mm/rev. The initial turning diameter was 28 mm and the cutting depth was 2 mm and 3 mm (diameter reduction), respectively. Measurement scene is shown in Figure 5.
During the turning process, at the same cutting length of ~70 mm, the insert temperature was measured on the side of the insert (measurement site is shown in Figure 3) using an infrared thermometer PT90 (Shan Xi RG Automatic Instrument Co., Ltd., Xi’an, China).
The surface roughness of the turning specimens was measured by an optical microscope ZAG-1 (Shanghai Optical Instrument Factory, Shanghai, China).

2.2.3. Drilling Tests

Drilling was performed on a horizontal machining center NH8000 DCG (Mori Seiki Manufacturing Company, Nagoya, Japan). The drilling site is shown in Figure 1. Two bits were used. One is a cemented carbide bit with Φ 14.5 mm diameter, and the other is a high-speed steel bit with Φ 19 mm diameter. When the Φ 14.5 mm bit was used, two adopted drilling processes were 1500 rpm rotating speed with 0.27 mm/rev feed rate and 800 rpm rotating speed with 0.5 mm/rev feed rate, respectively. Obviously, the drilling speed of the two drilling processes was the same: ~400 mm/min. Two holes were drilled for each material and each drilling process. When the Φ 19 mm bit was used, two adopted drilling processes were 240 rpm rotating speed with 0.42 mm/rev feed rate and 200 rpm rotating speed with 0.5 mm/rev feed rate, respectively. The drilling speed of 100 mm/min was the same for the two drilling processes. Two holes were also drilled for each material and each drilling process. The relative torque and feed force (bit axial force) on the bit were automatically measured by the horizontal machining center. Here, the relative load (torque or feed force) is the ratio of the actual load on the bit to the maximum designed output load of the machining center.
The depth of all drilled holes was 40 mm. When the bit just exited the hole after drilling, the temperature of the bit tip was measured using the infrared thermometer PT90. The drilled holes were cut along the central axis and the roughness of the internal surface was measured by the ZAG-1 microscope. The shape of the internal surface was measured by the three-dimensional surface profiler (NanoFocus AG, Oberhausen, Germany).

3. Results and Discussion

3.1. Microstructure Effects on Mechanical Properties

The mechanical properties of HT250 and QT450 are listed in Table 2. The tensile strength of each material was the average value obtained from four specimens, and the hardness of each material was the mean value of the five locations. In Table 2, the tensile strength of the two materials from the front brackets did not reach the required strength (>250 MPa for HT250 and >450 MPa for QT450). However, during the front brackets production, the individually cast tensile specimens reached the required strength, and thus the front brackets were considered as qualified products.
The structural parameters of the two materials are also listed in Table 2. In Table 2, the percentage is the volume percentage, which is calculated based on the area percentage in the metallograph (the volume percentage equals to the area percentage), and refers to the percentage of this type of graphite to the total graphite or the pearlite to the matrix. The microstructure of the two materials is shown in Figure 6. Flake graphite length of HT250 is 0.12–0.25 mm, and its pearlite content is about half of the matrix. The nodularity of QT450 is ~90%, and the graphite sphere diameter is 0.03–0.06 mm. The matrix structure of QT450 is basically ferrite.
The tensile strength of graphite cast irons is determined by graphite shape and size, pearlite content, and interlaminar spacing [18], and among them, the graphite shape is the most important factor. Spherical graphite, compared to flake graphite, not only reduces the stress concentration at the phase interface, but also reduces the segmentation of matrix structure. The two reasons lead to the tensile strength of HT250 to be significantly lower than QT450.
For graphitic cast irons, Brinell hardness of graphite is only ~3 HBS [19], which can be ignored compared to pearlite and ferrite. The pearlite hardness is dramatically higher than ferrite. For example, in the Fe-Cr-B alloy, the hardness of pearlite and ferrite is 290–330 HV [20] and 160–220 HV [21], respectively. Meanwhile, the pearlite hardness was mainly controlled by interlamellar spacing [22]. Thus, Brinell hardness of graphitic cast irons mainly depends on the pearlite content and pearlite interlamellar spacing. The pearlite content of HT250 was significantly higher than QT450, so the hardness of HT250 is significantly higher than QT450.

3.2. Microstructure and Physical Properties Effects on Turning and Drilling Ability
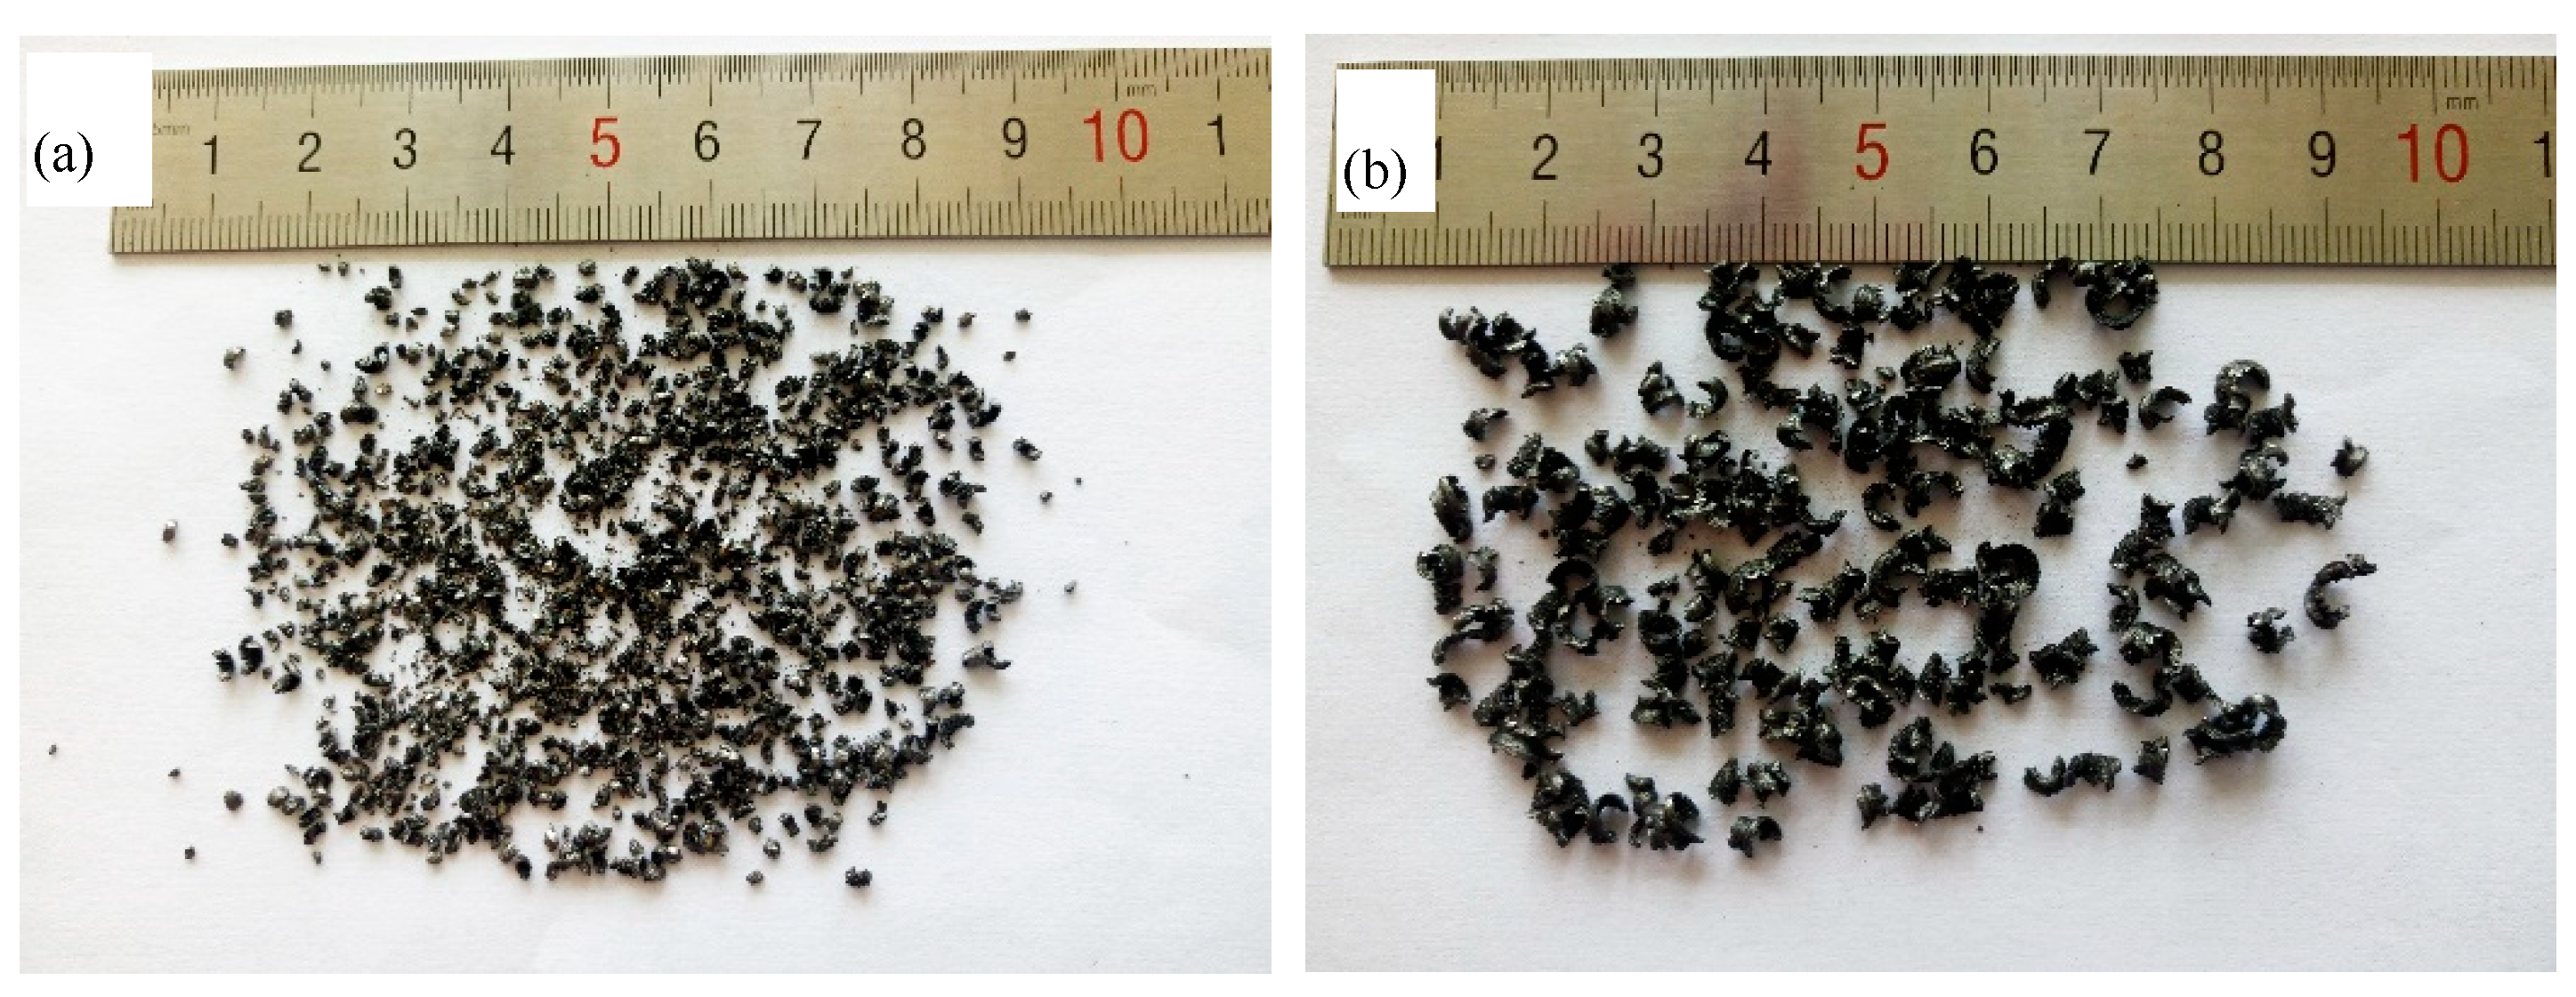
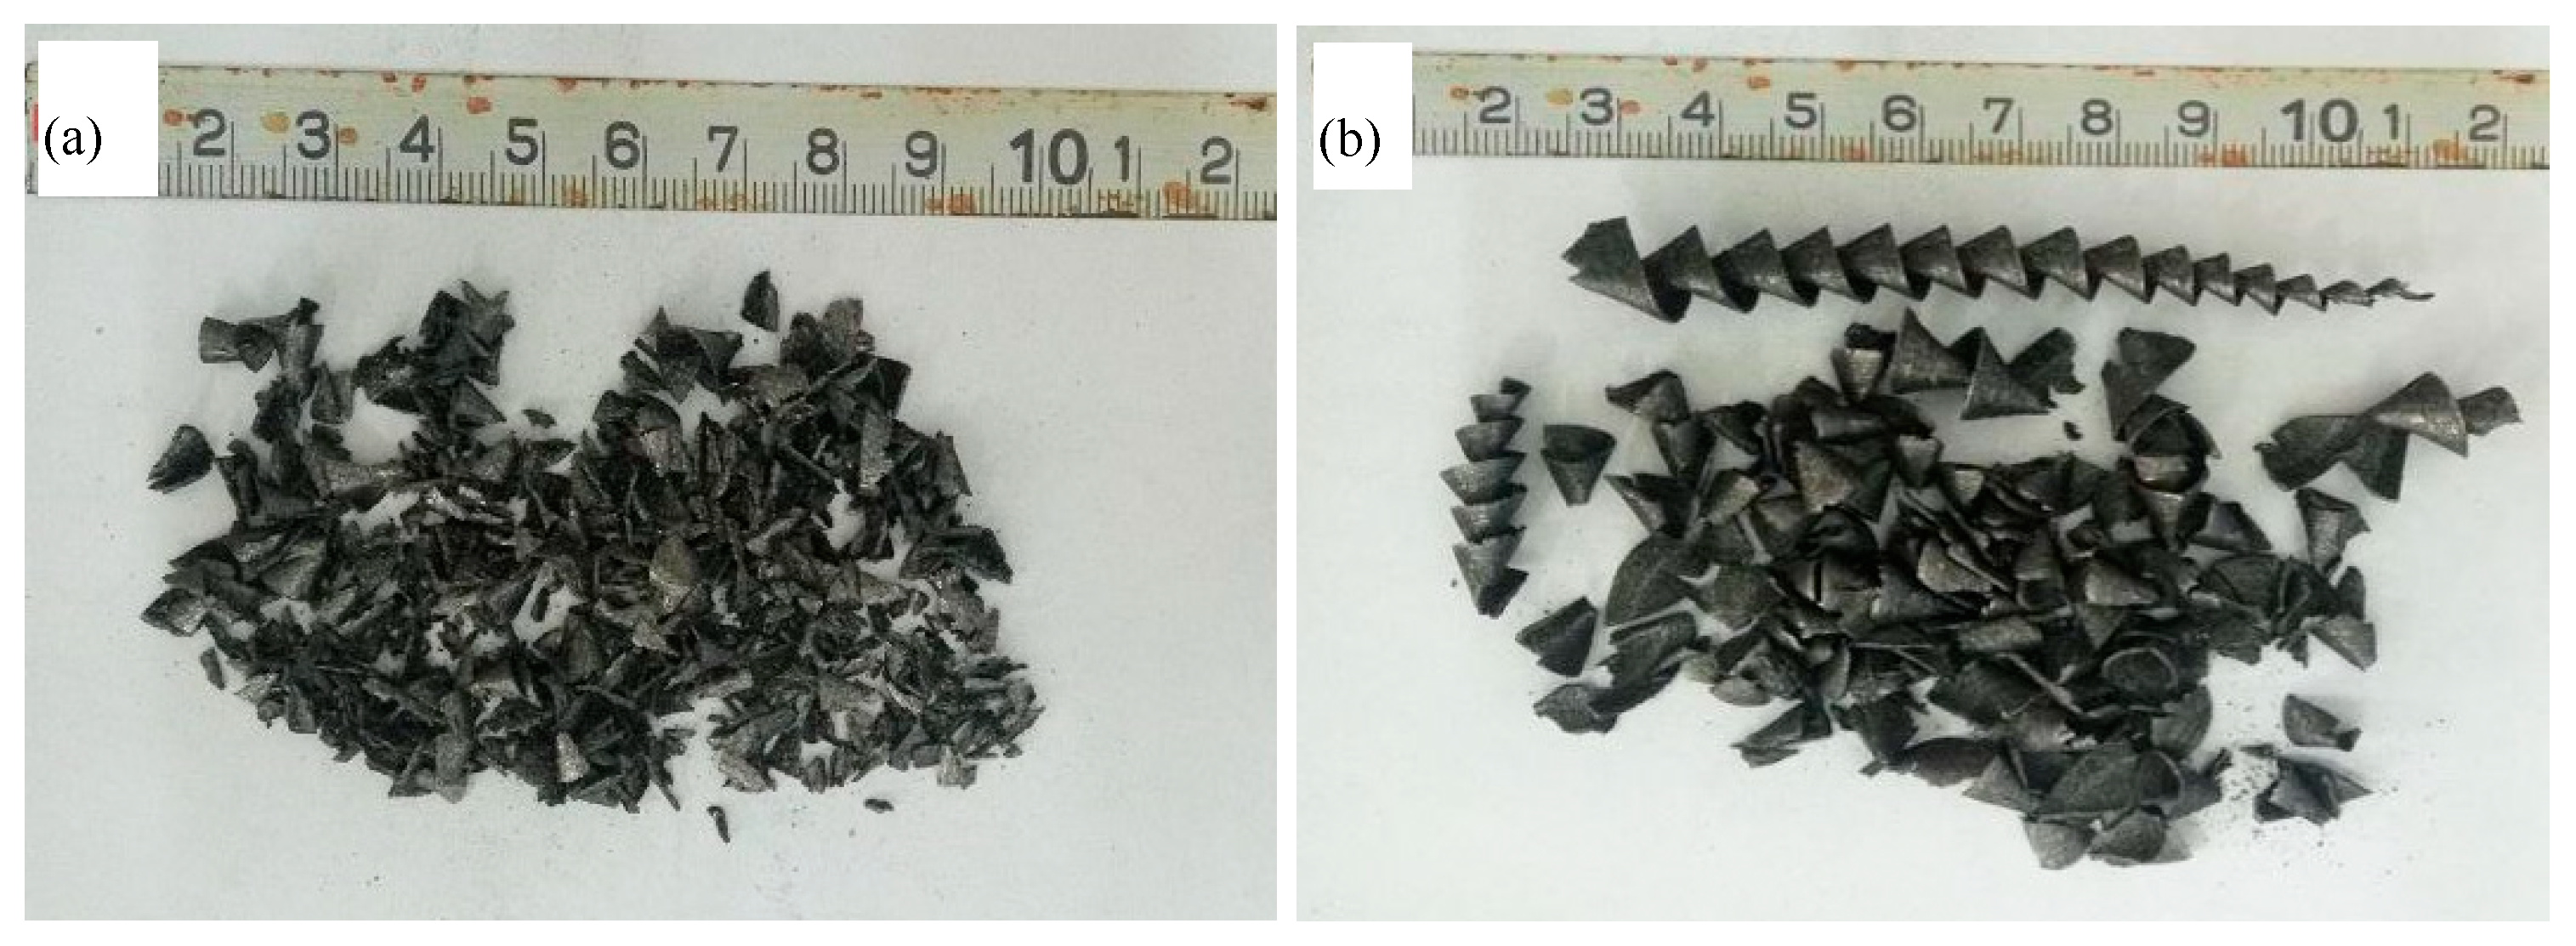
3.2.1. Chips Shape

The shape and size of drilling chips were roughly the same for the same diameter bit with different drilling processes (rotating speed and feed rate) for the same material. The larger the cutting depth or the bit, the bigger the chips should be for the same material. However, for different materials, whether in turning or drilling processes, the shape and size of chips were different under the same machining conditions, as shown in Figure 7 and Figure 8. The turning chips and drilling chips are obviously different, resulting from the difference of the geometric parameters of the insert and bit blades. Compared with HT250, in both the turning and drilling processes, the chips breaking of QT450 was worse, especially during drilling. This is because of the microstructure difference between the two materials. First, the graphite morphology of TH250 and QT450 was flakes and spheres, respectively. The round edge of spherical graphite reduces the stress concentration at the phase interface (i.e., reduces the notch effect), making the crack initiation more difficult [23]. The spherical graphite reduces the surface areas of graphite in the structure (for the same volume of graphite, the surface area of spherical graphite is less than flake graphite), and then reduces partitioning to the matrix [24]. Second, the matrix of QT450 was ferrite (<5% pearlite content), whereas HT250 was half ferrite and half pearlite. Compared with the pearlite, the ferrite had good plasticity, which can lead to its large plastic deformation without fracture.

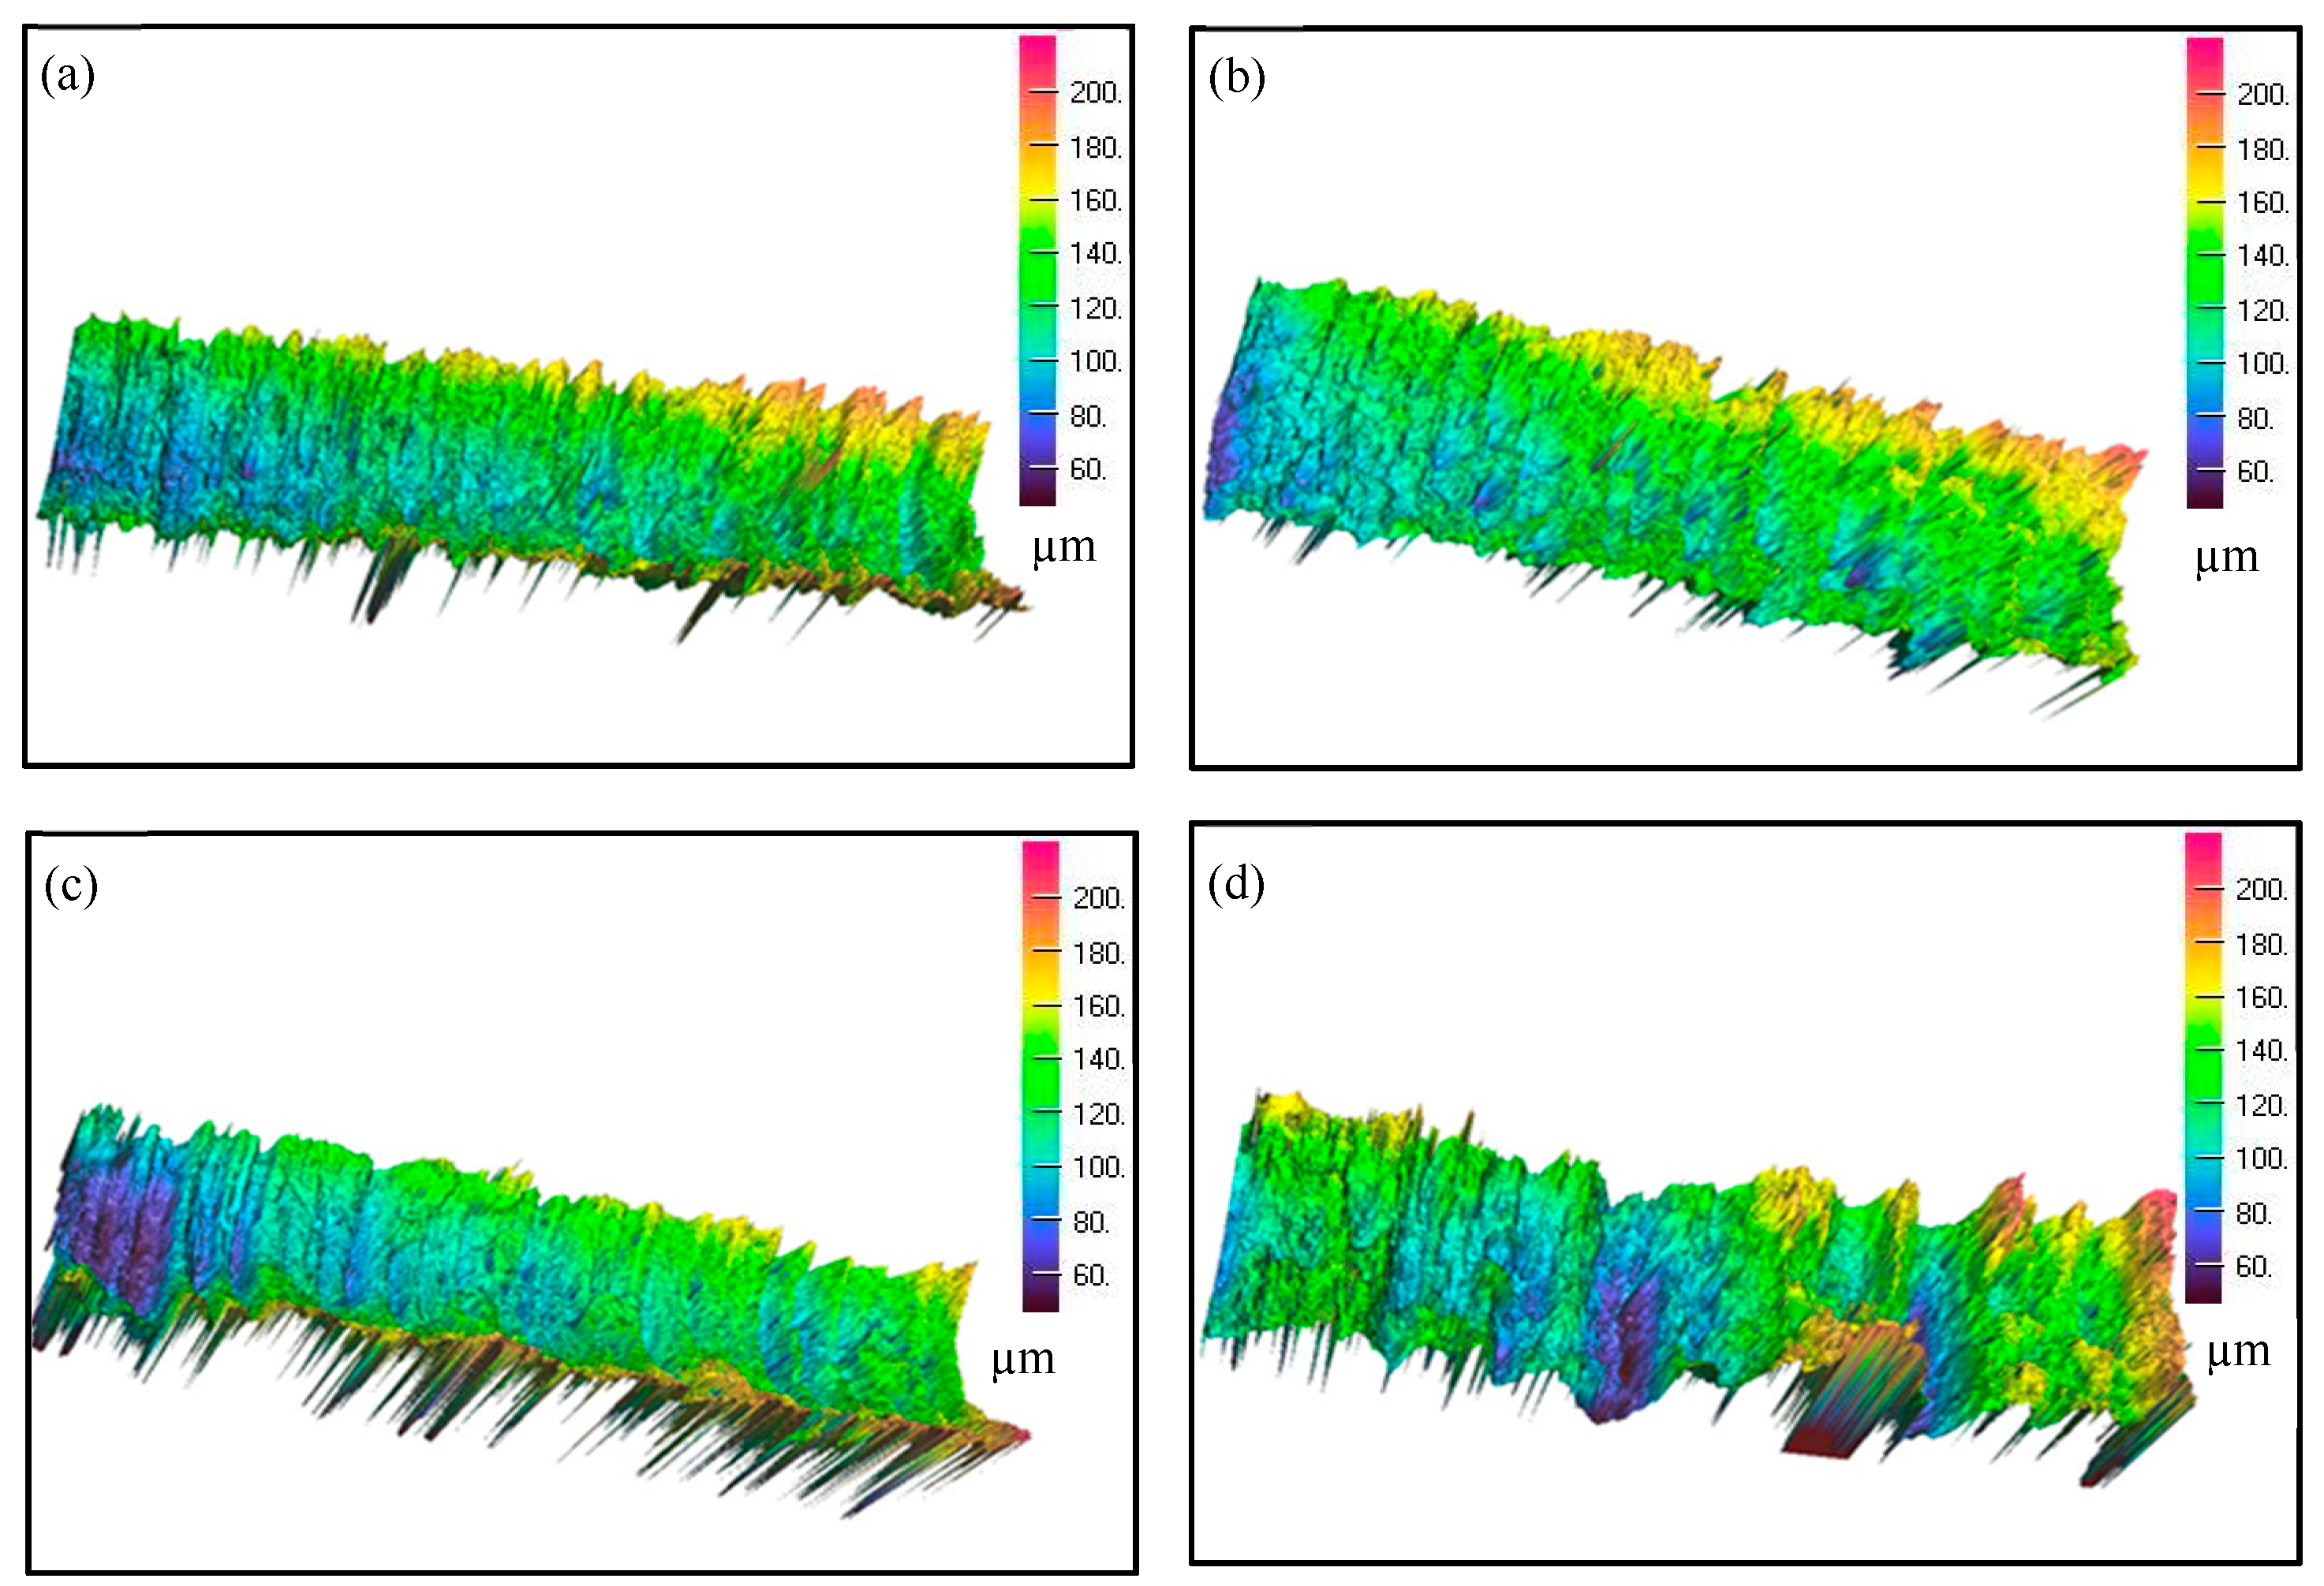
3.2.2. The Roughness of Turning Bar Surface and Drilling Hole Internal Surface

The roughness (Rz) of the turning specimen (bar) surface is listed in Table 3 (measurement standard: National Standards of the People’s Republic of China GB/T131-1993). By observing the drilling holes internal surface, it was found that holes internal surface roughness was not different for the same material drilled by the same diameter bit with different drilling process (rotating speed and feed rate). The holes internal surface roughness of the two materials, respectively, drilled by Φ 14.5 mm bit under 800 rpm rotating speed with 0.5 mm/rev feed rate and Φ 19 mm bit under 240 rpm rotating speed with 0.42 mm/rev feed rate, is listed in Table 3, and the three-dimensional shape of the holes internal surface is shown in Figure 9.
During turning, the differences in surface roughness were not obvious for different materials or different cutting depth. However, during drilling, the internal surface roughness of the hole is different for different materials or bit diameters. The QT450 roughness was higher than HT250 for the same bit. When drilled by the Φ 14.5 mm bit, the hole roughness of QT450 was 45% higher than HT250, and when drilled by the Φ 19 mm bit, it was 78% higher. The QT450 surface roughness during drilling was higher because of the worse chip breaking, leading to longer chips. It was harder to remove the longer chips from the holes, resulting in a rougher uneven hole surface. According to the analysis of the chips breaking the performance of QT450, increased pearlite content in the QT450 spheroidal graphite cast iron structure improved chips breaking performance, and thus improves the surface quality. In the turning process, difficult chip removal did not exist, so the surface roughness differences between QT450 and HT250 turning specimens are not obvious.

3.2.3. Insert and Bit Temperature during Turning and Drilling

The insert and bit temperatures are listed in Table 4 for the QT450 and HT250 turning and drilling. The bit temperature is the average value obtained by drilling two holes. As seen in Table 4, for the two machined materials, the insert temperature was roughly the same for the same cutting depth, whereas the bit temperature was obviously different for the same drilling process (bit diameter, rotating speed and feed rate). Under the same drilling conditions, two reasons caused the bit temperature during QT450 drilling to be higher than HT250. First, during QT450 drilling, higher friction occurred because of the difficult chip removal, resulting in a higher temperature of the bit. Second, the thermal conductivity of QT450 is significantly lower than HT250, as listed in Table 5, which resulted in lower heat dissipation during QT450 drilling, and thus higher temperature. In production, drilling is continuously carried out multiple times, so the temperature rise of the bit used to drill QT450 will be higher, leading to wear degradation of the bit. The difference of friction-generated heat between the chip and the insert during turning of QT450 and HT250 is small due to the similar shape and size of the QT450 and HT250 chips. Opposite to drilling an enclosed hole, the insert is open, so the effects of different thermal conductivity of QT450 and HT250 on the insert temperature were relatively weak. This led to roughly the same insert temperature during turning QT450 and HT250.

3.2.4. Turning and Drilling Load

The average values and standard deviation of the main cutting force over 70 mm cutting length at 2 mm and 3 mm cutting depth are listed in Table 6. The average value and standard deviation of the main cutting force of HT250 were obviously higher than QT450. At 2 mm cutting depth, the cutting force of HT250 was 9% higher than QT450, and at 3 mm cutting depth, it was 19% higher. The HT250 (FGI) with higher hardness and lower tensile strength had a higher cutting force compared with QT450 (SGI). In [5] (our previous work), the cutting force of FGI was also higher with higher hardness and lower tensile strength than CGI and SGI. FGI with 250 HB hardness and 347 MPa tensile strength had 1438 N cutting force at 2.5 mm cutting depth, whereas CGI with 162 HB hardness and 345 MPa tensile strength had 1156 N cutting force, and SGI with 181 HB hardness and 525 MPa tensile strength had 1254 N cutting force. However, in [3], there was no such phenomenon observed, as shown in Table 7. The cutting force of FGI with higher hardness (175 HB) was obviously smaller than SGI with lower hardness (155 HB). The results in different references are obviously inconsistent. This inconsistent situation can be explained as follows. The cutting force should also be closely related to lubricant on the tool surface, cut material deformation and fracture resistance besides tool material and geometric parameters. During cutting, the share rates of these factors (lubricant, cut material deformation, and fracture resistance) in the cutting force are still unclear. These inconsistent results of this work and of the works in [3,5] are likely due to sulfur content differences of their respective FGI. Heck et al. [7] pointed the reason why FGI had good machinability compared with CGI was due to the formation of the MnS layer on the tool surface when machining FGI, but this layer cannot form when machining CGI due to addition of vermiculizer containing magnesium during CGI casting. Likewise, this layer cannot form when machining SGI due to the addition of nodularizer containing magnesium during SGI casting. The MnS layer acts as a lubricant and prevents the adhesion of workpiece particles, which dramatically decreases the cutting force and tool wear. For graphite cast irons with different graphite shapes, the influence of the MnS layer on the cutting force is different. Yet, the influence of the MnS layer should not be classified as the influence of graphite shape.
The sulfur content was 0.055 wt.% in HT250 (The sulfur content of FGI was also low in our previous work because all castings were produced by the same company.), but the content of FGI in [3,7] was relatively high, up to 0.09 wt.% and 0.085 wt.%, respectively. Due to lower sulfur content in HT250, the MnS lubricant layer could not be formed or was discontinuous, and its effect on the cutting force was lower, which resulted in the larger cutting force during HT250 cutting. Meanwhile, as described above, graphitic cast irons with higher pearlite content have higher hardness. Higher hardness resulted in higher deformation resistance. Only from the deformation resistance, the higher the pearlite content in the HT250 matrix led to the larger cutting force of HT250. Based on plenty of experimental data in our previous work, the pearlite content is the main cutting force influencing factor under our experimental conditions. The fracture resistance during cutting is different from the tensile strength because of the different stress states. However, there should be a positive correlation between the two. The magnitude of the effect of the tensile strength on cutting force is still unclear.
The single ferrite in the QT450 matrix led to a smaller cutting force standard deviation of QT450.
The relative torque and feed force on the bit under different drilling processes are listed in Table 8. Under the same drilling conditions, the difference of the drilling load (relative torque and feed force) between the two materials was small. Two factors caused this result. First, compared with HT250, the friction between the bit and chips during drilling of QT450 is severe. The larger friction force resisted bit rotation and feeding and resulted in the larger drilling load. Second, the cutting mechanism of the cutting edges of both insert and bit was the same [25]. The cutting force on the insert was smaller during QT450 turning, and the cutting force on the bit edge was also relatively smaller during QT450 drilling. The smaller cutting force on the bit edge should lead to a smaller drilling load. The even action of the larger friction force and the smaller cutting force on the bit during QT450 drilling resulted in the drilling loads of QT450 and HT250 being roughly the same.
In summary, during rough turning, compared with QT450, the turning ability of HT250 was worse due to its larger cutting force. However, the drilling ability of HT250 was better due to its smaller hole surface roughness and lower temperature of the bit. To increase drill bit life in drilling SGI, appropriate surface treatment for drill bit may be an efficient method. Rodriguez-Barrero et al. [26] concluded that the proper coatings (TiAlSiN, mAlTiN, and AlTiSiN) can offer the best performance (including long life of drill bit) in drilling low and medium carbon steels according to flank wear, adhesion, chip evacuation, and thrust force evolution criteria. Their research results are used for reference for the choice and design of the drill bit during drilling the SGI front brackets.

4. Conclusions

(1) During rough turning, the average value and standard deviation of the cutting force of HT250 with lower sulfur content were obviously larger than QT450. At 2 mm cutting depth, the cutting force of HT250 was 9% higher than QT450, and at 3 mm cutting depth, it was 19% higher. However, the surface roughness of the two materials was roughly the same.
(2) During drilling, the even action of the larger friction force and the smaller cutting force on the bit during QT450 drilling caused the drilling loads of QT450 and HT250 to be roughly the same.
(3) Compared with HT250, the much higher friction and lower thermal conductivity lead to a higher temperature of the bit during QT450 drilling. The chips breaking situation was worse and the longer chips badly scratched the surface of the holes, resulting in the larger surface roughness. When drilled by the Φ 14.5 mm bit, the hole roughness of QT450 was 45% higher than HT250, and when drilled by the Φ 19 mm bit, it was 78% higher.

Author Contributions

J.R. drafted the manuscript and performed a part of experiments; F.R. contributed to the study concept; F.L. contributed to the bracket production; L.C. performed the experiments; Y.X. and A.A.V. performed the data analysis and revised the manuscript. All authors have read and agreed to the published version of the manuscript.

Funding

This study was supported by China’s National Overseas Study Fund (CSC201808180001) and the National Natural Science Foundation of China (U1804146).

Conflicts of Interest

The authors declare no conflicts of interest.

References

  1. Ezugwu, E.O.; Wang, Z.M. Titanium alloys and their machinability—A review. J. Mater. Process. Tech. 1997, 68, 262–274. [Google Scholar] [CrossRef]
  2. Günay, M.; Korkut, I.; Aslan, E.; Seker, U. Experimental investigation of the effect of cutting tool rake angle on main cutting force. J. Mater. Process. Tech. 2005, 166, 44–49. [Google Scholar] [CrossRef]
  3. Nayyar, V.; Kaminski, J.; Kinnander, A.; Nyborg, L. An experimental investigation of machinability of graphitic cast iron grades; flake, compacted and spheroidal graphite iron in continuous machining operations. Procedia Cirp 2012, 1, 488–493. [Google Scholar] [CrossRef]
  4. Seker, U.; Hasirci, H. Evaluation of machinability of austempered ductile irons in terms of cutting forces and surface quality. J. Mater. Process. Tech. 2006, 173, 260–268. [Google Scholar] [CrossRef]
  5. Ren, J.Z.; Li, Z.L.; Xiong, Y.; Li, F.J.; Ren, F.Z.; Volinsky, A.A. Effect of microstructure and mechanical properties on cutting force of different cast irons with similar tensile strength. China Foundry 2019, 16, 177–183. [Google Scholar] [CrossRef] [Green Version]
  6. Tooptong, S.; Park, K.H.; Kwon, P. A comparative investigation on flank wear when turning three cast irons. Tribol. Int. 2018, 120, 127–139. [Google Scholar] [CrossRef]
  7. Heck, M.; Ortner, H.M.; Flege, S.; Reuter, U.; Ensinger, W. Analytical investigations concerning the wear behaviour of cutting tools used for the machining of compacted graphite iron and grey cast iron. Int. J. Refract. Met. Hard Mater. 2008, 26, 197–206. [Google Scholar] [CrossRef]
  8. De Sousa, J.A.G.; Sales, W.F.; Guesser, W.L.; Machado, Á.R. Machinability of rectangular bars of nodular cast iron produced by continuous casting. Int. J. Adv. Manuf. Tech. 2018, 98, 2505–2517. [Google Scholar] [CrossRef]
  9. Dias, L.R.M.; Diniz, A.E. Effect of the gray cast iron microstructure on milling tool life and cutting force. J. Braz. Soc. Mech. Sci. 2013, 35, 17–29. [Google Scholar] [CrossRef]
  10. Amir, M.; Rohollah, G.; Carsten, B. Effects of workpiece microstructure, mechanical properties and machining conditions on tool wear when milling compacted graphite iron. Wear 2018, 410, 190–201. [Google Scholar]
  11. Da Silva, M.B.; Naves, V.T.G.; De Melo, J.D.B.; De Andrade, C.L.F.; Guesser, W.L. Analysis of wear of cemented carbide cutting tools during milling operation of gray iron and compacted graphite iron. Wear 2011, 271, 2426–2432. [Google Scholar] [CrossRef]
  12. Ren, F.Z.; Li, F.J.; Liu, W.M.; Ma, Z.H.; Tian, B.H. Effect of inoculating addition on machinability of gray cast Iron. J. Rare Earth 2009, 27, 294–299. [Google Scholar] [CrossRef]
  13. Meena, A.; El Mansori, M. Drilling performance of green austempered ductile iron (ADI) grade produced by novel manufacturing technology. Int. J. Adv. Manuf. Tech. 2012, 59, 9–19. [Google Scholar] [CrossRef]
  14. Jan, J.; Rafal, K.; Tomasz, T. Operational tests of wear dynamics of drills made of low-alloy high-speed Hs2-5-1 steel. Eksploat. Niezawodn. 2016, 18, 271–277. [Google Scholar]
  15. Li, Y.; Wu, W.W. Investigation of drilling machinability of compacted graphite iron under dry and minimum quantity lubrication. Metals 2019, 9, 1095. [Google Scholar] [CrossRef] [Green Version]
  16. De Lacalle, L.N.L.; Lamikiz, A.; Sanchez, J.A.; de Bustos, I.F. Simultaneous measurement of forces and machine tool position for diagnostic of machining tests. IEEE Trans. Instrum. Meas. 2005, 54, 2329–2335. [Google Scholar]
  17. Ren, F.Z.; Zhang, D.W.; Volinsky, A.A. Experimental investigation of the cutting force measurements in machinability evaluations of metals. J. Test. Eval. 2014, 42, 1541–1545. [Google Scholar]
  18. Hernando, J.C.; Elfsberg, J.; Ghassemali, E.; Dahle, A.K.; Diószegi, A. The effect of coarsening of primary austenite on the ultimate tensile strength of hypoeutectic compacted graphite Fe-C-Si alloys. Scr. Mater. 2019, 168, 33–37. [Google Scholar] [CrossRef]
  19. Qian, L.; Zhang, H.B.; Zhao, Y.C.; Chen, J.P. Relationship between cutting machining properties of graphite-containing cast irons and their structures. Mod. Cast Iron 2005, 25, 17–20. [Google Scholar]
  20. Tian, Y.; Ju, J.; Fu, H.G.; Ma, S.Q.; Lin, J.; Lei, Y.P. Effect of chromium content on microstructure, hardness, and wear resistance of as-cast Fe-Cr-B alloy. J. Mater. Eng. Perform. 2019, 28, 6428–6437. [Google Scholar] [CrossRef]
  21. Buchely, M.F.; Gutierrez, J.C.; Leon, L.M.; Toro, A. The effect of microstructure on abrasive wear of hardfacing alloys. Wear 2005, 259, 52–61. [Google Scholar] [CrossRef]
  22. Zhao, Y. Effects of raw material proportioning on pearlitic lamellar spacing and hardness of ductile iron. Foundry 2011, 60, 397–400. [Google Scholar]
  23. Sun, T.; Song, R.B.; Li, Y.P.; Yang, F.Q.; Wu, C.J.; Wang, Z.Y. Influence of nodularizing and inoculation treatment on the microstructure characteristic and mechanical property of lower bainite cast iron. J. Mech. Eng. 2015, 51, 128–134. [Google Scholar] [CrossRef] [Green Version]
  24. Carazo, F.D.; Giusti, S.M.; Boccardo, A.D.; Godoy, L.A. Effective properties of nodular cast-iron: A multi-scale computational approach. Comp. Mater. Sci. 2014, 82, 378–390. [Google Scholar] [CrossRef]
  25. Ren, F.Z.; Cui, L.K.; Shi, W.P.; Xiong, Y.; Wei, S.Z. Drilling-ability evaluation for grey cast iron and ductile iron front brackets. Acta Metrol. Sin. 2018, 39, 842–846. [Google Scholar]
  26. Rodriguez-Barrero, S.; Fernández-Larrinoa, J.; Azkona, I.; López de Lacalle, L.N.; Polvorosa, R. Enhanced performance of nanostructured coatings for drilling by droplet elimination. Mater. Manuf. Process. 2016, 31, 593–602. [Google Scholar] [CrossRef]
Figure 1. The front bracket casting and its tested parts.
Metals 10 00285 g001
Figure 2. Schematic diagram of samples cutting sites and hardness measurement locations.
Metals 10 00285 g002
Figure 3. Cutting tool and octagonal ring dynamometer installation.
Metals 10 00285 g003
Figure 4. Calibration of measuring force system.
Metals 10 00285 g004
Figure 5. Measurement scene.
Metals 10 00285 g005
Figure 6. The microstructure of two materials: (a) HT250 and (b) QT450.
Metals 10 00285 g006
Figure 7. The turning chips appearance at 2 mm cutting depth: (a) HT250 and (b) QT450.
Metals 10 00285 g007
Figure 8. The drilling chips appearance for the Φ 14.5 mm bit diameter with 800 rpm rotating speed and 0.5 mm/rev feed rate: (a) HT250 and (b) QT450.
Metals 10 00285 g008
Figure 9. Three-dimensional shape of the holes internal surface of the HT250 borehole: (a) Φ 14.5 mm bit and (b) Φ 19 mm bit; QT450 borehole: (c) Φ 14.5 mm bit and (d) Φ 19 mm bit (1.6 mm measured length).
Metals 10 00285 g009
Table 1. The composition of HT250 and QT450 in wt.%.
MaterialCSiMnCrSPMgRare Earths
HT250Design3.15–3.31.6–1.80.8–10.2–0.3≤0.12≤0.10--
Actual3.261.800.830.170.0550.03--
QT450Design3.6–42.7–3≤0.35-≤0.035≤0.070.035–0.0550.02–0.04
Actual3.552.930.26-0.0180.0310.0550.02
Table 2. The microstructure and mechanical properties of HT250 and QT450.
MaterialGraphite Shape and Content, vol.%Graphite Length or Diameter, mmPearlite Content, vol.%Tensile Strength, MPaBrinell Hardness, HB
HT250Flake, 1000.12–0.2545–55191163
QT450Sphere, 900.03–0.06<5420141
Table 3. The surface roughness in μm.
MaterialsTurningDrilling
Depth 2 mmDepth 3 mmΦ 14.5 mm BitΦ 19 mm Bit
HT25034.240.920.450.3
QT45034.636.429.689.5
Table 4. The insert and bit temperature in °C.
MaterialInsertΦ 14.5 mm BitΦ 19 mm Bit
n = 1500,n = 800,n = 240,n = 200,
t = 2t = 3v = 0.27v = 0.5v = 0.42v = 0.5
HT2508711698898692
QT45093114126102105124
Note: t is the cutting depth (mm); n is the bit speed (rpm); v is the feed rate (mm/rev).
Table 5. Thermal conductivity at a different temperature, W/(m·K).
Material323 K423 K473 K573 K
HT25049464441
QT45031333436
Table 6. The average value and standard deviation of the main cutting force, N.
MaterialCutting Depth of 2 mmCutting Depth of 3 mm
AverageDeviationAverageDeviation
HT25096440141558
QT45088231119237
Table 7. The average cutting force, N [3].
MaterialTurningBoring
v = 30, f = 0.2, t = 1.5v = 30, f = 0.3, t = 1.5
FGI615790
CGI700920
SGI940
Note: v is the cutting speed (m/min), f is the feed rate (mm/rev), and t is the cutting depth (mm).
Table 8. Relative torque and relative feed force on the drilling bits.
MaterialMeasuring ProjectΦ 14.5 mm BitΦ 19 mm Bit
n = 1500,
v = 0.27
N = 800,
V = 0.5
n = 240,
v = 0.42
N = 200,
V = 0.5
HT250Relative torque, %16756
Relative feed force, %6259
QT450Relative torque, %15856
Relative feed force, %6361
Note: n is bit the rotating speed (rpm); v is the feed rate (mm/rev).

