Metallurgical Characterization of the Interfaces in Steel Plates Clad with Austenitic Steel or High Ni Alloys by Hot Rolling


Abstract
1. Introduction
2. Materials and Methods
2.1. Clad Plates Production, Specimens Fabrication, and Experimental Tests
- (a)
- low carbon steel ASTM A 515 Gr.60 plate (thickness 6.5 mm), clad with AISI 304 L austenitic steel (thickness 2.5 mm) (Table 1);
- (b)
- low carbon steel ASTM A 283 plate (thickness 10 mm), clad with Alloy 59 (thickness 2.5 mm) (Table 2); and,
- (c)
- low carbon steel AISI 1010 plate (thickness 13 mm), clad with Monel 400 (thickness 2 mm) (Table 3).
2.2. Theoretical Modelling and Simulation
- obtain the couples of values of temperature and time, which are compatible with the process, and characterize the diffusion phenomena; and,
- analyze the effects of process temperature and time variations on the thickness involved by diffusion and on cladding uniformity and stability.
3. Results of Experimental Characterization
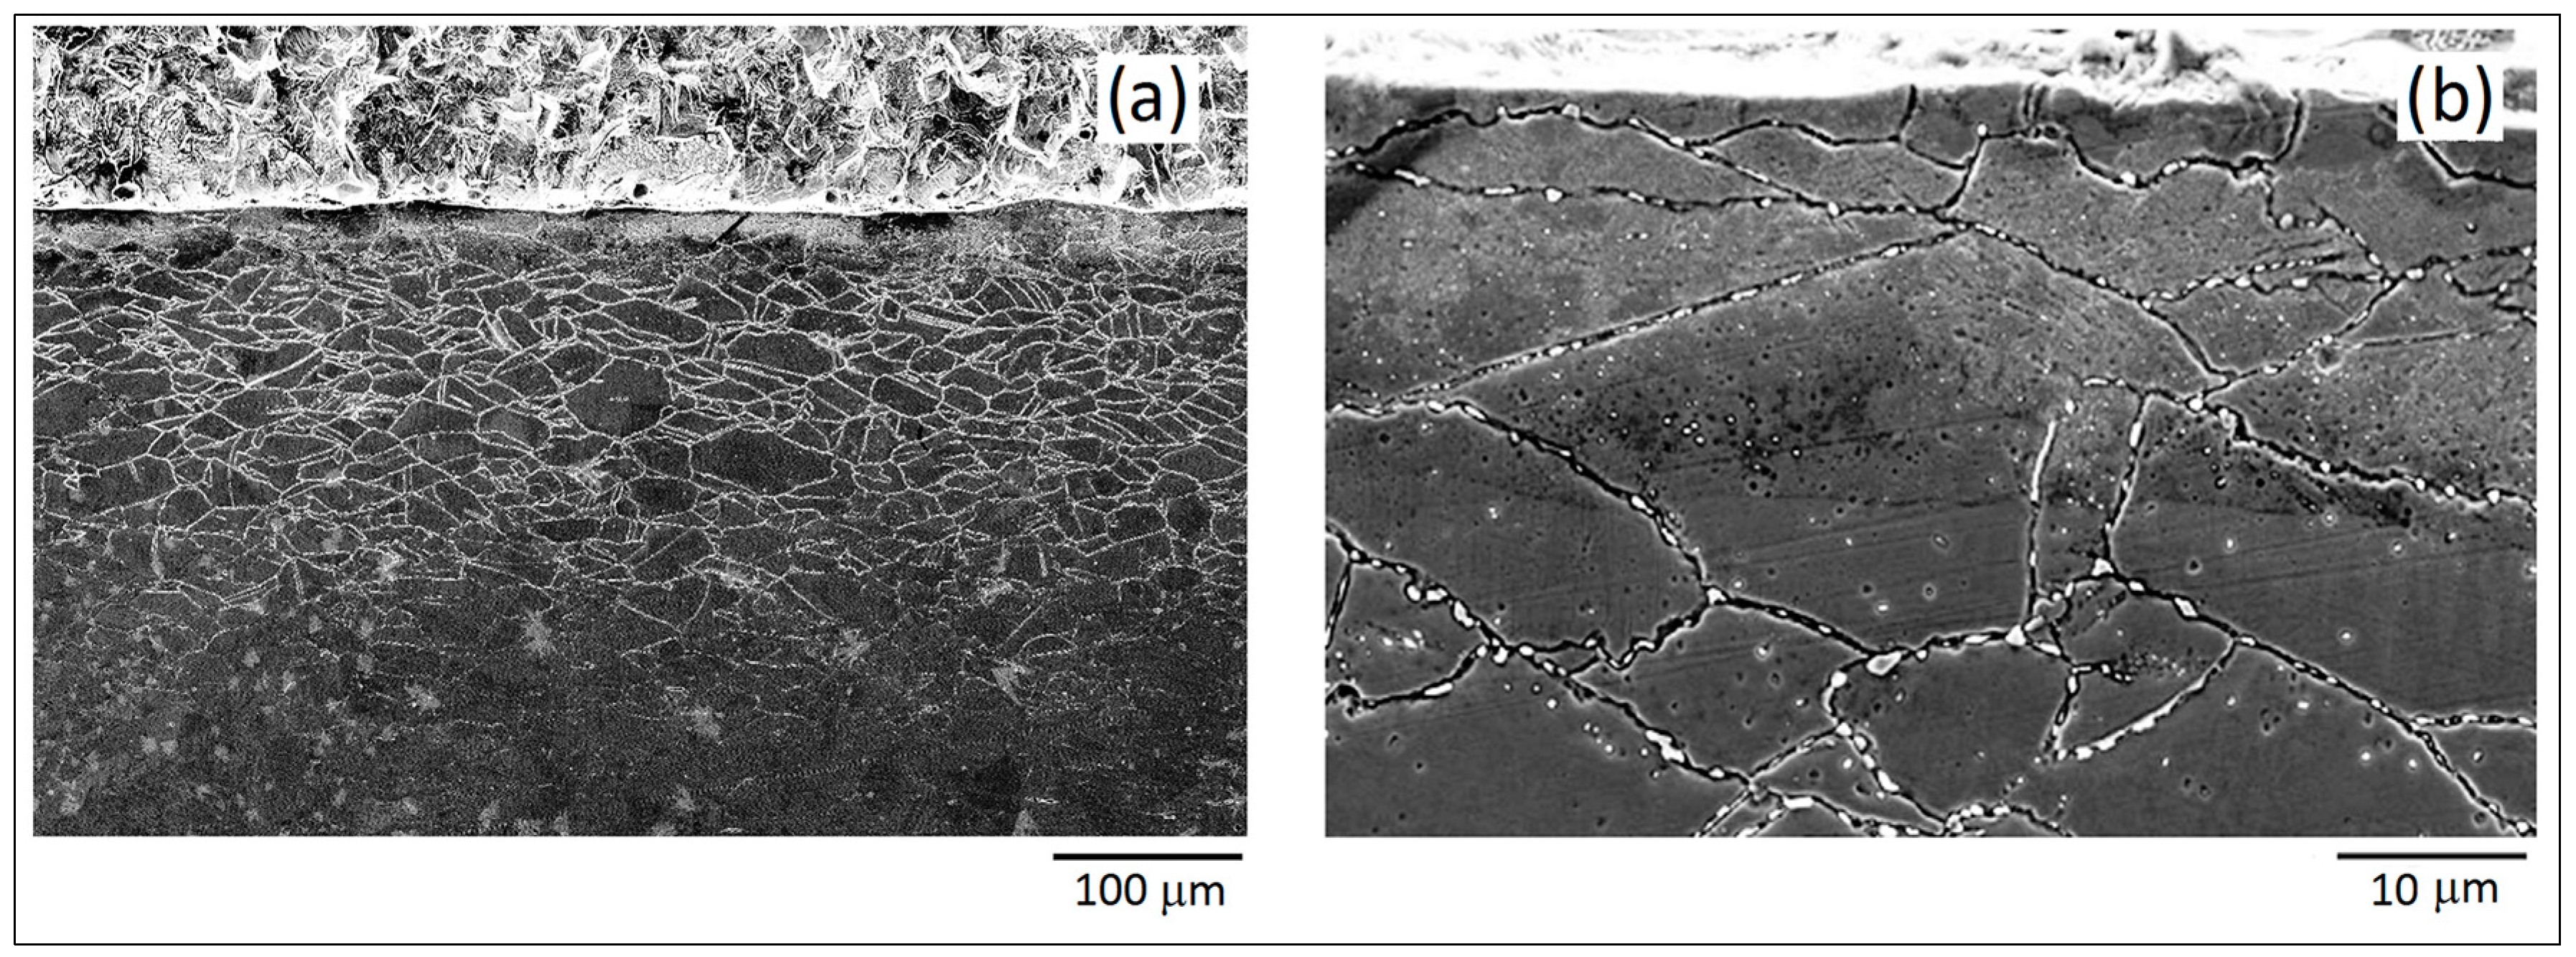
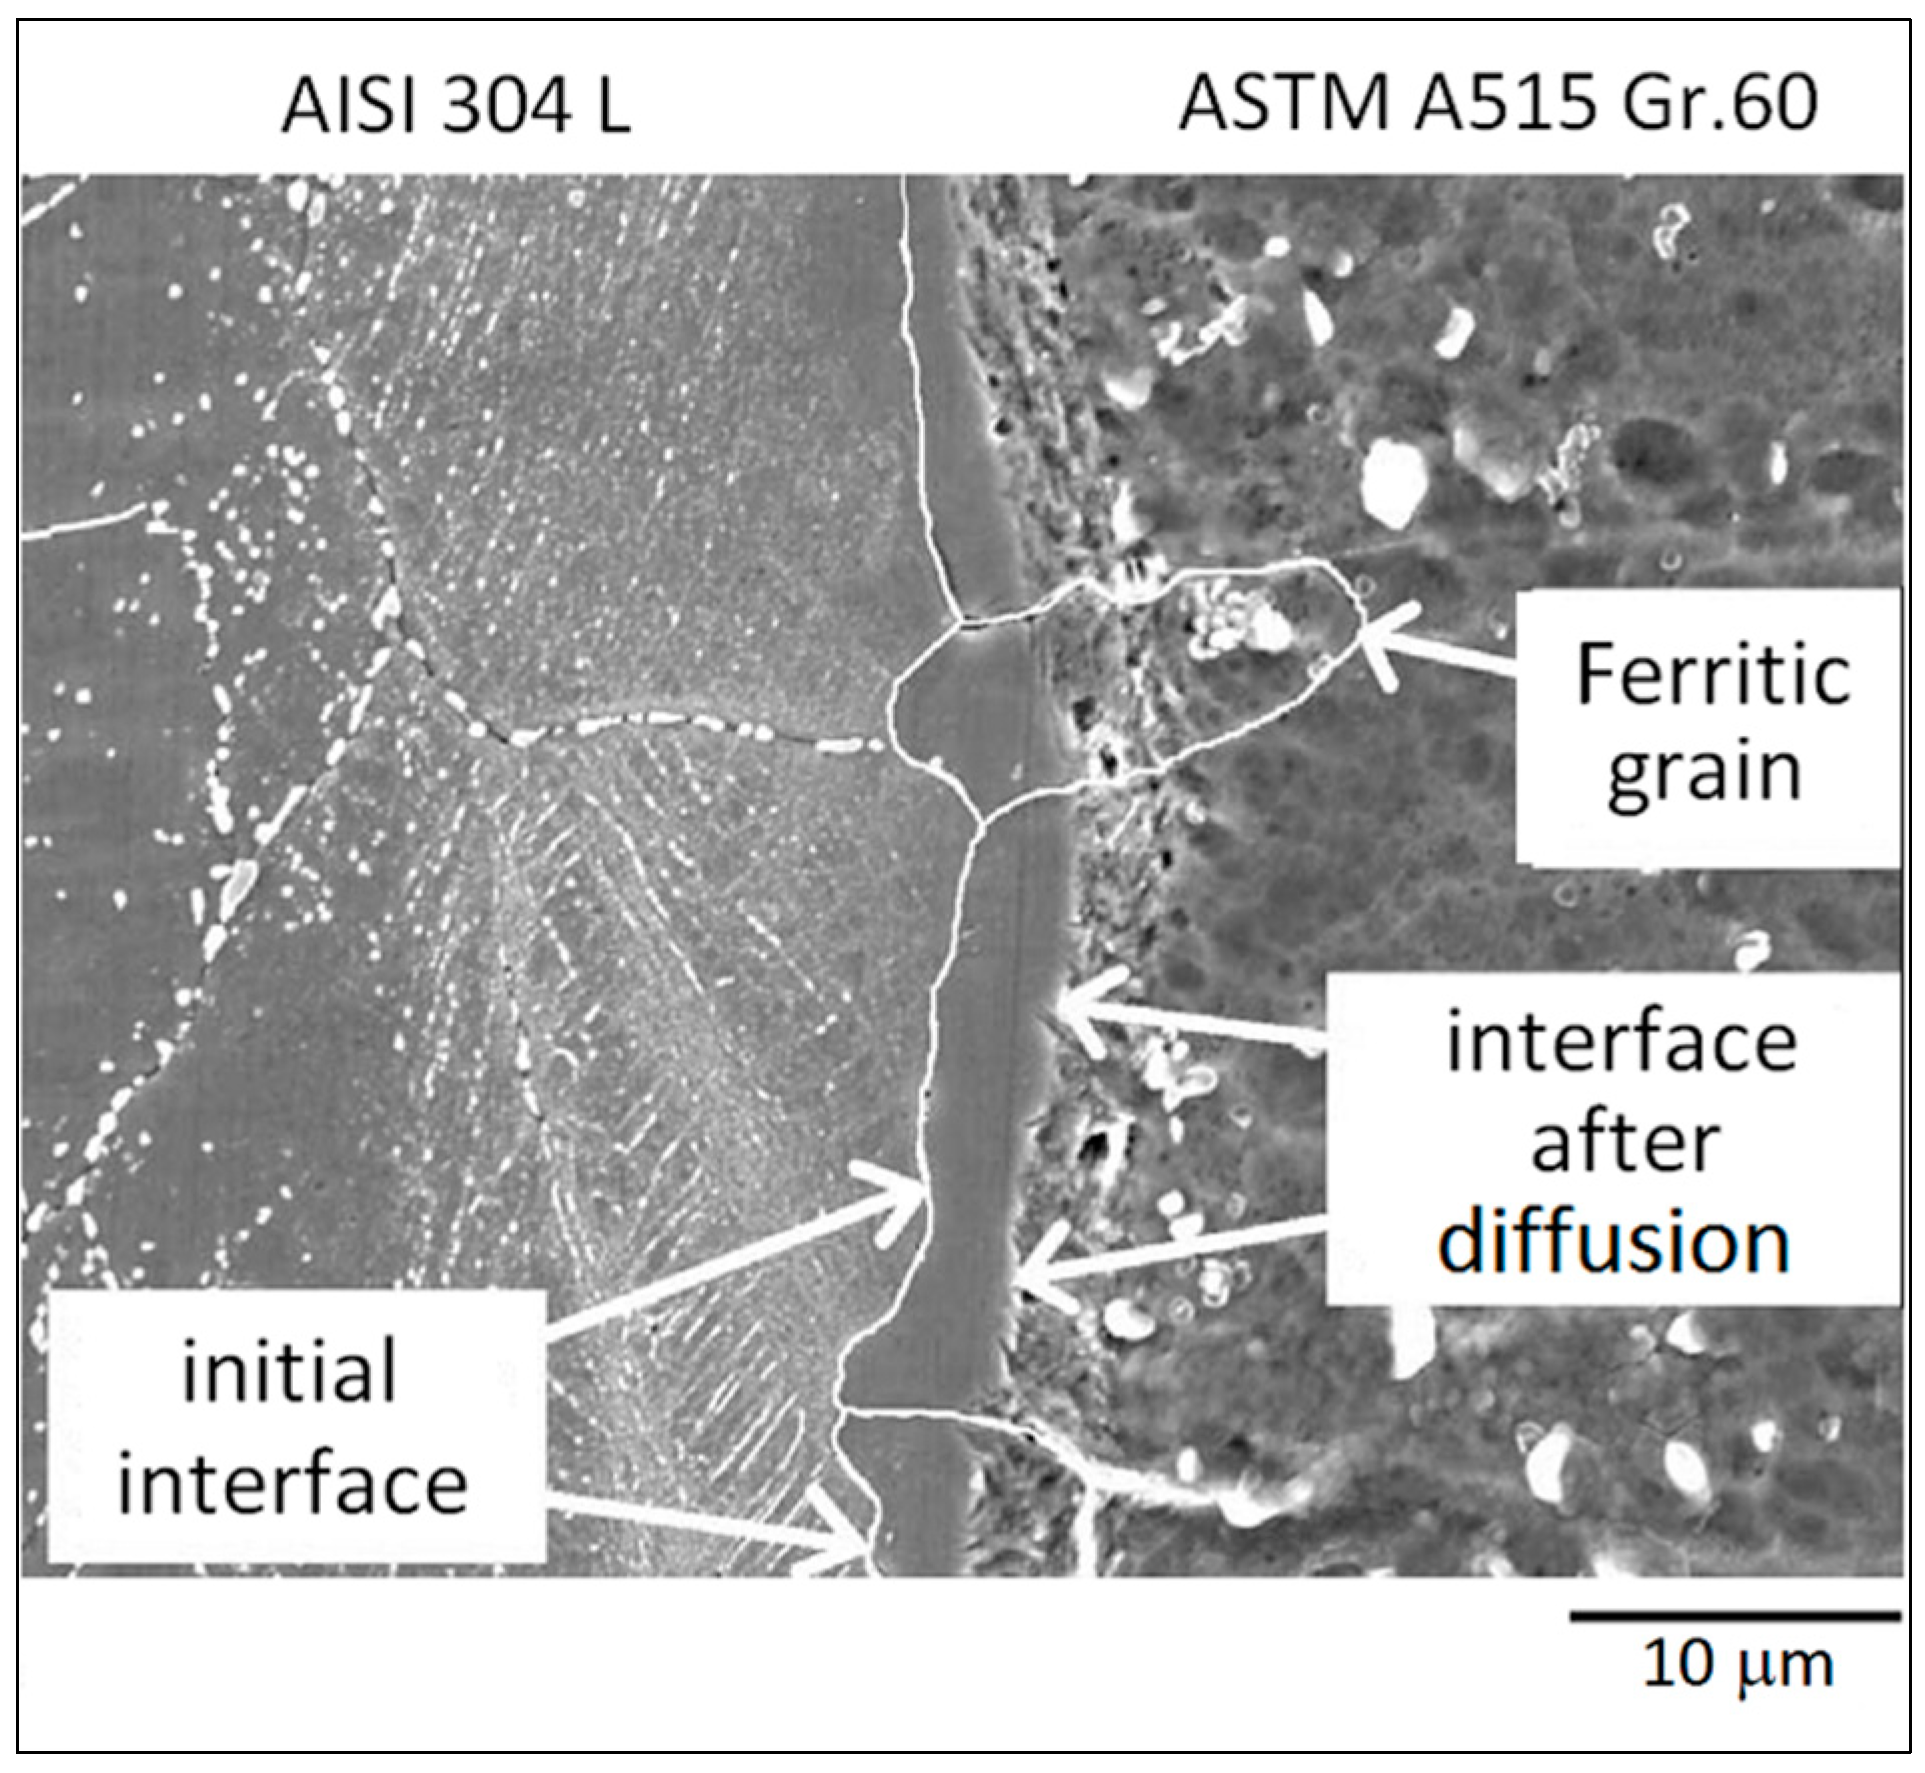
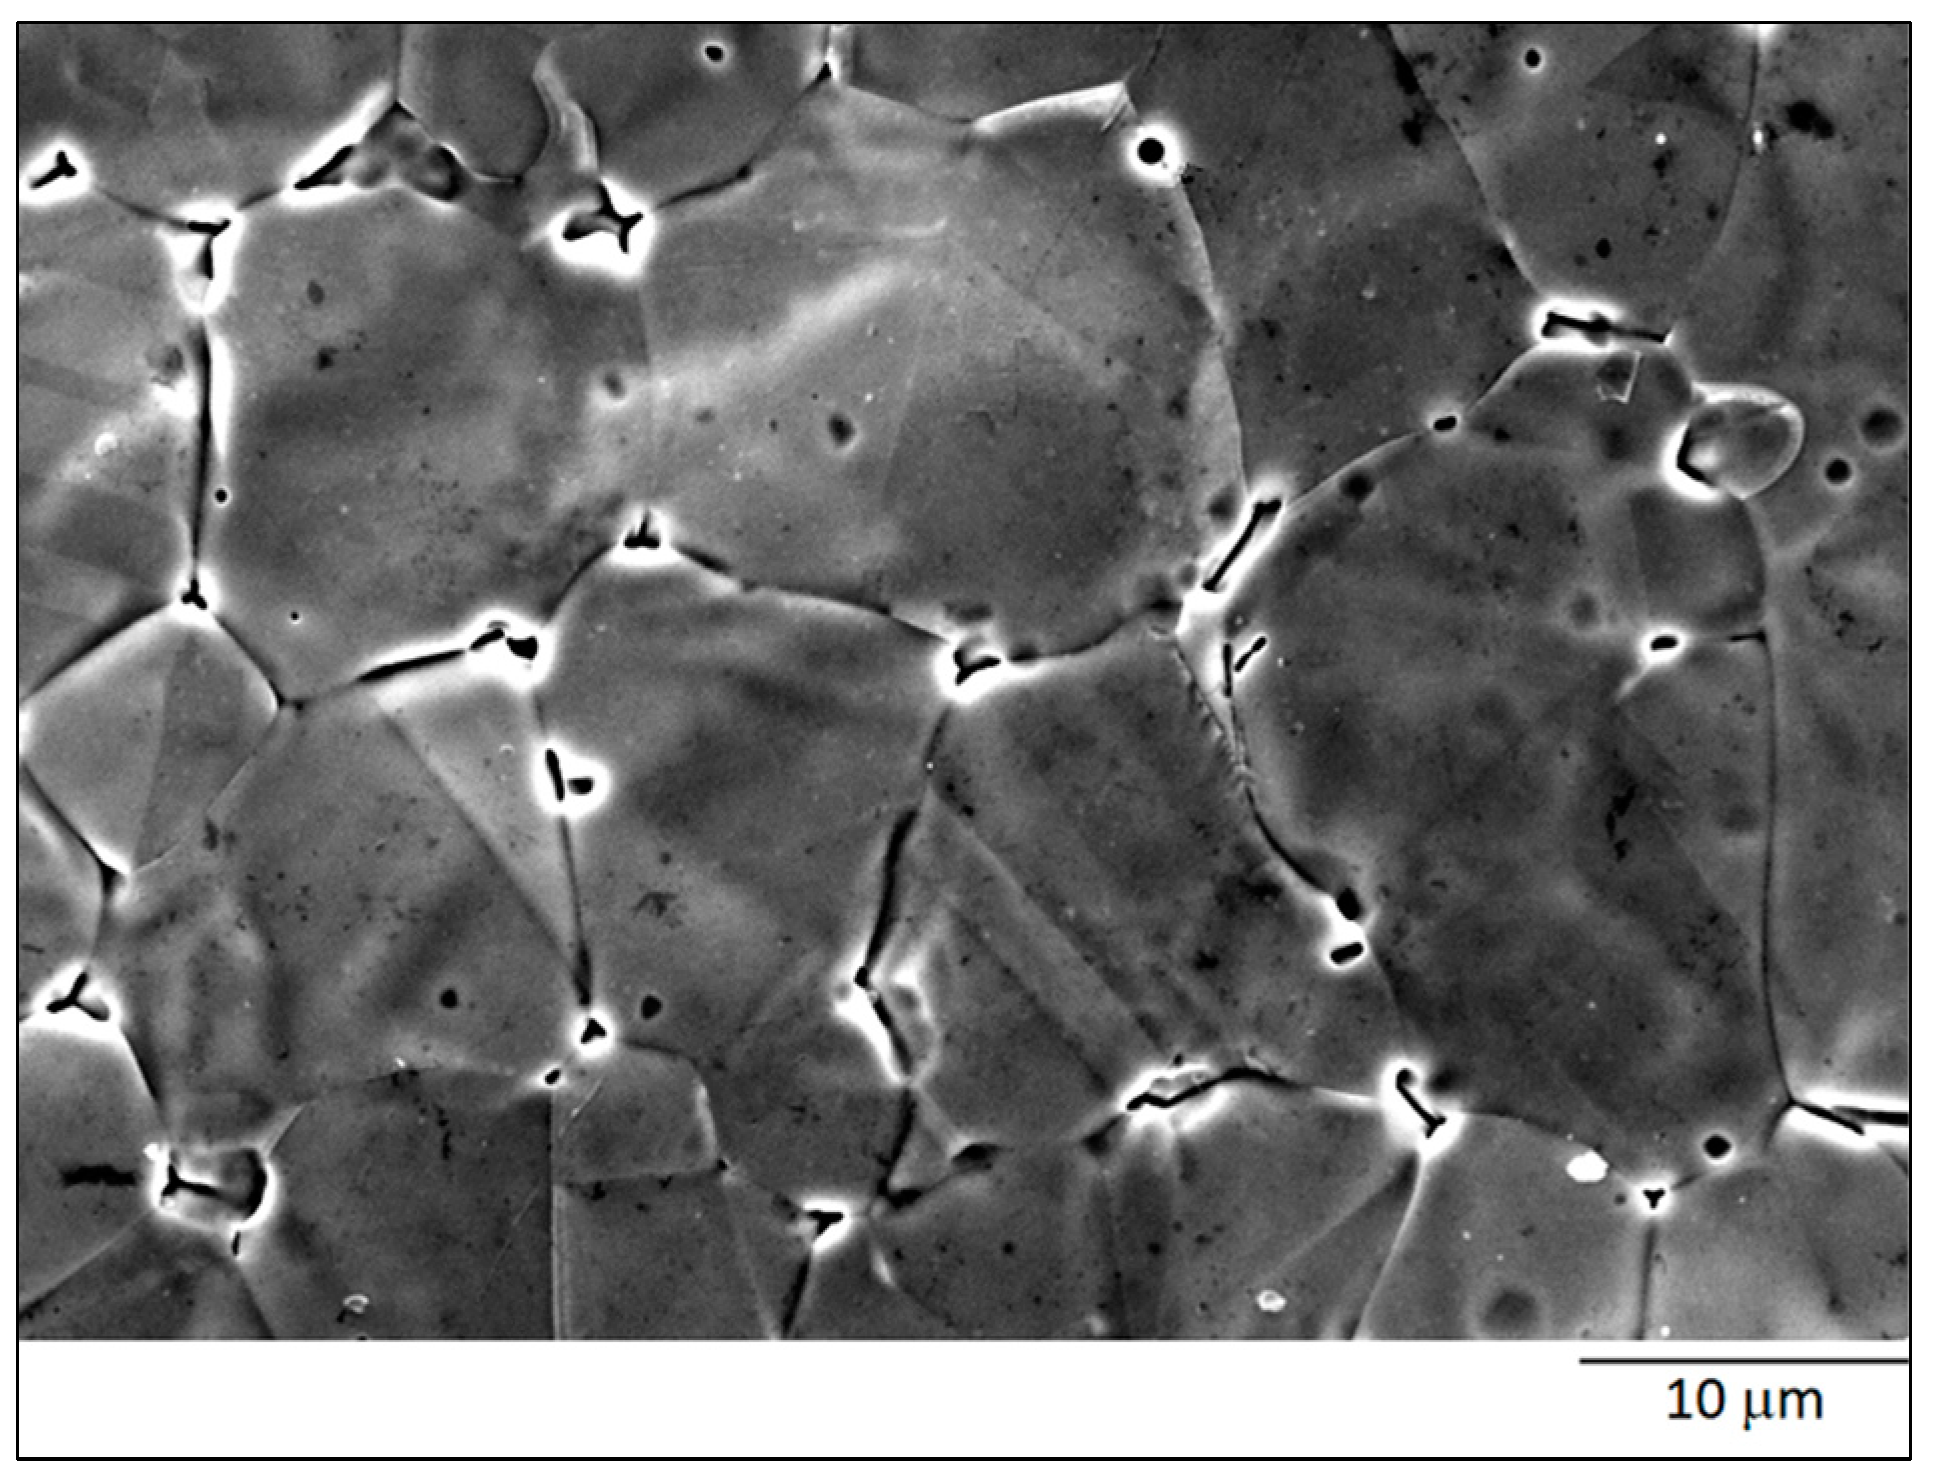
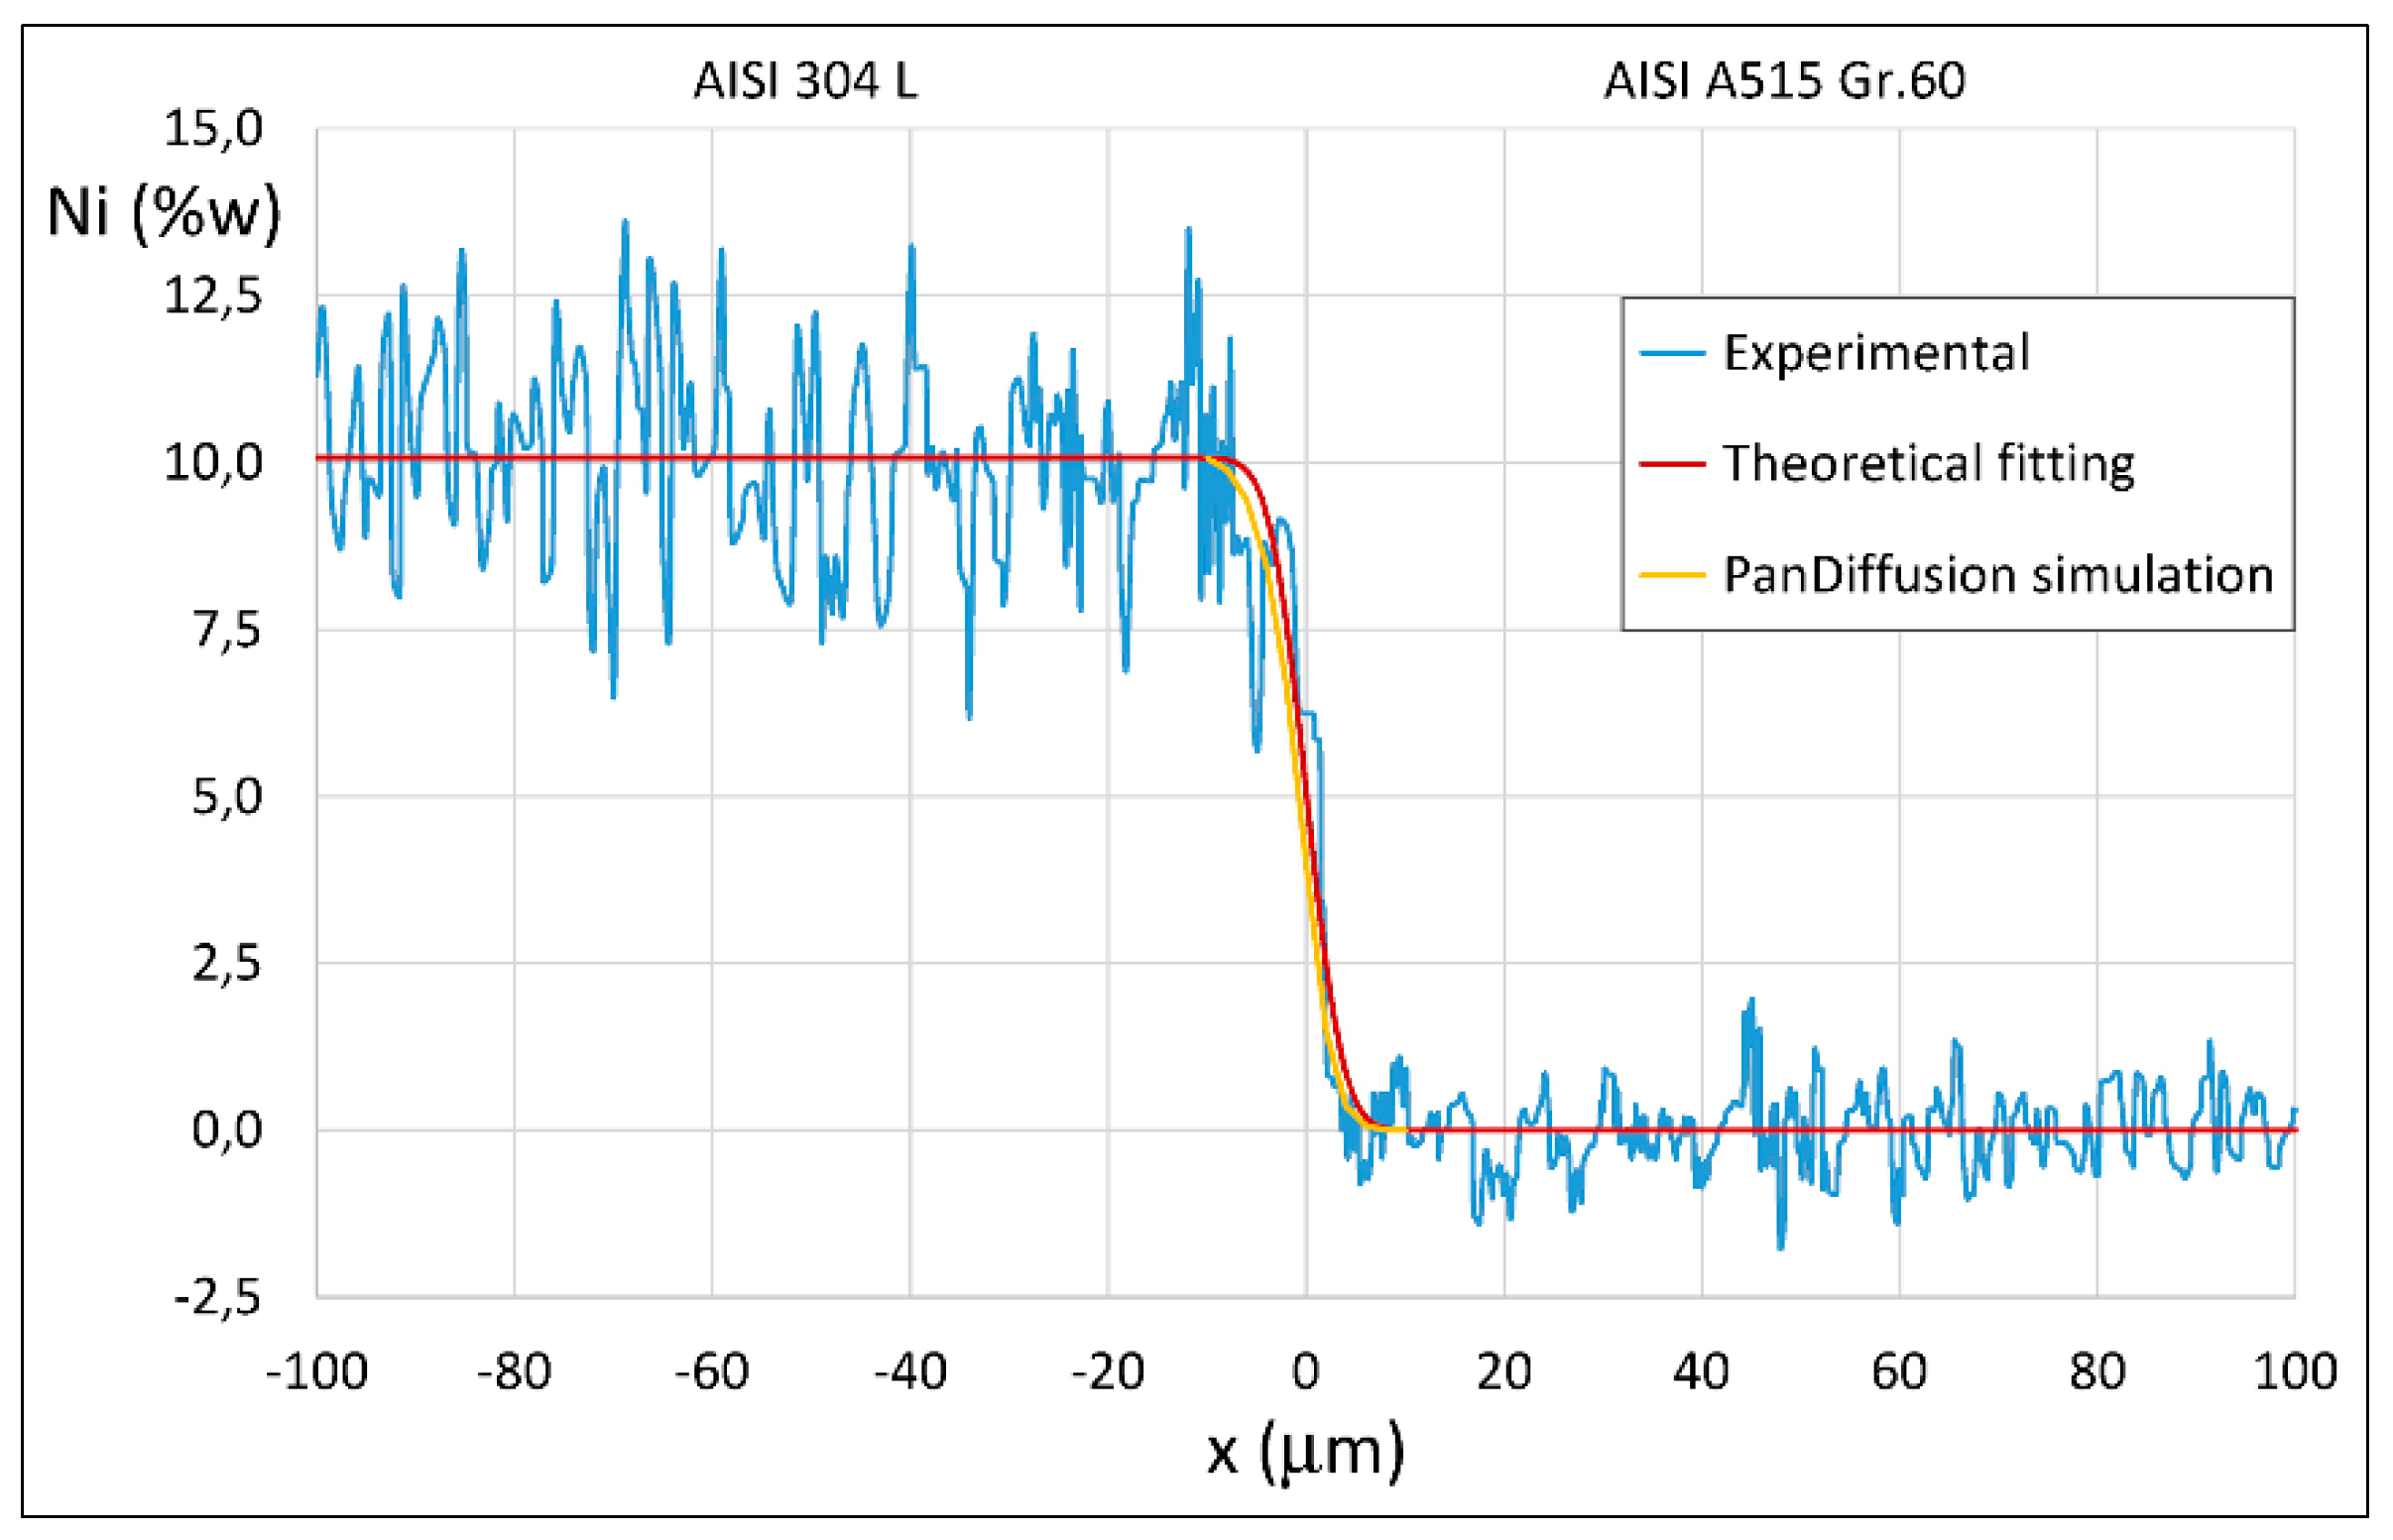
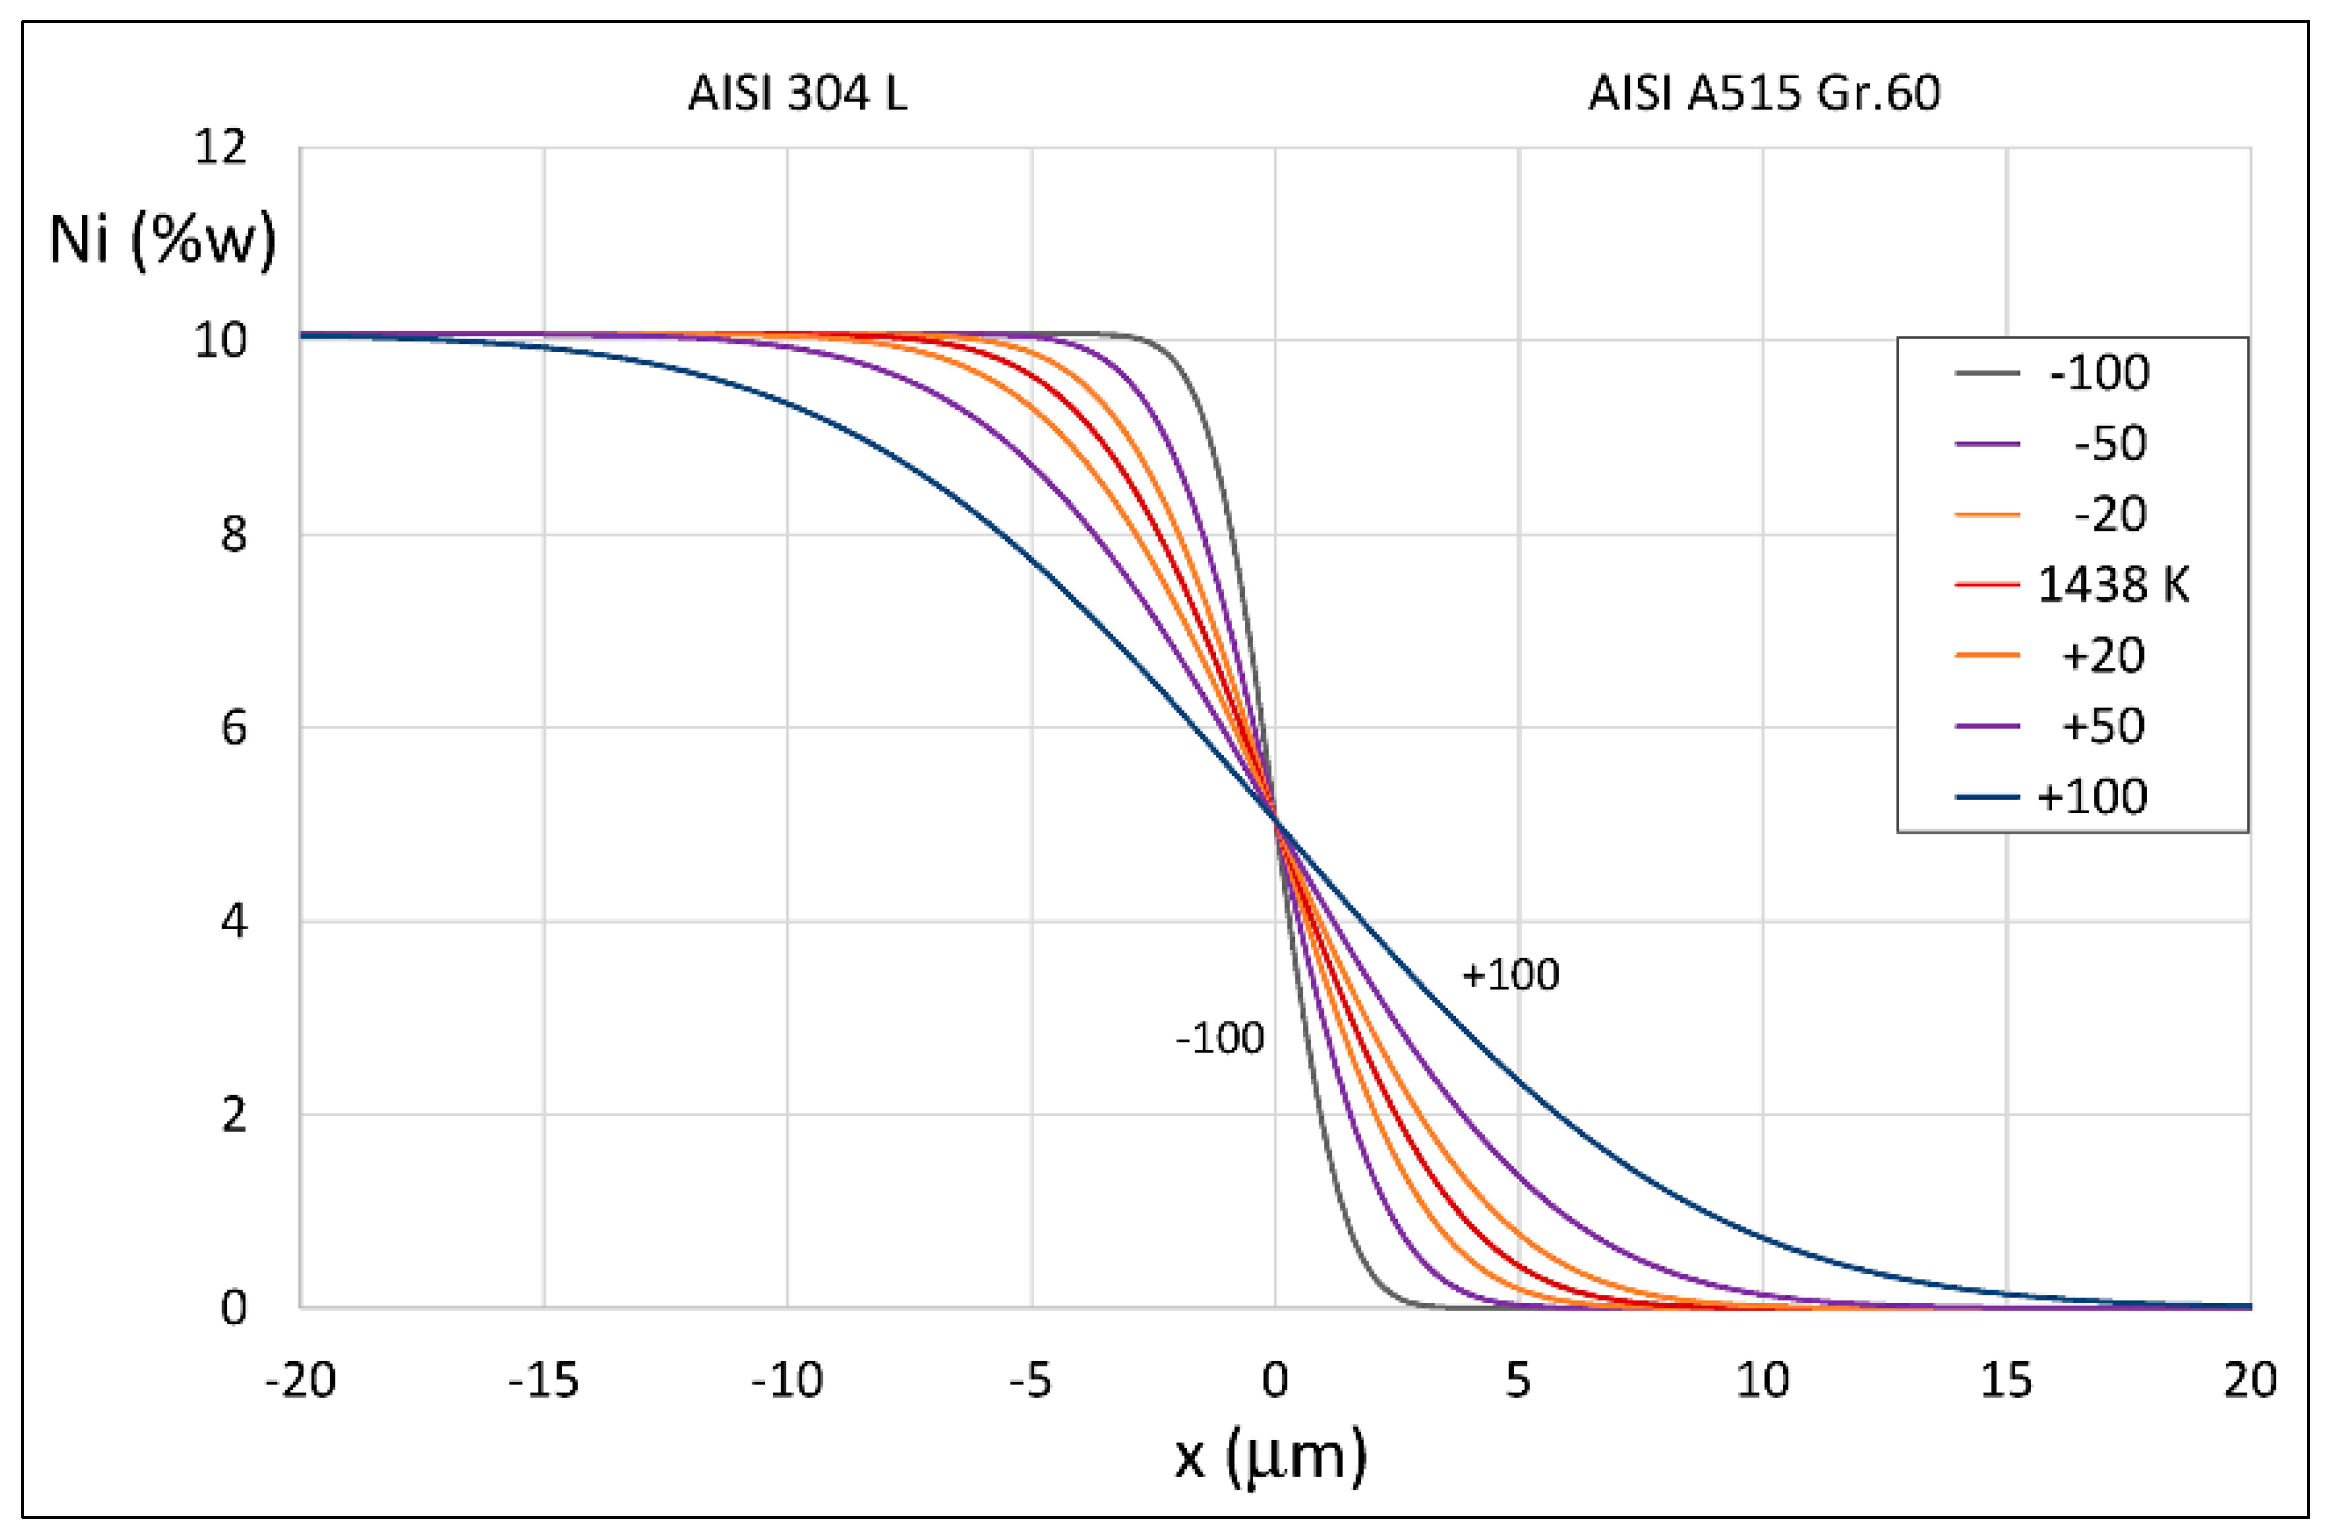
3.1. ASTM A515 Gr.60 Low Carbon Steel Clad with AISI 304L Austenitic Stainless Steel
3.2. ASTM A283 Extra Low Carbon Steel Clad Alloy 59
3.3. AISI 1010 Low Carbon Steel and Monel 400 Cu-Ni Alloy
4. Results of Theoretical Simulation and Discussion
5. Conclusions
Author Contributions
Funding
Conflicts of Interest
References
- Smith, L. Engineering with Clad Steel; Nickel Development Institute: Beijing, China, 2012. [Google Scholar]
- Ban, H.Y.; Bai, R.S.; Chung, K.F.; Zhu, J.C.; Bai, Y. Research progress on material properties of clad steel. In Proceedings of the 12th International Conference on Advances in Steel-Concrete Composite Structures ASCCS 2018, València, Spain, 27–29 June 2018. [Google Scholar]
- Song, H.; Shin, H.; Shin, Y. Heat-treatment of clad steel plate for application of hull structure. Ocean Eng. 2016, 122, 278–287. [Google Scholar] [CrossRef]
- Roll-Bonded Clad Plates; Voest Alpine Grobblech GmbH: Linz, Austria, 2016.
- Dhib, Z.; Guermazi, N.; Gaspérini, M.; Haddar, N. Cladding of low-carbon steel to austenitic stainless steel by hot-roll bonding: Microstructure and mechanical properties before and after welding. Mat. Sci. Eng. A-Struct. 2016, 656, 130–141. [Google Scholar] [CrossRef]
- Liu, B.X.; An, Q.; Yin, F.X.; Wang, S.; Chen, C.X. Interface formation and bonding mechanisms of hot rolled stainless steel clad plate. J. Mat. Sci. 2019, 54, 11357–11377. [Google Scholar] [CrossRef]
- Qian, M.; Lim, L.C.; Chen, Z.D.; Chen, W.L. Parametric studies of laser cladding processes. J. Mat. Process. Tech. 1997, 63, 590–593. [Google Scholar] [CrossRef]
- Anjos, M.A.; Vilar, R.; Qiu, Y.Y. Laser cladding of ASTM S31254 stainless-steel on a plain carbon steel substrate. Surf. Coat. Tech. 1997, 92, 142–149. [Google Scholar] [CrossRef]
- Costanza, G.; Crupi, V.; Guglielmino, E.; Sili, A.; Tata, M.E. Metallurgical characterization of an explosion welded aluminum/steel joint. Metall. Ital. 2016, 11, 17–22. [Google Scholar]
- Lee, K.S.; Kim, J.S.; Joa, Y.M.; Lee, S.E.; Heo, J.; Chang, Y.W.; Lee, Y.S. Interface-correlated deformation behavior of a stainless steel-Al–Mg 3-ply composite. Mater. Charact. 2013, 75, 138–149. [Google Scholar] [CrossRef]
- Mudhaffar, M.A.; Saleh, N.A.; Aassy, A. Influence of hot clad rolling process parameters on life cycle of reinforced bar of stainless steel carbon steel bars. Procedia Manufact. 2017, 8, 353–360. [Google Scholar] [CrossRef]
- Shen, W.; Feng, L.; Feng, H.; Cao, Y.; Liu, L.; Cao, M.; Ge, Y. Preparation and characterization of 304 stainless steel/Q235 carbon steel composite material. Results Phys. 2017, 7, 529–534. [Google Scholar] [CrossRef]
- Li, H.; Zhang, L.; Zhang, B.; Zhan, Q. Microstructure characterization and mechanical properties of stainless steel clad plate. Materials 2019, 12, 509. [Google Scholar] [CrossRef]
- Dhib, Z.; Guermazi, N.; Ktari, A.; Gasperini, M.; Haddar, N. Mechanical bonding properties and interfacial morphologies of austenitic stainless steel clad plates. Mat. Sci. Eng. A-Struct. 2017, 696, 374–386. [Google Scholar] [CrossRef]
- Wang, S.; Liu, B.X.; Chen, C.X.; Feng, J.H.; Yin, F.X. Microstructure, mechanical properties and interface bonding mechanism of hot-rolled stainless steel clad plates at different rolling reduction ratios. J. Alloys Compd. 2018, 766, 517–526. [Google Scholar] [CrossRef]
- Yu, T.; Jing, Y.A.; Yan, X.; Li, W.; Pang, Q.; Jing, G. Microstructures and properties of roll-bonded stainless/medium carbon steel clad plates. J. Mater. Process. Technol. 2019, 266, 264–273. [Google Scholar]
- Missori, S.; Murdolo, F.; Sili, A. Studio delle interfacce in acciai ferritici placcati a caldo con acciaio austenitico o lega a base di Ni. Metal. Ital. 2003, 3, 21–26. [Google Scholar]
- Missori, S.; Murdolo, F.; Sili, A. Single-pass laser beam welding of clad steel plate. Weld. J. 2004, 83, 65s–71s. [Google Scholar]
- Liu, B.X.; Yin, F.X.; Dai, X.L.; He, J.N.; Fang, W.; Chen, C.X.; Dong, Y.C. The tensile behaviors and fracture characteristics of stainless steel clad plates with different interfacial status. Mat. Sci. Eng. A-Struct. 2017, 679, 172–182. [Google Scholar] [CrossRef]
- Zhang, X.J.; Li, L.; Liu, H.Y.; Yin, F.X. Application of insert layer in manufacturing clad metal plates. Steel Roll. 2013, 30, 45–49. [Google Scholar]
- Feng, Y.; Yu, H.; Luo, Z.; Xie, G.; Misra, R.D.K. The impact of surface treatment and degree of vacuum on the interface and mechanical properties of stainless steel clad plate. Materials 2018, 11, 1489. [Google Scholar] [CrossRef]
- Wu, Z.J.; Peng, W.F.; Shu, X.D. Influence of rolling temperature on interface properties of the cross wedge rolling of 42CrMo/Q235 laminated shaft. Int. J. Adv Manuf. Technol. 2017, 9, 517–526. [Google Scholar] [CrossRef]
- Jin, H.; Zhang, L.; Yi, Y. Effect of rolling reduction rate on the microstructure of hot rolling stainless steel clad plate. IOP Conf. Ser. Mater. Sci. 2018, 394, 1–5. [Google Scholar] [CrossRef]
- Shewmon, P. Diffusion in Solids; The Minerals, Metals & Materials Society: Pittsburgh, PA, USA, 1989. [Google Scholar]
- Wang, B.; Zhang, F.; Chen, S.L.; Kou, S. Computational simulation of diffusion process in multicomponent and multiphase systems in diffusion bonding. Sci. Technol. Weld. Joi. 2013, 18, 451–457. [Google Scholar] [CrossRef]
- Chen, C.X.; Liu, M.Y.; Liu, B.X.; Yin, F.X.; Dong, Y.C.; Zhang, X.; Zhang, F.Y.; Zhang, Y.G. Tensile shear sample design and interfacial shear strength of stainless steel clad plate. Fusion. Eng. Des. 2017, 125, 431–441. [Google Scholar] [CrossRef]
- Kotecki, D.J. A martensite boundary on the WRC-1992 diagram: The effect of manganese. Welding J. 2000, 79, 346–354. [Google Scholar]
- Missori, S.; Sili, A. Prediction of weld metal microstructure in laser beam weld metal clad steel. Metallurgist 2018, 62, 84–92. [Google Scholar] [CrossRef]
- Gomez, X.; Echeberria, J. Microstructure and mechanical properties of low alloy steel T11-austenitic steel 347H bimetallic tubes. Mater. Sci. Technol. 2000, 16, 187–193. [Google Scholar] [CrossRef]
- Badia, M.; Vignes, A. Diffusion du fer, du nickel et du cobalt dans les metaux de transition du groupe du fer. Acta Metall. 1969, 17, 177–187. [Google Scholar] [CrossRef]
- Agren, J. A revised expression for the diffusivity of carbon in binary Fe-C austenite. Scripta Metall. 1986, 20, 1507–1510. [Google Scholar] [CrossRef]
- Weman, K. Welding Processes Handbook; Woodhead Publishing Ltd.: Cambridge, UK, 2003. [Google Scholar]
- Okamoto, H.; Schlesinger, M.E.; Mueller, E.M. ASM Handbook Vol. 3: Alloy Phase Diagrams; ASM International: Materials Park, OH, USA, 2016. [Google Scholar]
- Hirano, K.; Cohen, M.; Averbach, B.L. Diffusion of nickel into iron. Acta Metall. 1961, 9, 440–445. [Google Scholar] [CrossRef]
- Mehrer, H. Diffusion in Solid Metals and Alloys; Springer: Berlin, Germany, 1990. [Google Scholar]


| Materials | Thick (mm) | C | Mn | Si | P | S | Al | Cr | Ni | Mo | Fe |
|---|---|---|---|---|---|---|---|---|---|---|---|
| Base material: ASTM A515 Gr.60 | 6.5 | 0.14 | 0.85 | 0.20 | 0.008 | 0.001 | 0.04 | - | - | - | Bal. |
| Cladding: AISI 304 L | 2.5 | 0.017 | 1.32 | 0.39 | 0.029 | 0.003 | - | 18.39 | 10.07 | - | Bal. |
| Materials | Thick (mm) | C | Mn | Si | P | S | Al | Cr | Ni | Mo | Fe |
|---|---|---|---|---|---|---|---|---|---|---|---|
| Base material: ASTM A283 | 10 | 0.040 | 0.52 | 0.24 | 0.009 | 0.0016 | 0.057 | 0.028 | 0.006 | 0.006 | Bal. |
| Cladding: Alloy 59 | 2.5 | 0.005 | 0.15 | 0.040 | 0.004 | 0.002 | - | 22.85 | 59.47 | 15.55 | <1.5 |
| Materials | Thick (mm) | C | Mn | Si | P | S | Al | Cr | Ni | Cu | Fe |
|---|---|---|---|---|---|---|---|---|---|---|---|
| Base material: AISI 1010 | 13 | 0.109 | 1.19 | 0.27 | 0.011 | 0.001 | 0.038 | 0.014 | 0.23 | 0.14 | Bal. |
| Cladding: Monel 400 | 2 | 0.1 | 1.0 | 0.2 | - | 0.002 | - | - | 64.9 | 32.0 | 1.7 |
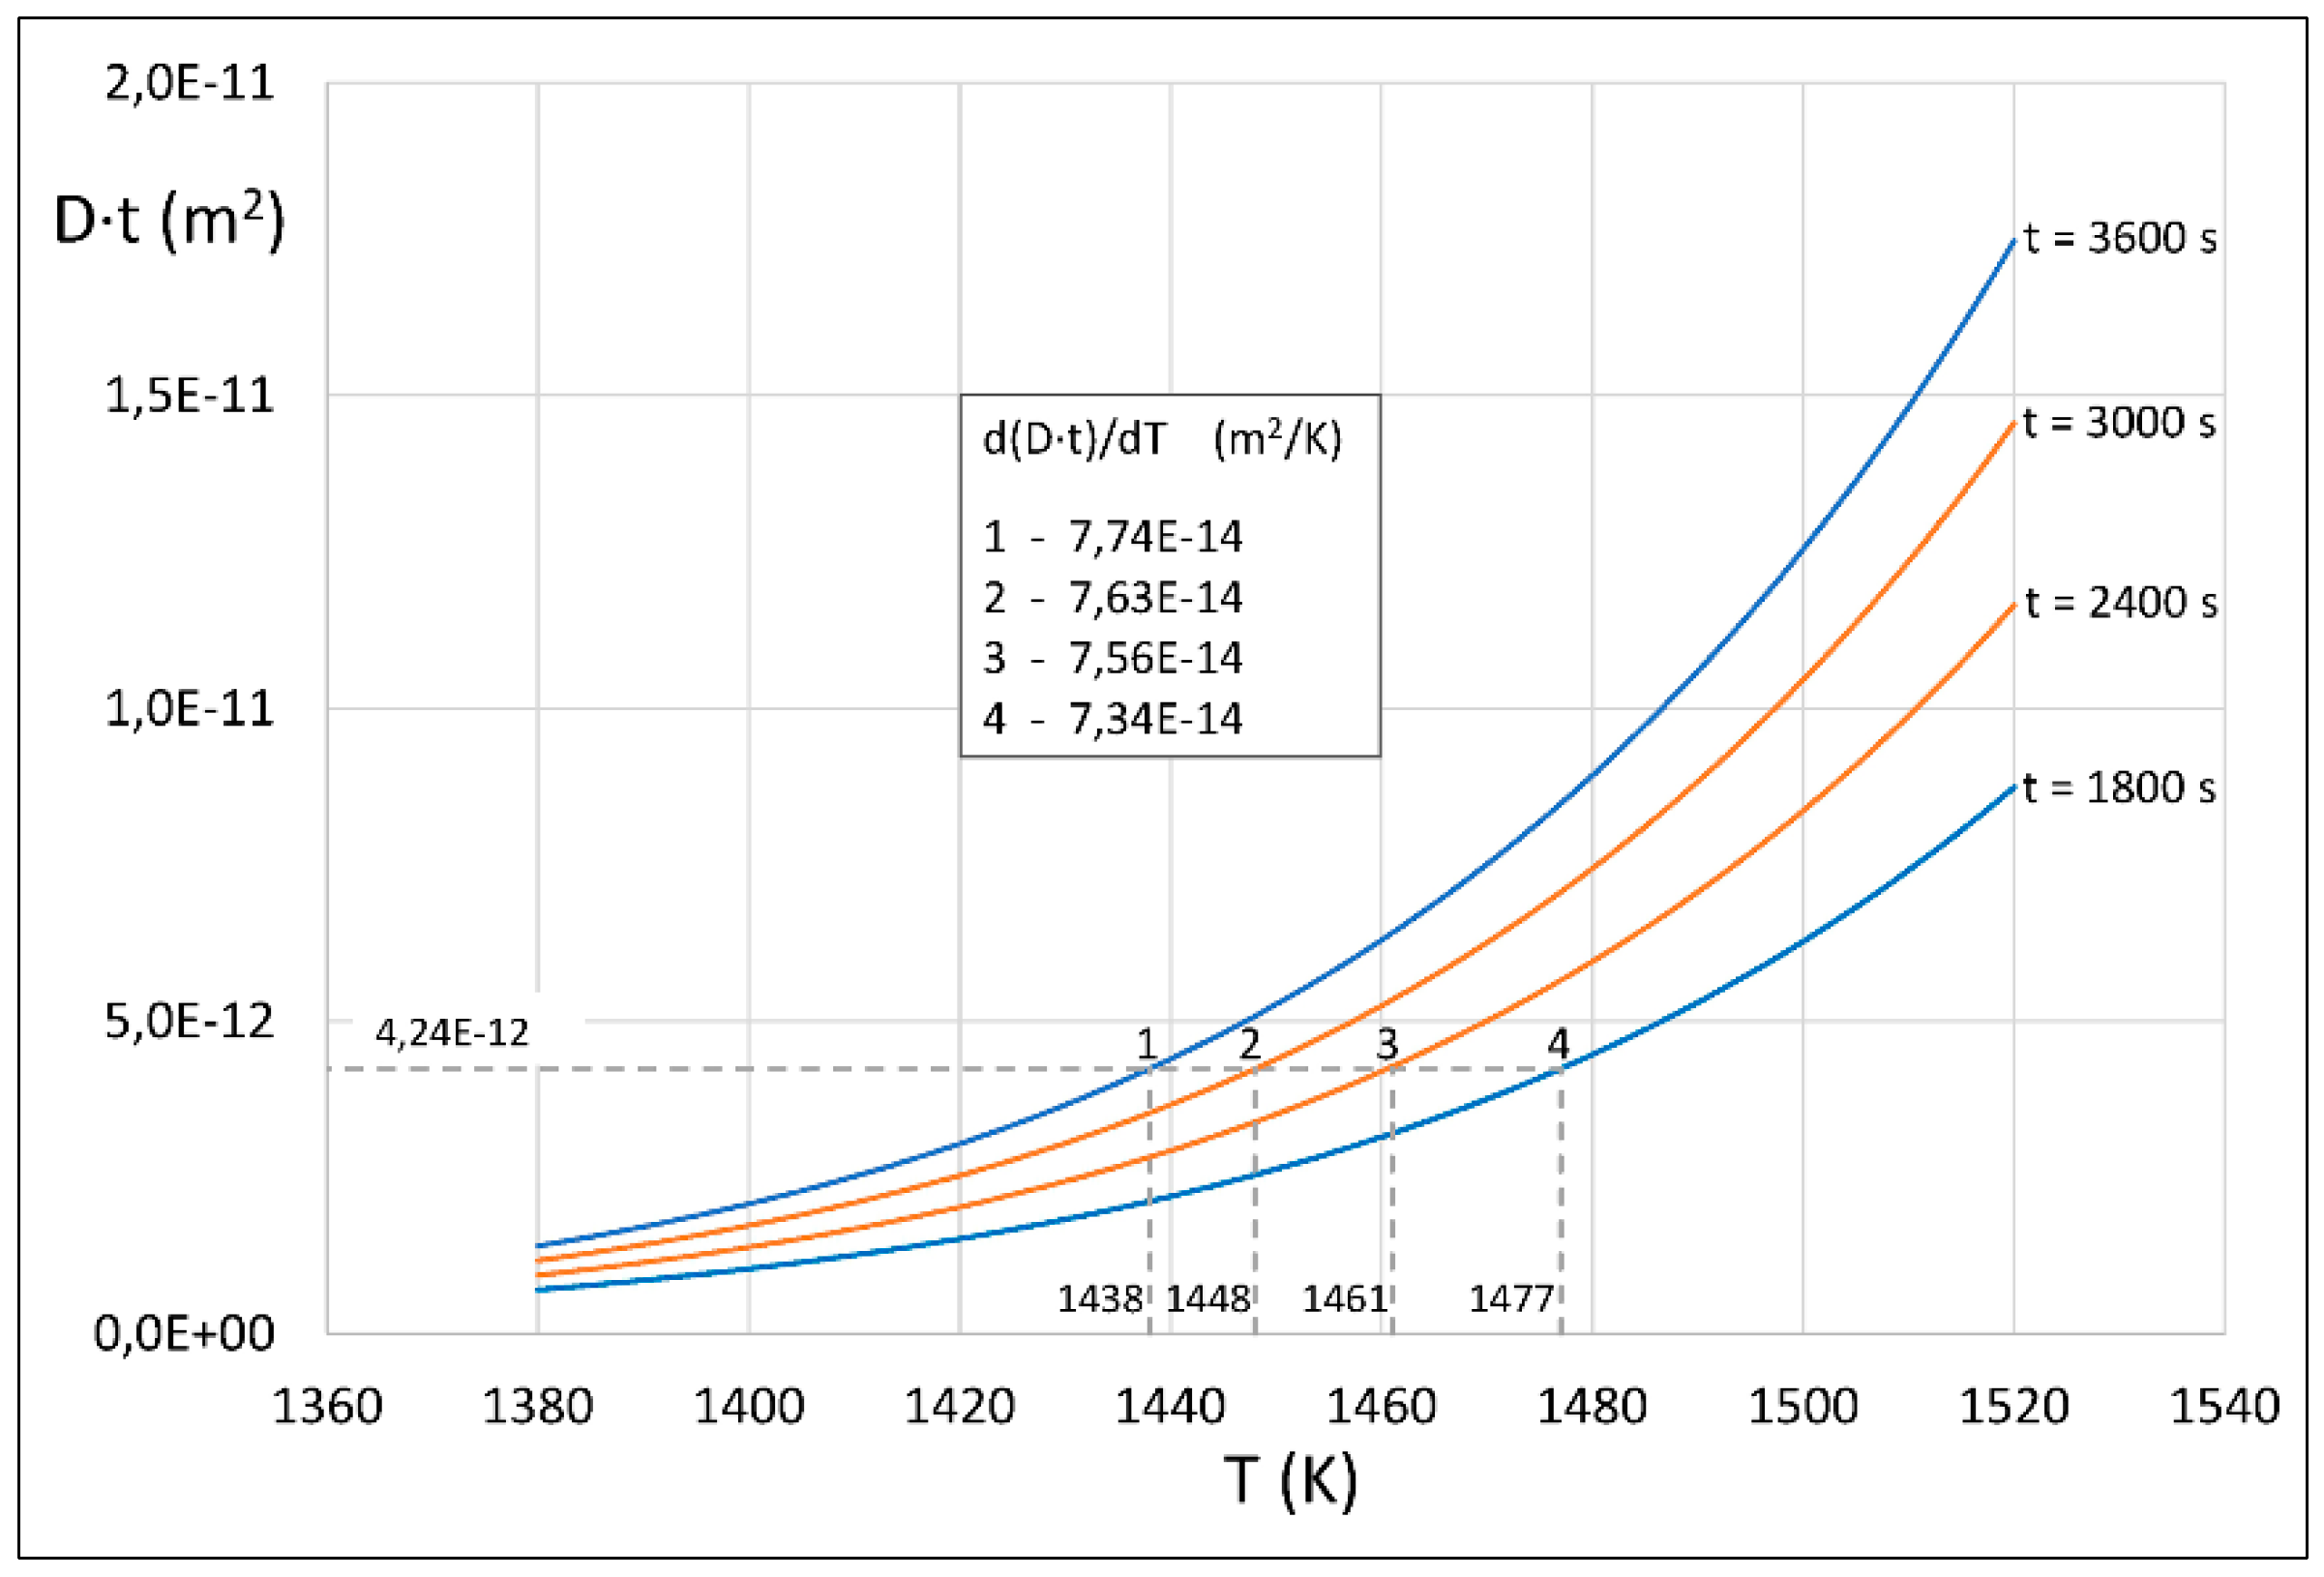
| D∙t (m2) (Exp/Fitted) | t (s) (Set Values) | D (m2/s) (Calculated) | T (K) (Calculated) |
|---|---|---|---|
| 4.24 × 10⁻¹² | 3600 | 1.18 × 10⁻¹⁵ | 1438 |
| 4.24 × 10⁻¹² | 3000 | 1.41 × 10⁻¹⁵ | 1448 |
| 4.24 × 10⁻¹² | 2400 | 1.77 × 10⁻¹⁵ | 1461 |
| 4.24 × 10⁻¹² | 1800 | 2.36 × 10⁻¹⁵ | 1477 |
| D∙t (m2) (Exp/Fitted) | t(s) (Set Values) | D (m2/s) (Calculated) | T (K) (Calculated) |
|---|---|---|---|
| 3.88 × 10⁻¹² | 3600 | 1.08 × 10⁻¹⁵ | 1434 |
| 3.88 × 10⁻¹² | 3000 | 1.29 × 10⁻¹⁵ | 1443 |
| 3.88 × 10⁻¹² | 2400 | 1.62 × 10⁻¹⁵ | 1455 |
| 3.88 × 10⁻¹² | 1800 | 2.16 × 10⁻¹⁵ | 1472 |
| D∙t(m2) (Exp/Fitted) | t(s) (Set Values) | D(m2/s) (Calculated) | T(K) (Calculated) |
|---|---|---|---|
| 9.08 × 10⁻¹² | 3600 | 2.52 × 10⁻¹⁵ | 1144 |
| 9.08 × 10⁻¹² | 3000 | 3.03 × 10⁻¹⁵ | 1152 |
| 9.08 × 10⁻¹² | 2400 | 3.78 × 10⁻¹⁵ | 1163 |
| 9.08 × 10⁻¹² | 1800 | 5.04 × 10⁻¹⁵ | 1177 |
© 2020 by the authors. Licensee MDPI, Basel, Switzerland. This article is an open access article distributed under the terms and conditions of the Creative Commons Attribution (CC BY) license (http://creativecommons.org/licenses/by/4.0/).
Share and Cite
Giudice, F.; Missori, S.; Murdolo, F.; Sili, A. Metallurgical Characterization of the Interfaces in Steel Plates Clad with Austenitic Steel or High Ni Alloys by Hot Rolling. Metals 2020, 10, 286. https://doi.org/10.3390/met10020286
Giudice F, Missori S, Murdolo F, Sili A. Metallurgical Characterization of the Interfaces in Steel Plates Clad with Austenitic Steel or High Ni Alloys by Hot Rolling. Metals. 2020; 10(2):286. https://doi.org/10.3390/met10020286
Chicago/Turabian StyleGiudice, Fabio, Severino Missori, Francesco Murdolo, and Andrea Sili. 2020. "Metallurgical Characterization of the Interfaces in Steel Plates Clad with Austenitic Steel or High Ni Alloys by Hot Rolling" Metals 10, no. 2: 286. https://doi.org/10.3390/met10020286
APA StyleGiudice, F., Missori, S., Murdolo, F., & Sili, A. (2020). Metallurgical Characterization of the Interfaces in Steel Plates Clad with Austenitic Steel or High Ni Alloys by Hot Rolling. Metals, 10(2), 286. https://doi.org/10.3390/met10020286