Minimising Defect Formation in Sand Casting of Sheet Lead: A DoE Approach


Manufacturing Theme, Cranfield University, Cranfield MK43 0AL, UK
*
Author to whom correspondence should be addressed.
Metals 2020, 10(2), 252; https://doi.org/10.3390/met10020252
Submission received: 28 January 2020
/
Revised: 6 February 2020
/
Accepted: 12 February 2020
/
Published: 13 February 2020
(This article belongs to the Special Issue Casting and Solidification Processing)
Abstract
:Sand casting of lead sheet is a traditional manufacturing process used up to the present due to the special features of sand cast sheet such as their attractive sheen. Similarly to any casting process, sand casting of lead sheet suffers from the presence of surface defects. In this study, a surface defect type, hereby referred to as ‘grooves’, has been investigated. The focus has been laid on the identification of the main factors affecting defect formation in this process. Based on a set of screening experiments performed using Scanning Electron Microscopy (SEM) as well as the existing literature, a number of factors affecting the formation of such defects was identified and their corresponding significance was estimated using the Analysis of Variance (ANOVA) technique. The obtained results suggest that the most significant factor affecting defect formation in sand casting of lead sheet is the composition of the moulding mixture. Defect formation was also proven to be dependent on the sand grain fineness, the quality of the melt and some of the interactions between the aforementioned process parameters. Finally, an optimal set of process parameters leading to the minimisation of surface defects was identified.
1. Introduction
Lead is one of the first metals used in manufacturing, its use dating back to around 3000 BC [1,2]. The Romans used sand cast lead sheet for the manufacture of water pipes and coffins amongst other artefacts [3]. Nowadays, lead is used for a wide variety of applications including battery grids, ammunition and radiation protection. One of the most common lead products is sheet lead, being widely used in the construction industry mainly for roofing and flashing applications. The high malleability and ductility of lead combined with its high resistance to corrosion makes it an appropriate material for roofing applications and architectural cladding [4]. Lead sheet are also used in the manufacture of lead lined boards for radiation protection in the healthcare industry due to their high density (11,340 kg/m3) and attenuation coefficient (5.549 cm2/g at 100 KeV) especially for high energy X-rays [5,6].
There are three main methods for manufacturing lead sheet, namely: (a) rolling (also referred to as milling), (b) continuous casting and (c) sand casting [4,7,8]. Amongst the aforementioned methods, rolling and continuous casting are often preferred due to their low cost and thickness consistency. Despite being the oldest and most traditional method, sand casting is still being used nowadays for the production of sheets for roofing, flashing and plumbing applications in the heritage industry as well as the renovation of old churches, cathedrals, castles and state homes. Sand cast sheets have a more attractive sheen compared to the ones manufactured via rolling or continuous casting methods; the top side (exposed to the atmosphere during casting) has a shiny mottled appearance while the bottom side (surface in contact with the sand bed) retains the texture of the sand [8].
One of the most common problems encountered in metal casting is the emergence of defects during filling/pouring or solidification. As reported by Campbell [9] the majority of casting defects arise due to poorly designed running and filling systems or improper selection of casting process parameters. Entrainment defects mainly arise due to the presence of turbulence during filling; oxide films submerge into the melt by folding and form oxide bifilms, which often entrap bubbles, sand particles and other inclusions. The presence of turbulence leads to a wide spectrum of casting defects in the final cast product including bubble trails, gas microporosity, hot tears and cold cracks [10]. Besides surface turbulence, there are additional factors leading to defective castings such as hydrogen gas bubbles generated upon solidification due to the lower solubility of hydrogen in the solid phase [11]. Moreover, the presence of sand-casting defects is also dependent on the moulding and sand mixture [12]. This is because green sand mixture usually consists of several components such as sand, clay, water while the proportion of the aforementioned constituents affects the bonding strength of the sand mould. Defects on the product surface may arise when one of these constituents are out of balance due to sand expansion.
Although the physical phenomena leading to defects in castings have been identified as mentioned above, the elimination of defects in the final cast product remains a challenging task. This is because of the fact that there are various process parameters associated with surface turbulence or melt quality. Several approaches on defect analysis have been established in the past: historical data analysis, cause effect diagrams, if-then rules, Design of Experiments (DoE) and trial and error [13]. The DoE method is an effective tool for reducing foundry defects by optimising various process parameters and can be used to establish a relationship between various input variables (factors) and an output variable (response). Dabade et al. [14] proposed a method combining DoE and numerical simulations to obtain the optimal process parameters for a cast iron component in order to reduce defects. Guharaja et al. [15] optimised the process parameters of a green sand-casting process (green strength, mould hardness, moisture content and permeability) using the Taguchi’s optimisation method to minimise defects in spheroidal graphite cast iron rigid coupling castings. In a similar study, Kumar et al. [16] analysed different process parameters of pressure die casting of aluminium alloys to reduce defects to a minimum using Taguchi’s method. Five different parameters (solidification time, molten metal temperature, injection pressure, filling time and velocity) were selected while three different levels were chosen for each of these parameters. Experiments were subsequently conducted using different combinations of the process parameters as per the Taguchi’s orthogonal array and the parameters were optimised for minimal casting defects. Besides DoE, Artificial Neural Networks (ANNs) have also been used for detecting the root cause of defects in castings. Perzyk et al. [17] trained an ANN using the simulated annealing algorithm in order to efficiently detect the root cause of gas porosity defects in steel castings.
Although previous studies have been focused on various topics related to the manufacturing [18], mechanical properties [7,19] of lead sheet as well as the numerical modelling of the corresponding sand casting process [20], there is still limited documented knowledge on the relationship between the process parameters and defect formation. This investigation is focused on a specific surface defect type occurring at the sand side of the sand cast sheet. The defect type under investigation has a groove like appearance and appears along the cast sheet (in the direction of flow of the metal) and will be addressed as ‘grooves’ throughout this manuscript. The objective of the current investigation is to identify the main process parameters affecting the formation of grooves and propose remedies leading to the reduction or elimination of the aforementioned defect type.
2. Materials and Methods
The process of manufacturing sandcast lead sheet essentially involves pouring molten lead on a previously prepared sandbed and subsequently flattening the surface by smearing the flowing metal using a strickle guided by a screed rail as illustrated in Figure 1. The thickness of the final cast sheet is determined by adjusting the lead pouring temperature and by using shims in between the screed rail and strickle. The effect of various process parameters such as the pouring temperature, screed velocity and clearance between the sandbed and the screed on the lead sheet thickness has been investigated in [20] via means of numerical simulation.
2.1. Materials
For the purpose of this experiment, silica sand of two different American Foundry Society (AFS) Grain Fineness Numbers (AFS 50 and 70 sourced from Tarmac, Solihull, UK) and bentonite clay were used. The sand moulds were prepared by mixing silica sand (95 to 98 wt%) with water (2 wt%) and bentonite clay (0 to 3 wt%) depending on the case under examination. Moreover, two types of melt were used: (a) pure lead and (b) a 50:50 mix of scrap with pure lead. Scrap lead primarily consisted of old roofing sheets, flashings and lead pipes. A SPECTROMAXx stationary metal analyser (SPECTRO Analytical Instruments, Kleve, Germany) [21] was used to determine the elemental composition of the scrap lead as shown in Table 1. Pure lead (99.9%) was obtained by melting scrap lead and then refining it using sodium nitrate and caustic soda. Lead was melted in 120-ton steel kettles and mixed in a smaller 5-ton kettle prior to casting.
2.2. Process
The process workflow is also presented in Figure 2. The lead sheet casting process starts with the preparation of a rectangular sand bed, usually 3–7 m long and 0.75–1.3 m wide. The surface of the sand bed is flattened using a strickle. Moreover, the sand surface is levelled and smoothened using steel floaters to minimise any surface undulations. The skill of the operator is vital in these operations. Once the bed is prepared, molten lead is poured at around 345 °C (the pouring temperature depends on the thickness of the sheet to be cast) using a hopper from the one end of the casting bench. Pouring is followed by smearing of the melt using a strickle and seconds later the melt solidifies.
2.3. Defect Analysis
This investigation is focused on a surface defect type, hereby addressed as ‘grooves’, appearing on the sand side of sand cast lead sheets as shown in Figure 3. As it can be observed, the nature of this defect type is different from surface roughness, which can be effectively controlled by AFS grain fineness number of the sand. These defects are formed along the direction of the flow and may range between 20 mm and 300 mm in length while their root cause has not been identified in the literature yet. Since lead sheets are used for roofing applications, which involve bending and manipulation of the sheet, cracks are often initiated at these locations. Moreover, grooves give the perception of poor quality and lead to rejection by customers.
There are several factors which could potentially influence the quality of cast lead sheets and promote the formation of grooves. Hence, based on process observation, literature review [12,22,23] and the experience of foundry engineers, all the possible factors affecting the quality of sheets were categorised based on a 5 M model (Man, Material (Melt), Machine (Mould), Method, Measurement) and environment [24] (see Table 2).
Initially a qualitative approach (visual examination) was followed; a set of screening experiments was conducted to check the influence of different process parameters on the formation of grooves and narrow down the factors affecting defect formation. The formation of grooves was hardly affected by altering the pouring temperature of the molten metal. Increased moisture content resulted in the formation of new defects such as blow holes. To investigate the effect of the stress induced by the screed rail on the metal during the process on the formation of defects, trials were conducted by casting sheets without the use of a screed rail. Trials were also conducted by altering the inclination of the sandbed as well. It was inferred that the screed rail and inclination of sandbed did not have much of an influence on the formation of grooves when other operating conditions were set. Experiments were also performed using 99.99% pure lead and unrefined scrap. According to naked-eye observations the use of scrap melt led to additional defects due to the presence of impurities, as expected. With regard to the concentration of grooves per unit area, which was the observable in this investigation, slightly higher values were observed in the case of unrefined scrap melt. Finally, it was observed that coarser sand resulted in poor surface finish, as expected. The initial screening experiments performed were used for the final selection of three factors affecting the formation of grooves which were subsequently used in the DoE analysis, as it will be discussed in Section 2.3.
In order to thoroughly investigate groove formation, microscopic analysis of the defects was carried out. Square samples (20 mm × 20 mm) were cut out from the central part of defective sheets. Since defects were observed to be uniformly distributed over the surface of the sheet, the aforementioned sample was considered to be indicative of the properties of the whole sheet. The samples were cleaned with ethyl alcohol (ethanol) at concentration 70% and the sand side of the samples was observed under a Scanning Electron Microscope (SEM) with an Electro Dispersive Spectrometer (EDX). A Phillips XL30ESEM (Phillips, Amsterdam, The Netherlands) environmental scanning electron microscope was used for this purpose. The results from the EDX confirmed the inclusion of sand particles in the vicinity of grooves as illustrated in Figure 4 and Figure 5. Based on this observation, it was assumed that the composition of the mould material may have an effect on defect formation.
2.4. Design of Experiments
Analysis of Variance (ANOVA) is a set of statistical techniques used in both trivial and complicated experimental designs. ANOVA is often employed in order to find out how the average value of a dependent variable varies across a set of conditions tested within the same experiment. The various conditions being compared are called independent variables or factors [25]. ANOVA is very useful in DoE where a number of factors may affect a dependent variable, since there is no limit to the number of discrete effects that ANOVA can predict. It can also be used to predict the optimum set of factor values to maximise or minimise the output or dependent variable [26]. The general layout of an ANOVA table is presented in Table 3. SSE and SSTrt are the error and treatment sum of squares respectively. The degrees of freedom for the aforementioned sum of squares are g-1 and N-g, respectively, where g is the number of treatments and N the total number of observations. The mean sum of squares (MS) is given by the sum of squares divided by the degrees of freedom. The F-statistic (or F-ratio) is equal to the ratio of mean squares of the treatments to that of the error. This quantity is used to test the null hypothesis, i.e., that the means of all the treatments are the same versus the alternative that some of the treatment means differ [25].
The implementation of the DoE method consists of the following 5 steps, namely: (a) selection of factors and corresponding levels, (b) identification of the response variable, (c) selection of experimental design (d) conducting the experiment and (e) analysis of data. In this study, the experimental factors were selected based on literature review, process observation and operator interviews. As discussed in Section 2.2, according to SEM observations and screening experiments, it was concluded that defects were caused as a result of poor mould properties. Green sand mould consists of sand, water and a binder (usually clay) to bond the sand particles together. A good casting is produced when there is a good balance between the components of a green sand mixture. Hence, the effect of these parameters on the formation of defects on the surface was investigated. Moreover, the use of pure lead does not result in the mottled appearance on the top sheet surface, which is one of the most characteristic and desired properties of cast lead sheet [8]; thus, most foundries use a mix of pure (refined) and scrap lead. This factor was also included in the study as defects could also be caused due to the melt quality or interaction between the melt and the mould. Table 4 summarises the experimental parameters and their corresponding levels that have been used in this study. The factors used for the DoE analysis were ‘sand’ (based on their AFS fineness number) (A), ‘bentonite percentage’ (B) and ‘type of melt’ (C). Each factor was set to two levels equivalent to the high and low values of the corresponding experimental variables.
After identifying the various factors and their levels, a suitable experimental design was established. Considering the relatively small number of factors, a full factorial design was preferred. In full factorial designs, all possible combinations of factors are tested in order to identify the statistically significant ones. Full factorial designs are very effective especially when the number of factors is relatively low due to the small number of experiments needed to be conducted. The design layout was formed as per the parameters defined in Table 4, while the run order was randomised in order to minimise systematic errors. All trials were replicated twice and a total of sixteen experiments was conducted. The experimental design is shown in Table 5. A square sample (500 mm × 500 mm) was cut out from the middle section of the cast sheet and the total length of defects per unit area was measured using a digital caliper or a ruler depending or their length; as mentioned in the previous subsection, their length can exceed 300 mm. The total length of defects per unit area was considered as the response variable (Y) of the DoE analysis.
Minitab (version 18, Minitab Inc., State College, PA, USA) [27] was used for the analysis of the collected results. As mentioned in the Introduction section, the main objective of using a full factorial DoE is to estimate the main and interaction effects with a significant influence on the response variable. In this study a 95% confidence interval was assumed while the factor effects were considered to be statistically significant for P ≤ 0.05.
3. Results and Discussion
Experiments were conducted on a 7000 mm long casting bench under identical conditions at a foundry based in Derby, UK. Each mould mixture was prepared in a rotating sand mixer while the melt was prepared in a furnace next to the casting bed at 450 °C. The melt was then transferred to a hopper where any dross formed was removed. A k-type thermocouple with a temperature range of −200 °C to 1250 °C sourced from Omega Engineering Ltd (city, counrty) was dipped in the melt in order to constantly monitor the temperature before pouring at 345 °C. The pouring temperature was held constant for all trials. As illustrated in Table 6, the factors and interactions whose P-values are less than 0.005 have a significant effect on the response variable Y. Moreover, the sand-melt interaction and the three-way interaction between sand, clay and melt were considered to be insignificant and were hence neglected since their P values were greater than 0.005. The R-squared (R2) statistic is indicative of the variation of the response variable due to the variation of the input variables; larger values of R2 adjusted indicate models of greater predictive ability [28]. Predicted and adjusted R2 values were found to be equal to 99.92% and 99.85%, respectively, and in agreement with each other. Thus, the values obtained in the experiments are considered satisfactory for the validation of ANOVA.
ANOVA can also be validated through the normal probability plot of residuals (or error), which is a graphical technique for assessing whether a data set is approximately normally distributed. If the data points of a normal probability plot lie on the vicinity of a straight line, it can be assumed that the residuals are normally distributed. In Figure 6 the plotted data points fall on a straight-line indicating compliance to the normality assumption.
Significant effects can be identified from the normal plot of the effects as shown in Figure 7. All the effects lying in the proximity of the straight line are insignificant while the ones lying far from it are statistically significant. The response variable is increased when the positive effects change from low level to high level while negative effects have the inverse effect on the response variable. Those effects further from x = 0 are more significant [29]. A Pareto plot was also generated to evaluate the significance of the main and interaction effects as shown in Figure 8. The vertical red line at 2.3 is called reference line; any effects with bars reaching beyond this value are considered significant. From the Pareto and normal probability plots of the effects, it is evident that the most significant effect is B (clay content in the moulding mixture). Other significant effects influencing defect formation are A (sand type), C (melt composition), AB (sand-clay interaction) and BC (clay-melt interaction). It can also be observed that AC (sand-melt interaction) and ABC (three-way interaction between sand, clay and melt) are insignificant and consequently have negligible influence on the formation of defects.
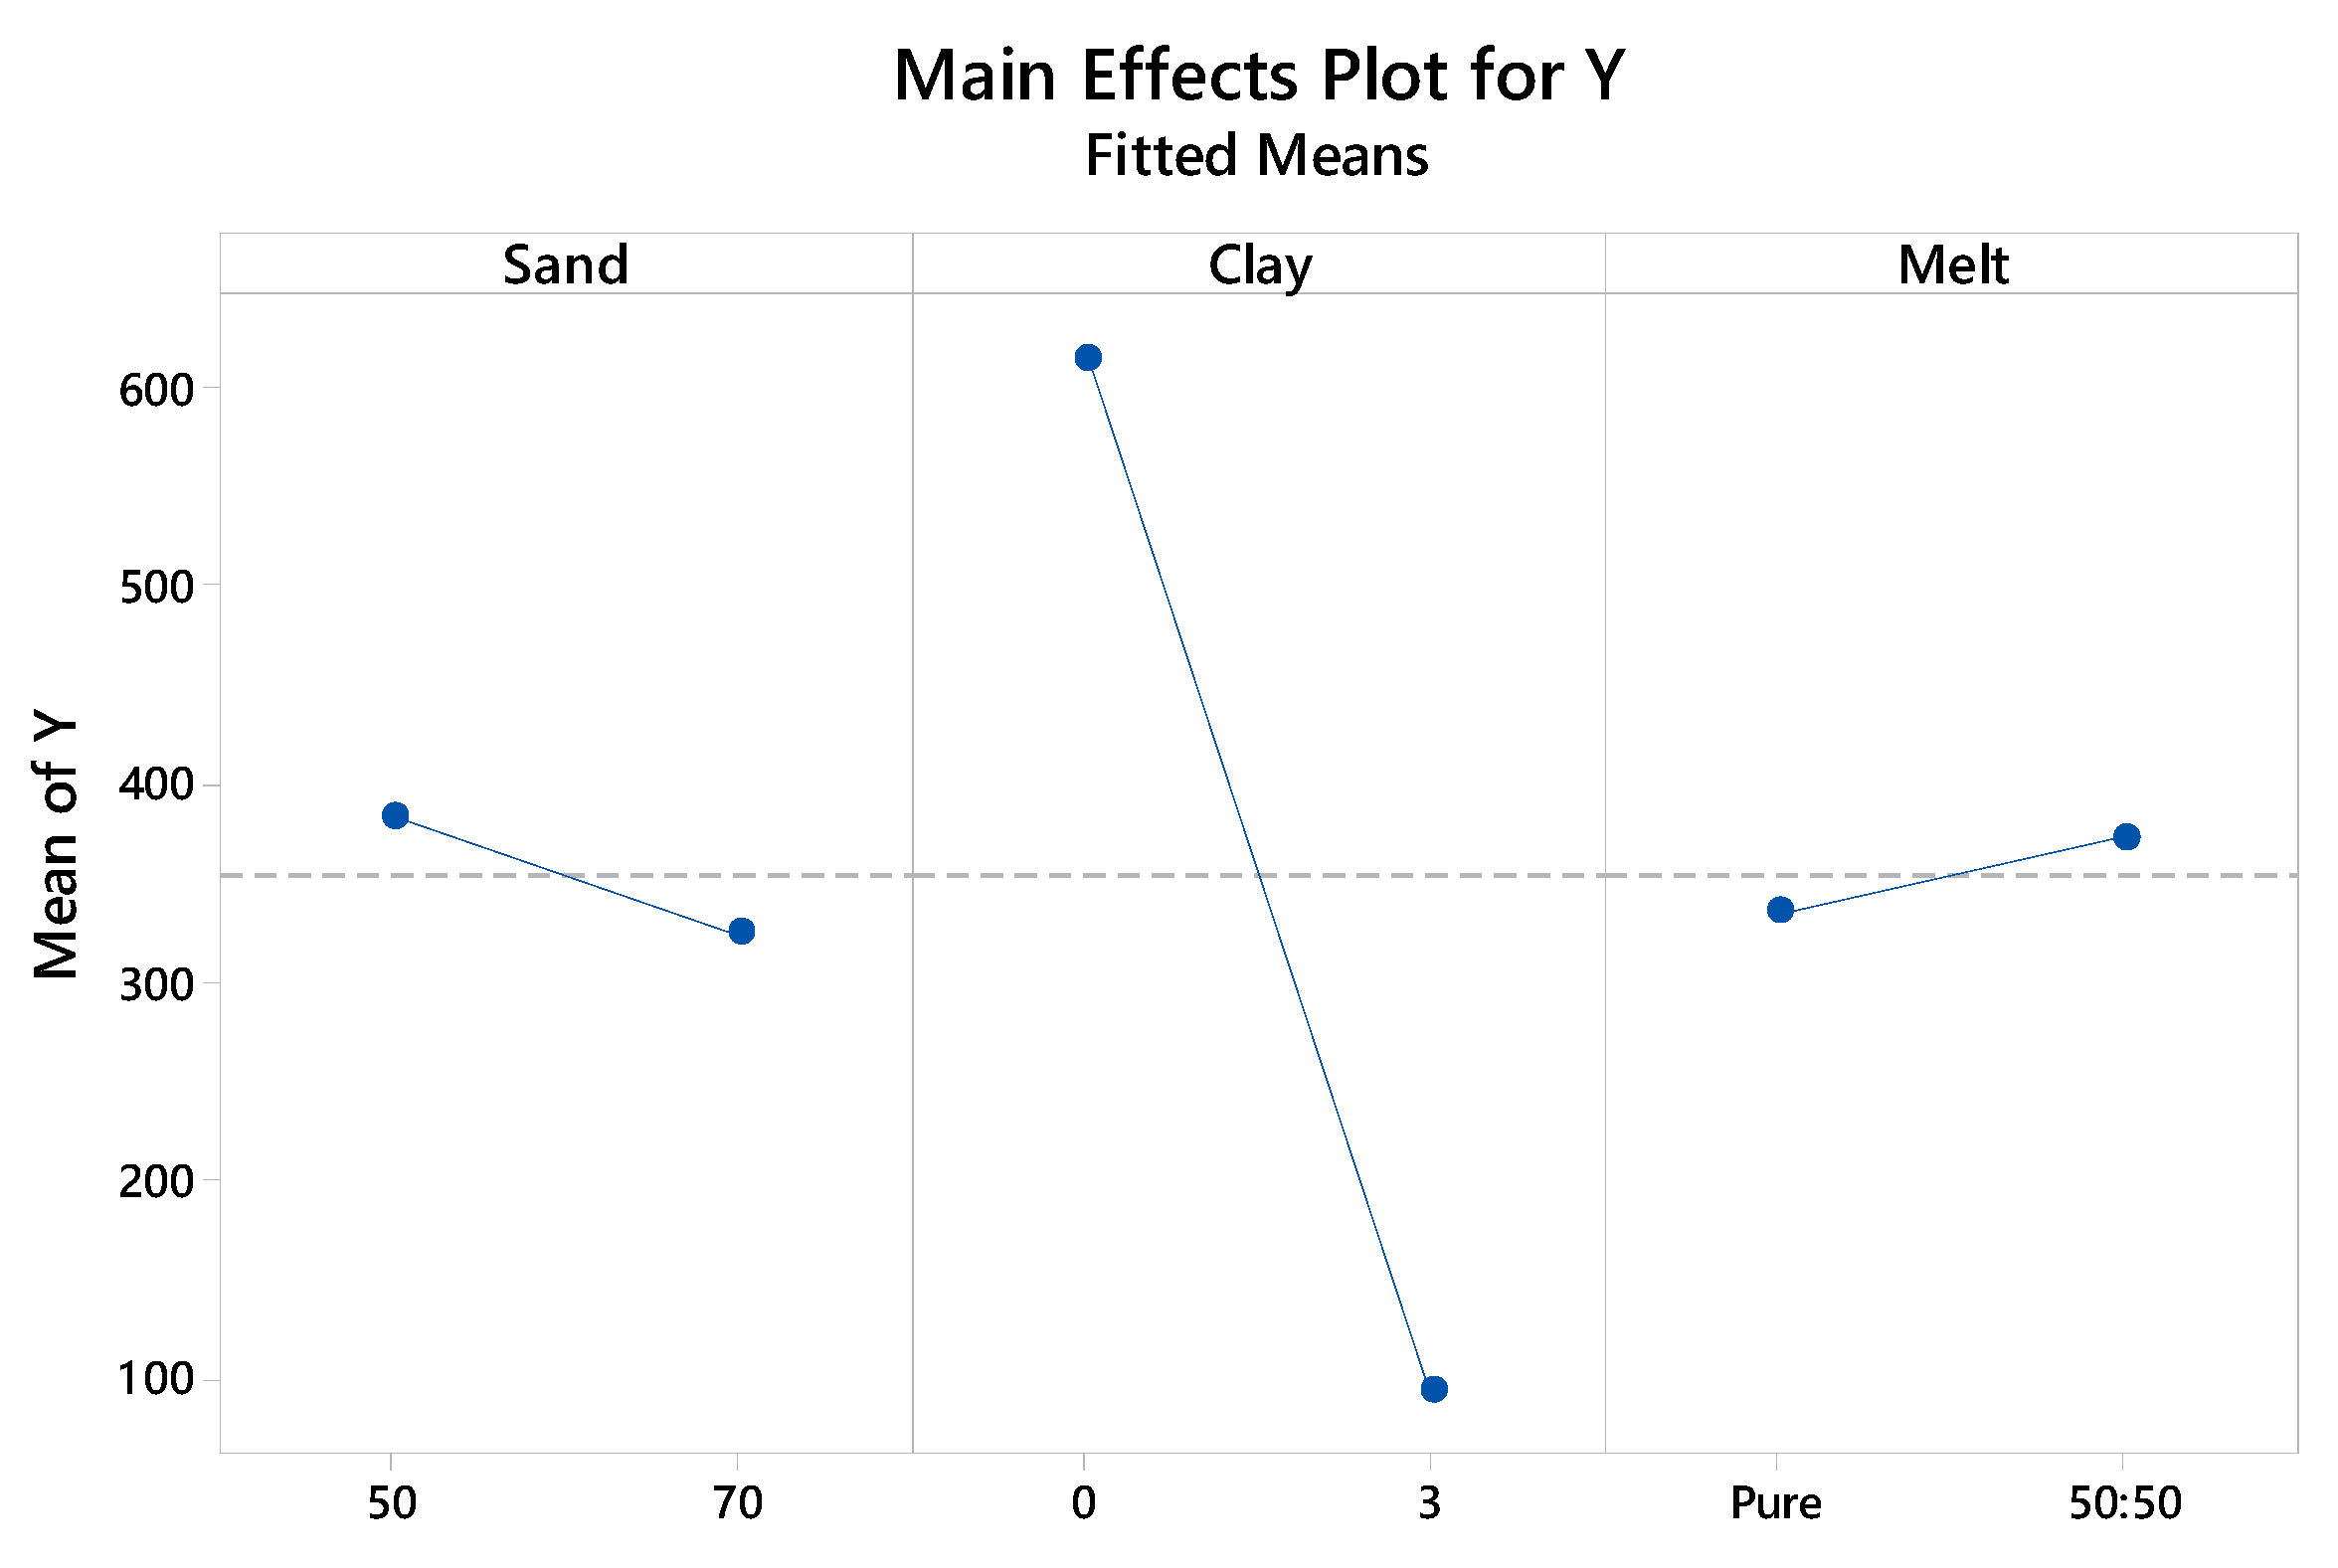
The main effects of the three factors considered on the formation of defects on the cast sheet have been plotted in Figure 9. As it can be observed, the clay content of the moulding mixture is the most significant among the 3 factors examined while defects have been found to reduce significantly with an increase in bentonite content. This is because a good casting is produced when there is a good balance between the components of the green sand mixture. Lead is a metal with a high density and has a high value of 3.22% for contraction on solidification [9]. Expansion defects are very common in castings and they originate in part due to expansion of the sand grains which get heated by the molten metal. Silica sand expands to a greater extent when compared with other sand like zircon, olivine and chromite [30]. Apart from expansion, these defects are also reliant on moisture. When the molten metal flows over the sand bed, the moisture in the mould is converted to steam and this steam permeates through the sand grains in the mould. At the point when the steam reaches a temperature lower than 100 °C, it condenses, and a wet layer is formed. This wet layer is weaker than the green sand or the hot dry sand. However, when the hot sand expands due to the heat absorbed from the molten metal, this wet layer shears to allow expansion, and ridges of sand spread into the mould cavity, and thereby, grooves are formed on the cast sheet. This phenomenon is intensified due to the contraction of the solidifying metal and erosion of sand. Addition of a binder holds the sand particles together thereby reducing this effect and explains the reduction in formation of these defects.
Grooves were also found to reduce with an increase in the AFS grain fineness number. Fine grained sand helps to attain a better surface finish owing to lower metal penetration into the mould but needs more binder content. However, a low permeability might result in formation of gas defects. Coarse grains provide higher permeability but may allow metal penetration. As a result, there should be a balance between these parameters to attain the best results [31]. Finally, the use of 50:50 mix of refined to unrefined lead increases the formation of defects as expected. This is because of the already existing inclusions in the 50:50 mix which contribute to the formation of additional defects. The optimum settings for minimal defects are obtained for a combination of 70 AFM sand, 3% Bentonite and pure melt.
4. Conclusions
Sand casting of lead sheet is a traditional method for manufacturing premium lead sheet for roofing applications in heritage buildings. Similarly to all casting processes, lead sheet casting suffers from the presence of defects. In this investigation the focus has been laid on a surface defect type, hereby addressed as ‘grooves’, appearing on the sand side of cast lead sheets. The presence of groove-type defects in the final cast sheet was quantified by estimating the ratio of their total length to the sample unit area. There are several factors potentially affecting the formation of this type of defects. Based on process observation, literature review and foundry experience, all possible factors affecting quality of sheets were listed. The initial set of factors selected was narrowed down based on a set of screening experiments, literature review and the experience of foundry engineers. Analysis of Variance (ANOVA) was implemented in order to identify the process parameters or factors which had the most significant contribution to the formation of grooves while an optimal set of process parameters was proposed in order to minimise defects in the final product. The main conclusions drawn from this investigation are summarised below:
- (1)
- The majority of the defects produced in lead sheet casting industry can be attributed to mould properties and moulding materials. This paper substantiates the fact that green sand casting provides better surface quality and finish as compared to traditional sand mixtures used in sand casting of lead sheet.
- (2)
- The trials conducted with the green sand mixture showed an improved surface finish and substantial reduction in the grooves produced on the sand side. Addition of bentonite in the sand mixture results in a substantial reduction of groove defects in sand cast lead sheet.
- (3)
- Grooves are reduced for higher AFS grain fineness numbers. Fine grained sand contributes to superior surface finish due to the decreased lead penetration into the sand.
- (4)
- The quality of the melt also affects the formation of the grooves. Pure lead should be favoured over a mix of refined and scrap lead.
- (5)
- Groove defects in sand cast lead sheet can be minimised by 90% for a combination of 70 AFS sand, 3% bentonite and pure melt.
Author Contributions
Conceptualization, A.P.; methodology, A.P.; software, A.P.; validation, A.P.; formal analysis, A.P.; investigation, A.P.; resources, K.S. and M.J.; data curation, A.P.; writing—original draft preparation, A.P., M.P.; writing—review and editing, M.P. and K.S.; visualization, A.P.; supervision, K.S. and M.J.; project administration, K.S.; funding acquisition, K.S. and M.J. All authors have read and agreed to the published version of the manuscript.
Funding
The authors would like to acknowledge ML Operations, Derby, UK for their support in conducting this research and Innovate UK for providing funding through the Knowledge Transfer Partnership (Project Number 9855).
Conflicts of Interest
The authors declare no conflict of interest.
References
- Hofmann, W. Lead and lead alloys. In Lead and Lead Alloys; Springer: Berlin/Heidelberg, Germany, 1970; pp. 25–320. [Google Scholar]
- Ben-Yosef, E.; Vassal, Y.; Van Den Brink, E.C.M.; Beeri, R. A new Ghassulian metallurgical assemblage from Bet Shemesh (Israel) and the earliest leaded copper in the Levant. J. Archaeol. Sci. Rep. 2016, 9, 493–504. [Google Scholar]
- Rocca, E.; Mirambet, F.; Steinmetz, J. Study of ancient lead materials: A gallo-roman sarcophagus—Contribution of the electrolytic treatment to its restoration. J. Mater. Sci. 2004, 3, 2767–2774. [Google Scholar] [CrossRef]
- Prabhakar, A.; Mielnicka, J.; Jolly, M.; Salonitis, K. Improving energy efficiency in direct method for continuous casting of lead sheets. In Proceedings of the TMS Annual Meeting & Exhibition, Phoenix, AZ, USA, 11–15 March 2018; Springer: Berlin, Germany; pp. 121–132. [Google Scholar]
- Haynes, W. CRC Handbook of Chemistry and Physics; CRC Press: Boca Raton, FL, USA, 2015. [Google Scholar]
- Hubbell, J.H.; Seltzer, S.M. Tables of X-ray Mass Attenuation Coefficients and Mass Energy-Absorption Coefficients 1 keV to 20 MeV for Elements Z= 1 to 92 and 48 Additional Substances of Dosimetric Interest; NISTIR-5632; National Inst. of Standards and Technology-PL: Gaithersburg, MD, USA, May 1995.
- Whillock, S.; Charles, J.A.; Smith, G.C. Microstructures and mechanical properties of milled and continuously cast lead sheet Part 1 Microstructures. Mater. Sci. Technol. 1989, 5, 1074–1083. [Google Scholar] [CrossRef]
- Prabhakar, A.; Salonitis, K.; Jolly, M.; Manufacturing, S.; Centre, S.; Kingdom, U. Characterization of Lead Sheet Manufactured Using Traditional Sand-Casting Technique; Springer: Berlin, Germany, 2019; pp. 283–292. [Google Scholar]
- Campbell, J. Complete Casting Handbook: Metal Casting Processes, Techniques and Design; Butterworth-Heinemann: Oxford, UK, 2015; ISBN 978-0-444-63509-9. [Google Scholar]
- Campbell, J. An overview of the effects of bifilms on the structure and properties of cast alloys. Metall. Mater. Trans. B Process. Metall. Mater. Process. Sci. 2006, 37, 857–863. [Google Scholar] [CrossRef]
- Tian, C.; Law, J.; Van der Touw, J.; Murray, M.; Yao, J.Y.; Graham, D.; John, D. Effect of melt cleanliness on the formation of porosity defects in automotive aluminium high pressure die castings. J. Mater. Process. Technol. 2002, 122, 82–93. [Google Scholar] [CrossRef]
- Saikaew, C.; Wiengwiset, S. Optimization of molding sand composition for quality improvement of iron castings. Appl. Clay Sci. 2012, 67–68, 26–31. [Google Scholar] [CrossRef]
- Mane, V.V.; Sata, A.; Khire, M.Y. New Approach to Casting Defects Classification and Analysis Supported by Simulation. In Proceedings of the 59th Indian Foundry Congress, Chandigarh, India, 11–13 February 2010; pp. 87–104. [Google Scholar]
- Dabade, U.A.; Bhedasgaonkar, R.C. Casting defect analysis using design of experiments (DoE) and computer aided casting simulation technique. Procedia CIRP 2013, 7, 616–621. [Google Scholar] [CrossRef] [Green Version]
- Guharaja, S.; Noorul Haq, A.; Karuppannan, K.M. Optimization of green sand casting process parameters by using Taguchi’s method. Int. J. Adv. Manuf. Technol. 2006, 30, 1040–1048. [Google Scholar] [CrossRef]
- Kumar, S.; Gupta, A.K.; Chandna, P. Optimization of process parameters of pressure die casting using taguchi methodology. Int. J. Mech. Aerosp. Ind. Mechatron. Manuf. Eng. 2012, 6, 1484–1488. [Google Scholar]
- Perzyk, M.; Kochański, A. Detection of causes of casting defects assisted by artificial neural networks. Proc. Inst. Mech. Eng. Part B J. Eng. Manuf. 2003, 217, 1279–1284. [Google Scholar] [CrossRef]
- Chopra, O.; Niessen, P. Solidification of lead and lead alloys in continuous drum sheet casting. Z. Met. Res. Adv. Tech. 1975, 66, 10–16. [Google Scholar]
- Whillock, S.; Charles, J.A.; Smith, G.C. Microstructures and mechanical properties of milled and continuously cast lead sheet. Mater. Sci. Technol. 1991, 7, 1116–1127. [Google Scholar] [CrossRef]
- Prabhakar, A.; Papanikolaou, M.; Salonitis, K.; Jolly, M. Sand casting of sheet lead: Numerical simulation of metal flow and solidification. Int. J. Adv. Manuf. Technol. 2019, 106, 1–13. [Google Scholar] [CrossRef]
- SPECTROMAXx Metal Analyzer|SPECTRO Analytical. Available online: https://www.spectro.com/products/optical-emission-spectroscopy/spectromaxx-metal-analyzer (accessed on 6 February 2020).
- Kumaravadivel, A.; Natarajan, U.; Ilamparithi, C. Determining the optimum green sand casting process parameters using Taguchi’s method. J. Chin. Inst. Ind. Eng. 2012, 29, 148–162. [Google Scholar] [CrossRef]
- Thiel, J.; Ziegler, M.; Dziekonski, P.; Joyce, S. Investigation into the technical limitations of silica sand due to thermal expansion. Trans. Am. Foundry Soc. 2007, 115, 383–400. [Google Scholar]
- Hakimi, S.; Zahraee, S.M.; Mohd Rohani, J. Application of Six-Sigma DMAIC methodology in plain yogurt production process. Int. J. Lean Six Sigma 2018, 9, 562–578. [Google Scholar] [CrossRef]
- Wulff, S.S. A First Course in Design and Analysis of Experiments; University of Minnesota: Minneapolis, MN, USA, 2003; Volume 57, ISBN 0716735105. [Google Scholar]
- Hossain, M.S.; Rahim, N.A.; Aman, M.M.; Selvaraj, J. Application of ANOVA method to study solar energy for hydrogen production. Int. J. Hydrogen Energy 2019, 44, 14571–14579. [Google Scholar] [CrossRef]
- Minitab 18 Statistical Software 2017; [Computer software]; Minitab, Inc.: State College, PA, USA, 2017.
- Scarpa, F.; Vieira, L.M.G.; Freire, R.T.S.; Panzera, T.H.; Oliveira, L.Á.; Santos, J.C. Evaluation of hybrid-short-coir-fibre-reinforced composites via full factorial design. Compos. Struct. 2018, 202, 313–323. [Google Scholar]
- Montgomery, D.C. Design and Analysis of Experiments; John Wiley & Sons: Hoboken, NJ, USA, 2017. [Google Scholar]
- Jolly, M. Comprehensive Structural Integrity; Elsevier: Amsterdam, The Netherlands, 2003. [Google Scholar]
- Brown, J.R. Foseco Foundryman’s Handbook; Butterworth-Heinemann: Oxford, UK, 1994. [Google Scholar]
Figure 1.
(a) Snapshot and (b) schematic representation of the lead sheet casting process.
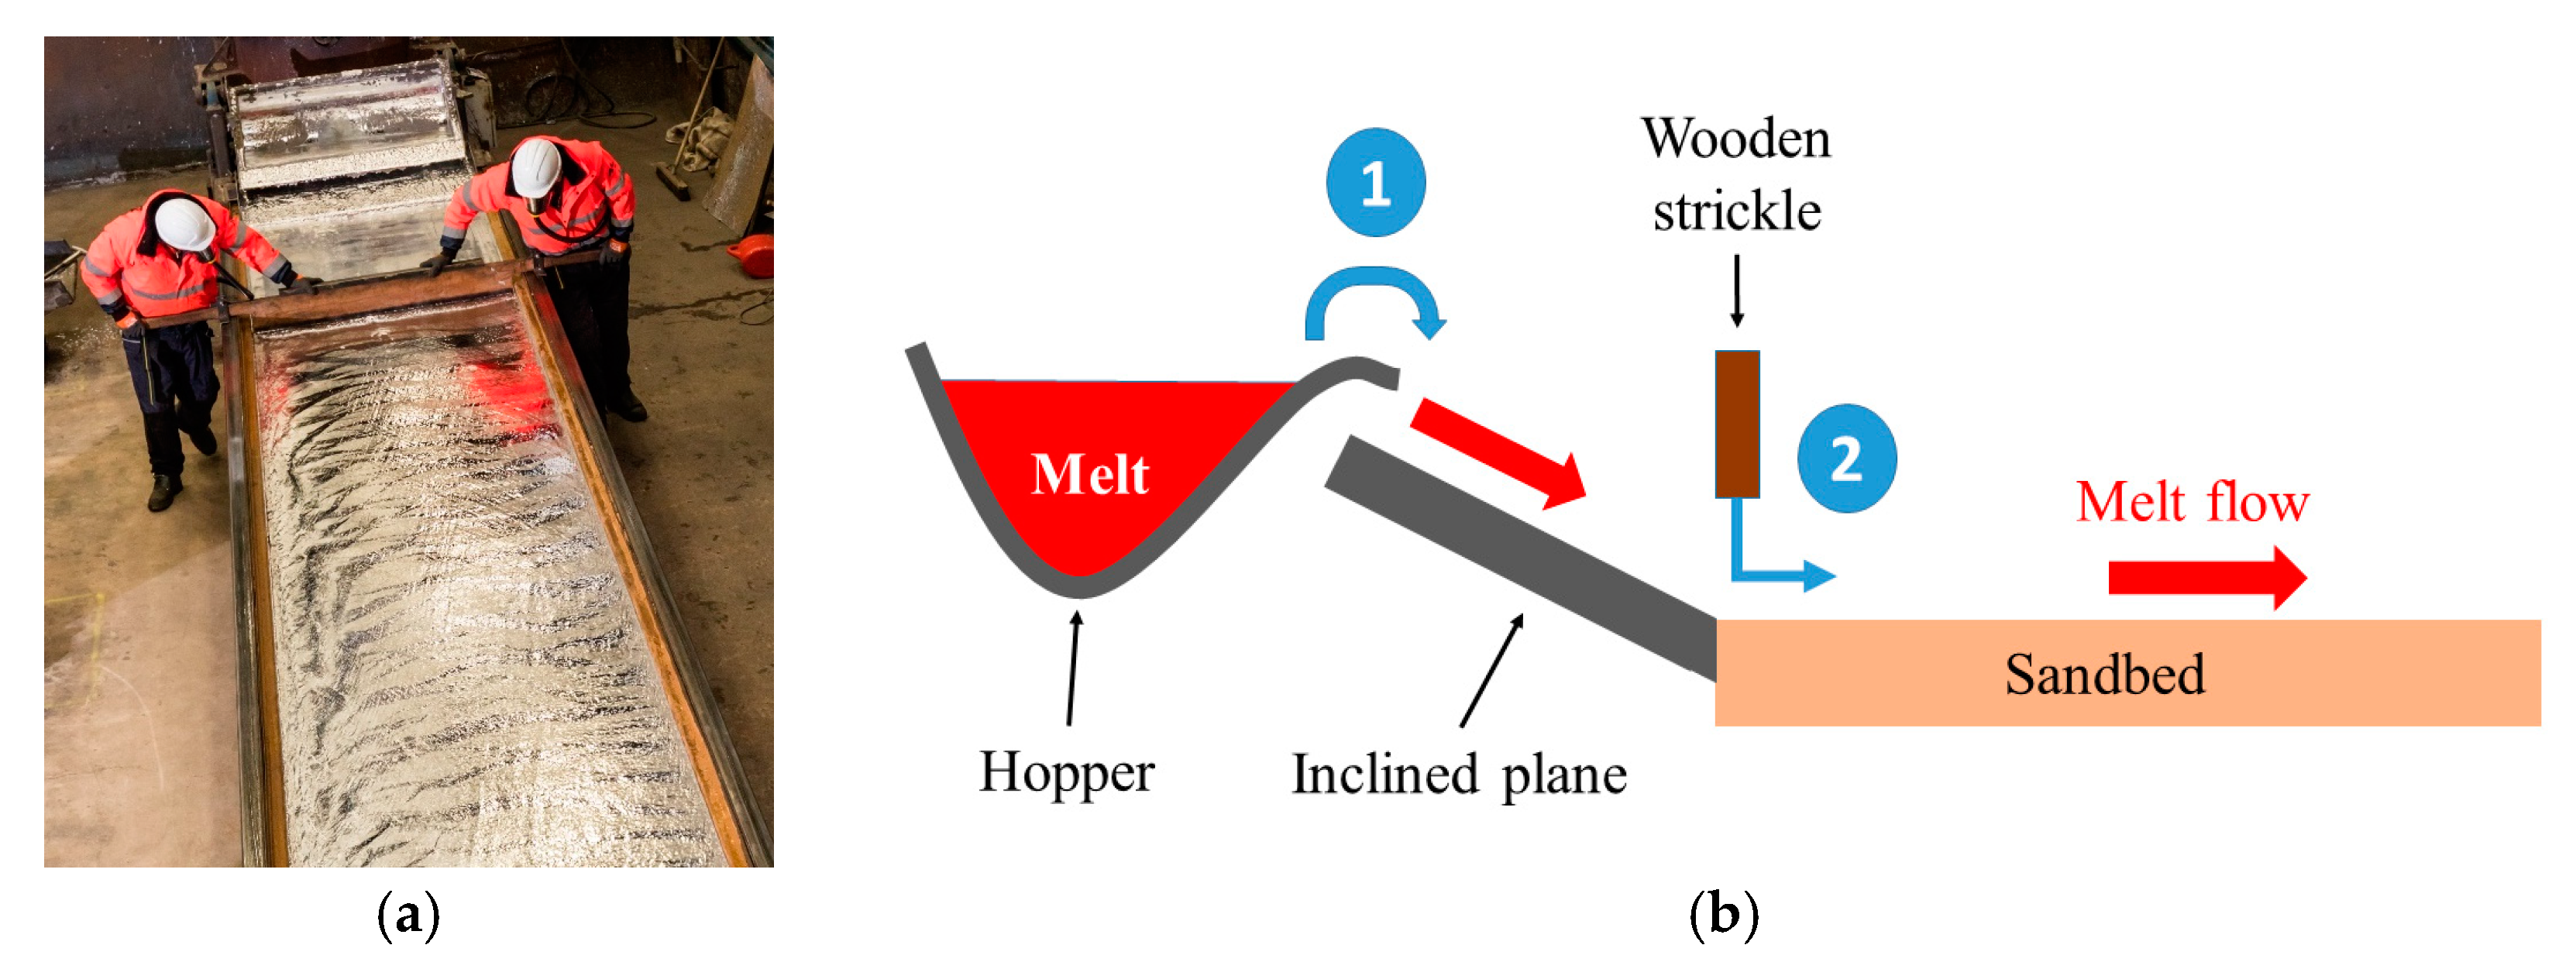
Figure 2.
Lead sheet sand casting process workflow.
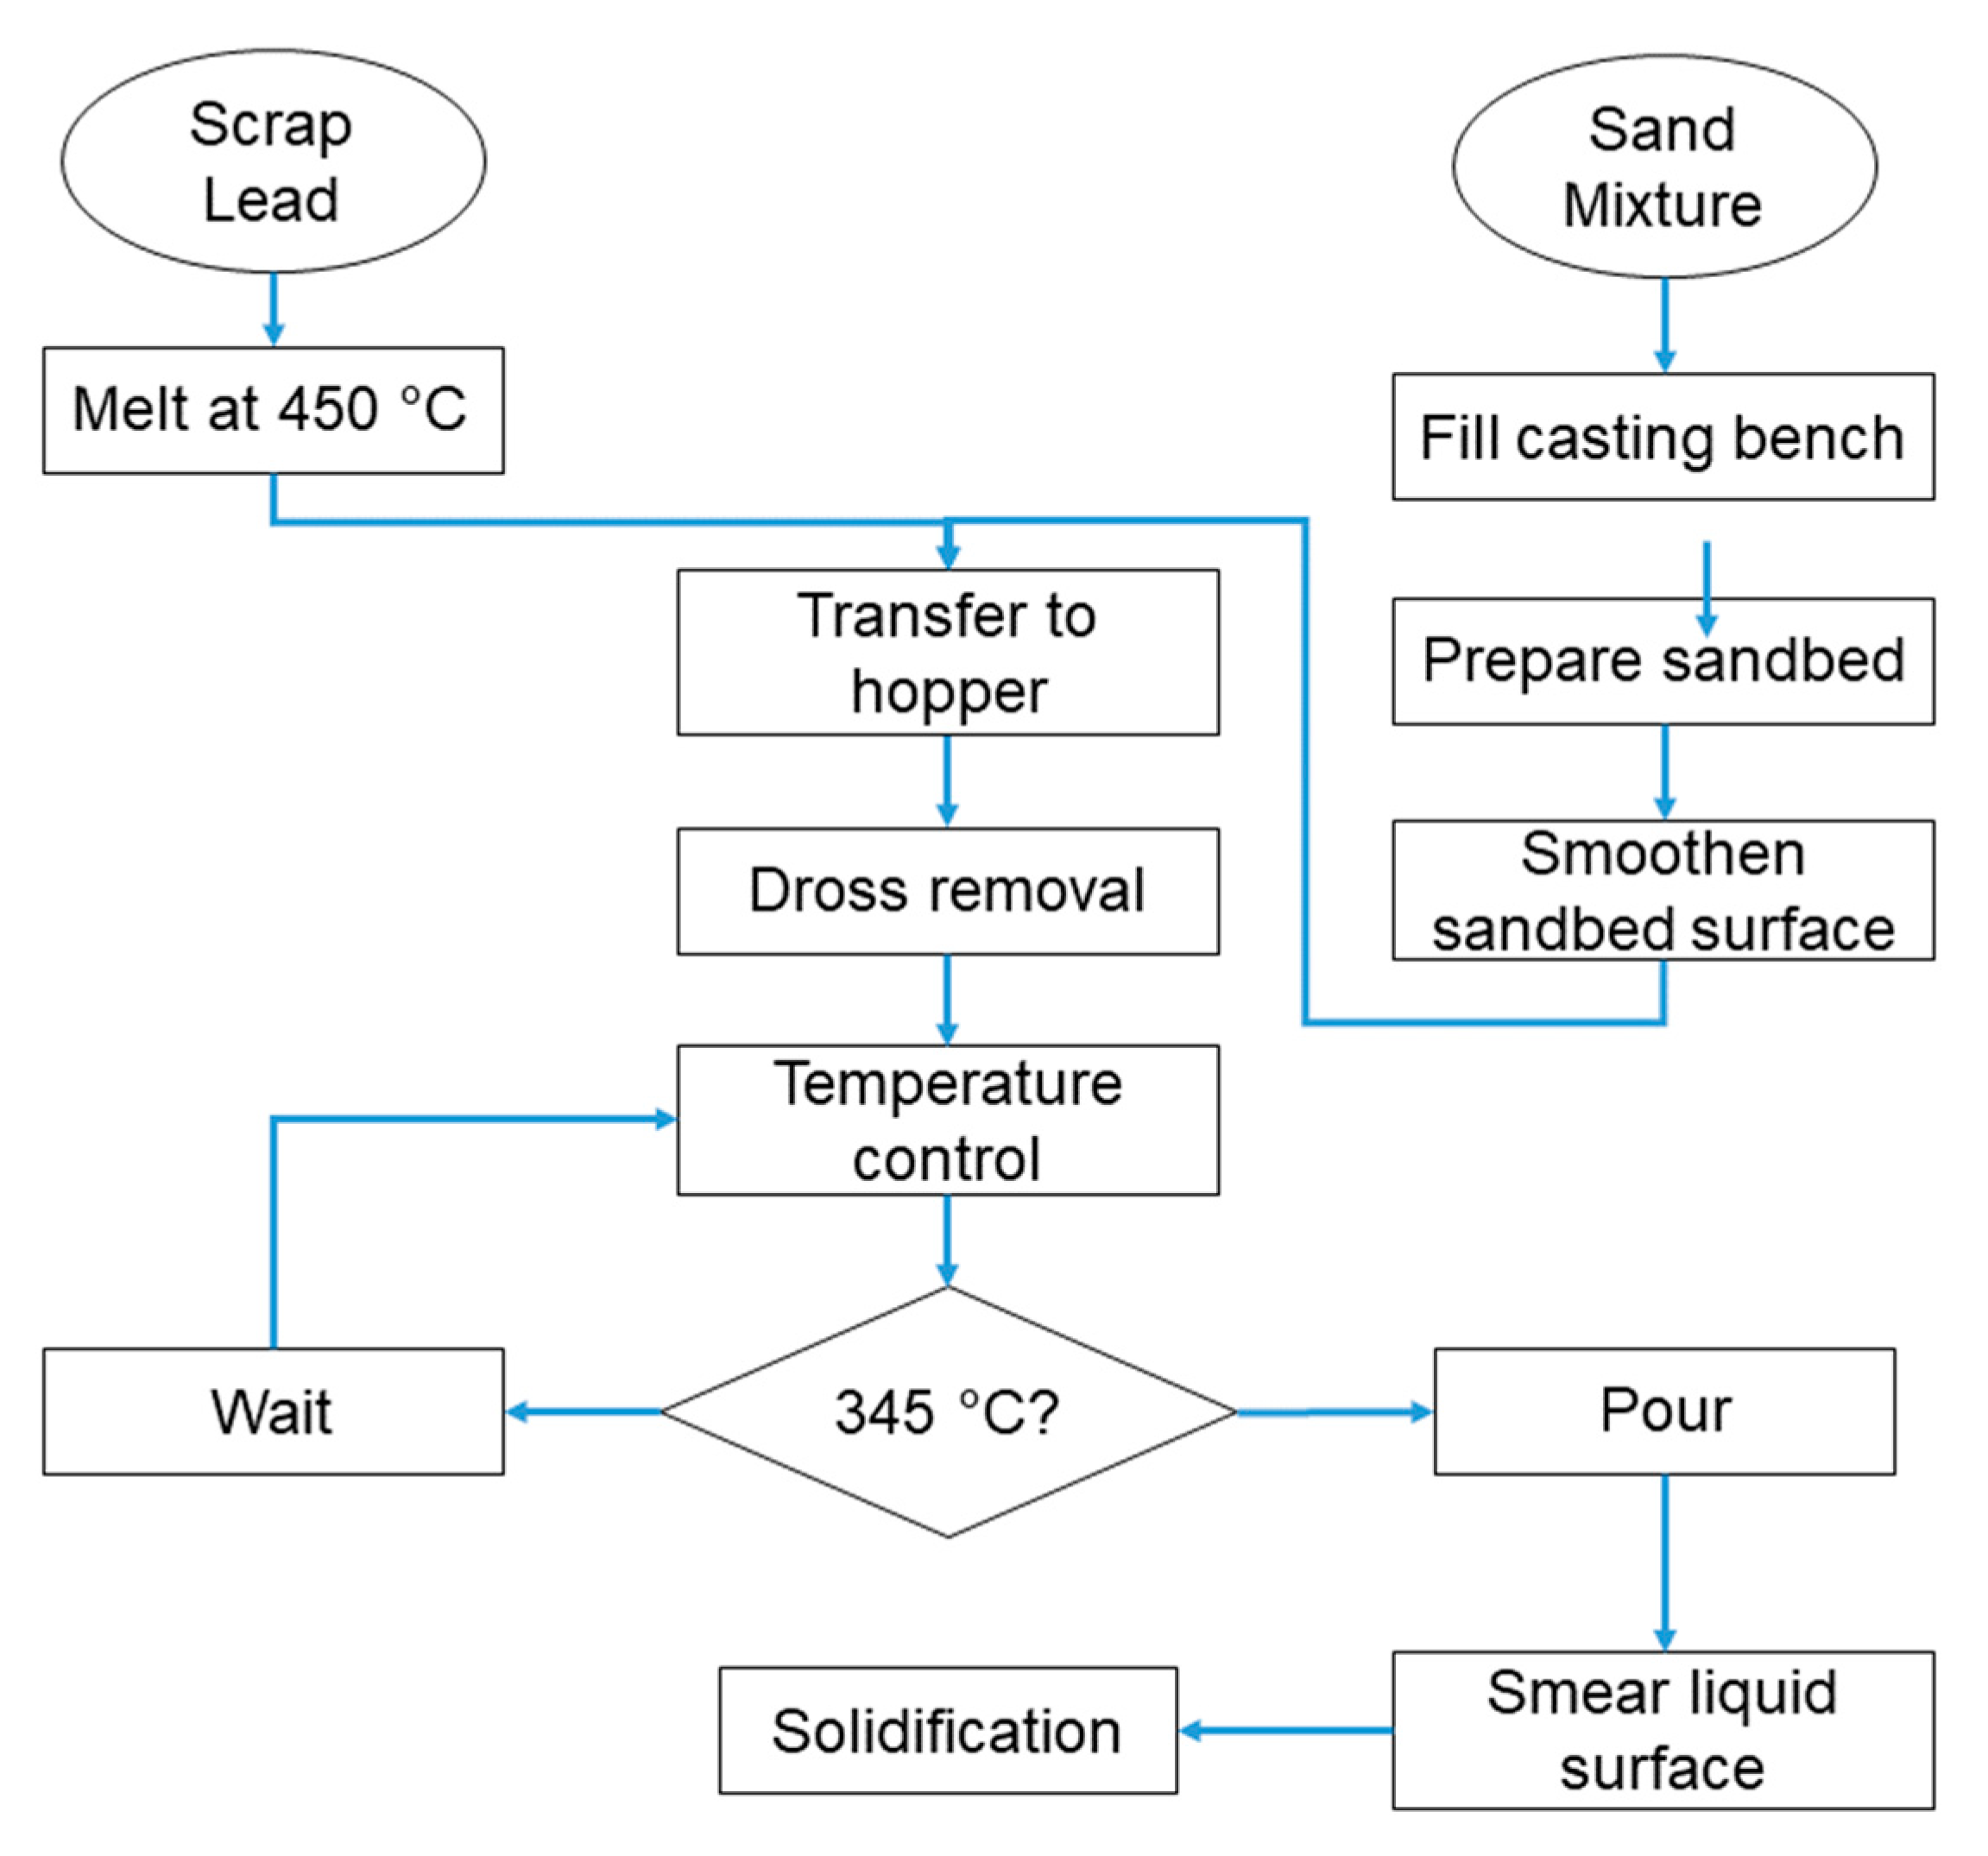
Figure 3.
Sand side of cast sheet with grooves (1000 mm × 600 mm).
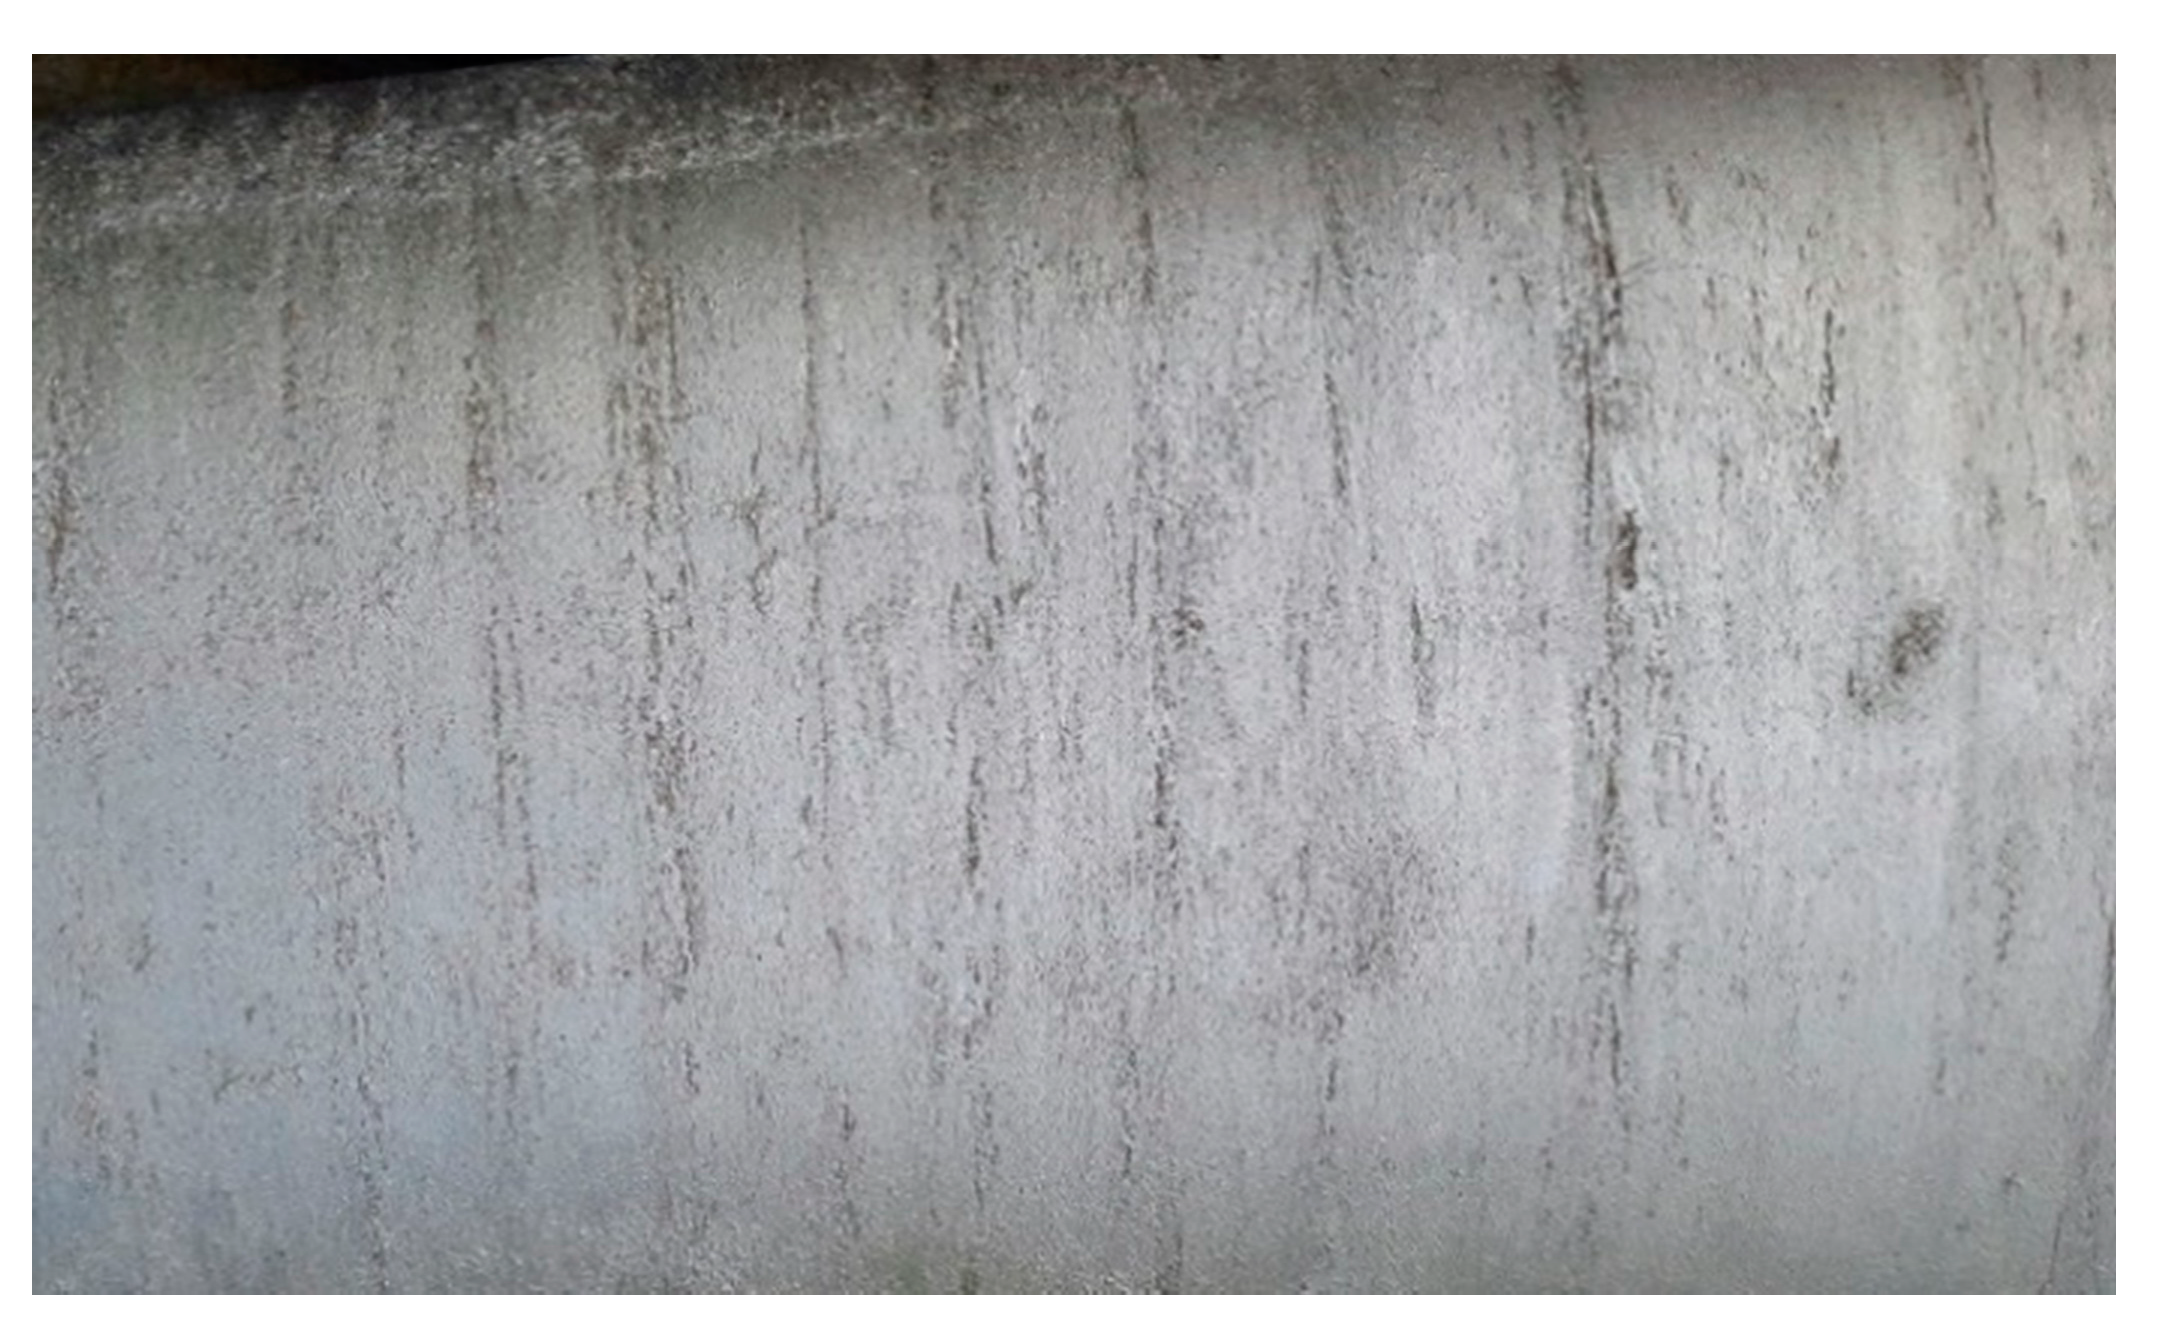
Figure 4.
SEM images of (a) the groove defect at 350× magnification and (b) a sand inclusion at 26× magnification.
Figure 4.
SEM images of (a) the groove defect at 350× magnification and (b) a sand inclusion at 26× magnification.
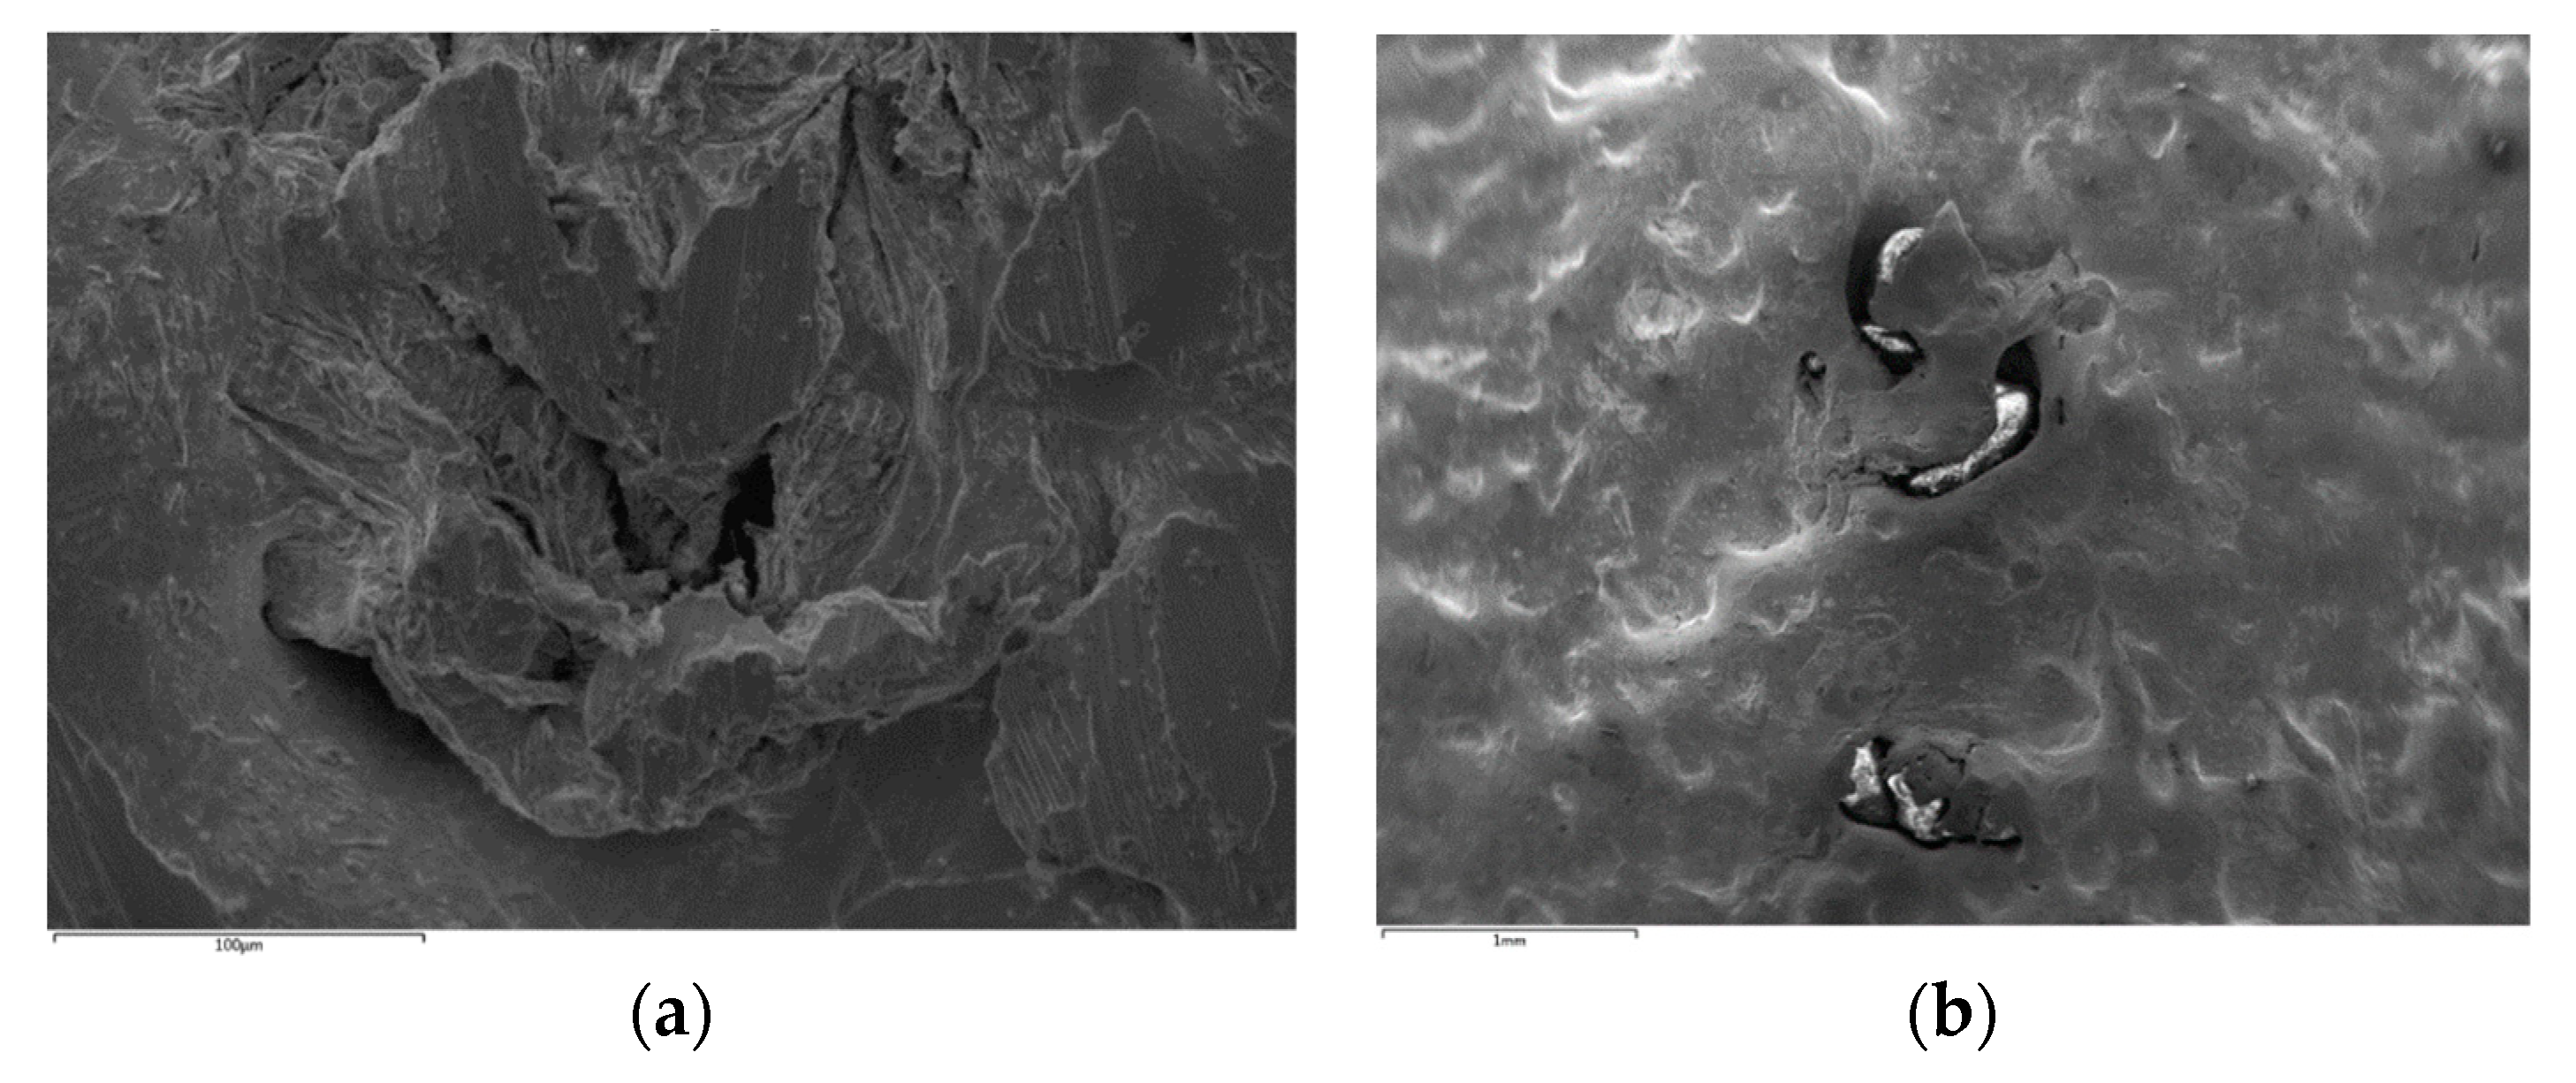
Figure 5.
(a) SEM Image of sand inclusion at magnification 150× and (b) spectral analysis of the corresponding regions (1–4).
Figure 5.
(a) SEM Image of sand inclusion at magnification 150× and (b) spectral analysis of the corresponding regions (1–4).

Figure 6.
Normal probability plot of residuals.
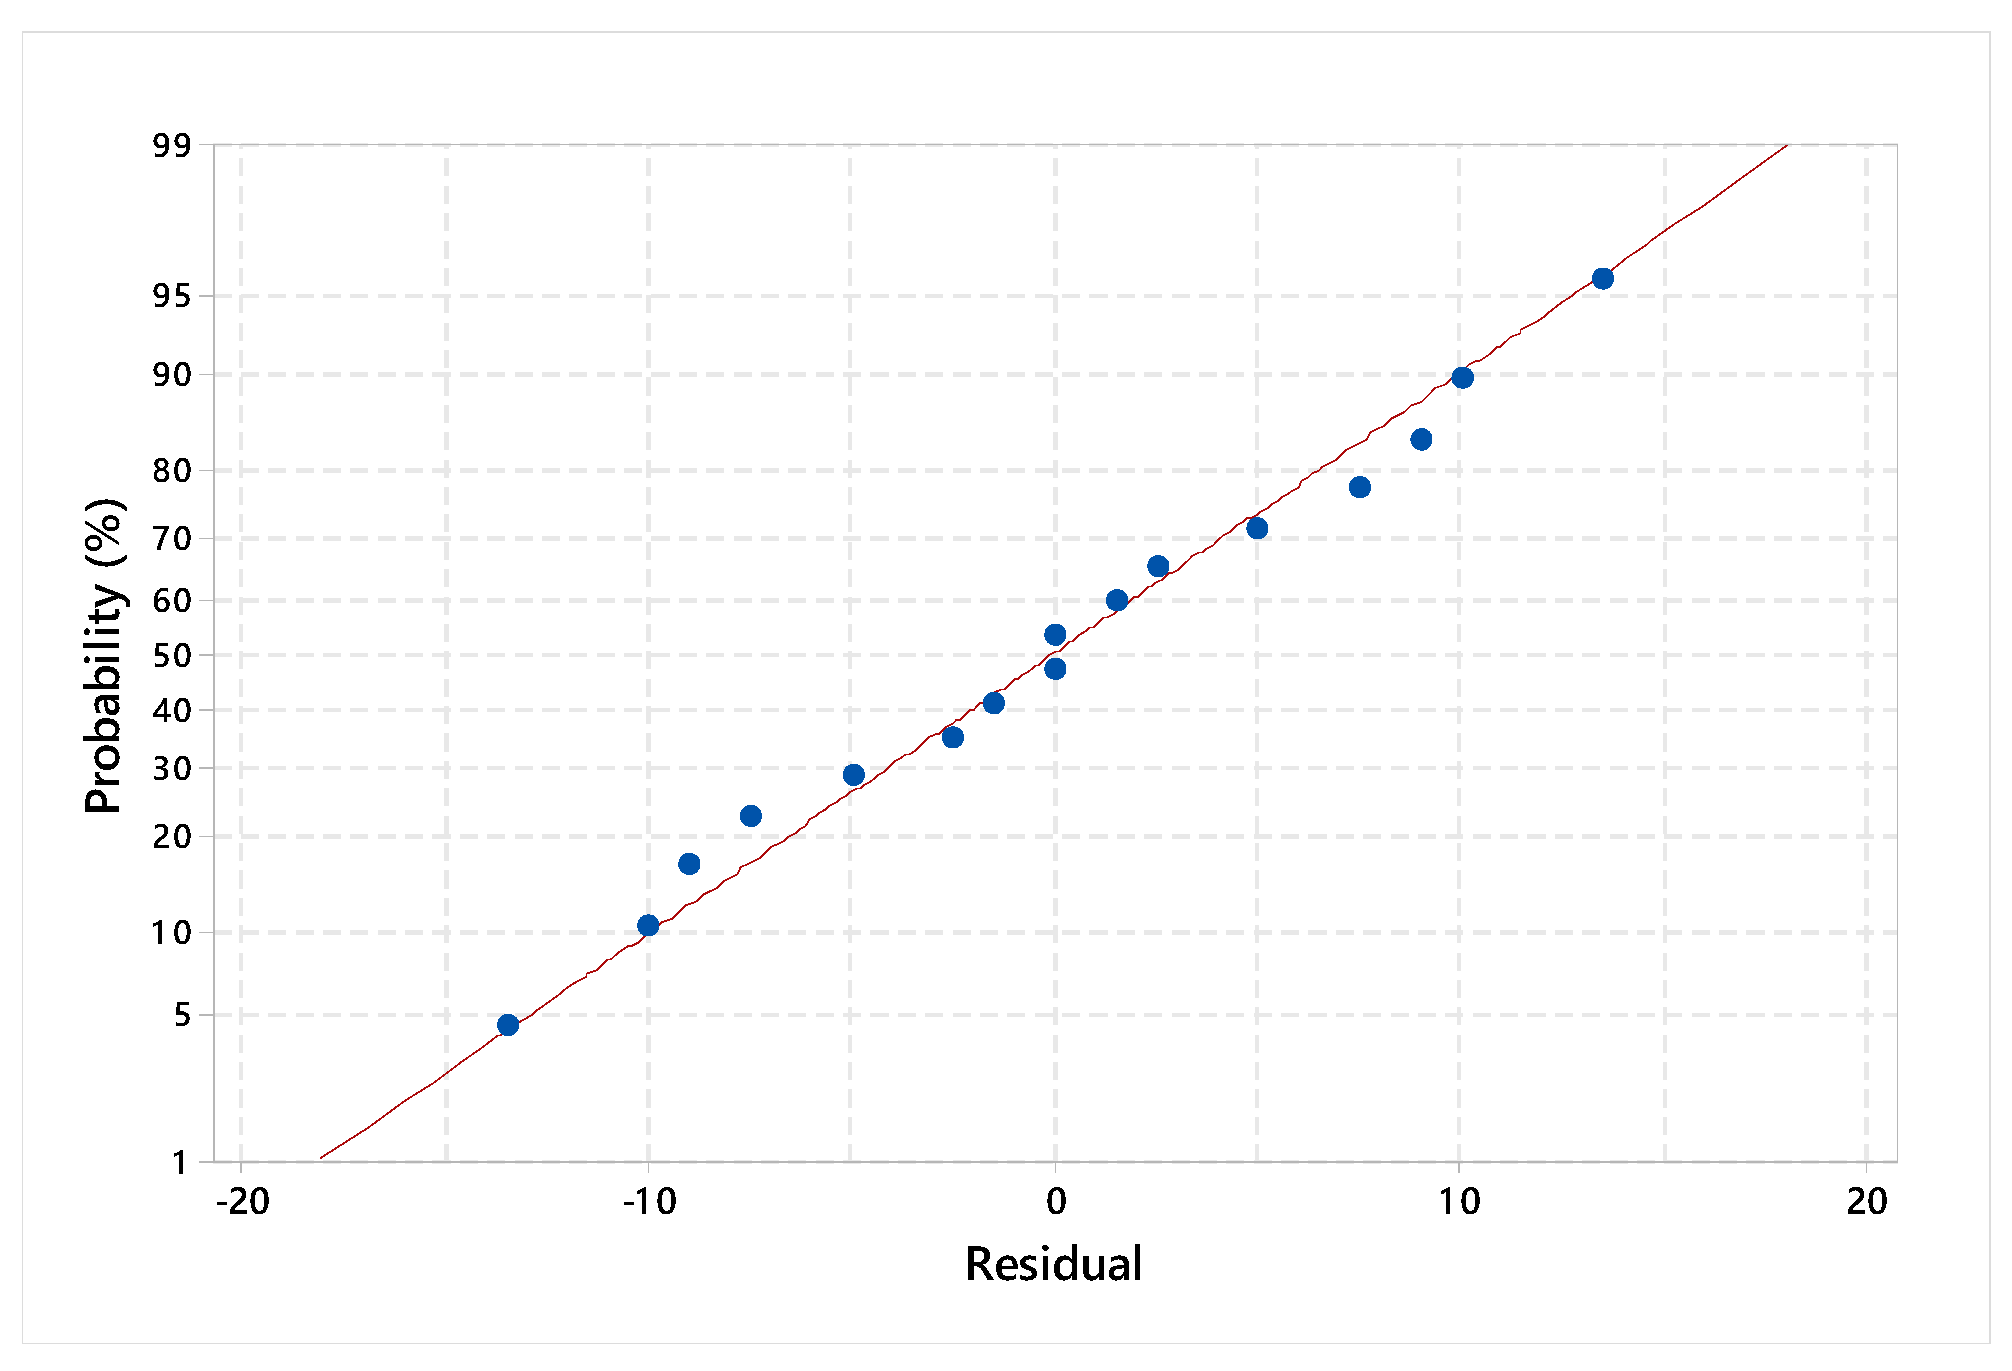
Figure 7.
Normal probability plot of the effects.
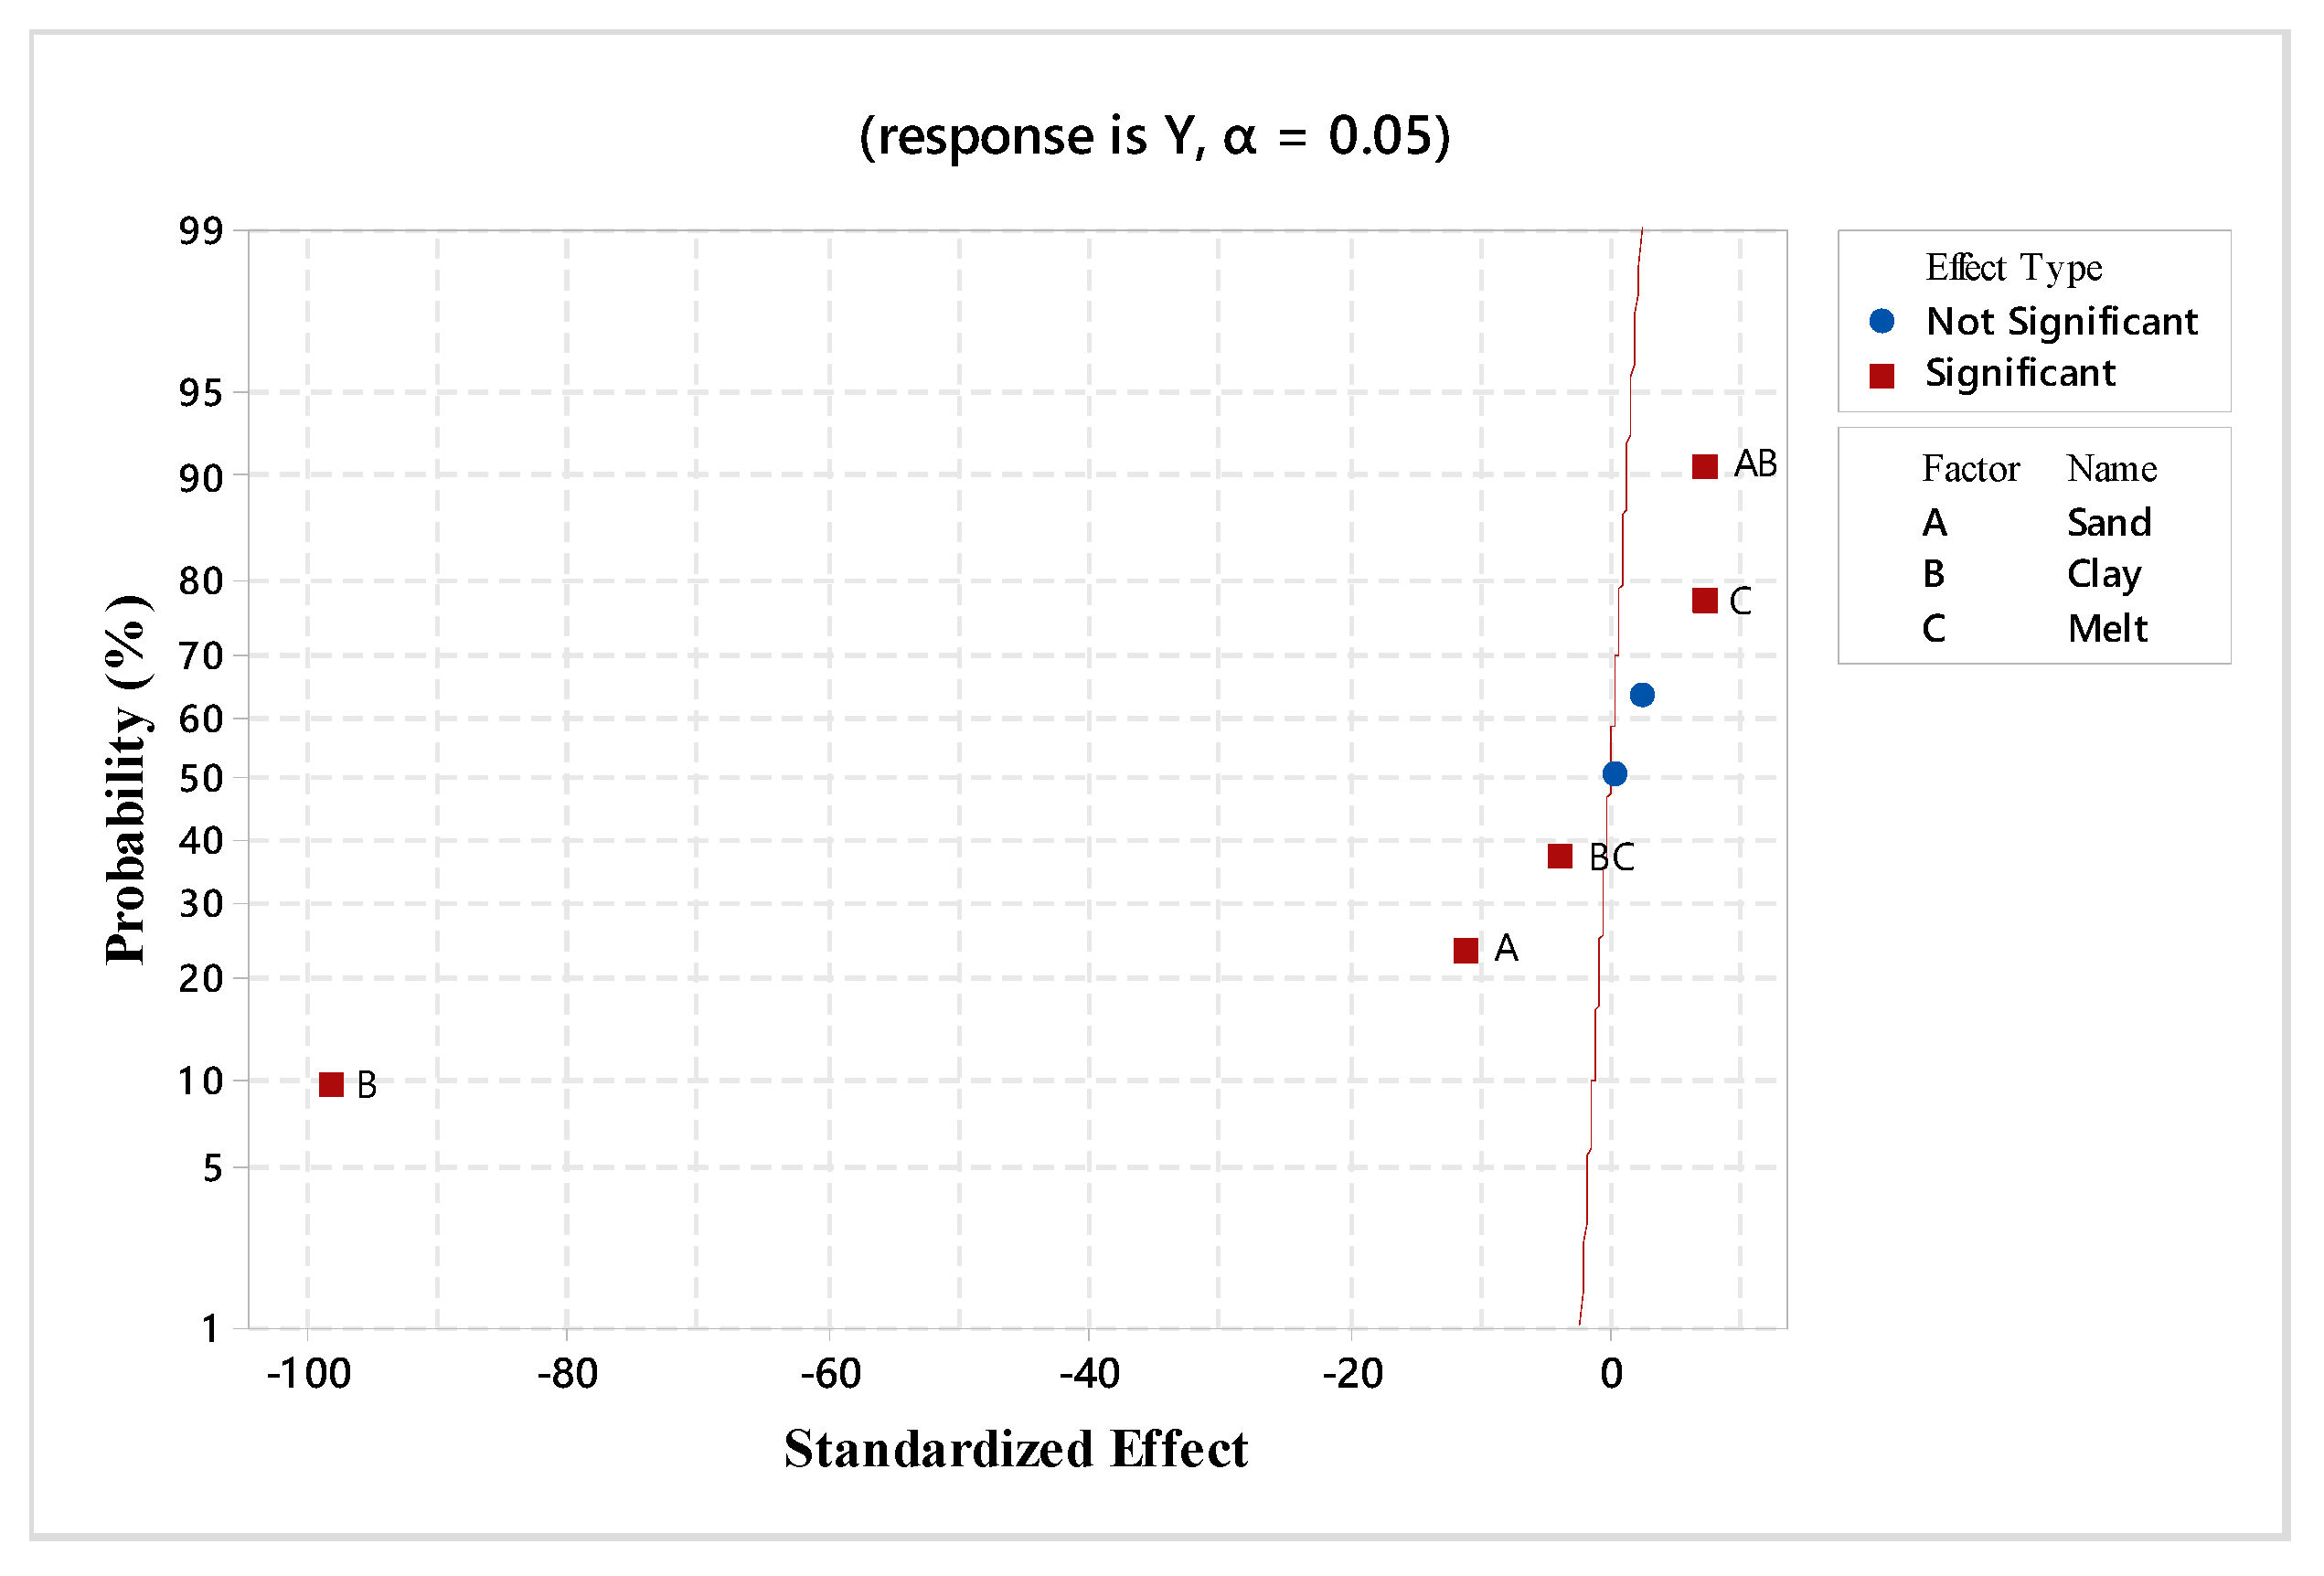
Figure 8.
Pareto chart of Standardised effects.
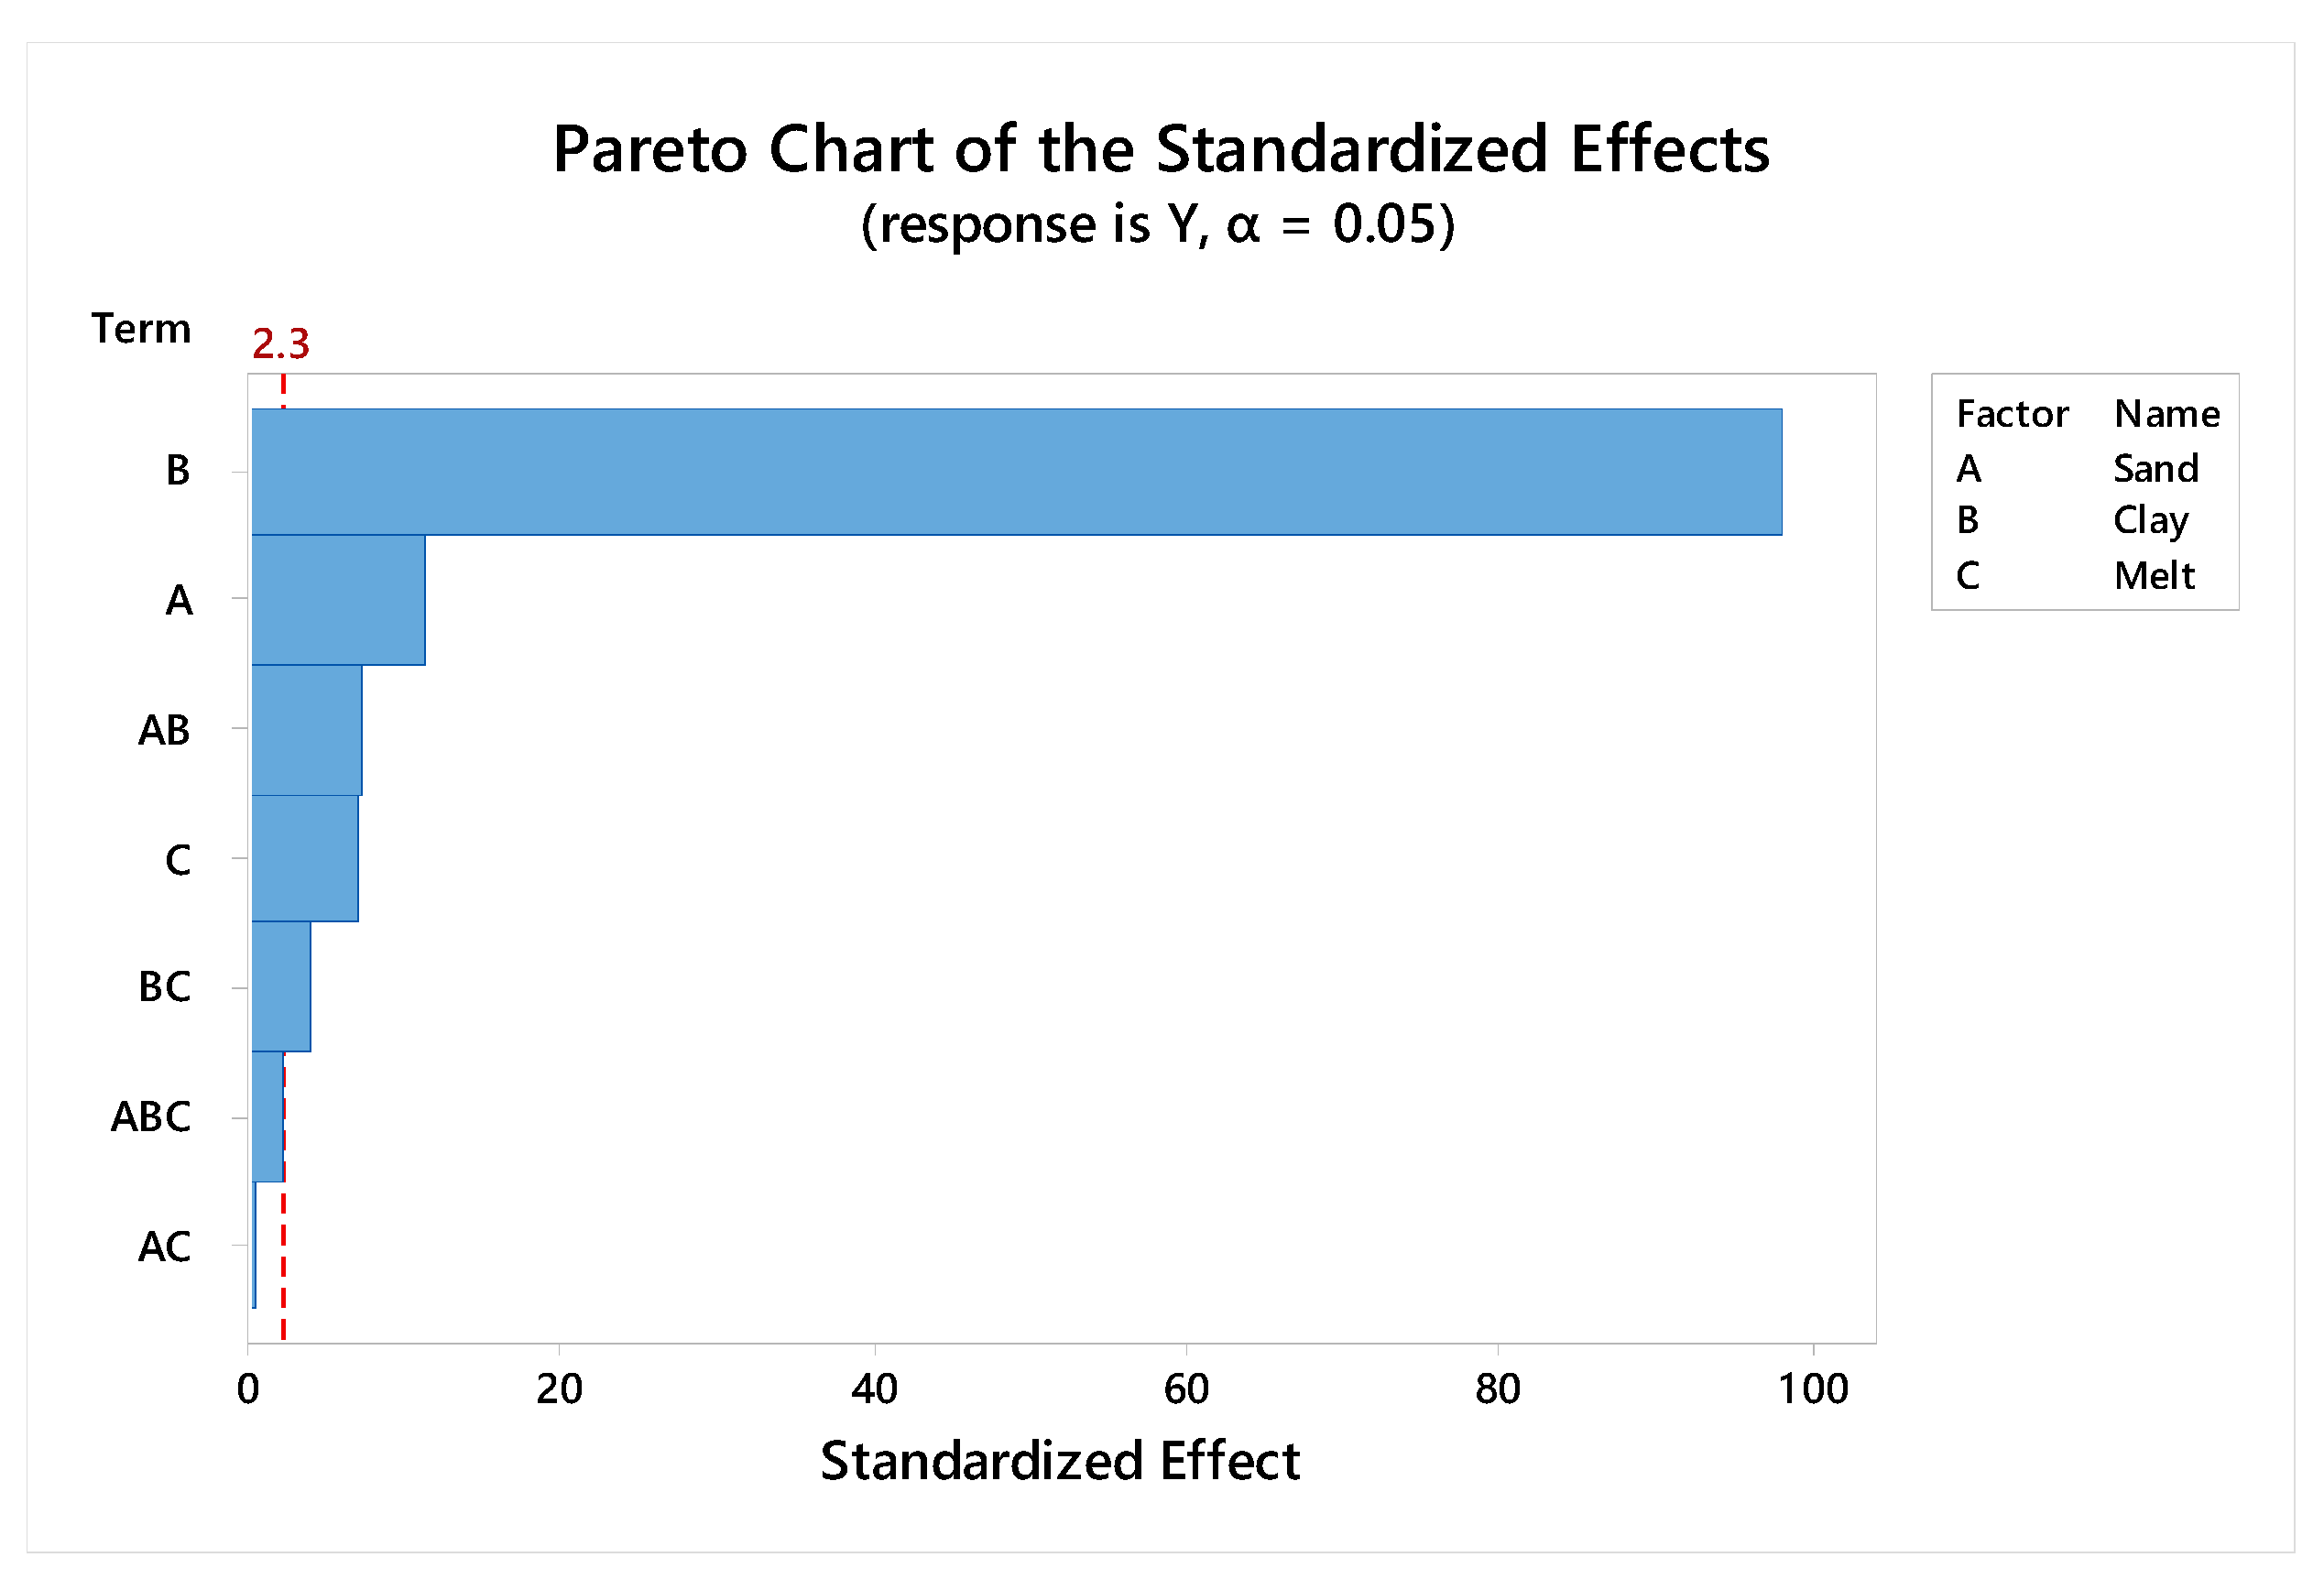
Figure 9.
Effect of process parameters on defect formation.

Table 1.
Mean and standard deviation (SD) values of common impurities obtained from elemental analysis of 80 different scrap melt batches.
Table 1.
Mean and standard deviation (SD) values of common impurities obtained from elemental analysis of 80 different scrap melt batches.
| Elements (wt%) | Cu | Zn | Sn | Sb | Bi | Ag |
|---|---|---|---|---|---|---|
| Mean | 0.0283 | 0.0029 | 0.086 | 0.0315 | 0.0179 | 0.0041 |
| SD | 0.0255 | 0.0101 | 0.0011 | 0.079 | 0.0030 | 0.0184 |
Table 2.
Factors potentially affecting the quality of cast sheets.
| No. | Process Parameters | Classification as per 5 M |
|---|---|---|
| 1 | Temperature of Melt | Material |
| 2 | Melt Composition | Material |
| 3 | Sand | Machine |
| 4 | Water content | Machine |
| 5 | Velocity of screed | Method |
| 6 | Angle of inclination of sand bed | Machine |
| 7 | Use of screed | Method |
| 8 | Ambient temperature | Environment |
| 9 | Bed preparation | Man |
Table 3.
General layout of the ANOVA table.
| Source | DF | SS | MS | F |
|---|---|---|---|---|
| Treatments | g-1 | SSTrt | SSTrt/(g-1) | MSTrt/MSE |
| Error | N-g | SSE | SSE/(N-g) |
Table 4.
Factors and their levels.
| Factors | Type | Low Level | High Level |
|---|---|---|---|
| A: Sand AFS (Dimensionless) | Numeric | 50 | 70 |
| B: Clay (wt%) | Numeric | 0 | 3 |
| C: Melt | Categoric | Pure | 50:50 Mix of refined and scrap lead |
Table 5.
Experimental Design.
| Standard Order | Run Order | A: Sand AFS (Dimensionless) | B: Bentonite (wt%) | C: Melt (Composition) | Response: Y (1/mm) |
|---|---|---|---|---|---|
| 1 | 1 | 50 | 0 | Pure | 620 |
| 15 | 2 | 50 | 3 | 50:50 | 105 |
| 2 | 3 | 70 | 0 | Pure | 538 |
| 16 | 4 | 70 | 3 | 50:50 | 99 |
| 3 | 5 | 50 | 3 | Pure | 110 |
| 12 | 6 | 70 | 3 | Pure | 70 |
| 9 | 7 | 50 | 0 | Pure | 640 |
| 8 | 8 | 70 | 3 | 50:50 | 96 |
| 4 | 9 | 70 | 3 | Pure | 65 |
| 6 | 10 | 70 | 0 | 50:50 | 582 |
| 13 | 11 | 50 | 0 | 50:50 | 712 |
| 14 | 12 | 70 | 0 | 50:50 | 600 |
| 7 | 13 | 50 | 3 | 50:50 | 105 |
| 11 | 14 | 50 | 3 | Pure | 95 |
| 10 | 15 | 70 | 0 | Pure | 548 |
| 5 | 16 | 50 | 0 | 50:50 | 685 |
Table 6.
ANOVA table.
| Source | DF | Adj SS | Adj MS | F-Value | P-Value |
|---|---|---|---|---|---|
| Model | 7 | 1,119,746 | 159,964 | 1412.48 | 0.000 |
| Linear | 3 | 1,111,617 | 370,539 | 3271.87 | 0.000 |
| Sand | 1 | 14,042 | 14,042 | 123.99 | 0.000 |
| Clay | 1 | 1,092,025 | 1,092,025 | 9642.60 | 0.000 |
| Melt | 1 | 5550 | 5550 | 49.01 | 0.000 |
| 2-Way Interactions | 3 | 7552 | 2517 | 22.23 | 0.000 |
| Sand-Clay | 1 | 5776 | 5776 | 51.00 | 0.000 |
| Sand-Melt | 1 | 12 | 12 | 0.11 | 0.751 |
| Clay-Melt | 1 | 1764 | 1764 | 15.58 | 0.004 |
| 3-Way Interactions | 1 | 576 | 576 | 5.09 | 0.054 |
| Sand-Clay-Melt | 1 | 576 | 576 | 5.09 | 0.054 |
| Error | 8 | 906 | 113 | - | - |
| Total | 15 | 1,120,652 | - | - | - |
© 2020 by the authors. Licensee MDPI, Basel, Switzerland. This article is an open access article distributed under the terms and conditions of the Creative Commons Attribution (CC BY) license (http://creativecommons.org/licenses/by/4.0/).
Share and Cite
MDPI and ACS Style
Prabhakar, A.; Papanikolaou, M.; Salonitis, K.; Jolly, M. Minimising Defect Formation in Sand Casting of Sheet Lead: A DoE Approach. Metals 2020, 10, 252. https://doi.org/10.3390/met10020252
AMA Style
Prabhakar A, Papanikolaou M, Salonitis K, Jolly M. Minimising Defect Formation in Sand Casting of Sheet Lead: A DoE Approach. Metals. 2020; 10(2):252. https://doi.org/10.3390/met10020252
Chicago/Turabian StylePrabhakar, Arun, Michail Papanikolaou, Konstantinos Salonitis, and Mark Jolly. 2020. "Minimising Defect Formation in Sand Casting of Sheet Lead: A DoE Approach" Metals 10, no. 2: 252. https://doi.org/10.3390/met10020252
Note that from the first issue of 2016, this journal uses article numbers instead of page numbers. See further details here.