Article

Characteristics and Formation Tendency of Freckle Segregation in Electroslag Remelted Bearing Steel

State Key Laboratory of Advanced Metallurgy, University of Science and Technology Beijing, Beijing 100083, China
*
Author to whom correspondence should be addressed.
Metals 2020, 10(2), 246; https://doi.org/10.3390/met10020246
Submission received: 2 January 2020 / Revised: 1 February 2020 / Accepted: 7 February 2020 / Published: 12 February 2020
(This article belongs to the Special Issue Advances in Metal Casting Technology)

Abstract

:
Undesirable macro segregation defects, freckles, restrict the commercial production of large-sized electroslag remelting (ESR) bearing steel ingots through degradation of the mechanical properties and service lifetime. In order to clarify the freckle characteristics and formation tendency as well as the formation mechanism, freckles from an industrial large-sized GCr15SiMn ESR ingot were investigated through structural and compositional analysis, along with simulation calculation. The results show that freckles consist of (Si, Mn, Cr)-enriched equiaxed grains and occur in about the 1/2 radius region at the middle-upper part of the ESR ingot, where the secondary dendritic arm spacing (SDAS) and solidification front angle are large but cooling rate is small. The absolute value of relative Rayleigh number, Ra, also reaches its maximum in the 1/2 radius region, with a liquid fraction of 0.3–0.5, corresponding to the region where freckles form. Based on the experimental and simulation results, to evaluate the freckle formation in industrial-scale GCr15SiMn ESR ingots, the threshold value of relative Ra, a freckle criterion considering the compositional and thermal effects, was determined to be about −0.023.

1. Introduction

GCr15SiMn bearing steel is one of the most important special steels and is utilized to produce bearing rings and rollers that are applied widely in large equipment like tunnel boring machines, wind power equipment, precision machine tools, and so on. As the key parts of this equipment, excellent inner quality is strongly required for bearing steels to maximum the service life and reliability of bearing. With the increasing demand for high-quality and large-sized bearing steel, the electroslag remelting (ESR) process has been widely used as an important technology to produce bearing steel due to its superiority in the production of large-sized ingots and the improvement of solidification structure, cleanliness, and mechanical properties.
Freckles are a kind of unexpected but common channel- or stringer-like macro segregation defect. Furthermore, they are a typical reflection of solute inhomogeneity initiated by convective instabilities in the mushy zone during solidification [1] and appear as long black linear trails with a diameter of up to several millimeters. Freckles have received more and more attention because they often act as crack initiation sites and can dramatically reduce the mechanical properties and lifetime of products. It is obvious that freckles are harmful solidification defects, and those steel ingots with freckles have to be discarded because the freckles are practically impossible to eliminate thoroughly in the subsequent forging or heat treatment process. This can be attributed to these factors: (i) Large freckle channels and slow diffusion of solutes in the solid phase require an extremely long homogenizing treatment time (several years or even decades) and high treatment temperature (intensify liquation), (ii) it is difficult to eliminate micro pores and eutectic or primary carbide, (iii) freckles consist of equiaxed grains, and equiaxed grains in freckle channels cannot be eliminated through mechanical or heating treatment. The difficulty of preventing the formation of freckles has become a key limiting factor in increasing the production capability of large-sized ingots.
The study of freckle defects has attracted many researchers, and numerous studies have been conducted to clarify the freckle formation mechanism and to control them; however, these studies mainly focused on solidification systems like NH4Cl aqueous solutions, Pb-Sn and Al-Cu binary alloys, and Ni-based superalloy ingots produced through unidirectional solidification and single crystal solidification [2,3,4,5,6]. Cao et al. [7] studied the freckle formation of an Ni-Al-Ta alloy through the numerical modelling of vertically unidirectional solidification and found that freckle formation can be attributed to the density inversion induced by thermosolutal convection at the front of the solid/liquid interface. Guillemot, Schneider, and Zaloznik [8,9,10] developed mathematical models of macro segregation to predict the channel segregation, which were successful in the prediction of Sn-Pb, Sn-Bi, Ga-In, and Ni-based superalloys but did not work well to predict the channel segregation of steel ingots. Cao et al. [11] simulated and compared the channel segregation in alloys and carbon steels and found that alloying elements will strengthen channel segregation by enhancing the density difference and natural convection strength. However, steel ingots prepared through pouring liquid steel into a sand mold are distinctly different from ESR steel ingots, and the modelling parameters are also inapplicable for the ESR process. Rad et al. [12] predicted the formation of A-segregation, also commonly referred to as channel segregation or freckles, when the melt is cooled from below in steel sand castings with different shapes. This is also inapplicable for ESR steel ingots because the thermal parameters are different for the steel sand process. Moreover, the ingot size and mold design also generate influence on freckle segregation formation [13].
It is essential to predict freckle formation in order to avoid it. Mathematical modelling is one typical method, but it consumes excessive time (even years) for large-sized ingot because it requires a small mesh size [14]. Therefore, several criterions have been proposed to predict the freckle tendency. The early prediction approaches were constructed based only on the thermal gradient, G, and grain growth rate, R, represented by the form of GmRn. Most of these researches are for Ni-based superalloys [5,15]. A few researchers, like Suzuki [16], proposed the criterion for freckle formation in steel ingots based on GR2.1. It should be stressed that this criterion form has a deficiency, which is that it does not take into account the steel compositions, which can have an important influence on solute diffusion and then on the density and viscosity, buoyancy force, and frictional force. In fact, freckle formation is closely related to the competing effect of buoyancy force and frictional force. In comparison to the criterion form of GmRn, the non-dimensional Rayleigh number receives more attention because it does not only take account of thermal conditions like cooling rate, but also incorporates thermal properties related to alloy compositions like liquid density inversion and viscosity, and also the permeability of the mushy zone in relation to solidification front angle and dendrite structure. In most of cases, this criterion form was also applied in freckle formation in unidirectionally solidified Ni-based alloys and some non-ferrous alloys rather than steel ingots [12,17,18,19,20,21,22].
Overall, many efforts have been made to characterize freckles, clarify their formation mechanism, and predict their formation. On the one hand, most of these studies pay attention to freckles in model alloy or Ni-based superalloy ingots produced through unidirectional solidification or single crystal solidification. Even though there have been some studies on freckles in steel ingots, the steel ingots were always small experimental ingots produced through steel or sand molds. Small ingots typically do not present freckles to the same extent as larger ingots because of the distinct solidification conditions. Specially, freckles in industrial ESR steel ingots may show differences in characteristics and formation tendency from those found in small sand mold or steel mold ingots or Ni-based superalloy ingots from unidirectional solidification or single crystal solidification due to the distinction in the solidification process, chemical composition, and ingot size. Few studies have revealed the differences in characteristics and formation tendencies of freckles in industrial ESR steel ingots. However, it is important to make these difference clear for the production of freckle-free, large-sized ESR steel ingots.
In the current study, using experimental and numerical investigation, freckles in industrial ESR bearing steel ingots with a diameter of up to 745 mm and a weight of up to 5 tons were investigated, with the aim of enhancing the fundamental understanding of freckle characteristics and formation mechanisms, and to predict the freckle formation tendency in industrial ESR bearing steel ingots.

2. Materials and Methods

2.1. Materials Preparation and Characterization

A GCr15SiMn bearing steel ingot with a diameter of 500 mm, produced through a vacuum induction melting process, was used as a consumable electrode for the ESR process. After ESR, a GCr15SiMn bearing steel ESR ingot with a top diameter of 700 mm, a bottom diameter of 745 mm, and a height of about 1650 mm was obtained. The chemical composition of the ESR ingot were analyzed through X-ray fluorescence (XRF) and are listed in Table 1.
As per the schematic sampling diagram shown in Figure 1, in order to reveal the freckles in the ESR ingot, the ingot was first cut transversely into three cylinders, and then all the cylinders were cut longitudinally along the axial plane. Three semi-cylinders from the same side of the longitudinal section were then cut into slices with a thickness of 30 mm to reveal freckles through etching with 50 pct HCl aqueous solution. Two samples were cut from the bottom and top of a freckle channel, and were then polished and etched to reveal the dendritic structure of the freckle and the structure around it through an optical microscope. Meanwhile, 15 samples with a size of 30 mm × 30 mm × 30 mm were cut from the bottom, middle, and top parts along the radial direction from the center, 1/3 radius, 1/2 radius, 2/3 radius, and at the edge of the ESR ingot. All these 15 samples were ground using SiC abrasive paper and polished on a wheel cloth using diamond lapping pastes with a size of 1.5 μm, and thereafter etched using 5 pct trinitrophenol to reveal the solidification structure characteristics through scanning electron microscope (SEM, Carl Zeiss, Inc., Oberkochen, Germany) and energy dispersive spectrometry (EDS) analysis. Microhardness measurement was carried out using a Vickers microhardness tester under a load of 50 g with a dwell time of 15 s, with at least 5 measurements on each sample. The secondary dendritic arm spacing (SDAS) and solidification front angle were measured using ImageJ software.

2.2. Thermodynamic and Thermo-Physical Calculation

In order to clarify the freckle formation, it is necessary to learn about the solute distribution between liquid and solid during solidification. However, it is almost impossible to achieve the dynamic change of solutes through experiment. The Scheil module of the Thermo-Calc software (2016b, Thermo-Calc Software AB, Stockholm, Sweden) can be employed to calculate the solute change with solidification. The module was established based on the Scheil–Gulliver model Equation (1), with the assumption of infinitely fast diffusion of solute elements in the liquid phase but without diffusion in the solid phase. However, in fact, back diffusion in the solid phase of interstitial elements like C and P exists. It is therefore the modified Scheil module of the Thermo-Calc software that takes into account the back diffusion, and δ→γ transformation was adopted to predict the composition and density changes of the liquid phase with solidification using the simplified GCr15SiMn steel system, Fe–1.0C–0.56Si–1.06Mn–1.53Cr–0.018P.
C l = C 0 ( 1 f s ) ( k 0 1 )
where, C l and C 0 are the liquid composition at a given temperature and the initial liquid composition, respectively, f s is the solid fraction (= 1− f L , f L is the liquid fraction ), k 0 is the distribution coefficient defined as C s / C l , and C s is the solid composition.
Liquid viscosity is also necessary for the investigation and prediction of freckles but is difficult obtain through experimental measurements. Java-based materials properties software (JMatPro 7.0, Sente Software Ltd., Guildford, UK) provides a method to learn about the properties of an alloy or an individual phase within a specification zone, such as the liquid phase in the mushy zone, which is always beyond the measurement capability. For an individual phase in a multi-component system, properties like viscosity can be calculated through a simple pair-wise mixture model Equation (2).
P = i x i P i 0 + i j > 1 x i x j ν Ω i j ν ( x i x j ) ν
where P is the property of the phase, P i 0 is the property of the phase in the pure element, i, Ω i j ν is a binary interaction parameter dependent on the value of ν, and xi and xj are the mole fractions of elements i and j in the phase. Both P i 0 and Ω i j ν are temperature dependent and it is possible to include ternary or higher order effects.

3. Results and Discussion

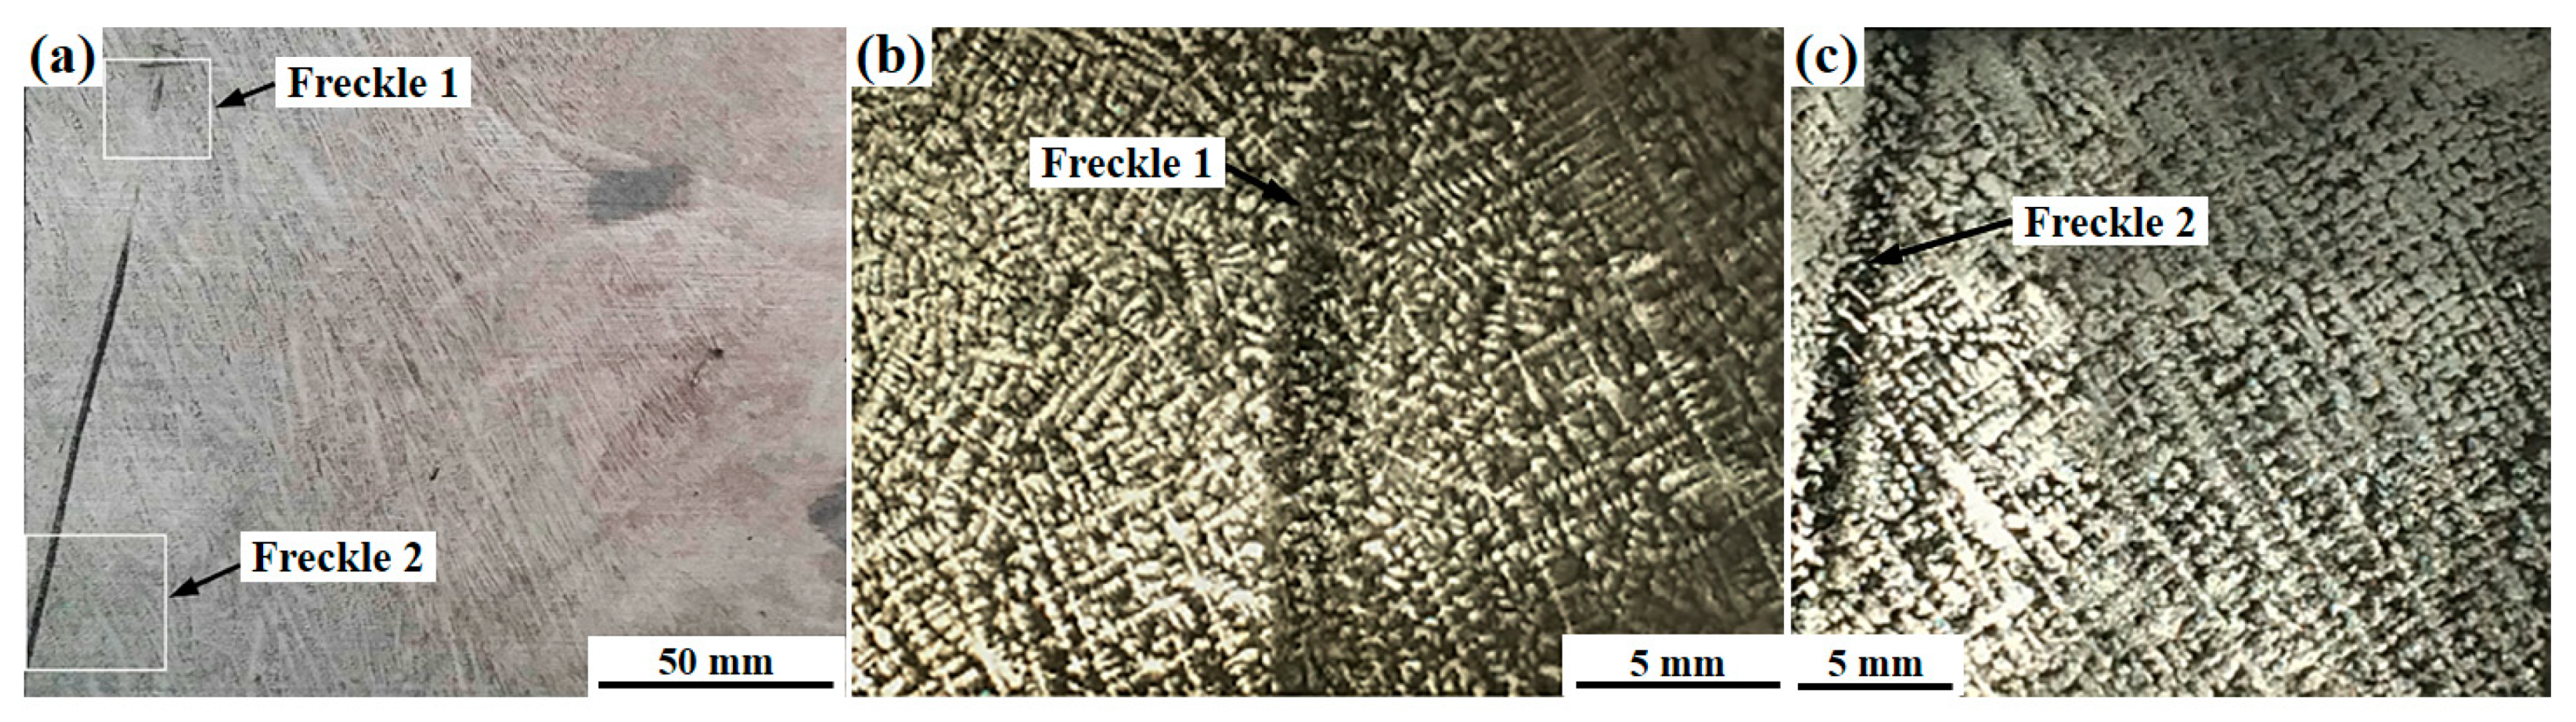
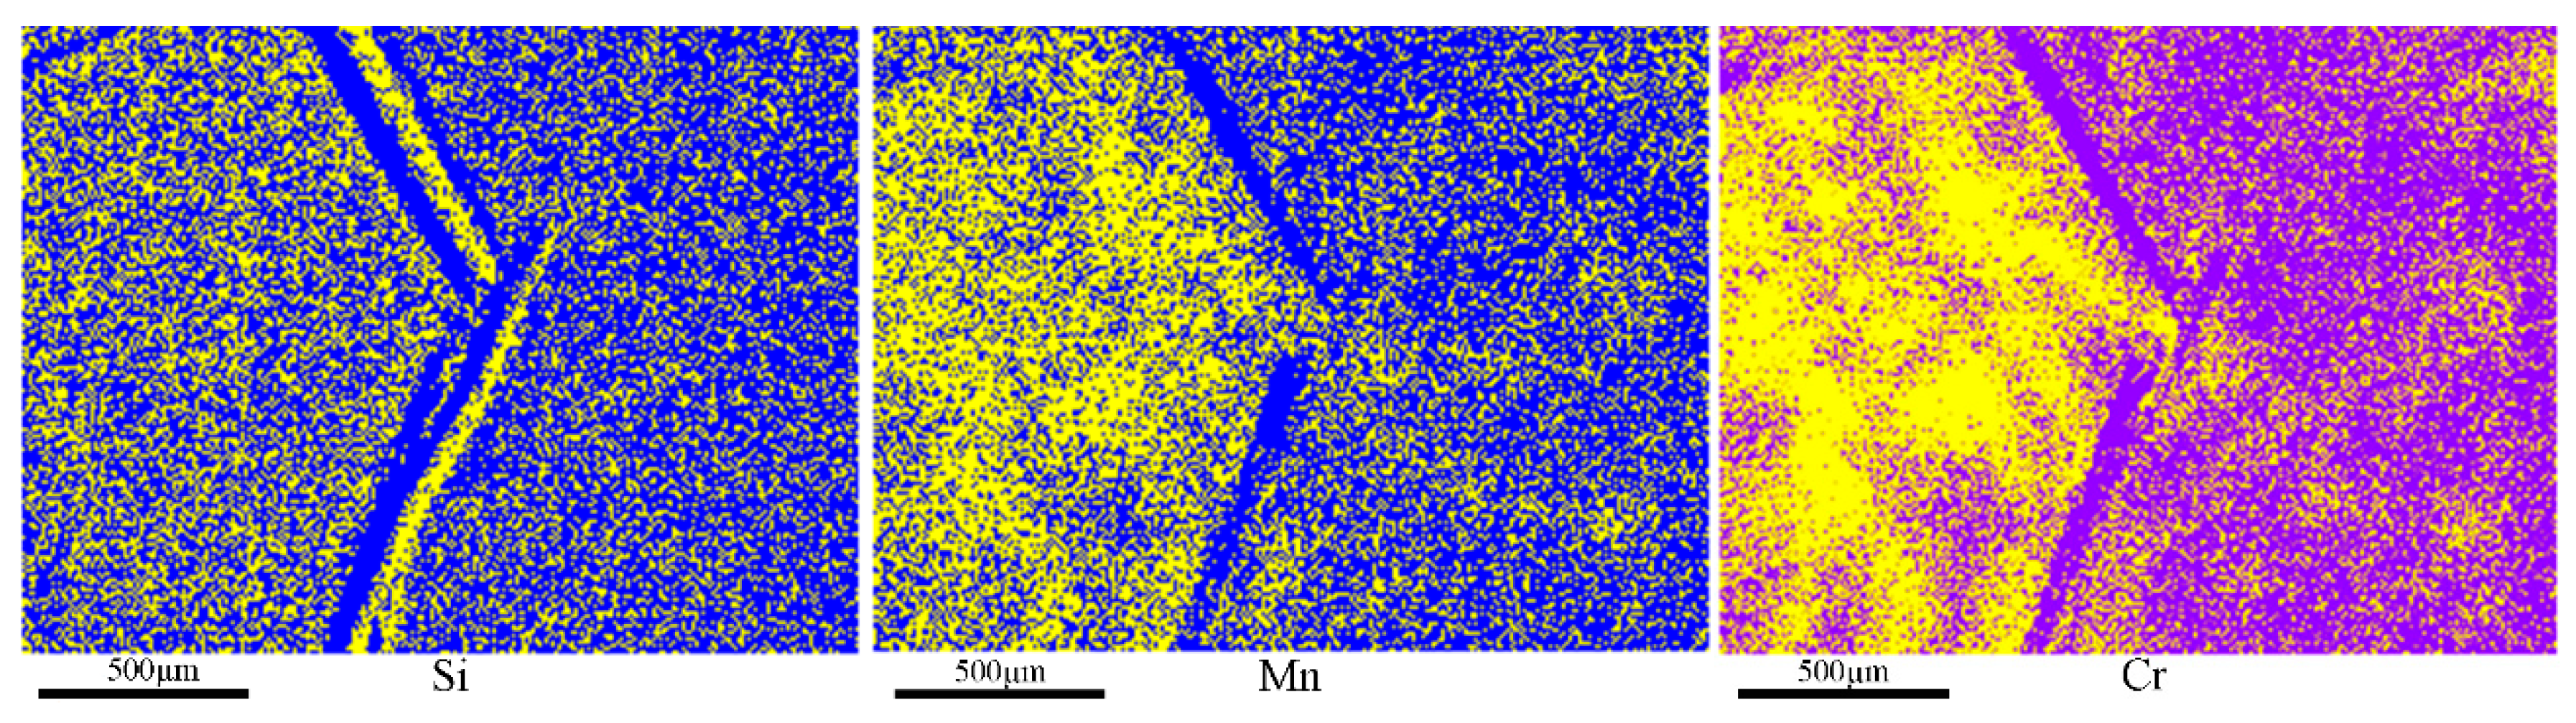
3.1. Characteristics of Freckles

According to the etch results of the GCr15SiMn ESR ingot, freckles can only be found at the region around 1/2–2/3 radius from 3/5 height to the top rather than in the center and edge of the ESR ingot, which is different from the freckle position in Ni-based superalloy, where freckles are usually found in the edge or center of the ingot [2,5,23,24,25]. This phenomenon is related to the solidification process.
Figure 2 displays the macro morphology of a freckle channel. It can be seen that the freckle extends with a slight slope from the lower left to the upper right with a length of more than 100 mm, but the grains grow along the direction from the lower right to the upper left, which is fundamentally the same as the direction of the thermal gradient. This suggests that formation of freckles cannot be attributed to the liquid flow along the solidification front.
In order to specify the characteristics of freckles, the upper and lower parts from a freckle channel, denoted as Freckle 1 and Freckle 2, were cut, polished, and etched to reveal the dendritic structure. As shown in Figure 2b, the dendritic structure from Freckle 1 (upper right part of the freckle channel) is basically the same as its surrounding matrix; only part of the dendrites were etched or remelted by the upward flow of the segregated interdendritic liquid during solidification. In comparison with Freckle 1, as shown in Figure 2c, Freckle 2 displays an unwanted misoriented equiaxed dendritic structure, which has a feature distinct from the surrounding matrix, existed as an obvious and developed columnar dendritic structure; this phenomenon is consistent with that reported in [17]. The equiaxed dendritic structure in the lower part of the freckle channel may originate from the delayed growth of dendrites or from remaining dendrite fragments that detached from the main branch due to local remelting. The mechanism will be discussed below.
In order to further identify the freckle characteristics and compare the differences between freckle and matrix, the compositions and elemental mappings of freckles and the surrounding matrix were examined through EDS analysis and are presented in Figure 3 and Table 2. It can be seen from Figure 3 that there are more Si, Mn, and Cr elements in the freckle region (left part of each figure) than in the matrix. Table 2 further presents the quantitative results. It should be noted that each composition listed in Table 2 is the average of at least five measurements. Meanwhile, the standard deviations (SDs) are also listed in the table. Those elements, like Si, Mn, and Cr, with extremely slow diffusion and less density than Fe enriched in the freckle channel, especially Cr, which presents the largest segregation among all elements. This indicates that the freckle formation in the Gr15SiMn ESR ingot correlates closely with element segregation. The results will be discussed in the last section.
The microhardness of the freckle and the surrounding matrix were also measured at room temperature and are compared in Table 2. The freckle presents greater microhardness, which is 35% more than the matrix. Variation of microhardness is closely related to the transition of the dendritic structure. Generally, equiaxed grain structure has higher microhardness than columnar grain structure because it has finer grains [26]. Due to the great difference in microhardness between freckle and matrix, the interface between freckle and matrix is likely to be the origin of fracture initiation, along with stress concentration when applying great mechanical or thermal loads to the product.

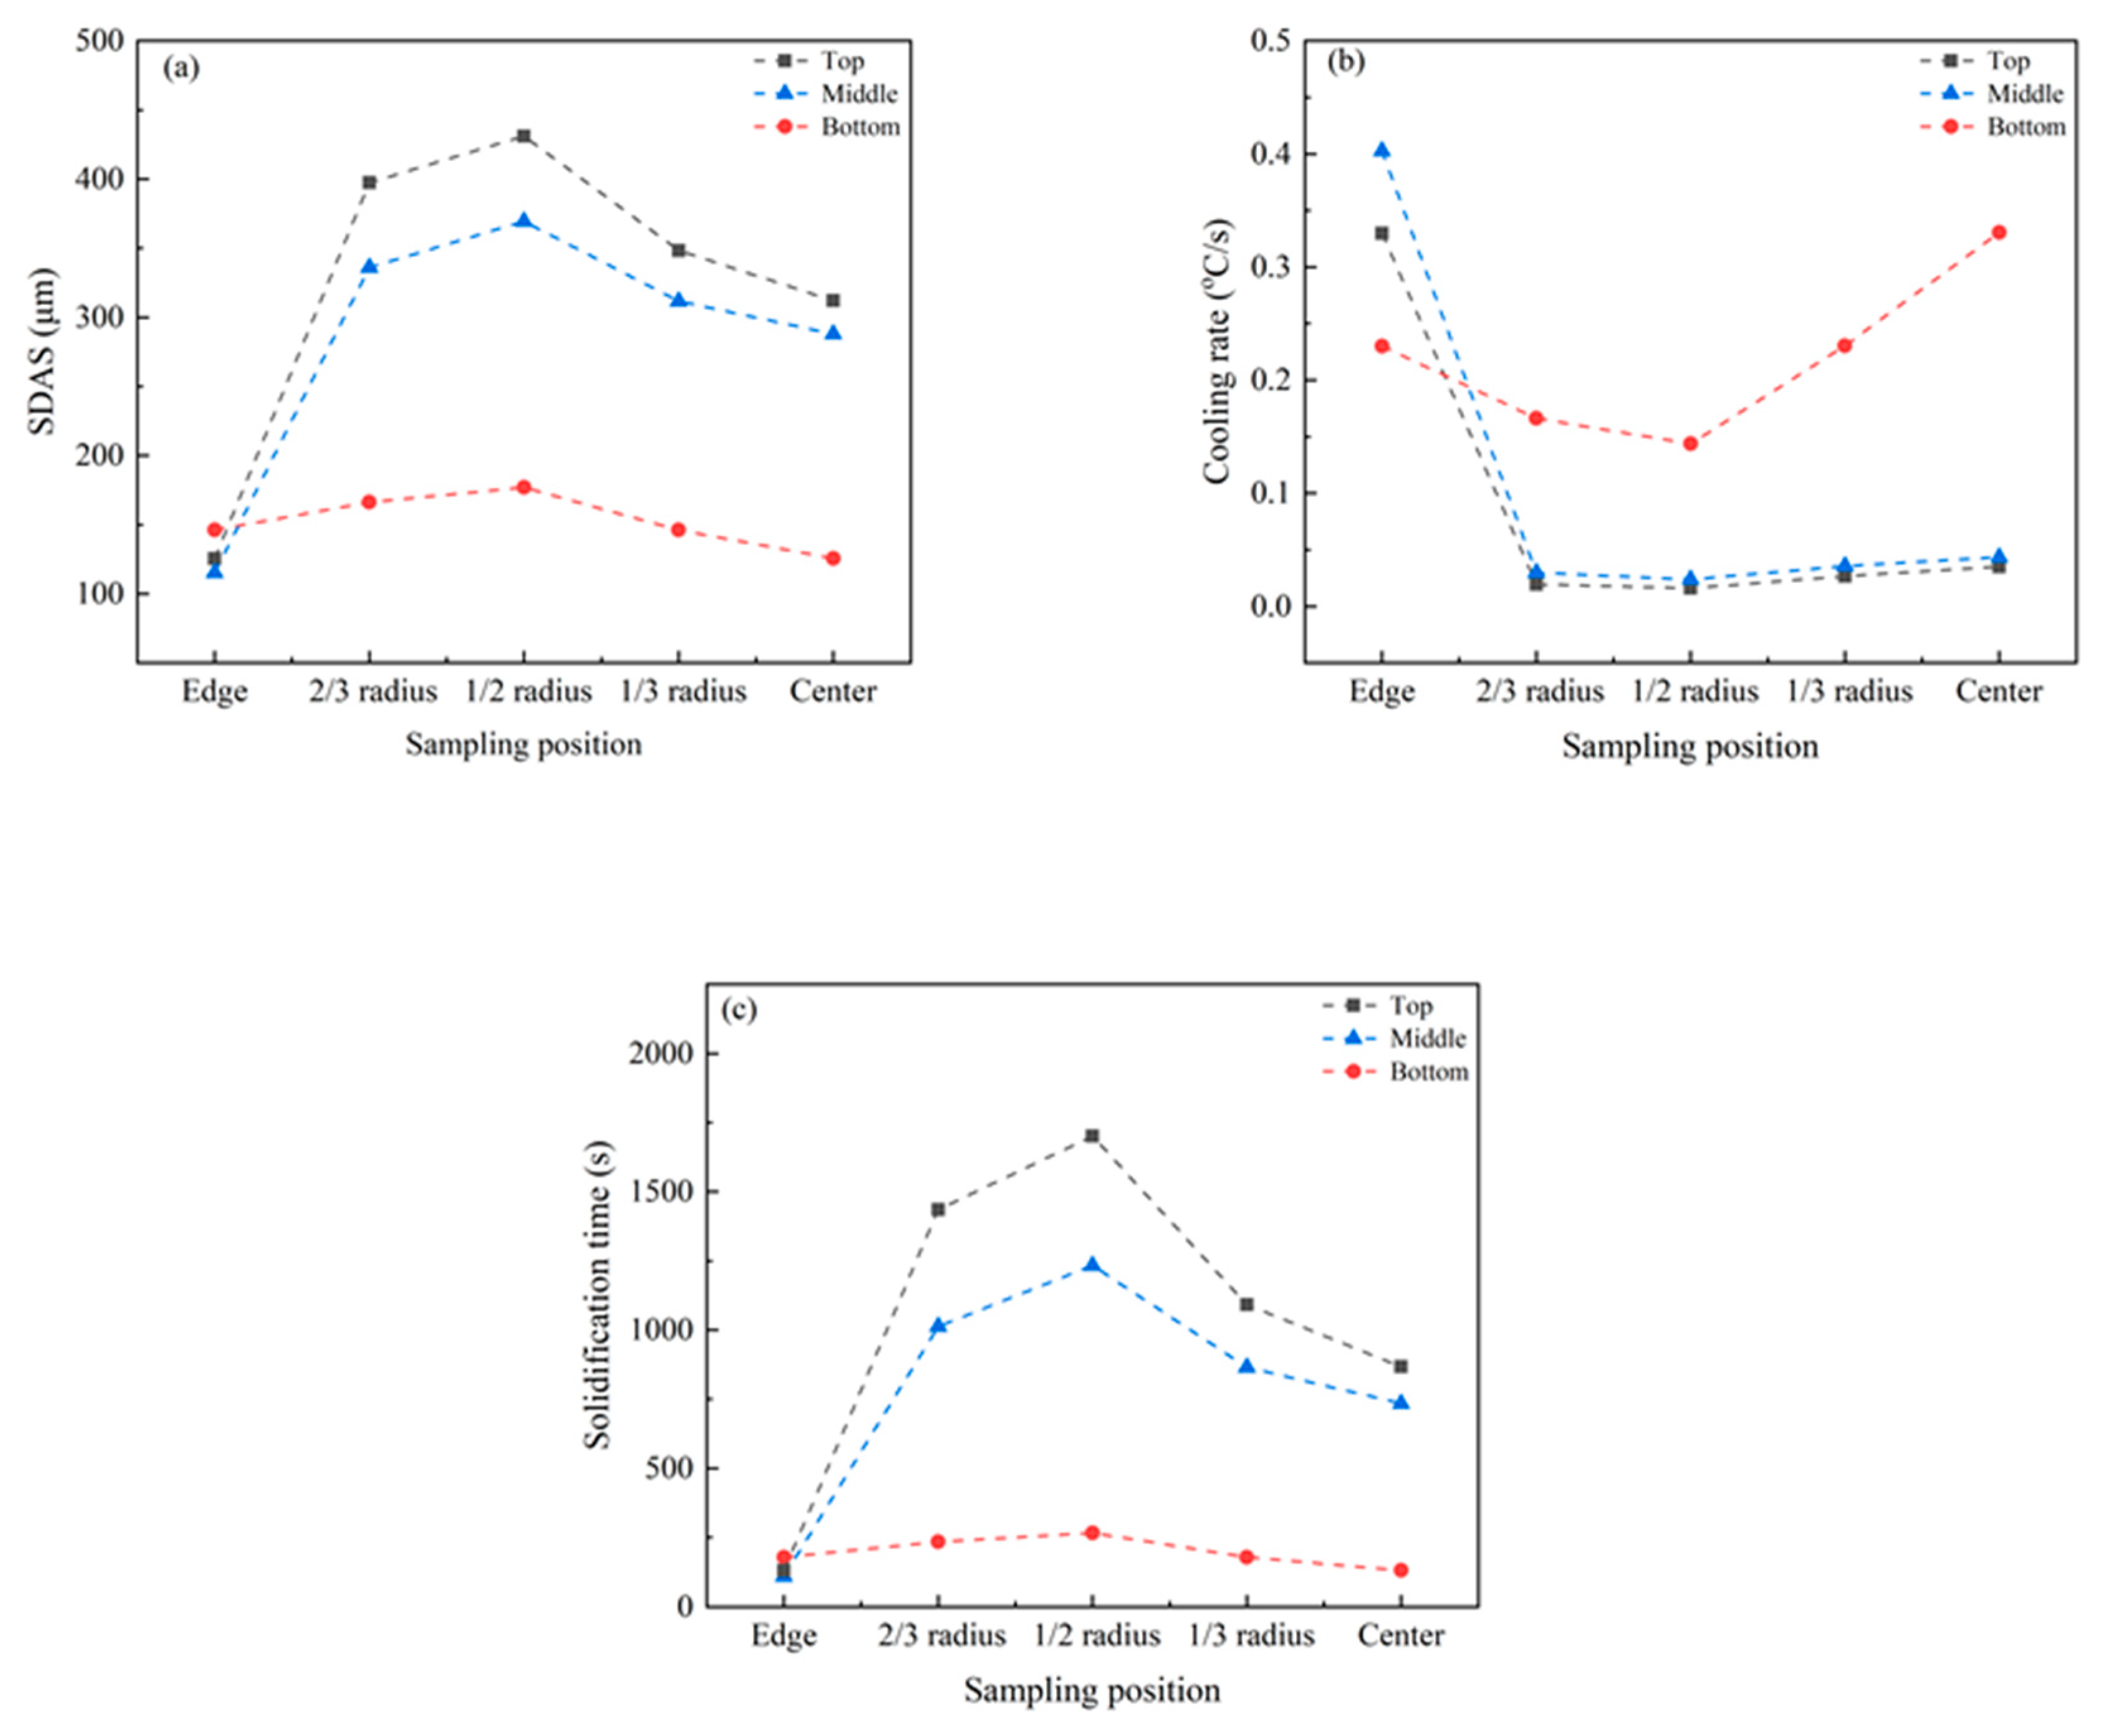
3.2. SDAS and Solidification front Angle

It is necessary to learn about the SDAS and solidification front angle to characterize the solidification at different positions. As described in the experimental section, SDAS can be acquired through measuring the etched dendritic structure. Thomas et al. [27] derived a mathematical expression to predict SDAS based on reported experimental data, which shows a good agreement with measured values. According to Thomas’s research, back calculation of the cooling rate, C R , of the GCr15SiMn ESR ingot can be achieved using measured SDAS through Equation (3).
λ 2 = ( 21.53 9.40 C 0 , C ) ( ( T L T S ) / C R ) ( 0.4 + 0.08 C 0 , C )  
where,   C R is the cooling rate, °C/s; λ 2 is the SDAS, μm; C 0 , C is the nominal carbon content of the GCr15SiMn steel ingot, wt pct; and T L and T S are the liquidus and solidus temperatures, respectively, °C, which can be calculated using Thermo-Calc software based on the steel compositions. ( T L T S ) / C R is the local solidification time.
Figure 4a shows the measured SDAS at various positions of the GCr15SiMn ESR ingot. It can be seen that SDAS increases first and then decreases from the edge to the center of the ESR ingot. Meanwhile, SDAS tends to increase from the bottom to the top of the ESR ingot. In spite of this, all structures from the bottom, middle, and top parts of the ESR ingot present maximum SDAS at the position of the 1/2 radius region. The cooling rate, shown in Figure 4b, gives an opposite change to SDAS, but the local solidification time, shown in Figure 4c, gives a similar change to SDAS. The changes of SDAS, cooling rate, and solidification time can be caused by the cooling mode of the ESR process. As we know, cooling of the ESR furnace is achieved through water cooling of the mold wall and bottom water tank; as a result, the cooling effect of the bottom and the region near the mold wall is larger. The cooling effect decreases gradually with increasing distance from the bottom and edge. The cooling effect from the bottom water tank becomes particularly weaker for the middle and top of large ESR ingots, so the cooling rate and solidification time are close to each other for the middle and top, and, in the meantime, the dendritic structure becomes coarse. Moreover, for large-sized ESR ingots, there is no fixed heat transfer direction in the center, and equiaxed dendritic structures are always formed in this region. However, for the region of 1/2 radius, the heat transfer direction is fixed and the thermal gradient is close to the center (especially in the middle and top regions) due to the large diameter of the ESR ingot, so this is where the coarse columnar dendritic structures are developed.
Solidification front angle,   θ , which is defined as the angle between the solidification front and the horizontal direction, is also a key factor of freckle formation and can be obtained through measuring the angle between the growth direction of the primary dendrite and the vertical direction. Table 3 shows the measured solidification front angle. It can be seen that the solidification front angle as a whole tends to decrease from the edge to the center regions of ESR ingots. The primary dendrites grow towards the pool; the pool is almost right above the primary dendrites in the center of the bottom of the mold and, therefore, the solidification front angle is small in this region. With an increase in distance from the center, the pool is in the upper right or left of the primary dendrites, so the solidification front angle increases. However, the thermal gradients tend to be close to each other, with their position near the center, and the solidification front angle also decreases slowly. In association with freckles found at the ~1/2–2/3 radius region, it can be concluded, to a certain extent, that freckle formation is related to a large solidification front angle. This is also consistent with research from Beckermann and Ramirez [17,18], who found that an increase of solidification front angle could strengthen the formation potential of freckles based on their study on freckles in Ni-based superalloy.

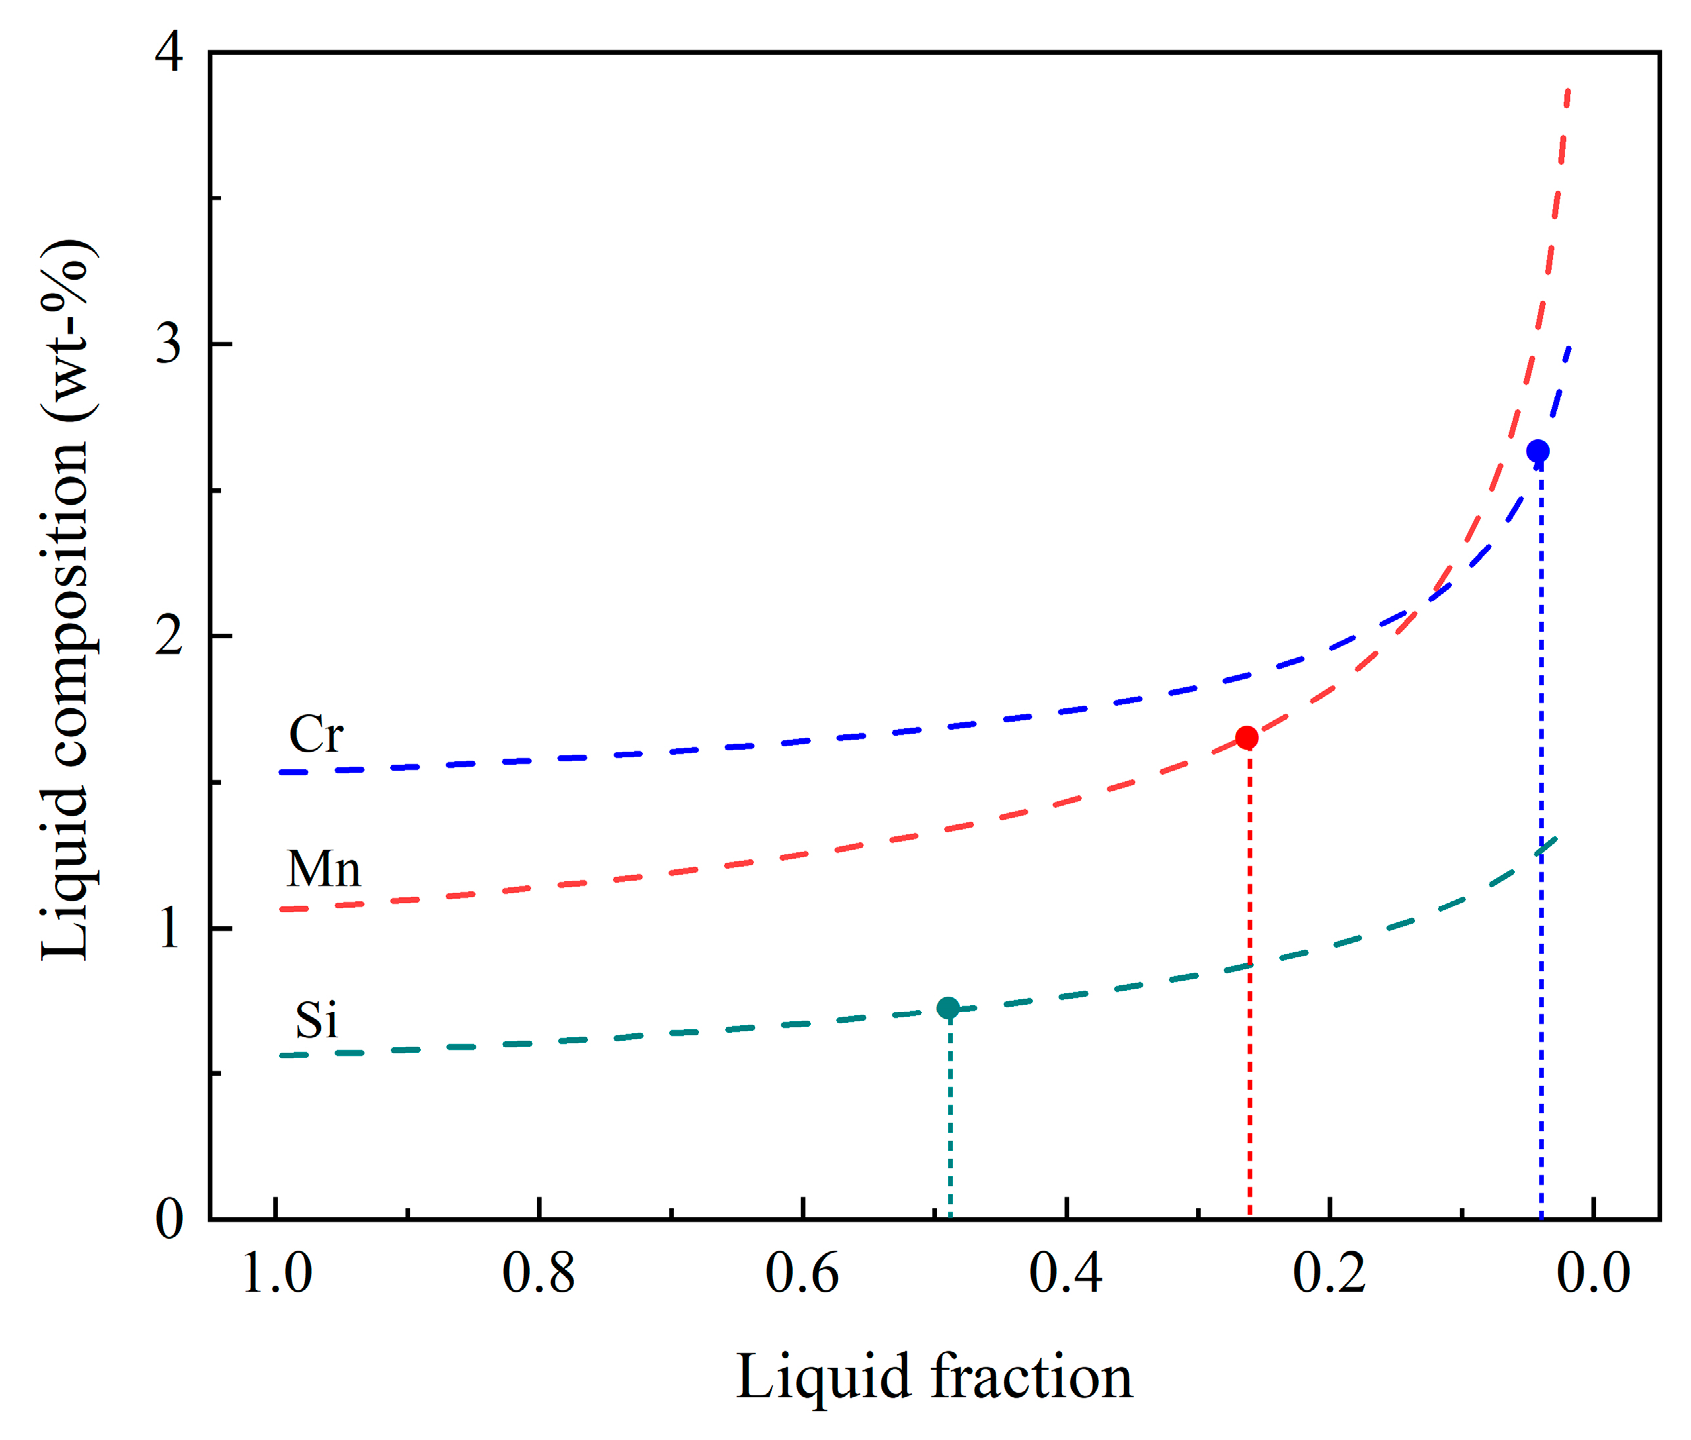
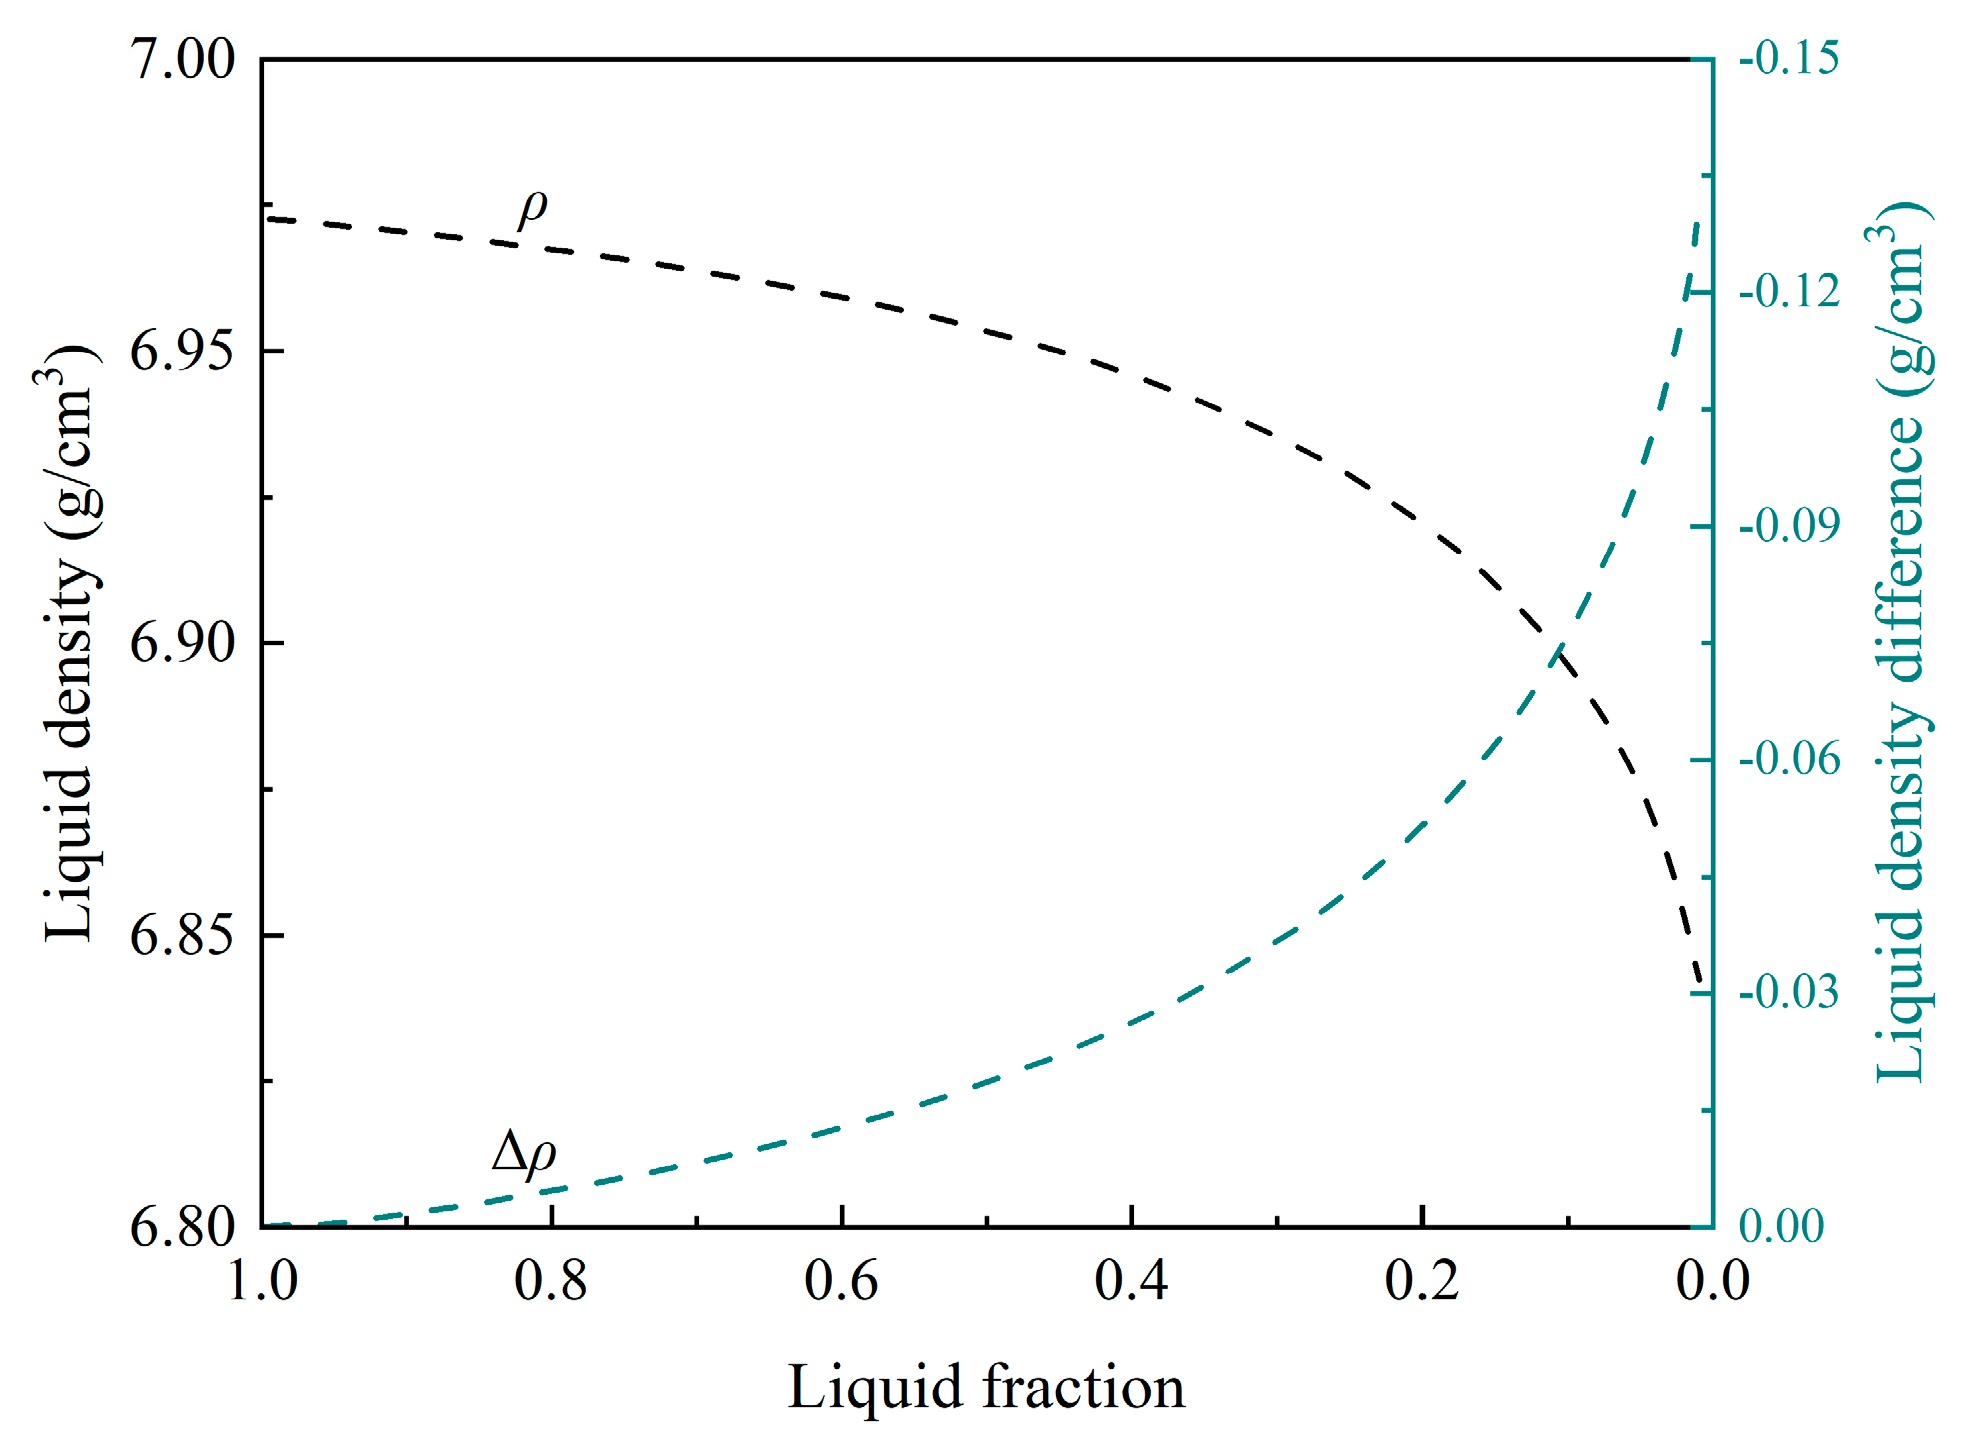
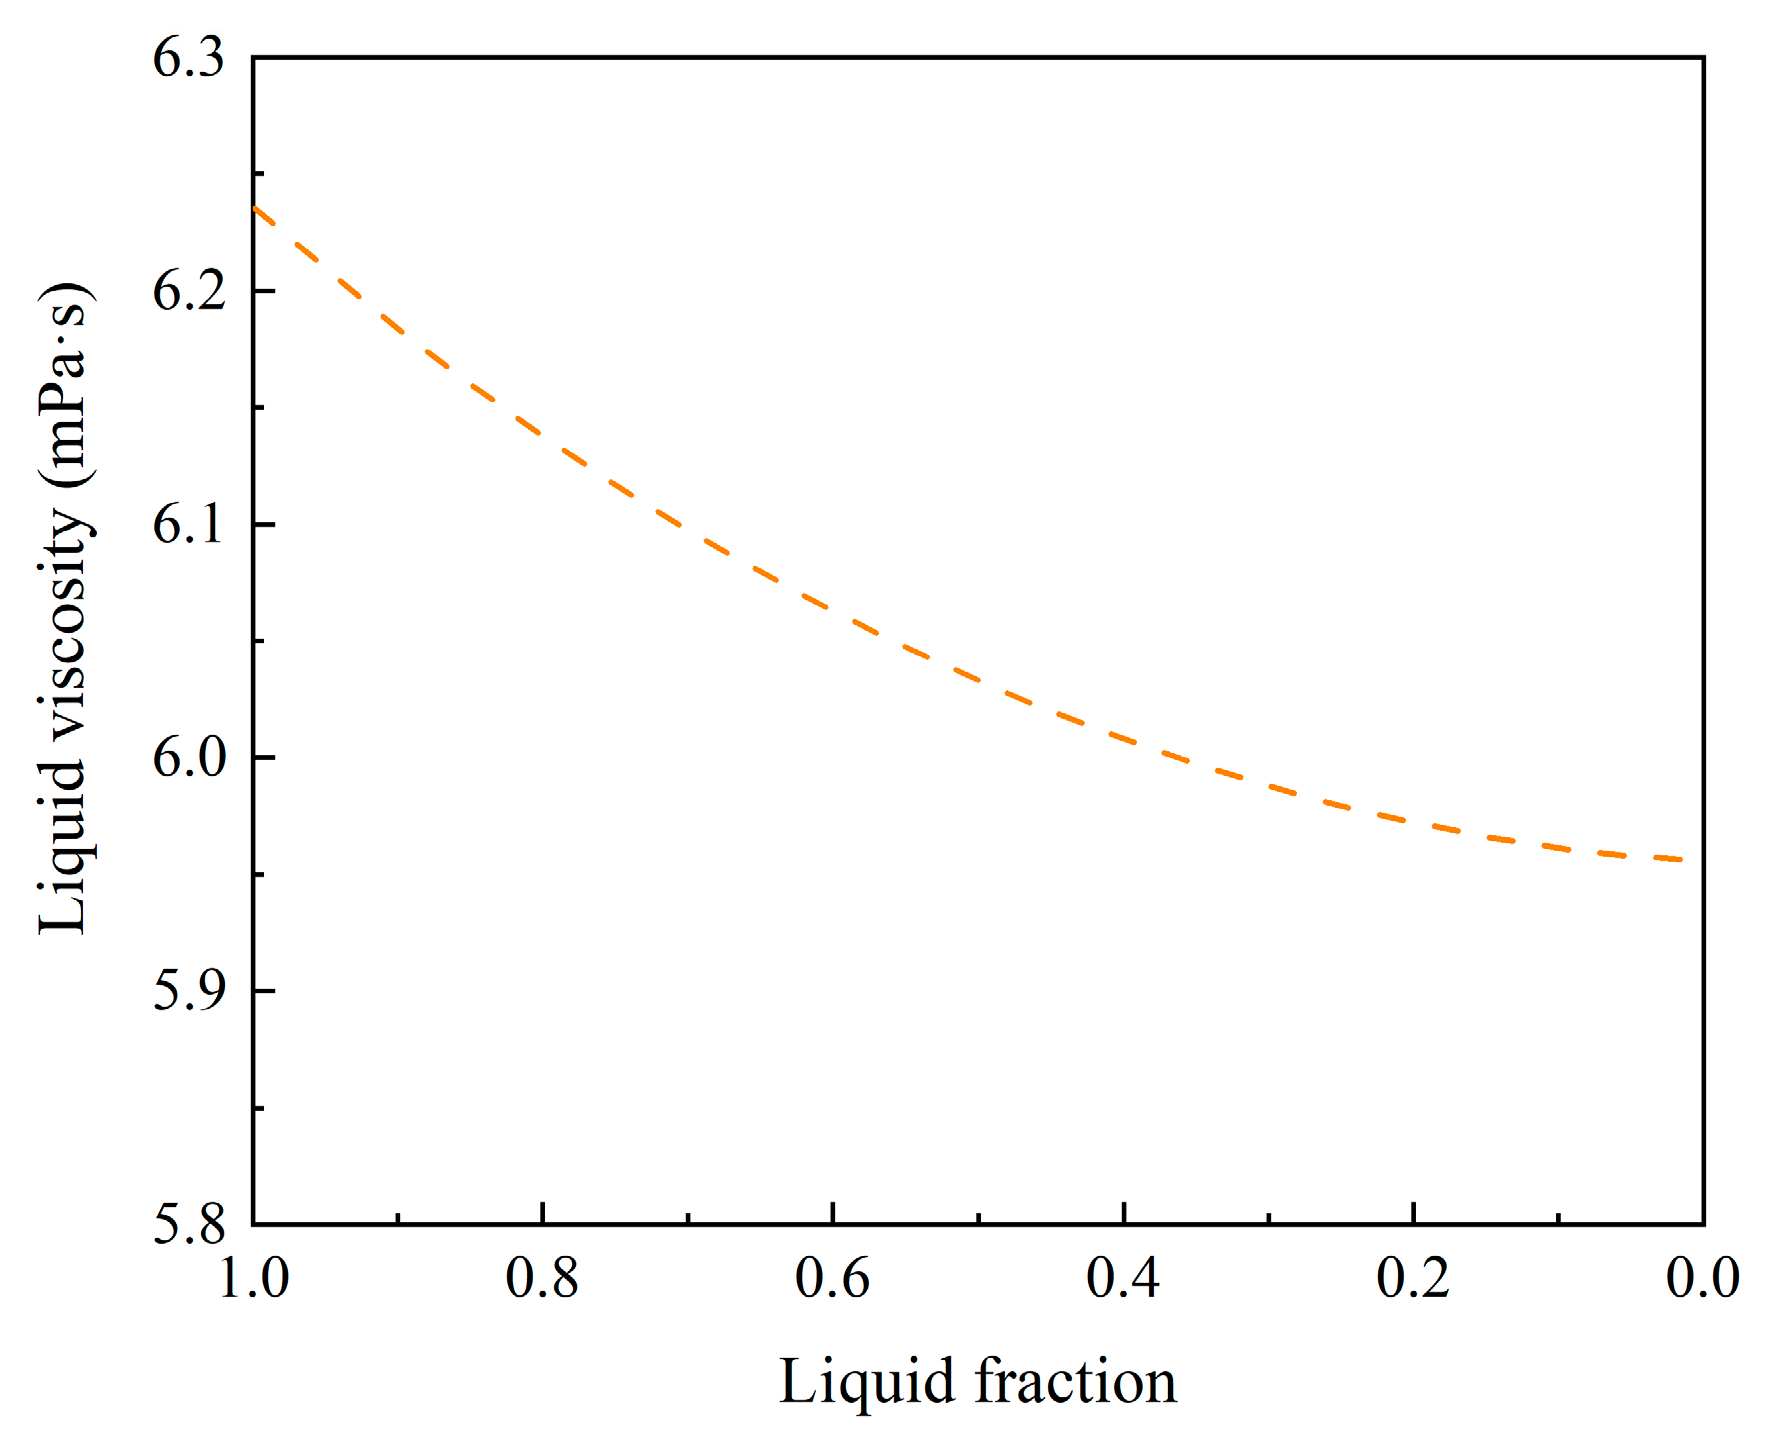
3.3. Compositions and Thermal-Physical Properties of Liquid

The calculated liquid compositions (which can be viewed as interdendritic liquid compositions), using the modified Scheil module of the Thermo-Calc software as a function of liquid fraction, f L , is shown in Figure 5. It can be observed that there are various increases of Si, Mn, and Cr concentrations with solidification. The Mn and Cr concentrations, especially, show a larger increase with the decrease of liquid fraction. This can be attributed to the lower densities of Si, Mn, and Cr compared to Fe; they are rejected into the liquid phase with solidification. As a result, the first-solidified part has relatively low concentrations of these light solutes, and many solutes enrich in the remaining liquid phase. In comparison with the measured compositions shown in Table 2, it seems the Mn and Si profiles are reasonable, but the Cr profile is underestimated in the range with relatively low liquid fraction. This can also be verified through the determination of the liquid fraction range for freckle formation with measured compositions in Table 2. According to Figure 5, if the Cr concentration is used, the lower limit of the liquid fraction for freckle formation is only 0.04 (almost complete solidification), which is, in fact, impossible. However, when the Si and Mn concentrations are used, the liquid fraction range for freckle formation can be estimated to be 0.27–0.49, which agrees, to some extent, with the reported liquid fractions of 0.3–0.5 [19], 0.3–0.6 [24,28], 0.4–0.6 [20,29,30], and 0.4–0.7 [31] for freckle formation in Ni-based superalloy.
The modified Scheil module of the Thermo-Calc software was also used to estimate the variations of interdendritic liquid density ,   ρ , and the density difference, Δ ρ (= ρ 0 ρ , representing liquid density inversion), between the density at liquidus temperature, ρ 0 (calculated at the liquidus temperature and solute concentrations corresponding to the nominal compositions), and local liquid density, ρ , at a certain temperature of T during solidification. The estimation takes volume shrinkage, compositional variation, phase transition, and back diffusion of the interstitial elements into account to improve its accuracy. Liquid density and density difference as functions of liquid fraction are plotted in Figure 6. An obvious decrease in liquid density and an increase in liquid density difference can be found with solidification, which can be attributed to the rejection of solutes into the interdendritic liquid. This also indicates the enhancement of segregation with a decrease in liquid fraction.
According to the study from Hirai [32], the kinematic viscosity, ν , of liquid is proportional to the liquid density. For steel containing more alloy elements, the solute concentrations of the interdendritic liquid phase increase fast with solidification. This also means viscosity decreases with the decrease of liquid density. As a result, a greater number of light alloy elements in steel decreases the density and, subsequently, the liquid viscosity. The viscosity can affect the interdendritic liquid flow. It is vitally important to know the liquid viscosity in order to understand the liquid flow behavior of the mushy zone. It is barely possible to experimentally measure the liquid viscosity in the mushy zone. Figure 7 presents the kinematic viscosity of the interdendritic liquid, calculated using JMatPro software with decreasing liquid fraction. It can be observed that the viscosity decreases with solidification, which will strengthen the flowability of the interdendritic liquid.

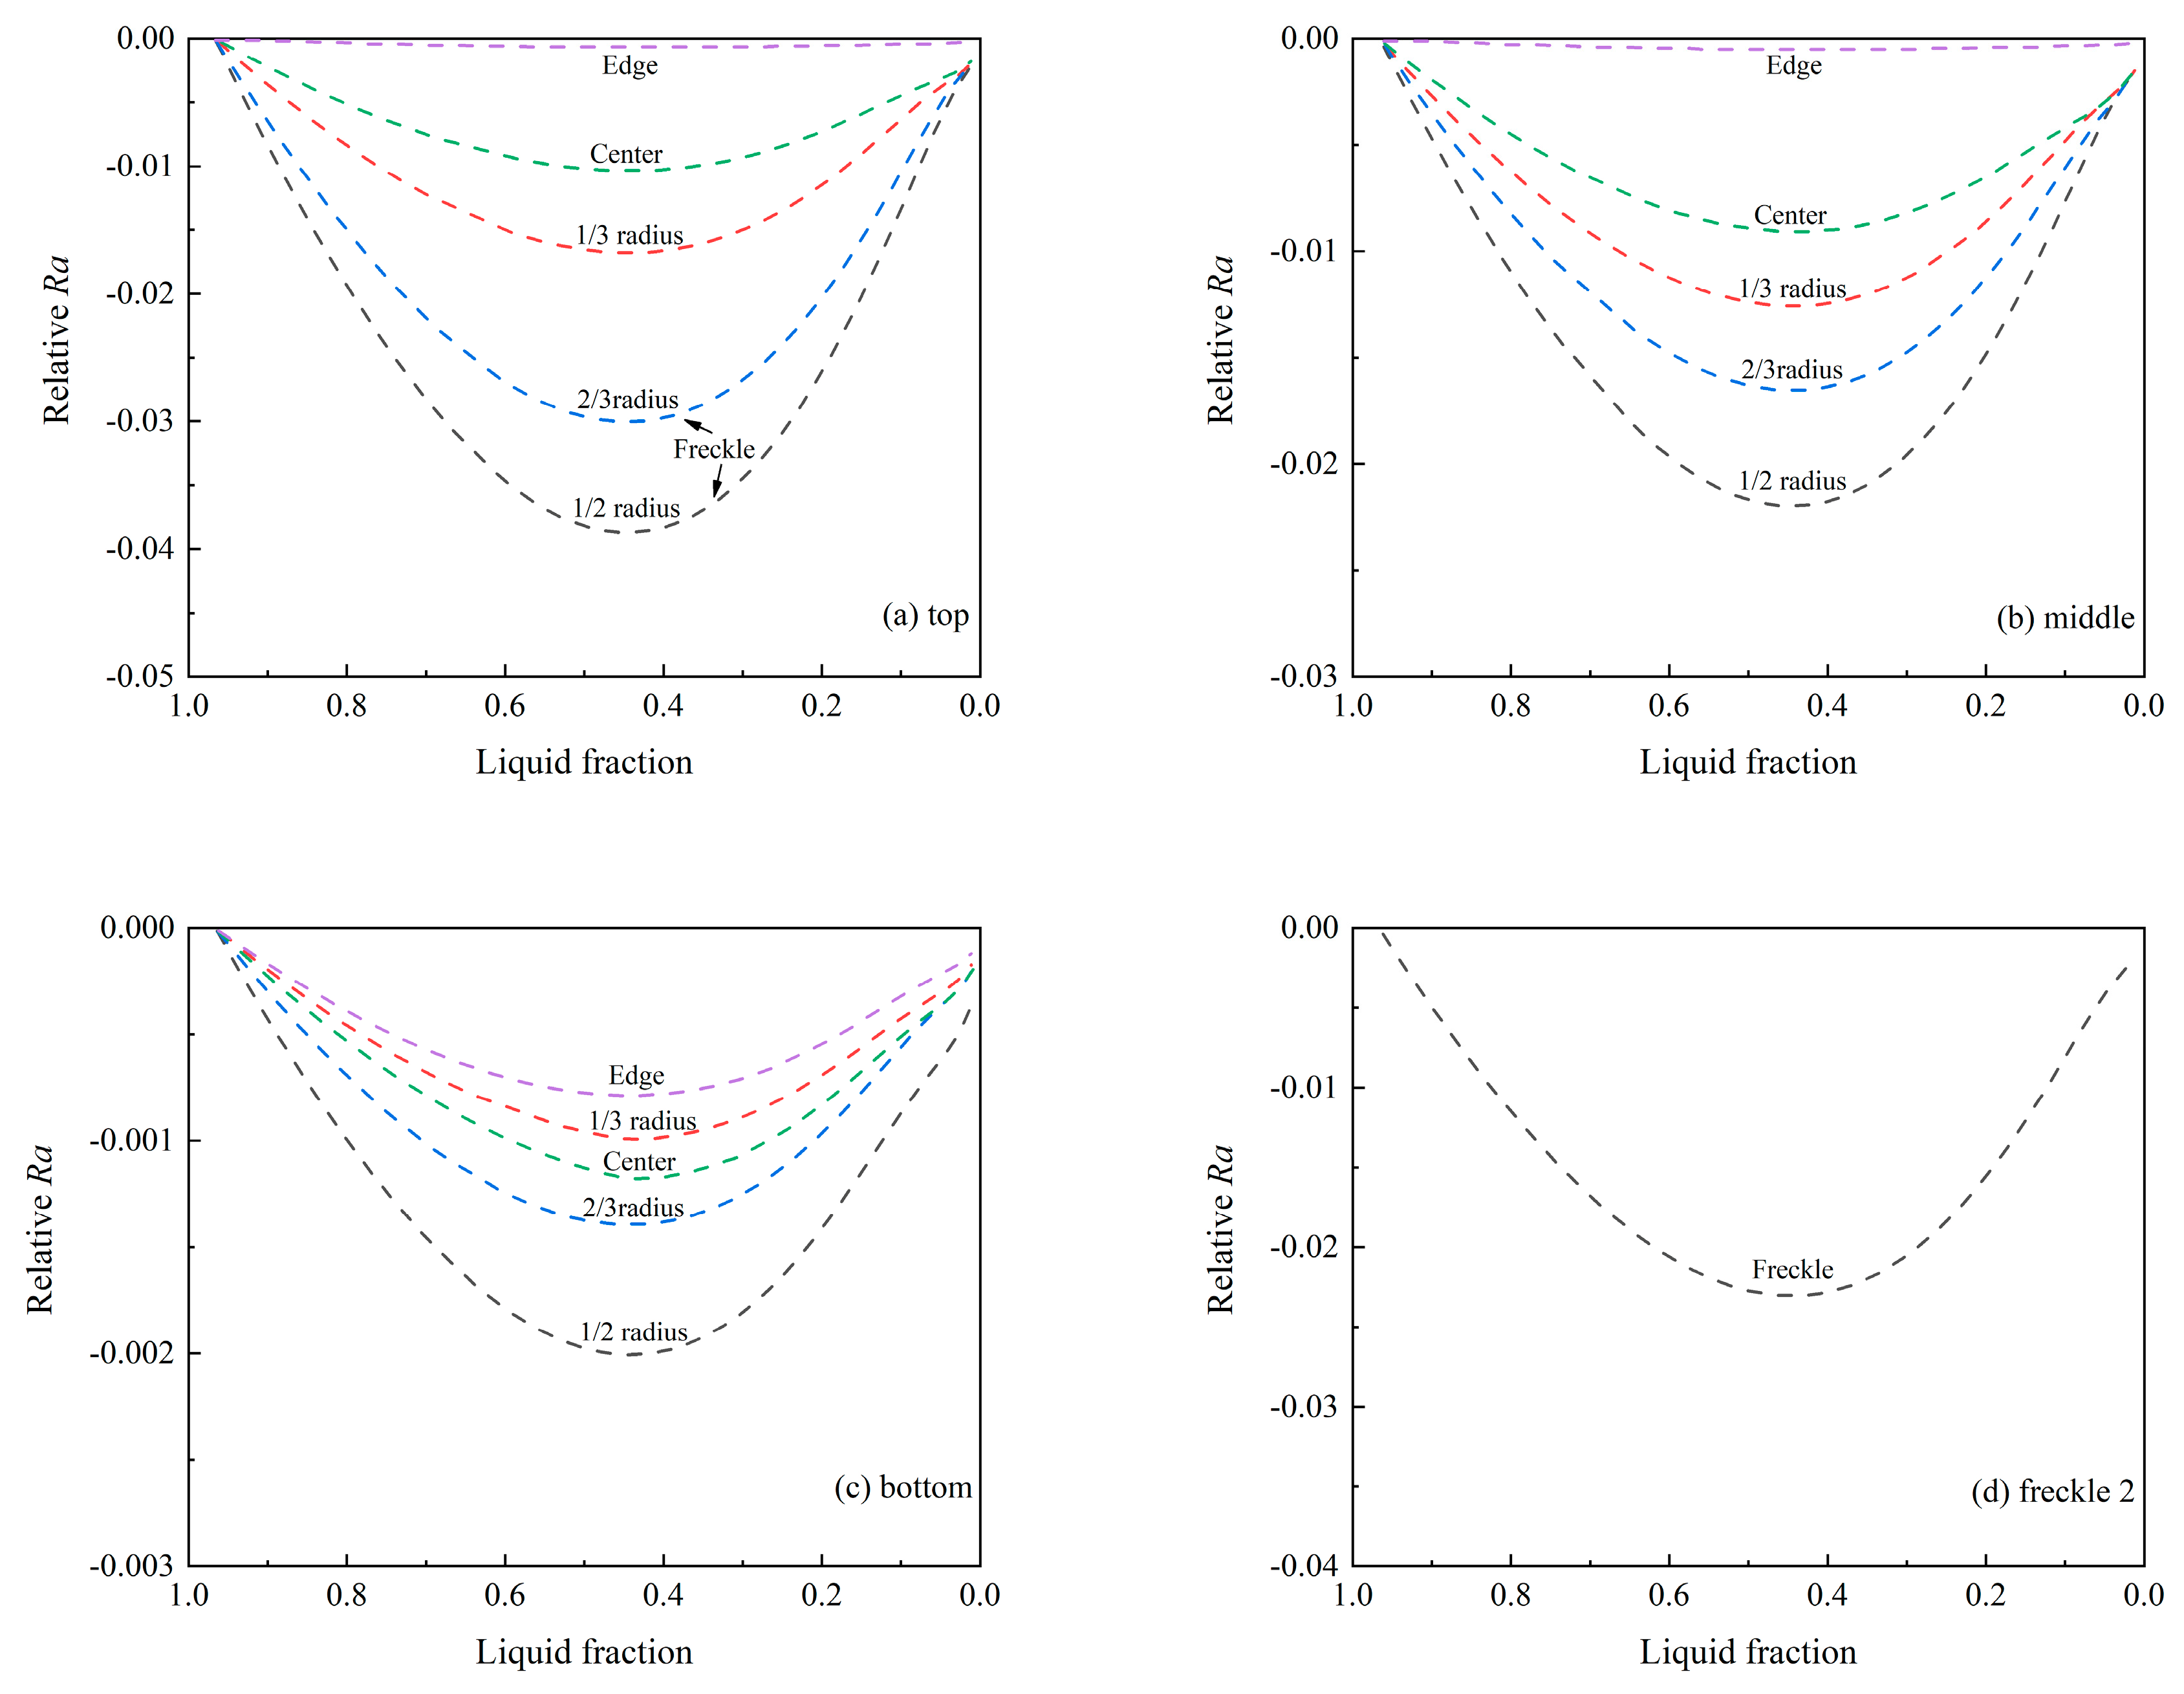
3.4. Prediction of Freckles using Rayleigh Number

As explained above, freckle formation is inextricably bound up with both thermal and compositional effects. The form of the Rayleigh number as Equation (4), proposed by Valdes et al. [21], containing the above thermal and compositional factors, can be used to describe the freckle formation.
R a = ( Δ ρ g cos θ ν f L ) ( Κ P 2 c o s 2 θ + Κ N 2 s i n 2 θ R ) 1 2
where the parameters Δ ρ , θ , ν , f L , and R have been described or calculated above; g is the gravity constant; and K P and K N are the parallel and perpendicular components of permeability to the primary dendrites, respectively. For the industrial scale ESR process in the present study, it is impracticable to obtain the reliable grain growth rate directly, thus the cooling rate, C R , was adopted to replace [6]. So Equation (4) can be written as Equation (5).
R a   ( relative ) = ( Δ ρ g cos θ ν f L ) ( Κ P 2 c o s 2 θ + Κ N 2 s i n 2 θ C R ) 1 2
At the macroscopic scale, the dendritic mushy zone is treated as a porous medium with a growing solid fraction; therefore, it will generate retarding frictional force to the segregated liquid flow. Permeability of the interdendritic liquid is a critical parameter to describe the ability of liquid to flow in the mushy zone, which is mainly affected by liquid fraction and dendrite structure. Combining the cause of nucleation and propagation of freckles, freckle is affected by the upward flow of the solute-enriched interdendritic liquid. Therefore, the permeability of the interdendritic liquid can be viewed as a parameter of freckle formation. Many researches applied permeability parameters to evaluate the macro segregation, but most of them only adopted the mean permeability with no concern for anisotropy of permeability [12,17,18,19,22,33,34,35]. However, the mean permeability, with only a concern for isotropy, is appropriate for the upward directional solidification but not for the ESR solidification process due to the significant effect of the tilted solidification front. As found above, for the GCr15SiMn ESR ingot, freckles are found predominately at ~1/2 radius of the ingot rather than in the center, where Ra is maximum if adopting this definition. Accordingly, the anisotropy of permeability within the mushy zone was considered in this study by adopting Equations (6) and (7) [36].
K P = 3.75 × 10 4 f L 2 λ 1 2
K N = 9.66 × 10 18 f L 3.34 λ 1 0.699 λ 2 2.73
As can be seen, K P and K N are functions of liquid fraction and dendritic structure. The primary dendritic arm spacing (PDAS), λ 1 , can be obtained indirectly through a combination of Equations (3) and (8) [27]. According to Equation (3), one can calculate cooling rate based on measured SDAS, then substitute it into Equation (8) to obtain the PDAS.
λ 1 = 278.75 C R 0.206 C 0 , C 0.0189 0.492 C 0 , C
All the necessary parameters used for calculation of relative R a are known according to the above measurement and calculation. Figure 8 shows the calculated relative R a as a function of liquid fraction at varying positions of the GCr15SiMn ESR ingot. It should be pointed out that the negative values are caused by the negative liquid density differences from the density of the liquid with normal compositions. It can be seen from Figure 8a through Figure 8c that the absolute value of R a increases with the distance from the edge along the radial direction, and it reaches the maximum at 1/2 radius region and then decreases with distance near the center. The absolute value of R a also presents an obvious decrease from the top to the middle and then to the bottom zones of the ESR ingot. The larger absolute value of R a indicates a stronger formation tendency for freckles. As shown in Figure 8a, the freckles were formed in the ~1/2–2/3 radius region at the middle-upper zone of the ESR ingot, where the absolute value of R a reaches the largest among those R a values at the same radial positions of different zones along the axial direction. In combination with the analysis in Section 3.2 and Equation (5), the bottom zone has a larger cooling rate than that of the middle and top zones, and its absolute values of R a were the lowest in the ESR ingot. The cooling effect of the bottom water tank reduces gradually from the bottom to the middle zones, thus the absolute values of R a at the middle of the ingot are lower. Even though the solidification front angle at the edge region was larger than that at the other regions, the cooling rate at the edge region is largest; this competition effect causes the smallest absolute value of   R a . Overall, the lower cooling rate, high solidification front angle, and more serious segregation, as well as a smaller liquid flow resistance in the coarse dendritic structure of the mid-radius region at the middle-upper zone of the GrCr15SiMn ESR ingot, are beneficial to freckle formation.
In addition, all absolute values of R a at any positions and in any zones of the ESR ingot present an increase and then a subsequent decrease with the decrease of liquid fraction. This result can be attributed to the competition effect of liquid density difference, liquid viscosity, and the permeability of the mushy zone. At the early stage of solidification, the liquid fraction is high and the compositions of liquid and solid are homogeneous; low buoyancy force and frictional force to liquid flow decelerate the interdendritic flow. As solidification progresses, the liquid density difference increases perceptibly (Figure 6), but liquid viscosity (Figure 7) and permeability decrease significantly. As a result, both the buoyancy force and the frictional force, which affect the flow of the interdendritic liquid, receive a simultaneous increase. The buoyancy force may overcome the frictional force to form a thermal solute convection. As solidification continues, the liquid fraction may fall into a specific range where the interdendritic liquid is surrounded completely by solid and can no longer flow out. As shown in Figure 8, under this competition effect of buoyancy force and frictional force, a maximum absolute value of R a was reached at the liquid fraction range of 0.3–0.5 (0.4 ± 0.1), which is basically consistent with the corresponding liquid fraction range of 0.27–0.49 (Figure 5), obtained through simulation calculation using freckle compositions.
According to Figure 8, a critical threshold value of R a , −0.023, as a boundary to divide the freckled and freckle-free regions can be derived. There is no freckle formation in the GCr5SiMn ESR ingot when R a is below this threshold value.

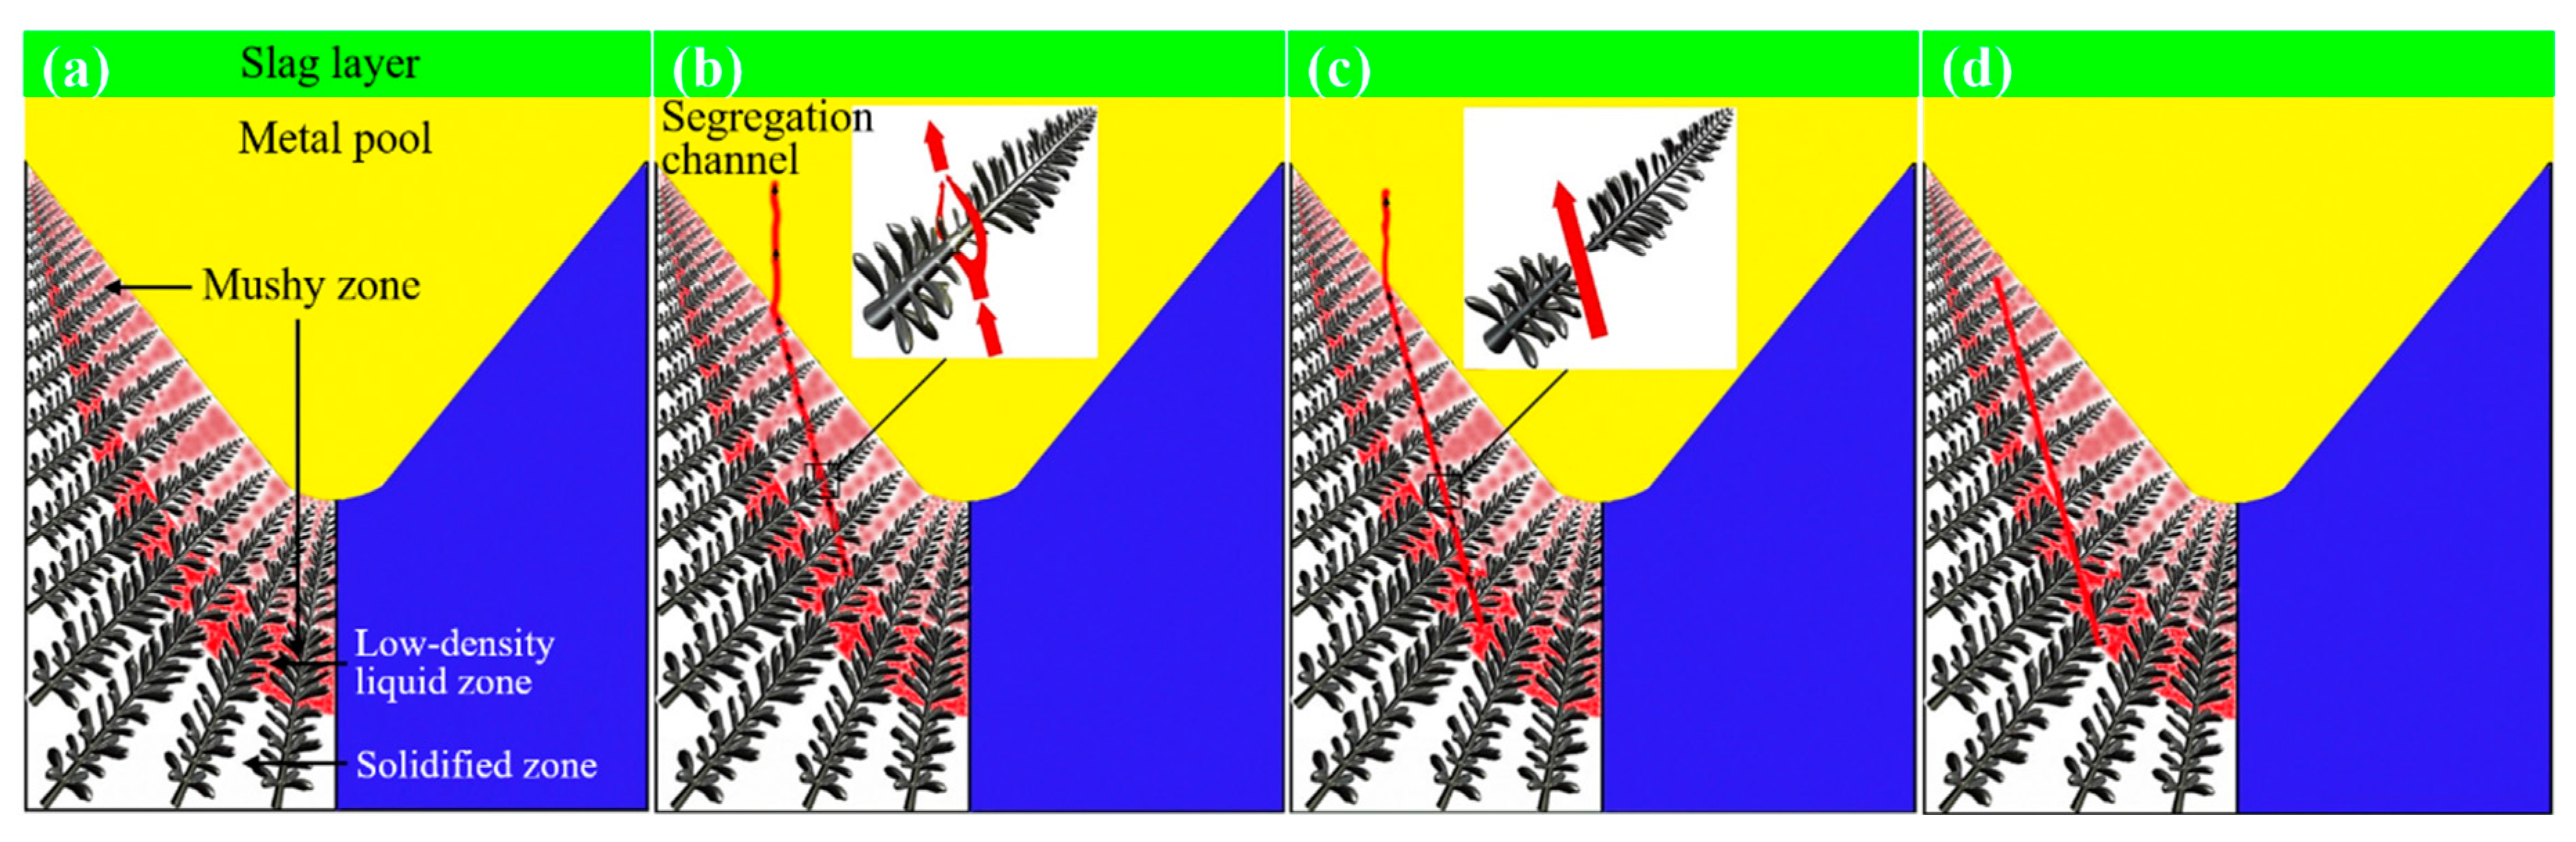
3.5. Formation Mechanism of Freckles in ESR Bearing Steel Ingot

A high melting rate is likely to induce the deep mushy zone and the solidification front with a large tilted angle during the ESR process of large sized ingots, which is conducive to the flow of the interdendritic liquid. During solidification, lighter solute elements like Cr, Mn, and Si in bearing steel GCr15SiMn are rejected into the interdendritic liquid from dendritic arms, and, meanwhile, parallel concentration and density gradients are formed along the solidification direction in the mushy zone. As shown in Figure 9a, a gravitational-instability and light (Si, Mn, Cr)-enriched liquid layer (red in the color figure) initially exists at the bottom of the mushy zone. Once the density gradient increases to a certain extent during solidification, the buoyancy force of the segregated liquid will be able to overcome the frictional force; as a result, the segregated liquid flows upward. In the initial stage of freckle nucleation, many small streams of segregated liquid flow upwards into the liquid zone through the mushy zone from the bottom and then form many segregation channels. Since the fluid is inclined to flow along the channel with the lowest resistance, the interdendritic segregated liquid around the channels will flow into the segregation channels due to the low solid fraction (low resistance) of the channels. These small segregation channels grow through absorbing the surrounding interdendritic segregated liquid. In the meantime, the growth also further strengthens its absorption ability. These growing channels merge with each other and eventually become a large and stable segregated liquid channel. As the segregated liquid progresses towards the molten pool, the liquid will be heated, but its compositions are almost constant because thermal diffusion is faster than solute diffusion. Therefore, the liquid becomes more unsaturated under high temperature. As shown in Figure 9b,c, the solidified dendritic arms in the channel will eventually be eroded and perhaps remelted by the high-temperature and the unsaturated segregated liquid. In the later stage of freckle nucleation, both the (Si, Mn, Cr)-enriched upward flow and the (Si, Mn, Cr)-poor downward flow proceed simultaneously due to volume conservation. The (Si, Mn, Cr)-poor liquid promotes the growth of surrounding dendrites, while the (Si, Mn, Cr)-enriched liquid gradually approaches the fine dendrites in the edge zone of the ESR ingot with the advance of the solidification front. Ultimately, as shown in Figure 9d, the buoyancy force driven by the liquid density difference can no longer cross the growing frictional force, and the segregated channel is enclosed by dendrites. Those dendrite fragments from the erosion of initial dendrites have higher density than the surrounding liquid. They will lower the liquid temperature once they sink in the liquid, and some partially melted fragments may become nucleation sites. However, the heat transfer direction is irregular in the segregation channel, and the solute diffusion is extremely slow in solids, so the segregation channel has to retain its original compositions to solidify with equiaxed grain structure. This conclusion has been identified in Figure 2.
On this basis, fine dendritic structure and a smooth solidification front are crucial for the prevention of freckle formation. The dendrites are finer and there are more of them, and the permeability of the mushy zone is smaller. As a result, the segregation degree is lower and the liquid density difference is smaller. On the other hand, the smooth solidification front will cause larger resistance to the upward flow of the interdendritic liquid due to the fact that parallel component, K P , of permeability is far less than the perpendicular component, K N [37]. Consequently, it is essential to obtain as fine a dendritic structure and smooth solidification front as possible in order to avoid freckles during the ESR process of GCr15SiMn. Alternative measures are to increase the filling ratio of the electrode, decrease the melting rate, strengthen cooling, and improve radial heat transfer.

4. Conclusions

(1)
Freckles were identified to be of a (Si, Mn, Cr)-enriched equiaxed grain structure with a higher microhardness, and formed around the 1/2–2/3 radius region at the middle upper zone of the GCr15SiMn ESR ingot, where SDAS reaches its maximum but cooling reaches its minimum.
(2)
Similar liquid fractions of 0.3–0.5, corresponding to the range of the strongest freckle formation, were obtained based on both freckle composition and relative Ra, using thermodynamic approaches.
(3)
A threshold value of relative Ra was determined to be –0.023 for freckle formation in the GCr15SiMn ESR ingot based on experimental and simulation results.

Author Contributions

W.Y. and Y.Z. performed the investigations and analyzed the data; W.Y. wrote the manuscript; W.C. supervised the investigations; W.C. and J.L. discussed, edited, and reviewed the manuscript. All authors have read and agreed to the published version of the manuscript.

Funding

This research received no external funding.

Conflicts of Interest

The authors declare no conflict of interest.

References

  1. Moore, J.; Shah, N. Mechanisms of formation of A- and V-segregation in cast steel. Int. Mat. Rev. 1983, 28, 338–356. [Google Scholar] [CrossRef]
  2. Ma, D.; Wu, Q.; Buehrig-Polaczek, A. Some new observations on freckle formation in directionally solidified superalloy components. Metall. Mater. Trans. B 2012, 43, 344–353. [Google Scholar] [CrossRef]
  3. Hong, J.; Ma, D.; Wang, J.; Wang, F.; Sun, B.; Dong, A.; Li, F.; Bührig-Polaczek, A. Freckle defect formation near the casting interfaces of directionally solidified superalloys. Materials 2016, 9, 929. [Google Scholar] [CrossRef] [PubMed] [Green Version]
  4. Gao, S.; Liu, L.; Hu, X.; Ge, B.; Zhang, J.; Fu, H. Review of freckle defects under directional solidification of Nickel-based superalloys. J. Mater. Sci. Eng. 2010, 28, 145. [Google Scholar]
  5. Copley, S.; Giamei, A.; Johnson, S.; Hornbecker, M. The origin of freckles in unidirectionally solidified castings. Metall. Trans. 1970, 1, 2193–2204. [Google Scholar] [CrossRef]
  6. Mehrabian, R.; Keane, M.; Flemings, M. Experiments on macrosegregation and freckle formation. Metall. Trans. 1970, 1, 3238–3241. [Google Scholar]
  7. Cao, H.; Shen, H.; Liu, B. Numerical simulation of freckle formation in directional solidification of Nickel-based superalloy. Rare Metal Mater. Eng. 2006, 35, 1849–1853. [Google Scholar]
  8. Guillemot, G.; Gandin, C.; Bellet, M. Interaction between single grain solidification and macrosegregation: Application of a cellular automaton—Finite element model. J. Cryst. Growth 2007, 303, 58–68. [Google Scholar] [CrossRef]
  9. Schneider, M.; Gu, J.; Beckermann, C.; Boettinger, W.; Kattner, U. Modeling of micro- and macrosegregation and freckle formation in single-crystal nickel-base superalloy directional solidification. Metall. Mater. Trans. A 1997, 28, 1517–1531. [Google Scholar] [CrossRef]
  10. Zaloznik, M.; Kumar, A.; Combeau, H. An operator splitting scheme for coupling macroscopic transport and grain growth in a two-phase multiscale solidification model: Part II—Application of the model. Comp. Mater. Sci. 2010, 48, 11–21. [Google Scholar] [CrossRef]
  11. Cao, Y.; Chen, Y.; Li, D.; Liu, H.; Fu, P. Comparison of channel segregation formation in model alloys and steels via numerical simulations. Metall. Mater. Trans. A 2016, 47, 2927–2939. [Google Scholar] [CrossRef]
  12. Torabi Rad, M.; Kotas, P.; Beckermann, C. Rayleigh number criterion for formation of A-segregates in steel castings and ingots. Metall. Mater. Trans. A 2013, 44, 4266–4281. [Google Scholar]
  13. Bogdan, O. Influence of ingot size and mold design on macro-segregation in AISI 4340 forging ingots. In Proceedings of the 1st International Conference on Ingot Casting, Rolling and Forging, Aachen, Germany, 3–7 June 2012. [Google Scholar]
  14. Gu, J.; Beckermann, C. Simulation of convection and macrosegregation in a large steel ingot. Metall. Mater. Trans. A 1999, 30, 1357–1366. [Google Scholar] [CrossRef] [Green Version]
  15. Pollock, T.; Murphy, W. The breakdown of single-crystal solidification in high refractory nickel-base alloys. Metall. Mater. Trans. A 1996, 27, 1081–1094. [Google Scholar] [CrossRef]
  16. Suzuki, K.; Miyamoto, T. Study on the formation of-A segregates in steel ingot. Trans. Iron Steel Inst. Jpn. 1978, 18, 80–89. [Google Scholar] [CrossRef] [Green Version]
  17. Beckermann, C.; Gu, J.; Boettinger, W. Development of a freckle predictor via Rayleigh number method for single-crystal Nickel-base superalloy castings. Metall. Mater. Trans. A 2000, 31, 2545–2557. [Google Scholar] [CrossRef]
  18. Ramirez, J.; Beckermann, C. Evaluation of a rayleigh-number-based freckle criterion for Pb-Sn alloys and Ni-base superalloys. Metall. Mater. Trans. A 2003, 34, 1525–1536. [Google Scholar] [CrossRef]
  19. Yang, W.; Chen, W.; Chang, K. Freckles in remelted niobium containning superalloys. In Proceedings of the 130th Annual Meeting & Exhibition of The Minerals, Metals & Materials Society, New Orleans, LA, USA, 11–15 February 2001; pp. 113–122. [Google Scholar]
  20. Wang, L.; Dong, J.; Tian, Y.; Zhang, L. Microsegregation and Rayleigh number variation during the solidification of superalloy Inconel 718. J. Univ. Sci. Technol. Beijing 2008, 15, 594–599. [Google Scholar] [CrossRef]
  21. Valdés, J.; King, P.; Liu, X. On the formulation of a freckling criterion for Ni-based superalloy vacuum arc remelting ingots. Metall. Mater. Trans. A 2010, 41, 2408–2416. [Google Scholar] [CrossRef]
  22. Yang, W.; Chang, K.; Chen, W.; Mannan, S.; Barbadillo, J. Freckle criteria for the upward directional solidification of alloys. Metall. Mater. Trans. A 2001, 32, 397–406. [Google Scholar] [CrossRef]
  23. Han, D.; Jiang, W.; Xiao, J.; Li, K.; Lu, Y.; Zheng, W.; Zhang, S.; Lou, L. Investigation on freckle formation and evolution of single-crystal nickel-based superalloy specimens with different thicknesses and abrupt cross-section changes. J. Alloys Compd. 2019, 805, 218–228. [Google Scholar] [CrossRef]
  24. Giamei, A.; Kear, B. On the nature of freckles in nickel base superalloys. Metall. Trans. 1970, 1, 2185–2192. [Google Scholar] [CrossRef]
  25. Li, Q.; Shen, J.; Qin, L.; Xiong, Y. Investigation on local cooling in reducing freckles for directionally solidified superalloy specimens with abruptly varying cross-sections. Mater. Char. 2017, 130, 139–148. [Google Scholar] [CrossRef]
  26. Kaya, H.; Boyuk, U.; Cadirli, E.; Marasli, N. Measurements of the microhardness, electrical and thermal properties of the Al-Ni eutectic alloy. Mater Des. 2012, 34, 707–712. [Google Scholar] [CrossRef]
  27. El-Bealy, M.; Thomas, B. Prediction of dendrite arm spacing for low alloy steel casting processes. Metall. Mater. Trans. B 1996, 27, 689–693. [Google Scholar] [CrossRef]
  28. Suzuki, K.; Miyamoto, T. Influence of alloy elements on the formation of-A segregates in steel ingot. Trans. Iron Steel Inst. Jpn. 1980, 1, 377–383. [Google Scholar]
  29. Auburtin, P.; Cockcroft, S.; Mitchell, A. Liquid density inversion during the solidification of superalloys and their relationship to freckle formation in castings. In Proceedings of the 8th Int. Symp. on Superalloys (Superalloys 1996), Anaheim, CA, USA, 22–26 September 1996; pp. 443–450. [Google Scholar]
  30. Long, Z.; Liu, X.; Yang, W.; Chang, K.; Barbero, E. Thermodynamic assessment of liquid composition change during solidification and its effect on freckle formation in superalloys. Mat. Sci. Eng. A 2004, 386, 254–261. [Google Scholar] [CrossRef]
  31. Valdes, J.; Liu, X.; King, P.; Cowen, C.; Jablonski, P. Solidification front tilt angle effect on potential nucleation sites for freckling in the remelt of Ni-base superalloys. In Proceedings of the 7th Int. Symp. on Superalloy 718 and Derivatives, Seattle, WA, USA, 10–13 October 2010; pp. 79–94. [Google Scholar]
  32. Hirai, M. Estimation of viscosities of liquid alloys. ISIJ Int. 1993, 33, 251–258. [Google Scholar] [CrossRef] [Green Version]
  33. Kumar, A.; Založnik, M.; Combeau, H.; Goyeau, B.; Gobin, D. Channel segregation during columnar solidification: Influence of inertia. In Proceedings of the 4th Int. Conf. on Porous Media and Its Applications, Potsdam, Germany, 17–22 June 2012; pp. 1–6. [Google Scholar]
  34. Yuan, L.; Lee, P. A new mechanism for freckle initiation based on microstructural level simulation. Acta Mater. 2012, 60, 4917–4926. [Google Scholar] [CrossRef]
  35. Gao, Z.; Jie, W.; Liu, Y.; Zheng, Y.; Luo, H. A model for coupling prediction of inverse segregation and porosity for up-vertical unidirectional solidification of Al-Cu alloys. J. Alloys Compd. 2019, 797, 514–522. [Google Scholar] [CrossRef]
  36. Poirier, D. Permeability for flow of interdendritic liquid in columnar-dendritic alloys. Metall. Trans. B 1987, 18, 245–255. [Google Scholar] [CrossRef]
  37. Auburtin, P.; Wang, T.; Cockcroft, S. A Mitchell. Freckle formation and freckle criterion in superalloy castings. Metall. Mater. Trans. B 2000, 31, 801–811. [Google Scholar] [CrossRef]
Figure 1. Schematic diagram of sampling position.
Metals 10 00246 g001
Figure 2. Macrostructure of freckles in the GCr15SiMn ESR ingot. (a) freckle on ingot, (b) macrostructure of freckle 1, (c) macrostructure of freckle 2.
Metals 10 00246 g002
Figure 3. Element distribution mappings of the freckle region (left half) and its surrounding matrix.
Metals 10 00246 g003
Figure 4. (a) Secondary dendritic arm spacing (SDAS), (b) cooling rate, and (c) solidification time at different positions of the ESR ingot.
Metals 10 00246 g004
Figure 5. Change of liquid composition during solidification.
Metals 10 00246 g005
Figure 6. Variation of liquid density and density difference during solidification.
Metals 10 00246 g006
Figure 7. Variation of liquid viscosity during solidification.
Metals 10 00246 g007
Figure 8. Relative Ra at different positions of the GCr15SiMn ESR ingot.
Metals 10 00246 g008
Figure 9. Schematic diagrams of freckle formation during the ESR process. (a) gravitational-instability liquid layer, (b) erosion of dendritic arm, (c) remelting of dendritic arm, (d) enclosing of segregated channel.
Metals 10 00246 g009
Table 1. Chemical compositions of GCr15SiMn electroslag remelting (ESR) ingot.
CSiMnCrSPNiCuMoTiAlFe
1.00.561.061.530.0010.0180.040.050.060.0120.014Bal
Table 2. Compositions and hardness of the freckle and the surrounding matrix.
ElementContent (SD), wt pctHV (SD), MPa
SiMnCr
Freckle0.72 (0.054)1.65 (0.17)2.70 (0.23)271.5 (21.4)
Matrix0.67 (0.070)1.20 (0.14)1.72 (0.16)200.9 (10.3)
Table 3. Solidification front angle at different positions of the ESR ingot (degree).
PositionEdge2/3-radius1/2-radius1/3-radiusCenter
Top4638402620
Middle5035353025
Bottom6560502318

