Article

Liquation Cracking Tendency of Novel Al-Mg-Zn Alloys with a Zn/Mg Ratio below 1.0 during Fusion Welding

1
State Key Laboratory for Advanced Metals and Materials, University of Science and Technology Beijing, Beijing 100083, China
2
Shandong Provincial Key Laboratory of Special Welding, Harbin Institute of Technology at Weihai, Weihai 264209, China
*
Author to whom correspondence should be addressed.
Metals 2020, 10(2), 222; https://doi.org/10.3390/met10020222
Submission received: 27 December 2019 / Revised: 22 January 2020 / Accepted: 23 January 2020 / Published: 6 February 2020
(This article belongs to the Special Issue Fusion Welding)

Abstract

:
The main obstacle for the application of high strength 7××× series aluminum alloys is that these alloys are susceptible to hot cracking during fusion welding. This study presents the liquation cracking susceptibility of the novel T-Mg32(AlZn)49 phase strengthened Al-Mg-Zn alloy with a Zn/Mg ratio below 1.0 by a circular-patch welding test, and compared the liquation cracking tendency with η-MgZn2 phase strengthened 7××× series alloys whose Zn/Mg ratios are above 1.0. It was found that all these novel Al-Mg-Zn alloys still have as low a liquation cracking susceptibility as traditional 5××× series alloys, surpassing that of traditional 7××× series alloys substantially. It was noticed that the increase of the Zn/Mg ratio will result in a larger difference between the fraction solids of the fusion zone and the partially melted zone during the terminal solidification stage, which can lead to a wider crack healing disparity between these two areas and thus result in different liquation cracking susceptibilities in different alloys.

1. Introduction

Aluminum alloys are widely used in the shipbuilding and vehicle industries. Commonly known high-strength aluminum alloys, such as precipitation hardened 7××× series aluminum alloys with a Zn/Mg ratio above 1.0, tend to crack easily during the fusion welding process, as demonstrated by the occurrence of visible solidification or liquation cracks on their welds [1,2]. It makes welding and joining extremely hard for these alloys. Poor weldability has prevented their adoption in long-span material application scenarios. Most studies have been carried out on the solidification cracking behavior of metal materials [3,4,5]. These solidification cracks usually take place at the end of the solidification process, during which time solid phases occur as the temperature cools down, and grains begin to contact with their neighboring ones. However, severe liquation cracking can occur in the partially melted zone (PMZ), which is an area next to the outer side of the fusion zone (FZ). Liquation cracking can lead to a lower product yield rate and result in great danger while in use [6,7,8]. It also has the tendency to bring about solidification cracks, and result in serious large-scale cracking during fusion welding. With regard to the causes of liquation cracking, it is commonly understood that as heat input increases during welding, intergranular eutectic phases in the PMZ are melted while the grains do not reach the liquidus point and remain solid. As the weld cools down, shrinking stress occurs, pulling the heat-affected zone in the opposite direction to the constraining direction, and liquation cracks will occur once this stress surpasses the limit that the weld can hold. [9,10,11].
The 5××× series aluminum alloys, such as AA5083 and AA5059, always have a good weldability to suppress the solidification and liquation cracking during fusion welding [12]. However, their strength is relatively low since the alloy is strengthened by a solid solution and strain hardening, limiting their usage in fields where high strength is emphasized as a first priority. In our group, the authors are trying to design novel aluminum alloys with both high strength and good weldability. The Zn/Mg ratio in the novel alloy is below 1.0 compared with the η-MgZn2 phase strengthened 7××× series aluminum alloys, whose Zn/Mg ratio is above 2.0. In these alloys, the T-Mg32(AlZn)49 phase becomes an effective precipitation hardening phase under proper artificial aging treatments to guarantee the strength compared with 7××× series aluminum alloys [13,14,15,16,17,18].
In this study, a circular-patch welding test was applied to determine the liquation cracking susceptibility of the novel alloys and the contrast alloys welded by 5556 filler metals. All of their microstructures were then observed by a scanning electron microscope (SEM). In order to make explanations for the differences in weldabilities, a non-equilibrium simulation during solidification was used to determine the variation in the fraction solid as a function of temperature.

2. Materials and Methods

2.1. Materials

The composition of all tested alloys and the filler metal are listed in Table 1. The Zn/Mg ratio increases to 1.3 from Alloy 1 to Alloy 5. Among all the alloys, Alloy 1 is a contrast AA5083 alloy with Mg as the main alloying element. Alloy 5 is a contrast AA7039 alloy, having a Zn/Mg ratio above 1.0. The other three alloys are novel alloys with a Zn/Mg ratio below 1.0. ER5556 is used as the filler metal during fusion welding.
All test alloys were melted, homogenized, scalped, hot rolled, recrystallized, and cold rolled to a final thickness of 2.0 mm. Samples were solution treated at 525 °C for 10 min in a salt bath, and then the samples were quenched in cold water. The alloys were aged at 90 °C for 24 h and then aged at 140 °C for 24 h, respectively. The tensile yield strength of the contrast Alloy 1 and Alloy 5 were 144 MPa and 392 MPa, respectively. Meanwhile, the tensile yield strength of the novel Alloy 2, Alloy 3, and Alloy 4 were 149 MPa, 217 MPa, and 404 MPa, respectively. The novel Alloy 4 had a higher strength than the contrast alloys. All alloy workpieces were machined from heat-treated specimens to obtain a fishbone shape, and the details of the size of these workpieces are depicted in Figure 1.

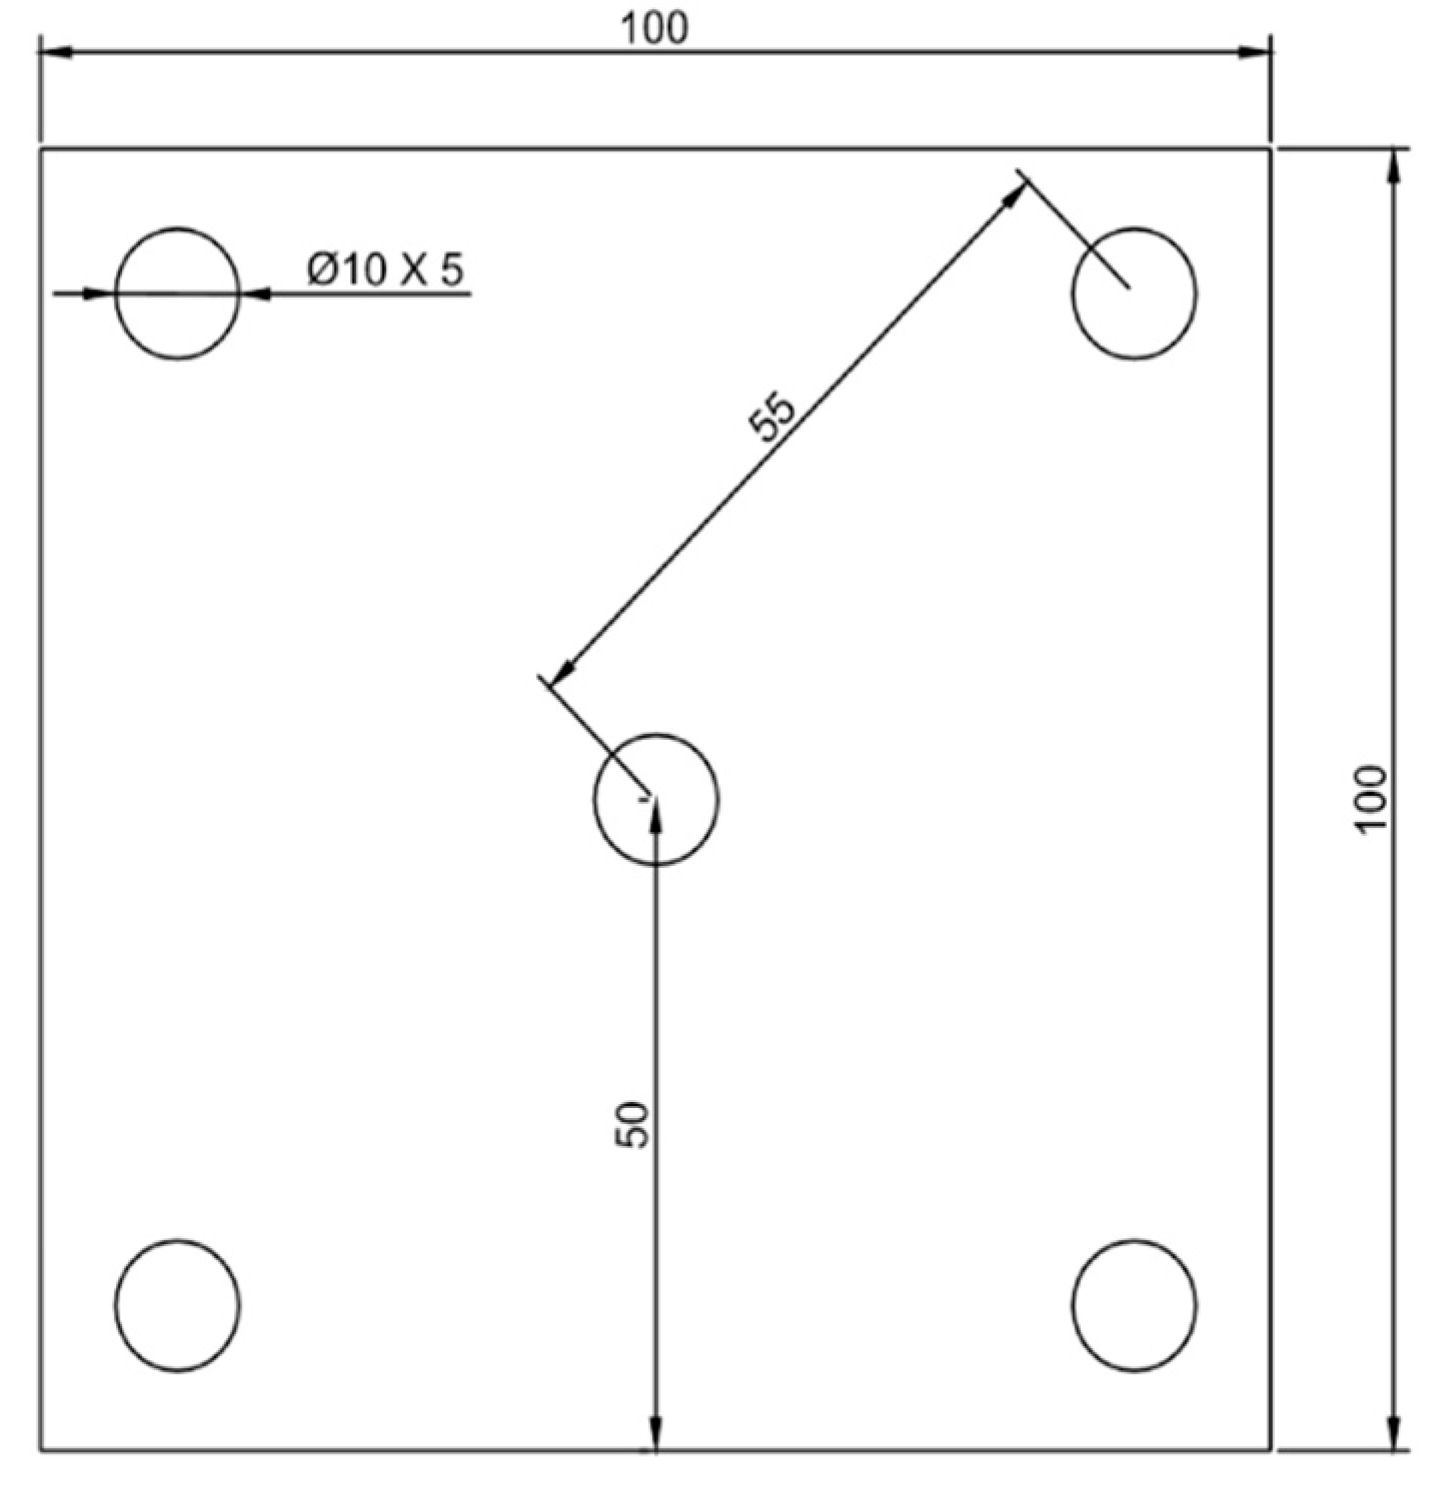
2.2. Circular-Patch Welding Test

A circular-patch welding test was first proposed by Kou to measure the liquation cracking tendency of traditional Al alloys [19,20]. In this study, the circular-patch welding test was applied to assess the liquation cracking susceptibility of different alloys, and a sketch diagram of the instruments is shown in Figure 2. The workpieces were strictly restrained between two thick copper plates by all their holes being bolted tightly, so as to prevent the workpieces from contracting freely during the welding and cooling processes. The copper plates were thick and heavy enough to resist any forms of shift during welding. A torque wrench was used to tighten all bolts to the same torque of 50 N·m. Thus, the copper plates could provide symmetric and even constraining forces to the workpieces.
In this study, the workpieces were machined into two parts, inner and outer pieces, with a gap of about 0.2 mm left on each workpiece, making it easier for filler metal to penetrate into the back of the workpieces. The inner piece had a 70 mm diameter and a hole with an 8 mm diameter in the center, and the holes on the outer piece had the same dimensions as those on the inner piece. The workpieces were not in direct contact with the copper plates in order to avoid the heat sink effect of copper, which can lead to fast and uncontrollable cooling speeds of post-weld workpieces. Thus, steel washers measuring 1.5 mm in thickness were placed between the workpieces and the copper plates.
The welding processes for each workpiece were conducted by an PLC controlled manipulator (Asea Brown Boveri Ltd., Zurich, Switzerland), equipped with a Fronius Trans-Synergic-5000 Cold Metal Transfer (CMT) welding system and a VR-7000 weld feeder. A CMT pattern of the welding system was applied. The ER5556 filler metal had a diameter of 1.2 mm, and the main welding parameters are listed in Table 2. The weld surface was sanded and cleaned with acetone to remove the oxide layer and contaminates before welding.

2.3. Microstructure Observation and Simulation

The directions perpendicular to the weld surface direction were examined microscopically by SEM, and the number of micro-cracks in the PMZ were counted by the Image pro plus 6.0 software (MEDIA CYBERNETICS Inc., Rockville, MD, USA) so as to compare the differences among liquation cracking susceptibilities. Energy-dispersive spectroscopy (EDS) (PHENOM Inc., Eindhoven, Netherlands) was employed to explore the distribution of Al, Mg, Zn, Cu, and Mn elements during the welding process. The Factsage 7.1 software (Thermofact/CRCT, Montreal, Canada and GTT technologies, Ahern, Germany) was used to simulate the solidification behavior in the FZ and the PMZ for all tested alloys, with the Scheil non-equilibrium model selected as the cooling condition. During this simulation, only Mg, Zn, and Cu were taken into consideration in these alloys. The other alloying elements were not involved in this part because the contents of Fe, Si, Cr, and Ti were too small to affect the calculation results. Another main alloying element, Mn, was mostly found in the Al6(MnFe) phase, which is difficult to melt during the welding process, making it almost impossible for it to take part in the solute redistribution process.

2.4. Determination of the Weld Metal’s Composition

The Mg, Zn, and Cu contents used in the simulations of PMZ during solidification were taken directly from Table 1, because, in the PMZ, only a very small volume of the base metal was melted during the welding process. Thus, the chemical composition could be considered to be unchanged compared with the base metal. On the other hand, the chemical composition in the FZ had changed considerably, owing to the dilutional effect of Mg, Zn, and Cu elements that the ER5556 filler metal brought in. So, the contents of Mg, Zn, and Cu used in the simulations in the FZ during solidification were recalculated.
The Mg, Zn, and Cu contents, ω x , for simulations in the FZ during solidification should be determined by the following equation:
ω x = ω a ρ B M · V A + ω b ρ F M · ( V B + V C ) ρ B M · V A + ρ F M · ( V B + V C ) = ω a V A + ω b ( V B + V C ) V A + V B + V C
where ρBM and ρFM represent the density of the base metal and filler metal, respectively. In this study, the density difference between all tested alloys is negligible. Figure 3 shows the method to determine the dilutional ratio. In this figure, VA stands for the volume of the base metal area A before welding, while VB and VC stand for the volume of the filler metal areas B and C that is added during the welding process, respectively. The joint gap is not considered in this calculation, and the dilutional ratio ε can be calculated as follows:
ε = V A V A + V B + V C
Over 10 side views of welded joints were measured and calculated. The average dilutional ratio was approximately 50%, which means that the chemical composition of the FZ was determined by a mixture of 50% base metal and 50% filler metal. As a result, the Mg, Zn, and Cu contents for simulations in the FZ during solidification were calculated using the equation:
ω x = ω a · ε + ω b · ( 1 ε )
where ωa is the element content in the base metal and ωb is the element content in the filler metal. The calculated results are listed in Table 3.

3. Results and Discussion

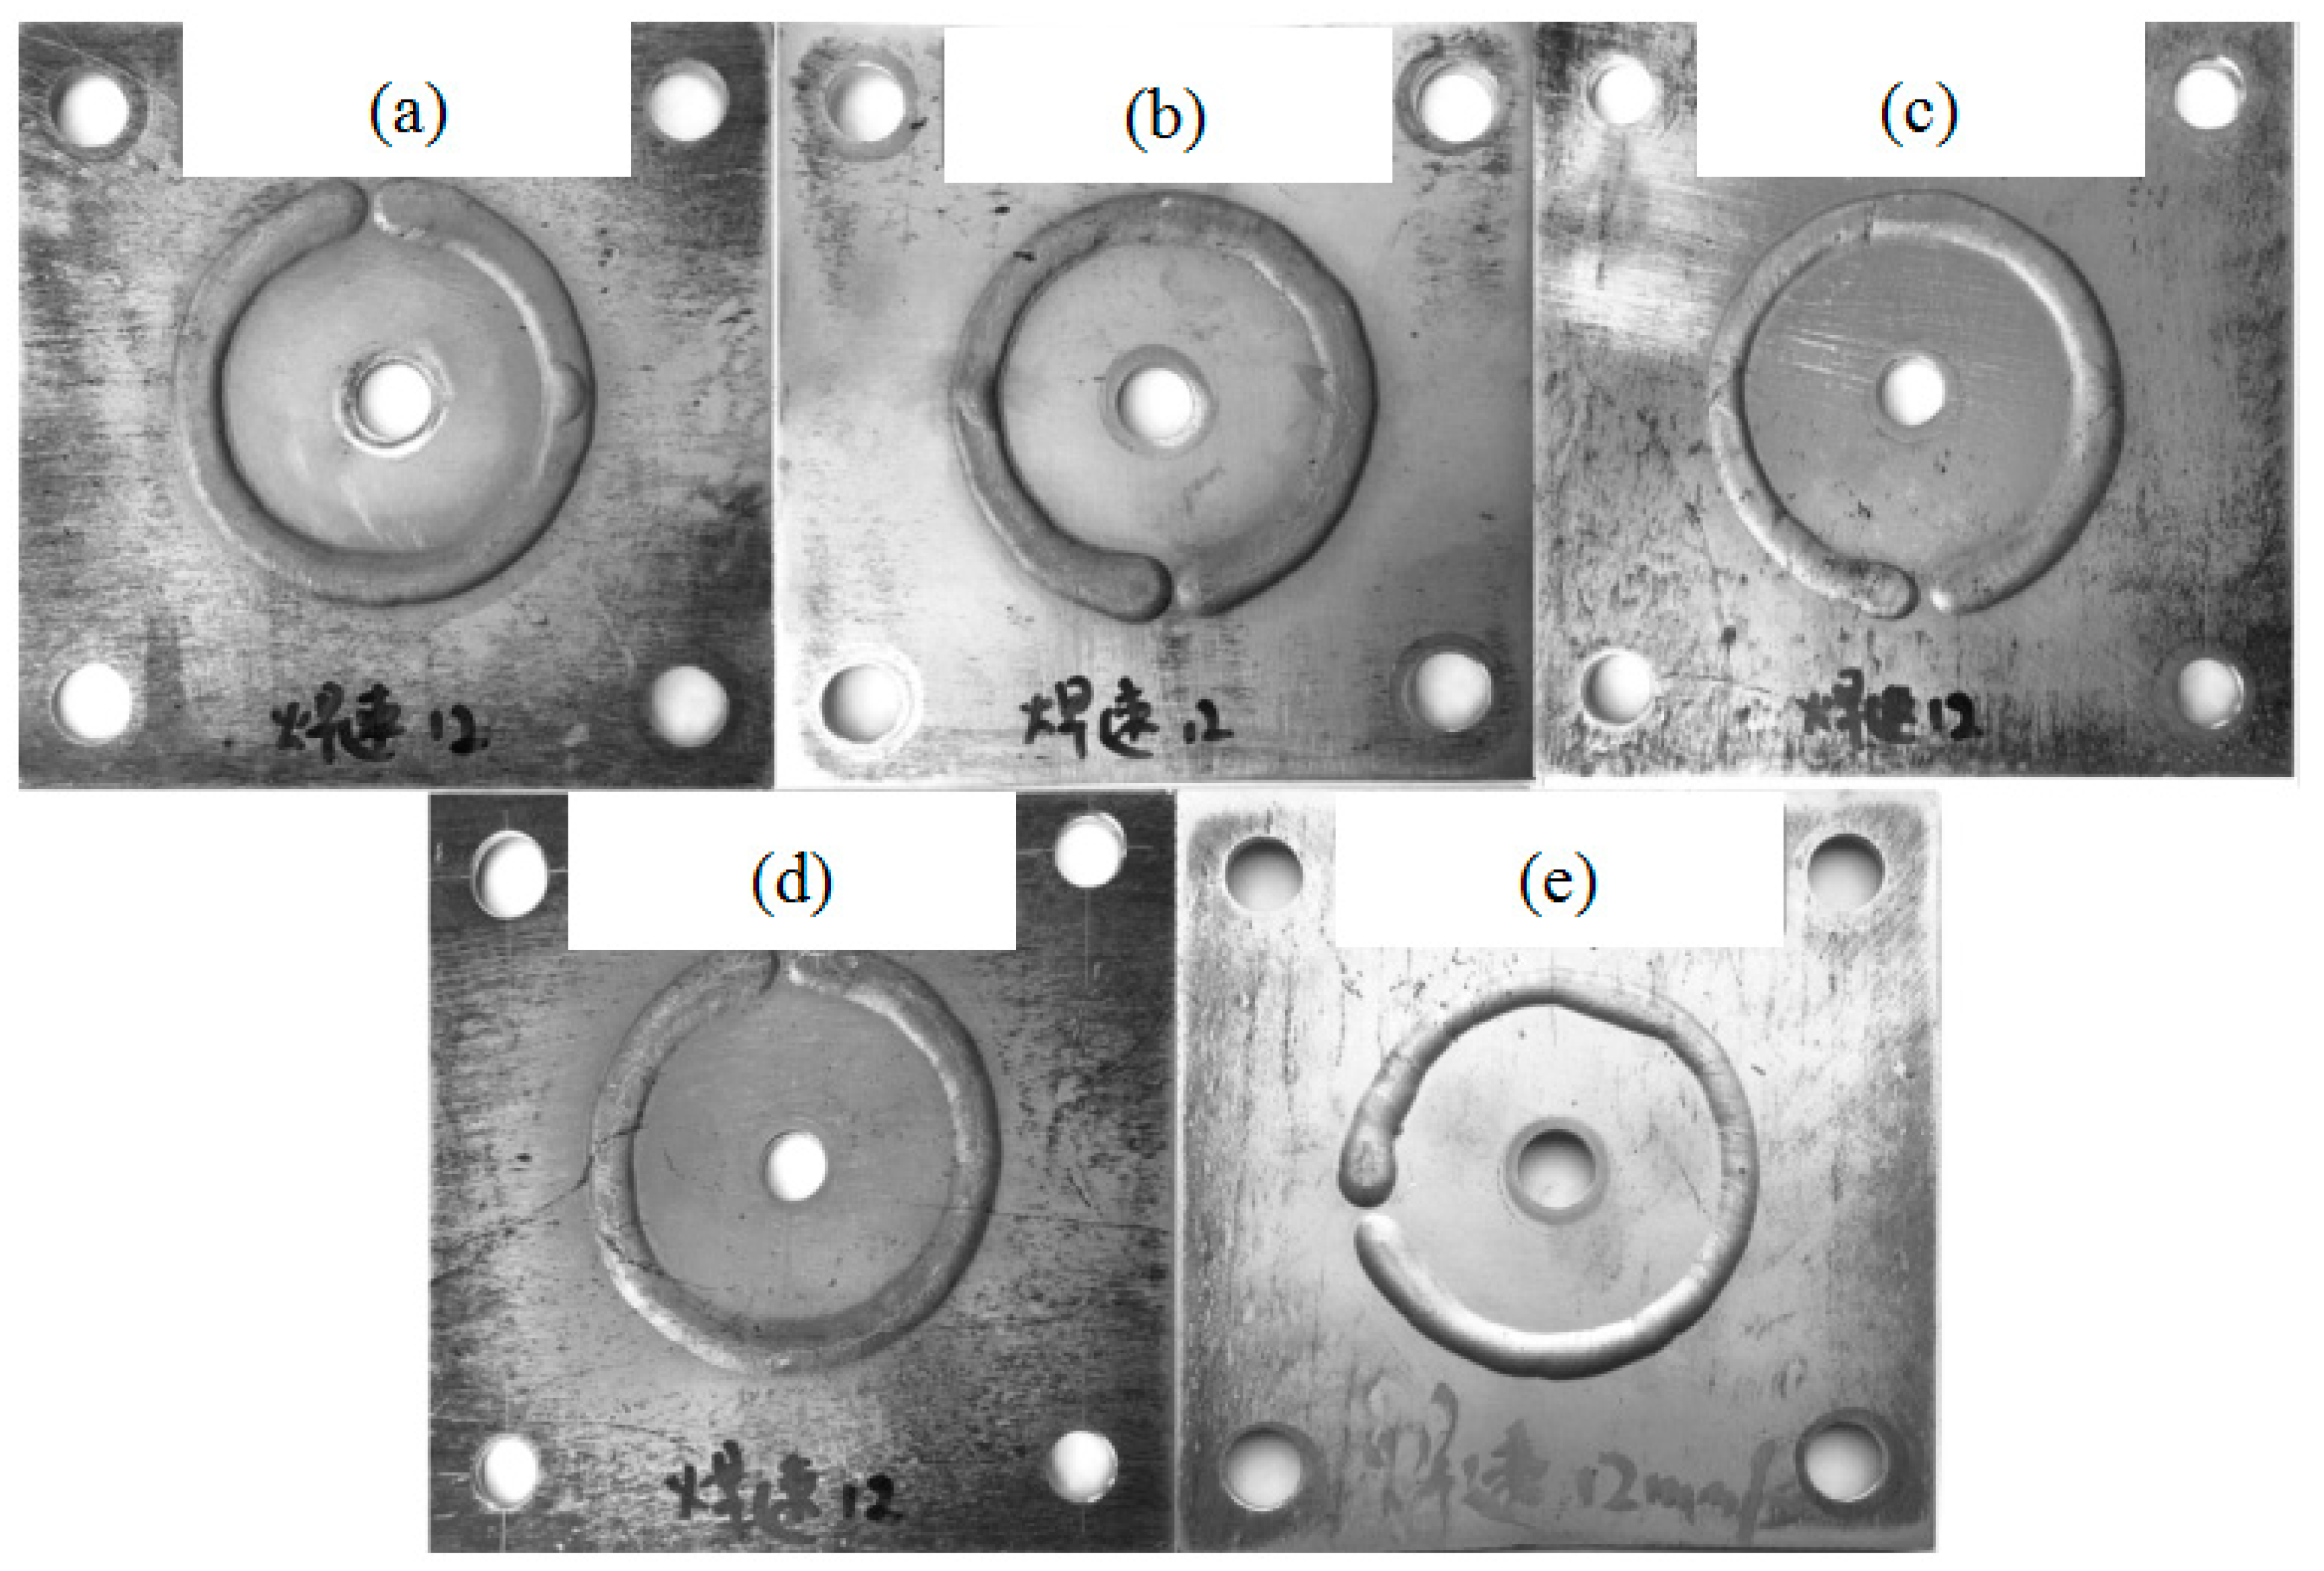
3.1. Circular-Patch Welding Test

In the circular-patch welding test, four parallel workpieces were tested for each group of alloy with the filler metal 5556. Figure 4 shows some representative post-weld pictures of workpieces. No obvious liquation cracking was observed in the weld transverse macrograph for all of the tested alloys.

3.2. Microstructure Observation

SEM microstructure observations of all tested alloys were conducted afterwards so as to determine their cracking susceptibility and the phase distribution patterns of workpieces. As shown in Figure 5, Alloy 5, having a higher Zn/Mg ratio, shows discontinuous cracks along the grain boundary in the PMZ. On the other hand, obvious liquation cracking is eliminated in the other four alloys. Figure 6 presents the PMZ microstructures of Alloy 3 and Alloy 4 after the circular-patch test by SEM at a higher magnification. It was found that randomly located micro-cracks exist on all tested alloys. By comparing images of Alloy 1, Alloy 2, Alloy 3, and Alloy 4 welds, it was found that micro-cracks occur to various degrees. As the Zn/Mg ratio increases, the number of these micro-cracks exhibits an upward trend. The extent of the eutectic phase on grain boundaries also increases with an increase of the Zn/Mg ratio. Figure 7 shows that, according to the EDS analysis, the contents of these eutectic phases are in line with the composition of Al-Mg-Zn.
In order to describe these differences quantitatively, the number and size of these micro-cracks on all welds were measured and calculated by image-processing software, and the percentage that pixels of micro-cracks occupied on an SEM image were used to describe the cracking susceptibility of all alloys. The SEM images of different welds that were used to count pixels were all captured under the same magnification to ensure the comparability of all data. In addition to the phase counting process, the Al6(MnFe) phase shown in Figure 8 was not counted because it is proven that it is difficult to melt during the welding process. Moreover, the shape of Al6(MnFe) phases are easy to distinguish from Mg32(AlZn)49 eutectic phases because they are much larger than Mg32(AlZn)49 eutectic phases. The identification of the Mg32(AlZn)49 and Al6(MnFe) phases by a transmission electron microscope was elaborated in our previous studies [13,14,15,16,17,18].
As can be seen from Figure 9, the number of micro-cracks increases with an increase of the Zn/Mg ratio, which supports the view that liquation cracking susceptibility increases with an increasing Zn/Mg ratio in the alloy. It is worth noting that the liquation cracking susceptibility of the contrast Alloy 5 is 3 times higher than that of the novel alloys, whose cracking susceptibility ranks the highest among all three novel Al-Mg-Zn alloys. Moreover, it can also be demonstrated from Figure 9 that the liquation cracking susceptibilities of Alloy 2, Alloy 3, and Alloy 4 maintain the same level as the contrast 5083 alloy, which means that all these new Al-Mg-Zn alloys in this study still have the same low liquation cracking susceptibility that the traditional 5××× alloy usually has.

3.3. Non-Equilibrium Simulation during Solidification

A non-equilibrium simulation was used to identify the solidification pattern for the PMZ and FZ in order to make explanations and even predictions for differences in weldabilities, and the simulation results are shown in Figure 10. In each simulation picture, the red line and black line stand for the PMZ and the FZ respectively, which were calculated based on Table 3, and the starting points of the T and β eutectic reactions are marked by arrows.
The following information and analyses can be extracted from the simulation results as depicted in Figure 10. During the terminal solidification stage, which usually refers to the period where the fraction solid is over 95%, the fraction solids of PMZs in all five tested alloys are higher than those of FZs. More liquid phase exists in their FZ than in their PMZ, resulting in better micro-crack healing performance in the FZ during this period. Thus, under the welding conditions of this study, liquation cracking tendencies exist in all these alloys. In terms of three novel Al-Mg-Zn alloys, it can be seen that as the Zn/Mg ratio increases, the differences between their PMZ and FZ fraction solids in the terminal solidification stage become higher, implying that a wider crack healing disparity between the PMZ and the FZ will occur. The increasing liquation cracking tendencies with an increasing Zn/Mg ratio can be thus explained. The simulation result for Alloy 1 shows that the difference between its PMZ and FZ fraction solids ranks the smallest among all five tested alloys, explaining the phenomenon that the traditional AA5083 alloy exhibited the lowest liquation cracking susceptibility in the circular-path welding test. As is shown in the simulation result for Alloy 5, the fraction solid of the PMZ in this alloy is dramatically higher than that of the FZ during not only the terminal solidification stage but also the whole solidification process. As a result, the liquation cracking tendency of the traditional AA7039 alloy ranks the highest.

4. Conclusions

In this study, a circular-path welding test was used to determine the liquation cracking susceptibility of three novel Al-Mg-Zn alloys with Zn/Mg ratios below 1.0, and two traditional AA5083 and AA7039 alloys as contrast alloys. It was found that the Zn/Mg ratio plays an important role in the liquation cracking tendency of Al alloys. The main conclusions can be summarized as follows:
(1)
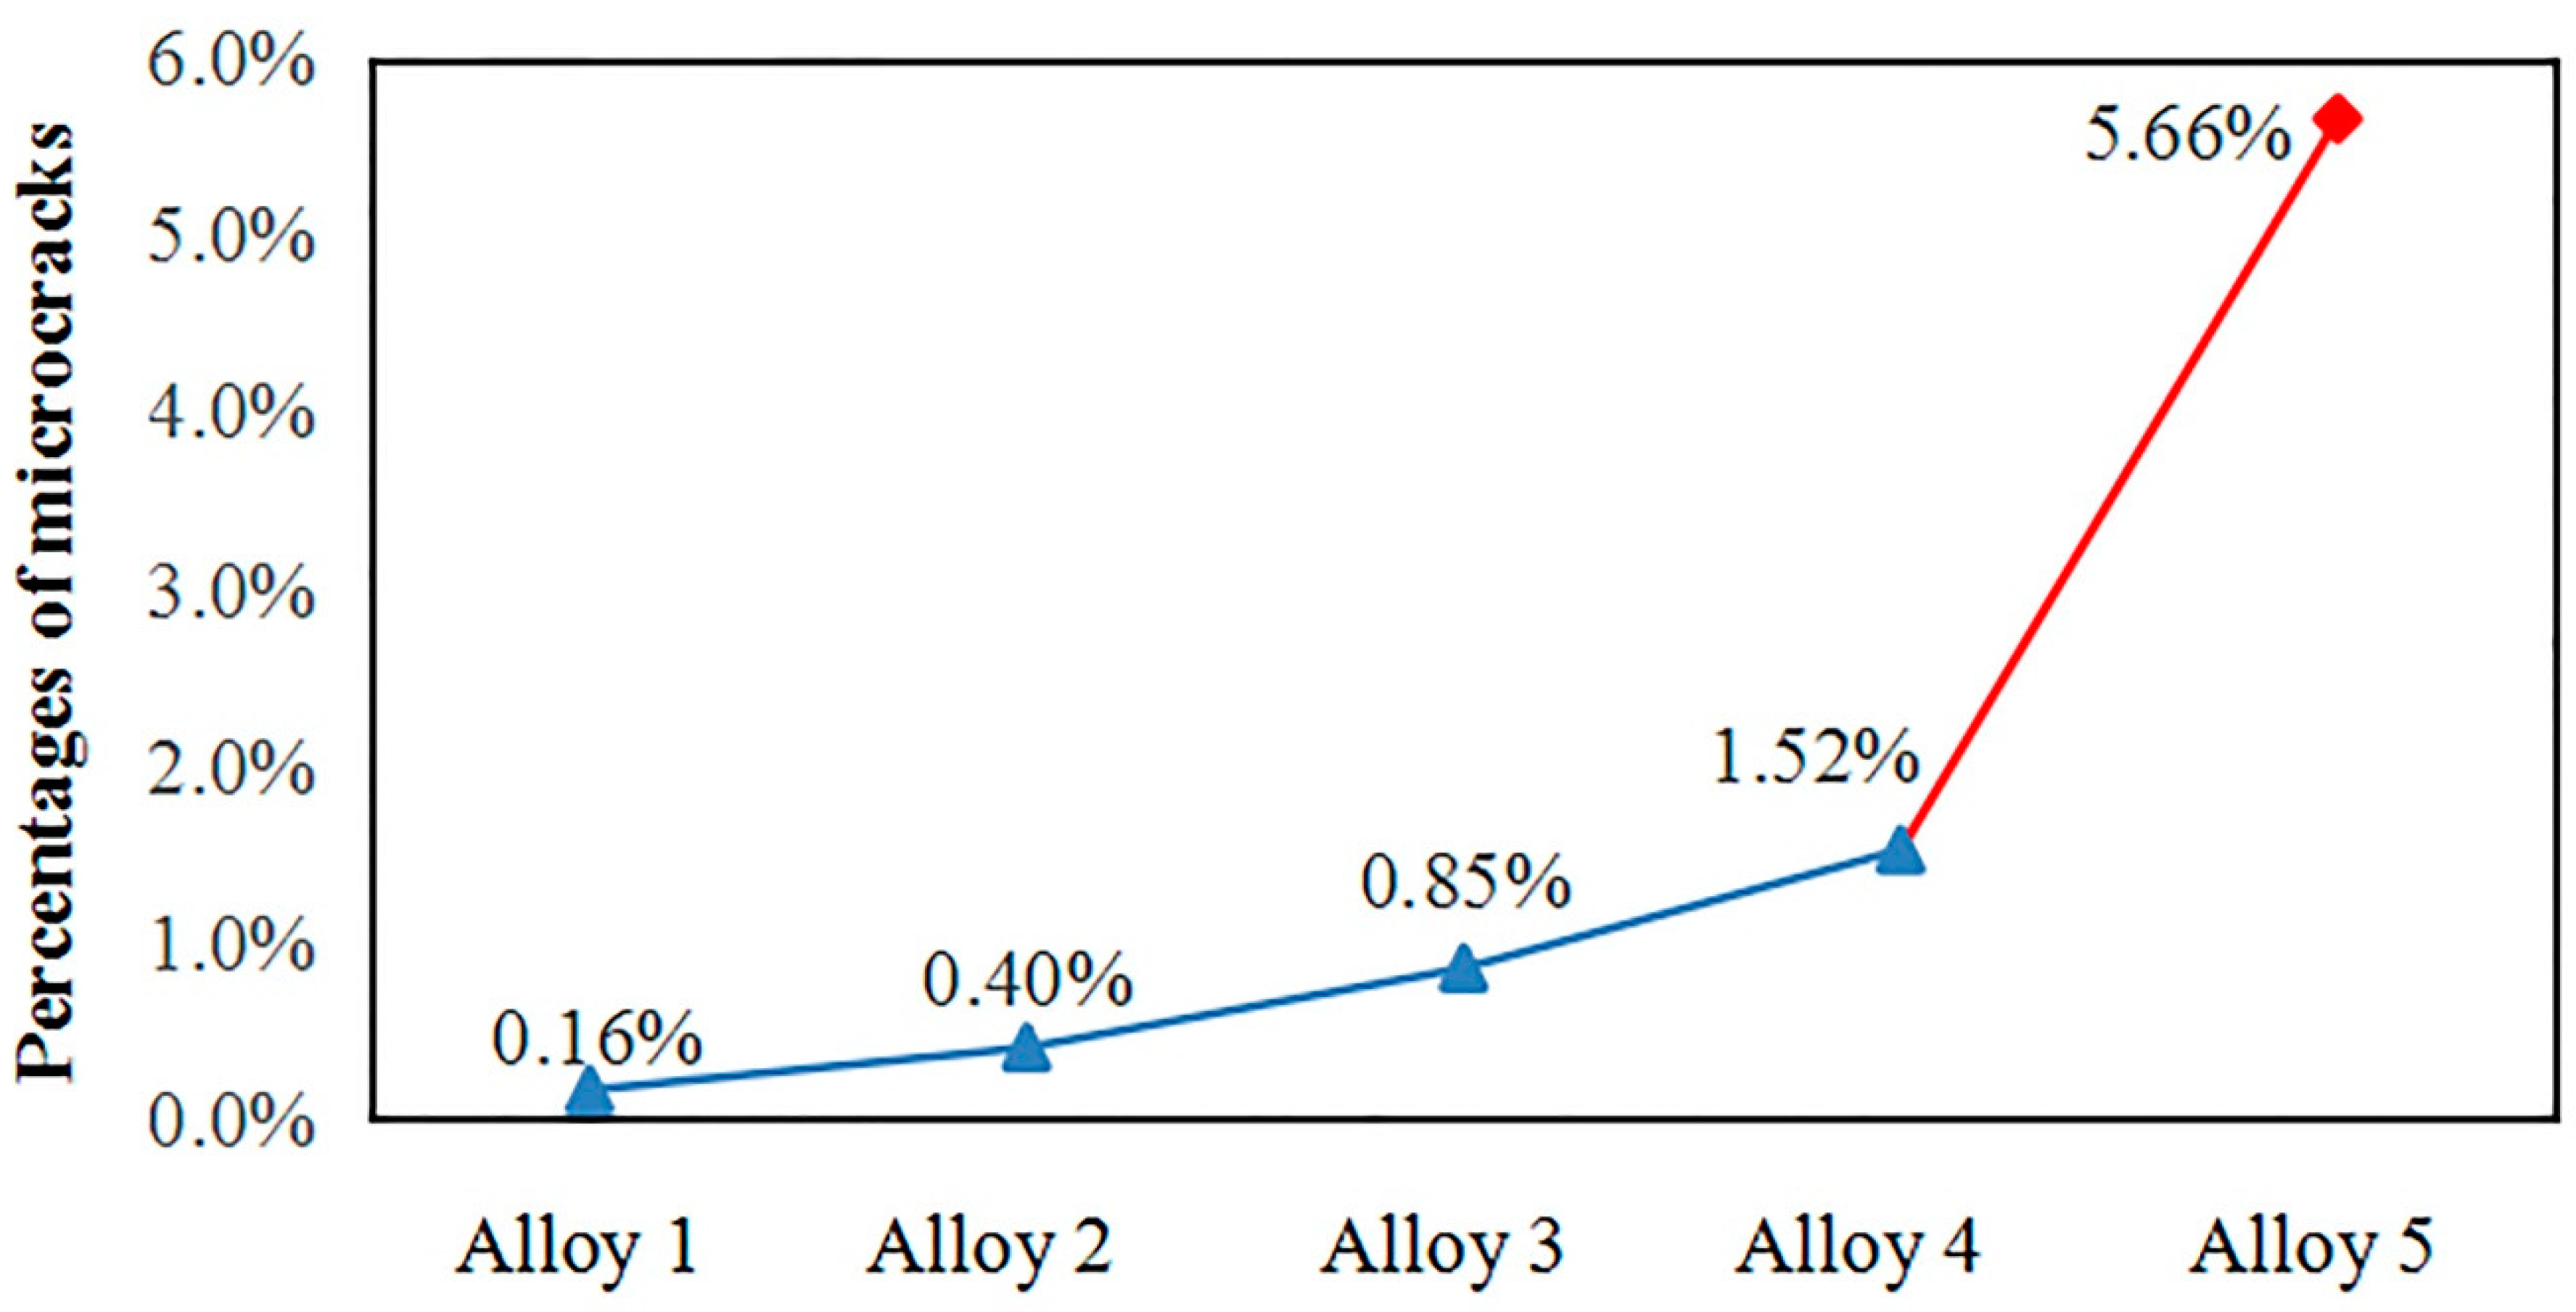
The liquation cracking susceptibility of this new Al-Mg-Zn alloy system with a Zn/Mg ratio below 1.0 is lower than traditional 7××× series alloys with a Zn/Mg ratio above 1.0. Only micro-cracks exist in the novel Al-Mg-Zn alloy system.
(2)
The main reason for the suppression of liquation cracking tendency compared with 7××× series alloys is that this novel Al-Mg-Zn alloy system will result in a smaller difference between the fraction solids of FZ and PMZ during the terminal solidification stage, thus leading to a narrower crack healing disparity between these two areas. The PMZ in these alloys has enough liquid to heal micro-cracks caused by concentrating stresses.

Author Contributions

Conceptualization, D.Z. and J.Z.; methodology, X.Z.; software, H.L. and L.Z. (Li Zhou); validation and visualization, D.Z., X.Z. and Y.P.; investigation, writing—original draft preparation, X.Z.; writing—review and editing, D.Z.; supervision and project administration, L.Z. (Linzhong Zhuang). All authors have read and agreed to the published version of the manuscript.

Funding

This research was funded by the Major State Research and Development Program of China, grant number 2016YFB0300801, and the National Natural Science Foundation of China, grant numbers 51571013 and 51971019.

Acknowledgments

This work was supported by the Beijing Laboratory of Metallic Materials and Processing for Modern Transportation, China.

Conflicts of Interest

The authors declare no conflict of interest.

References

  1. Mondolfo, L.F. Aluminum Alloys: Structure and Properties; Butterworths: London, UK, 1976; pp. 651–657. [Google Scholar]
  2. Kou, S. Welding Metallurgy, 2nd ed.; John Wiley & Sons: Hoboken, NJ, USA, 2003. [Google Scholar]
  3. Alvarez, P.; Vazque, L.; Ruiz, N.; Rodriguez, P.; Magana, A.; Niklas, A.; Santos, F. Comparison of hot cracking susceptibility of TIG and laser beam welded alloy 718 by varestraint testing. Metals 2019, 9, 985. [Google Scholar] [CrossRef] [Green Version]
  4. Zhu, S.; Yan, B. Effects of cerium on weld solidification crack sensitivity of 441 ferritic stainless steel. Metals 2019, 3, 372. [Google Scholar] [CrossRef] [Green Version]
  5. Agarwal, G.; Gao, H.; Amirthalingam, M.; Hermans, M. Study of solidification cracking susceptibility during laser welding in an advanced high strength automotive steel. Metals 2018, 8, 673. [Google Scholar] [CrossRef] [Green Version]
  6. Chen, K.C.; Chen, T.C.; Shiue, R.K.; Tsay, L.W. Liquation cracking in the heat-affected zone of IN738 superalloy weld. Metals 2018, 8, 387. [Google Scholar] [CrossRef] [Green Version]
  7. Chen, Y.H.; Chen, J.T.; Shiue, R.K.; Tsay, L.W. The evolution of cast microstructures on the HAZ liquation cracking of Mar-M004 weld. Metals 2018, 8, 35. [Google Scholar] [CrossRef] [Green Version]
  8. Liu, J.; Kou, S. Crack susceptibility of binary aluminum alloys during solidification. Acta Mater. 2016, 110, 84–94. [Google Scholar] [CrossRef] [Green Version]
  9. Kou, S. A simple index for predicting the susceptibility to solidification cracking. Weld. J. 2015, 94, 374–388. [Google Scholar]
  10. Huang, C.; Cao, G.; Kou, S. Liquation cracking in partial penetration aluminium welds: Assessing tendencies to liquate, crack and backfill. Sci. Technol. Weld. Join. 2013, 9, 149–157. [Google Scholar] [CrossRef]
  11. Cao, G.; Kou, S. Predicting and reducing liquation-cracking susceptibility based on temperature vs. fraction solid. Weld. J. 2006, 85, 9–18. [Google Scholar]
  12. Kou, S. Solidification and liquation cracking issues in welding. JOM 2003, 55, 37–42. [Google Scholar] [CrossRef]
  13. Cao, C.; Zhang, D.; Zhuang, L.; Zhang, J. Improved age-hardening response and altered precipitation behavior of Al-5.2Mg-0.45Cu-2.0Zn (wt%) alloy with pre-aging treatment. J. Alloy Compd. 2017, 691, 40–43. [Google Scholar] [CrossRef]
  14. Cao, C.; Zhang, D.; He, Z.; Zhuang, L.; Zhang, J. Enhanced and accelerated age hardening response of Al-5.2Mg-0.45Cu (wt%) alloy with Zn addition. Mater. Sci. Eng. A 2016, 666, 34–42. [Google Scholar] [CrossRef]
  15. Cao, C.; Zhang, D.; Wang, X.; Ma, Q.; Zhuang, L.; Zhang, J. Effects of Cu addition on the precipitation hardening response and intergranular corrosion of Al-5.2Mg-2.0Zn (wt.%) alloy. Mater. Charact. 2016, 122, 177–182. [Google Scholar] [CrossRef]
  16. Hou, S.; Liu, P.; Zhang, D.; Zhang, J.; Zhuang, L. Precipitation hardening behavior and microstructure evolution of Al–5.1Mg–0.15Cu alloy with 3.0Zn (wt%) addition. J. Mater. Sci. 2018, 53, 3846–3861. [Google Scholar] [CrossRef]
  17. Hou, S.; Zhang, D.; Ding, Q.; Zhang, J.; Zhuang, L. Solute clustering and precipitation of Al-5.1Mg-0.15Cu-xZn alloy. Mater. Sci. Eng. A 2019, 759, 465–478. [Google Scholar] [CrossRef]
  18. Meng, C.; Zhang, D.; Cui, H.; Zhuang, L.; Zhang, J. Mechanical properties, intergranular corrosion behavior and microstructure of Zn modified Al–Mg alloys. J. Alloy Compd. 2014, 617, 925–932. [Google Scholar] [CrossRef]
  19. Huang, C.; Kou, S. Liquation Cracking in Full-Penetration Al-Mg-Si Welds. Weld. J. 2004, 83, 111–122. [Google Scholar]
  20. Huang, C.; Kou, S. Liquation Cracking in Full-penetration Al-Cu Welds. Weld. J. 2004, 84, 50–68. [Google Scholar]
Figure 1. Top view of the workpiece for the circular-patch welding test (unit: mm).
Metals 10 00222 g001
Figure 2. A sketch diagram of the circular-patch welding test instruments. (a) Samples (b) Test instruments with fastening bolts.
Metals 10 00222 g002
Figure 3. The method to determine the dilutional ratio.
Metals 10 00222 g003
Figure 4. Representative images of post-weld workpieces: (a) Alloy 1, (b) Alloy 2, (c) Alloy 3, (d) Alloy 4, and (e) Alloy 5.
Metals 10 00222 g004
Figure 5. Scanning electron microscope (SEM) images of the PMZ in the welds: (a) Alloy 1, (b) Alloy 2, (c) Alloy 3, (d) Alloy 4, and (e) Alloy 5.
Metals 10 00222 g005
Figure 6. PMZ micro-cracks of (a) Alloy 3 and (b) Alloy 4.
Metals 10 00222 g006
Figure 7. (a) Al-Mg-Zn eutectic phase leading to micro-cracks and (b) its energy-dispersive spectroscopy (EDS) line scan.
Metals 10 00222 g007
Figure 8. (a) A typical image, (b) an EDS line scan of Al-Mn-Fe phase in the PMZ, and EDS mapping of (c) Mn and (d) Fe.
Metals 10 00222 g008
Figure 9. Percentages of micro-cracks in the welds.
Metals 10 00222 g009
Figure 10. Solidification simulation results for all tested alloys: (a) Alloy 2, (b) Alloy 3, (c) Alloy 4, (d) Alloy 1, and (e) Alloy 5.
Metals 10 00222 g010
Table 1. Experimental alloy composition in wt% (Balance: Al).
Alloy SymbolMgZnZn/MgMnCuCrTiZrFeSi
Base AlloysAlloy15.0000.800.150.030.070.150.200.15
Alloy25.01.00.20.800.150.030.070.150.200.15
Alloy35.02.00.40.800.150.030.070.150.200.15
Alloy45.03.00.60.800.150.030.070.150.200.15
Alloy53.04.01.30.250.050.20.07-0.150.15
Filler Metal55565.10.25-0.750.10.130.13-0.40.25
Table 2. Parameters applied during the welding process.
PolarityDCEP (Electrode-Positive Polar)
Current95 A
Voltage13.3 V
Arc holding time1.0 s
Feeding speed6.1 m/min
Welding speed12 mm/s
Shielding gasArgon
Gas flow17 L/min
Distance from workpiece5 mm
Table 3. Chemical compositions of the fusion zone (FZ) and the partially melted zone (PMZ) used for simulations (wt%).
Simulated ZoneAlloyMgZnCuAl
PMZAlloy 15.000.15Bal.
Alloy 25.01.00.15
Alloy 35.02.00.15
Alloy 45.03.00.15
Alloy 53.04.00.05
FZ (50% delusional ratio)Alloy 15.050.1250.125Bal.
Alloy 25.050.6250.125
Alloy 35.051.1250.125
Alloy 45.051.6250.125
Alloy 54.052.1250.075

