Article

Material Deformation Behavior in T-Shape Hydroforming of Metal Microtubes

1
Faculty of Engineering, Integrated Graduate School of Medical, Engineering, and Agricultural Sciences, University of Yamanashi, 4-3-11 Takeda Kofu-shi, Yamanashi 400-8511, Japan
2
Department of Engineering and Design, Shibaura Institute of Technology, 3-9-14 Minato-ku, Tokyo 108-8548, Japan
3
Metal forming unit, Polytechnic University, 2-32-1 Ogawanishi-Machi, Kodaira-shi, Tokyo 187-0035, Japan
4
Department of Mechanical System Engineering, Tokyo Metropolitan University, 1-1 Minami-Osawa, Hachioji-shi, Tokyo 192-0397, Japan
*
Author to whom correspondence should be addressed.
Metals 2020, 10(2), 199; https://doi.org/10.3390/met10020199
Submission received: 21 December 2019 / Revised: 25 January 2020 / Accepted: 26 January 2020 / Published: 30 January 2020
(This article belongs to the Special Issue Metal Micro-forming)

Abstract

:
In this study, the material behavior in the T-shape microtube hydroforming (MTHF) of pure copper and stainless-steel SUS304 microtubes with an outer diameter of 500 µm and wall thickness of 100 µm was examined experimentally and numerically. This paper elucidates the basic deformation characteristics, the forming defects, and the forming limit as well as the effects of lubrication/friction and tube length. The hydroformability (bulge height) of the SUS304 microtube was shown to be higher than that of the copper microtube because of the high buckling resistance of SUS304. Good lubrication experimentally led to the high hydroformability of T-shape forming. The length of the microtube significantly affects its hydroformability. Friction resistance increases with increasing tube length and restricts the flow of the microtube material into the die cavity. By comparing the T-shape and cross-shape MHTF characteristics, we verified the hydroformability of the T-shape microtube to be superior to that of the cross-shape microtube theoretically and experimentally. In addition, the process window for T-shape MTHF had a narrower “success” area and wider buckling and folding regions than that for cross-shape MTHF. Furthermore, conventional finite element (FE) modeling without consideration of the grains was valid for MTHF processes owing to the many grains in the thickness direction.

1. Introduction

In recent years, the demand for extremely small tubular parts has increased with the miniaturization of equipment and devices in medical, communication, and electronic fields [1]. To fabricate these microscale metallic tubular parts, tube hydroforming (THF) technology is expected to be applied [2]. However, the hydroforming technology for microtube components requires high precision and fine tooling, a sealing system that can withstand ultrahigh pressure, and a forming machine suitable for microscale processing [3]. In addition, the THF of microtubes might be impossible to simply scale down because of elastic deformation of the tool compared with the normal scale [4], and the size effect [5], friction [6], and other effects will become prominent. In addition, the wall thickness of the microtube increases with downscaling, and handling of the microtube becomes difficult [7]. Therefore, to achieve microtube hydroforming (MTHF), it is necessary to solve these problems. So far, the following investigations have been carried out on MTHF.
Hartl et al. [4,5] successfully deformed an SUS304 stainless-steel tube with an outer diameter of 0.8 mm and a wall thickness of 0.04 mm, where the tubes were expanded to an outer diameter of 1.04 mm. In this process, an internal pressure of 120 MPa, clamping force of 16 kN, and axial compressive force of 800 N were loaded on the SUS304 tube. At the same time, the dimensional error, which was affected by the elastic deformation of the tool, and the cracks caused by the increase in crystal grain size relative to the dimensions of the tube blank were examined. Ngaile et al. [6] developed a simple sealing system with a floating die that could load a maximum internal pressure of 140 MPa on the tube and a maximum die clamping force of 1500 kN. MTHF was carried out using SUS304 tubes with an outer diameter of 1 mm and wall thickness of 0.1 mm, and an outer diameter of 2 mm and wall thickness of 0.2 mm. These tubes were deformed experimentally into T and Y-shapes. In addition, the effects of friction and tube dimensions on the axial compressive force were evaluated by finite element method (FEM) analysis. Cross-shape forming has been investigated by Shirayori et al. [8,9]. Aluminum alloy tubes and copper tubes with outer diameters of 8 mm and thicknesses of 0.5 and 0.8 mm were used in these studies. An aluminum alloy tube loaded with an internal pressure of 25 MPa was deformed to a bulge height of 18.5 mm. Similarly, a copper tube loaded with an internal pressure of 62 MPa was deformed to a bulge height of 20.75 mm. Furthermore, for a fine small magnesium alloy tube with 2.0 mm outer diameter, a bulging test was carried out by Yoshihara et al. [10]. They conducted the bulging test numerically to evaluate the bulging deformation of a fine small tube, which is employed as a medical stent. However, few studies on microtubes with outer diameters of less than 0.8 mm have been reported.
Mori and Manabe, among the present authors, developed a new ultrahigh-pressure MTHF system [11] and applied it to cross-shape MTHF of a phosphorus-deoxidized copper tube with an outer diameter of 0.5 mm. The following results were obtained. (1) To operate the MTHF equipment reliably at the required precision of the microscale under even ultrahigh pressures of over 200 MPa, a new microdie structure was developed with a simplified structure of left and right split dies for easy handling. (2) To reduce the friction resistance between the tube and the die, which would be increased by the size effect, a special axial compressive punch was developed, which has eight grooves cut on the punch surface and end. At the same time, the supplying and sealing of the pressure medium under ultrahigh pressure for the microtube became possible because of the grooves on the punch. (3) A simple ultrahigh-pressure generator and an MTHF device were developed and used in an experiment on cross-shape MTHF for a microtube of 0.5 mm outer diameter. The process windows, forming limit, and forming defects were clarified and classified. (4) In the case of cross-shape MTHF, an excellent bulge height (have = 798 µm) of 1.6 times the initial tube outer diameter was successfully attained. In addition, it was revealed that a higher hydroformability of approximately 80% of the theoretical bulge height was obtained.
However, the possibility of an MTHF process for T-shape and other tube materials for a 0.5-mm outer-diameter microtube was not studied; thus, the material deformation behavior in the T-shape MTHF process has not yet been evaluated. Furthermore, the effects of the difference in the deformation characteristics between T- and cross-shape forming processes and the influential factors such as the tube material and the length of the tube have not been clarified.
For the conventional THF process, it is known that the length of tubes and lubrication condition significantly affect the hydroformability. In the earlier studies on the hydroformability (bulge height) using different tube lengths, it was reported that a longer tube has a lower bulging height, indicating lower hydroformability [12]. However, even for conventional THF, few fundamental investigations on the THF of a long tube have been reported. On the other hand, for medical applications, there has been increasing demand for long integrated complex tubular microcomponents without welded or joined portions in recent years.
In this study, a micro-T-shape forming experiment is performed using the MTHF system developed previously [11]. The objective of the current study is to confirm the deformation behavior and evaluate the hydroformability of the microtube in T-shape forming experimentally and numerically. In addition, the effects of the tube material, tube length, and lubrication condition on the hydroformability of microtubes are clarified. Furthermore, by comparison with the previous cross-shape MTHF results, the featured forming characteristics for T-shape MTHF are clarified in detail.

2. Materials and Methods

2.1. Overview of MTHF System

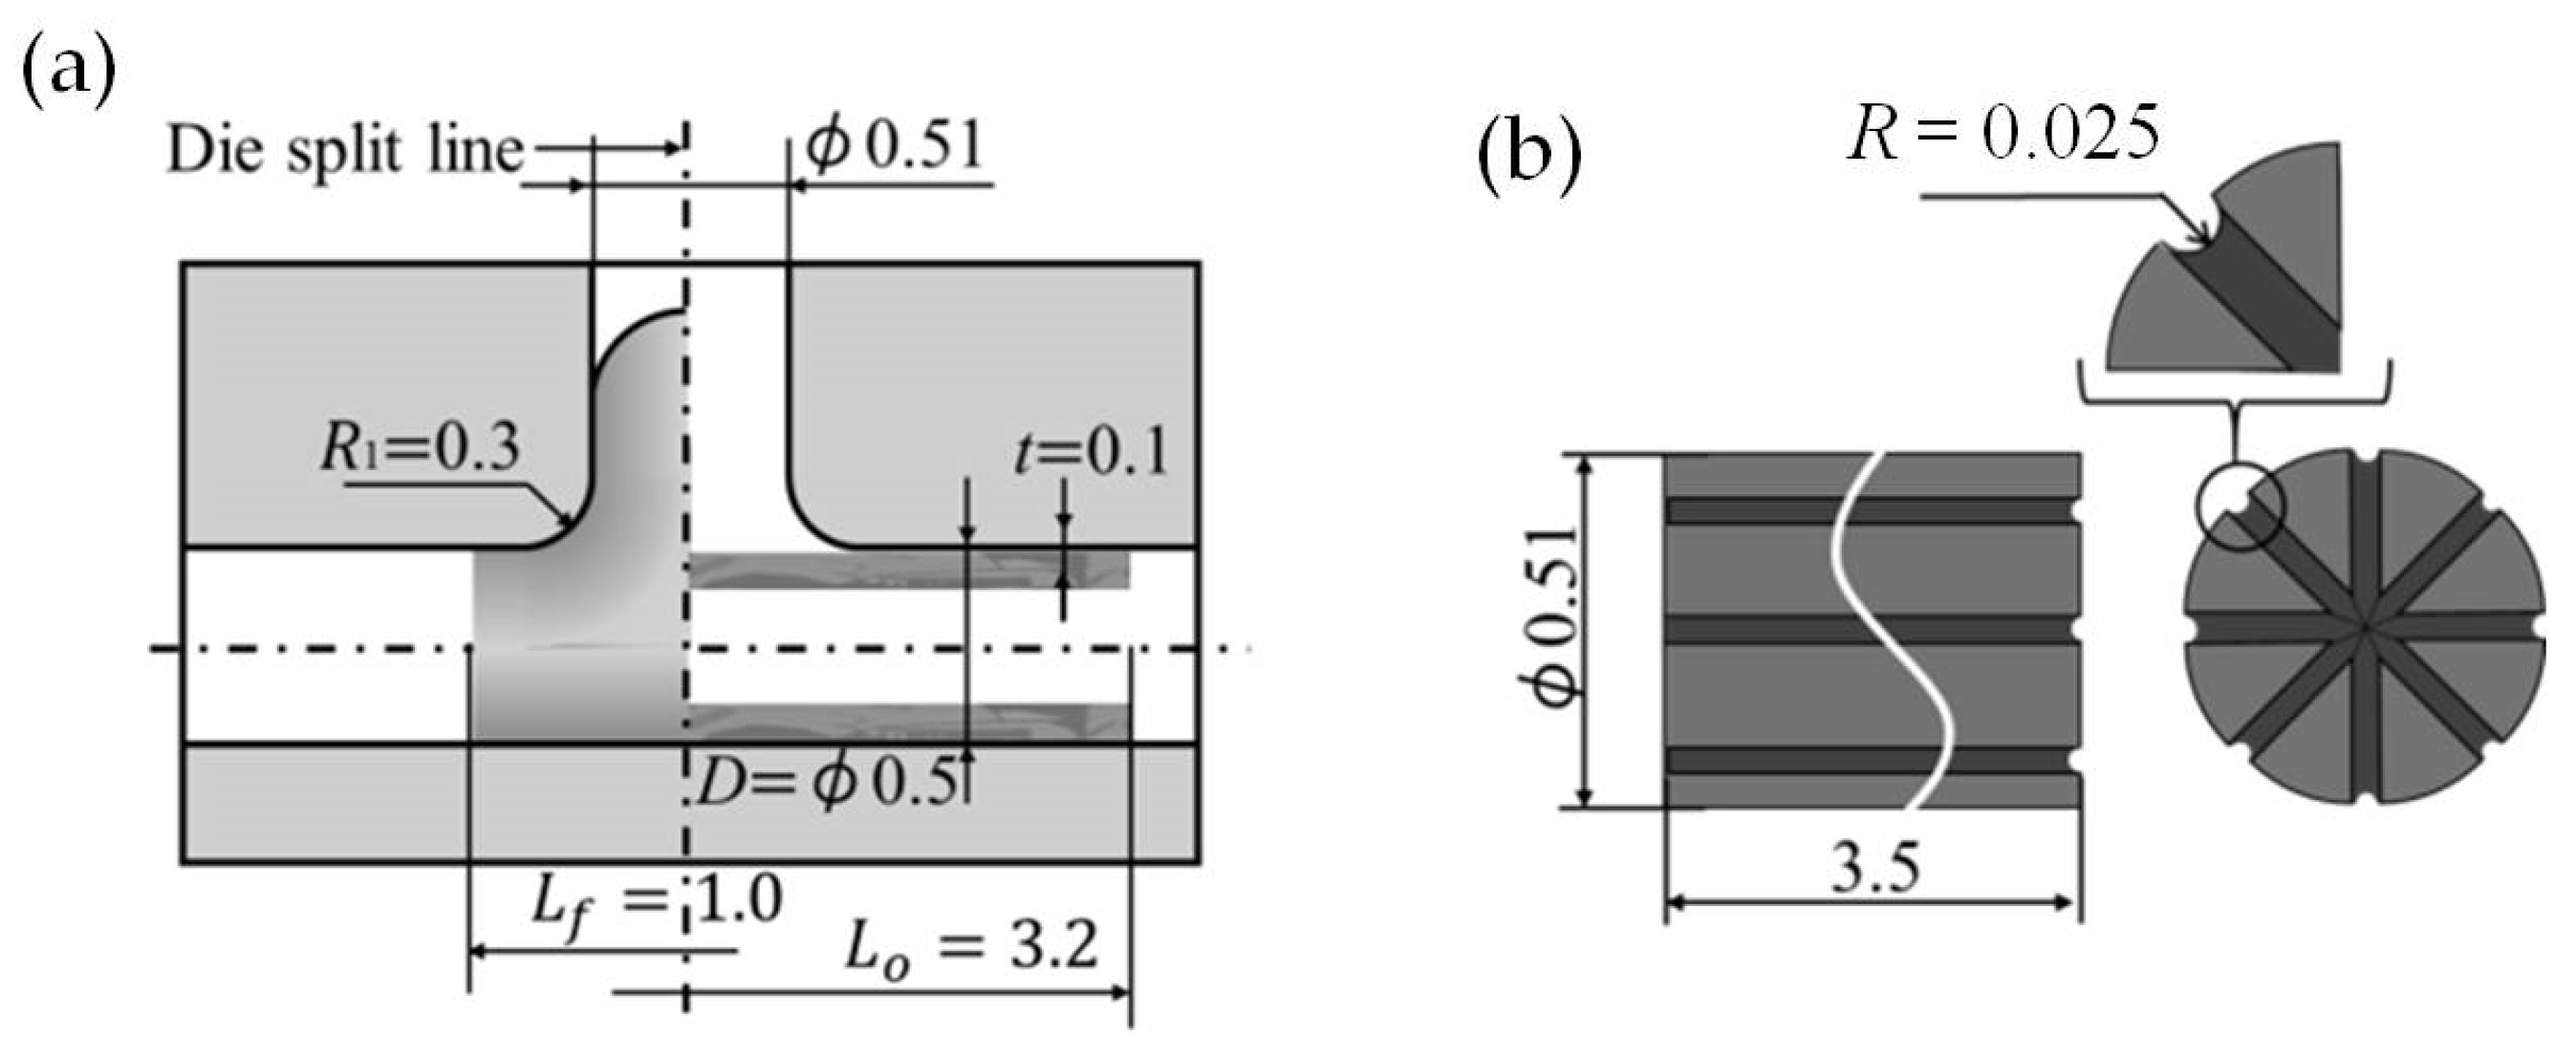
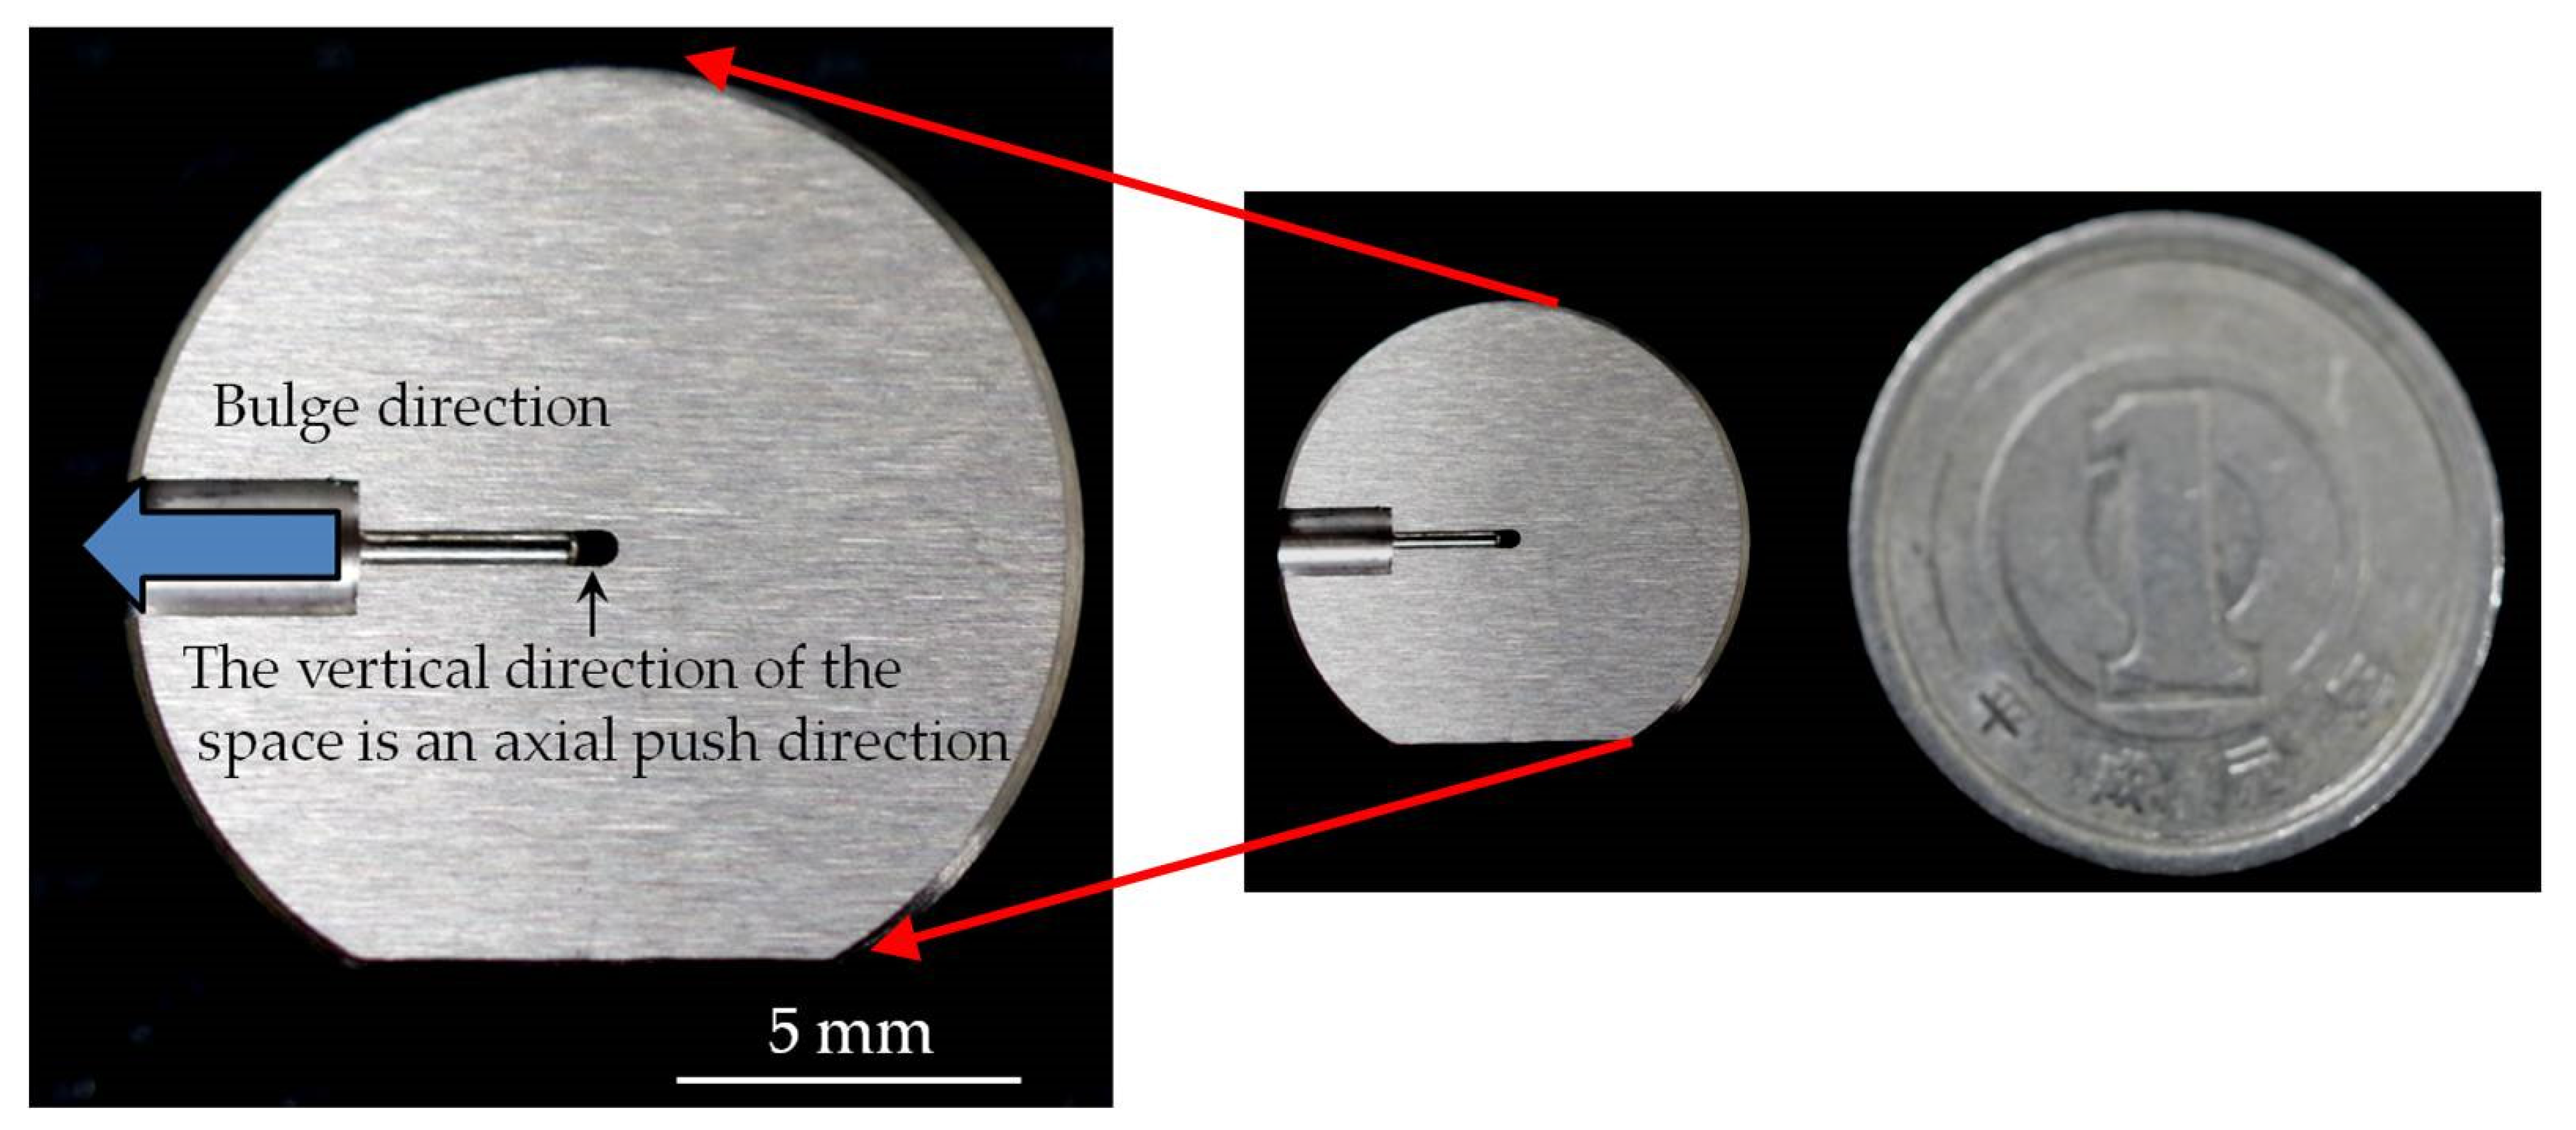
Figure 1a shows the MTHF system used in the experiment. This system was successfully for cross-shape MTHF in a previous study [11]. It is constructed from an MTHF device comprising mounted dies for T-shape forming and an ultrahigh-pressure generator. The MTHF system is compact, as shown in Figure 1b. The axial compressive punch in the figure has a drive system with manually rotated screws, and the screws on each end are synchronized by a gear mechanism, as shown in Figure 1c. The axial compressive displacements at each end were measured by dial gauges connected to the screws. The ultrahigh-pressure generator has length Lu = 120 mm, width Wu = 120 mm, and height Hu = 150 mm. In addition, the MTHF device has length Ld = 200 mm, width Wd = 87 mm, and height Hd = 114 mm. Figure 2 shows the structure and dimensions of the die and the axial compressive punch for MTHF. In consideration of the ease of removing micro-T-shaped samples, the divided die, which has left and right parts as shown in Figure 2a, was employed. Both the microdie and the axial compressive punch were made of cemented carbide. The die cavity has a diameter of 0.51 0 + 0.010 mm and die shoulder radius of r1 = 0.3 mm, and the outer diameter of the axial compressive punch is 0.51 0.005 0.001   mm. The axial compressive punch has grooves (R = 0.025 mm) machined on the outer periphery and end. A hydraulic pressure medium flowing on the grooves reduces the friction, which increases owing to the size effect between the tube and the die. At the same time, the axial compressive punch enables the supply and sealing of the hydraulic pressure medium under ultrahigh pressure (Figure 2b). Figure 3 and Figure 4 respectively show the appearance of one of the divided dies and the profiles of the die shoulder for the designed die and measured machined die. The shoulder profile in the machined die was measured using a confocal laser microscope VK-100 (KEYENCE Corp., Osaka, Japan). It can be seen that the die shoulder was cut precisely.
The ultrahigh-pressure generator (maximum hydraulic pressure 400 MPa) generates ultrahigh pressure by compressing the hydraulic pressure medium, which was filled into the cylinder with a piston attached to a precision universal testing machine. Loading an ultrahigh pressure of 250 MPa is possible owing to this mechanism. The hydraulic pressure was measured with a pressure sensor having a rated capacity of 500 MPa.

2.2. Materials Used and Experimental Methods

The materials used are phosphorus-deoxidized copper tubes (C1220-H) and SUS304 tubes with an outer diameter D = 0.5 mm and wall thickness t = 0.1 mm. A test specimen was cut to an initial length L0 of 3.2 mm. The end surface of the specimen for experiments was polished with #4000 abrasive paper using a jig to increase the uniformity of the loaded axial compressive force and ensure the sealability in the pressurization stage. The perpendicularity on the tube end was ensured to be 90 ± 2°. The inner and outer diameters of the tubes were measured at cross-sections of the tubes using a digital microscope VHX-900 (KEYENCE Corp., Osaka, Japan).
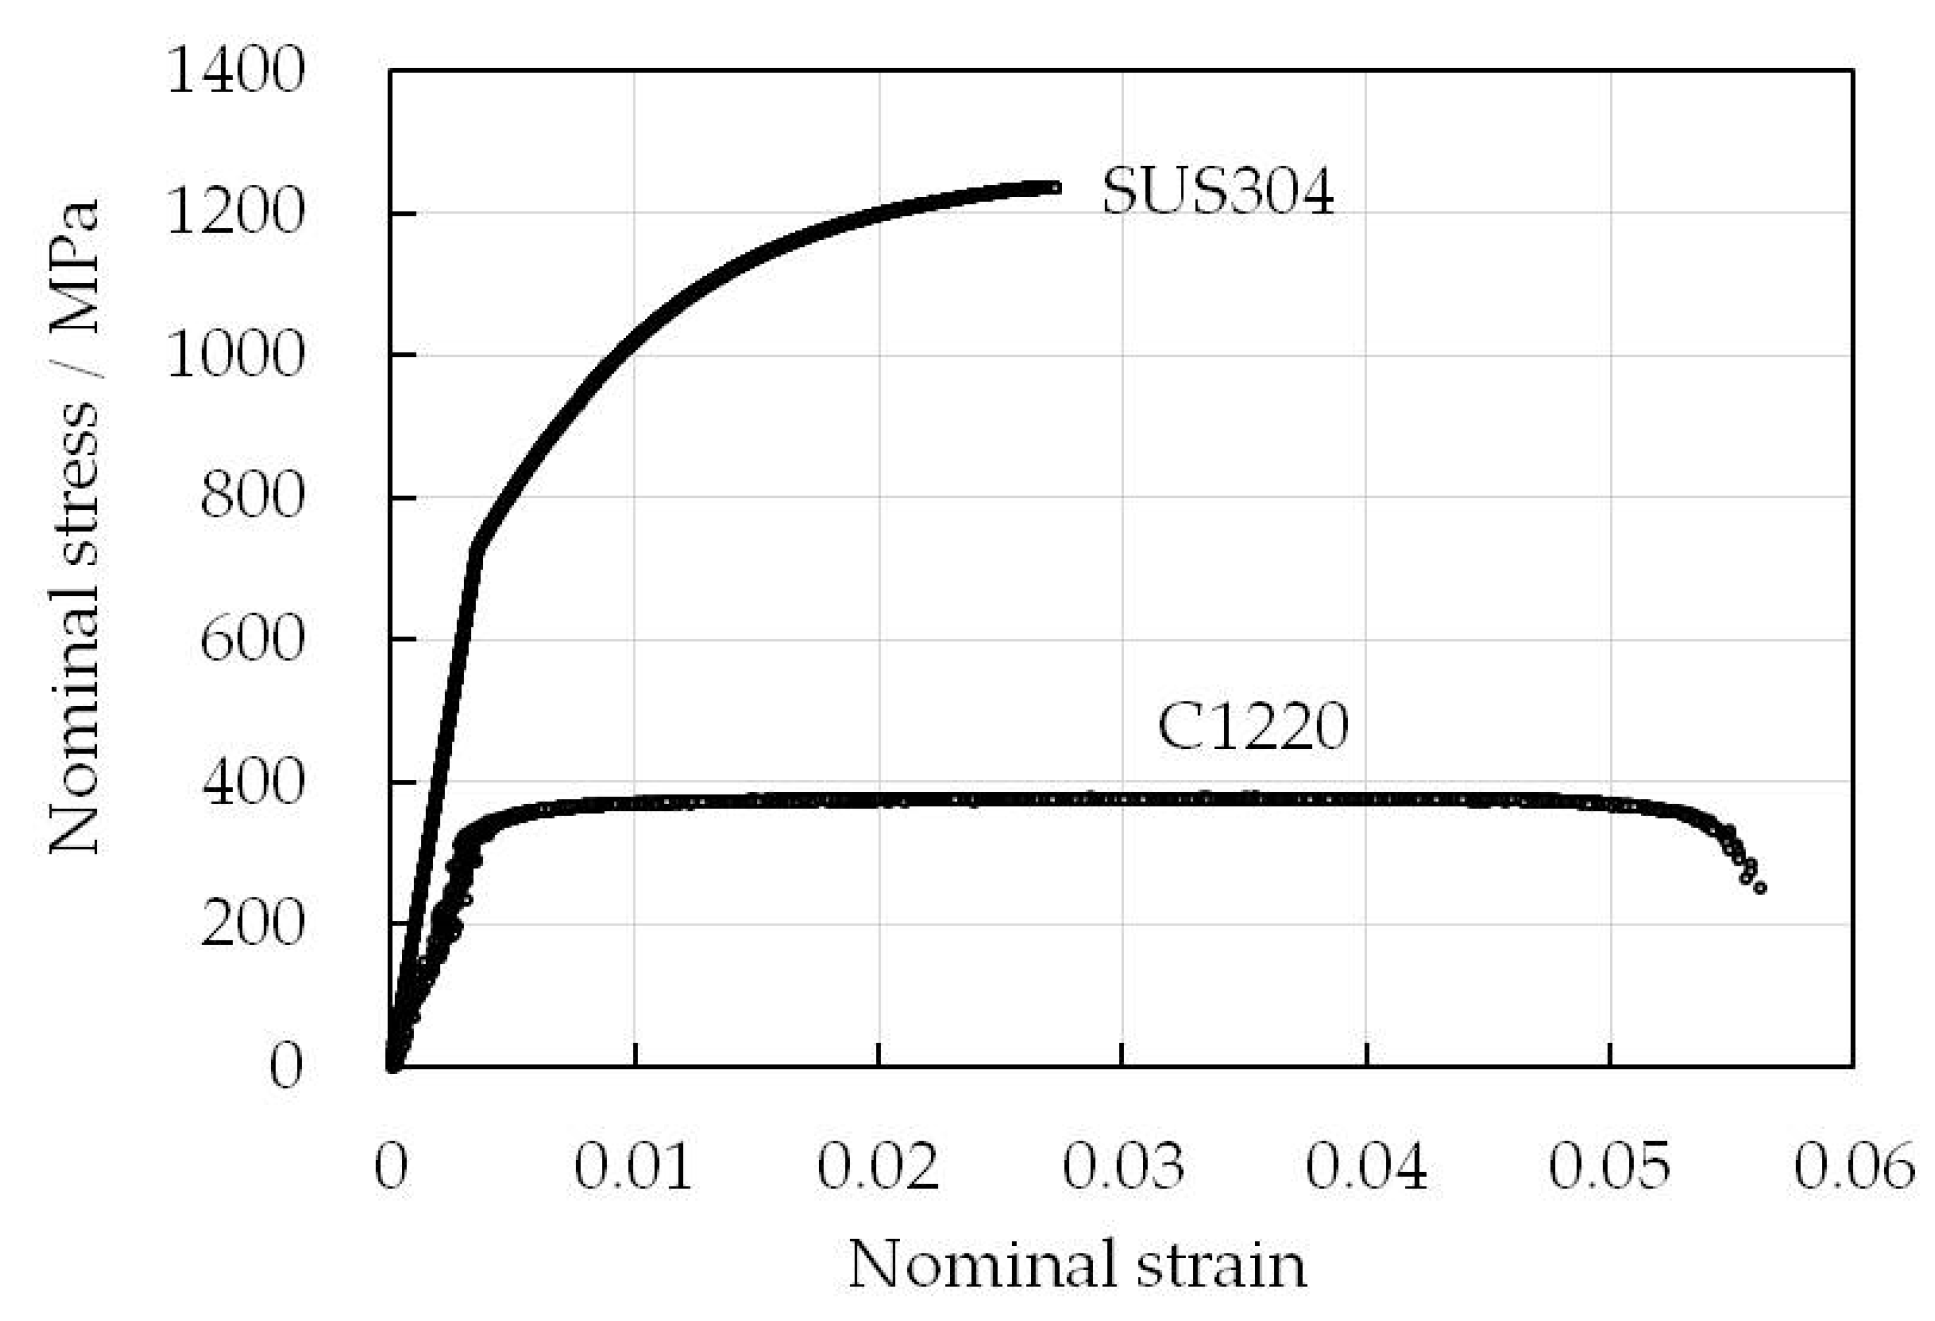
For the tensile test, a precision universal testing machine AG-50kN (SHIMADZU Corp., Kyoto, Japan) was used. The tubular test specimen was chucked between the upper and lower chucks with a distance between each chuck of approximately 14 mm. Elongation of the test specimen was measured by a video-type noncontact extensometer DVE-101 (SHIMADZU Corp., Kyoto, Japan) on the basis of the gage length (approximately 10 mm). The speed of the applied tensile load was 0.5 mm/min. Figure 5 shows the nominal stress–nominal strain diagram of specimens obtained from the tensile test. It was confirmed that the test results of several specimens had material properties with little variation. A C1220 tube has an almost constant stress after yielding, and the breaking strain is 0.056, whereas the yield point of an SUS304 tube is about 2.25 times larger than that of a C1220 tube, and the subsequent strain-hardening characteristic is outstanding. Its tensile strength exceeds 1200 MPa, which is more than three times that of copper. No detailed data were obtained on the elongation from the tensile test of SUS304 in this study. In addition, by comparing with the tensile test results obtained with a different loading speed of 0.2 mm/min, no marked strain rate dependence was observed.
Figure 6a shows the basic loading path of the internal pressure ph and axial feeding ΔL adopted in the micro-T-shape forming experiment. In the loading path, Stage (1) is the sealing of the hydraulic pressure applied, whereby the tube is compressed by the punch with distance ΔL1 from the two ends. ΔL1 is the distance required to seal the pressure medium flowing from the axial compressive punch to the microtube and is determined below the limit at which the microtube buckles due to axial compression. In this experiment, ΔL1 = 150 µm for the copper tube (C1220) and ΔL1 = 450 µm for the SUS304 tube were set on the basis of the results of previous studies [11,13]. Next, in Stage (2), the hydraulic pressure is loaded to the predetermined internal pressure ph. This pressure is maintained after the pressure medium (oil) is filled and the air in the tube is vented. ph is set in the range of 0 to 280 MPa. After that, in Stage (3), axial feeding to deform the tube is carried out to the maximum axial feeding length ΔL2 of 1000 µm from each end while maintaining the internal pressure ph.
The loading path used to confirm the process window is shown in Figure 6b. In Stage (1), the path is selected to reveal the buckling limit of the tube ΔLb in the sealing stage. In Stages (2) and (4), the paths are for determining the bursting limit of the tube pf. In Stage (3), the path is a combination of those in Stages (2) and (4). The path in Stage (4) traces a complicated route, and it is difficult to conduct experiments with the present system. Therefore, pf was determined by finite element method (FEM) analysis. In this MTHF machine, machine oil was used as the hydraulic pressure medium. Fluorocarbon, which was applied by dry spraying, was employed for lubrication between the tube and the die.

2.3. FEM Model

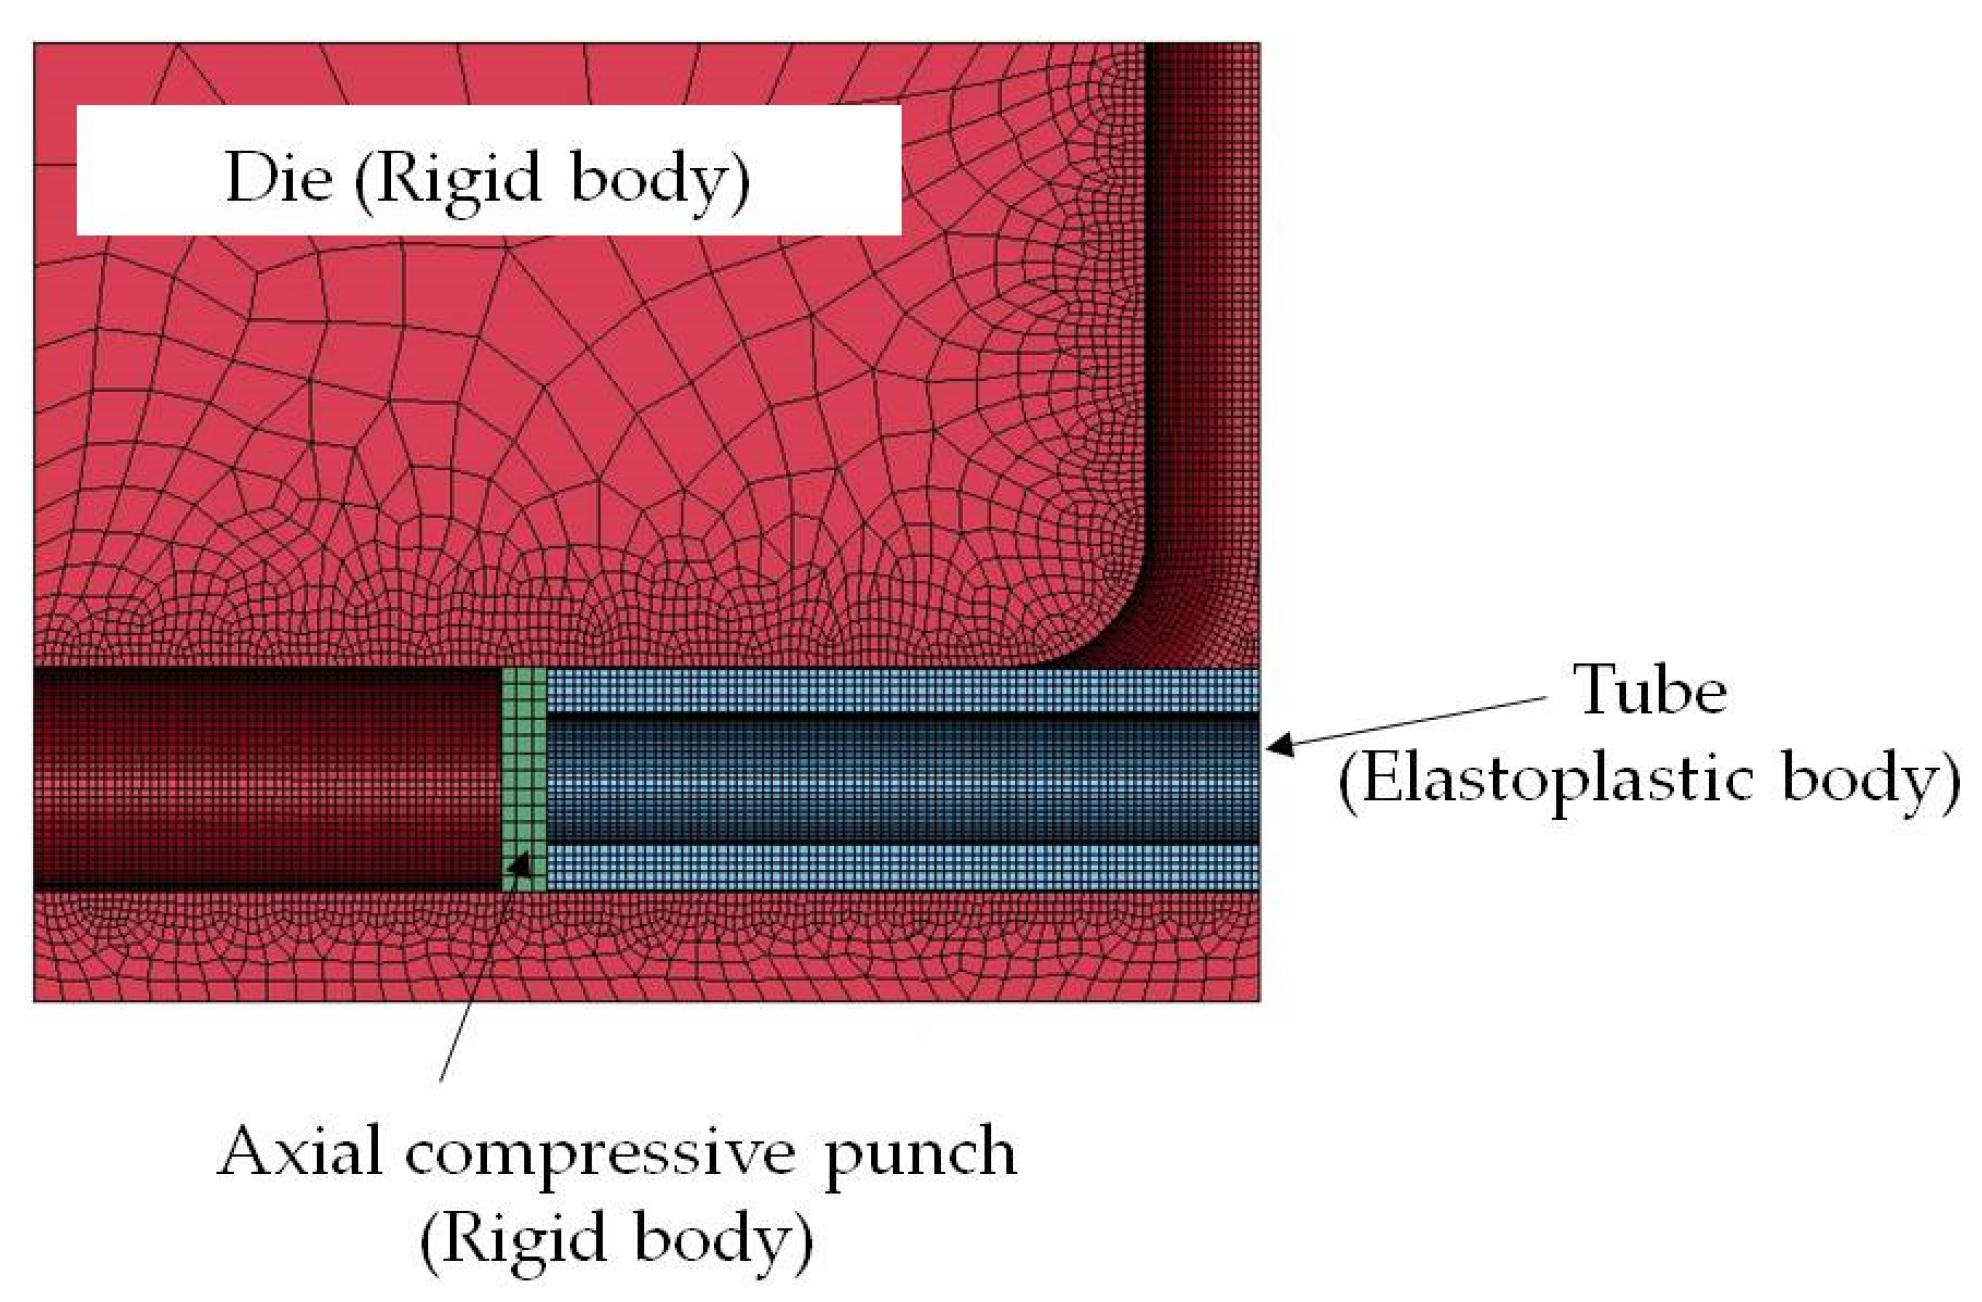
The MTHF process was analyzed by FEM to evaluate the deformation behavior and characteristics of the tube. The FEM code used was the dynamic explicit LS-DYNA 3D (ver. 19. 2) (ANSYS Inc. Canonsburg, PA, USA). The FE model was constructed for one-quarter of the entire part considering the geometrical symmetry of the T-shape forming model, as shown in Figure 7. The model was based on the dimensions of the microtube and the die (Figure 2a). Solid elements were used for the tube, the die, and the axial compressive punch. A rigid body was employed for the die and the punch model. The tube model was meshed with eight-node elements and an isotropic elastoplastic material was assumed. The minimum element size of the tube was 20 µm × 20 µm × 15.7 µm. The mechanical properties of the C1220 copper microtube used in the simulations are shown in Table 1. The material characteristics of the tube were determined using the true stress–true strain diagram in Figure 5 in the uniform deformation region. The stress–strain data were input as the values approximated by a multiline approximation approach. The data in the large-strain region were extrapolated and input. In the simulation, the contact state was assumed using the normal Lagrange method. The Coulomb friction model was used in the simulation, and the friction coefficients μs (static) and μd (kinetic) between the tube and the die used in the simulation were 0.01 and 0.005, 0.025 and 0.015, 0.1 and 0.05, and 0.2 and 0.15, respectively. In the simulation, the internal pressure and the axial feeding were linearly loaded along the steplike loading path in Figure 6a.

3. Results and Discussion

3.1. Deformation Behavior in T-Shape MTHF Process

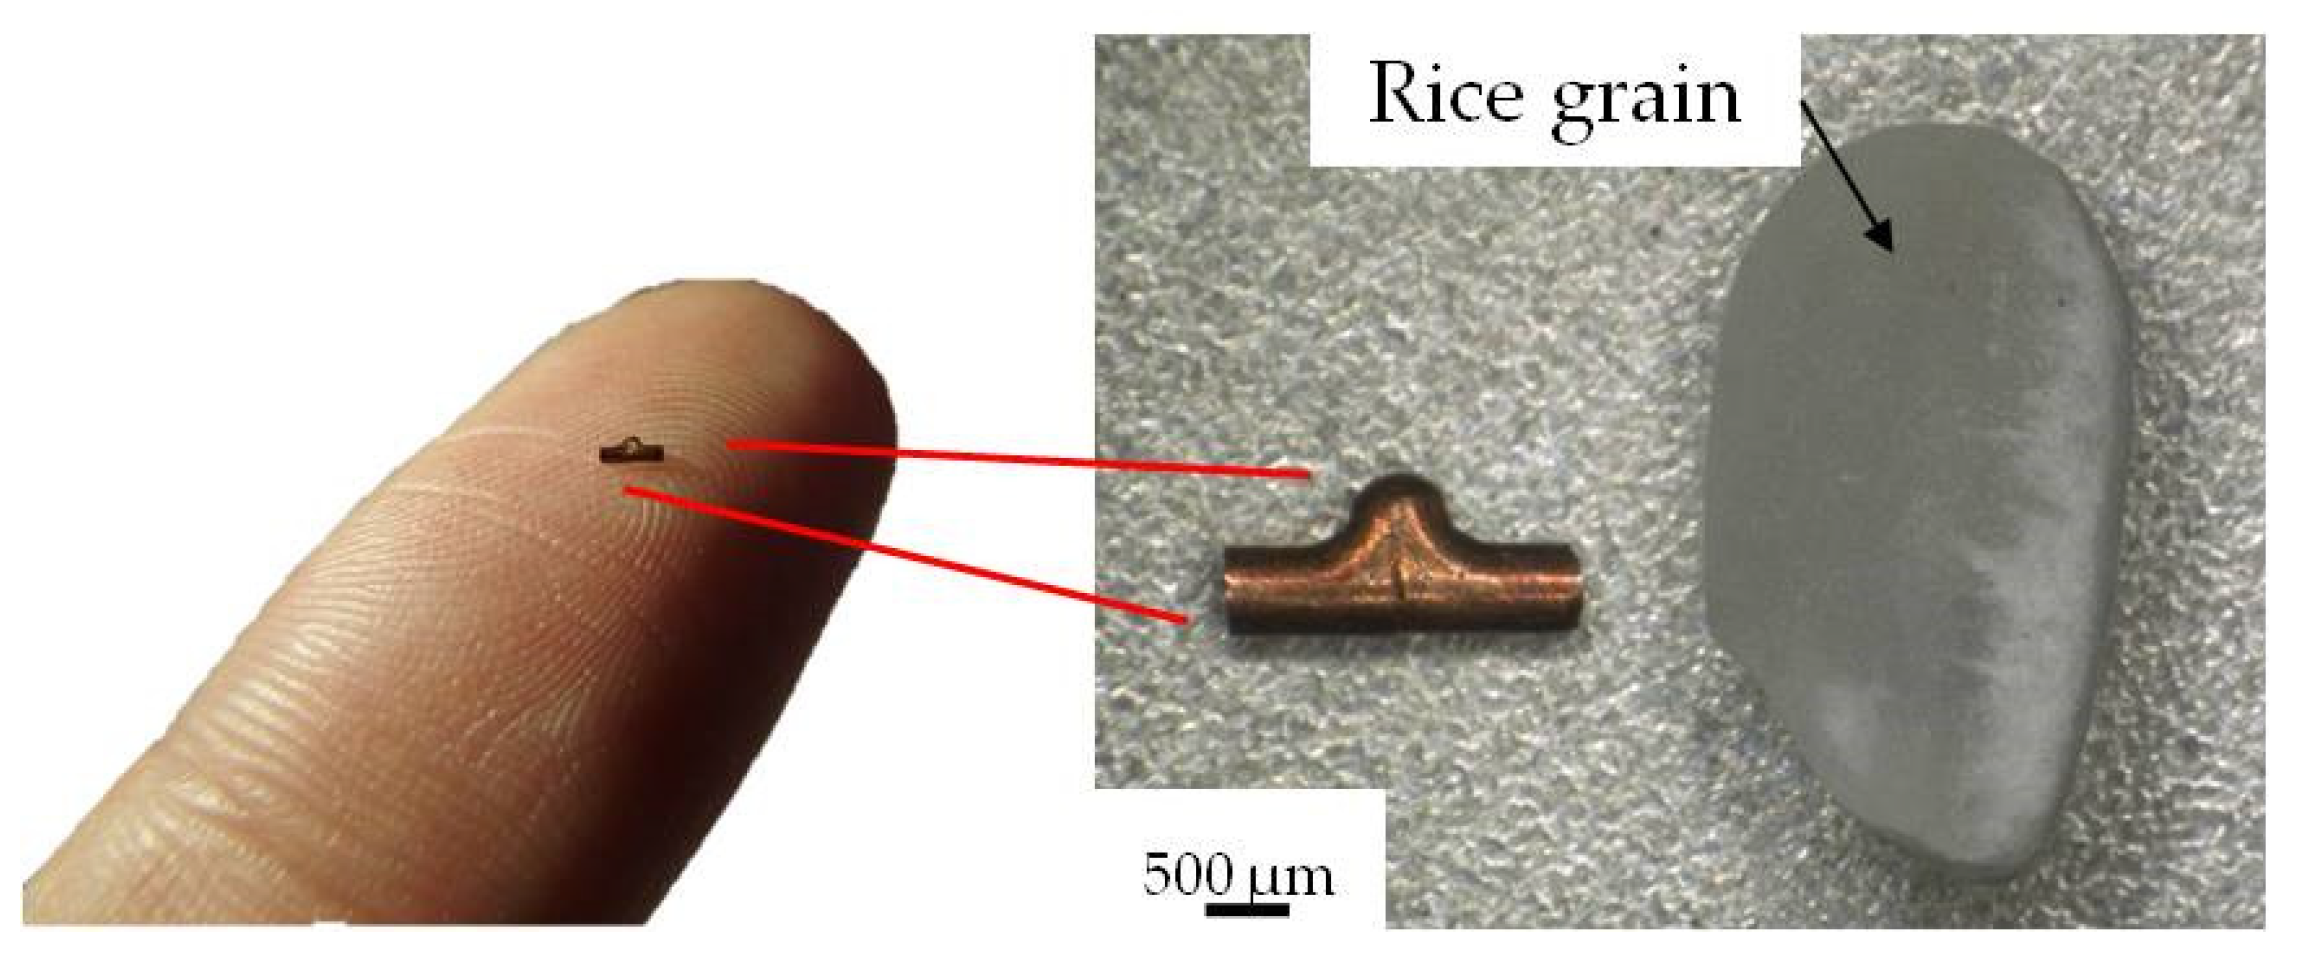
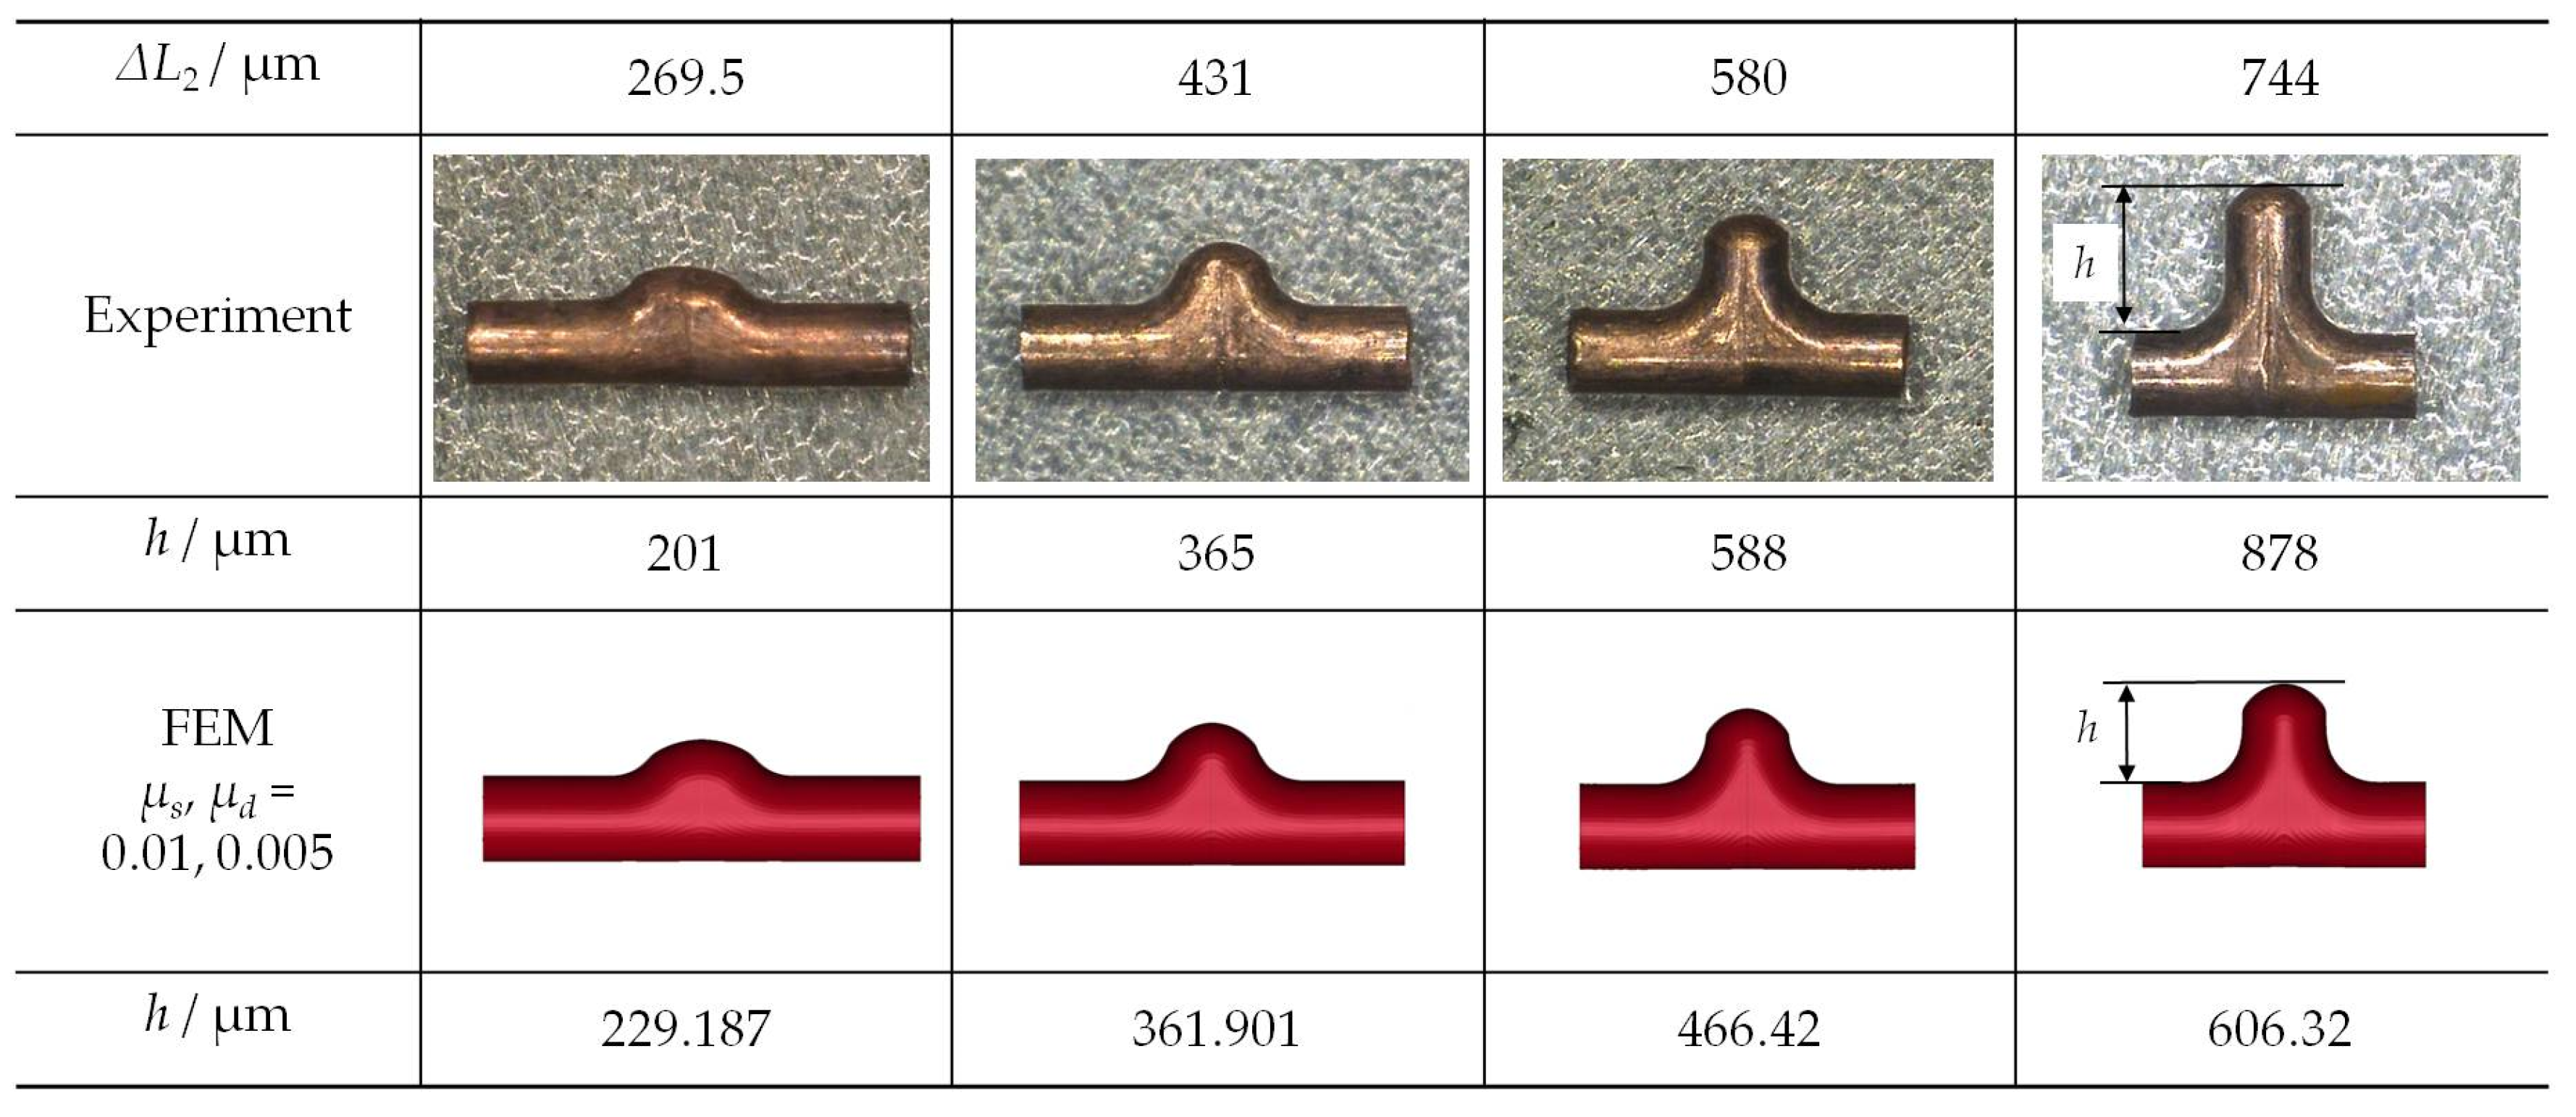
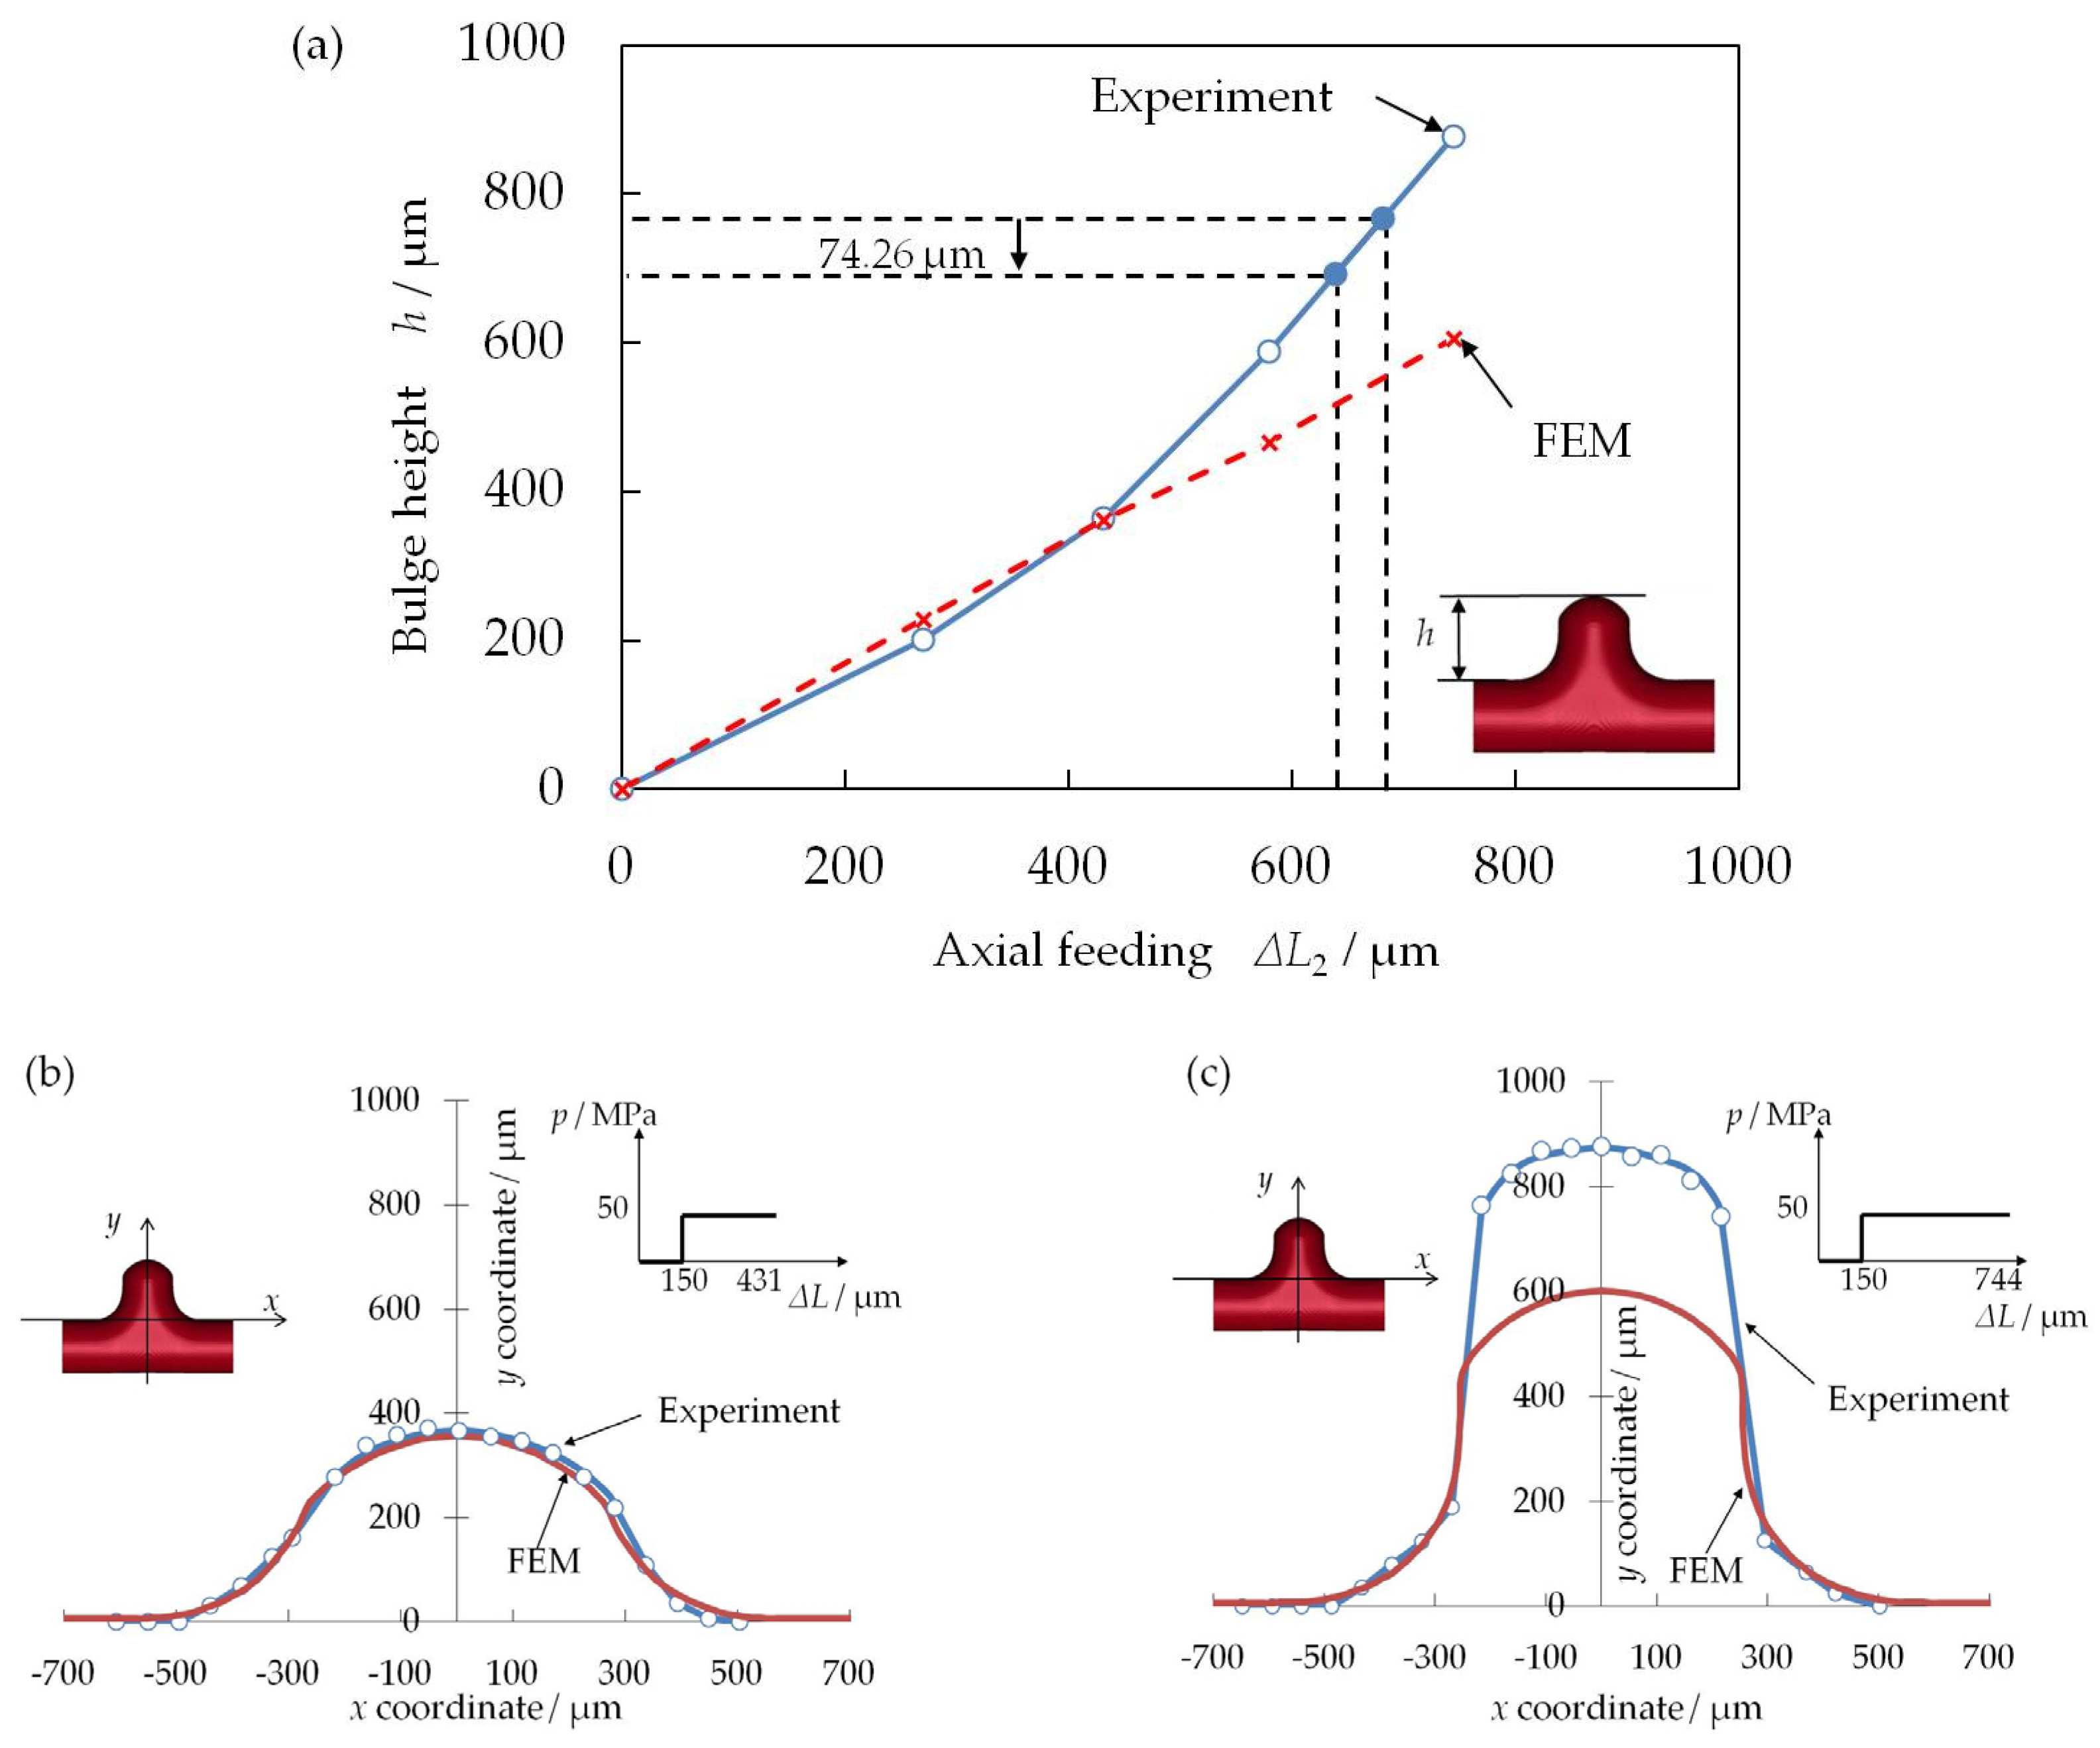
Figure 8 shows the appearance of a successful micro-T-shape sample of a C1220 tube on a finger and the magnified microsample with a rice grain [14]. Figure 9 shows the deformation behavior of the microtube during MTHF and a comparison of deformation profiles obtained by experiment and FE analysis. The input conditions of MTHF in FE analysis are ph = 50 MPa, μs = 0.01, and μd = 0.005. The bulge height h grows with increased axial feeding ΔL2 in both the experiment and analysis. From the comparison, it is seen that the two sets of results are in good agreement qualitatively. Using the data on bulge height shown in Figure 9, we examined the relationship between bulge height and axial feeding. Figure 10a shows the bulge height behavior in T-shape MTHF for the copper tube. The bulge height grows linearly with the increased axial feeding amount ΔL2 in the early stage. However, in the late stage, the experimental height gradually becomes larger than the simulated bulge height. In particular, when ΔL2 is 744 µm, a significant difference arises in the bulge height between the experimental and FEM results. This variation in the bulge height with the increasing axial feeding amount is shown in Figure 10a. From this figure, this behavior of bulge deformation growth can be well understood. In the early deformation stage, the simulated result agrees very well with the experimental result up to ΔL2 of about 430 µm. However, after that, the experimental result increases gradually and then rapidly, but the simulated result continues to increase steadily. Figure 10b shows the shape of samples obtained in the experiment and analysis at ΔL2 = 431 µm. Not only the bulge height but also the shape of the samples was almost in agreement. However, the shape of the samples differed between the experiment and analysis at ΔL2 = 744 µm, as shown in Figure 10c; the branch was higher in the experiment.
Therefore, to investigate the cause of the rapid increase in the bulge height seen in Figure 10, we investigated what happens inside the tube when ΔL2 is about 430 µm or more. Figure 11 shows the deformation state inside the tube observed from the axial cross-sections of T-shape samples with different loading path conditions. Figure 11 shows the axial cross-section of the microtube with the loading conditions of (a) ph = 50 MPa and ΔL = 450 μm and (b) ph = 120 MPa and ΔL = 700 μm. Under conditions (a), wrinkling/buckling occurs at the bottom side opposite the branch side. On the other hand, under conditions (b), despite the higher internal pressure applied, the buckling at the bottom of the tube is not suppressed. Moreover, since axial feeding is advanced further, the buckling deformation occurs and progresses to folding deformation. These results suggest that the difference in bulge height behavior arising in the later stage of the process in Figure 10a is due to the occurrence of buckling at the bottom of the tube, localized variation in the wall thickness distribution, and the change in the lubrication conditions during the process.
Figure 12 shows the overall appearance and axial cross-section of the T-shaped SUS304 tube. Even though the bulge height is 500 μm or more, which is greater than the bulge height in Figure 11, there is no buckling at the bottom of the tube, and the entire bottom thickens more uniformly. Thus, the thickening and buckling behaviors on the bottom of the SUS304 tube is different from those of the copper tube. The cause is considered to be the difference in the buckling resistance of the tube materials used.
The empirical buckling stress σK of a cylindrical tube under axial compression was formulated by Miyagawa et al. [15] on the basis of Geckeler’s plastic buckling theory [16]. When the ratio of the diameter to the wall thickness of the tube is expressed as d0/t0, the plastic buckling stress of the tube is expressed by
σ k σ B =   ( 1 0.026 ( d 0 t 0 ) 0.5 ( d 0 t 0 ) 1 )
where σB is the tensile strength. From Equation (1), the plastic buckling stress of the C1220 and SUS304 microtubes with a diameter of 0.5 mm and a wall thickness of 0.1 mm can be calculated by using the tensile strengths of the copper tube, σB = 375 MPa, and the stainless-steel tube, σB = 1235 MPa, which was obtained from Figure 5. The calculated plastic buckling stresses of the copper microtube and stainless-steel microtube were 342.5 MPa and 1127.97 MPa, respectively. Thus, the nominal strain at the onset of plastic buckling can be obtained from the stress–strain diagram in Figure 5 using the calculated plastic buckling stresses. The nominal strains of the copper and stainless-steel tubes are determined to be approximately 0.00413 and 0.0144, respectively. Thus, it is seen that the strain at the onset of plastic buckling strongly depends on the material properties; the plastic buckling onset strain of SUS304 is much larger than that of C1220, and the plastic buckling resistance of SUS304 is high. Since SUS304 has a higher plastic buckling resistance than C1220, it is concluded that for SUS304, the occurrence of plastic buckling at the bottom side opposite the branch is suppressed and delayed. Consequently, it can be concluded that a microtube material with high buckling resistance has high micro-hydroformability in T-shape MTHF.

3.2. Effect of Lubrication/Friction on Bulge Height and Material Behavior in Micro-T-Shape Forming

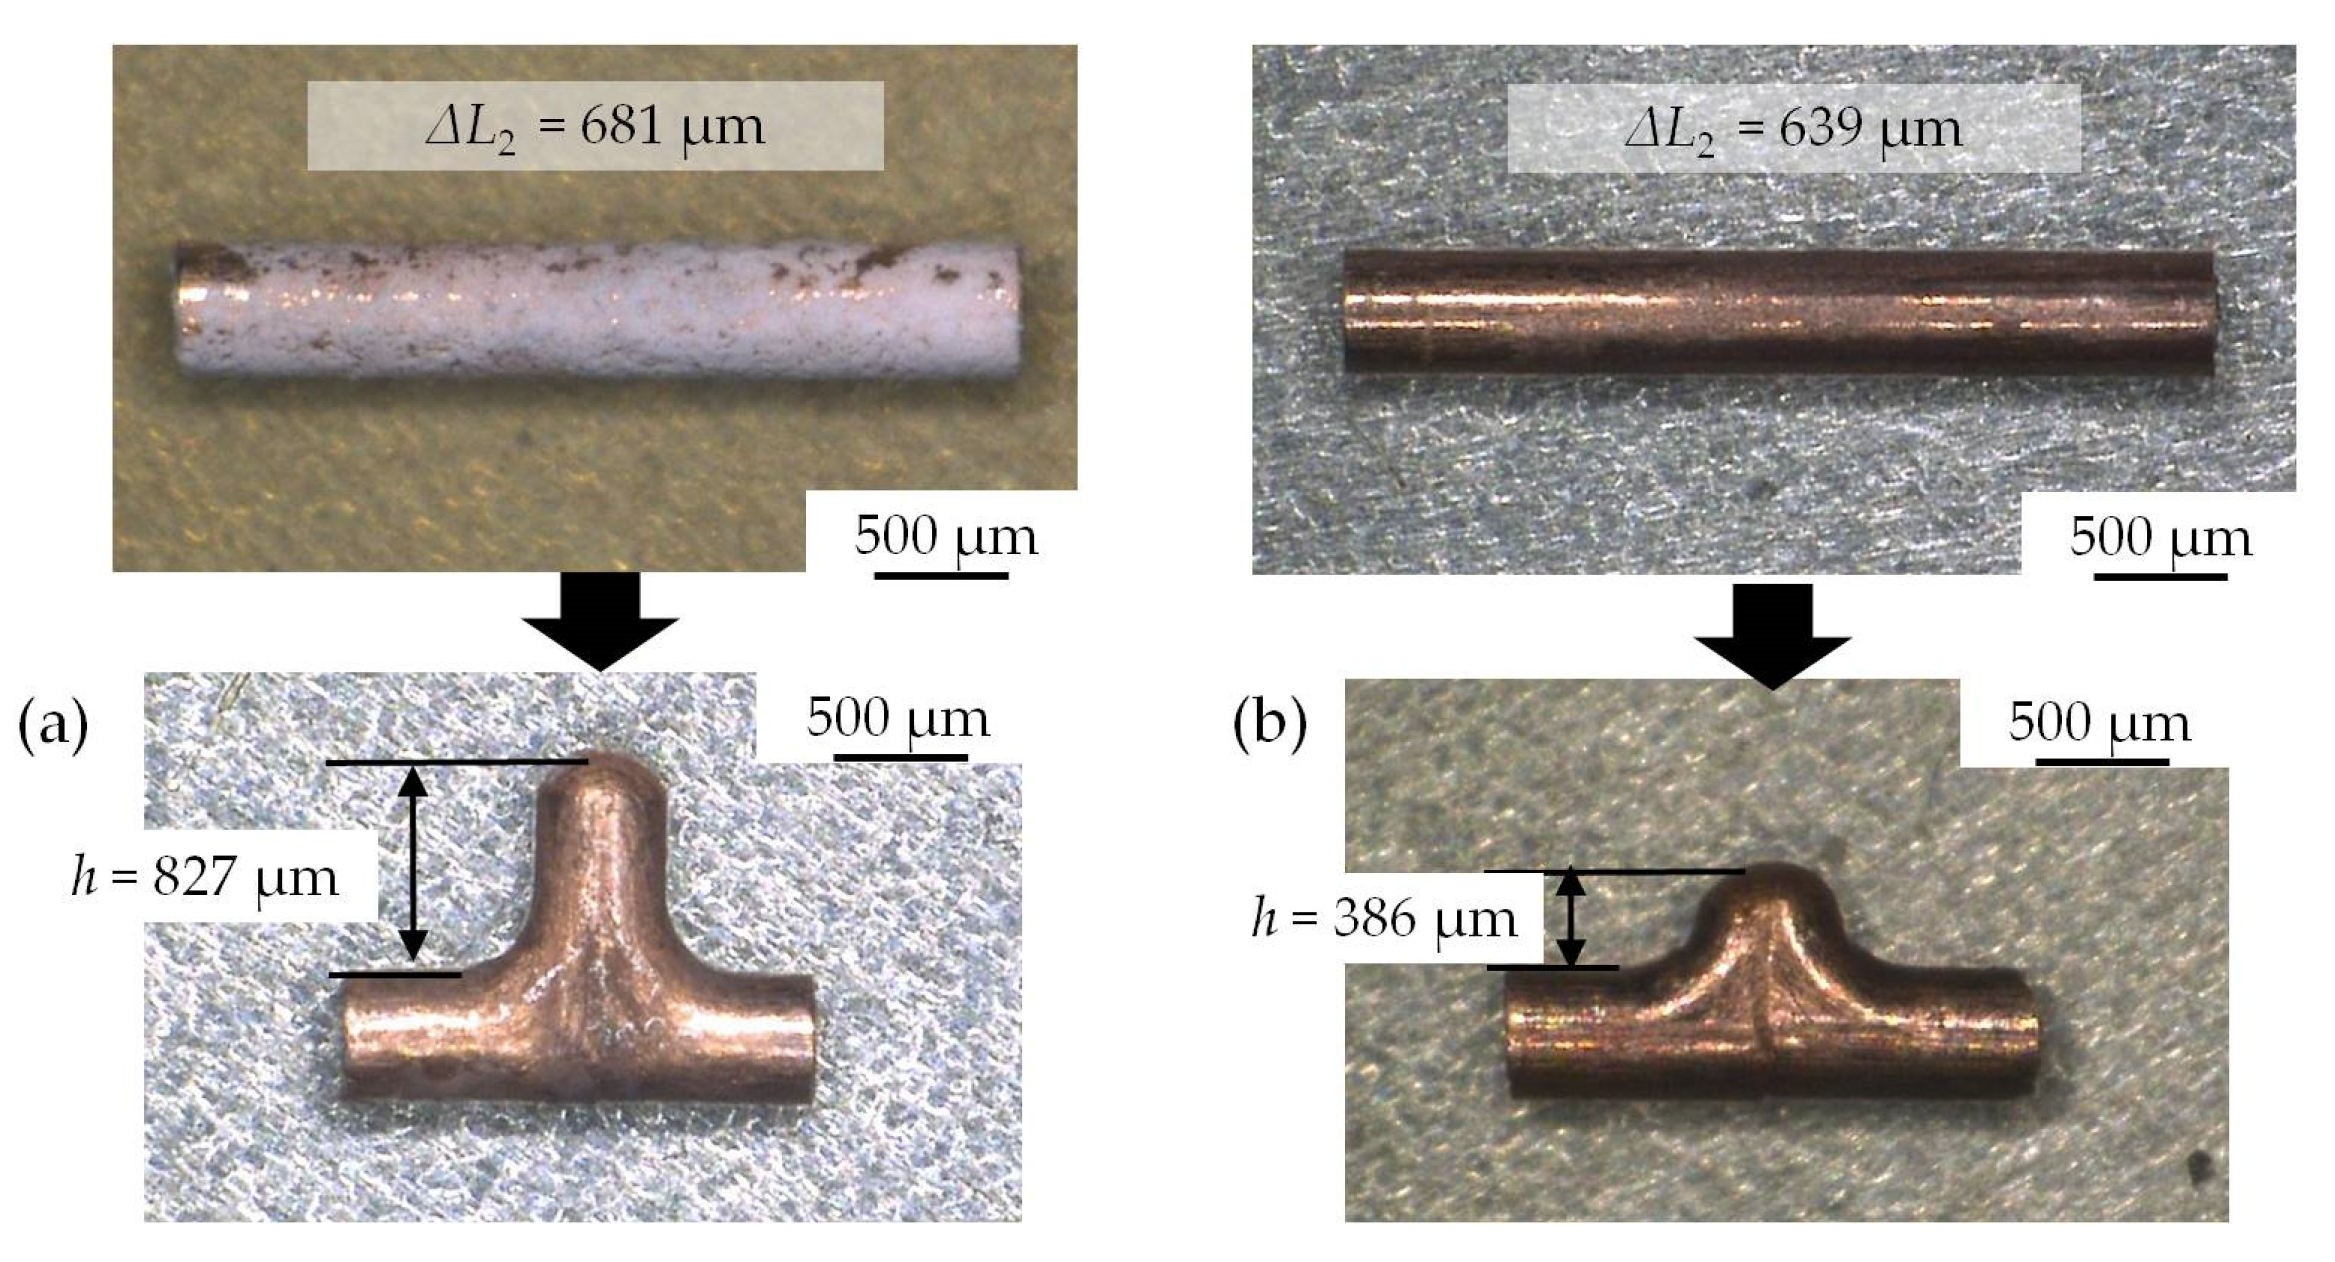
The size effects of lubrication/friction are that the tribological characteristics increase with the miniaturization of process dimensions [17], and with the microscaling of dimensions, the lubrication effect decreases [18]. In the deformation of microscale parts, friction affects the formability of parts because the ratio of the volume to surface area of parts increases [6,18]. Therefore, it is necessary to evaluate the effect of lubrication/friction on hydroformability in MTHF. To determine confirm such effects, the bulge height h after the T-shape MTHF of a C1220 tube was evaluated under different lubrication conditions: no lubrication (degreasing treatment) and fluorocarbon lubrication. Figure 13 shows the appearance of the initial test specimens and the T-shape samples under the different lubrication conditions with the internal pressure ph and the axial feeding amount ∆L2 during loading unchanged. The bulge height h obtained with fluorocarbon lubricant is considerably larger than that with no lubrication. However, under the fluorocarbon condition (Figure 13a), the amount of axial feeding is slightly larger than that in the case of no lubrication (Figure 13b). As a result, the bulge height h with fluorocarbon lubricant was twice that of the sample without the fluorocarbon coating shown in Figure 13b. If both of these experiments had been conducted with the same amount of axial feeding (∆L2 = 639 μm), the bulge height h with fluorocarbon lubrication would be expected to be reduced by 74.26 μm judging from Figure 10a. However, it is possible that the lubrication state on the friction interface is complicated, and the no-lubrication condition greatly changes owing to adherence of leaked pressure medium to microtube because of the sealing mechanism mentioned below. In any case, it can be confirmed that the lubrication condition greatly affects the deformation behavior and the bulge height, or hydroformability, in T-shape MTHF. Furthermore, as can be seen from the microtooling of the MTHF system in Figure 2b, some pressure medium may flow over and adhere to the outer surface of the tube blank owing to the structure of the apparatus. Therefore, it has not been determined whether a no-lubrication state can be realized.
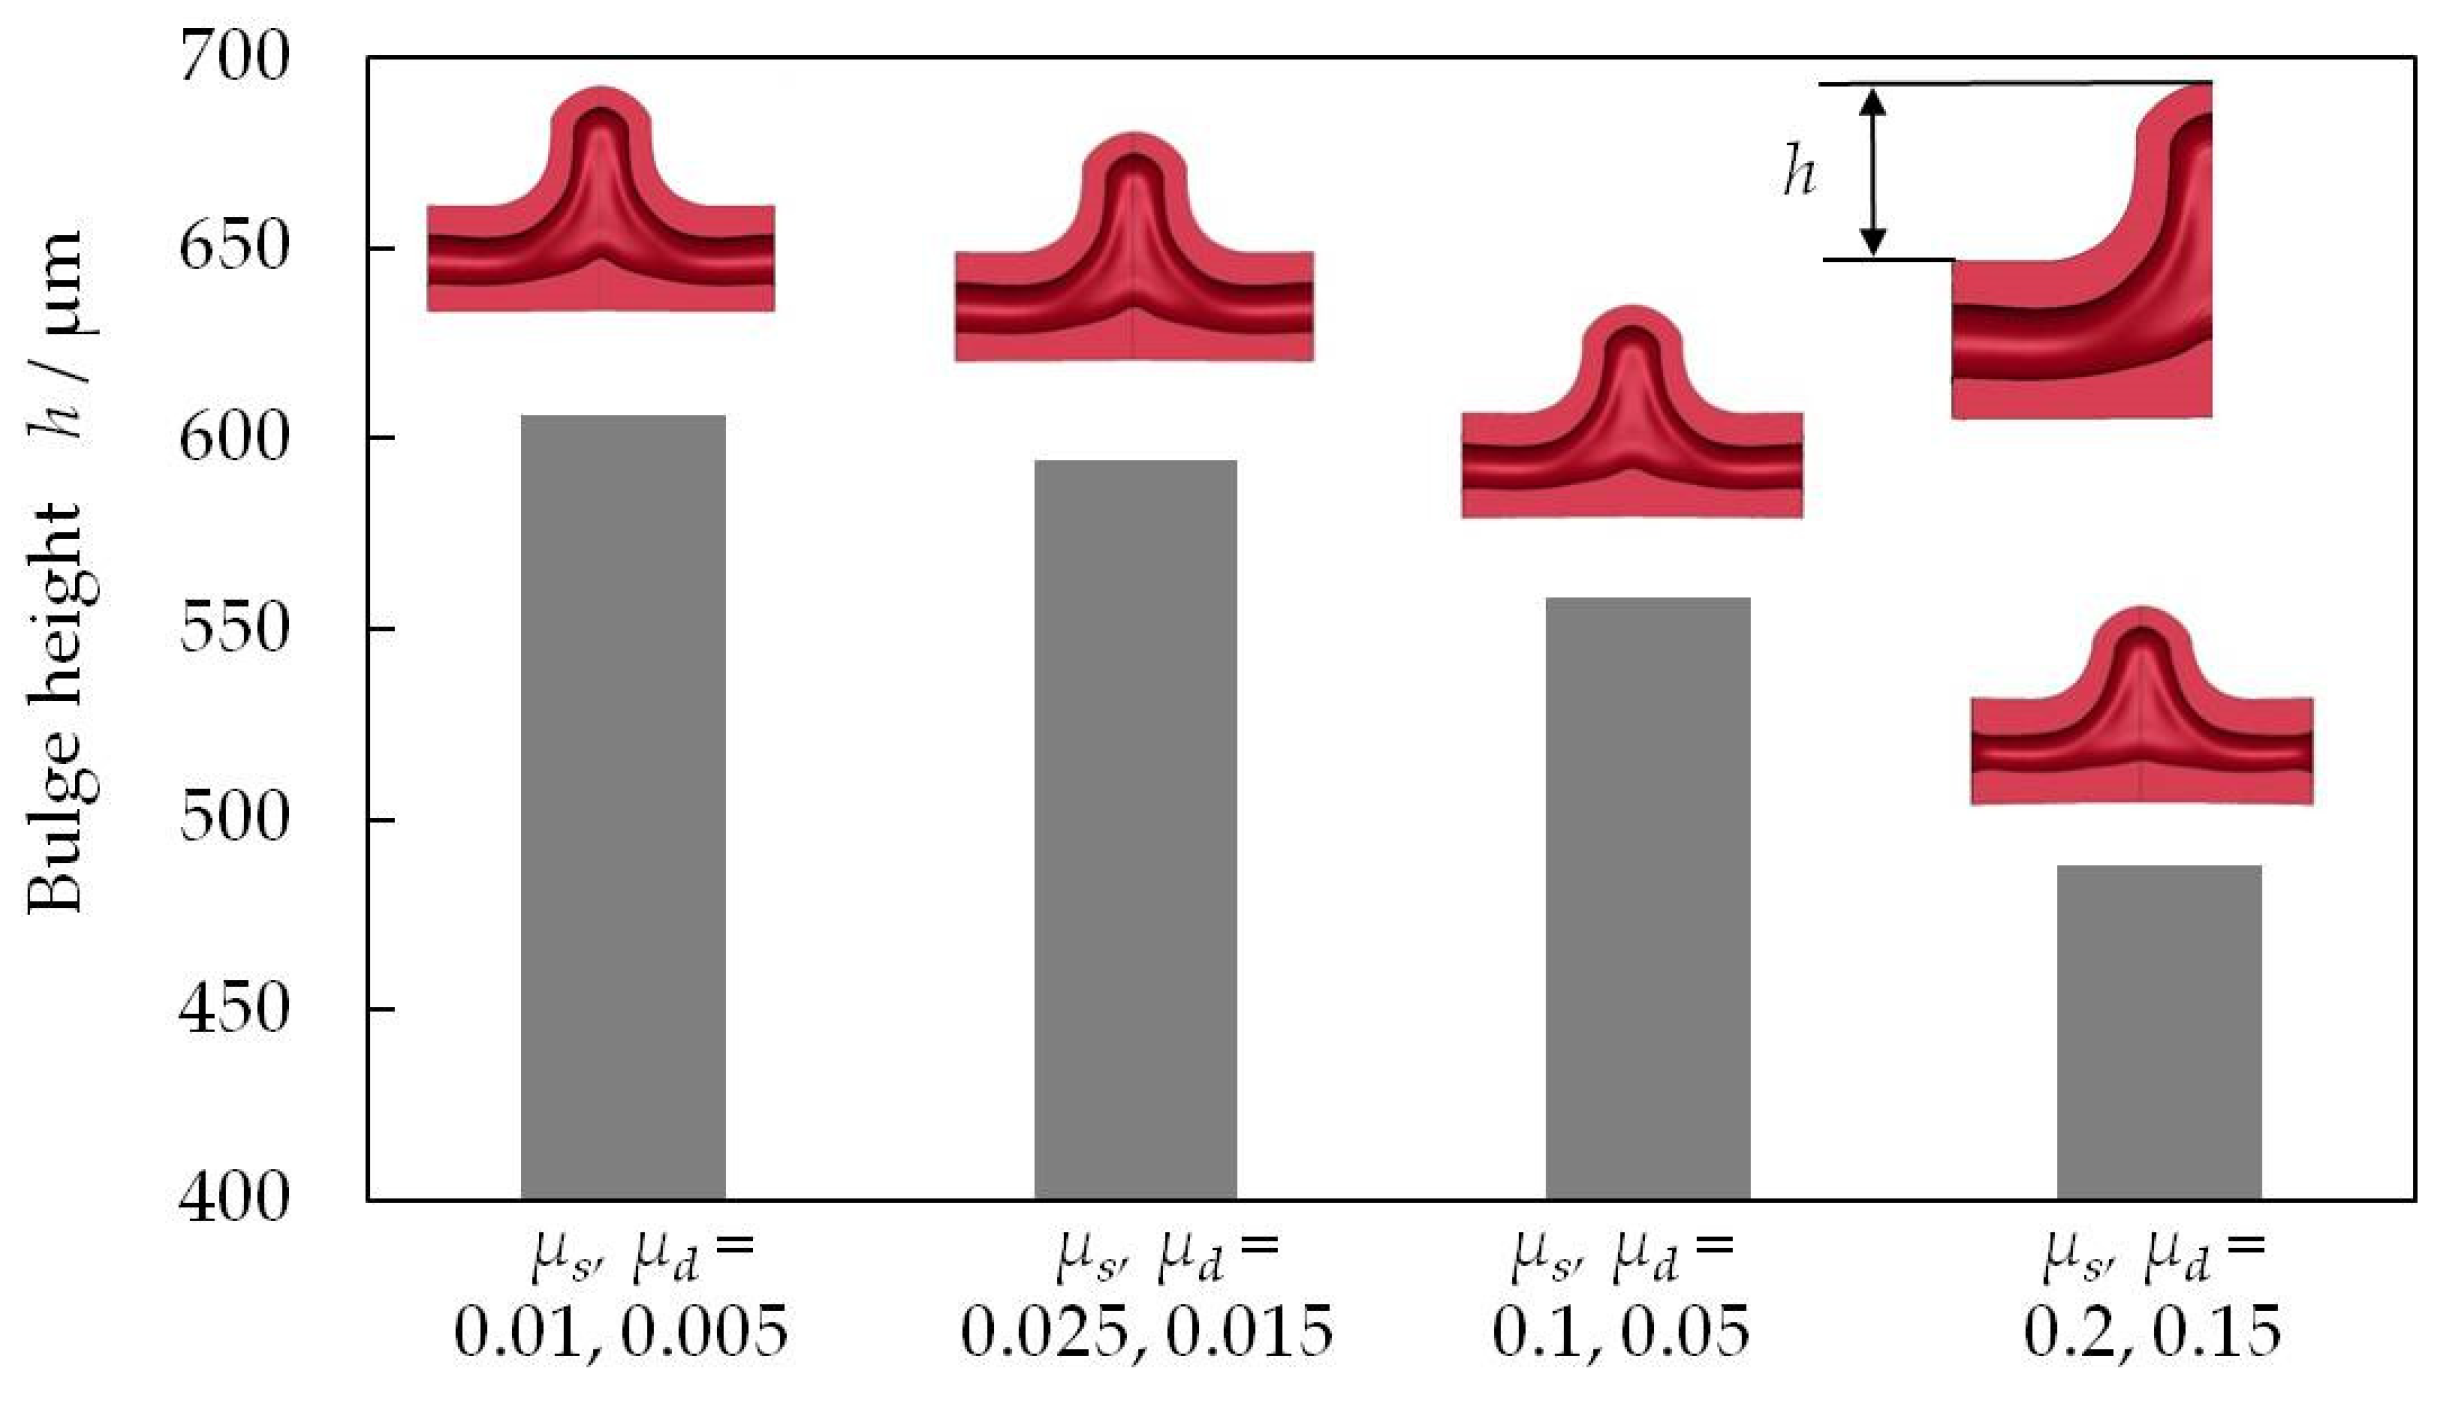
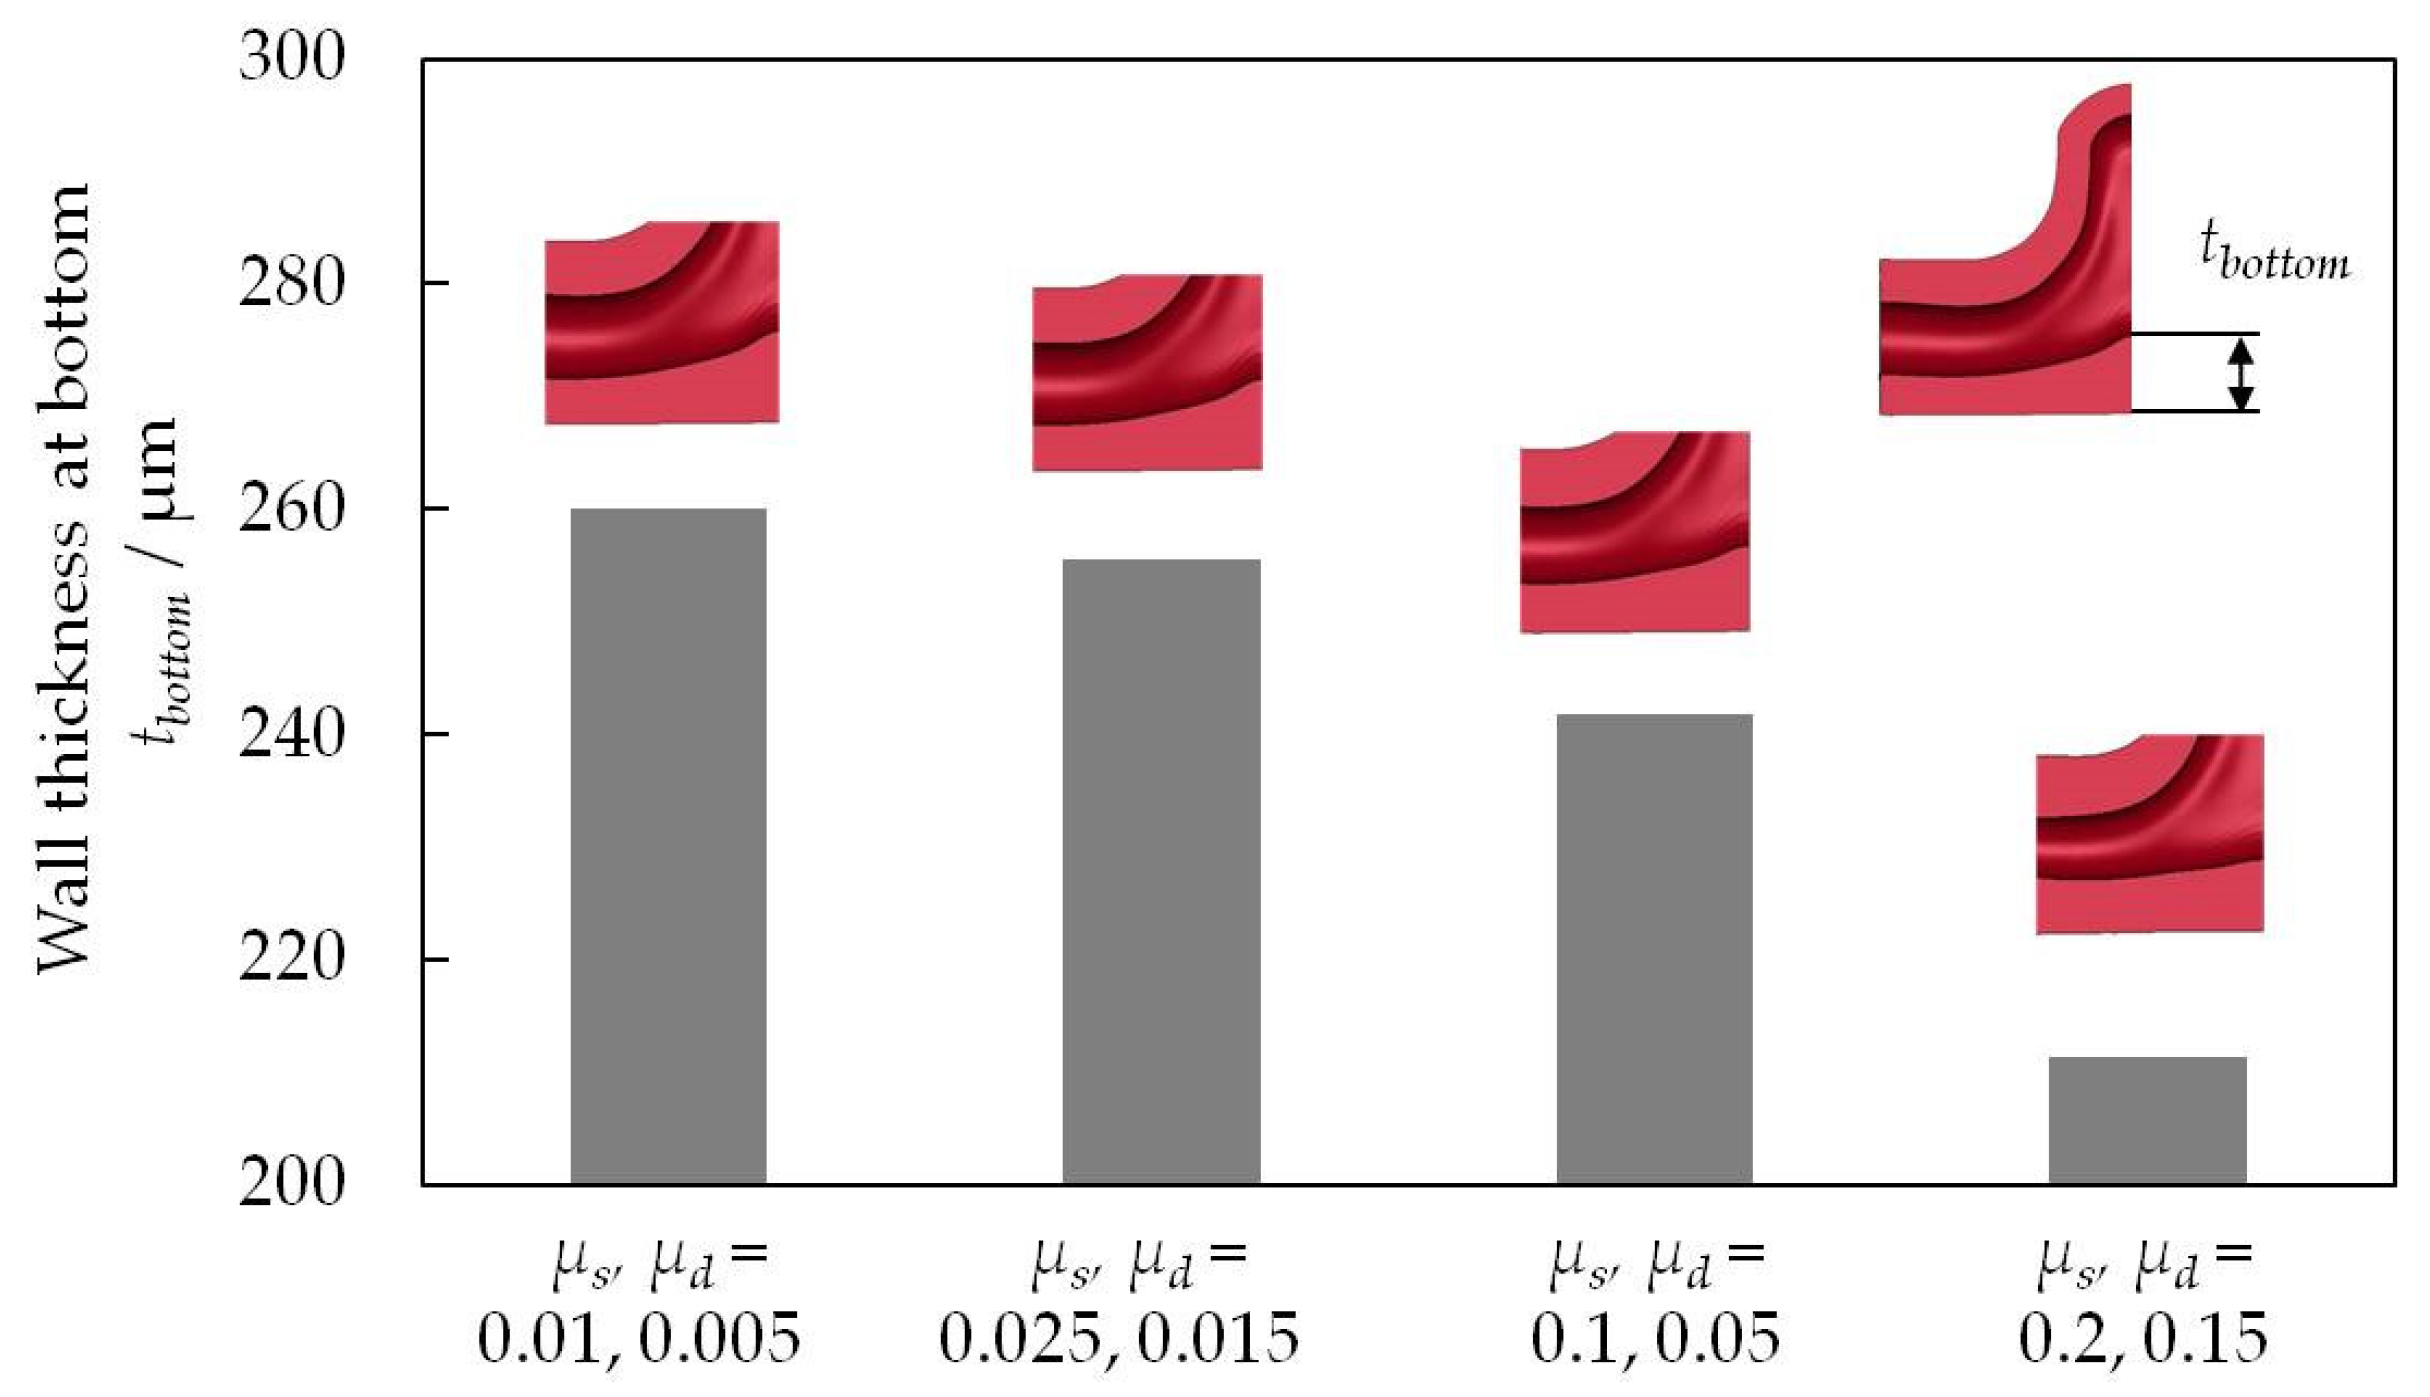
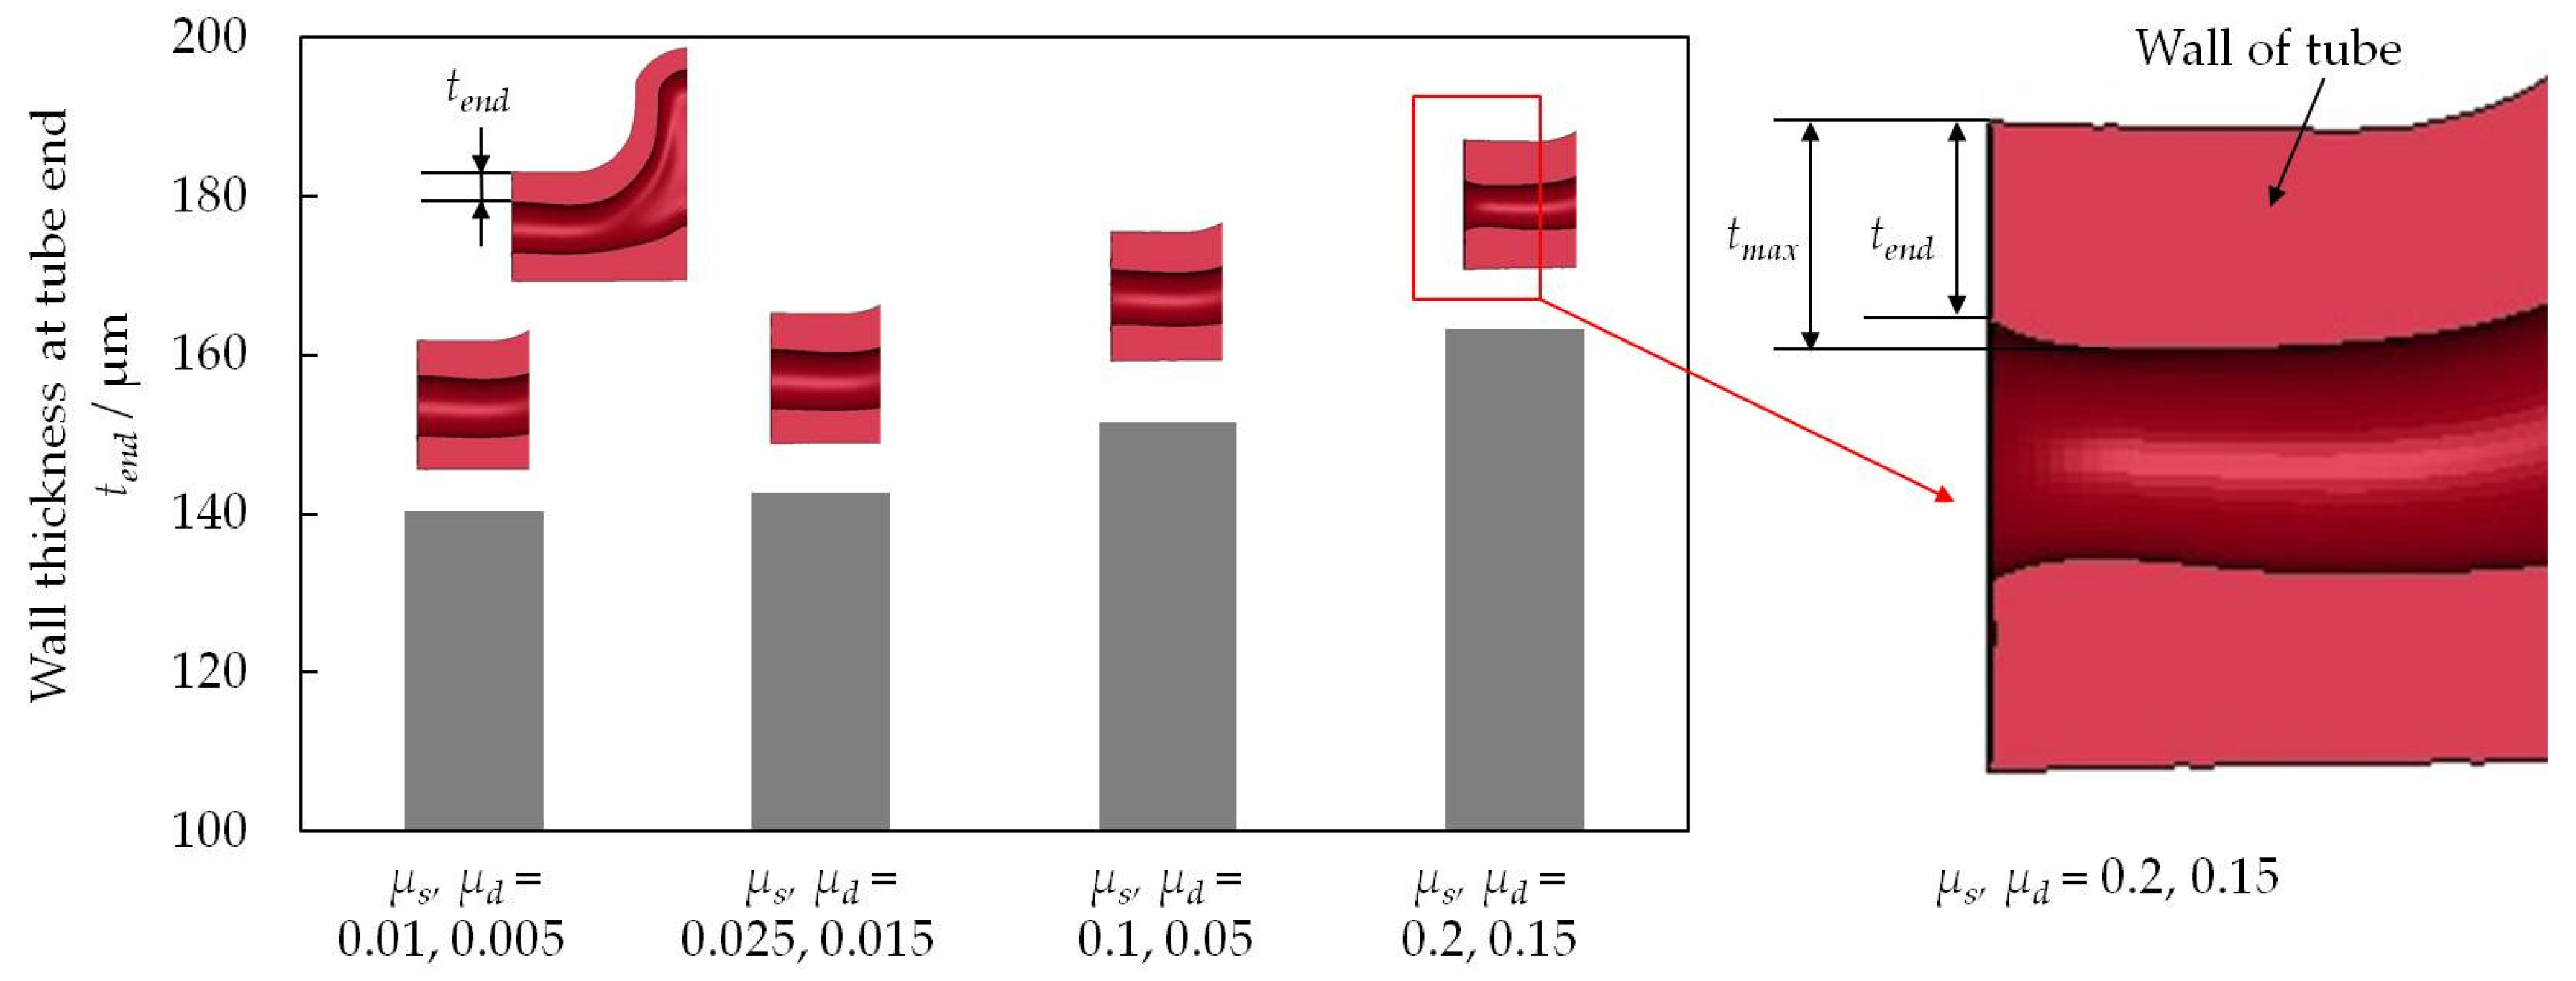
Next, the effects of the friction coefficient between the tube and the die on the deformation and material behavior of the tube in the micro-T-shape forming were evaluated by FEM. The sample used was a 3.2-mm-long C1220 tube. The friction coefficients μs and μd were 0.01 and 0.005, 0.025 and 0.015, 0.1 and 0.05, and 0.2 and 0.15, respectively. The internal pressure ph applied to the tube was 50 MPa, and the amount of axial feeding ΔL2 was 744 μm.
(a) Bulge height: Figure 14 shows the effect of the friction coefficient on the bulge height h of the T-shape samples. When the friction coefficient is low, the bulge height increases, but when the friction coefficient is large, the bulge height decreases. This is because the greater friction prevents the material flow into the die cavity and suppresses the bulge height and hence, the hydroformability. These results confirm the experimental results in Figure 13 described above. To enhance the hydroformability, the improvement of friction and lubrication conditions is essential.
(b) Wall thickness at different portions: Figure 15 shows the effect of the friction coefficient on the wall at the crown of the bulge. The wall at the crown of the T-shape tube becomes thick during MTHF with this loading path. As the friction coefficient increases, the wall thickness at the crown increases and reaches the maximum when μs and μd are 0.1 and 0.05; then, it decreases considerably when μs and μd are 0.2 and 0.15, respectively. This behavior can be explained as follows. When the friction coefficient is small, there is a large amount of material flow into the die cavity, and at this time, the overall wall thickness increases uniformly as a result of axial feeding, so that the wall at the crown can thicken gradually with the increasing friction coefficient. Meanwhile, when the friction coefficient increases, the compressive deformation and wall thickening become concentrated near the tube end area so that the wall at the crown can only deform in the early stage and not thicken so much under a high friction coefficient. Furthermore, when the friction coefficient increases, the material flow itself into the die is also suppressed. Then, since the bulge height is reduced, as shown in Figure 14, the thickness at the crown increases only slightly. Therefore, maximum thickness of the wall at the crown is the net effect of the increase in the thickness owing to the axial feeding and the decrease in the thickness owing to the decrease in the bulge height resulting from the increased friction coefficient.
Figure 16 shows the effect of the friction coefficient on the wall thickness at the bottom opposite the T-shape bulged part. The wall thickness at the bottom decreases with the increasing friction coefficient. In the case of a low friction coefficient, most of the axial compressive force due to axial feeding can be transmitted at the center of the tube bottom where the tube material cannot move, and the axial compressive force causes a significant increase in the wall thickness. However, when the friction coefficient increases and the values of μs and μd are 0.2 and 0.15, respectively, the compression force transmitted to the center of the tube bottom is too small; thus, the amount of tube material supplied to the branch cavity is not enough for a sufficient increase in the wall thickness.
Figure 17 shows the effect of the friction coefficient on the wall thickness of the T-shape samples at the contact surface between the tube and the axial punch. The wall thickness at the end of the tube increases with increasing friction coefficient. This is apparently because the frictional resistance also increases towing to the increase in the friction coefficient and because the end of the tube that receives the greatest frictional resistance is greatly compressed, thereby increasing the wall thickness. On the other hand, when the friction coefficients μs and μd are 0.2 and 0.15, respectively, the wall thickness is slightly increased, and a peak tmax is observed in the inner portion from the contact surface with the axial punch. The high coefficient of friction on the contact surface between the tube and the axial punch prevents the increase in wall thickness at the end of the tube. Thus, the tube material that could not flow toward the die cavity owing to a high coefficient of friction accumulates in the inner portion from the contact surface with the axial punch, and a peak is observed. On the basis of these results obtained from experiments and FE analysis, it was confirmed that the friction/lubrication condition is an extremely important processing factor affecting the flow and behavior of the tube material to fabricate highly accurate and high-quality microcomponents and to enhance the hydroformability.

3.3. Effect of Tube Length on Hydroformability in T-Shape MTHF

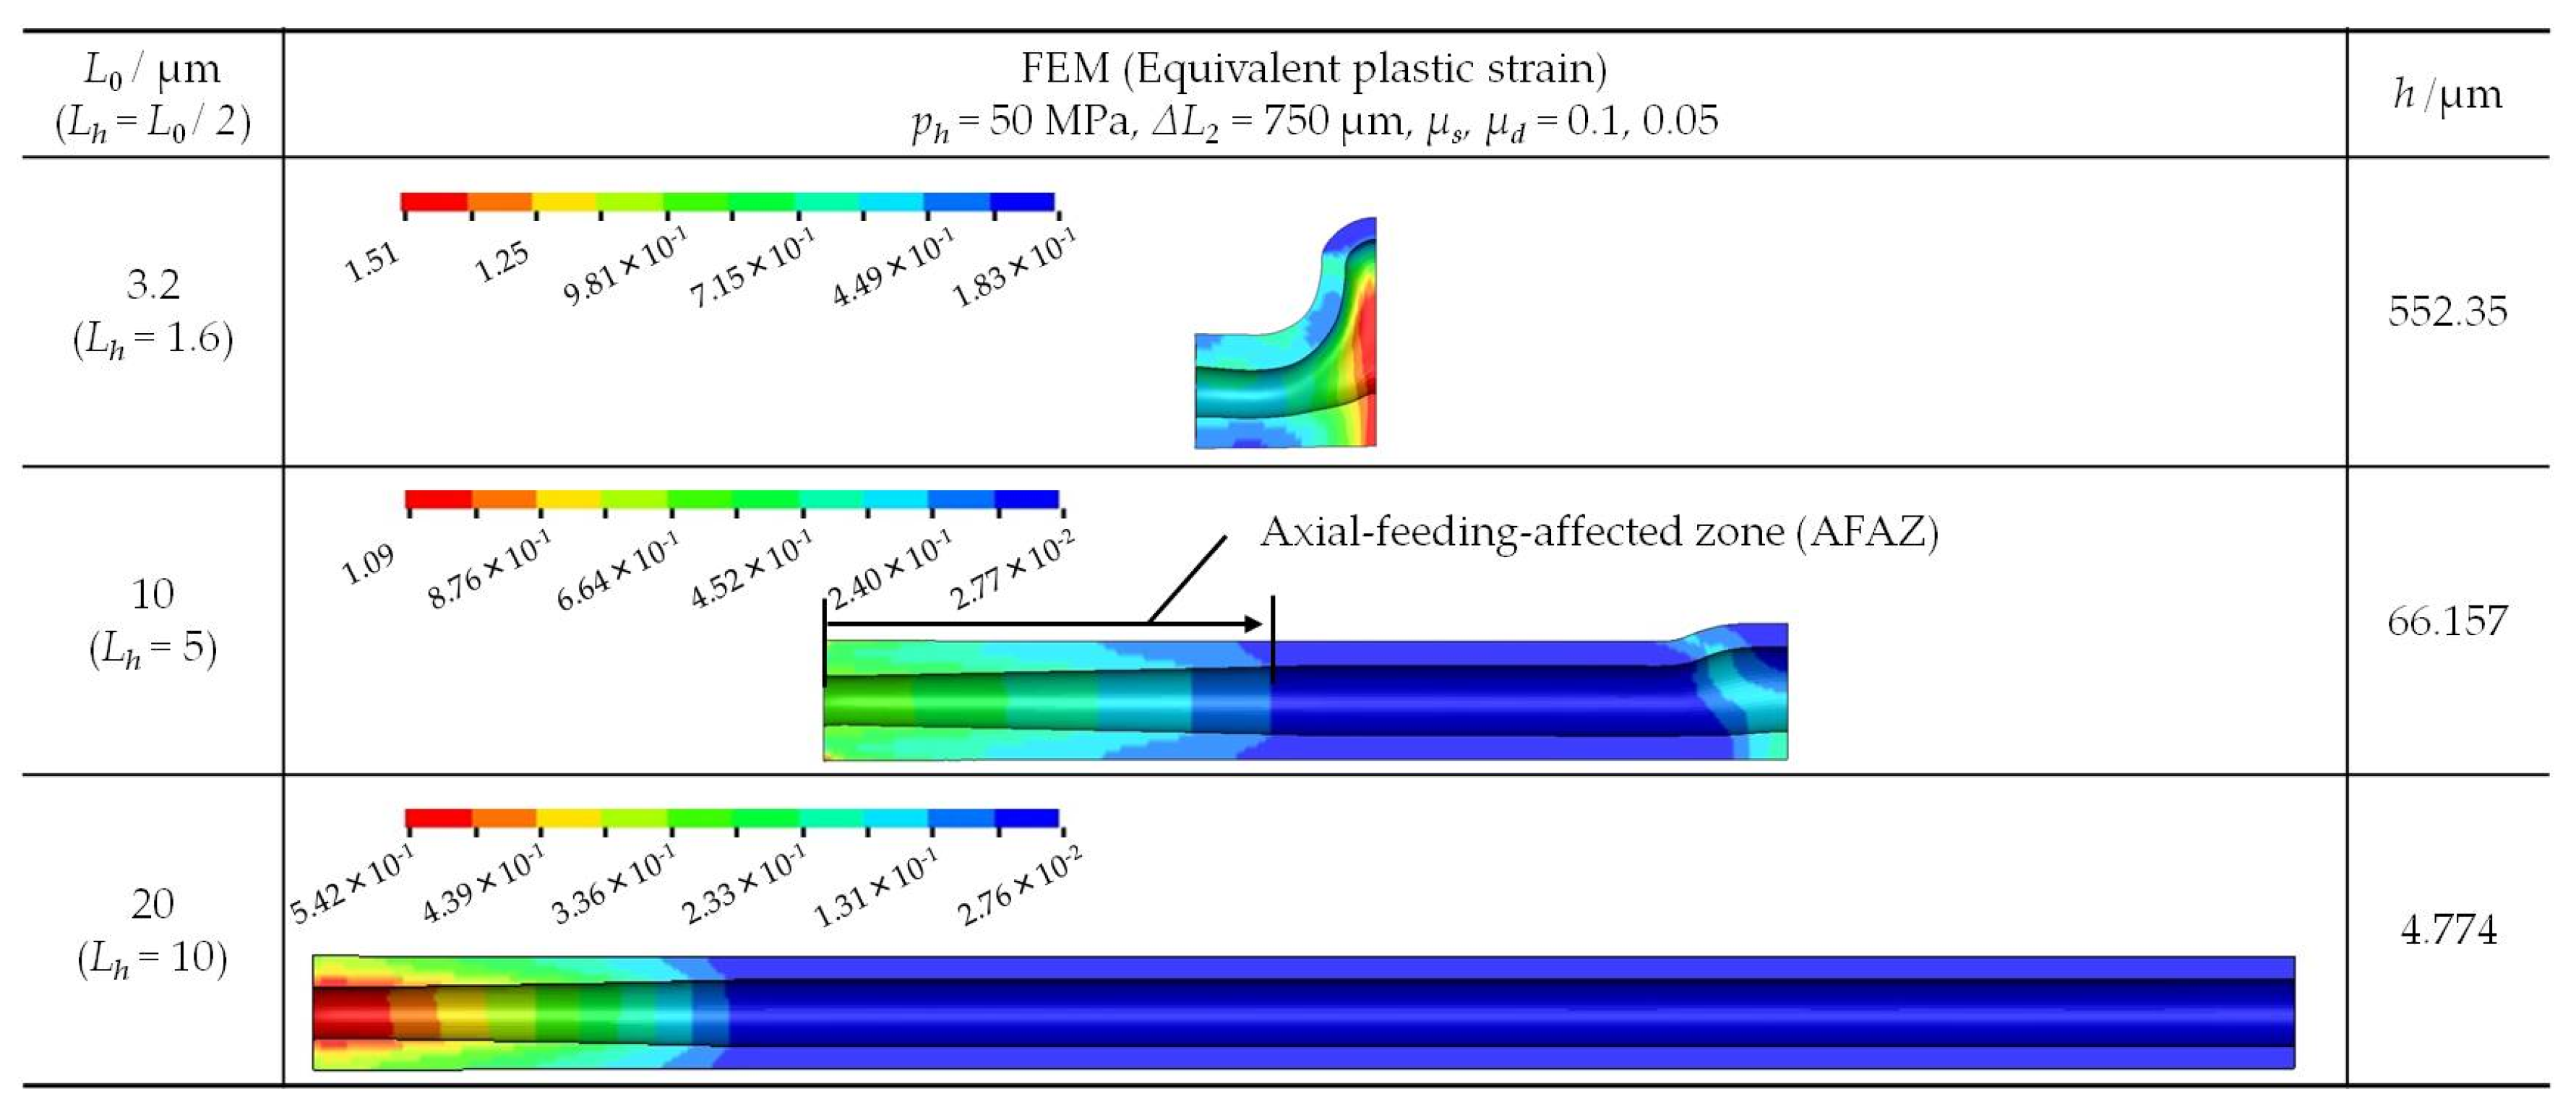
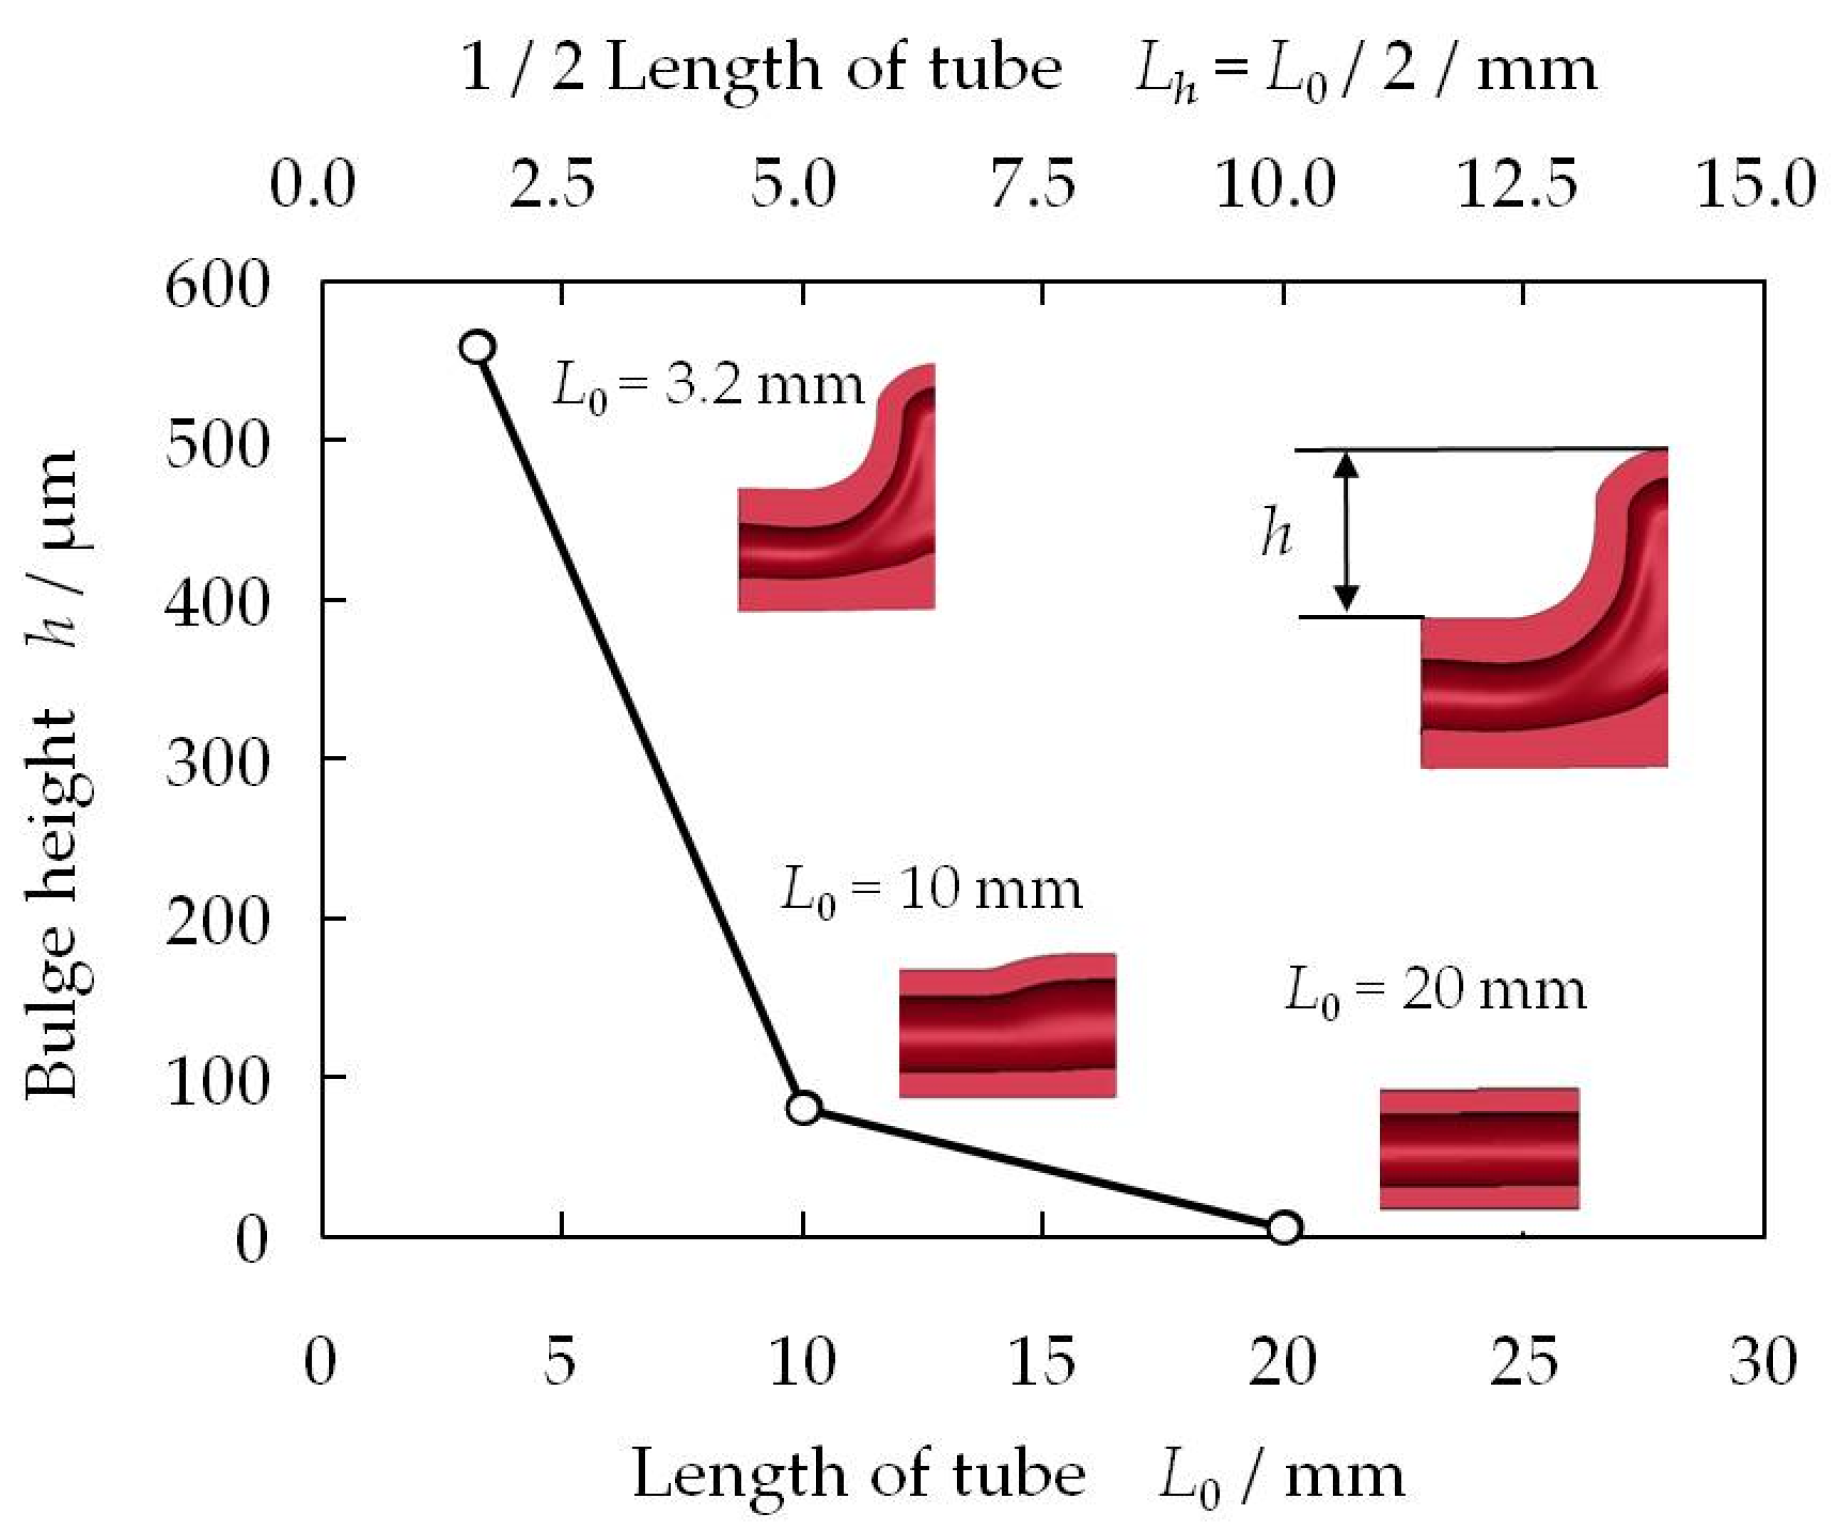
The length of the tube is known to affect hydroformability in connection with friction and lubrication. However, there has been little research on the effects of tube length on hydroformability so far. Here, the effect of the length of the tube on its deformation behavior in the T-shape MTHF process is investigated by FE simulation. The length of the tube ranged from a short tube with L0 = 3.2 mm (L0/d0 = 6.4) to a long tube with L0 = 20 mm (L0/d0 = 40). The friction coefficients μs and μd are 0.1 and 0.05, respectively. The loading conditions are an internal pressure ph = 50 MPa and axial feeding amount ΔL2 = 750 μm.
Figure 18 shows the effect of the tube length on the deformed profile and equivalent plastic strain distribution of the micro-T-shape tube. The bulge height decreases with the increasing initial tube length (L0 = 2Lh). In terms of the equivalent strain distribution of the T-shape sample, when the amount of axial feeding is the same, the longer the tube, the lower the overall average strain, but the strain distribution state differs greatly. In the case of L0 = 3.2 mm (Lh = 1.6 mm), a sufficient bulge height is obtained, and the entire region is deformed and strained. Regarding the characteristic strain distribution, a particularly large equivalent strain with shear deformation is concentrated along the centerline of the bulge. However, when L0 = 10 mm (Lh = 5 mm), the height of the bulge formed is insufficient, so that the strain in the bulge region is low, and the area around the tube end is larger. The highest strain occurs at the end of the tube, and it gradually decreases toward the center of the tube. It can be seen that the length of the axial feeding-affected region is about 4.5 mm in the axial direction, but there is less deformation from there toward the bulge die-cavity entrance. In addition, it is suggested that when the bulge height is smaller, the displacement increment vectors at the center of the tube are small, and the vectors hardly rotate toward the bulge direction. This result shows that the amount of material flowing in the bulge region decreases when a long microtube is deformed, and insufficient material flow could lead to a smaller bulge height h.
Moreover, when L0 = 20 mm (Lh = 10 mm), the bulge-forming process is incomplete. Hardly any deformation occurs at the center of the bulge, and thereby, only the area near the end of the tube is strained by axial feeding compression. From the figure, the axial-feeding-affected zone (AFAZ) has a length of about 4.5 mm, which is similar to that in the case of L0 = 10 mm. Generally, the factors affecting this AFAZ are considered to be the processing internal pressure, friction coefficient, tube strength, and wall thickness, all of which are related to material flow. However, according to Figure 18, the length of this AFAZ does not vary greatly and is considered to be a measure of the initial length of the tube, which indicates the possibility of bulge deformation with axial feeding. For a tube with a length close to that of this AFAZ, the material flow due to axial feeding and the material flow into the die cavity causing bulge deformation may occur at the same time. It is estimated that the initial length is slightly greater than the length of the AFAZ.
From these results, it is suggested that for longer tubes, increasing the axial feeding does not necessarily increase the bulge height and only compresses a certain area from the end of the tube, resulting in material flow only in that area. In addition, not only the strain distribution but also the displacement increment vector from the initial position at each node of the finite element mesh was observed; thus, the material flow was examined. As a result, it was also confirmed that the material flow state almost corresponds to the equivalent strain distribution in Figure 18.
As Figure 19 shows, it is clear that the bulge height decreases rapidly with the increasing initial length of the tube. Therefore, in the case of different values of the friction coefficient, it is predicted from the results in Figure 14 that the bulge height curve is below the curve in Figure 19 when the friction coefficient is larger and slightly above it when the friction coefficient is smaller. As a result, it is suggested that bulge forming becomes difficult if friction is increased, even with a shorter tube (L0 = 10 mm (Lh = 5 mm)).
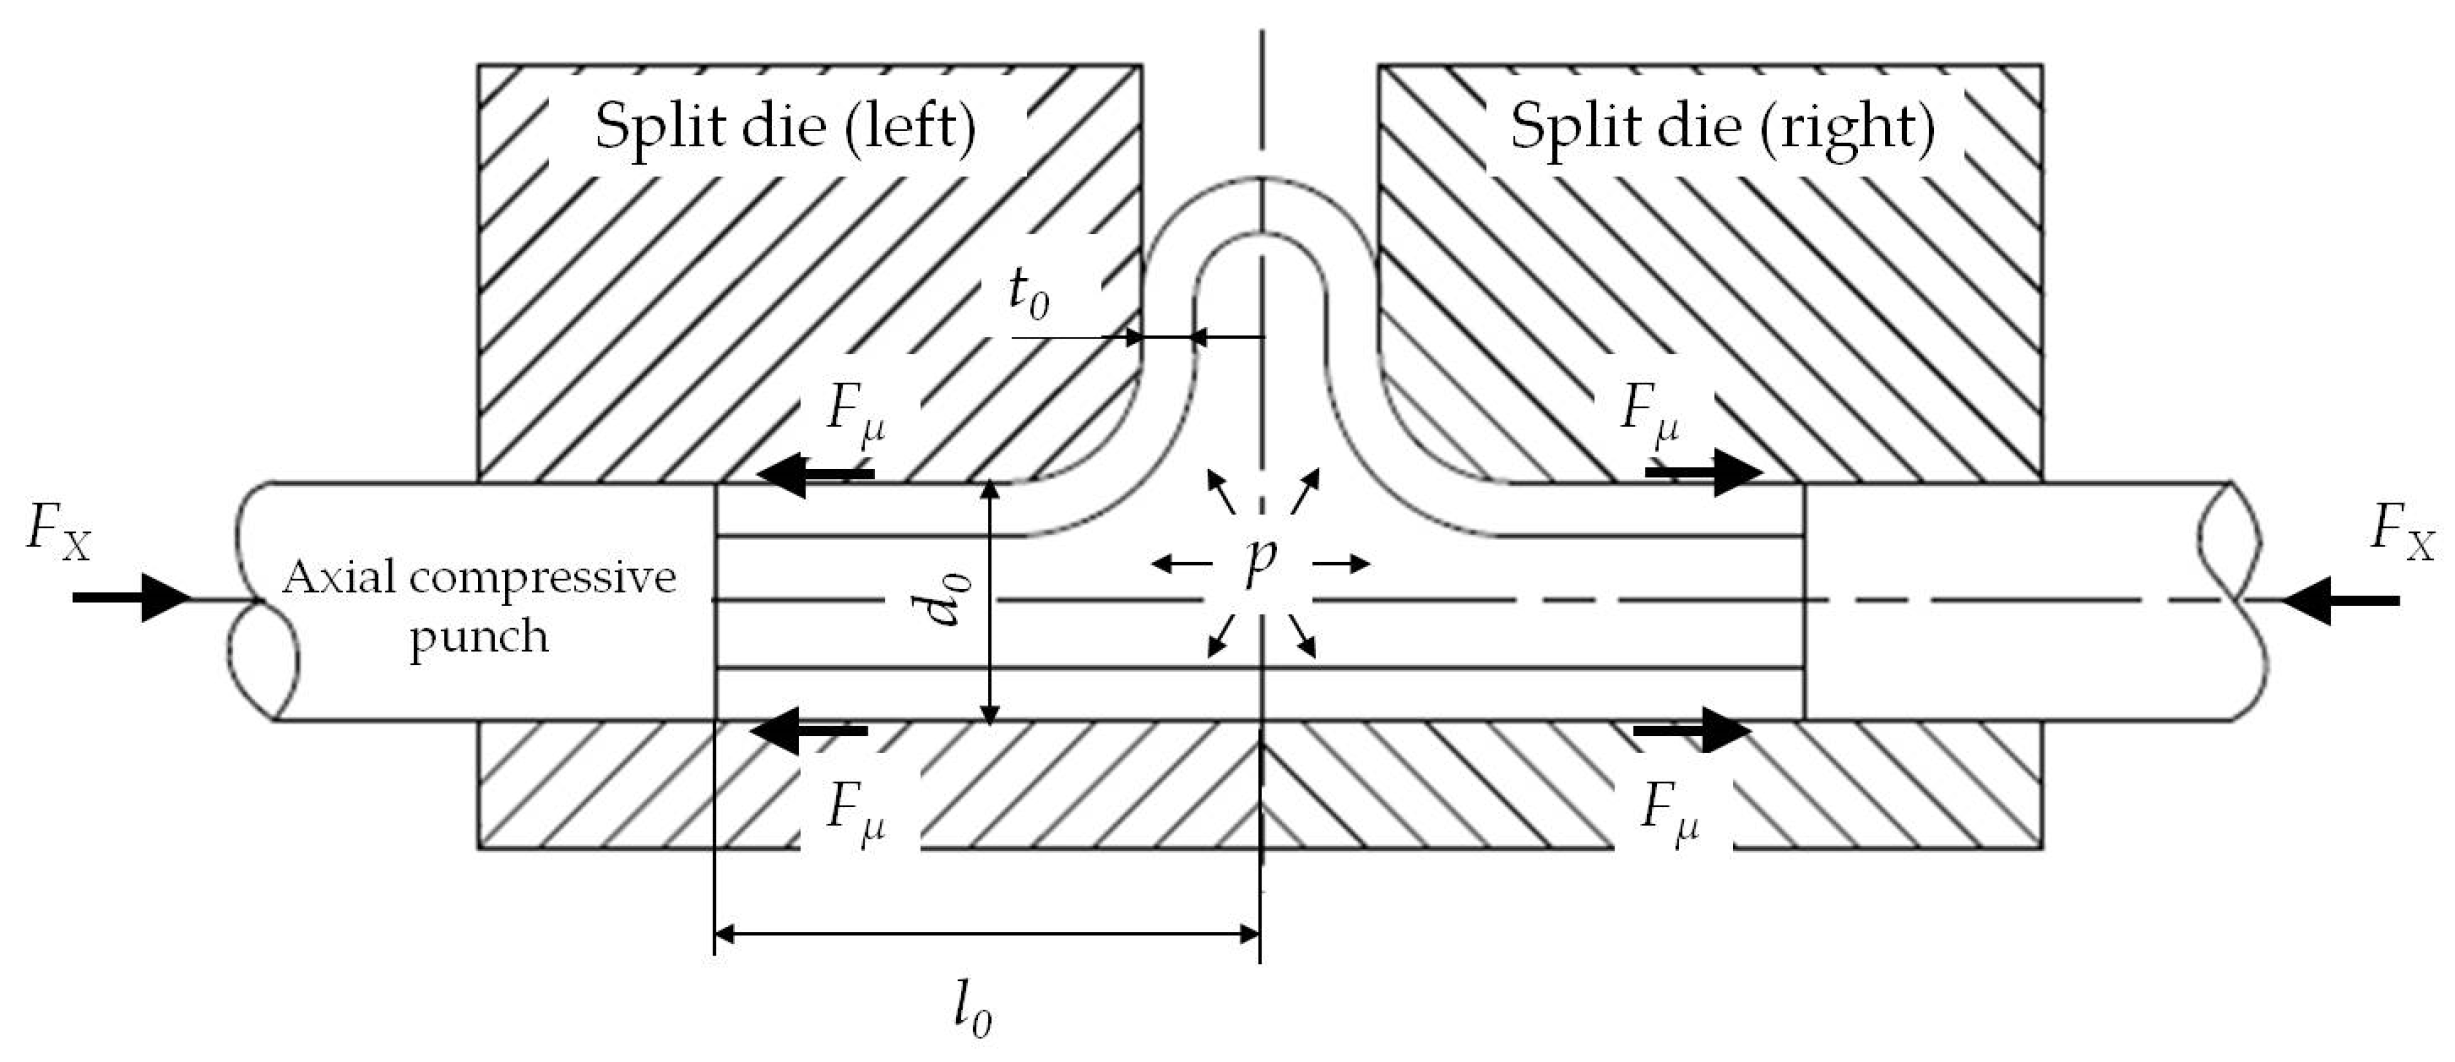
Here, the theory on the axial compressive force required in T-shape forming is formulated as the following equation referring to Figure 20 [19].
F X =   F P + F μ +   F f = π ( d 0 2 t 0 ) 2 4 p + μ π d 0 l μ p d i e + π t 0 ( d 0 t 0 ) k f 2
Here, FP is the axial compressive force against internal pressure, Fμ is the axial compressive force against the friction between the tube and the die, Ff is the axial compressive force related to the plastic deformation of the tube, p is the internal pressure for deforming, pdie is the contact surface pressure on the die cavity surface, d0 is the outer diameter of the tube, lμ is half the contact length between the tube and the die, t0 is the wall thickness of the tube, kf is the yield stress of the tube during forming, and μ is the friction coefficient. Then, lμ = l0x, where l0 is half the initial tube length and x is the axial displacement of the tube (one side).
From the second term of Equation (2), we see that the axial compressive force required in the hydroforming of the microtube depends on the tube length lμ. That is, the axial compressive force against the friction resistance Fμ between the tube and the die increases in proportion to the current tube length lμ. When T-shape forming was carried out with a longer tube, the deformation of the tube occurred only at the end of the tube, as shown in Figure 17 and Figure 18. As mentioned above, the cause of the reduction in the bulge height h is the effect of friction on the material flow into the die cavity. If the tube is longer, the material cannot flow toward the branch because of the increased friction effect. It can be concluded that insufficient material flow leads to lower bulge height h. For the deformation of a long microtube in MTHF, not only reduced friction between the tube and the die but also a higher axial compressive force is required. Additionally, the axial compressive force during the MTHF, which depends on the normal force (pressure p), is a product of pdie and the friction coefficient μ between the tube and the die. An excellent friction state might lead to an increase in the size of the region that can propagate the axial compressive force. Therefore, it is necessary to develop a processing technique that suppresses frictional (flow) resistance due to friction and promotes the plastic flow of the material by maintaining satisfactory friction and lubrication states as much as possible.

3.4. Microforming Defects and Process Windows

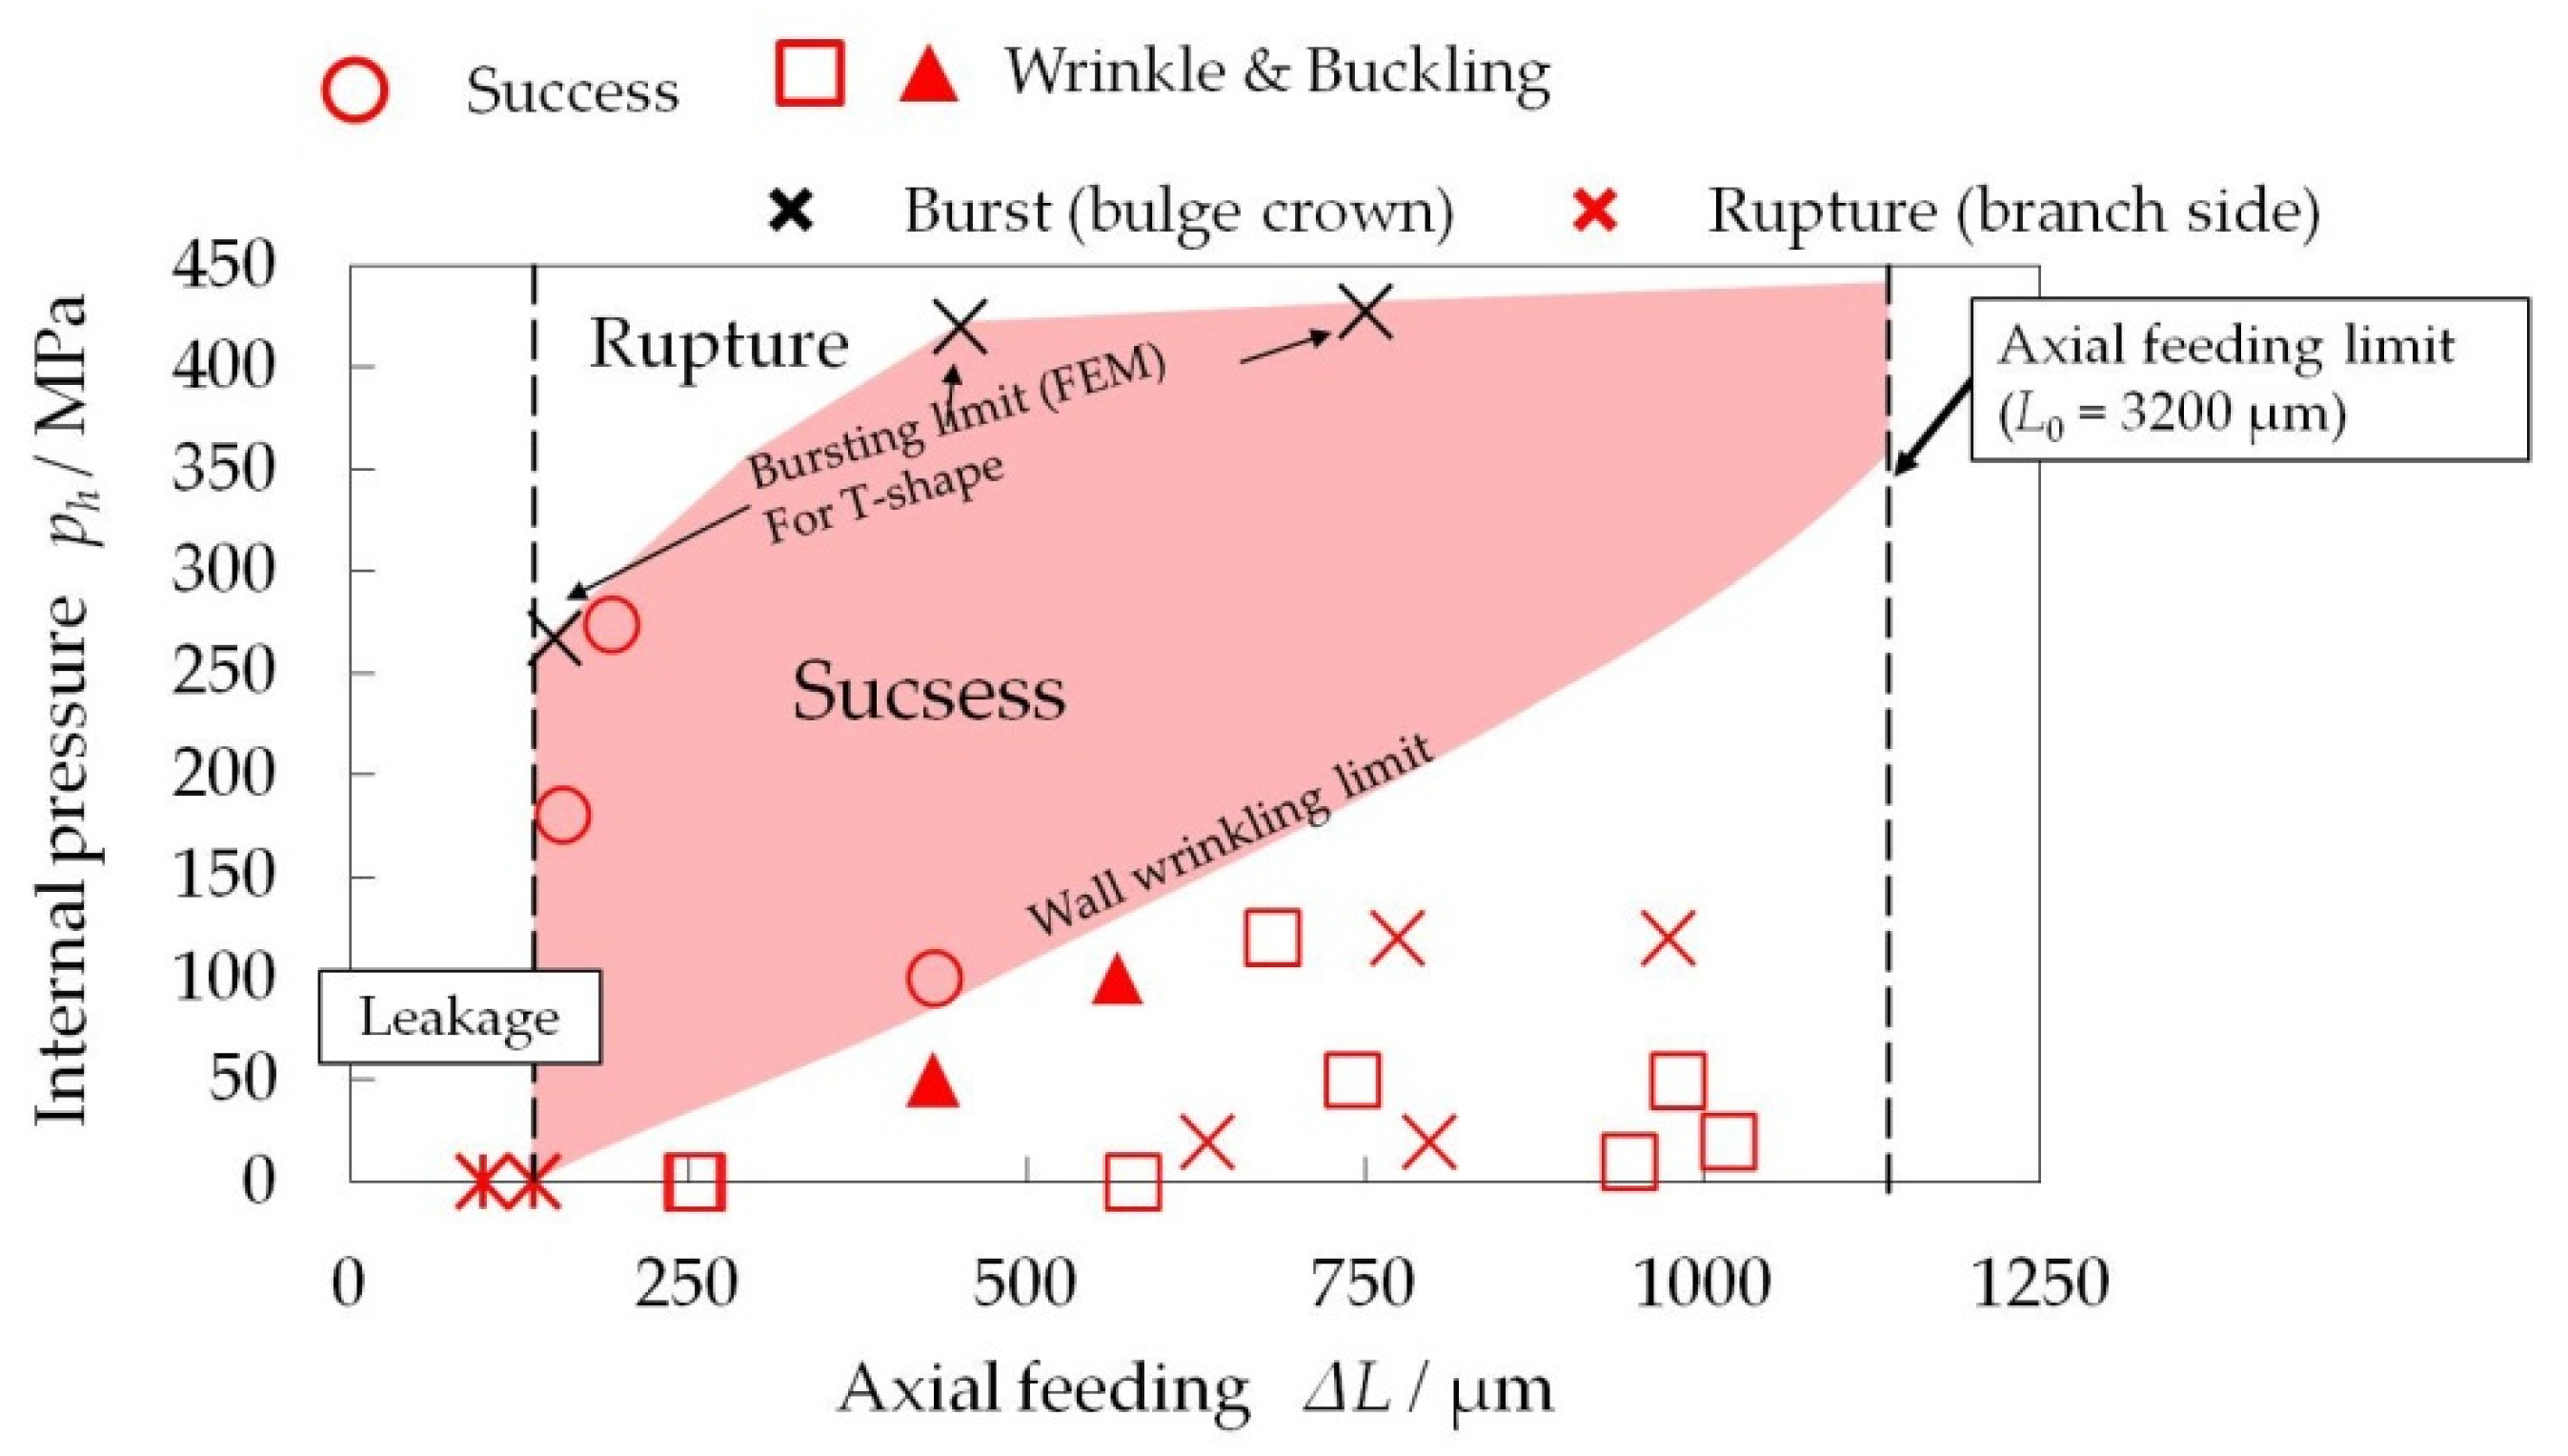
Figure 21 shows typical microforming defects of T-shape samples in both the T-shape forming experiment and FE analysis. There are three typical modes of the forming defects: (1) thinning and fracture of the branch wall (Figure 21a), (2) thickening and folding at the bottom side opposite the bulge (Figure 21a,b), and (3) rupture at the crown of the bulging branch (Figure 21c). The type of defect depends on the lubrication condition and loading path.
On the basis of these forming defects, a process window for T-shape MTHF is constructed. Figure 22 shows the process window created using all data obtained from experiments and FE analysis. The bursting pressure of the microtube increased with the amount of axial feeding. Similar results were obtained in previous studies on T-shape forming [20]. It can be understood that the wall thickness of the microtube was increased by the axial-feeding-affected bursting pressure of the microtube. In the low internal pressure region of the window, thickening occurred on the bottom side at the initial stage of T-shape forming. Then, this thickening led to buckling and folding with an increasing amount of axial feeding as shown in Figure 11. On the other hand, the defect of the deformed branch appeared as headband-shaped thinning or rupture in the low internal pressure region where buckling or folding wrinkles occurred. In the T-shape MTHF experiment, it is not easy to constantly maintain a stable lubrication state between the tube and the die. Even with forming at low internal pressure, different defects occur at different locations because of the variation in the lubrication state. This is a phenomenon that was not observed in the cross-shape MTHF experiment described in the previous report [11]. In the forming of a T-shape, which is a geometrically asymmetrical shape, it is difficult to obtain a process window with clear divisions between the defects such as buckling and rupture, unlike a process window for the forming of a cross-shape, which is symmetrical. The material flow in T-shape forming occurs toward the die cavity in only one direction. Therefore, the plastic flow of material in T-shape forming is not smooth because it is more complex than that in cross-shape MTFH, which has two opposing flow directions.
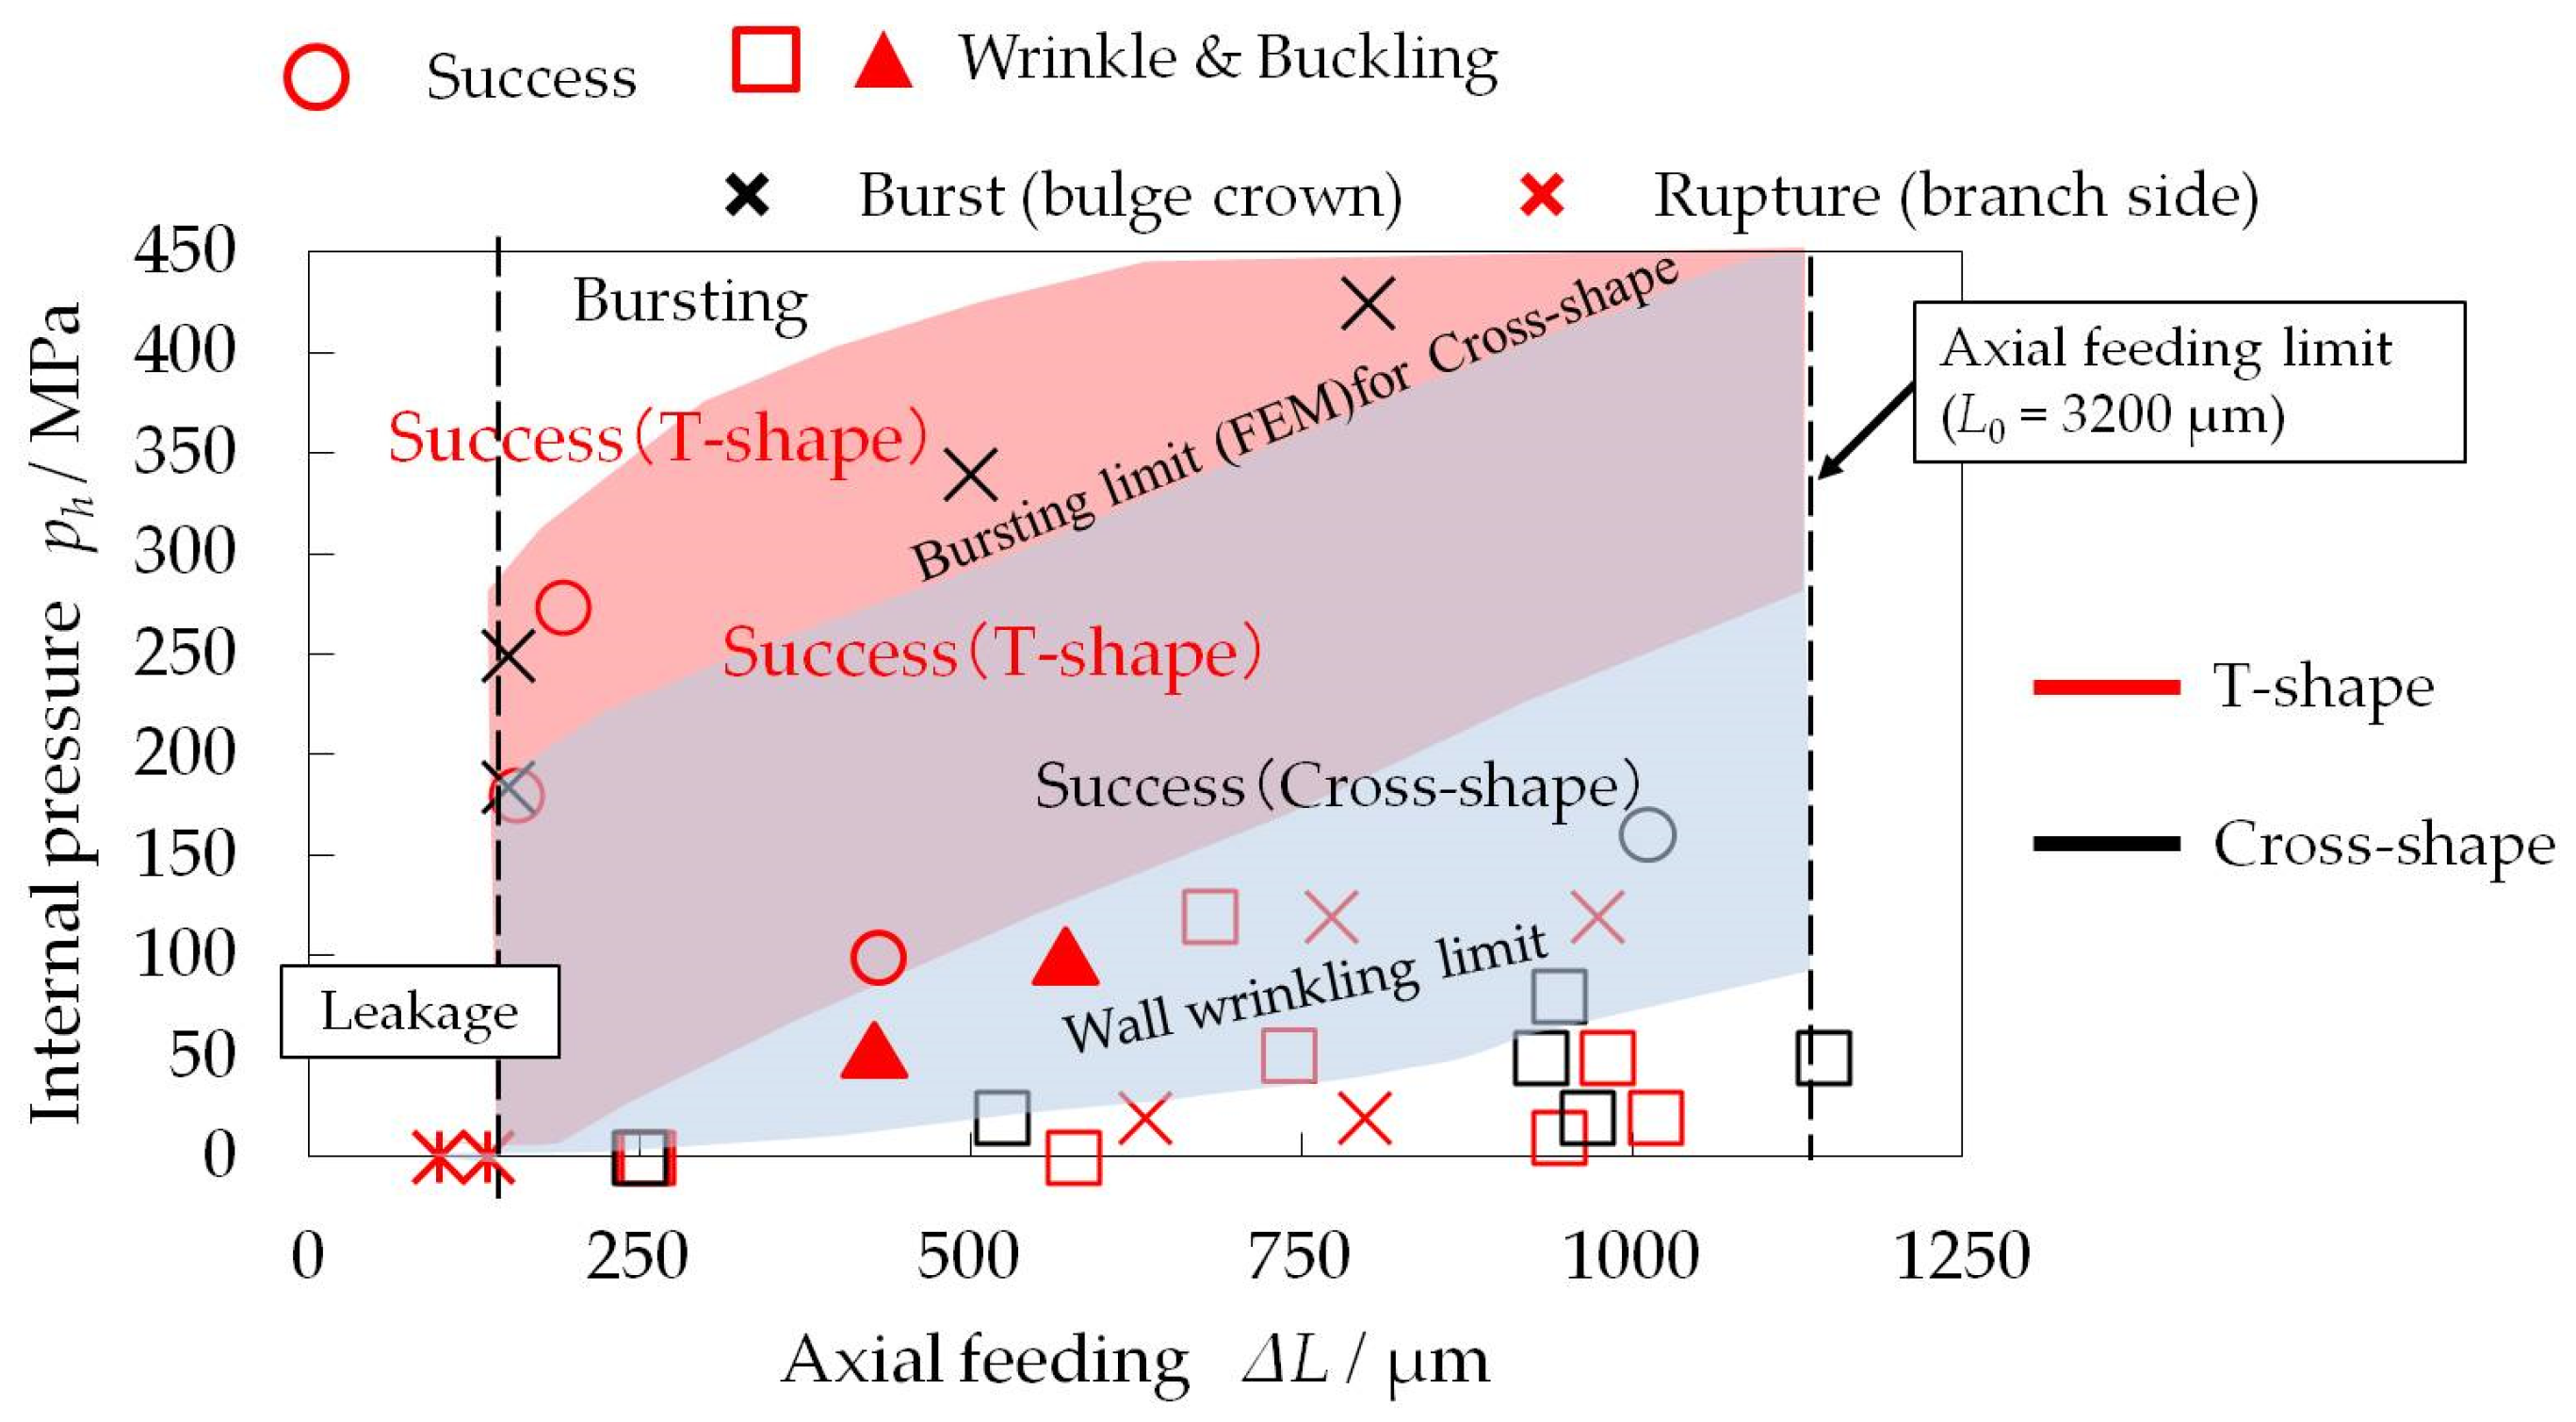
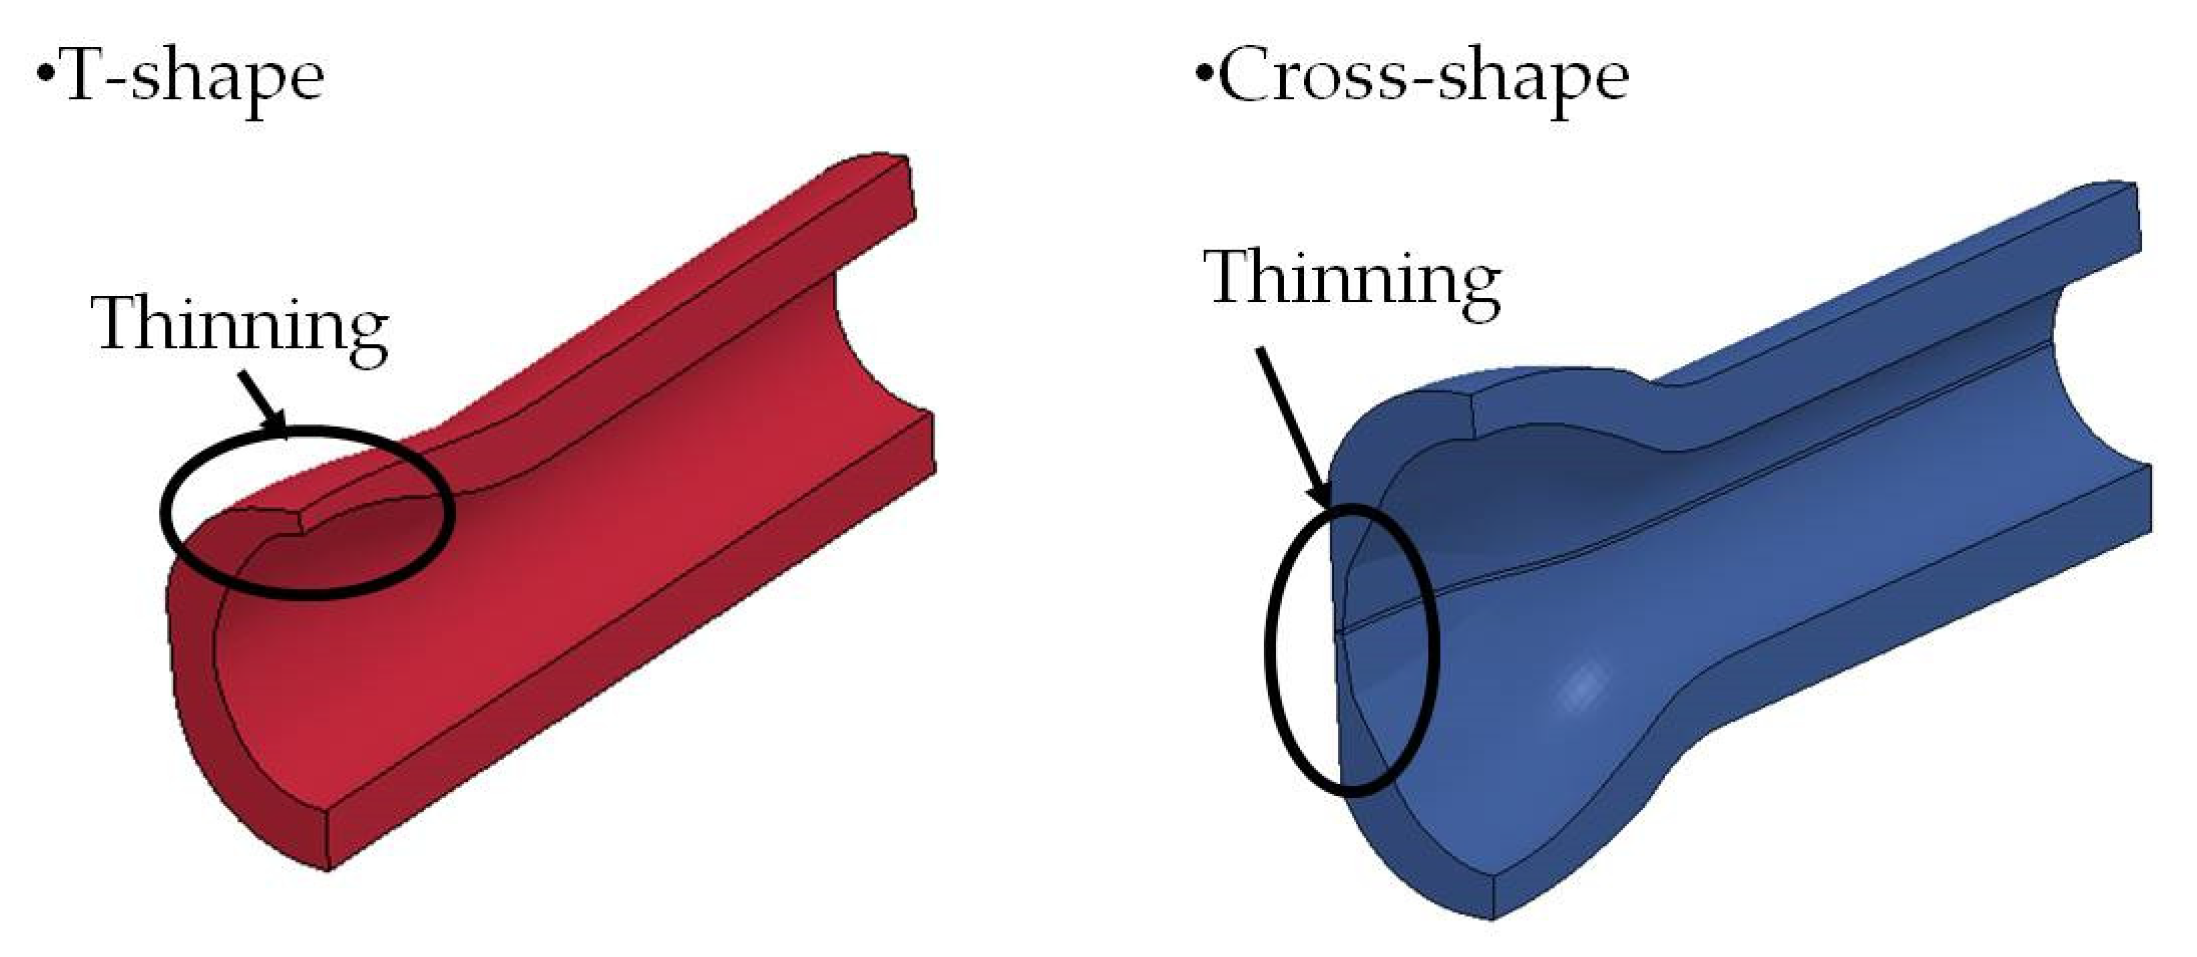
Figure 23 shows the process window of T-shape forming with the results of cross-shape forming for comparison. There was a “success” region that suggests an optimal process design between the rupture region with high internal pressure and the low-internal-pressure region where complex defects occurred. The “success” area in T-shape forming shifted toward the higher pressure direction compared with that in cross-shape forming. Thinning of the wall and bursting occurred at the crown of the bulge in the high-internal-pressure region in the process window. On the other hand, these defects were different from the headband-shaped thinning and rupture occurring in the low-internal-pressure region. Figure 24 shows the thinning behavior of the T-shape and cross-shape samples loaded only with internal pressure and analyzed by FEM. In cross-shape forming, thinning, which led to cracking of the tube, occurred at the border of the two branch tubes. In T-shape forming, thinning, which led to rupture of the tube, occurred at the crown of the bulge. As shown in Figure 24, the location of cracks depends significantly on the shape of the formed microproduct. The difference in their process windows is influenced by not only the difference in the flow of the material in the die cavity but also the location of the crack.

3.5. Theoretical and Experimental Bulge Height of T-Shape and Cross-Shape MTHF

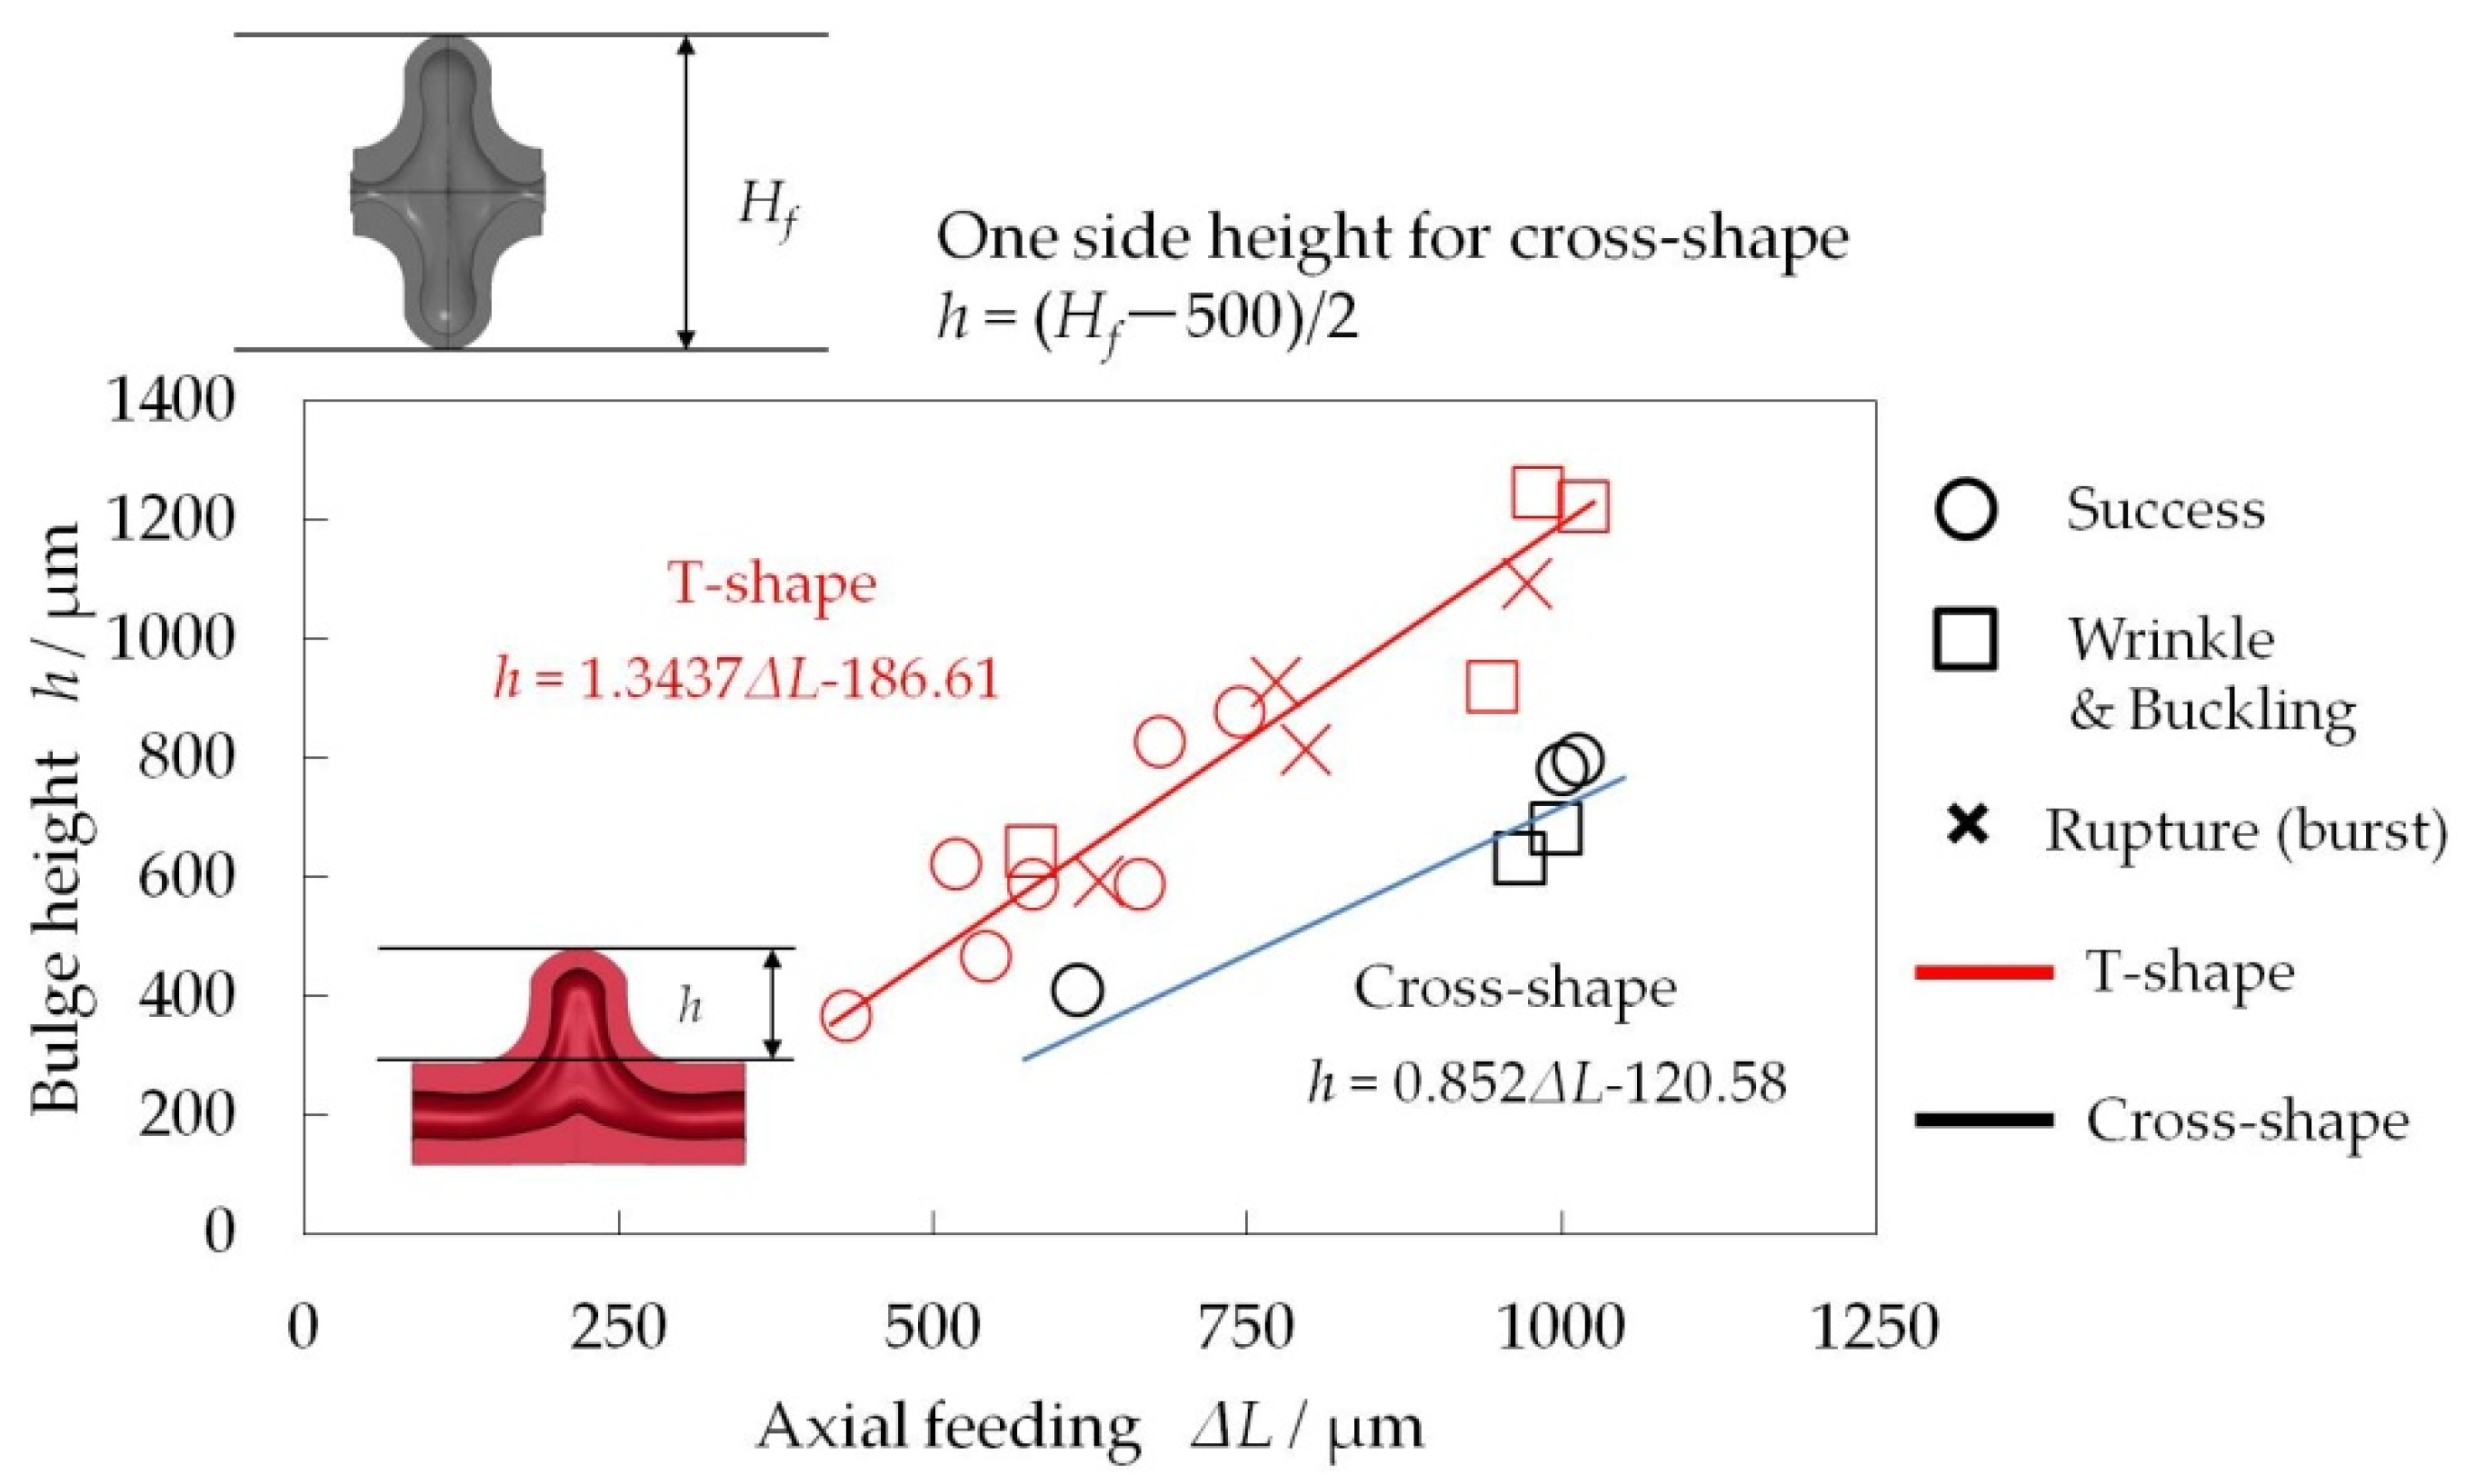
Figure 25 shows the relationship between the bulge height h and the amount of axial feeding ΔL2 for a C1220 microtube with fluorocarbon lubrication plotted using data from T-shape MTHF experiments with internal pressures ph of 20 to 274 MPa. The results for cross-shape forming are also plotted in the figure for comparison. The bulge height h of the cross-shape sample was measured as half of the bulge heights on the two sides (h = (Hf − 500)/2), where Hf is the height between two branches, so that it could be directly compared with the bulge height h of the T-shape samples. The regression lines of both experimental results are represented by
h = 1.3437ΔL−186.61   for T-shape forming, and
h = 0.852ΔL−120.58    for cross-shape forming.
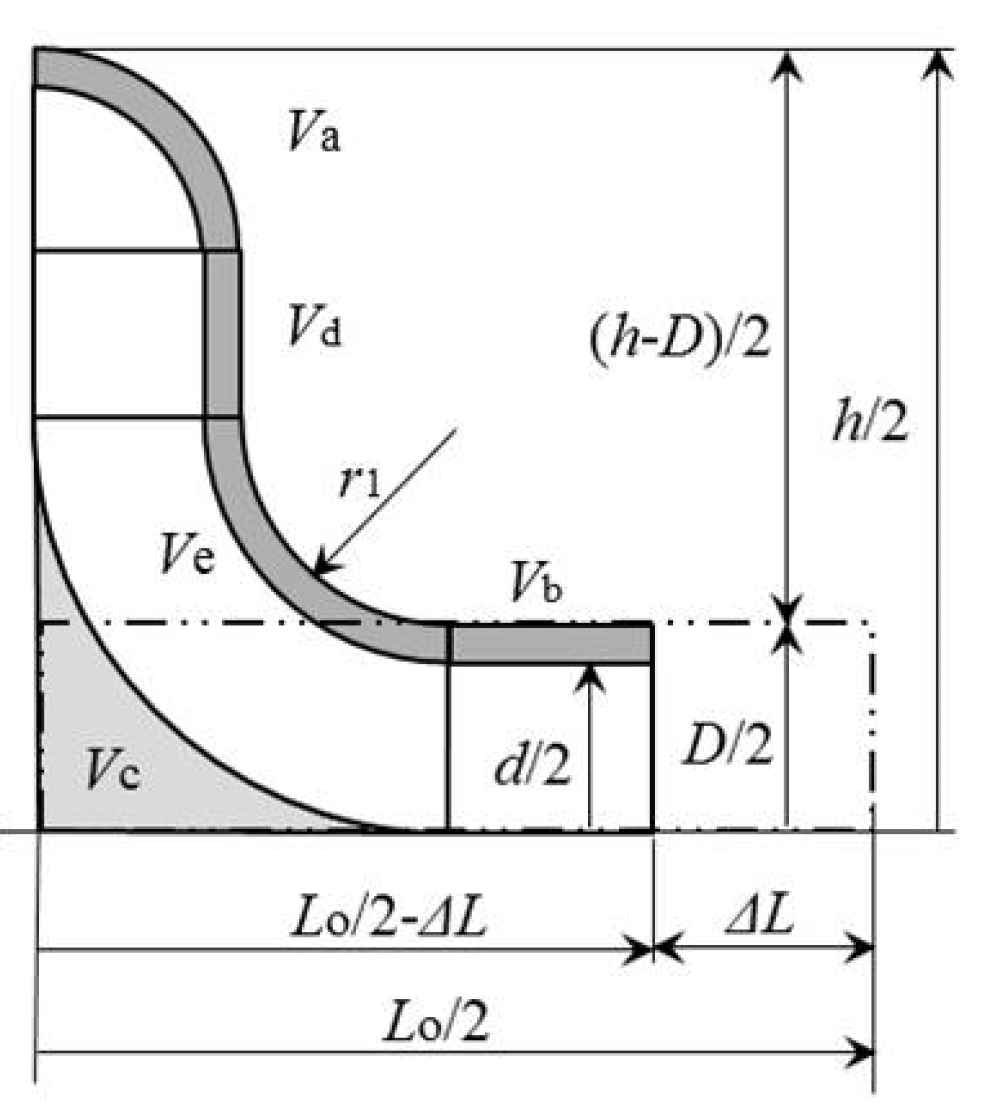
The bulge height h of the T-shape sample was higher than that of the cross-shape sample. It can be understood that the flow of the material at the bottom was led toward the branch in the sample in T-shape forming. Equations (3) and (4) respectively present the theoretical equations for the bulge height h in T-shape and cross-shape forming. In both formulae, the bulge height is proportional to the axial displacement, and the coefficient is different between them. The volume and wall thickness of the tube are assumed to be unchanged after MTHF forming, on the basis of the relation shown in Figure 26. The applicable range of the axial feeding amount ΔL for the theoretical formula is equal to the range of displacement from the value when the height of the bulge having a hemispherical branch tube head with a radius of D/2 is added to the die shoulder height r1 to the value when the axial punch head reaches the boundary of the die shoulder in the axial direction.
● T-shape forming
h = 4 Δ L + A 4 ( V a + V c + V e ) π ( D 2 d 2 )
● Cross-shape forming
h = 2 Δ L + A 4 ( V a + V c + V e ) π ( D 2 d 2 )
A = 4 r 1 + 3 D
V a = π ( D 3 d 3 ) 6
V c = ( 1 π 4 ) ( 2 r 1 + D ) 2 ( D d )
V e = π 2 ( D 8 + r 1 4 ) ( D 2 d 2 ) π ( D 3 d 3 ) 6
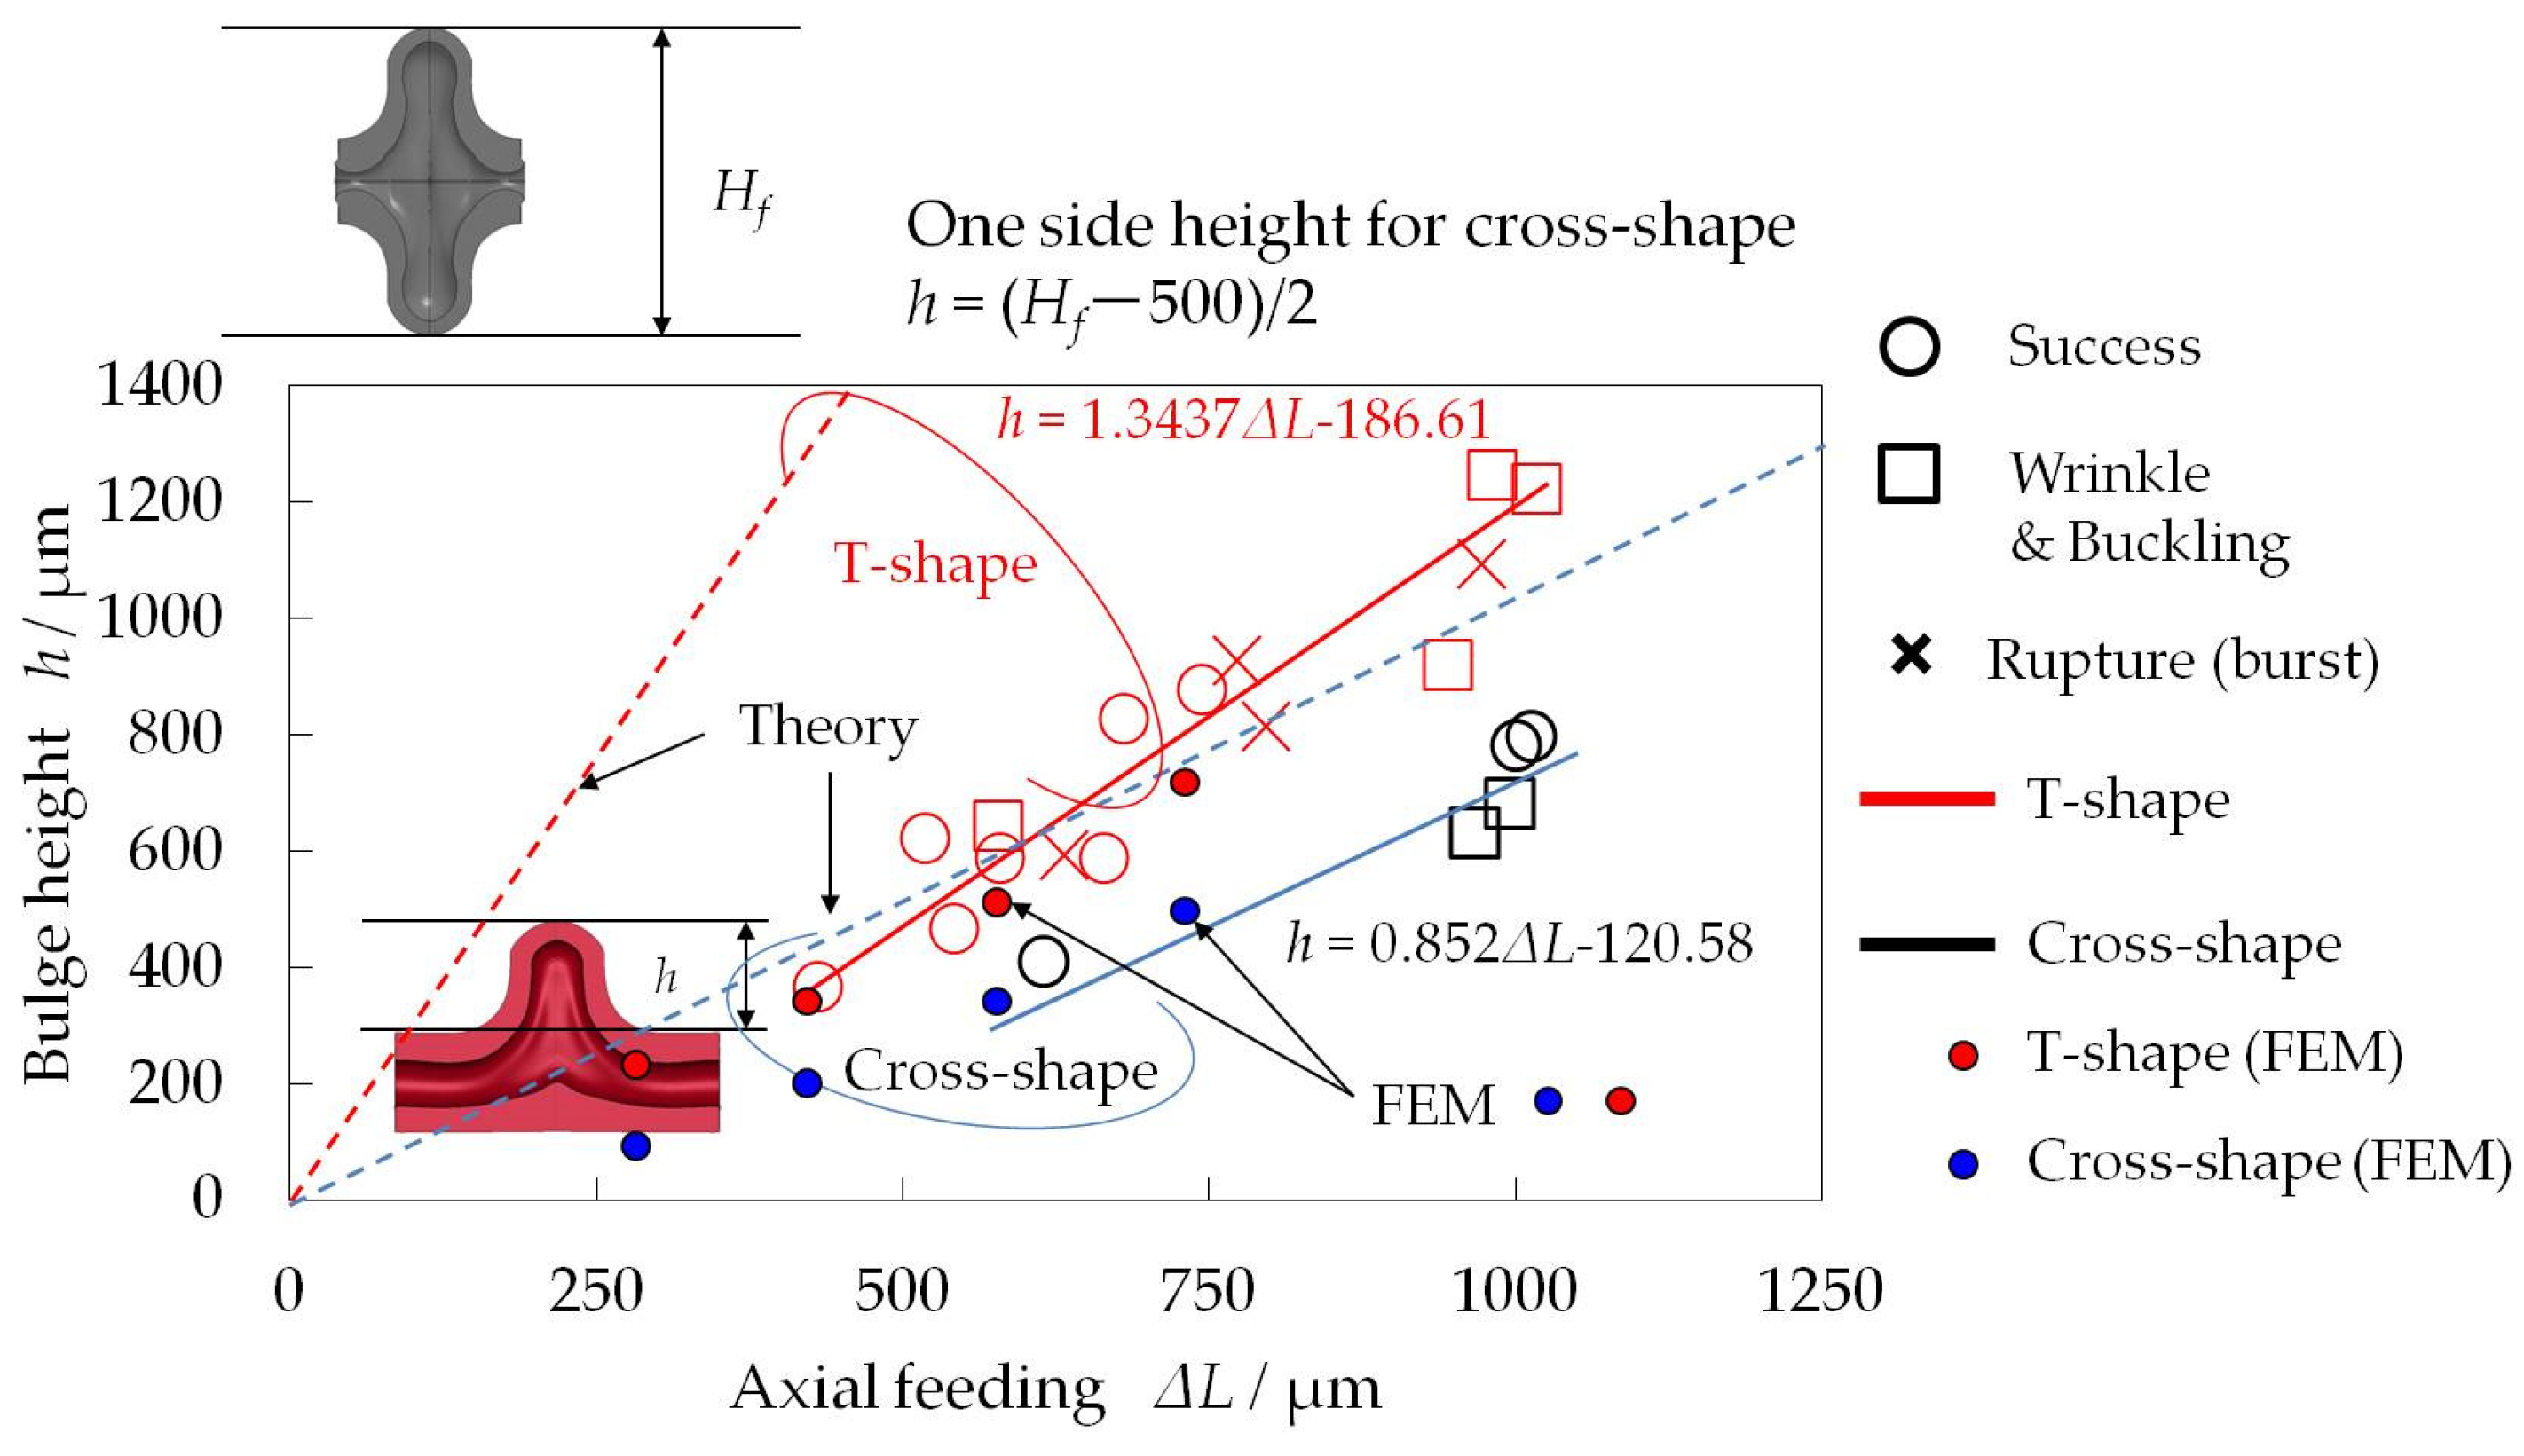
Figure 27 shows the experimental and theoretical results of the bulge height in the process window for T-shape and cross-shape forming. From Equations (3) and (4), it can be seen that the bulge height h of the T-shape sample can theoretically be twice that of the cross-shape sample under the same amount of axial feeding ΔL. However, in the experimental data, the bulge height h obtained with one-way material flow in T-shape forming is approximately 150% that of the cross-shape with thinning of the wall in two-way material flow. In addition, the FE analysis results are also plotted in the figure. From this figure, the results of FE analysis are in good agreement with the experimental data for both T-shape and cross-shape MTHF; together with Figure 9 and Figure 10a; the validity of FE modeling for this MTHF process is consequently verified.

3.6. Microstructure of Microtube in T-shape MTHF

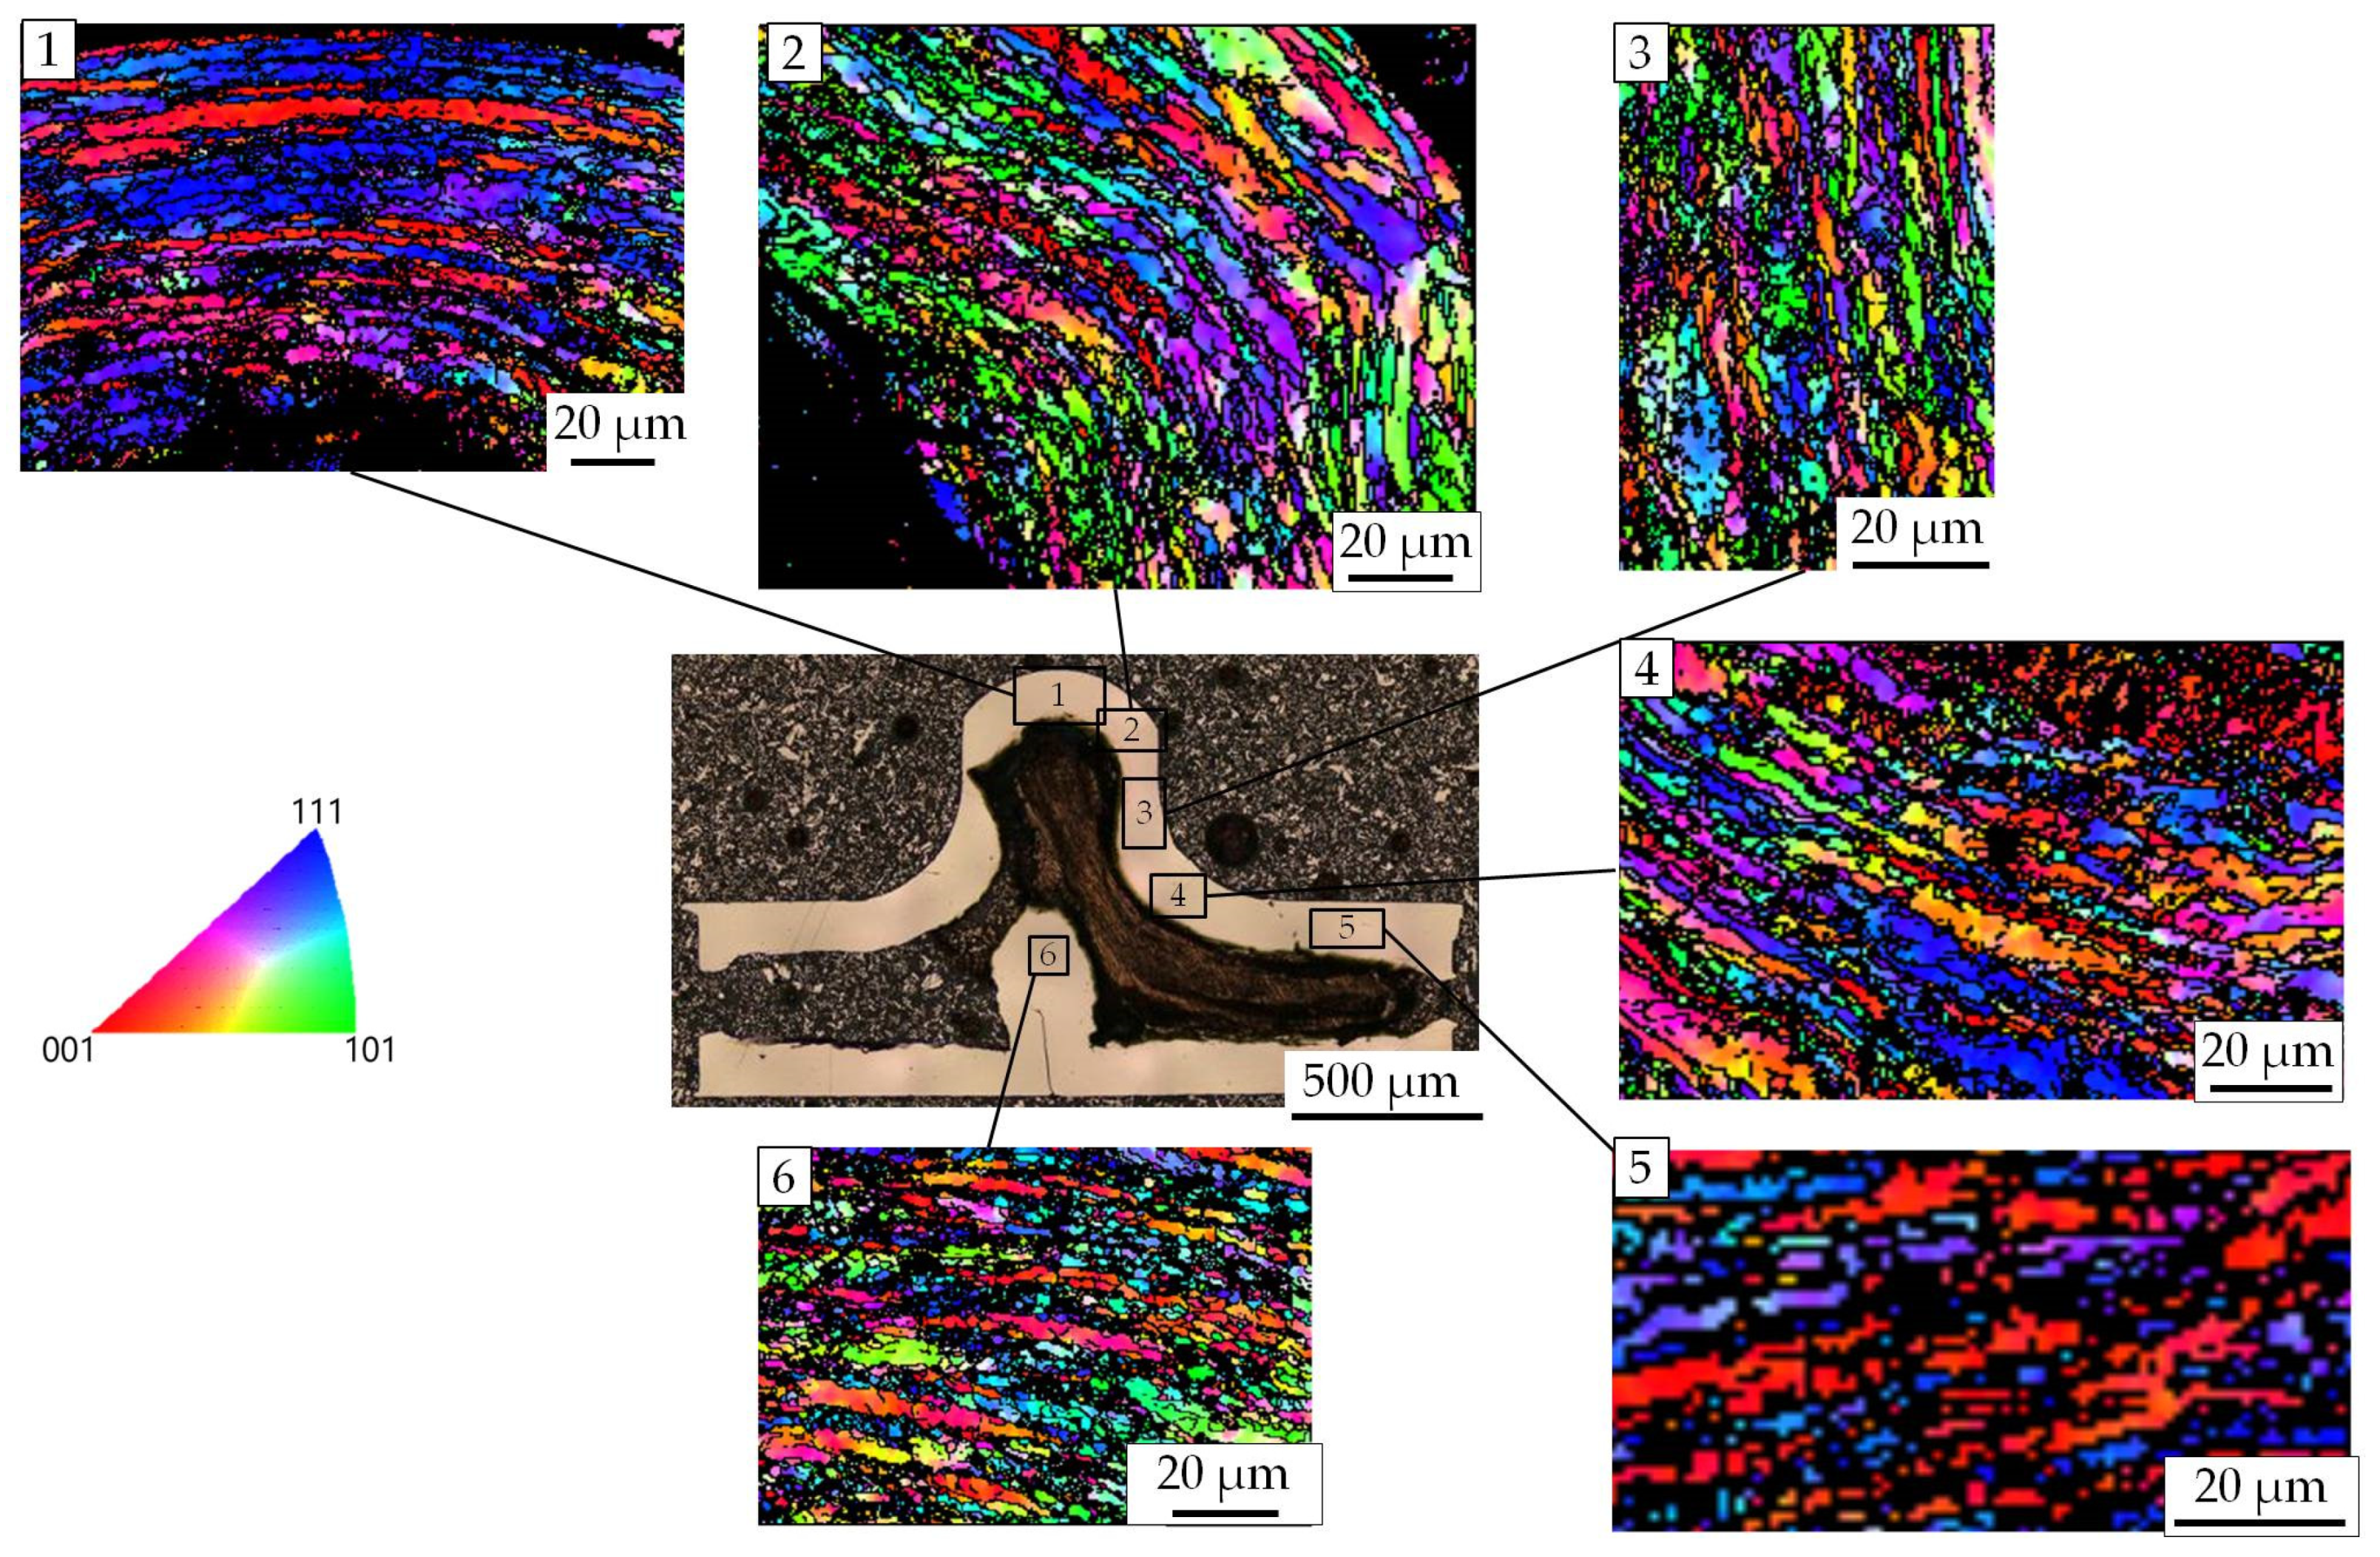
Figure 28 shows the microstructure of the initial microtube of C1220 copper. The original microtube has approximately 20 fine-grained layers in the wall thickness direction with a lamellar texture and average grain size of approximately 4.0 µm. This lamellar texture has a circular shape in the cross section of the hoop. Therefore, it is clarified that the microstructure in the wall thickness of the microtube is stretched in the axial direction by drawing. On the other hand, to observe the microstructure after T-shape MTHF, a T-shape sample was fabricated under the forming conditions of ph = 50 MPa, ΔL1 = 150 µm, and ΔL2 = 580 µm. Figure 29 shows the microstructures at different areas of the micro-T-shape sample [14]. The grain size of the T-shape sample is almost the same as that of the initial microstructure. Therefore, the evaluation of the hydroformability and deformation behavior of the microtube is possible by FE analysis, as shown previously, without considering the grain boundaries. In contrast, the microstructure of the T-shape sample changes from the initial state. As shown in Figure 29, the crystal orientation of the grains at the branch wall rotated. However, there was no rotation of the grains at the crown of the bulge, where the biaxial tensile stress was loaded. In addition, no rotated grains were observed at the area where compressive stress was loaded. In this area, the rotation of the grains was suppressed. The rotation of the grains may have been caused by uniaxial tensile stress at the branch wall.
On the other hand, the microstructure in the folding portion at the bottom opposite the bulge had a different texture. There were grains with an average size of 3.4 µm. These grains were approximately 14% smaller than the initial grains. Therefore, it is considered that the material at the bottom opposite the bulge was loaded with higher compression and underwent greater folding deformation than the other areas, presumably as a result of grain refinement. FEM could not simulate the buckling and folding at the bottom. One of the reasons for this disagreement could be that the refinement of grains in the material was not considered in FEM.

4. Conclusions

In this study, micro-T-shape forming for phosphorus–deoxidized copper and SUS304 stainless-steel tubes with an outer diameter of 0.5 mm and a wall thickness of 0.1 mm was examined by ultrahigh-pressure MTHF and FEM analysis. The deformation behavior and forming characteristics, the effects of lubrication/friction, tube material, and length on hydroformability, and the forming defects of the tubes were examined and evaluated. The process window of T-shape MTHF was compared with that of cross-shape MTHF. The results obtained in this study are summarized below.
  • The deformation behavior and forming characteristics of T-shape MTHF were clarified from experiments and FEM. The two sets of results showed relatively good agreement. In a late forming stage, a discrepancy between experimental and simulated bulge height results was seen and is thought to be due to the occurrence of irregular deformation at the bottom opposite the bulge in the experiment, and the experimental bulge height was larger than the FEM result.
  • The hydroformability of C1220 copper microtubes is lower than that of SUS304 because the SUS304 microtubes having high buckling resistance and the occurrence of bottom buckling in the T-shape MTHF process being suppressed.
  • The microtube length, which is related to the friction resistance, greatly affects the hydroformability. Even when T-shape MTHF of a short microtube is successful, for a longer tube, even with an extremely good friction/lubrication state, the flow of material into the die cavity becomes difficult, and the process cannot be successful. Compared with cross-shape MTHF, the hydroformability (bulge height) in T-shape MTHF is superior, and increased bulge height can be obtained. Since the tube material in T-shape MTHF flows asymmetrically in one direction into the die cavity, there is a high possibility of buckling deformation easily occurring at the bottom of the bulge, and the buckling region in the process window becomes wider under low internal pressure, and the success region moves to one of higher internal pressure.
  • Lubrication and friction between the tube and the die greatly affect the hydroformability (bulge height) of the microtube. When the friction resistance increases, the amount of material flowing into the die cavity is restricted and decreases, and then the bulge height decreases. Correspondingly, the microtube greatly thickens in the vicinity of its end.
  • The asymmetric material behavior in T-shape MTHF causes a variety of undesired deformation defects in low internal pressure loading paths. This is because the plastic flow into one side of the bulge die cavity causes irregular complex deformation behavior, whereby a variety of forming defects easily occur in the early stages of T-shape MTHF compared with cross-shape MTHF. A featured typical forming defect for T-shape MTHF is buckling/folding at the bottom of the bulge.
  • The success region in the process window for T-shape MTHF shifts toward higher internal pressure compared with that for cross-shape MTHF. There were many defects in the low internal pressure region, and the area where the microtube could be deformed was also narrowed. Since the thickening of the wall was greater than that in cross-shape forming, the forming efficiency considering the bulge height deteriorated by approximately 25%.
  • From observation of the metal microstructure, 20 or more fine grains arranged in the thickness direction were observed for the C1220 copper microtube. The deformation behavior of a T-shape tube was roughly estimated by FEM analysis that did not consider the structural size effect. The microstructure in buckling and folding wrinkles that occurred at the bottom opposite the bulge showed a decrease of approximately 14% in average grain size compared with the surrounding grains. This refinement could be caused by the difference in the buckling and folding behavior in FEM described in Equation (1) above.

Author Contributions

Conceptualization, K.-i.M.; Methodology, K.-i.M. and S.M.; experimental work and methodology, S.M.; numerical analysis, H.Y.; writing—original draft preparation, H.Y. and S.M.; final review and editing, K.-i.M.; supervision of numerical analysis, S.Y.; funding acquisition, K.-i.M.; experimental setup, K.T. All authors have read and agreed to the published version of the manuscript.

Funding

This work was supported by JSPS KAKENHI Grant Number JP18K04781 and The Die and Mold Technology Promotion Foundation.

Acknowledgments

The authors would like to express their appreciation for the implementation of this project in cooperation with Marko Vilotic of Novi Sad University and Kenta Itai, Kanta Sasaki and Naoya Kikuchi, who were the students of Tokyo Metropolitan University.

Conflicts of Interest

The authors declare no conflict of interest.

References

  1. The Japan Society for Technology of Plasticity. Tube Hydroforming Keiryoukanotameno-Seikei-Gijutsu, 1st ed.; Morikita-Shuppan: Tokyo, Japan, 2015; pp. 1–288. [Google Scholar]
  2. Manabe, K.; Fuchizawa, S. Tube Forming Technology: Toward the Highest Card for Weight Savings. J. Jpn. Soc. Technol. Plast. 2011, 52, 33–41. [Google Scholar] [CrossRef]
  3. Geiger, M.; Kleiner, M.; Eckstein, R.; Tiesler, N.; Engel, U. Microforming. CIRP Ann. 2001, 50, 445–462. [Google Scholar] [CrossRef]
  4. Hartl, C.; Anyasodor, G. Experimental and numerical investigations into micro-hydroforming processes and machine design. Steel Res. Int. 2010, 81, 1193–1196. [Google Scholar]
  5. Zhuang, W.; Wang, S.; Lin, J.; Hartl, C. Experimental and numerical investigation of localized thinning in hydroforming of micro-tubes. Euro. J. Mech. A/Solids 2011, 31, 67–76. [Google Scholar] [CrossRef]
  6. Ngaile, G.; Lowrie, J. New micro tube hydroforming system based on floating die assembly concept. Trans. ASME J. Micro Nano-Manuf. 2014, 2, 041004. [Google Scholar] [CrossRef]
  7. Manabe, K. Micro forming processing of metal tubes. B. Jpn. Soc. Technol. Plast. 2019, 2, 8–13. [Google Scholar]
  8. Shirayori, A.; Ando, T.; Narazaki, M.; Usui, M. Effect of Initial thickness on cross-shaped-tube hydroforming of small-diameter tubing. J. Jpn. Soc. Technol. Plast. 2013, 54, 988–992. [Google Scholar] [CrossRef] [Green Version]
  9. Shirayori, A.; Ando, T.; Usui, M.; Narazaki, M. Effect of Initial Thickness on Cross-Shaped Tube Hydroforming of Small Diameter Tubing. In Proceedings of the 6th International Conference on Tube Hydroforming (TUBEHYDRO 2013), Jeju, Korea, 25–28 August 2013; pp. 64–67. [Google Scholar]
  10. Yasui, H.; Yoshihara, S.; Yamada, R.; Ito, Y. Deformation Behavior on Small-Diameter ZM21 Magnesium Alloy Tube in Warm Tube Hydroforming. J. Jpn. Soc. Technol. Plast. 2019, 60, 346–351. [Google Scholar] [CrossRef]
  11. Mori, S.; Sato, H.; Itai, K.; Manabe, K. Development of microtube hydroforming system and its application to cross-shape microtube. J. Jpn. Soc. Technol. Plast. 2017, 58, 72–77. [Google Scholar] [CrossRef] [Green Version]
  12. Jirathearanat, S.; Hartl, C.; Altan, T. Hydroforming of Y-shapes—product and process design using FEA simulation and experiments. J. Mater. Process. Technol. 2004, 146, 124–129. [Google Scholar] [CrossRef]
  13. Manabe, K.; Sato, H.; Itai, K.; Vilotic, M.; Tada, K. Factors influencing the forming characteristics in micro tube hydroforming by ultra high-forming pressure. Procedia Eng. 2017, 207, 2334–2339. [Google Scholar] [CrossRef]
  14. Mori, S.; Itai, K.; Sato, H.; Tada, K.; Manabe, K.; Takahashi, S. Micro Tee Hydroforming of Copper Tube. In Proceedings of the 68th Japanese Joint Conference for the Technology of Plasticity, Fukui, Japan, 9–12 November 2017; pp. 409–410. [Google Scholar]
  15. Miyagawa, M.; Back, C. The buckling of the circular cylindrical shells under uniaxial compression and nose gorming. J. Jpn. Soc. Technol. Plast. 1962, 3, 397–405. [Google Scholar]
  16. Geckeler, J.W. Plastic buckling of the wall of hollow cylinders and some other folding phenomena on trays and sheets. J. Appl. Math. Mech. 1928, 8, 341–352. [Google Scholar]
  17. Vollertsen, F.; Hu, Z. Tribological size effects in sheet metal forming measured by a strip drawing test. CIRP Ann. 2010, 55, 1193–1196. [Google Scholar] [CrossRef]
  18. Putten, V.K.; Franzke, M.; Hirt, G. Size effect on friction and yielding in wire flat rolling. In Proceedings of the 2nd International Conference on New Forming Technology, Bremen, Germany, 20–21 September 2007; pp. 583–592. [Google Scholar]
  19. Shirayori, A.; Tamanoi, S.; Narazaki, M. Elementary Analysis Modeling for Branch Forming of Small Diameter Thick-Walled Tube. In Proceedings of the 63rd Japanese Joint Conference for the Technology of Plasticity, Kitakyushu, Japan, 4–6 November 2012; pp. 183–184. [Google Scholar]
  20. Fuchizawa, S.; Kitamura, K.; Narazaki, M.; Sukimoto, M.; Watanabe, I. Deformations of aluminum alloy tubes under forming of T-fitting. J. Jpn. Soc. Technol. Plast. 1995, 30, 80–86. [Google Scholar]
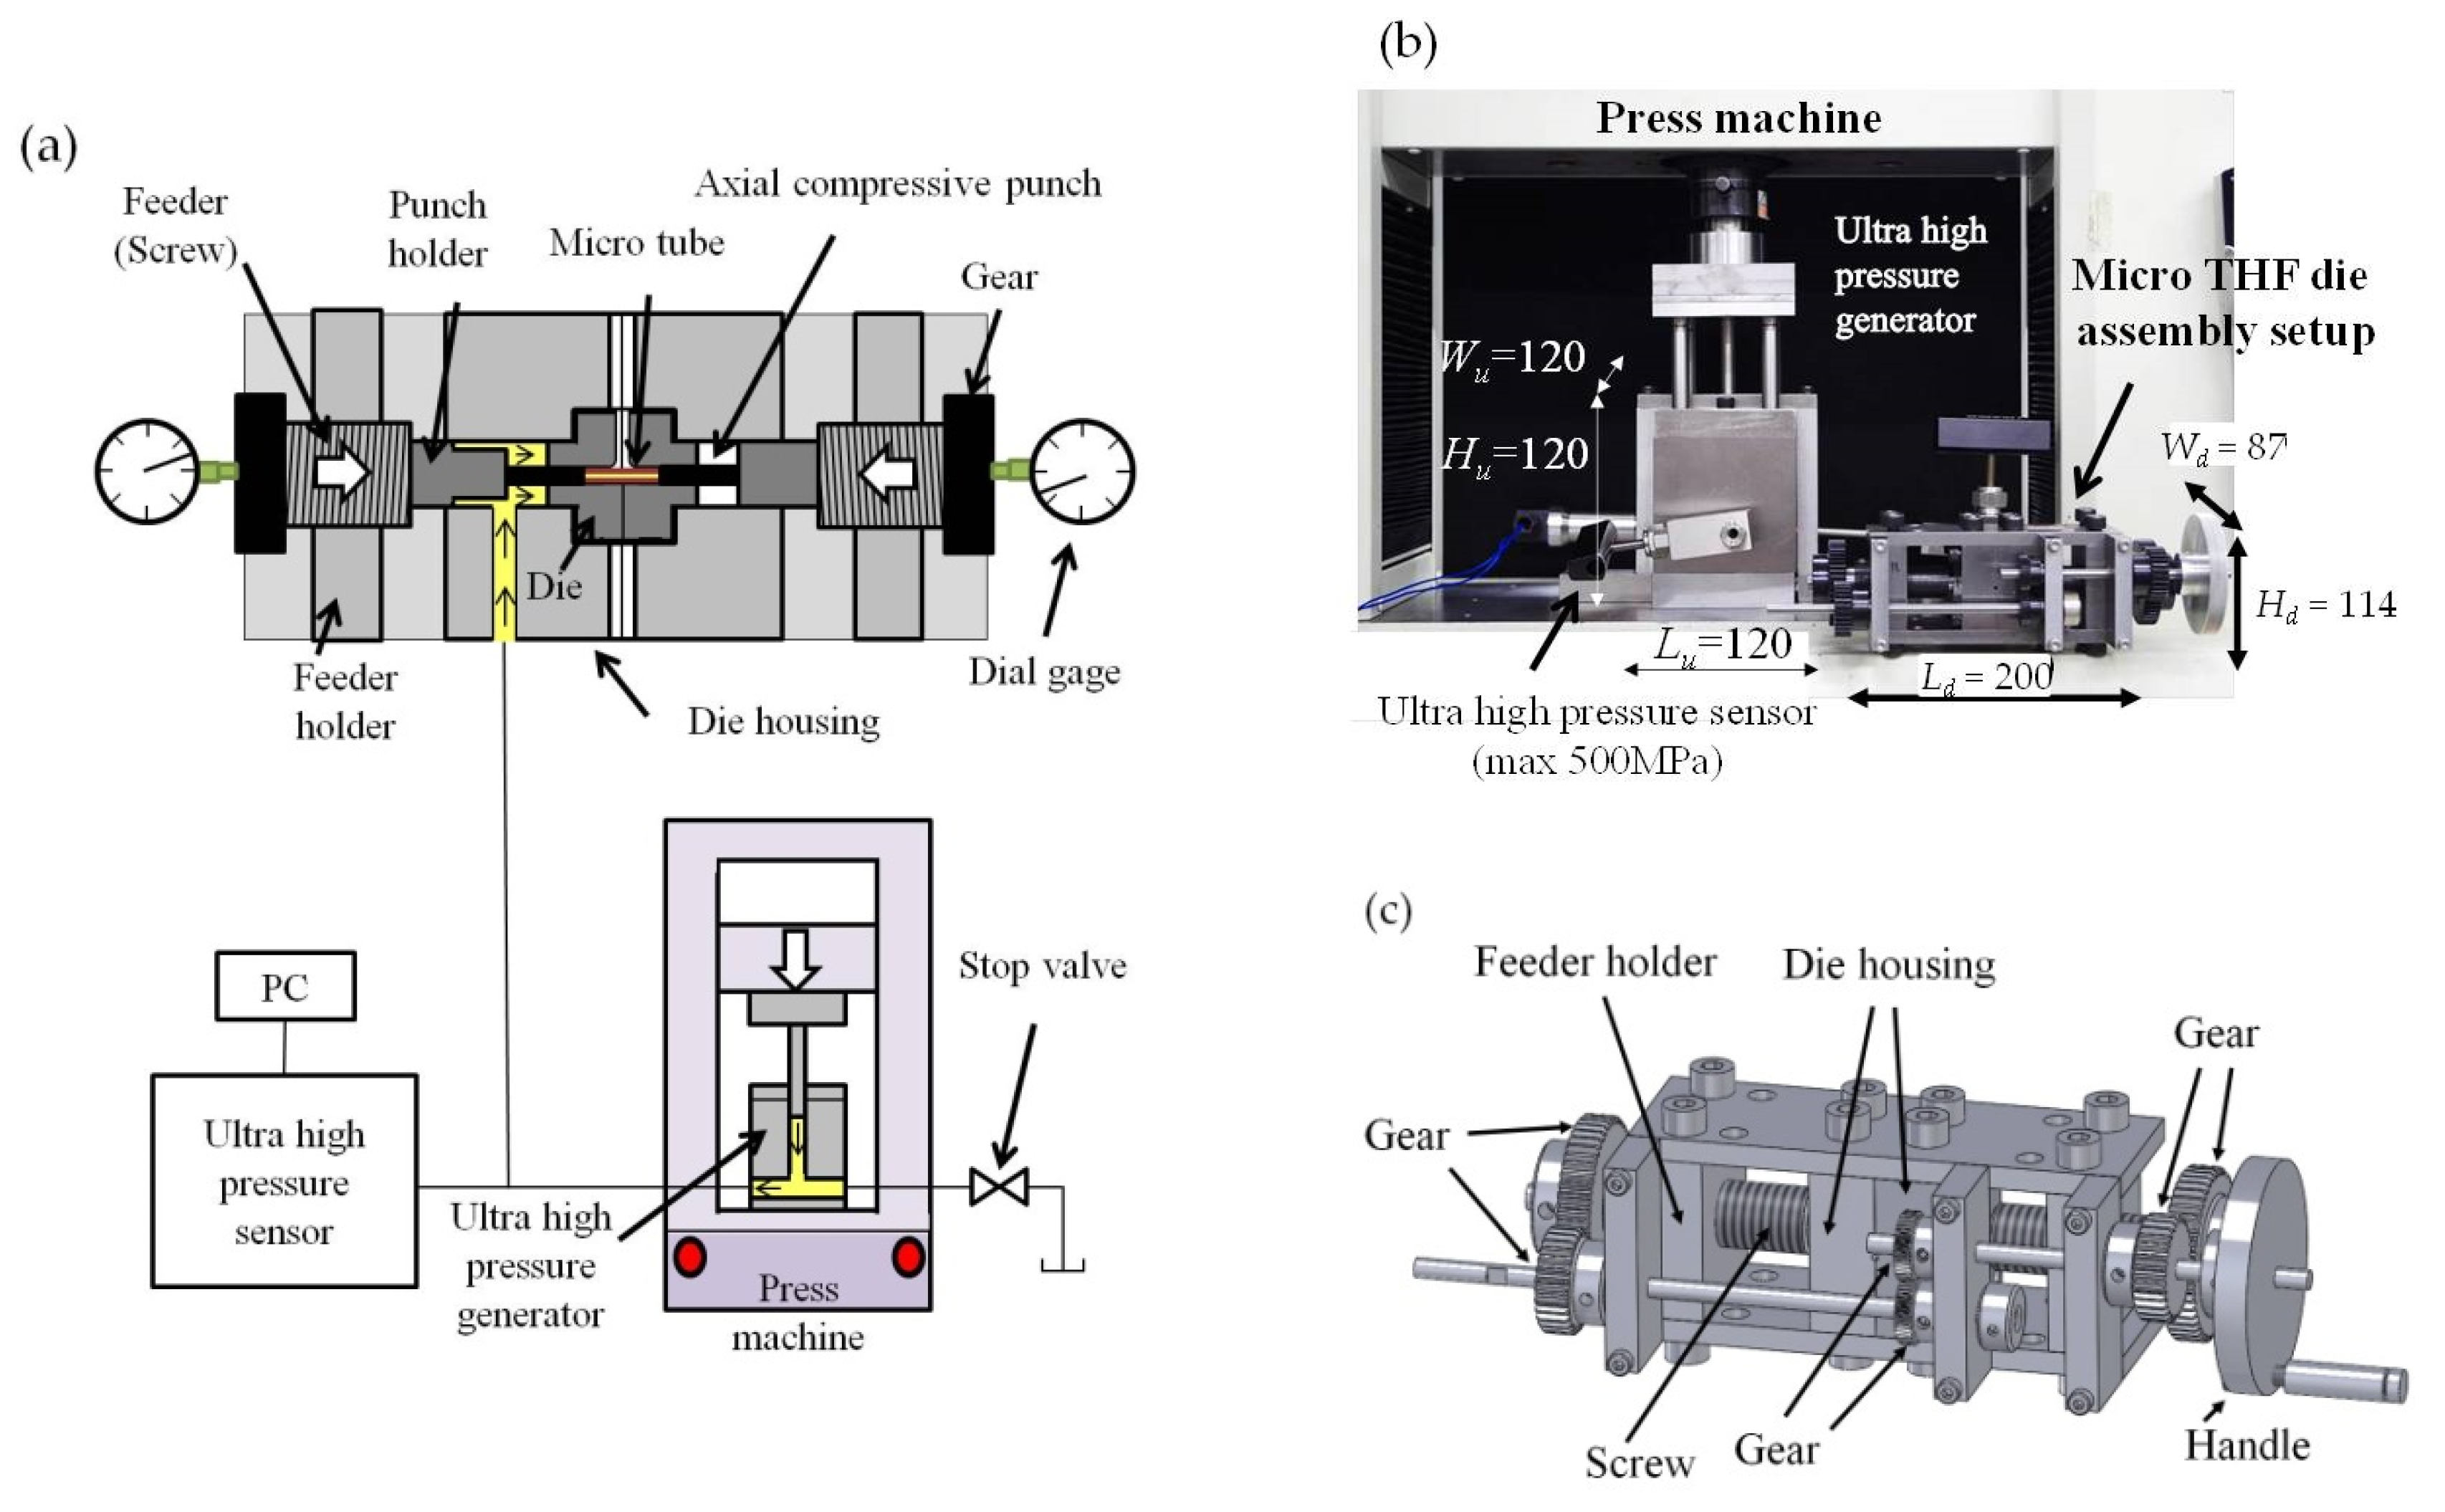
Figure 1. Microtube hydroforming (MTHF) system used for T-shape forming: (a) schematic of MTFH system; (b) appearance of MTHF system; (c) axial feeding mechanism in MTHF device.
Metals 10 00199 g001
Figure 2. Geometry and dimensions of die and axial punch used for a microtube hydroforming (THF) system (unit, mm): (a) die; (b) axial punch with groove.
Metals 10 00199 g002
Figure 3. Split die for T-shape microcomponent (comparison of one-yen coin and microdie).
Metals 10 00199 g003
Figure 4. Design profile (dotted line) and measured profile (solid line) nearby die shoulder part for T-shape MTHF (unit, μm).
Metals 10 00199 g004
Figure 5. Stress–strain curves obtained from tensile test results of microtubes used.
Metals 10 00199 g005
Figure 6. Loading path used in T-shape MTHF: (a) basic loading path; and (b) loading path for determining the process window.
Metals 10 00199 g006
Figure 7. Schematic of finite element (FE) model for T-shape MTHF.
Metals 10 00199 g007
Figure 8. Micro-T-shape sample on the finger and magnified sample compared with a rice grain (C1220).
Metals 10 00199 g008
Figure 9. Deformation behavior of microtube in T-shape MTHF (ph = 50 MPa, μs = 0.01, μd = 0.005) (C1220).
Metals 10 00199 g009
Figure 10. Bulging behavior and bulge shape in experiment and simulation (μs = 0.01 and μd = 0.005) (C1220, fluorocarbon): (a) bulging behavior; (b) bulge shape at ΔL2 = 431 µm; (c) bulge shape at ΔL2 = 744 µm.
Metals 10 00199 g010
Figure 11. Axial cross-section of T-shape samples (C1220) under different MTHF conditions: (a) sample hydroformed at ph = 50 MPa, ΔL = 450 μm; (b) sample hydroformed at ph = 120 MPa, ΔL = 700 μm.
Metals 10 00199 g011
Figure 12. Appearance and axial cross-section of T-shape sample of SUS304 (ph = 70 MPa, ΔL = 750 μm).
Metals 10 00199 g012
Figure 13. Effect of lubrication condition on the hydroformability (bulge height) of T-shape MTHF: (a) fluorocarbon; (b) no lubrication (ph = 120 MPa, ΔL1 = 150 μm) (C1220).
Metals 10 00199 g013
Figure 14. Effect of friction coefficient on bulge height of a micro-T-shape tube (ph = 50 MPa, ΔL1 = 150 μm).
Metals 10 00199 g014
Figure 15. Effect of friction coefficient on wall thickness at bulged crown of a micro-T-shape tube (ph = 50 MPa, ΔL1 = 150 μm).
Metals 10 00199 g015
Figure 16. Effect of friction coefficient on wall thickness at bottom opposite branch part of a micro-T-shape tube (ph = 50 MPa, ΔL1 = 150 μm).
Metals 10 00199 g016
Figure 17. Effect of friction coefficient on wall thickness at end of a micro-T-shape tube (ph = 50 MPa, ΔL1 = 150 μm).
Metals 10 00199 g017
Figure 18. Effect of the initial tube length on the deformation and equivalent plastic strain of a micro-T-shape tube.
Metals 10 00199 g018
Figure 19. Effect of the initial tube length on the bulge height of a micro-T-shape tube.
Metals 10 00199 g019
Figure 20. Axial compressive force acting against friction between tube and die Fμ during processing.
Metals 10 00199 g020
Figure 21. Typical failure modes that occur in the T-shape MTHF process observed in experiments and FE simulation (C1220): (a) folding, thinning and rupture; (b) thickening; (c) rupture at crown.
Metals 10 00199 g021
Figure 22. Process window for T-shape MTHF (C1220).
Metals 10 00199 g022
Figure 23. Process windows for T-shape MTHF with results of cross-shape MTHF plotted for comparison (C1220).
Metals 10 00199 g023
Figure 24. Sections where thinning occurs for T-shape and cross-shape MTHFs.
Metals 10 00199 g024
Figure 25. Relationship between bulge height and amount of axial feeding for T-shape and cross-shape hydroforming (C1220, experiment).
Metals 10 00199 g025
Figure 26. Model of geometric relationship between bulge height h and amount of axial feeding ΔL in MTHF process.
Metals 10 00199 g026
Figure 27. Theoretical and experimental results showing relationship between bulge height and amount of axial feeding for T-shape and cross-shape hydroforming (C1220).
Metals 10 00199 g027
Figure 28. Microstructure in the initial microtube (C1220).
Metals 10 00199 g028
Figure 29. Microstructure at different positions of micro-T-shape sample fabricated by the MTHF process (C1220).
Metals 10 00199 g029
Table 1. Mechanical properties of C1220 copper microtube used in the finite element method (FEM).
MaterialC1220
Material modelElastoplastic body
Mass density ρ/g cm38.89
Elastic modulus E/GPa118
Yield stress σy/MPa324.47
Poisson’s ratio ν0.3