Article

Defect Reduction and Quality Optimization by Modeling Plastic Deformation and Metallurgical Evolution in Ferritic Stainless Steels

by
Silvia Mancini
1,
Luigi Langellotto
1,
Paolo Emilio Di Nunzio
1,
Chiara Zitelli
1 and
Andrea Di Schino
2,*
1
RINA Consulting Centro Sviluppo Materiali, Via di Castel Romano 100, 00128 Roma, Italy
2
Dipartimento di Ingegneria, Università degli Studi di Perugia, Via G. Duranti 93, 06125 Perugia, Italy
*
Author to whom correspondence should be addressed.
Metals 2020, 10(2), 186; https://doi.org/10.3390/met10020186
Submission received: 9 December 2019 / Revised: 16 January 2020 / Accepted: 25 January 2020 / Published: 27 January 2020
(This article belongs to the Special Issue Thermomechanical Processing of Steels)

Abstract

:
Manufacturing of ferritic stainless steels flat bars is an important industrial topic and the steel 1.4512 is one of the most commonly used grades for producing this component. In this paper, the origin of some edge defects occurring during hot rolling of flat bars of this grade is analyzed and thermomechanical and microstructural calculations have been carried out to enhance the quality of the finished products by reducing the jagged borders defect on hot rolled bars. An accurate investigation has been carried out by analyzing the defects on the final product from both the macroscopic and microstructural point of view through the implementation of thermomechanical and metallurgical models in a finite element (FE) MSC Marc commercial code. Coupled metallurgical and damage models have been implemented to investigate the microstructural evolution of ferritic grain size and material damaging. Three levels of prior ferritic grain size (PFGS) and three furnace discharge temperatures have been considered in the thermo-mechanical simulations of the roughing passes. Rheological laws for modeling the evolution of ferritic grain have been modified to describe the specific cases simulated. Results have shown that the defect is caused by processing conditions that trigger an anomalous heating which, in turn, induces an uncontrolled grain growth on the edges. The work-hardened and elongated grains do not recrystallize during hot deformation. Consequently, they tend to squeeze out the surrounding softer and recrystallized matrix towards the edges of the bar where the fractures that characterizes the surface defect occur.

1. Introduction

Owing to their lower cost with respect to austenitic stainless steels, ferritic stainless steels are more and more requested. They are nowadays used in many applications facing with strength/ductility requirements coupled with high targets of corrosion resistance [1]. In particular, they are employed in automotive [2], construction and building [3,4], energy [5,6], aeronautical [7], food [8], and 3D printing [9] applications.
Manufacturing ferritic stainless steels flat bars is an important topic in steel industry. The steel grade EN 1.4512 is widely used in the production of ferritic bars. Flat bar products made of this material can exhibit some defects such as jagged edges when subjected to hot rolling. In order to study and identify the origin of this type of defect, a study on the rolling conditions of ferritic flat bars made of steel grade 1.4512 steel has been carried out.
The evolution of the steel microstructure is the key element to understand the nature of the abovementioned defects. For this reason, a model to simulate the effect of recrystallization and grain growth during hot deformation has been developed. Due to the high temperature and the intense strain field characterizing the roughing process, the solidification structure is fully replaced by a new recrystallized microstructure.
The roughing step has been identified as a crucial part of the hot rolling process. As a matter of fact, local hot working conditions of the material change strongly depending on the applied strain, strain rate, temperature, and also on the interpass time during the roughing process [10]. It is well known that recrystallization is influenced by temperature, strain amount and soaking time [11]. In case of hot rolling, two processes can be distinguished: the static recrystallization which takes place after deformation during the interpass time, and the dynamic or meta-dynamic recrystallization that takes place during or just after the hot deformation and is promoted by small strain rate and high temperature. A semi-empirical model considering either static and meta dynamic recrystallization has been developed and calibrated on the steel grade 1.4512 to describe all the possible elementary processes. It is coupled with the thermomechanical FE model of roughing in order to describe accurately the local conditions through the thickness and along the bar width on 2D sections.
Almost all the semi-empirical models for describing the microstructural evolution during hot deformation that can be found in the literature refer to austenitic stainless steels [12,13,14]. The same holds also for the equations for predicting the austenite grain size as a function of the hot working conditions [15]. Instead, it is rather difficult to find consistent literature data about the evolution of ferritic microstructure during the hot deformation processes. Some data can be found for interstitial free (IF) steels [16] and with low-carbon steels content during plastic deformation [17,18]. Therefore, in this work, a comprehensive model for recrystallization and grain growth of the ferritic stainless-steel grade EN 1.4512 is proposed.

2. Materials and Methods

The focus of this paper is on the jagged defect on the edges of hot rolled EN 1.4512 steel grade (see for example Figure 1). In order to investigate such defect, a detailed analysis on the border of selected specimen of bars has been performed by a scanning electron microscope (SEM) (Figure 2).
The image in Figure 3 has been the starting point for the understanding of the mechanism of the defect formation. It shows the presence of elongated and not recrystallized abnormal grains “squeezed out” of the edge of the bar which represent a possible cause of the macroscopically observed jagged border.
The original microstructure of the bar is characterized by a central zone, at mid thickness, with an average grain size of approximatively 5 mm as measured according to ASTM E112 specification. Going towards the surfaces the grain size decreases continuously down to 0.15 mm. This information, converted into the analytical function describing the prior ferritic grain size (PFGS) shown in Figure 4, has been used as input in the FE model of the roughing mill. The initial microstructure has been considered representative of the as-cast microstructure illustrated in Figure 5 and composed by a fine cortical grain size and a coarser columnar structure in the core region.
In order to understand the effect of the initial grain size distribution through the thickness on the evolution of the microstructure during the hot rolling process, simulations with the following grain distributions have been considered:
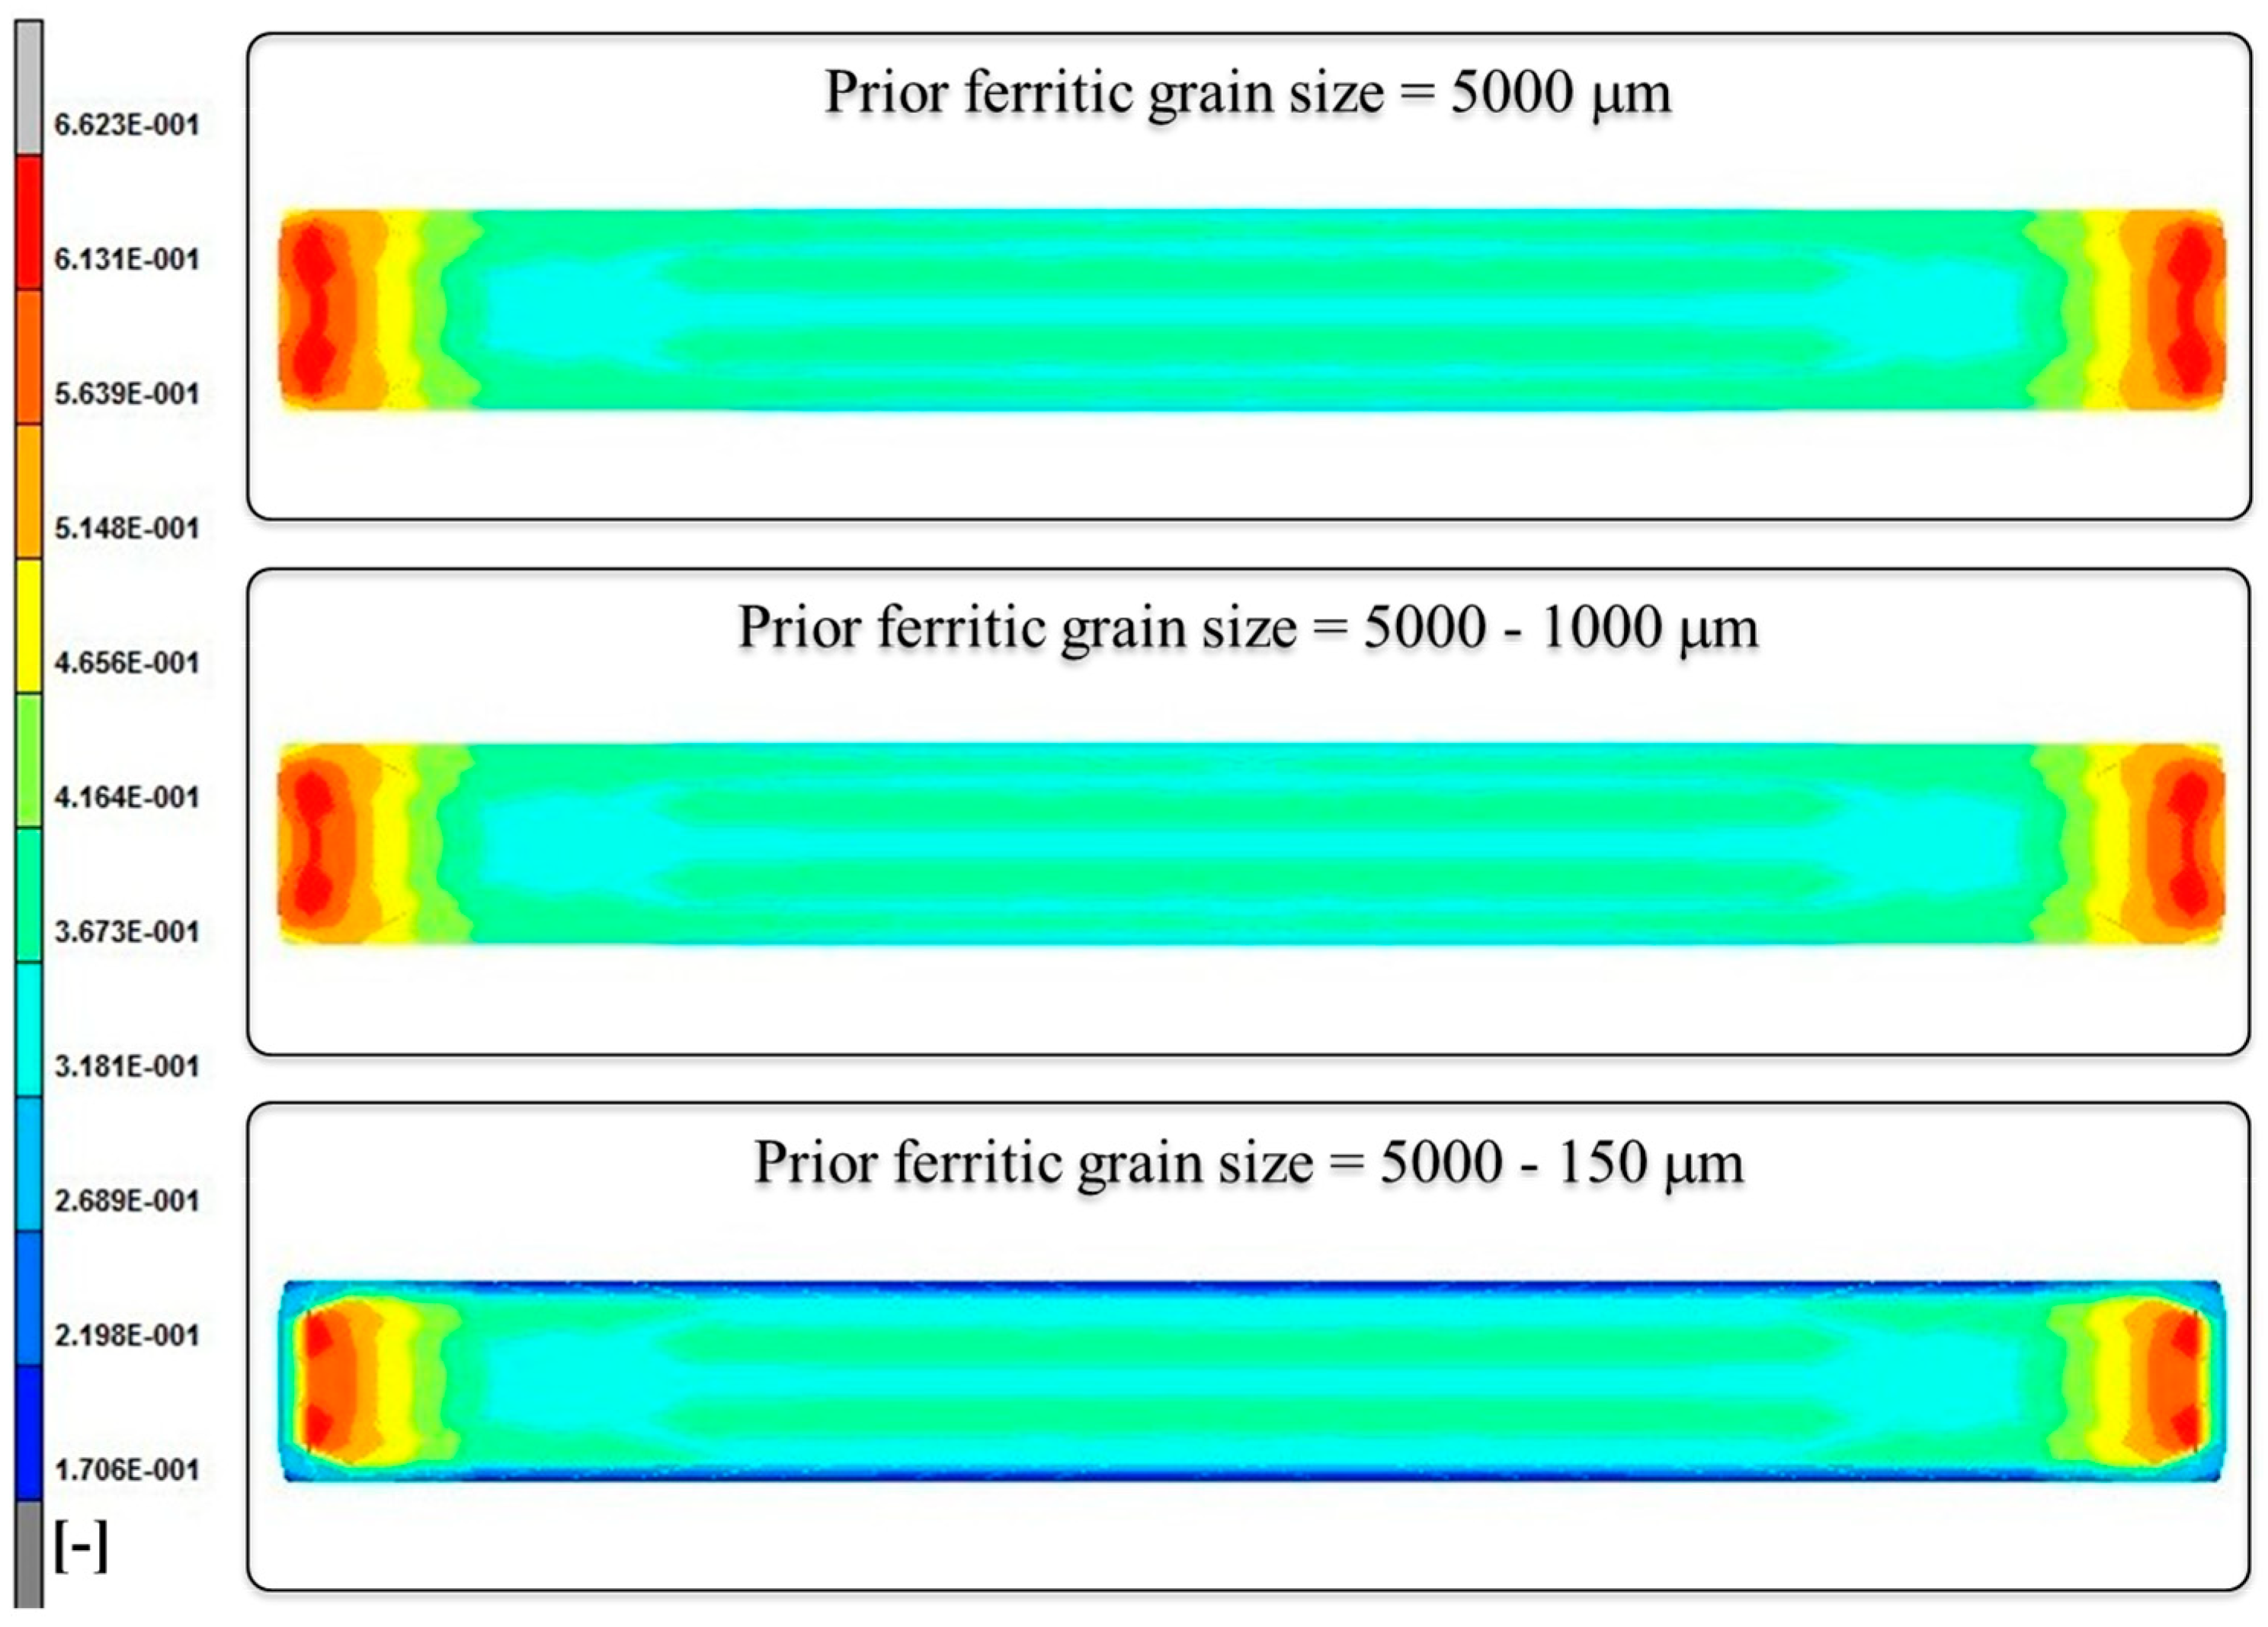
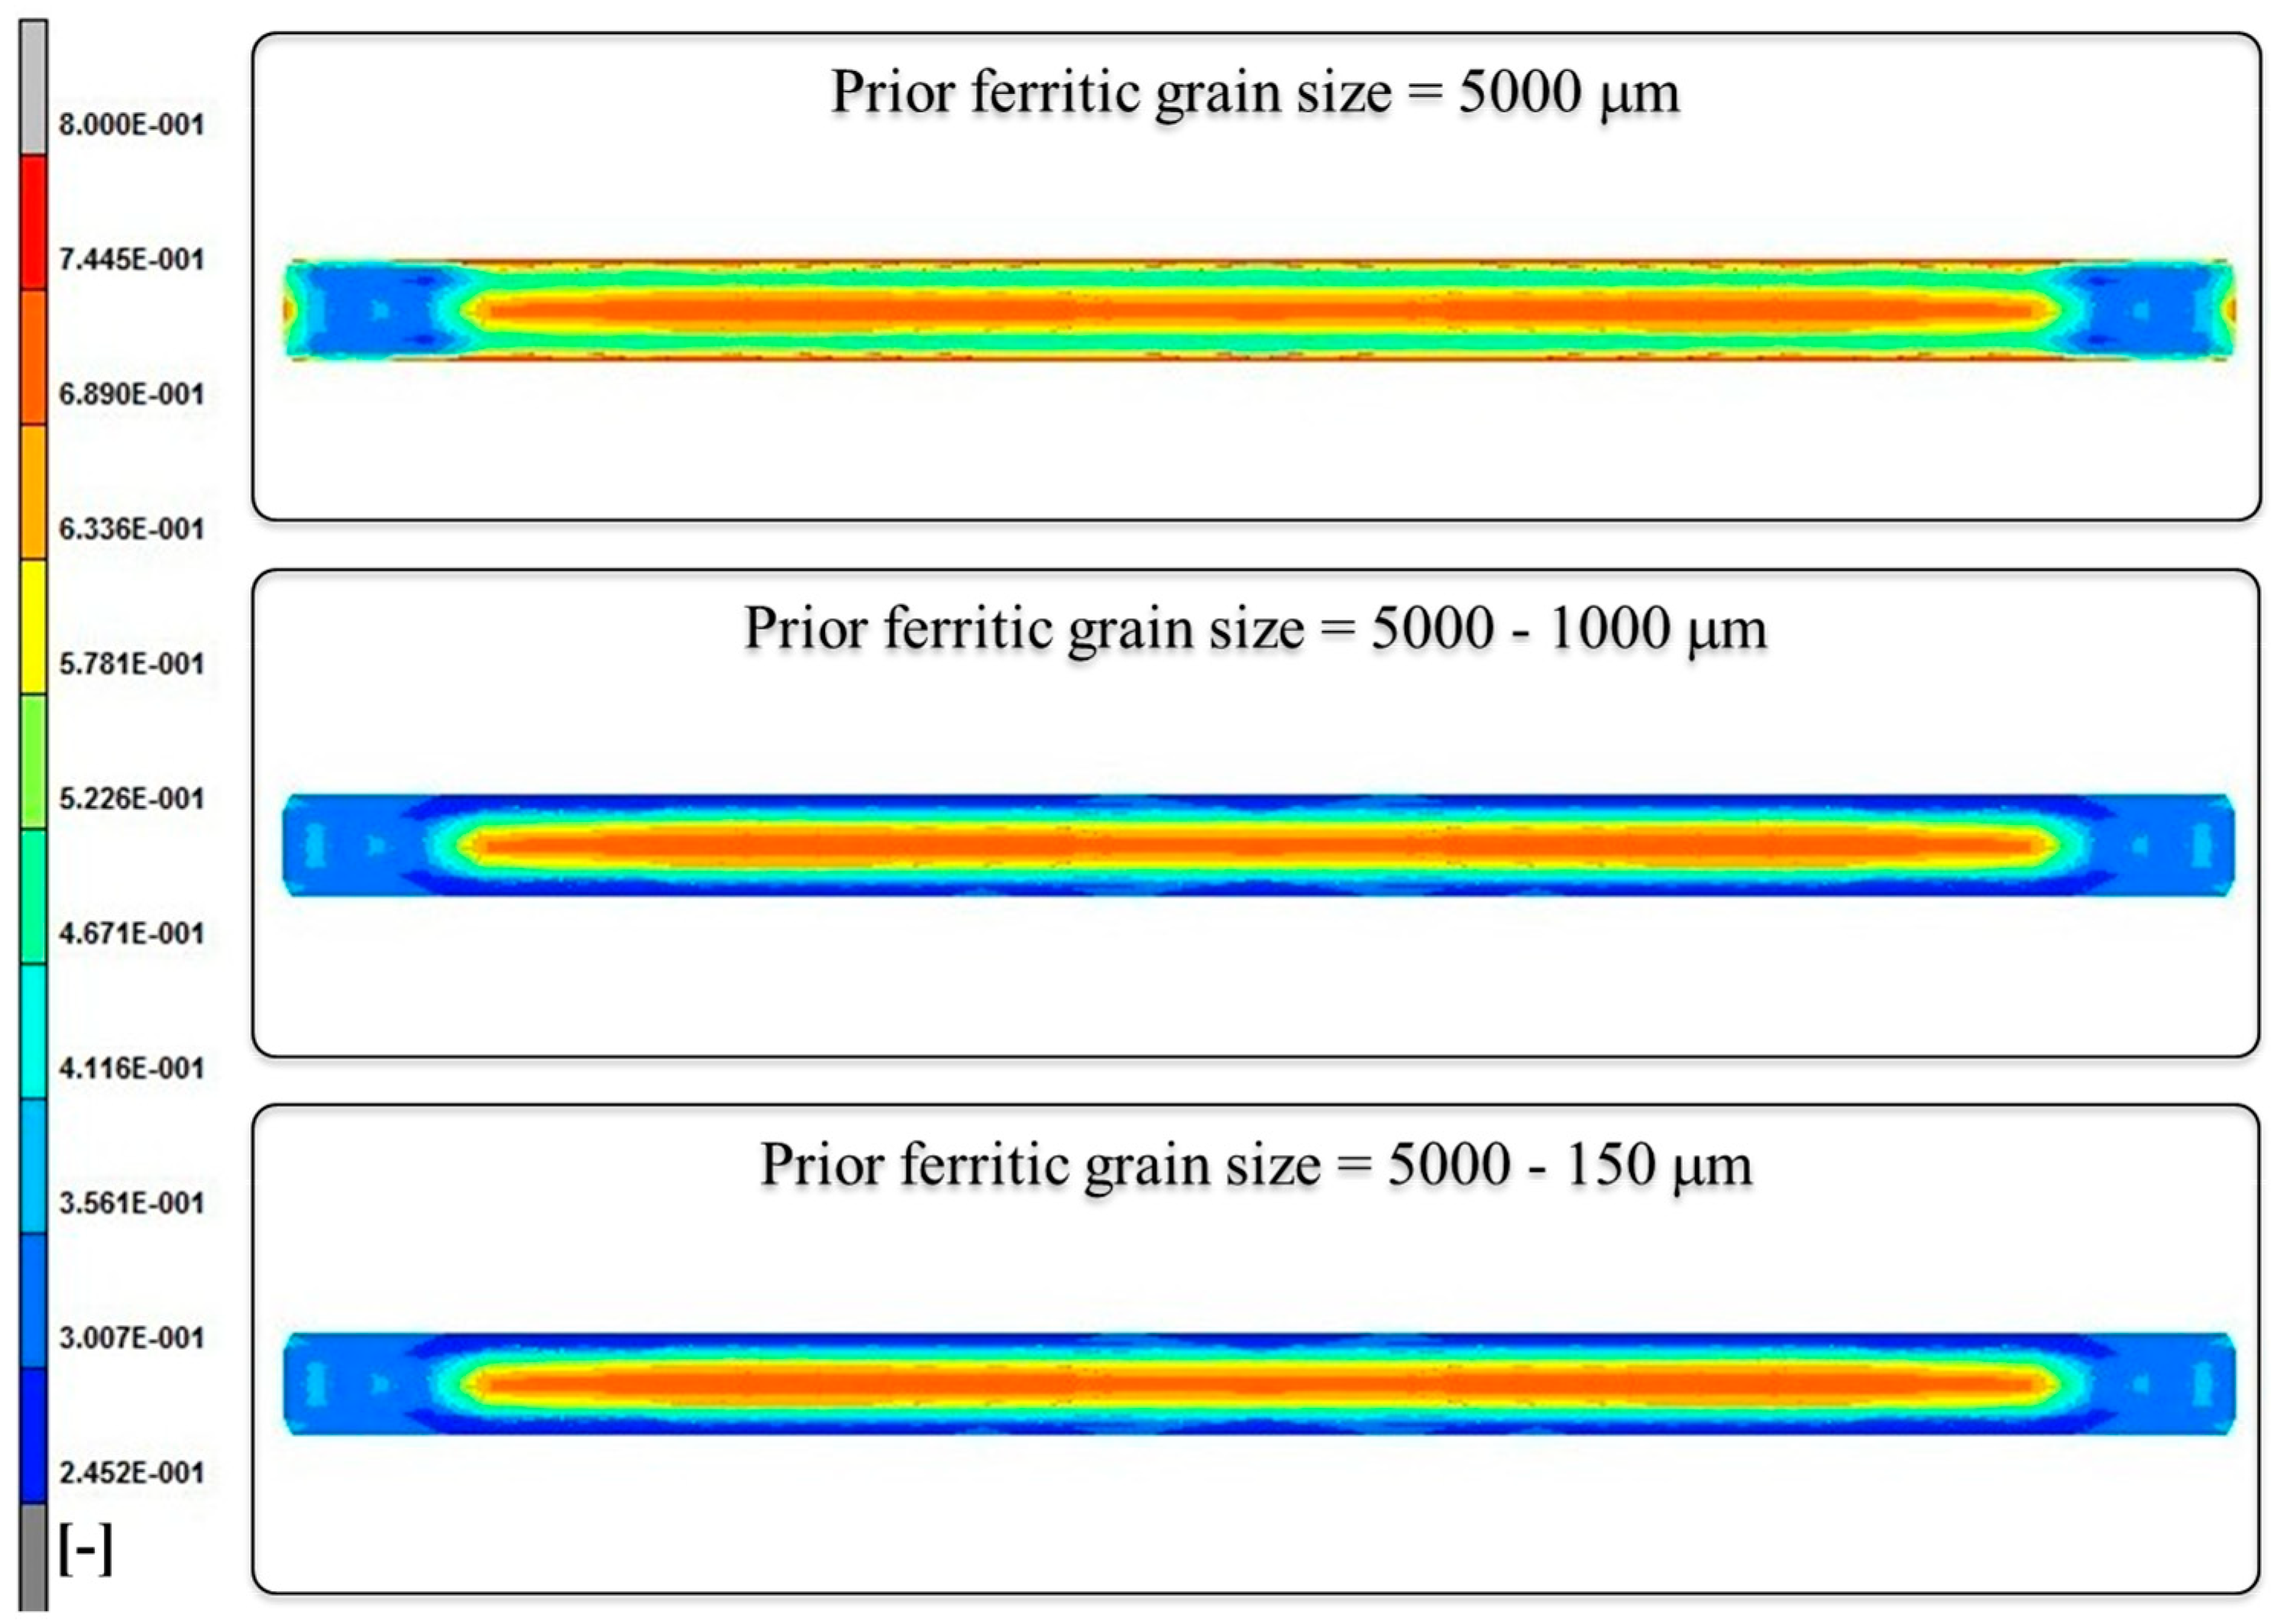
  • from 5000 μm (center) to 0.15 μm (surface)-reference condition
  • uniform grain size of 5000 μm
  • from 5000 µm (center) to 1000 μm (surface)
In order to calibrate the material and damage model tensile tests have been performed on EN 1.4512 steel grade in the temperature range 750–1200 °C, at strain rate of 0.1 s−1 and 5.0 s−1. For the tensile tests a standard round specimen for tensile test following ISO 6892-1:2009 with a diameter of 9 mm and a gauge length of 45 mm.

3. Rheological and Microstructural Models

In order to obtain the parameters for predicting the material microstructural evolution, an ad-hoc 3D thermo-mechanical and metallurgical FE models has been developed and tuned on specific experimental measurements and on literature data when available.

3.1. Hot Deformation Model

The simulation of the material flow when the bar undergoes plastic deformation process has been carried out by implementing a rheological model of the steel. The optimized equation used in this work is Equation (1), was originally proposed by Hansel–Spittel [19]. In such approach the flow stress is expressed by the product of strain, strain rate, and a power of temperature
σ F = A ( ε + ε 0 ) m 2 ( ε ˙ + ε 0 ˙ ) m 8 T e m 1 T
where σF, ε, ε ˙ are respectively flow stress, strain and strain rate, T is the temperature in Celsius degree, A is a scaling coefficient for the flow stress curve, and the coefficients m1, m2, m8 and are unknown and optimizable parameters: coefficient m1 is related to the material’s sensitivity to temperature, m2 models material’s sensitivity to strain, m8 combines the effect of temperature and strain rate.
The Hansel–Spittel model in Equation (1) can be used for strains below peak deformation. Above that threshold value the damage mechanism has to be taken into account in order to represent the lowering of the flow stress curve once the peak stress is reached. At this stage, recrystallization effects were not considered.
The peak deformation ε p is expressed as in Equation (2), where α and β are coefficients which needs to be calibrated.
ε p =   α ( Z ) β
where the Zener–Hollomon parameter Z is evaluated according to [19] as
Z = ( ε ˙ + ε ˙ 0 ) exp ( Q R T )
Coefficients in Equation (3) are the Zener–Hollomon parameter Z, the strain rate and the initial strain rate ε ˙ ,   ε ˙ 0 and the coefficients at the exponent are respectively the activation energy Q, the gas constant R, and temperature T.
α and β parameters in Equation (2) have been set to 0.0184 and 0.8, respectively after a further analysis on experimental curves and the activation energy Q has been set to 277 kJ/mol.
The damage model, based on a modified Lemaitre equation [20], has been implemented in the FE model by means of external subroutines, as well as the implementation of the yield stress. The law governing the damage D ˙ is
D ˙ =   ( h c y S 0 ) s 1 s 2 D i n ε ˙ ¯ p
where ε ˙ ¯ p is the plastic deformation strain rate, the material-dependent constants S0, s1, s2 take into account the strength of the damage and the coefficient hc is set to 1 if the material is in state of tension and 0.2 if it is in state of compression. The quantities y and Din represent respectively the energy released during deformation and the initial damage. All the parameters have been largely discussed in [20]. For the last two parameters, the following expressions have been adopted
y =   σ ¯ 2 E ( 1 D ) 2   [ 2 3   ( 1 + ϑ ) + 3 ( 1 2 ϑ ) ( σ H σ ¯ ) 2 ]
  D i n = a e b r R
where σ ¯ is the equivalent stress and σΗ/ σ ¯ the stress triaxiality factor, i.e., the ratio between the hydrostatic tension and the equivalent stress. The damage variable D depends on the initial value of the damage on the axis of the bar, a, and r is a radial coordinate ranging from 0 to the bar radius R. The coefficient b is calculated from the condition of no initial damage located at a certain radius r in the core area, which is determined through an analysis of the void’s distribution.
Tensile tests performed on EN 1.4512 steel grade in the temperature range 750–1200 °C, at strain rate of 0.1 s−1 and 5.0 s−1 have been reproduced by means of non-linear finite element modeling. The tensile tests were modeled with axisymmetric elements. MSC. Marc was used for all the simulations. Isotropic work hardening law, Equation (1), and von Mises yield criterion have been adopted by using external YIELD subroutine. Damage, formulations from Equation (4) to Equation (6), have been introduced in the FE model by means of UDAMAG user routine.
As far as material stress–strain curve modeling concerns, the after necking extended stress–strain curve was determined by using a modification of the inverse calibration approach proposed by [21,22]. The basic data are the load–displacement curves obtained from conventional tensile tests, fitted by the same results obtained from finite element simulations of the tensile test. The initial stress–strain curve, estimated as a simple power law from experimental data up to necking, was iteratively modified in the post-necking regime until the error between the experimental and numerical load–displacement curve has been reduced below a defined tolerance. Iterations were performed by using the automatic procedure described in [23]. Automatic iterative optimization procedure considers modify all coefficients of Equation (1) considering the total error between all experimental and numerical load–displacement curve in the temperature range 750–1200 °C, at strain rate of 0.1 s−1 and 5.0 s−1. For this multi-objective optimization problem, no single solution exists that simultaneously optimizes each objective, so a nondominated optimal solution that allow to reach the tolerance defined in the optimization procedure has been chosen.
The optimized coefficients of Equation (1) can be found in Table 1 and for Equation (4) are reported in Table 2. Examples of final, calibrated stress–strain curves are reproduced in Figure 6 and compared with experimental data of tensile tests. Comparisons have been reported for tensile tests carried out at: (a) T = 1200 °C ε ˙ = 5s−1; (b) T = 1050 °C ε ˙ = 5 s−1; (c) T = 900°C ε ˙ = 1 s−1.
Once the material model has been tuned in terms of Equation (1) and Equation (4) parameters, a thermo-mechanical hot rolling 3D model has been implemented. A screenshot of the thermo-mechanical 3D model is reported in Figure 7. The FE model of industrial rolling has been calibrated in terms of heat transfer coefficient between material and surrounding and material and rolls thanks the thermal image. Inter-pass time has been evaluated through the analysis of the rolling force signals acquired during hot rolling. The calculated temperatures are in good agreement with the experimental data obtained by a thermal imaging camera as revealed by Figure 7.

3.2. Static Recrystalization and Grain Growth Models

In this work the static recrystallization (which takes place during the interpass time between roughing passes) and three metadynamic recrystallization (more typical of ferritic steels) processes and the grain growth after recrystallization are considered. As previously mentioned, in the literature there is plenty of data on hot deformation of austenite but very few on ferrite. Therefore, the mathematical form of the equations describing the recrystallization kinetics and grain growth has been taken from the literature starting from and in particular from some works on hot deformation of IF and low-carbon steels [17,24] and the calibrated thermo-mechanical FE simulations have been used as a basis for refining the phenomenological coefficients of the metallurgical model.
The static recrystallization (SRX) has been modeled by an Avrami-like equation expressing recrystallized fraction Xrex as a function of time in isothermal conditions [25]
X r e x = 1 e x p [ 0.693 ( t t 0.5 ) n ]
where the parameter t0.5 is the time to reach 50% SRX and n a kinetic exponent. The t0.5 depends in turn on the initial grain size, temperature, strain, and strain rate as
t 0.5 = C ε p ε ˙ q d s e x p ( Q a p p R T )
where C is a constant related to the chemical composition, the exponents p, q and s express the effect of strain ε , strain rate ε ˙ and initial grain size d , R and T are the gas constant and the temperature respectively, and Qapp is the activation energy needed for the process. Such parameters were determined starting from literature data reported in [26] and are listed in Table 3.
If the steel undergoes low strain and low strain rate deformation, SRX mechanism is activated [27]. In this case, the recrystallized grain size dsrx can be expressed as
d S R X   =   c 1   +   c 2   d α c 3 ε c 4 ( ε ˙ e x p ( Q R T ) ) c 5
c1, c2, c3, c4 and c5 parameters and activation energy Q were determined starting from literature data reported in [27] and are listed in Table 4.
Concerning the grain growth after SRX, the following equation used:
d g g =   ( d α c 1 + c 2   e x p ( Q R T ) t g g ) c 3
c1, c2, c3 parameters, the activation energy Q and ferritic grain size dα were determined starting from literature data reported in [27] and are listed in Table 5.

3.3. Metadynamic Recrystalization and Grain Growth Models

According to the experimental data in literature on high chromium stainless steels, at high strain levels and high temperature the dominant mechanism is the metadynamic recrystallization (MDRX) [27]. This process is activated when the imposed strain exceeds a critical level ε C which in turn, is proportional to the peak strain according to the relationship in Equation (11).
ε C =   A   ε p
In the present case, the estimation of the peak strain has been carried out by exploiting a collection of literature data [27]. The peak deformation is a function of the Zener–Hollomon parameter as shown in Equation (2). For the MDRX the αMDRX and βMDRX are 0.025 and 0.59, respectively. The coefficient A in Equation (12), ranging between 0.7 and 0.8, has been set equal to 0.75.
The recrystallized fraction after MDRX fraction is calculated using the same Equation (7) as in the case of SRX. Instead, the ferrite grain size after MDRX is
d MDRX =   c 1 ε ˙ exp ( Q RT ) c 2
c1, c2 coefficients, properly calibrated on experimental data from the literature [27], are reported in Table 6.
The local strain, strain rate, and temperature conditions predicted by the thermo-mechanical FE calculation are used to identify whether SRX or a MDRX process is activated.

4. Results

The output of the FE thermo-mechanical simulations and the microstructural model have been coupled in order to simulate the evolution of the microstructure during roughing of the bar. In this section, a sensitivity analysis of the main factors affecting the microstructural evolution is reported and discussed.
Results are given in the form of maps of total equivalent plastic strain, equivalent Von Mises stress and temperature fields, taken on the transversal section of the hot rolled bar, as shown in Figure 8. Additionally, the chosen section must not suffer of border defect (associated for example to the finite nature of the computational domain), and stress–strain and temperature fields must be stationary.
The simulations have been carried out to evaluate the influence of reheating temperature, the effect of different initial ferrite grain sizes (PFGS) and the effect of damage on the microstructure evolution.
The effect of the reheating temperature on the ferrite grain size are summarized in Figure 9. The data are represented as maps of the ferrite grain size on the transversal section of the bar after the second roughing pass. They show the presence of bigger grains in the center of the bar compared to the sub-surface regions but, in all cases, there is no evidence of abnormal grains. It is possible to conclude that at this stage the microstructure evolution does not favor the formation of the jagged border defect.
The same data after the fifth pass are shown in Figure 10. Now the effect of the reheating temperature on the grain size is apparent. High reheating temperatures produces smaller grains in the center of the bar and a more homogeneous microstructure. Nevertheless, the relationship with the jagged border defect is still not clear because grains on the edge are smaller than those in the core with no formation of abnormal grains.
In order to take into account the effect of the grain size at prior to hot rolling, calculations with different distributions of the PFGS have been carried out The grain size maps in Figure 11 summarize the results after the second pass. The map calculated from the uniform PFGS equal to 5000 μm is substantially different from the two maps calculated using a gradient of grain sizes form center to surface. The effect is already apparent just after the beginning of the hot rolling process. In the first map of Figure 11, it can be observed that smaller grains are formed on the edges of the bar. On the contrary, in the other maps smaller grains are uniformly distributed along the whole surface.
Even greater differences can be appreciated after the fifth pass, as shown in Figure 12. Also, in this case, the starting in condition with a uniform PFGS equal to 5000 μm differs from the others. It is possible to observe that of smaller grains are formed on the edges of the bar but there are bigger grains just on the corners.
The maps showing the influence of the PFGS on damage after the fifth pass are reported in Figure 13. Damage increases going towards the edges in all cases. there is a minor presence of the damage on the center of the slabs, while its value increases on the edge. It can be noticed that the distribution of the damage parameter on the bar section is similar to the profile of the jagged border defect.
After the fifth roughing pass, even if the recrystallization interferes with the increasing of the damage, an increased density of damage is observed close to the edges. As shown in Figure 14, this effect is particularly intense for the configuration with a uniform PFGS equal to 5000 μm.
A synthesis of the previous observations after the fifth pass for the case of a uniform PFGS equal to 5000 μm is schematized in Figure 15 in comparison with a macrograph of a hot rolled bar. It is apparent that the positions of the edge defects observed in the specimen correspond to the regions that, in the calculations, exhibit the larger grain size and the higher level of damage. Figure 16 shows another view of the bar, where is possible to observe the border affected by a coarser grain.

5. Discussion

The results of FE simulations have shown the evolution of ferritic grain size during the roughing stage of hot rolling due to recrystallization as a function of different initial conditions regarding temperature and through-thickness distribution of the prior ferrite grain size. The calculated maps have highlighted that the recrystallization reduces the damage in all the examined cases and also on the bar edges. However, when a uniform initial ferrite grain size equal to 5000 μm is considered, the damage on the edges is more intense compared to the other analyzed conditions. During the hot rolling process, the ferrite grain is continuously refined and, in all cases, a homogeneous grain size is attained at the center of the bar. Instead, some differences are observed around the edges. In the surface region of the bar a localized presence of coarser grains (up to five time than the average size) is observed especially when the initial grain size is coarse. Instead, a finer grain size is predicted at the surface of the bar when the PFGS includes grains in the range 5000 to 150 μm.
The configuration with uniform PFGS = 5000 µm is representative of an anomalous grain growth, both superficial and sub-superficial. Such PFGS values in ferritic steels are usually related to high reheating temperature [28] which in industrial processing should happen following uncontrolled reheating in the furnace. It is well known [29] that the presence of such large grains opposes to the recrystallization behavior according to Equation (7) and Equation (8). This will result in the presence of a deformed fiber characterized by work-hardened grains surrounded by recrystallized grains: such topological arrangement will result in grain boundaries sliding rather than further deformation [30].
As a consequence, when the work-hardened grains are pushed in proximity of the edges, they will expel the recrystallized grains out of the bar. The material spreading due to the hot rolling condition is accentuated and the edges exhibit a jagged aspect. Moreover, the slower the recrystallization kinetics the higher the damaging of the material, thus inducing a higher probability of cracks and micro cracks formation on the bar surfaces.

6. Conclusions

An application of standard and advanced modeling techniques to the solution of industrial problems during hot rolling has been described. A special focus has been set to the use of combined experimental and numerical analysis on materials and products, in particular on hot rolling of flat bars made in 1.4512 stainless steel. The developed modeling tools have demonstrated the required accuracy to successfully predict the state of the material during the entire processing route and to help the manufacturer to improve the final product, identifying the cause that may lead to the formation of the jagged border defect on the edges of the rolled bar.
In order to investigate the formation of the defect, the material has been characterized by a mechanical point of view. Moreover, metallurgical models and material damaging theory have been implemented and coupled with FE calculation results in order to predict the microstructural evolution of the ferrite grain structure during hot deformation.
Important parameters such as strain, stress, and temperature have been considered in order to analyze the problem and to investigate their influence on the development of the steel microstructure.
Results have shown that the jagged border defect could be caused by uncontrolled or improper reheating or cooling stage of the flat bars during the process. This can induce the formation of large and elongated grains that produce a ‘squeezing’ of the grains on the edge of the flat bar, thus originating the jagged border defect. The influence of PGFS is also relevant. FE analysis has shown that when a smaller initial grain size is considered the defect is not produced and the bar is characterized by smaller grains near the surface coarser grains at the core.
On the contrary, a uniform and coarse prior ferrite grain size of 5000 μm is more prone to develop the defect in conditions of uncontrolled reheating. The abnormally coarse grains result from work-hardening and recovery rather than recrystallization, their behavior being substantially different from that of the surrounding recrystallized matrix. In these conditions, when the strain hardened grains are in proximity of the skin, they can squeeze out the recrystallized grains, thus generating the defect on the bar edges.

Author Contributions

Conceptualization, S.M. and L.L.; methodology, S.M. and L.L.; software, S.M. and L.L.; validation, S.M. and L.L.; formal analysis, S.M. and L.L.; investigation, S.M. and L.L.; resources, S.M. and L.L.; data curation, S.M. and L.L.; writing—original draft preparation, S.M.; writing—review and editing, S.M., A.D.S., L.L., P.E.D.N. and C.Z.; visualization, A.D.S., L.L., P.E.D.N. and C.Z.; supervision, A.D.S. All authors have read and agreed to the published version of the manuscript.

Funding

This research received no external funding.

Conflicts of Interest

The authors declare no conflict of interest.

References

  1. Marshall, P. Austenitic Stainless Steels: Microstructure and Mechanical Properties; Springer: Berlin, Germany, 1984. [Google Scholar]
  2. Rufini, R.; Di Pietro, O.; Di Schino, A. Predictive Simulation of Plastic Processing of Welded Stainless Steel Pipes. Metals 2018, 8, 519. [Google Scholar] [CrossRef] [Green Version]
  3. Corradi, M.; Di Schino, A.; Borri, A.; Rufini, R. A review of the use of stainless steel for masonry repair and reinforcement. Constr. Build. Mater. 2018, 181, 335–346. [Google Scholar] [CrossRef]
  4. Di Schino, A.; Kenny, J.M.; Abbruzzese, G. Analysis pf the recrystallization and grain growth processes in AISI 316 stainless steel. J. Mat. Sci. 2002, 37, 5291–5298. [Google Scholar] [CrossRef]
  5. Di Schino, A.; Porcu, G.; Longobardo, M.; Turconi, G.L.; Scoppio, L. Metallurgical design and development of C125 grade for mild sour service application. In Proceedings of the NACE—International Corrosion Conference Series, San Diego, CA, USA, 12–16 March 2006; pp. 061251–0612514. [Google Scholar]
  6. Di Schino, A. Analysis of heat treatment effect on microstructural features evolution in a micro-alloyed martensitic steel. Acta Metall. Slovaca 2016, 22, 266–270. [Google Scholar] [CrossRef] [Green Version]
  7. Di Schino, A.; Valentini, L.; Kenny, J.M.; Gerbig, Y.; Ahmed, I.; Hefke, H. Wear resistance of high-nitrogen austenitic stainless steel coated with nitrogenated amorphous carbon films. Surf. Coat. Technol. 2002, 161, 224–231. [Google Scholar] [CrossRef]
  8. Bregliozzi, G.; Ahmed, S.I.-U.; Di Schino, A.; Kenny, J.M.; Haefke, H. Friction and Wear Behavior of Austenitic Stainless Steel: Influence of Atmospheric Humidity, Load Range, and Grain Size. Tribol. Lett. 2004, 17, 697–704. [Google Scholar] [CrossRef]
  9. Zitelli, C.; Folgarait, P.; Di Schino, A. Laser powder bed fusion of stainless-steel grades: A review. Metals 2019, 9, 731. [Google Scholar] [CrossRef] [Green Version]
  10. Jhonas, J. Effect of Quench and Interpass Time on Dynamic and Static Softening during Hot Rolling. Steel Res. Int. 2005, 76, 392–398. [Google Scholar] [CrossRef]
  11. Hapmhreys, F.J.; Hatherly, M. Recrystallization and Related Annealing Phenomena; Elsevier: Amsterdam, The Netherlands, 2004. [Google Scholar]
  12. Sung, K.; Yeon-Chul, Y. Dynamic recrystallization behavior of AISI 304 stainless steel. Adv. Mater. Sci. Eng. 2001, 311, 108–113. [Google Scholar]
  13. Dehghan-Manshadi, A.; Barnett, M.R.; Hodgson, P.D. Hot deformation and recrystallization of austenitic stainless steel. Part I: Dynamic recrystallization. Metall. Mater. Trans. A 2008, 39, 1359–1370. [Google Scholar] [CrossRef] [Green Version]
  14. Stanley, J.K.; Perrotta, J. Grain Growth in Austenitic Stainless Steels. Metallography 1969, 11, 349–362. [Google Scholar] [CrossRef]
  15. Marchattiwar, A.; Sarkar, A.; Chakravartty, J.K.; Kashyap, B.P. Dynamic Recrystallization during Hot Deformation of 304 Austenitic Stainless Steel. J. Mater. Eng. Perform. 2013, 22, 2168–2175. [Google Scholar] [CrossRef]
  16. Duggan, B.J.; Tse, Y.Y.; Lam, G.; Quadir, M.Z. Deformation and Recrystallization of Interstitial Free (IF) Steel. Mater. Manuf. Processes 2011, 26, 51–57. [Google Scholar] [CrossRef]
  17. Barnett, M.R.; Jonas, J.J. Influence of ferrite rolling temperature on microstructure and texture in deformed low C and IF steels. ISIJ Int. 1997, 37, 697–705. [Google Scholar] [CrossRef]
  18. Shin, D.H.; Byung, C.K.; Yong-Seog, K.; Kyung-Tae, P. Microstructural evolution in a commercial low carbon steel by equal channel angular pressing. Acta Mater. 2000, 48, 2247–2255. [Google Scholar] [CrossRef]
  19. Spittel, M.; Spittel, T. Flow stress of steel. Metal forming data of ferrous alloys-deformation behavior-advanced materials and technologies (numerical data and functional relationships in science and technology). Group VIII Advanced Materials and Technologies. In Landolt-börnstein; Springer: Berlin, Germany, 2009; Volume 2C1. [Google Scholar]
  20. Ghiotti, A.; Fanini, S.; Bruschi, S.; Bariani, P. Modeling of the Mannesman effect. CIRP Ann. Manuf. Technol. 2009, 58, 255–258. [Google Scholar] [CrossRef]
  21. Ling, Y. Uniaxial true stress-strain after necking. AMP J. Technol. 1996, 5, 37–48. [Google Scholar]
  22. Choung, J.M.; Cho, S.R. Study on true stress correction from tensile tests. J. Mech. Sci. Technol. 2008, 22, 1039–1051. [Google Scholar] [CrossRef]
  23. Cortese, L.; Coppola, T.; Caserta, L. Calibration of material damage models using a multi-test inverse approach. In Proceedings of the XII International Symposium on Plasticity and Its Current Applications, Halifax, NS, Canada, 17–22 July 2006; Neat Press: Fulton, ML, USA, 2006; pp. 607–609. [Google Scholar]
  24. Barnett, M.R.; Jonas, J.J. Influence of ferrite rolling on grain size and texture in annealed low C ad IF steels. ISIJ Int. 1997, 37, 706–714. [Google Scholar] [CrossRef]
  25. Mehtonen, S.; Karjalainen, L.P.; Porter, D. Hot deformation behavior and microstructure evolution of a stabilized high-Cr ferritic stainless steel. Mater. Sci. 2013, 571, 1–12. [Google Scholar] [CrossRef]
  26. Mirzadeh, H.; Najafizadeh, A. Hot deformation and dynamic recrystallization of 17-4 PH stainless steel. ISIJ Int. 2013, 53, 680–689. [Google Scholar] [CrossRef] [Green Version]
  27. Oliveira, T.R.; Montheillet, F. Effect of Niobium and Titanium on the Dynamic Recrystallization during Hot Deformation of Stabilized Ferritic Stainless Steels. Mater. Sci. Forum 2004, 467–470, 1229–1236. [Google Scholar] [CrossRef]
  28. Sellars, C.M.; Whiteman, J.A. Recrystallization and grain growth in hot rolling. Met. Sci. 1979, 13, 187–194. [Google Scholar] [CrossRef]
  29. Raabe, D.; Lücke, K. The Role of Textures in Ferritic Stainless Steels. International Symposium on Strip Casting, Hot and Cold Working of Stainless Steels. Quebec 1993, 221. [Google Scholar]
  30. Jensen, D.J. Growth rates and misorientation relationships between growing nuclei/grains and the surrounding deformed matrix during recrystallization. Acta Metall. Mater. 1995, 43, 4117–4129. [Google Scholar] [CrossRef]
Figure 1. Specimens of flat bar in steel grade 1.4512 affected by jagged borders.
Metals 10 00186 g001
Figure 2. SEM images of the surface of a jagged bar.
Metals 10 00186 g002
Figure 3. Optical micrograph showing a detail of the bar edge with the macroscopic defect. The elongated and work hardened grains at mid thickness appear to be extruded from the microstructure during hot working (2% Nital Etching).
Metals 10 00186 g003
Figure 4. Mathematical function used to represent the through thickness variation of the ferrite grain size prior to hot rolling based on the as-cast microstructure.
Metals 10 00186 g004
Figure 5. Typical macrostructure of an as-cast billet of ferritic stainless steel.
Metals 10 00186 g005
Figure 6. Comparison between numerical and experimental data of tensile tests simulation after the optimization procedure of rheological and damage coefficients. Comparisons have been reported for tensile tests carried out at: (a) T = 1200 °C ε ˙   = 5 s−1; (b) T = 1050 °C ε ˙   = 5 s−1; (c) T = 900 °C ε ˙   = 1 s−1.
Metals 10 00186 g006
Figure 7. FE Thermomechanical 3D model of the hot rolling of flat bar compared to temperature experimental measures.
Metals 10 00186 g007
Figure 8. Selection of transversal section of the bar.
Metals 10 00186 g008
Figure 9. Effect of the reheating temperature on the ferrite grain size after the second roughing pass.
Metals 10 00186 g009
Figure 10. Effect of the reheating temperature on the ferrite grain size after the fifth roughing pass.
Metals 10 00186 g010
Figure 11. Effect of different PFGS on the ferrite grain size after the second roughing pass.
Metals 10 00186 g011
Figure 12. Effect of different PFGS on the ferrite grain size after the fifth roughing pass.
Metals 10 00186 g012
Figure 13. Effect of PFGS on damage after the fifth roughing pass.
Metals 10 00186 g013
Figure 14. Effect of PFGS on damage after the fifth roughing pass.
Metals 10 00186 g014
Figure 15. Comparison between macrography of the bar and the grain growth resulting from the maps of ferrite grain size and damage.
Metals 10 00186 g015
Figure 16. Comparison between macrography of the bar and the grain growth resulting from the maps of ferrite grain size and damage.
Metals 10 00186 g016
Table 1. Coefficients of first attempt and final value of the same coefficients for the rheological model of the EN 1.4512 steel in Equation (1).
CoefficientFirst Attempt Value [19]
Chapter 109
Final Value
A4422.714650
m1−0.0029−0.0032
m20.481510.3
m80.0002020.00017
ε 0 0.00.001
ε ˙ 0 0.00.01
Table 2. Coefficients of the damage model in Equation (4).
CoefficientValue
s01.1
s10.1
s20.5
Table 3. Coefficients for SRX process from [26].
CoefficientValue
N1.5
C (s)1.69 × 10⁻¹⁰
P−1.7
d0157
Q0
S1.5
Q (kJ/mol)143
Table 4. Coefficient used in Equation (9) for predicting the ferrite grain size after SRX [27].
CoefficientValue
c1 (s)28.26
c2 (s)18.24
c30
c4−0.6
c5−0.05
Q (kJ/mol)267
Table 5. Coefficient used in Equation (10) for grain growth during static recrystallization [27].
CoefficientValue
c17
c23 × 1023
c37
Q (kJ/mol)−356
dα3.6
Table 6. Coefficient for grain evolution during MDRX [27].
CoefficientValue
c118277
c2−0.246
Q (kJ/mol)267
d0157

