Fatigue Property and Improvement of a Rounded Welding Region between the Diaphragm Plate and Closed Rib of an Orthotropic Steel Bridge Deck


Abstract
:1. Introduction
2. Experiment
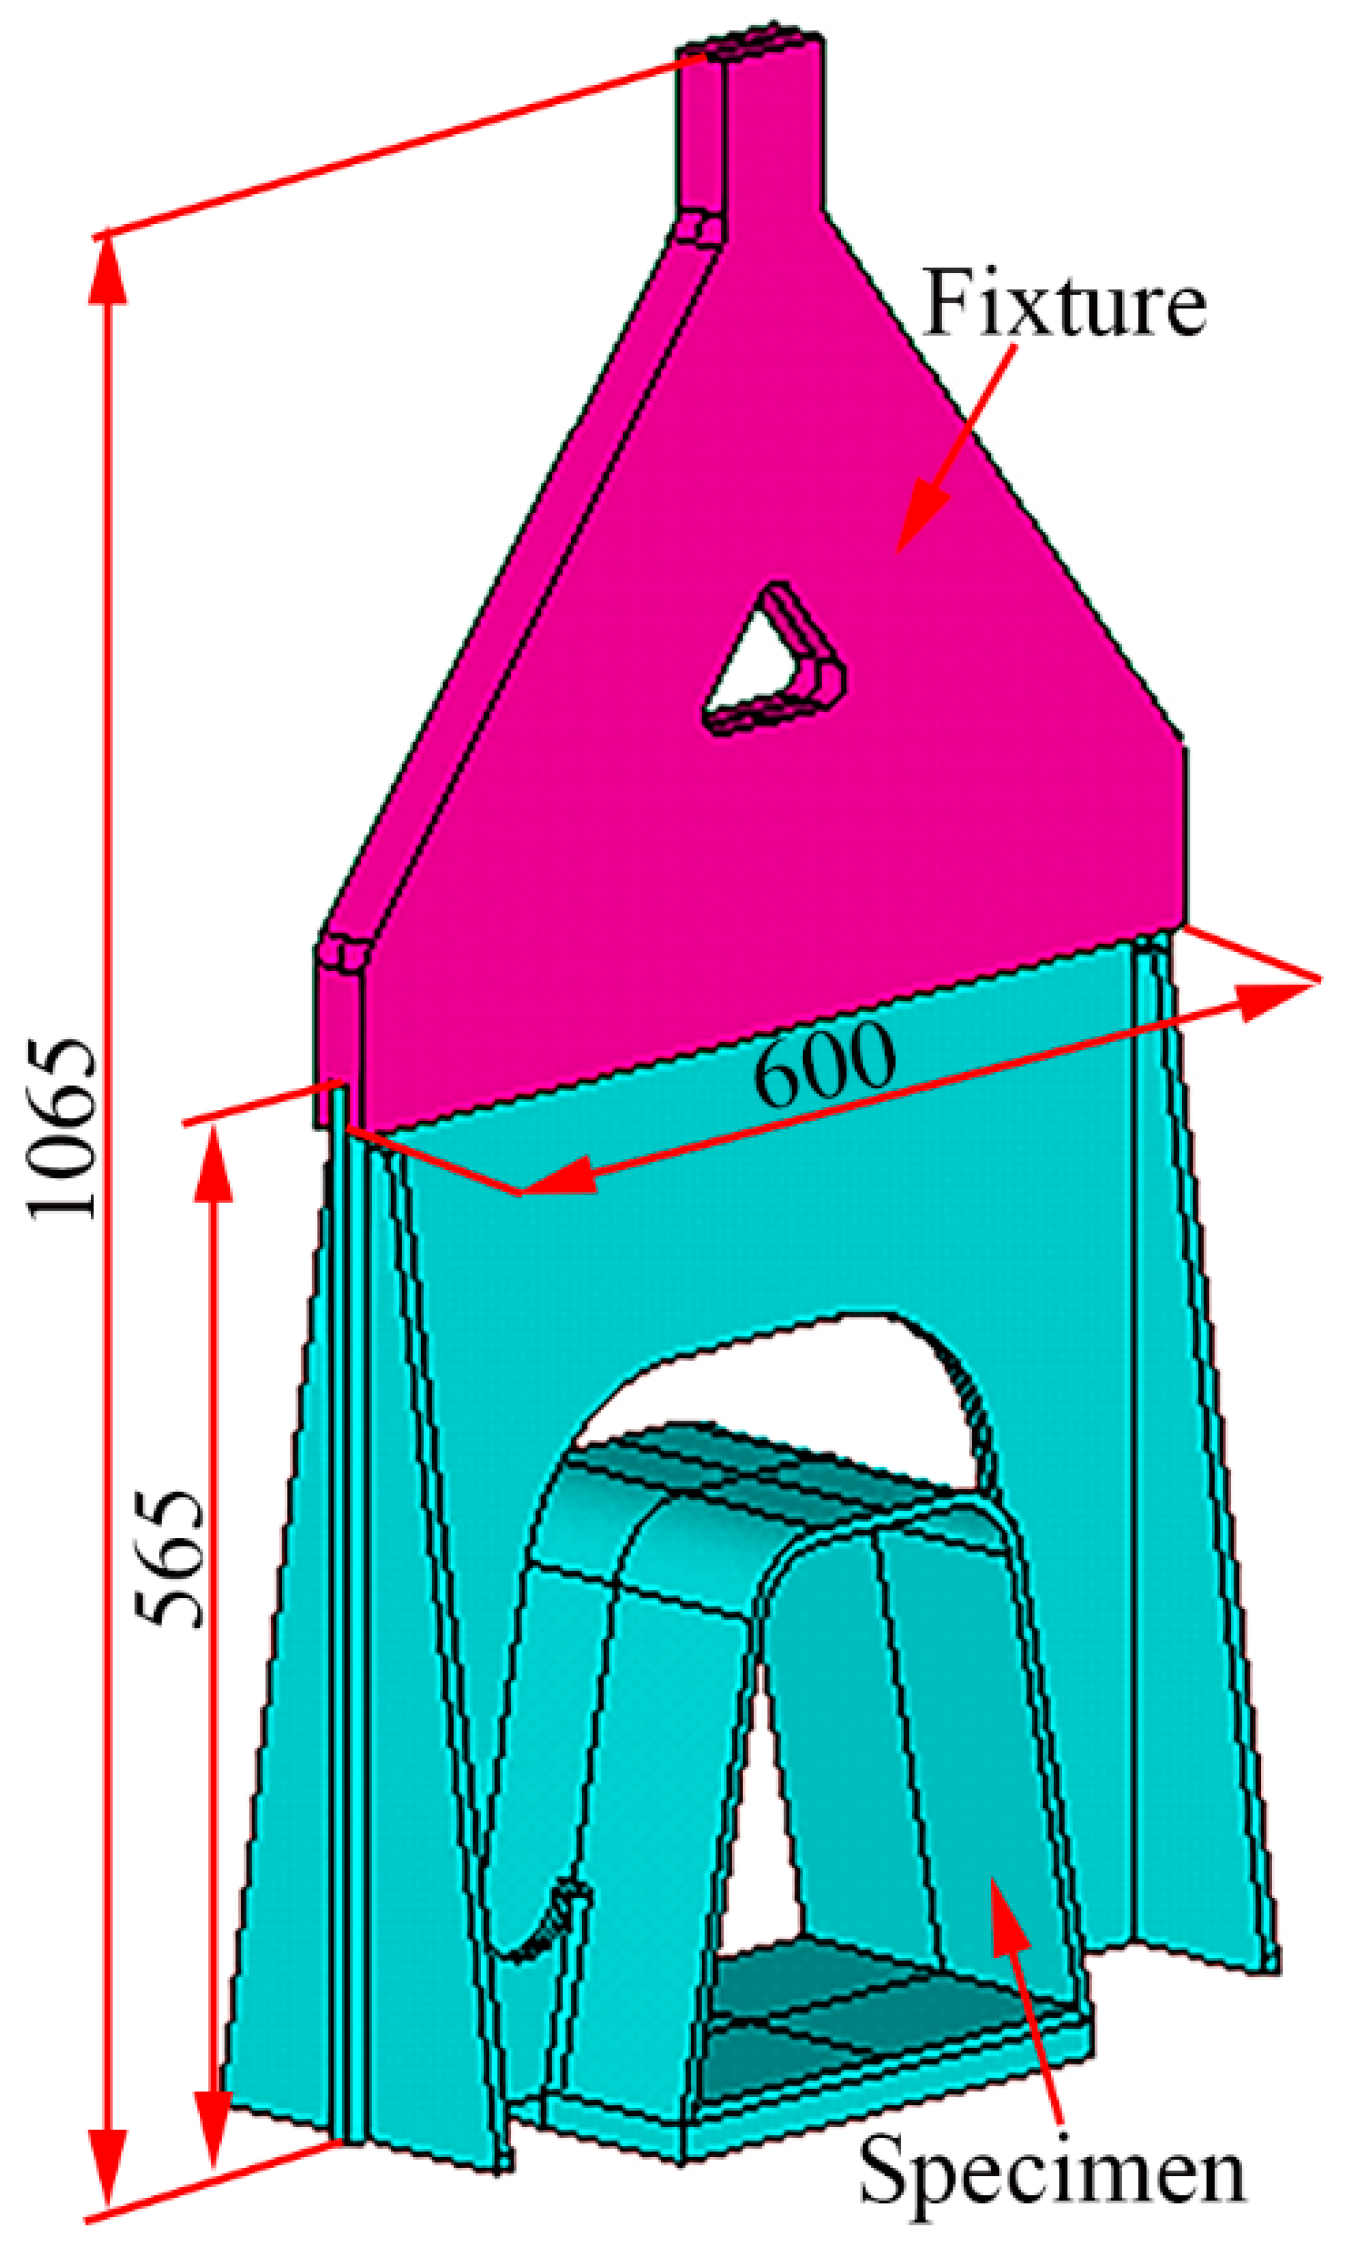
2.1. Design of Fatigue Specimen
2.2. Fatigue Specimen
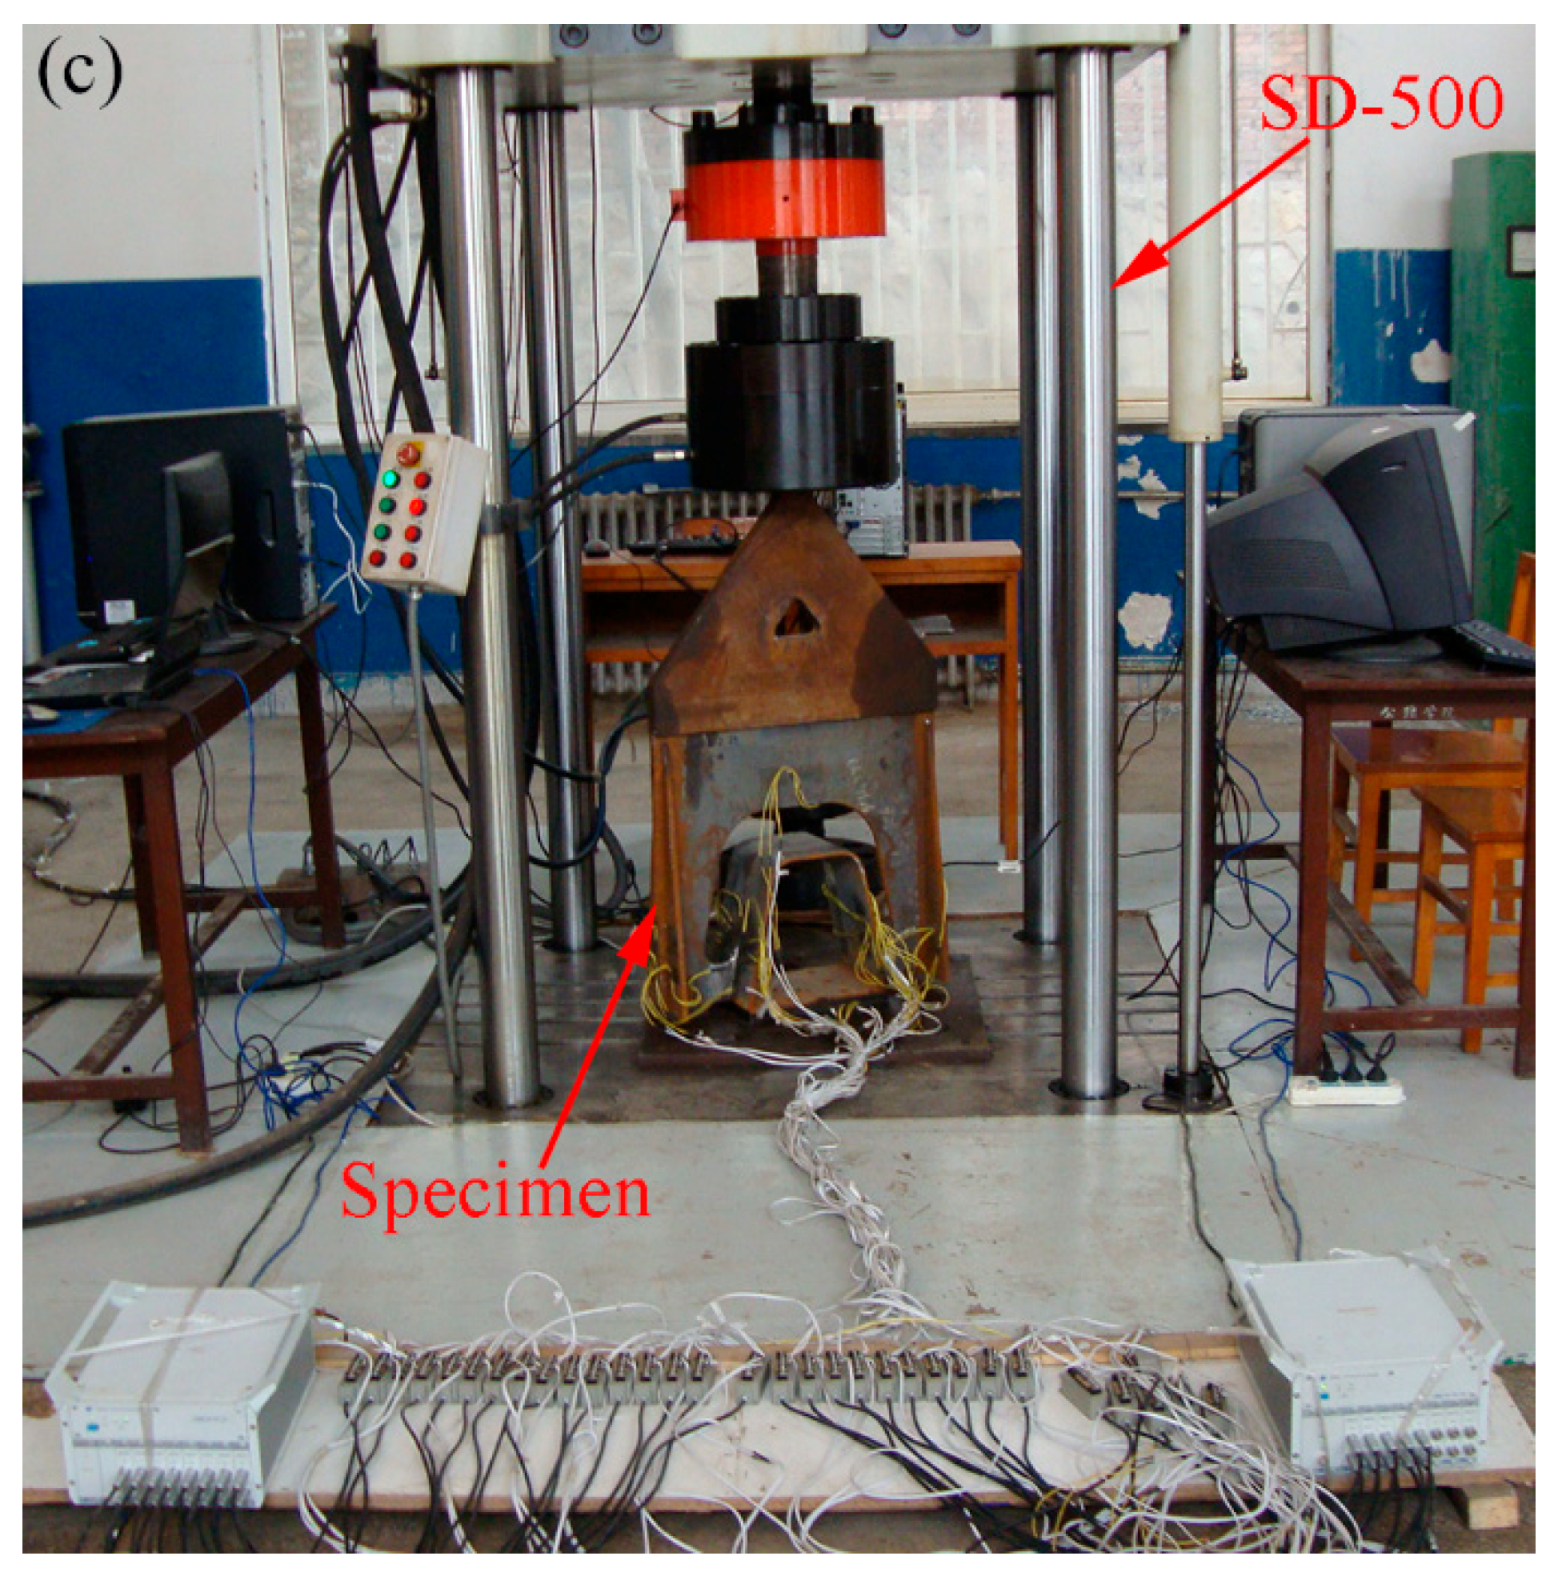
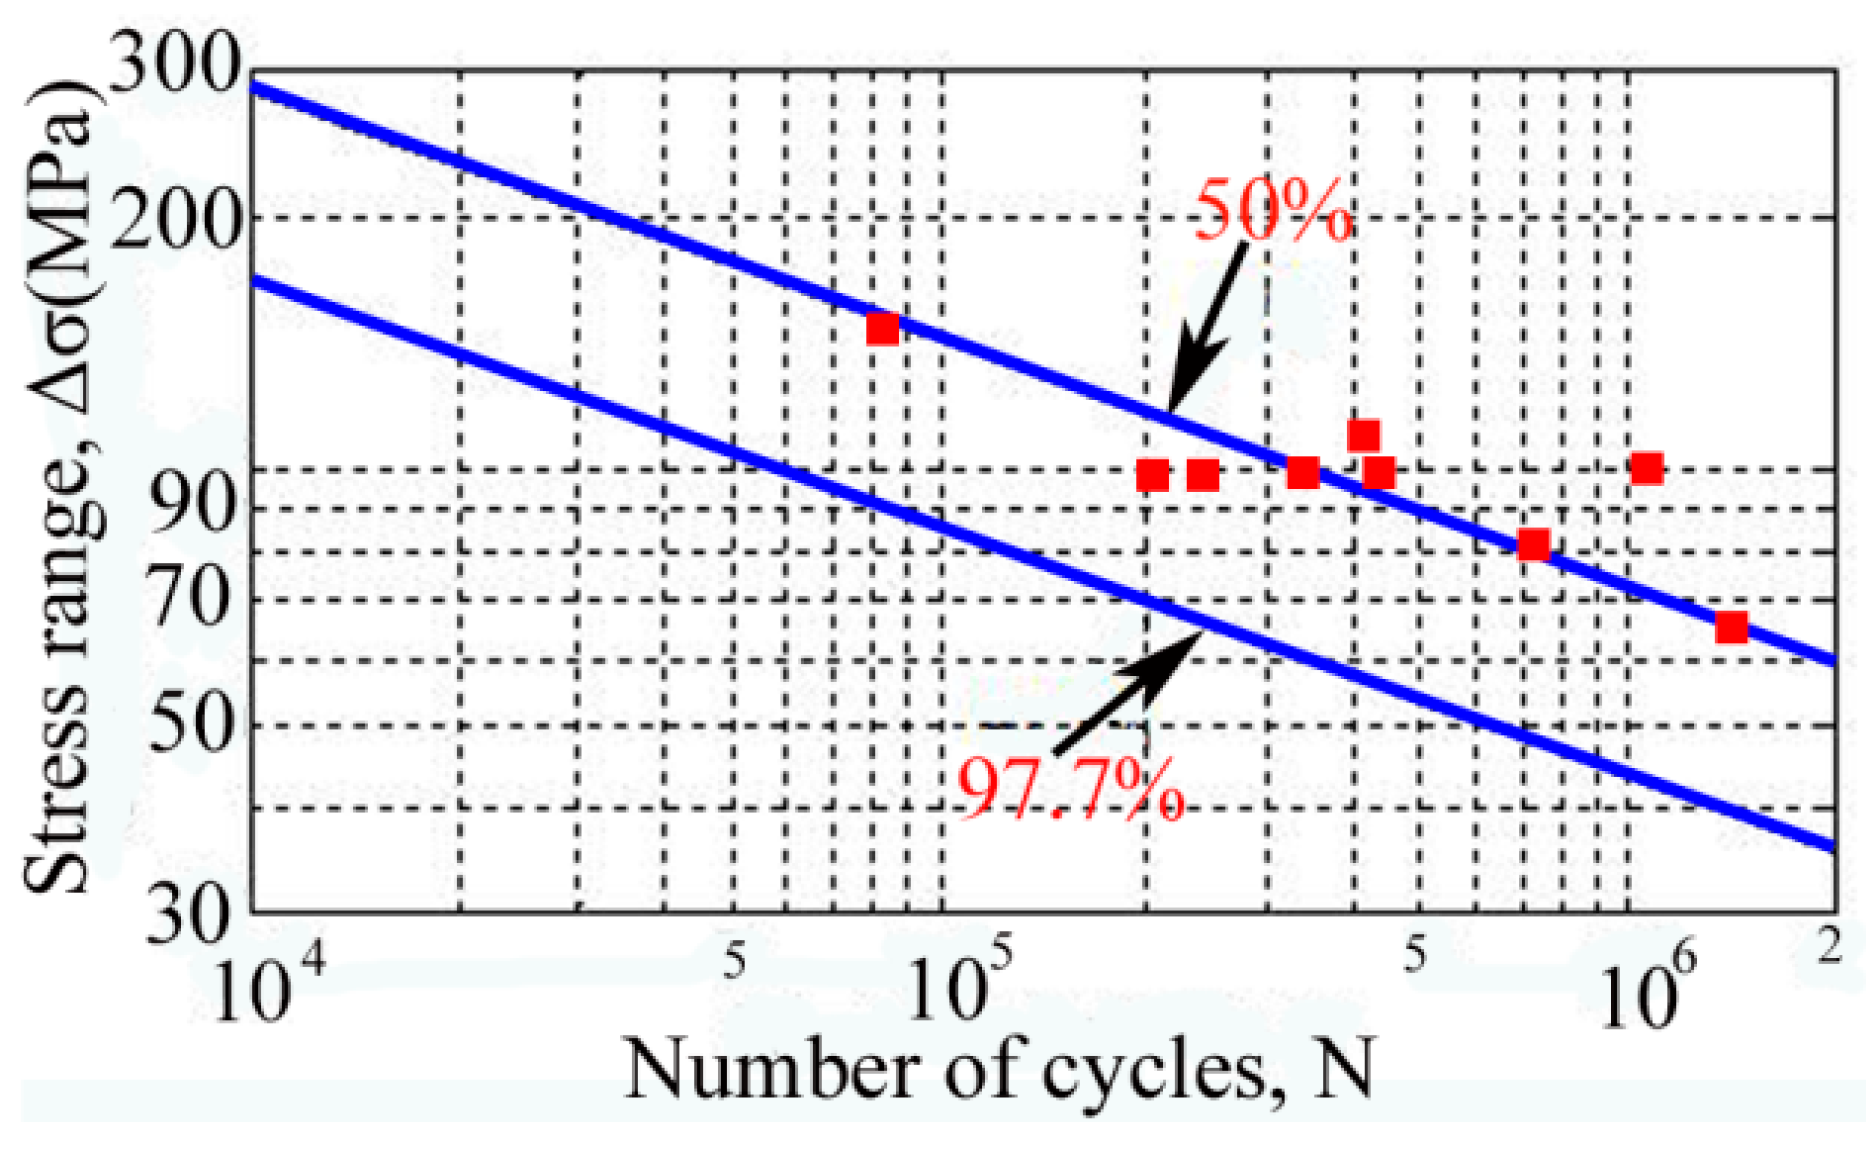
2.3. Fatigue Tests and Results
3. Discussion
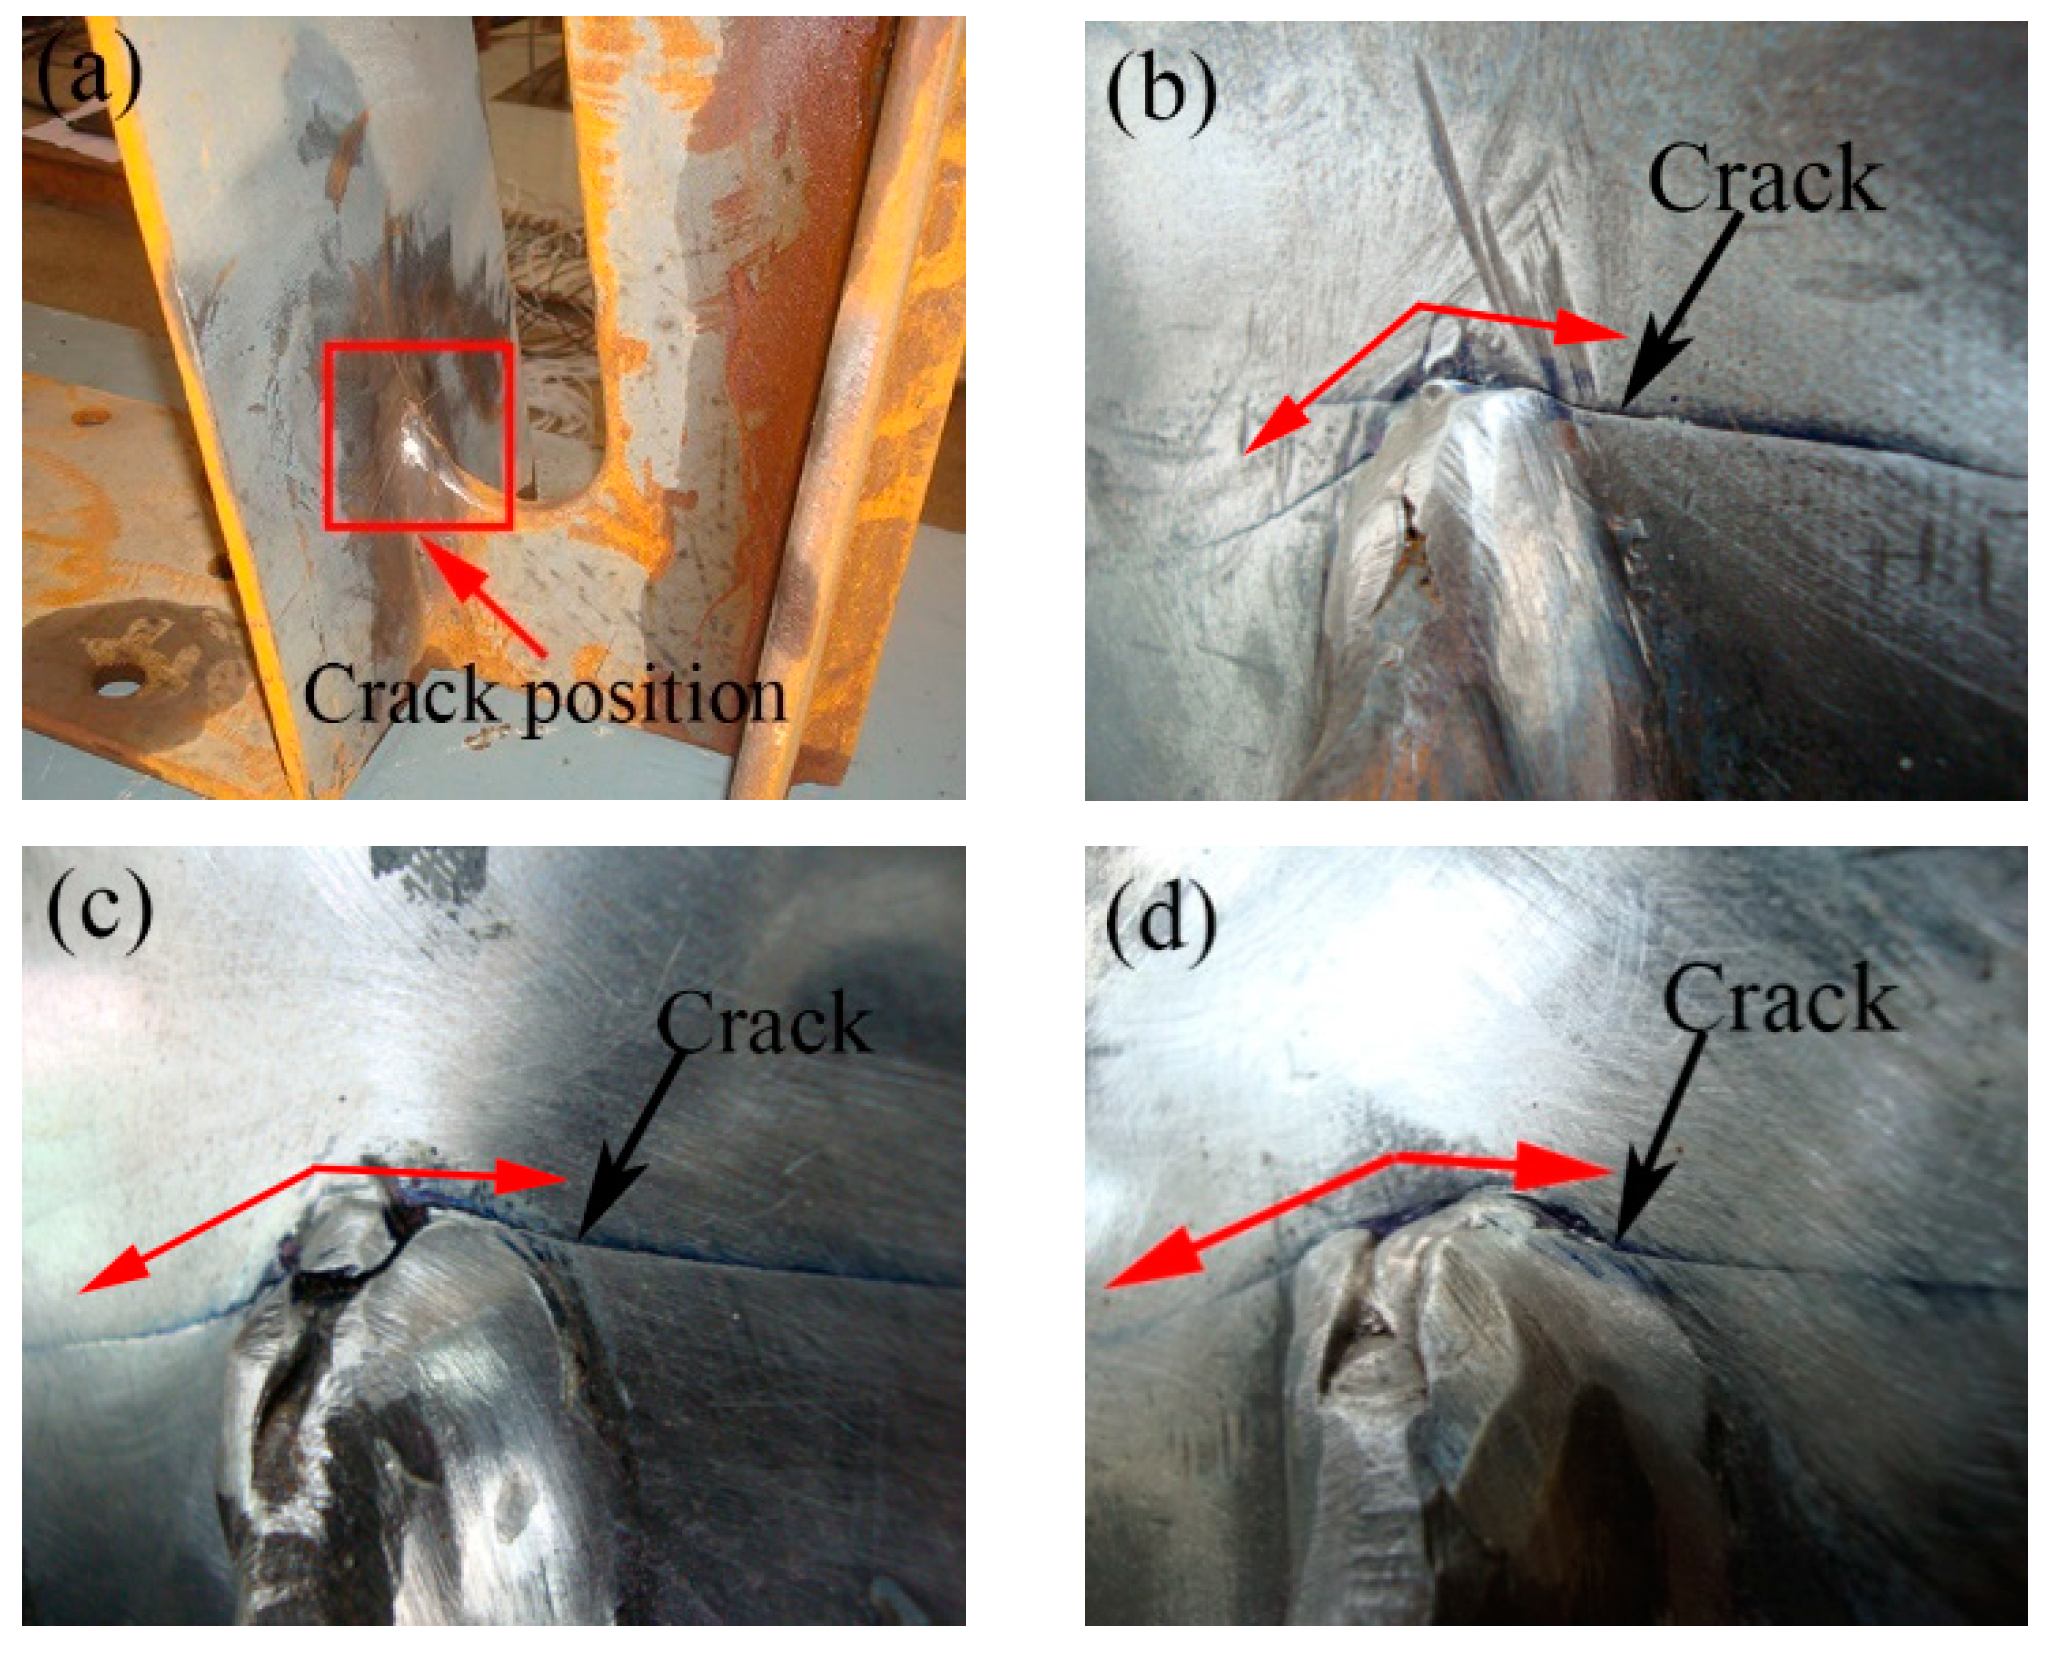
3.1. Fatigue Crack
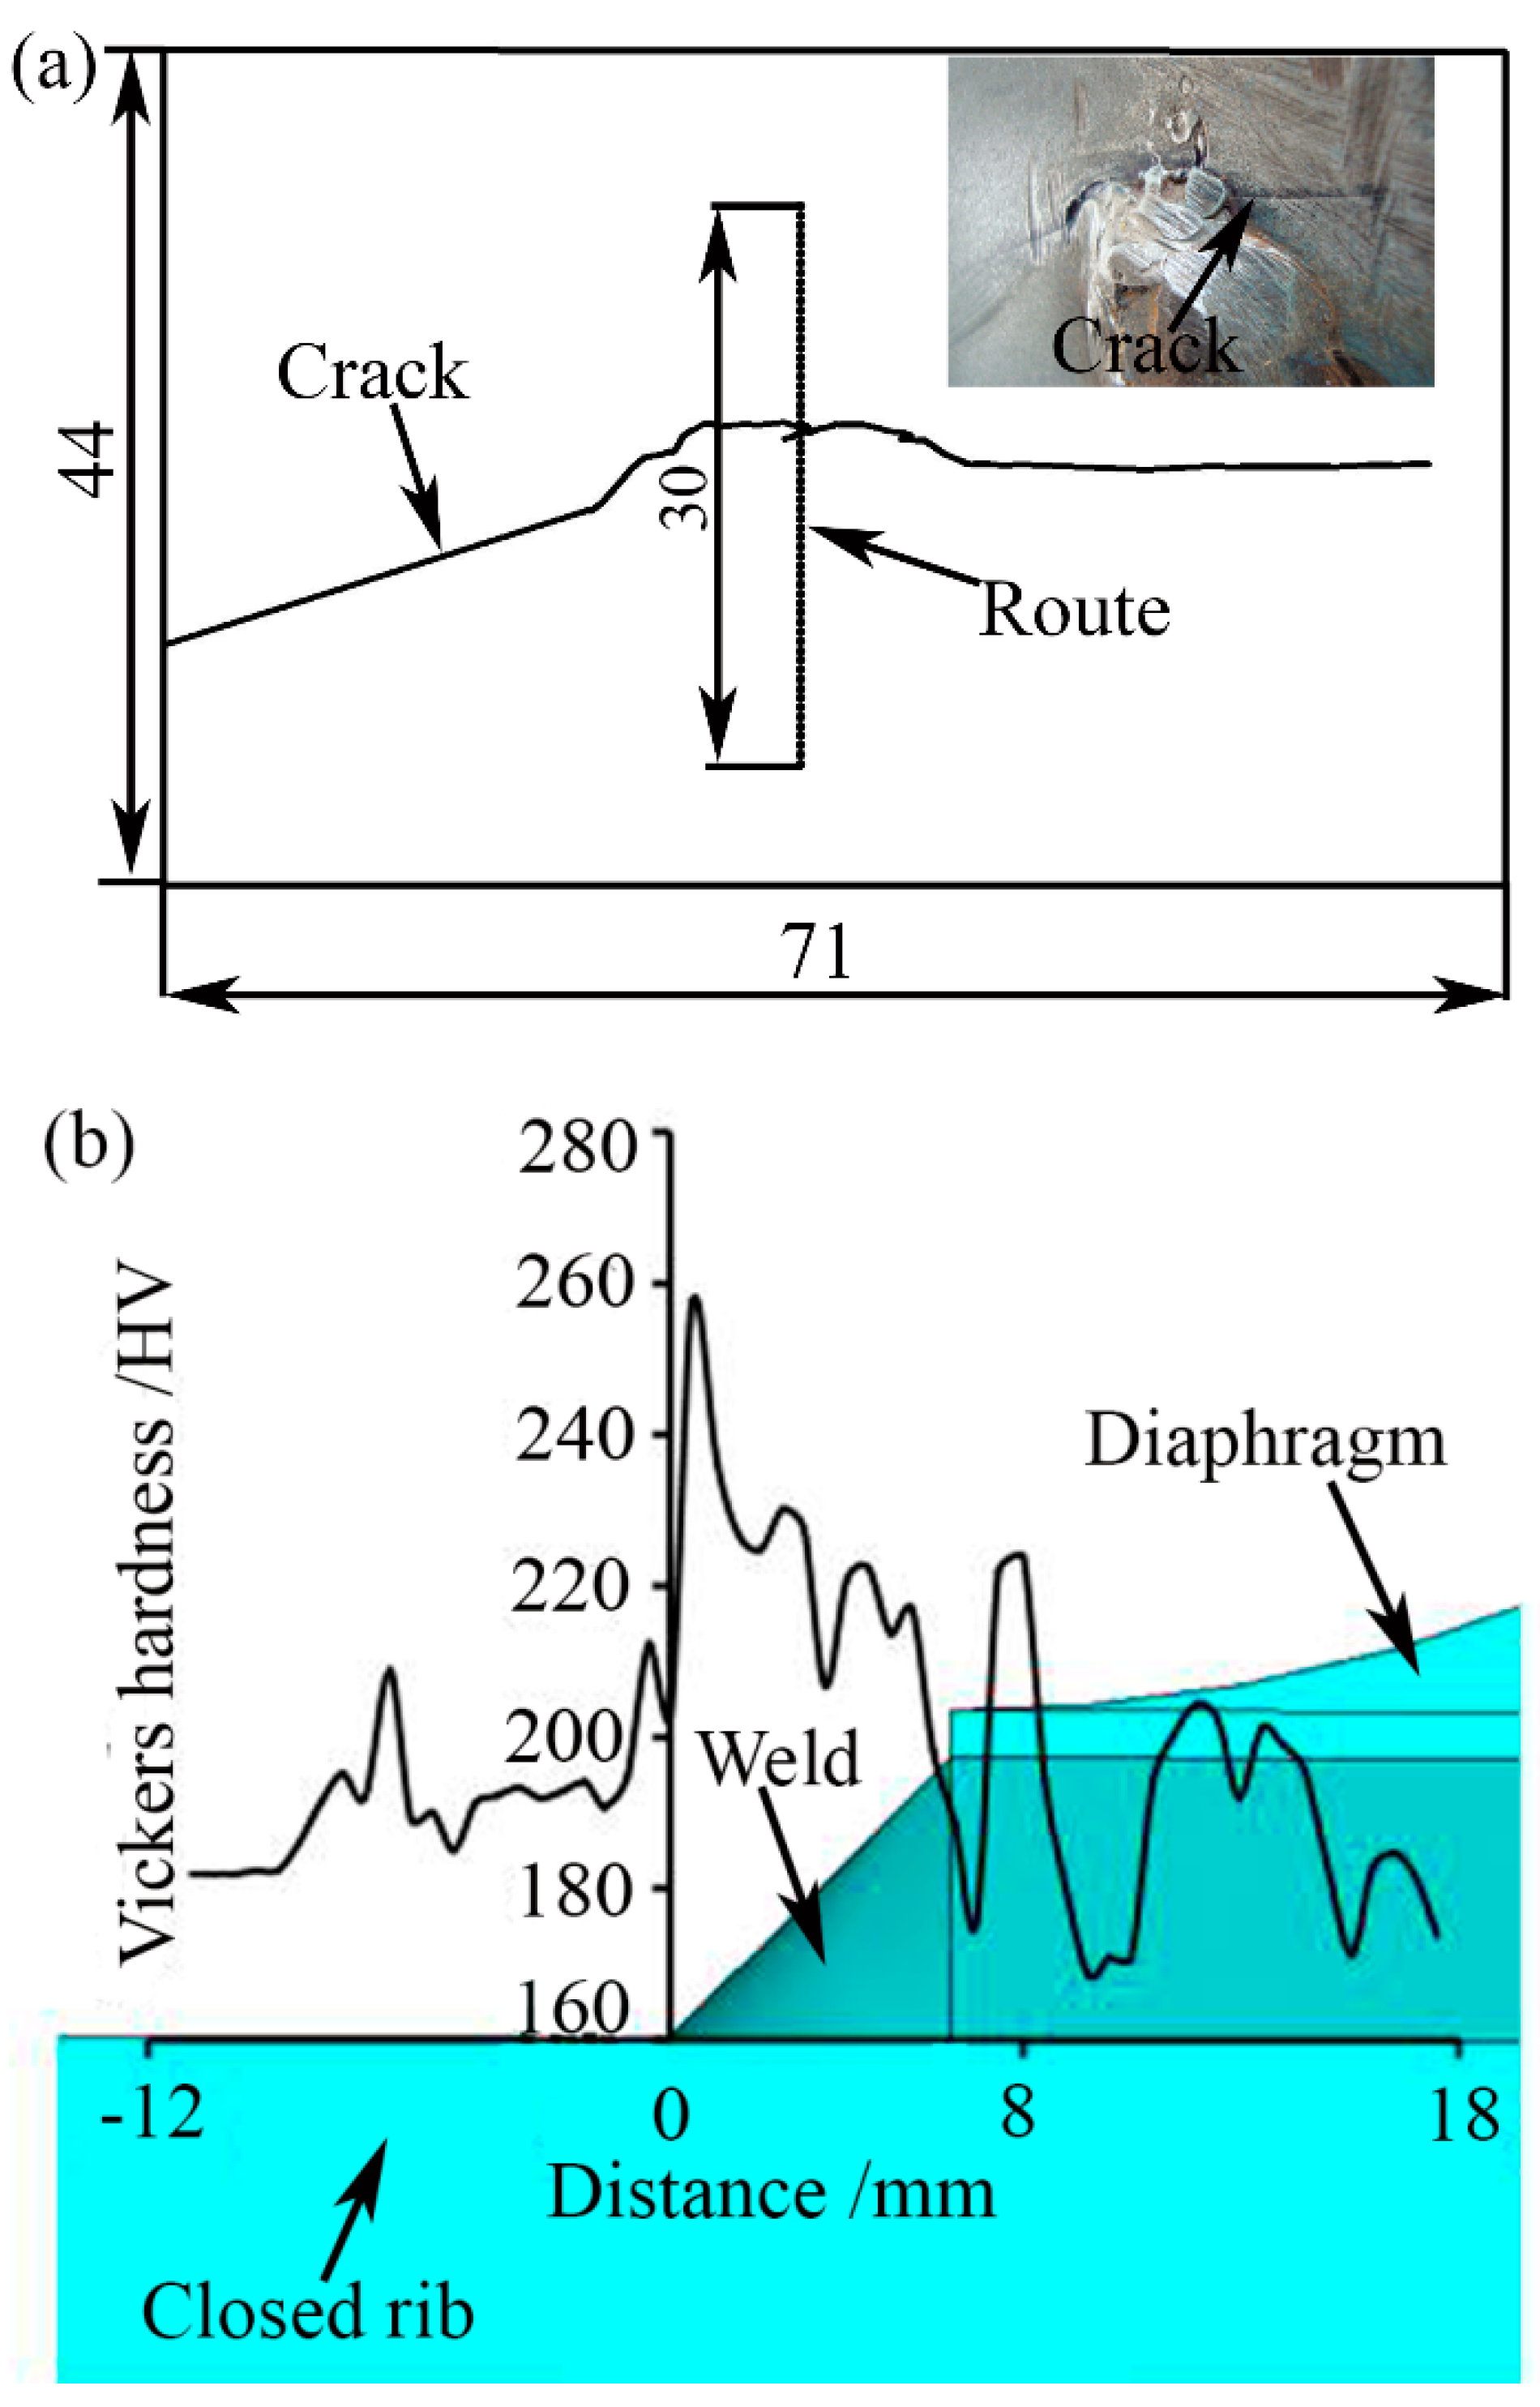
3.2. Hardness Measurements around the Crack
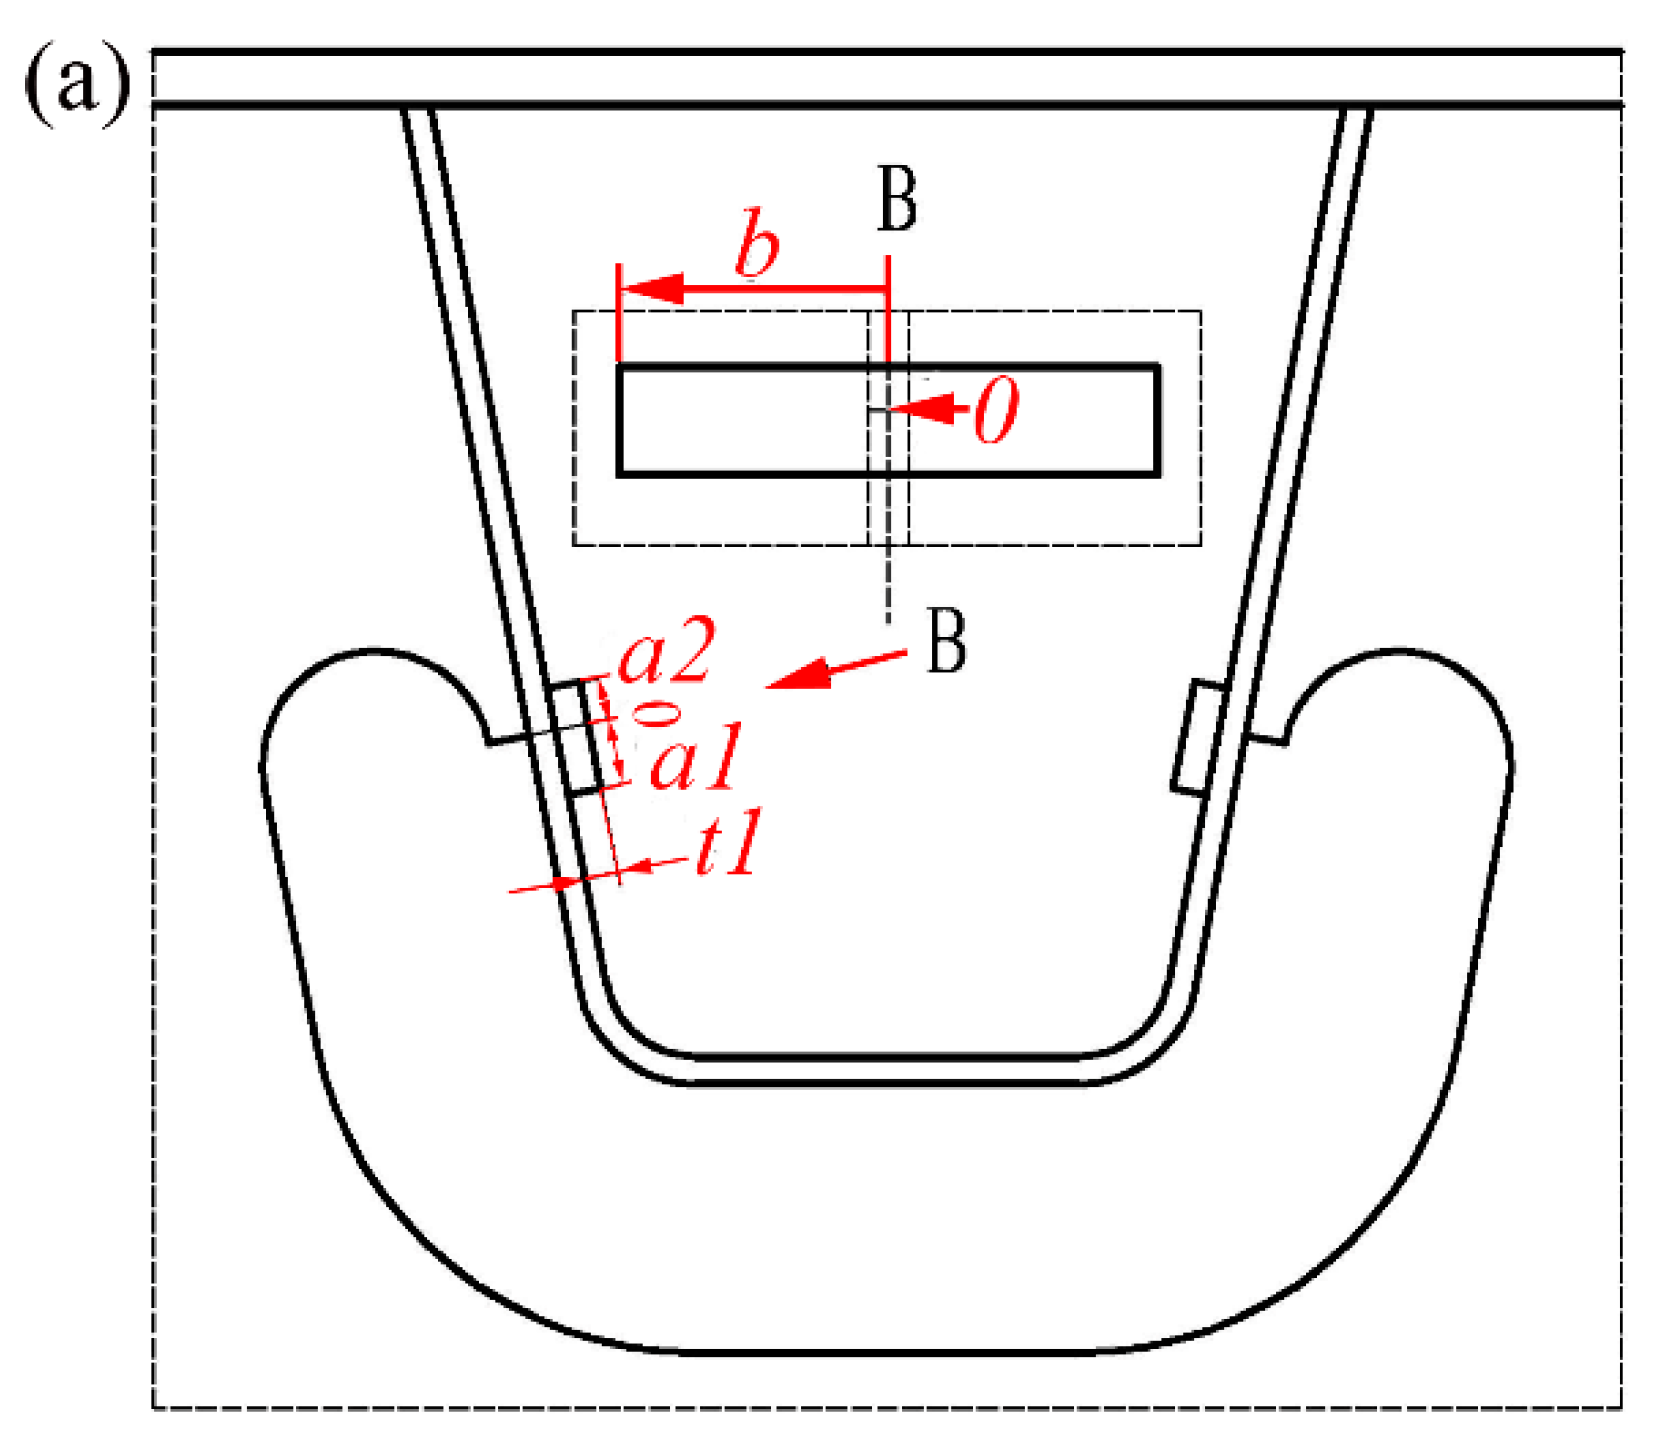
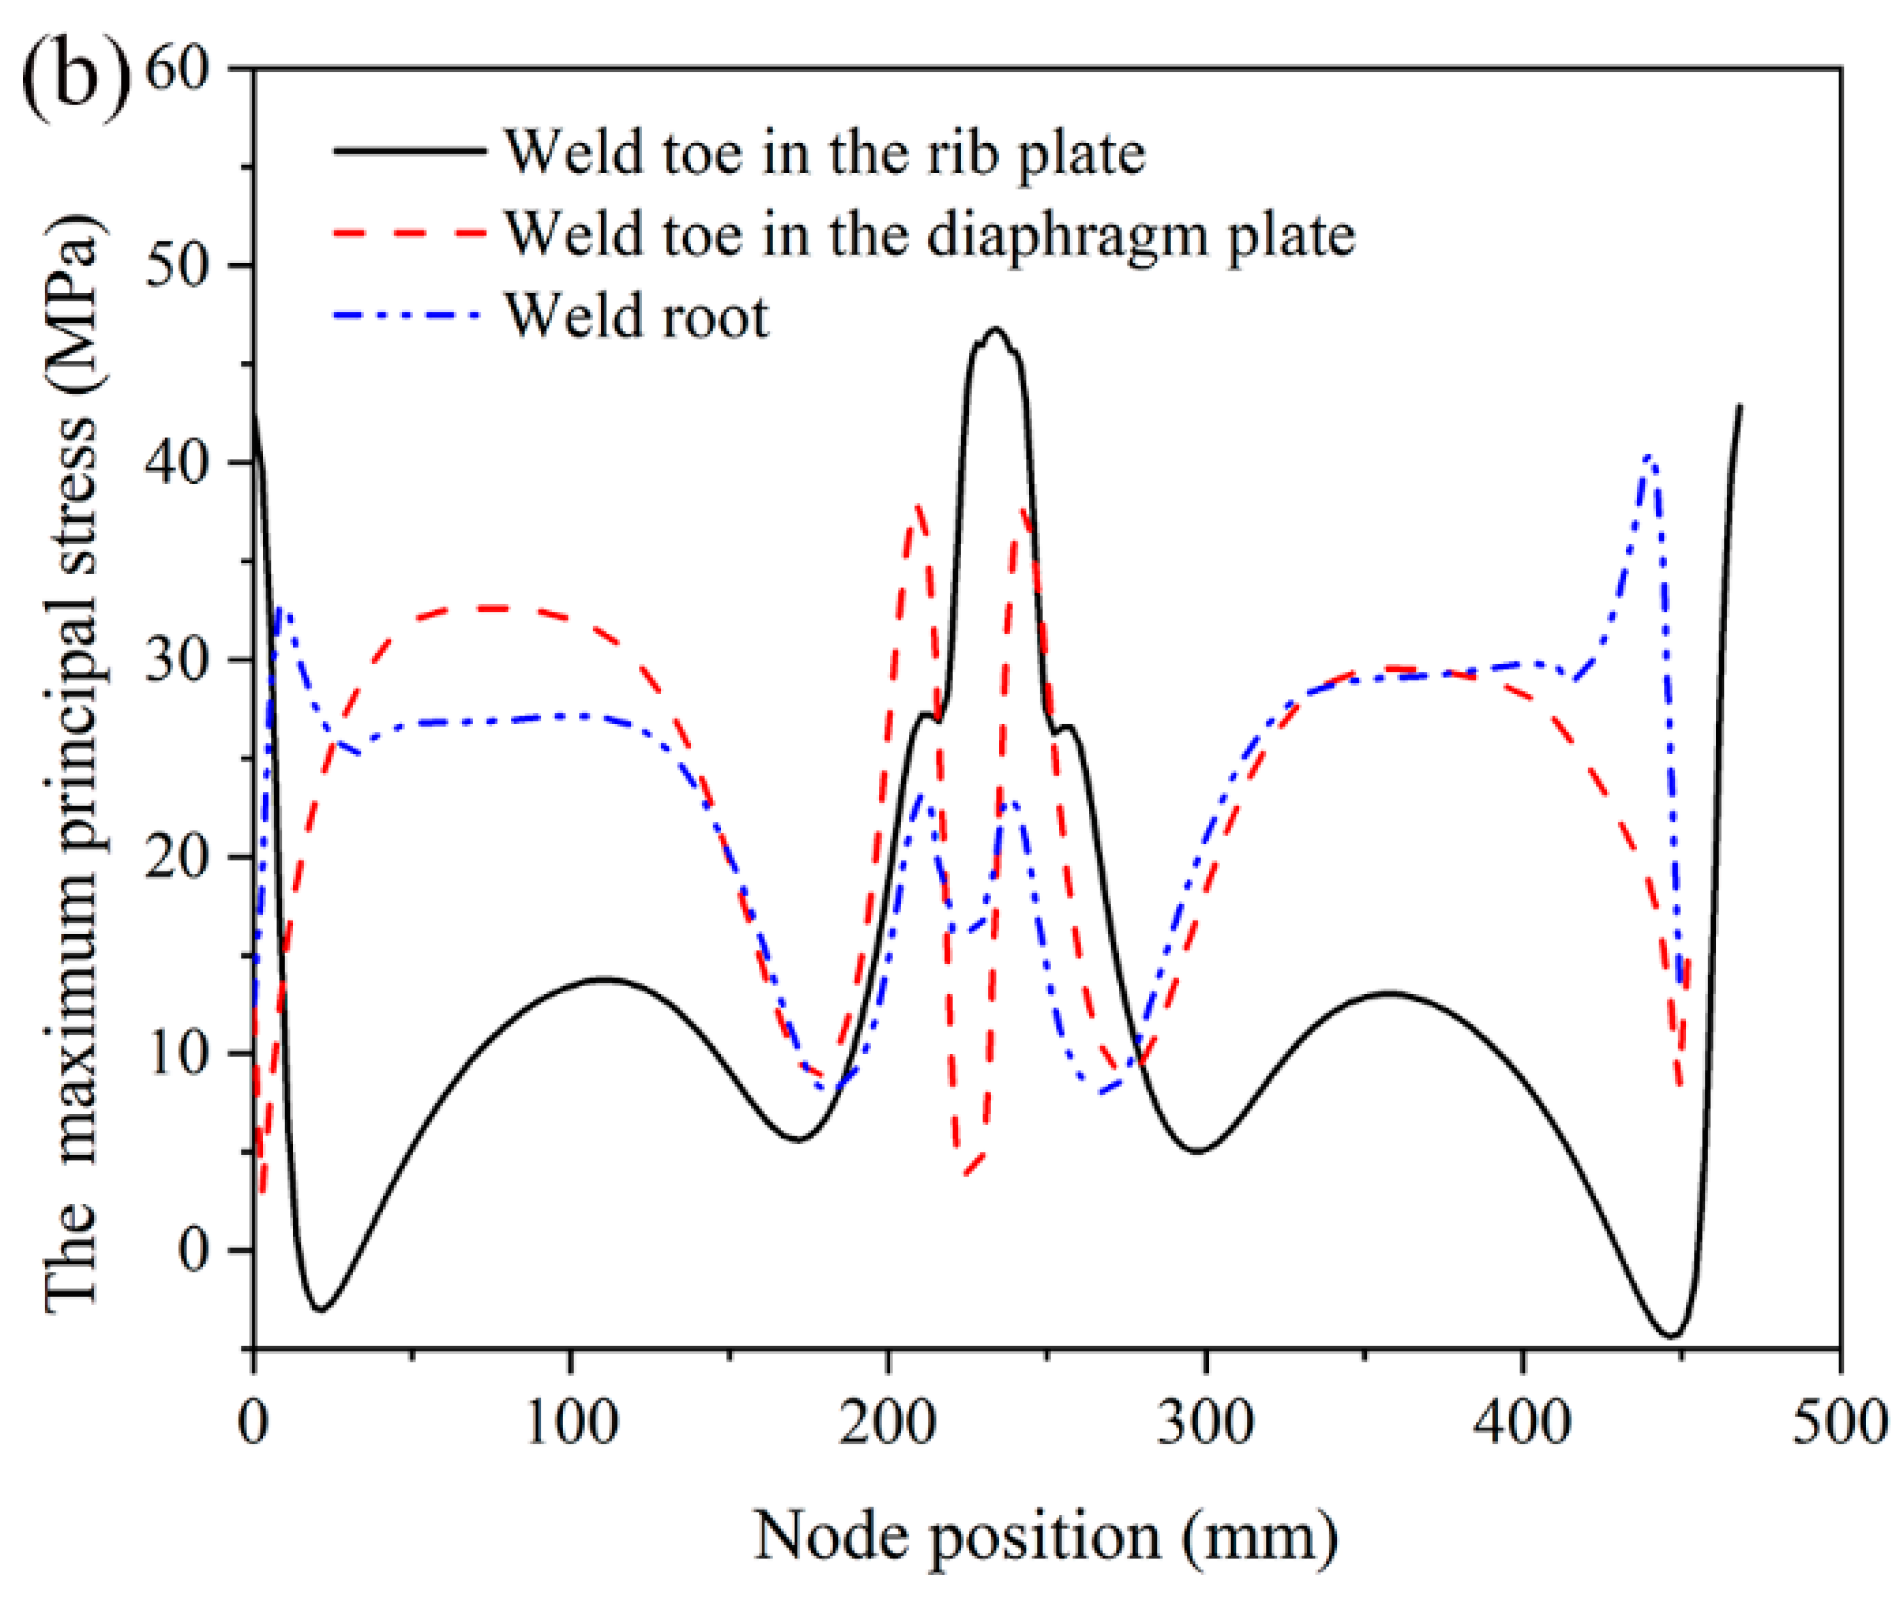
3.3. Improvement of the Local Structure: Scheme 1
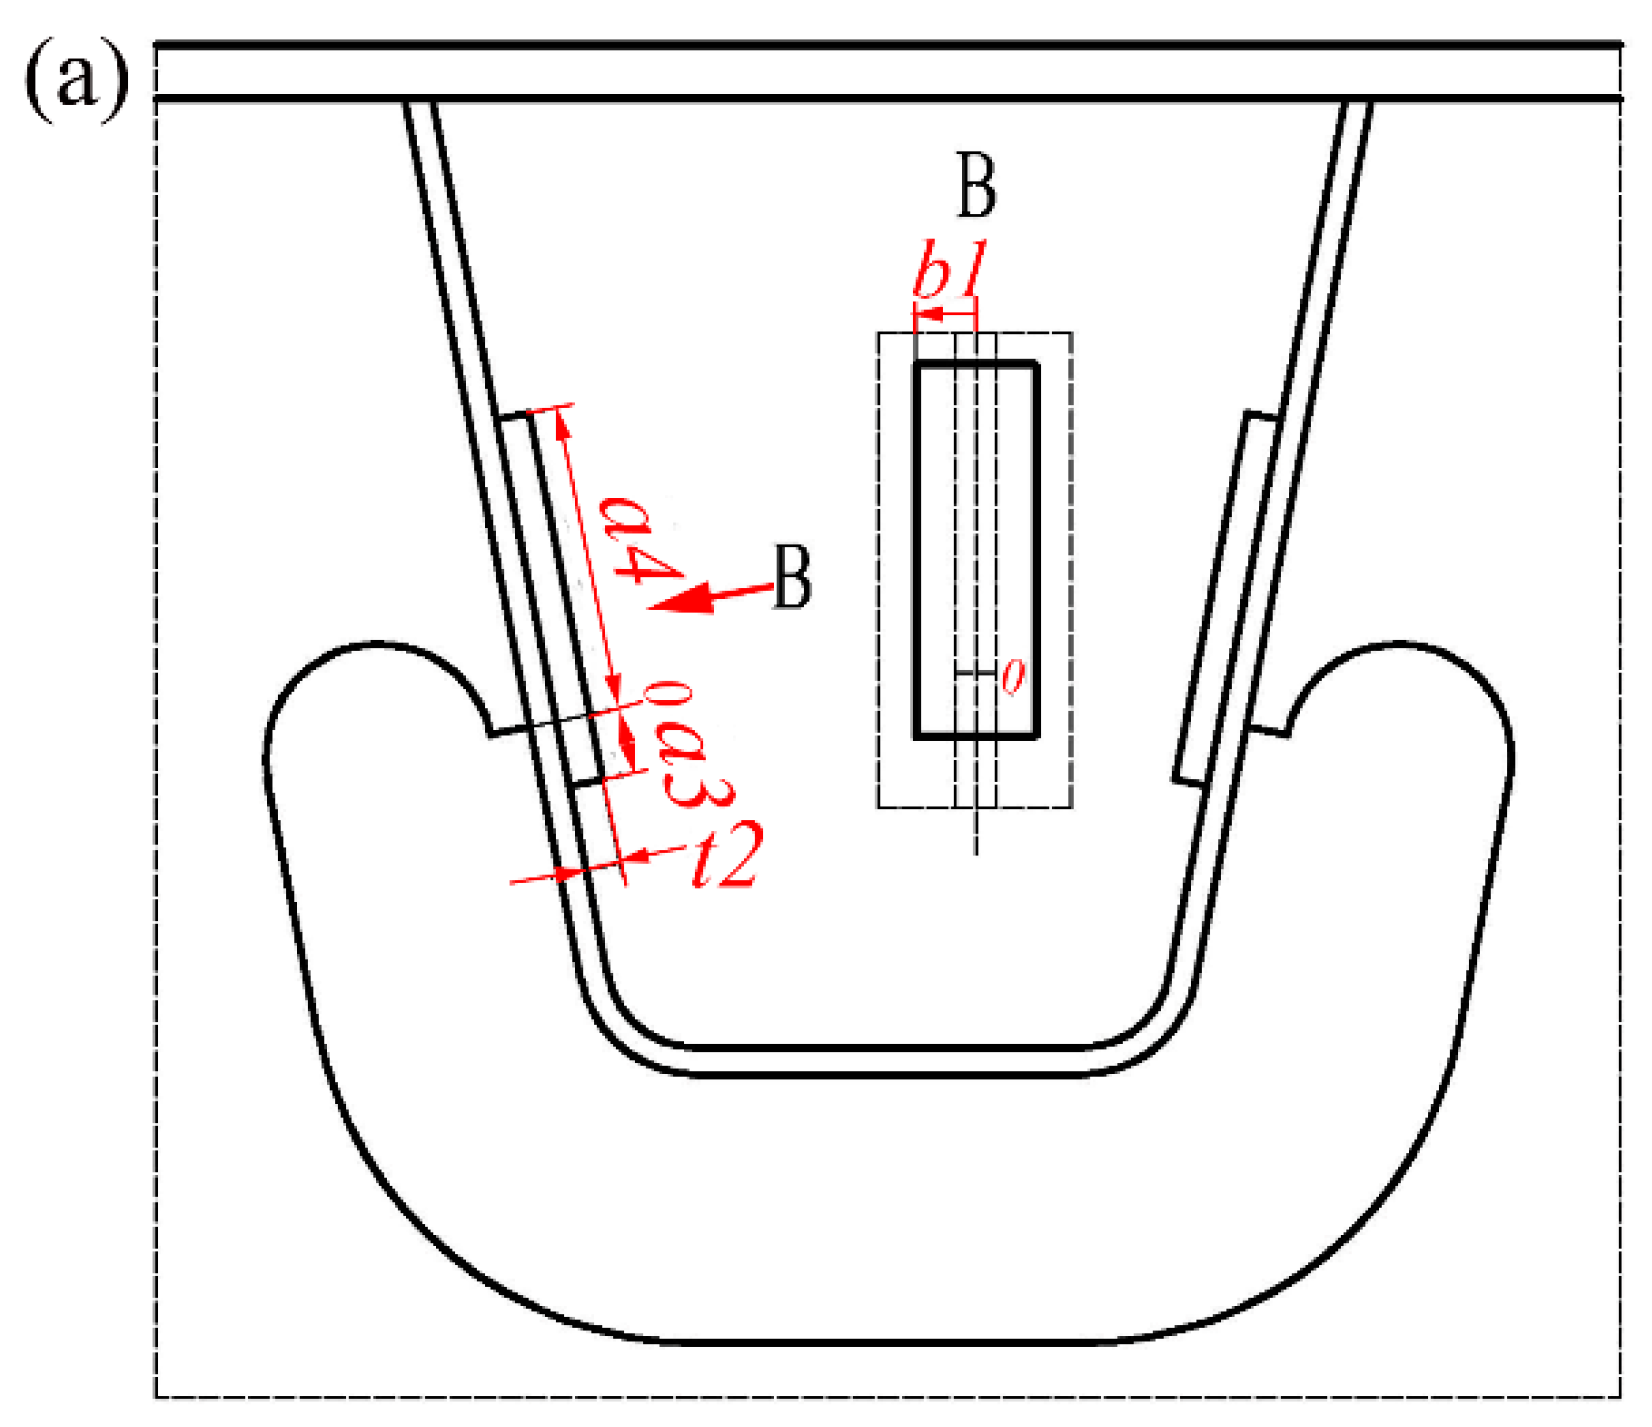
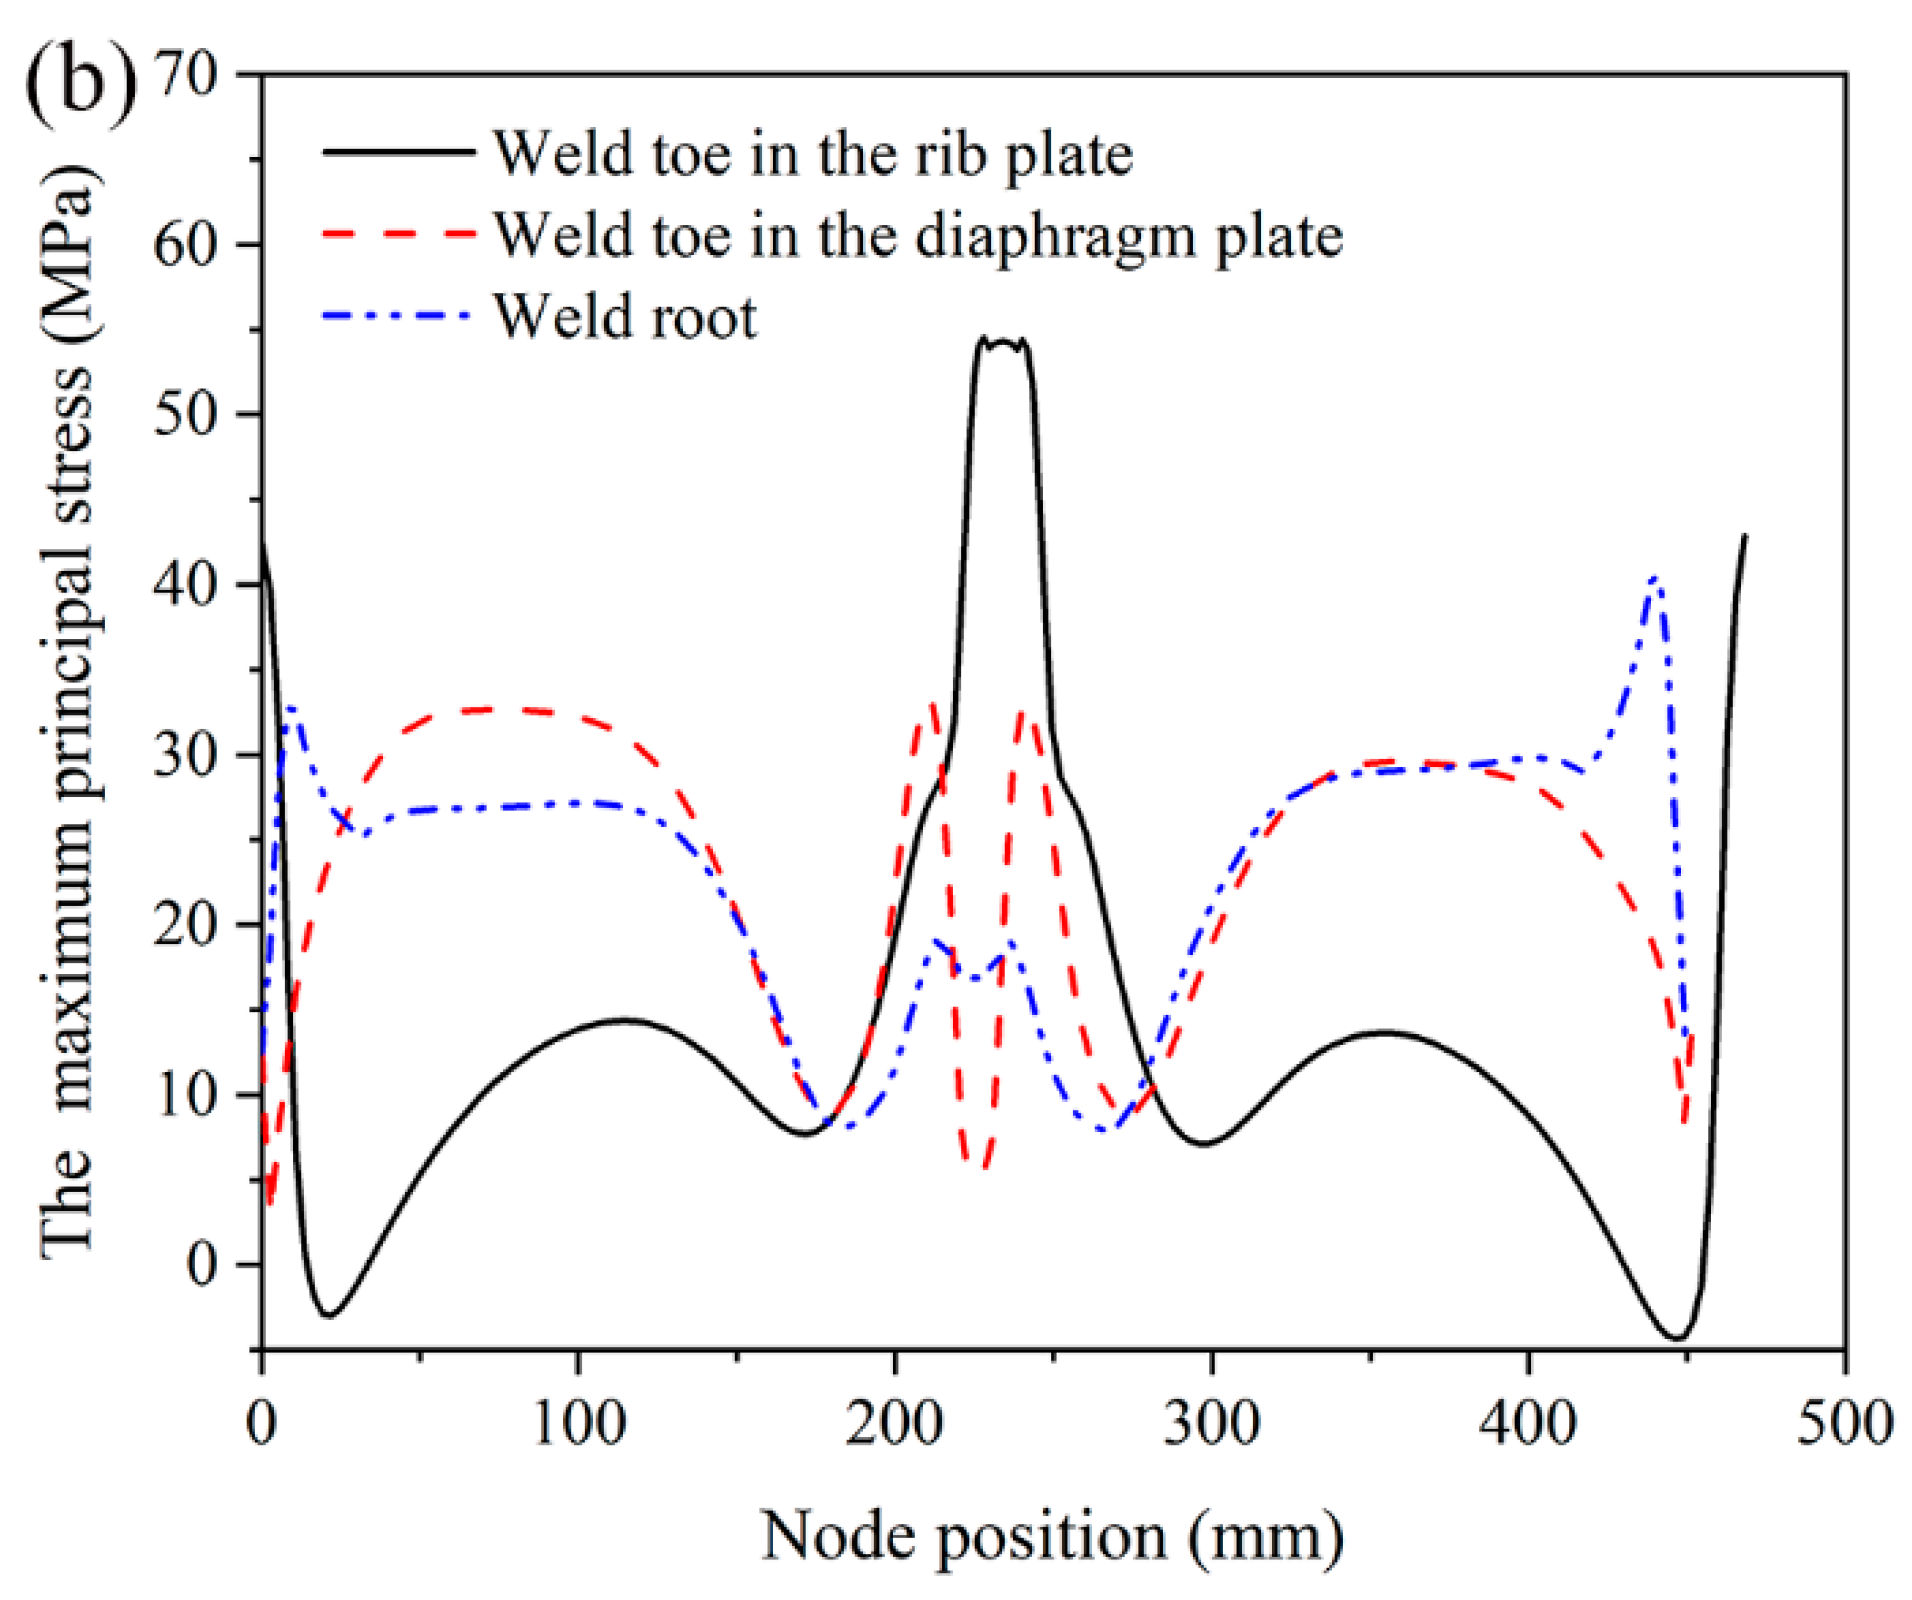
3.4. Improvement of the Local Structure: Scheme 2
3.5. Improvement of the Local Structure: Scheme 3
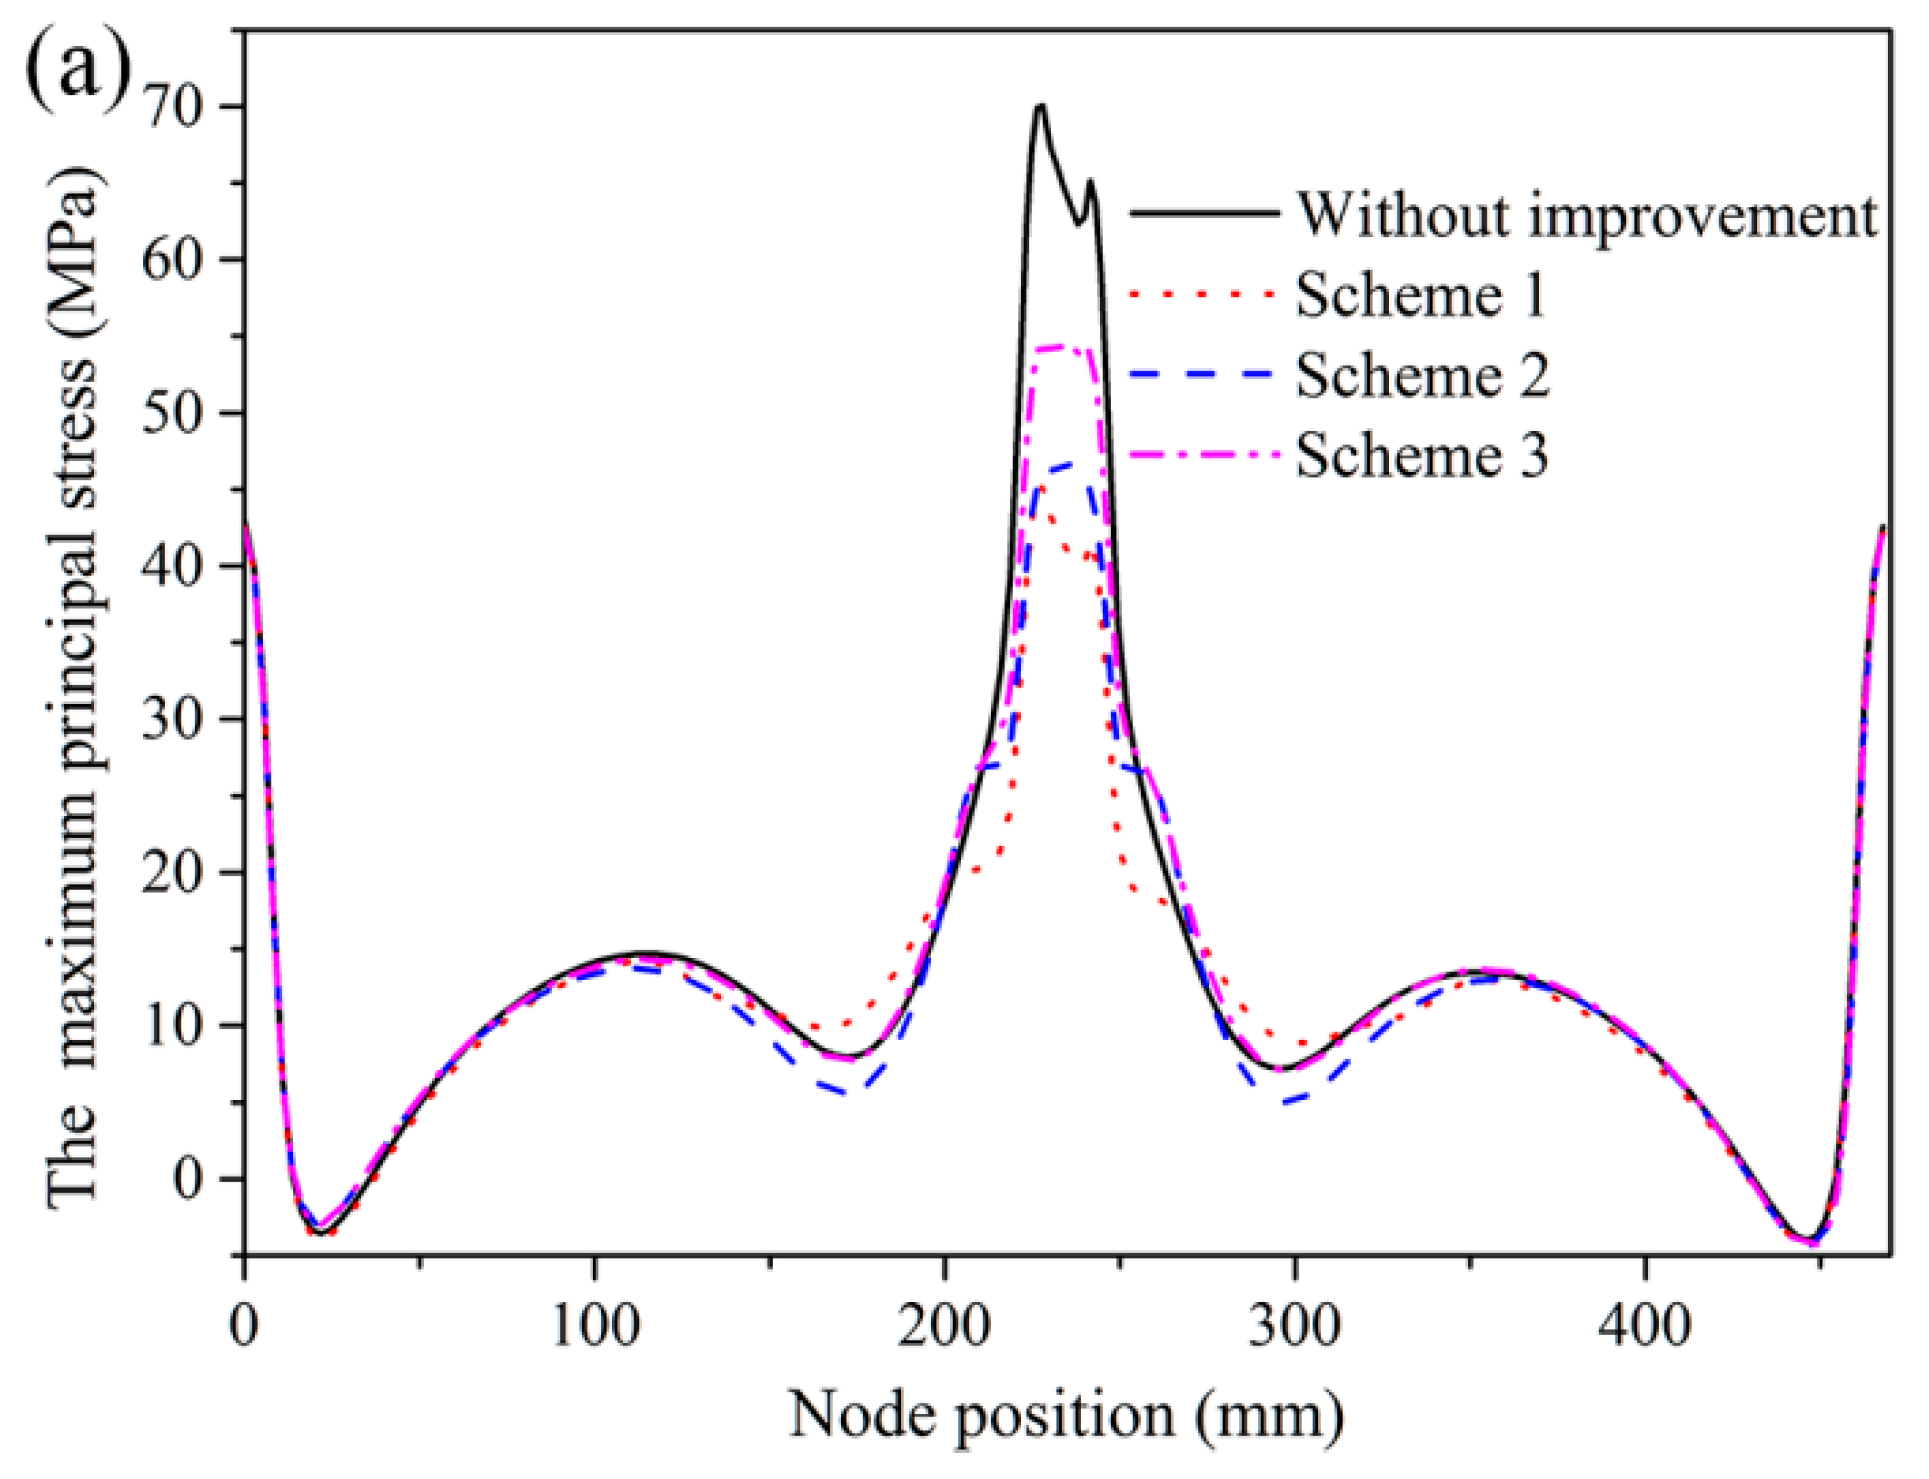
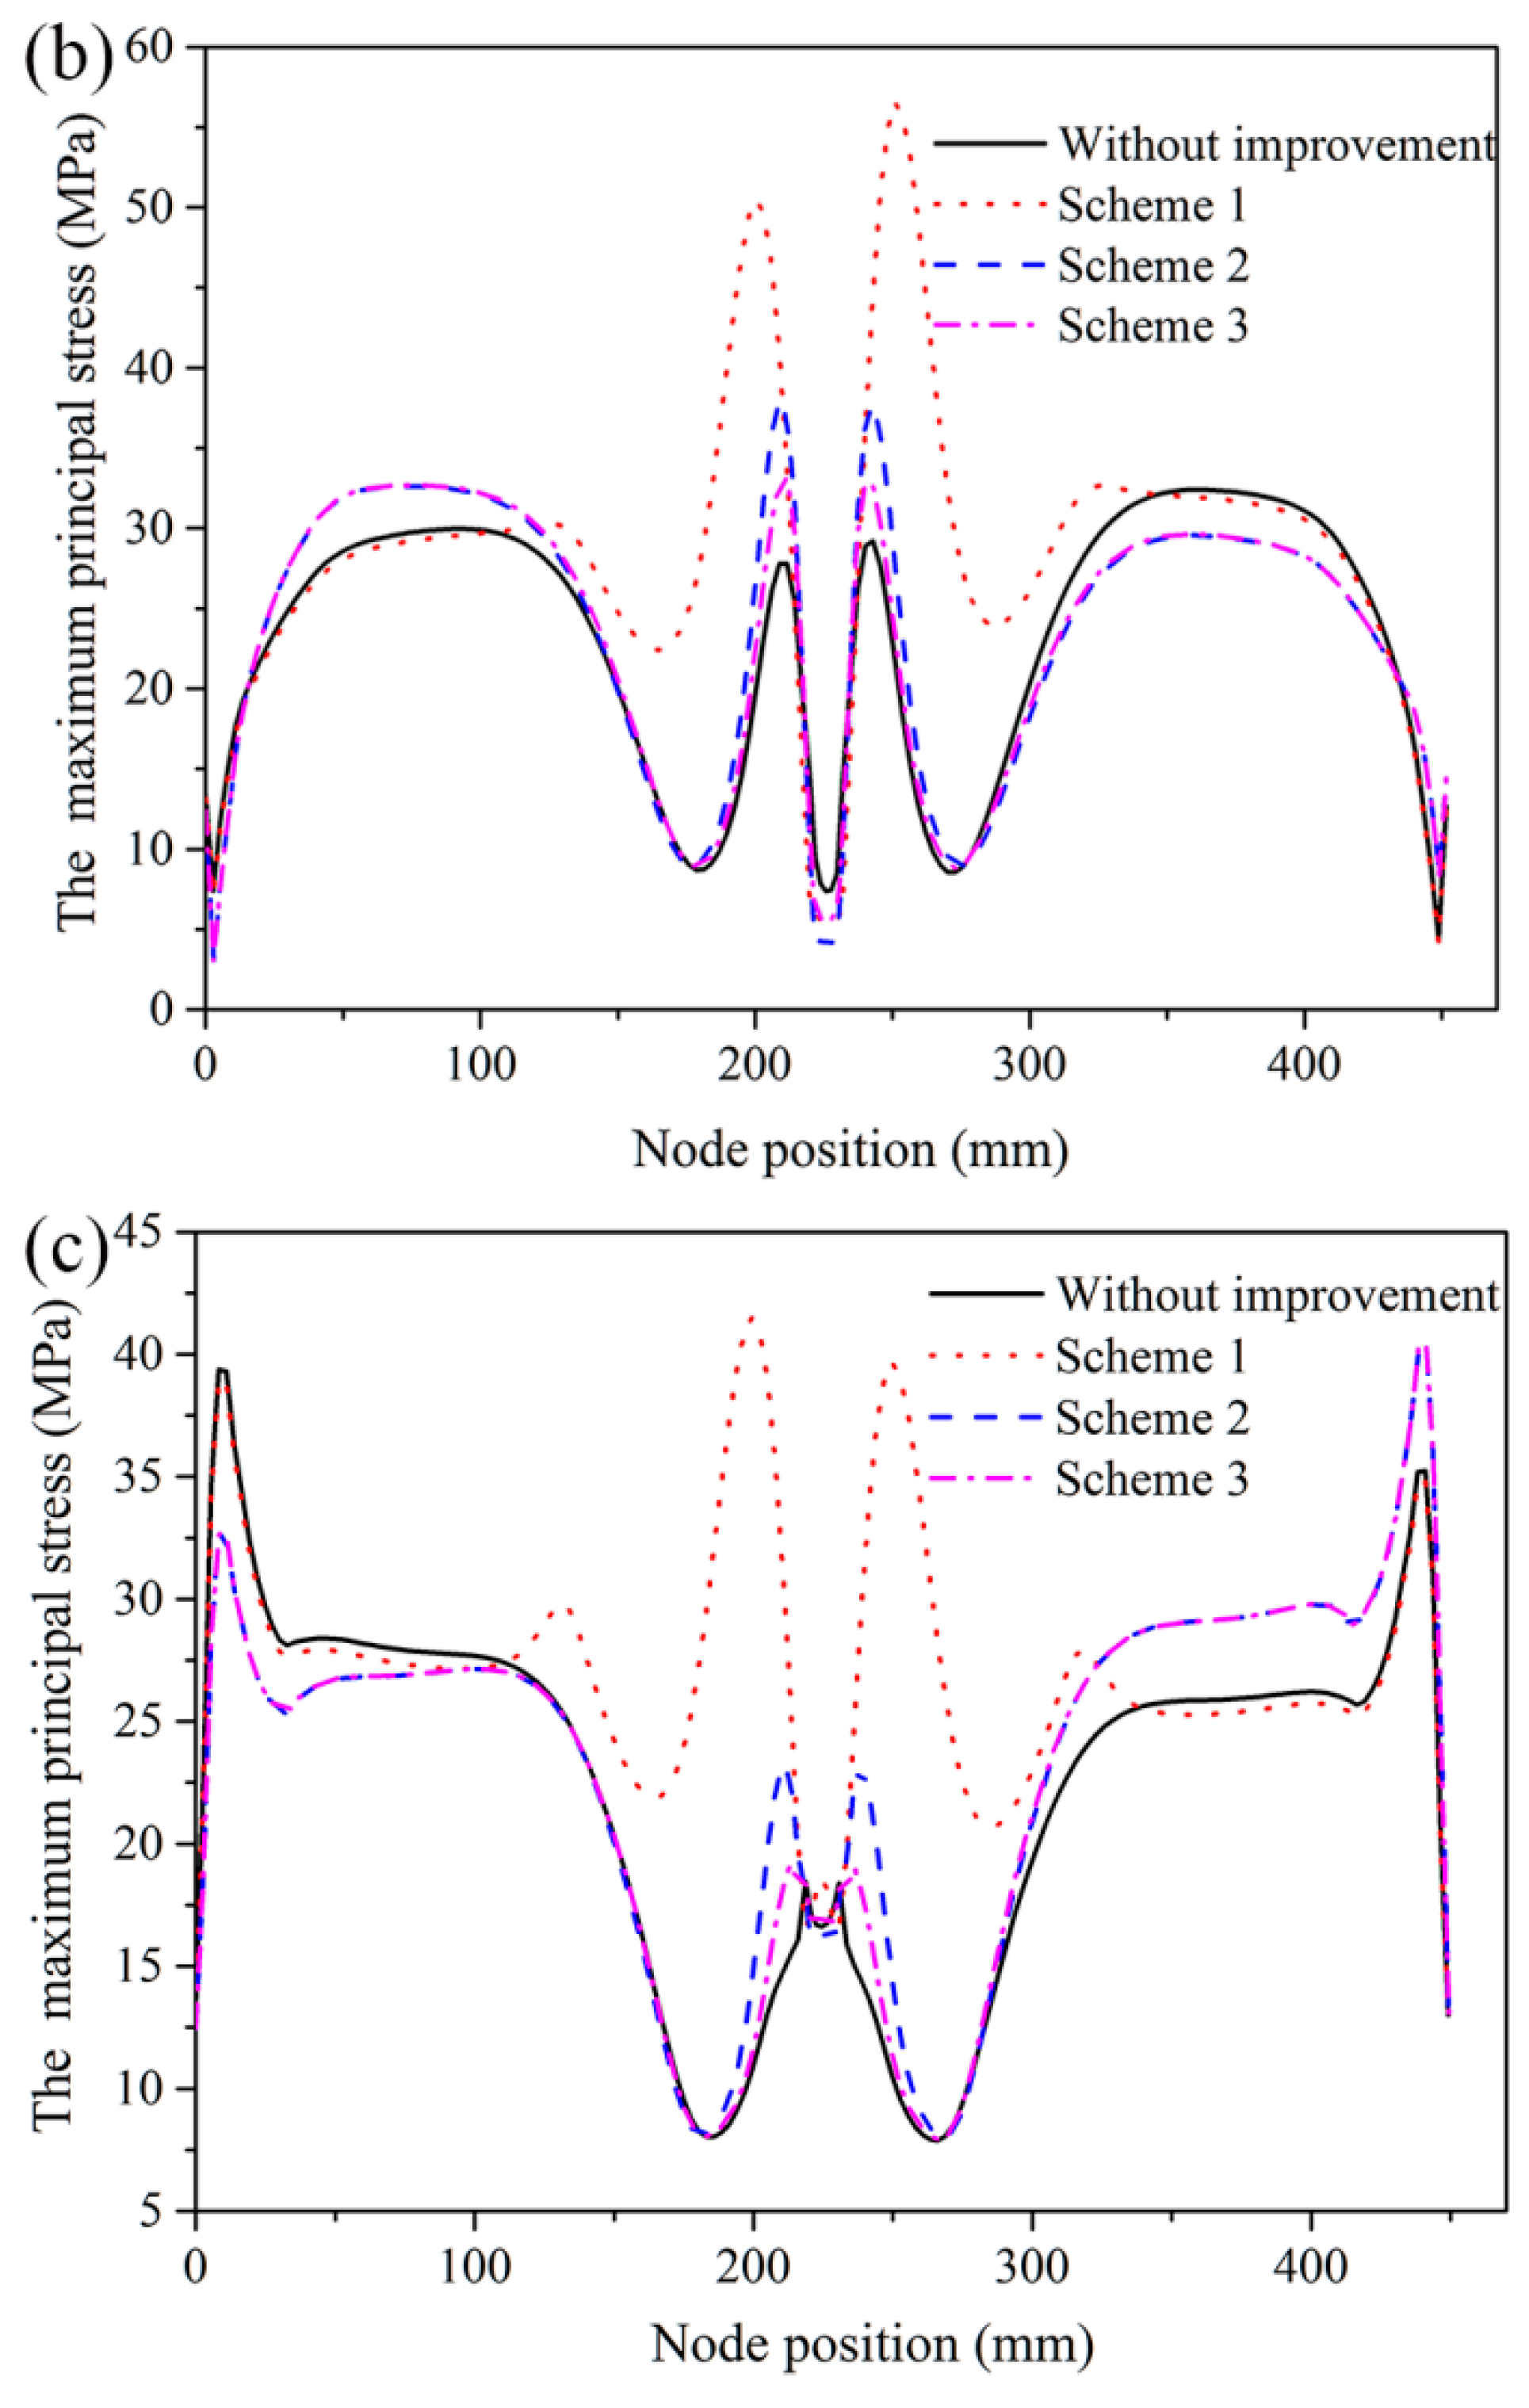
3.6. Comparisons of Three Improvement Schemes
4. Conclusions
- (1)
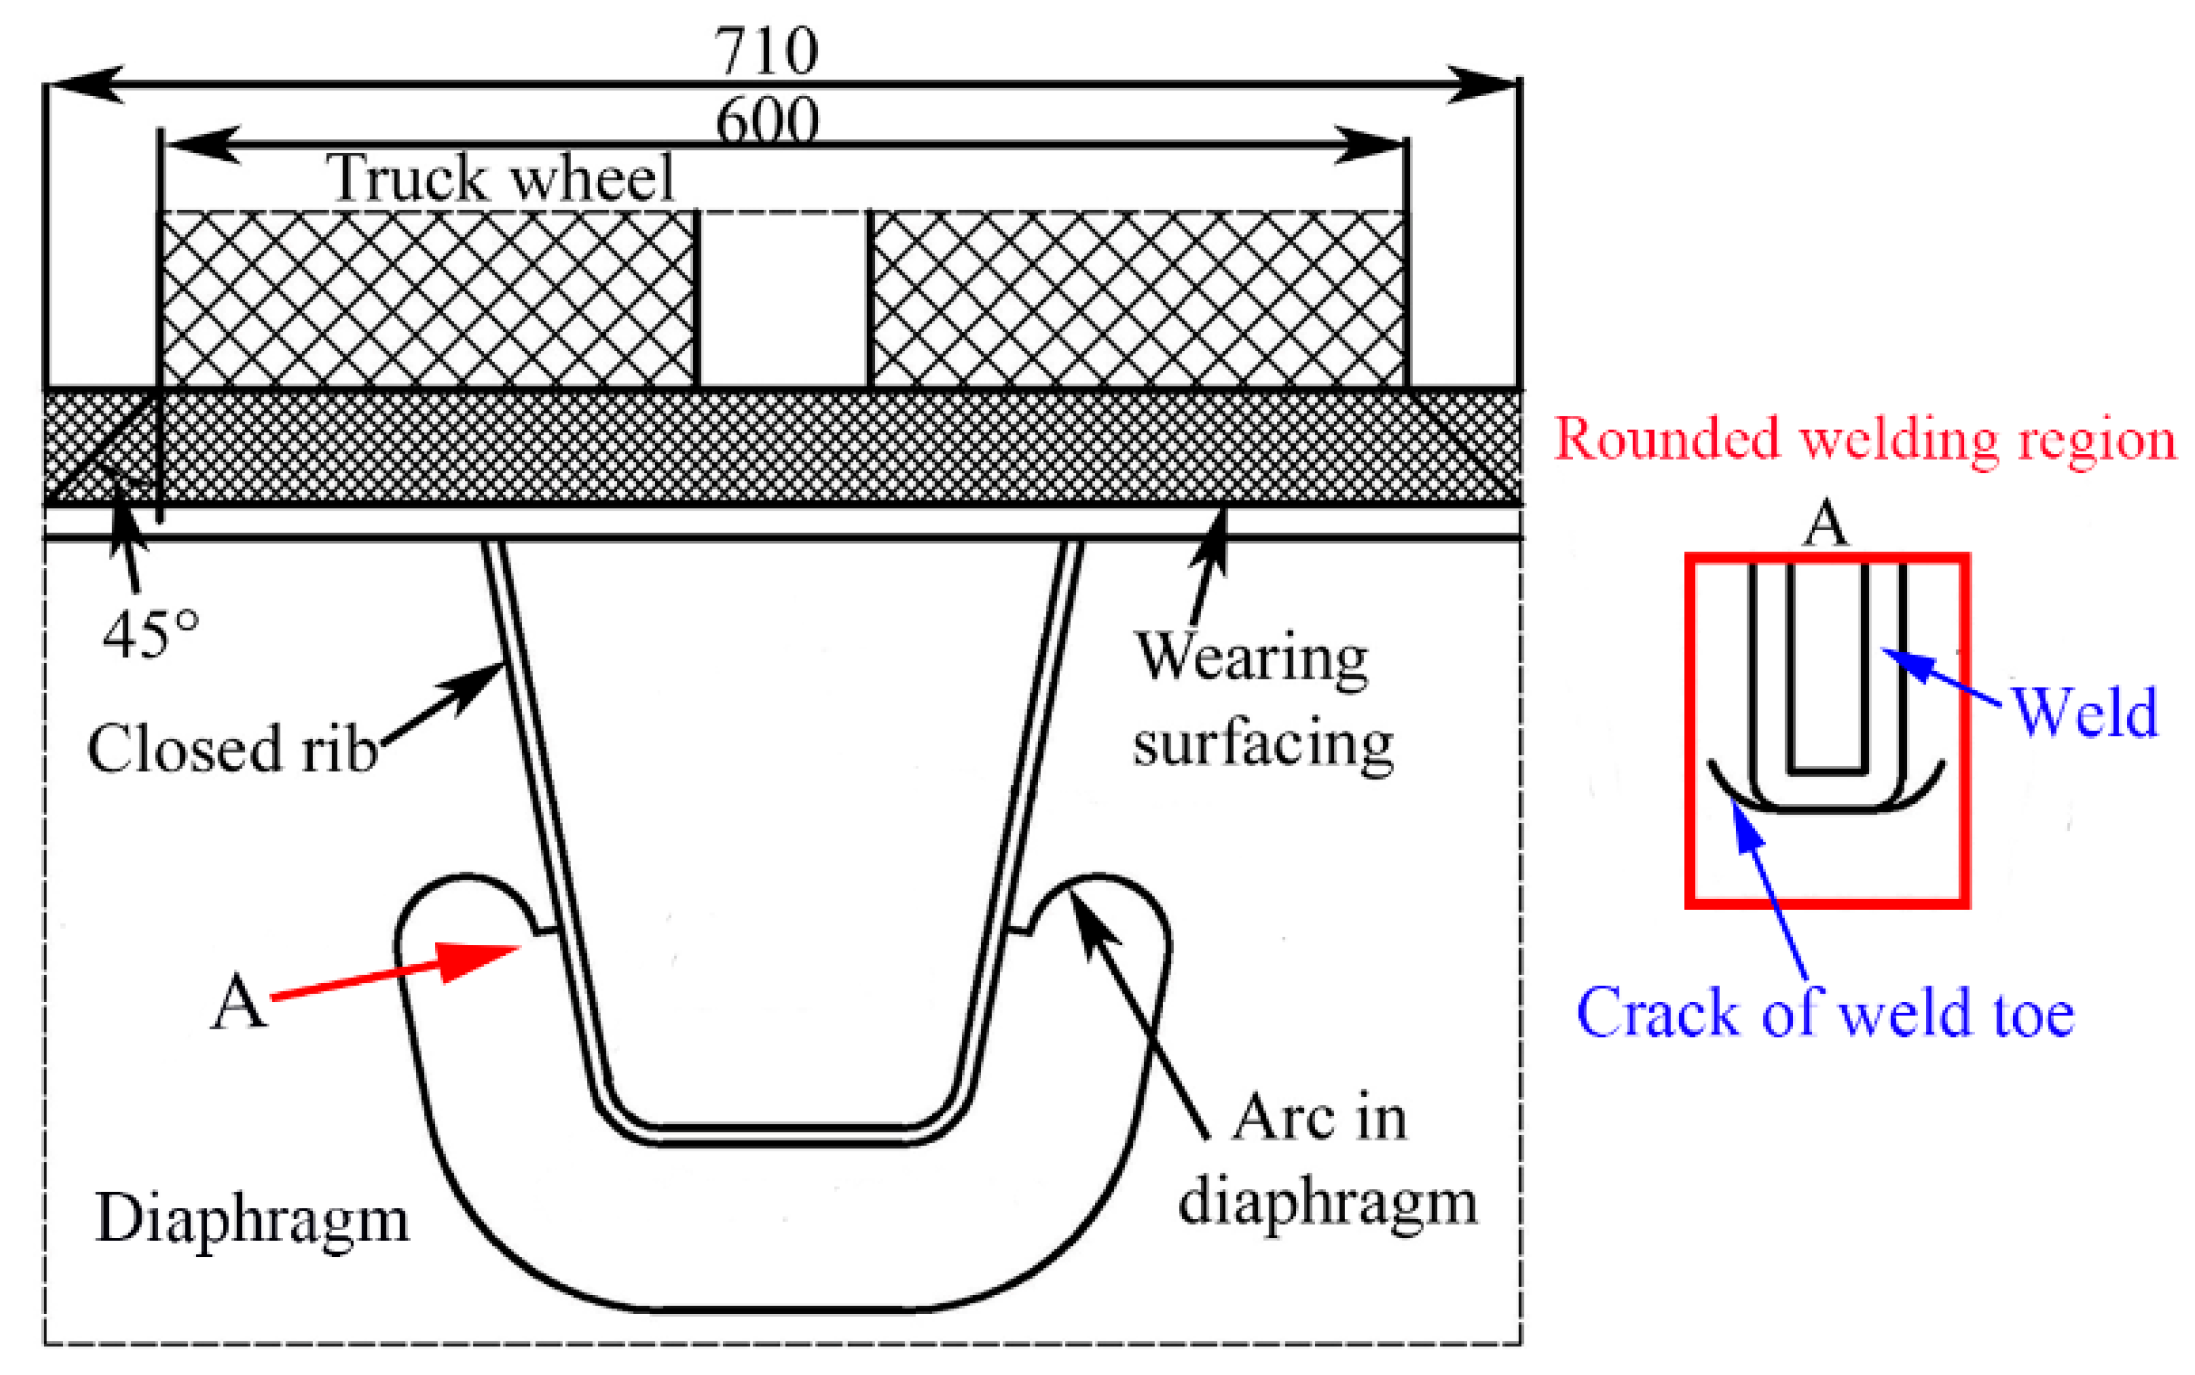
- The fatigue crack of the rounded welding region of the orthotropic steel bridge deck initiates from the weld toe in the closed rib plate.
- (2)
- The fatigue strength equation for the tested specimens is lgN = 11.57 − 3.4(lgΔσ) with 97.7% confidence bound. When the fatigue cycles N is 2 million, the stress range Δσ is 35.46 MPa. This equation can provide a reference for the fatigue design of this detailed structure.
- (3)
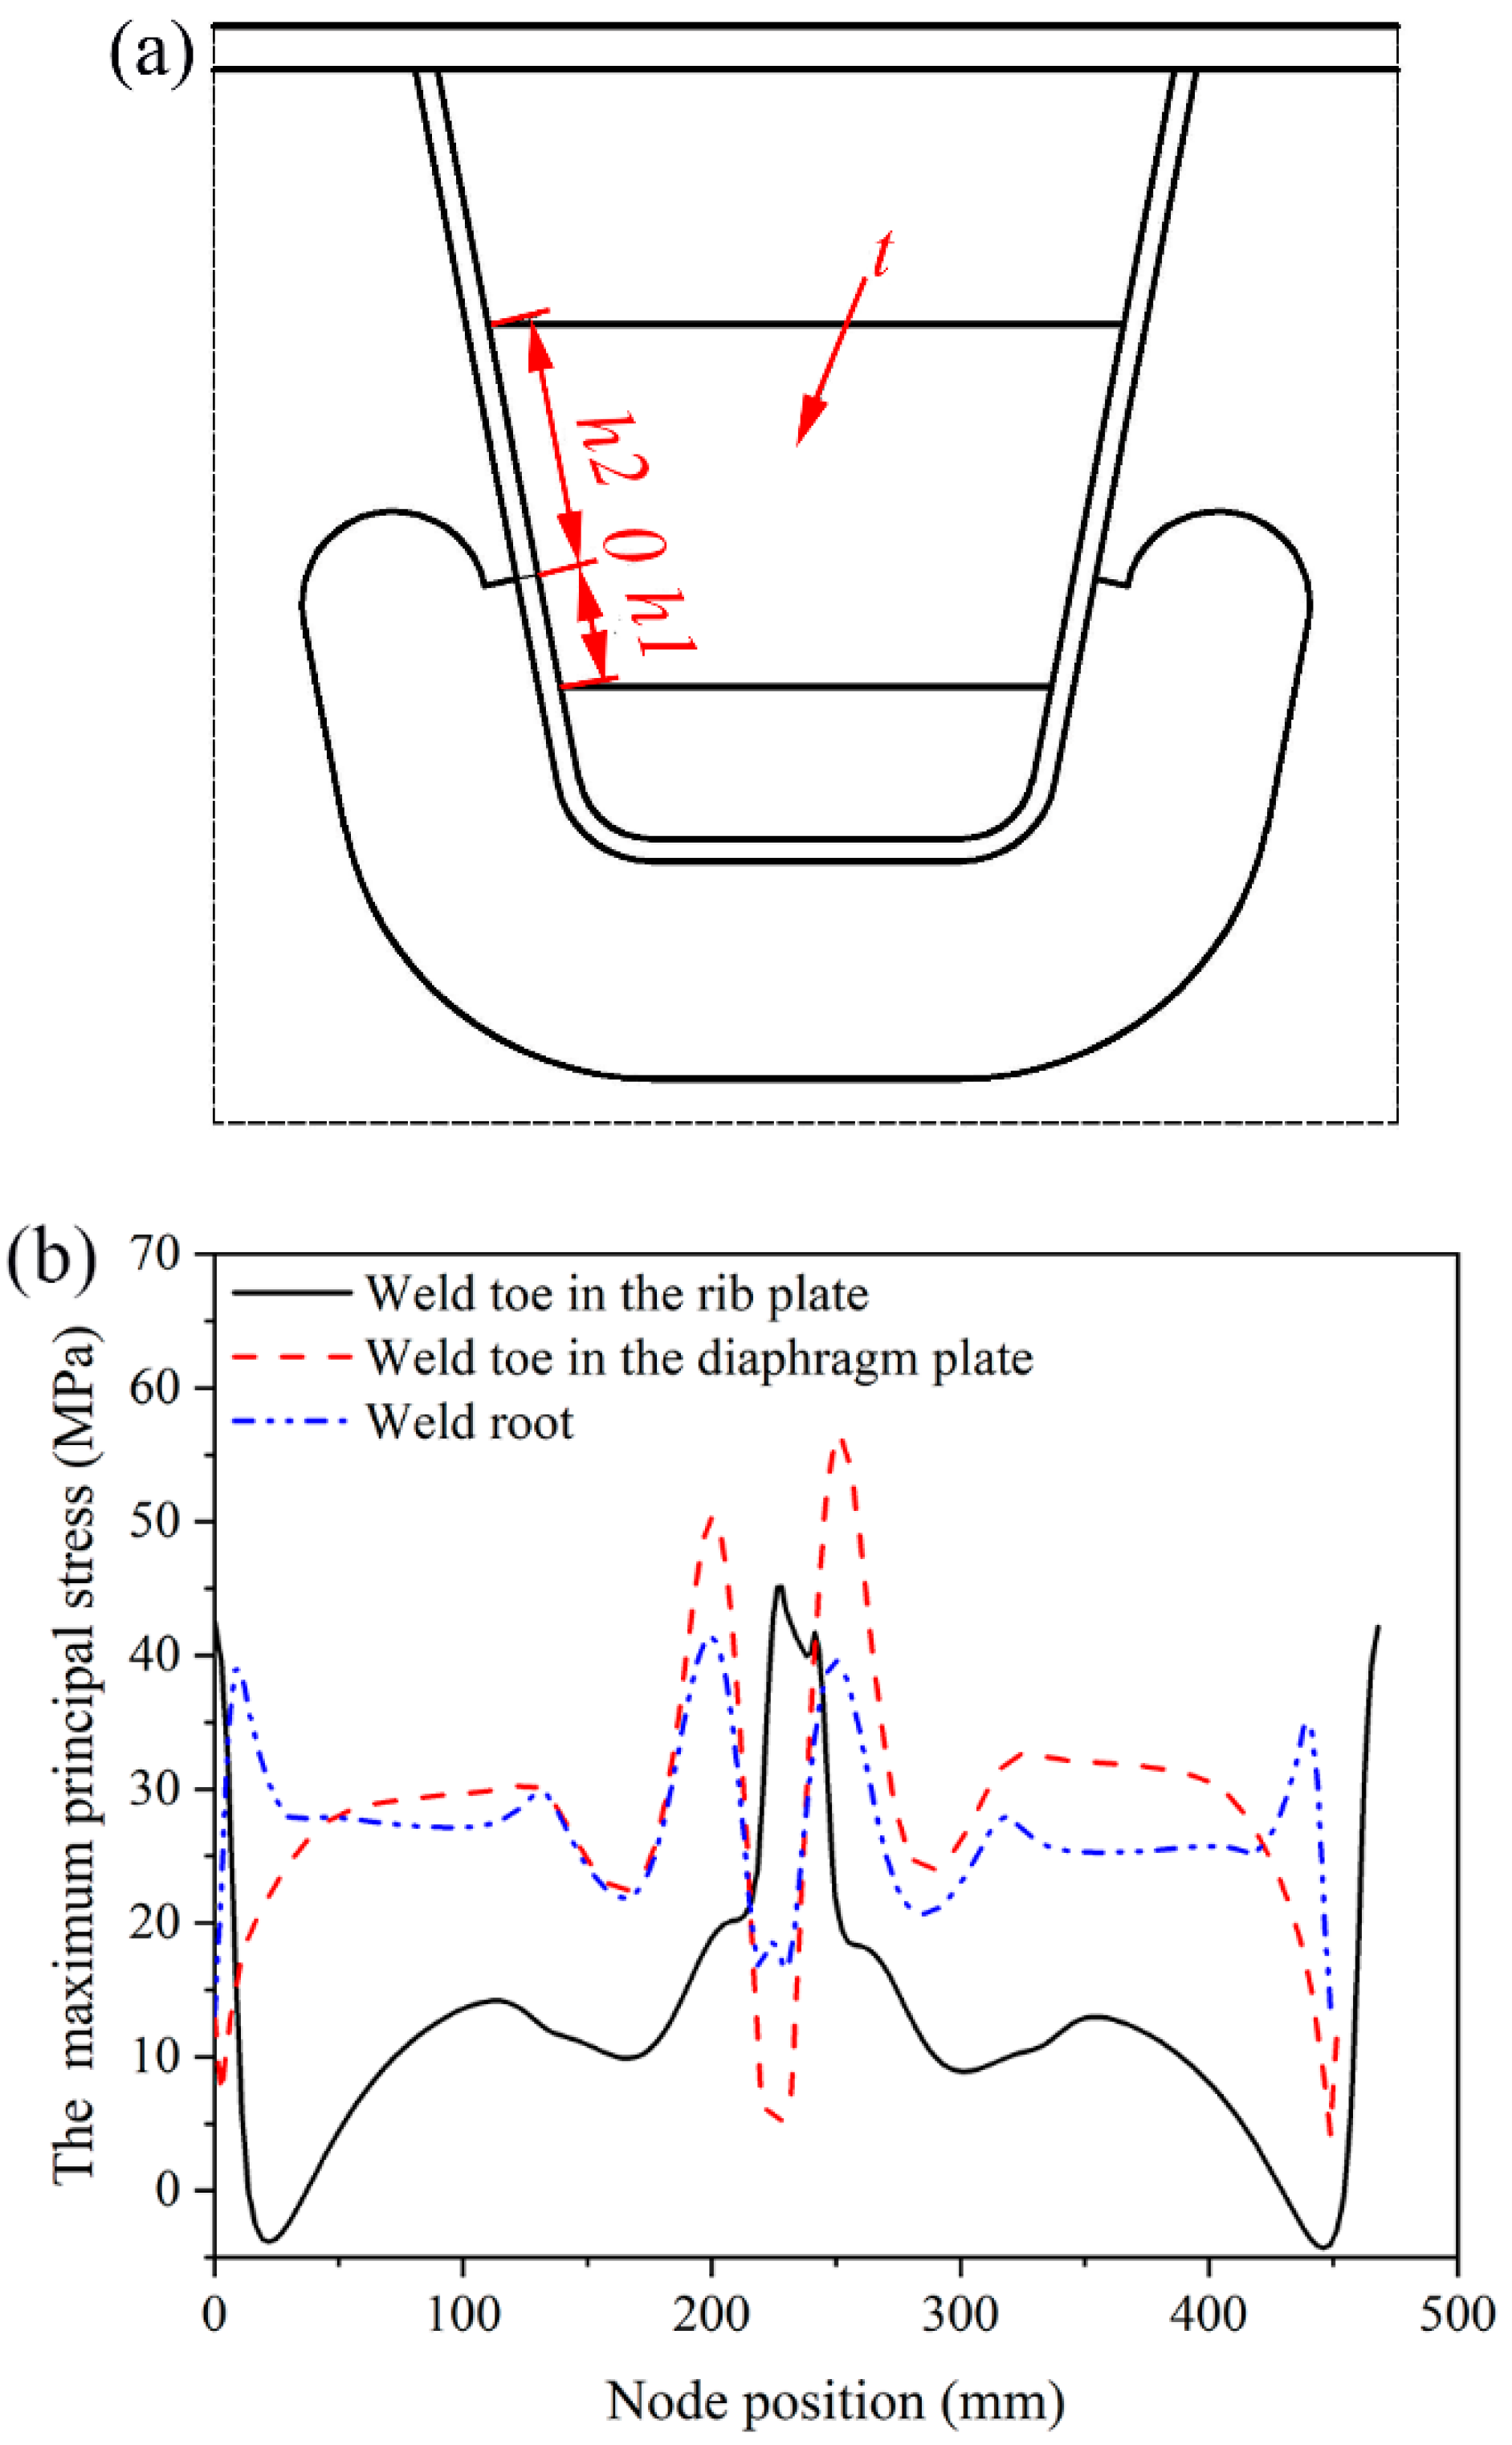
- The stress concentration of the rounded welding region is the main mechanism of fatigue crack initiation. Two optimized reinforcing plates welded in the closed rib effectively reduce the stress concentration of the rounded welding region, and the fatigue strength of this welded structure can be enhanced.
Author Contributions
Funding
Conflicts of Interest
References
- Freitas, S.T.D.; Kolstein, H.; Bijlaard, F. Composite bonded systems for renovations of orthotropic steel bridge decks. Compos. Struct. 2010, 92, 853–862. [Google Scholar] [CrossRef]
- Kainuma, S.; Yang, M.; Jeong, Y.S.; Inokuchi, S.; Kawabata, A.; Uchida, D. Experiment on fatigue behavior of rib-to-deck weld root in orthotropic steel decks. J. Constr. Steel Res. 2016, 119, 113–122. [Google Scholar] [CrossRef]
- Huang, Y.; Zhang, Q.; Bao, Y.; Bu, Y. Fatigue assessment of longitudinal rib-to-crossbeam welded joints in orthotropic steel bridge decks. J. Constr. Steel Res. 2019, 159, 53–66. [Google Scholar] [CrossRef]
- Choi, J.H.; Kim, D.H. Stress characteristics and fatigue crack behaviour of the longitudinal rib-to-cross beam joints in an orthotropic steel deck. Adv. Struct. Eng. 2008, 11, 189–198. [Google Scholar] [CrossRef]
- Zhang, Q.H.; Cui, C.; Bu, Y.Z.; Liu, Y.M.; Ye, H.W. Fatigue tests and fatigue assessment approaches for rib-to-diaphragm in steel orthotropic decks. J. Constr. Steel Res. 2015, 114, 110–118. [Google Scholar] [CrossRef]
- Cui, C.; Zhang, Q.; Luo, Y.; Hao, H.; Li, J. Fatigue reliability evaluation of deck-to-rib welded joints in OSD considering stochastic traffic load and welding residual stress. Int. J. Fatigue 2018, 111, 151–160. [Google Scholar] [CrossRef]
- Zhang, Q.; Bu, Y.; Li, Q. Review on fatigue problems of orthotropic steel bridge deck. J. China J. Highw. 2017, 30, 14–30. [Google Scholar]
- Deng, Y.; Liu, Y.; Feng, D.; Li, A. Investigation of fatigue performance of welded details in long-span steel bridges using long-term monitoring strain data. Struct. Control. Health Monit. 2015, 22, 1343–1358. [Google Scholar] [CrossRef]
- Alemdar, F. Experimental Study of Fatigue Crack Behavior of Rib-To-Rib Butt Welded Connections in Orthotropic Steel Decks. Lat. Am. J. Solids Struct. 2018, 15, e128. [Google Scholar]
- Zhuang, M.; Miao, C.; Chen, R. Analysis for Stress Characteristics and Structural Parameters Optimization in Orthotropic Steel Box Girders based on Fatigue Performance. KSCE J. Civ. Eng. 2019, 23, 2598–2607. [Google Scholar] [CrossRef]
- Tsakopoulos, P.A.; Fisher, J.W. Full-scale fatigue tests of steel orthotropic decks for the Williamsburg Bridge. J. Bridge Eng. 2003, 8, 323–333. [Google Scholar] [CrossRef]
- Connor, R.J.; Fisher, J.W. Consistent approach to calculating stresses for fatigue design of welded rib-to-web connections in steel orthotropic bridge decks. J. Bridge Eng. 2006, 11, 517–525. [Google Scholar] [CrossRef]
- Xiao, Z.; Yamada, K.; Ya, S.; Zhao, X. Stress analyses and fatigue evaluation of rib-to-deck joints in steel orthotropic decks. Int. J. Fatigue 2008, 30, 1387–1397. [Google Scholar] [CrossRef]
- Ya, S.; Yamada, K.; Ishikawa, T. Fatigue evaluation of rib-to-deck welded joints of orthotropic steel bridge deck. J. Bridge Eng. 2010, 16, 492–499. [Google Scholar] [CrossRef]
- Sim, H.; Uang, C.; Sikorsky, C. Effects of fabrication procedures on fatigue resistance of welded joints in steel orthotropic decks. J. Bridge Eng. 2009, 14, 366–373. [Google Scholar] [CrossRef]
- Miki, C. Fatigue damage in orthotropic steel bridge decks and retrofit works. Int. J. Steel Struct. 2006, 6, 255–267. [Google Scholar]
- Zhang, Q.; Liu, Y.; Bao, Y.; Jia, D.; Bu, Y.; Li, Q. Fatigue performance of orthotropic steel-concrete composite deck with large-size longitudinal U-shaped ribs. Eng. Struct. 2017, 150, 864–874. [Google Scholar] [CrossRef]
- JTGD60-2004. General Code for Design of Highway Bridges and Culverts; China Communications Press: Beijing, China, 2004. [Google Scholar]
- Zhang, C.; Lu, P.; Hu, X.; Song, X. Effect of buffer layer and notch location on fatigue behavior in welded high-strength low-alloy. J. Mater. Process. Technol. 2012, 212, 2091–2101. [Google Scholar] [CrossRef]
- Hobbacher, A. Recommendations for Fatigue Design of Welded Joints and Components; Springer: Berlin/Heidelberg, Germany, 2009. [Google Scholar]
- GB50017-2003. Code for Design of Steel Structures; China Architecture & Building Press: Beijing, China, 2003. [Google Scholar]
- TB10002-2. China Railway Major Bridge Reconnaissance Design of Railway Bridge; China Railway Publishing House: Beijing, China, 2005. [Google Scholar]
- Nussbaumer, A.; Borges, L.; Davaine, L. Fatigue Design of Steel and Composite Structures: Eurocode 3: Design of Steel Structures, Part 1–9 Fatigue; Eurocode 4: Design of Composite Steel and Concrete Structures; John Wiley & Sons: Hoboken, NJ, USA, 2012. [Google Scholar]
- AASHTO LRFD Bridge Design Specifications, 6th ed.; Parts I and II; ASCE: Atlanta, GA, USA, 2012.
- Ghorbal, G.B.; Tricoteaux, A.; Thuault, A.; Louis, G.; Chicot, D. Comparison of conventional Knoop and Vickers hardness of ceramic materials. J. Eur. Ceram. Soc. 2017, 37, 2531–2535. [Google Scholar] [CrossRef]
- Moreira, F.D.L.; Kleinberg, M.N.; Arruda, H.F.; Freitas, F.N.C.; Parente, M.M.V.; De Albuquerque, V.H.C.; Rebouças , P.P. A novel Vickers hardness measurement technique based on Adaptive Balloon Active Contour Method. Expert Syst. Appl. 2016, 45, 294–306. [Google Scholar] [CrossRef]
- Guo, B.; Zhang, L.; Cao, L.; Zhang, T.; Jiang, F.; Yan, L. The correction of temperature-dependent Vickers hardness of cemented carbide base on the developed high-temperature hardness tester. J. Mater. Process. Technol. 2018, 255, 426–433. [Google Scholar] [CrossRef]


| Q345qD | Yield Strength (MPa) | Tensile Strength (MPa) | Elongation (%) | V notch Impact Energy (−20 °C, J) |
| 345 | 510 | 21 | 34 |
| Welding Processes | Manual Welding |
|---|---|
| Electrode diameter (mm) | Φ 4.0 |
| Welding current (A) | 160 |
| Arc voltage (V) | 24 |
| Travel speed (cm/min) | 30~40 |
| Specimen ID | Minimum Stress (MPa) | Maximum Stress (MPa) | Stress Range Δσ (MPa) | Number of Cycles N at Failure (Crack Reaches 30 mm) |
|---|---|---|---|---|
| SY-3-1-1 | 5.83 | 71.71 | 65.88 | 1409107 |
| SY-3-1-2 | 5.83 | 104.65 | 98.82 | 1059280 |
| SY-3-1-3 | 5.83 | 88.18 | 82.35 | 736535 |
| SY-3-1-4 | 5.83 | 104.65 | 98.82 | 435607 |
| SY-3-1-5 | 5.83 | 115.63 | 109.80 | 409925 |
| SY-3-1-6 | 5.83 | 104.65 | 98.82 | 331072 |
| SY-3-1-7 | 5.83 | 104.65 | 98.82 | 205567 |
| SY-3-1-8 | 5.83 | 104.65 | 98.82 | 241068 |
| SY-3-1-9 | 5.83 | 154.06 | 148.23 | 82632 |
| Schemes | Without Improvement | Scheme 1 | Scheme 2 | Scheme 3 | |
|---|---|---|---|---|---|
| Locations | |||||
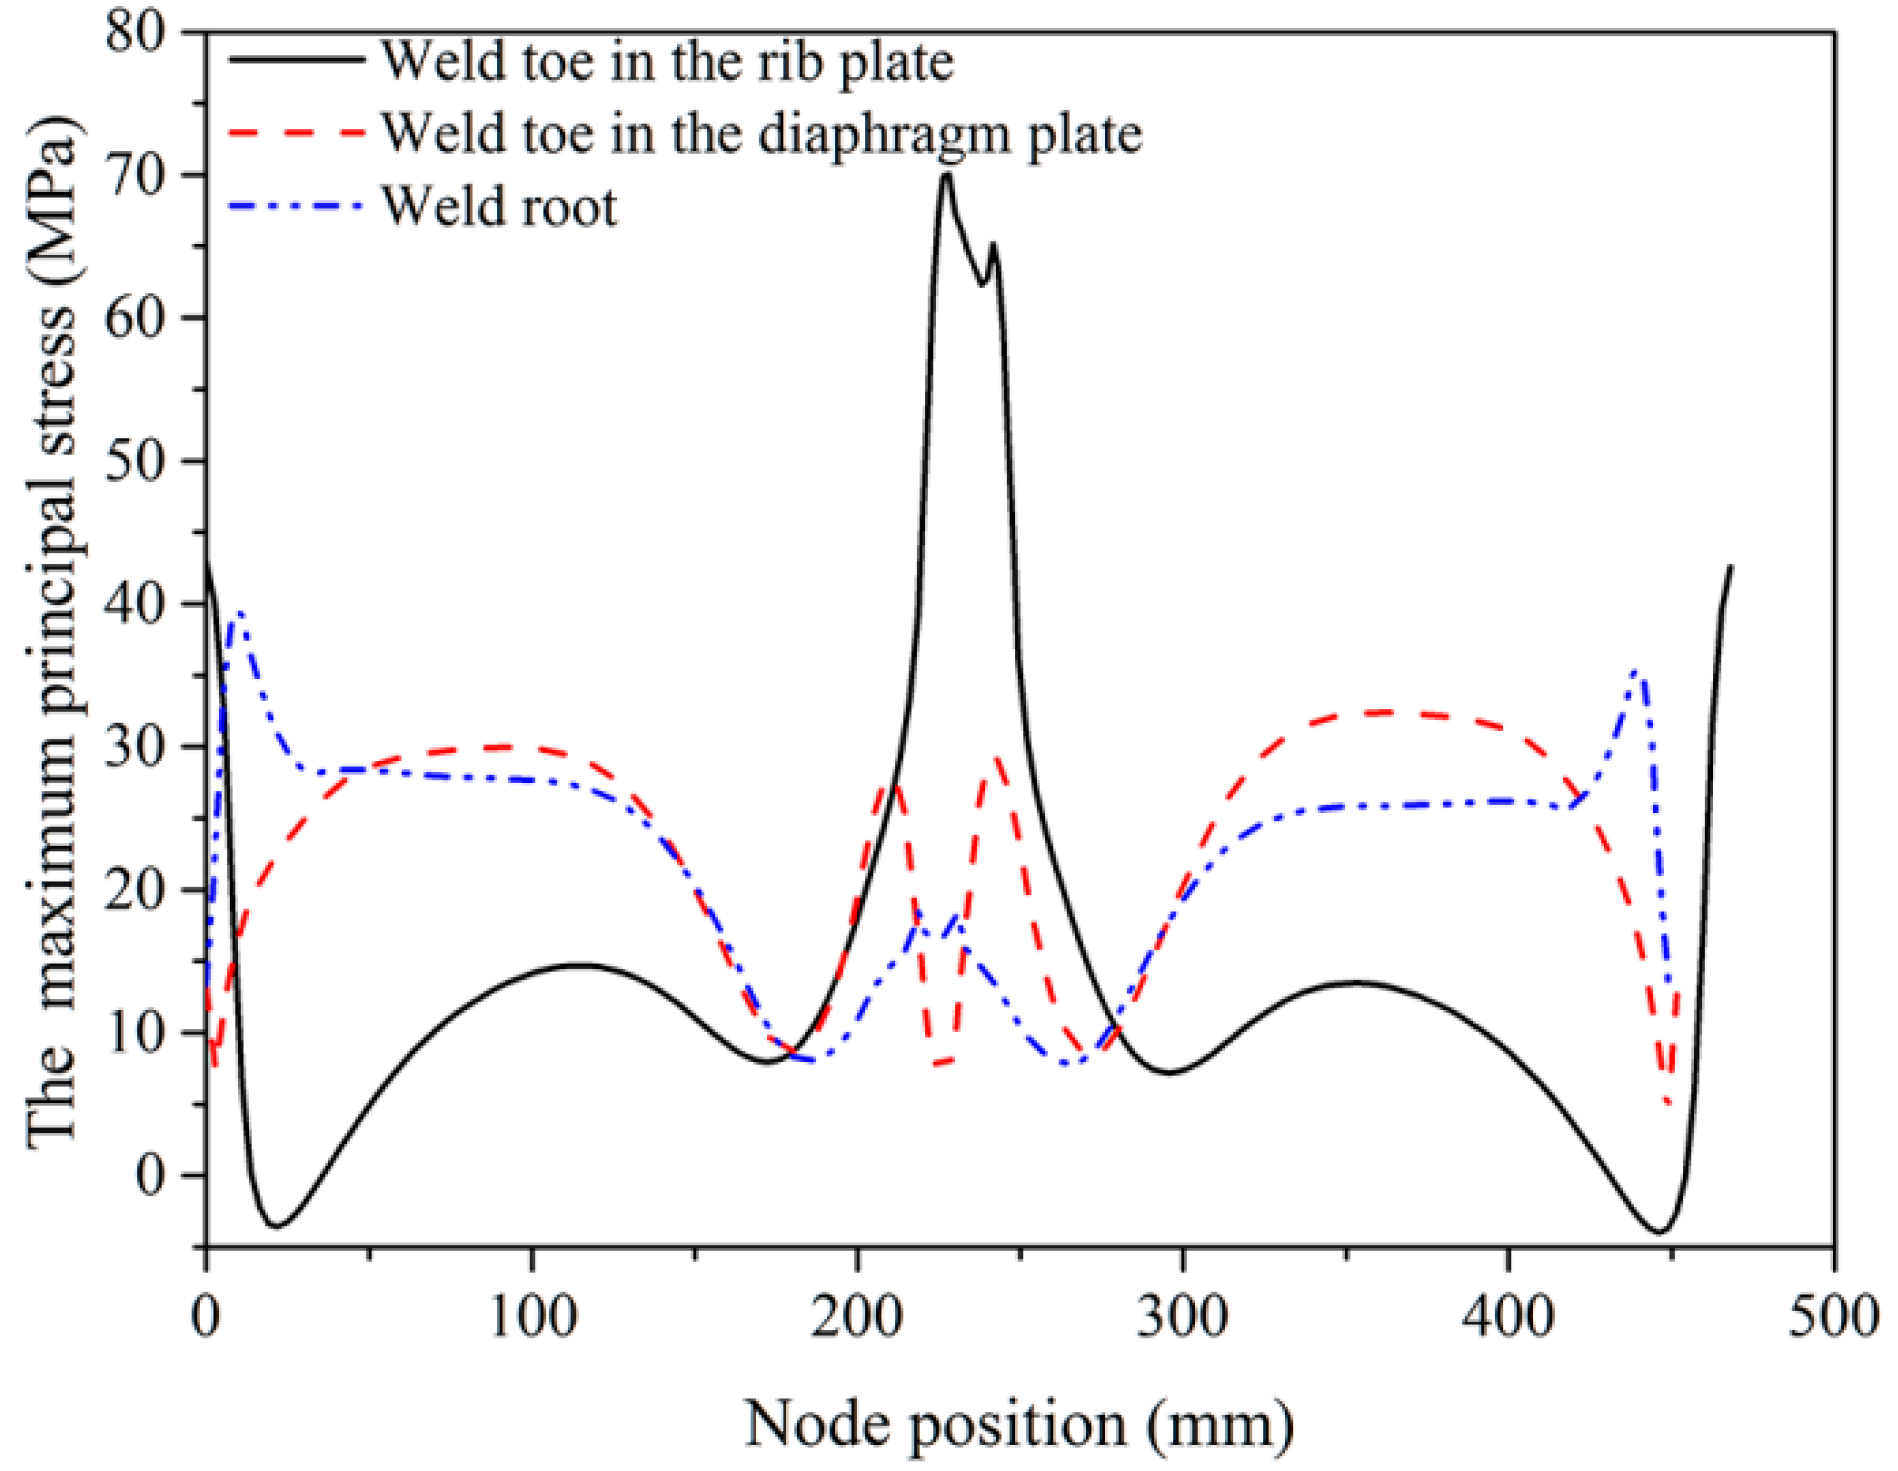
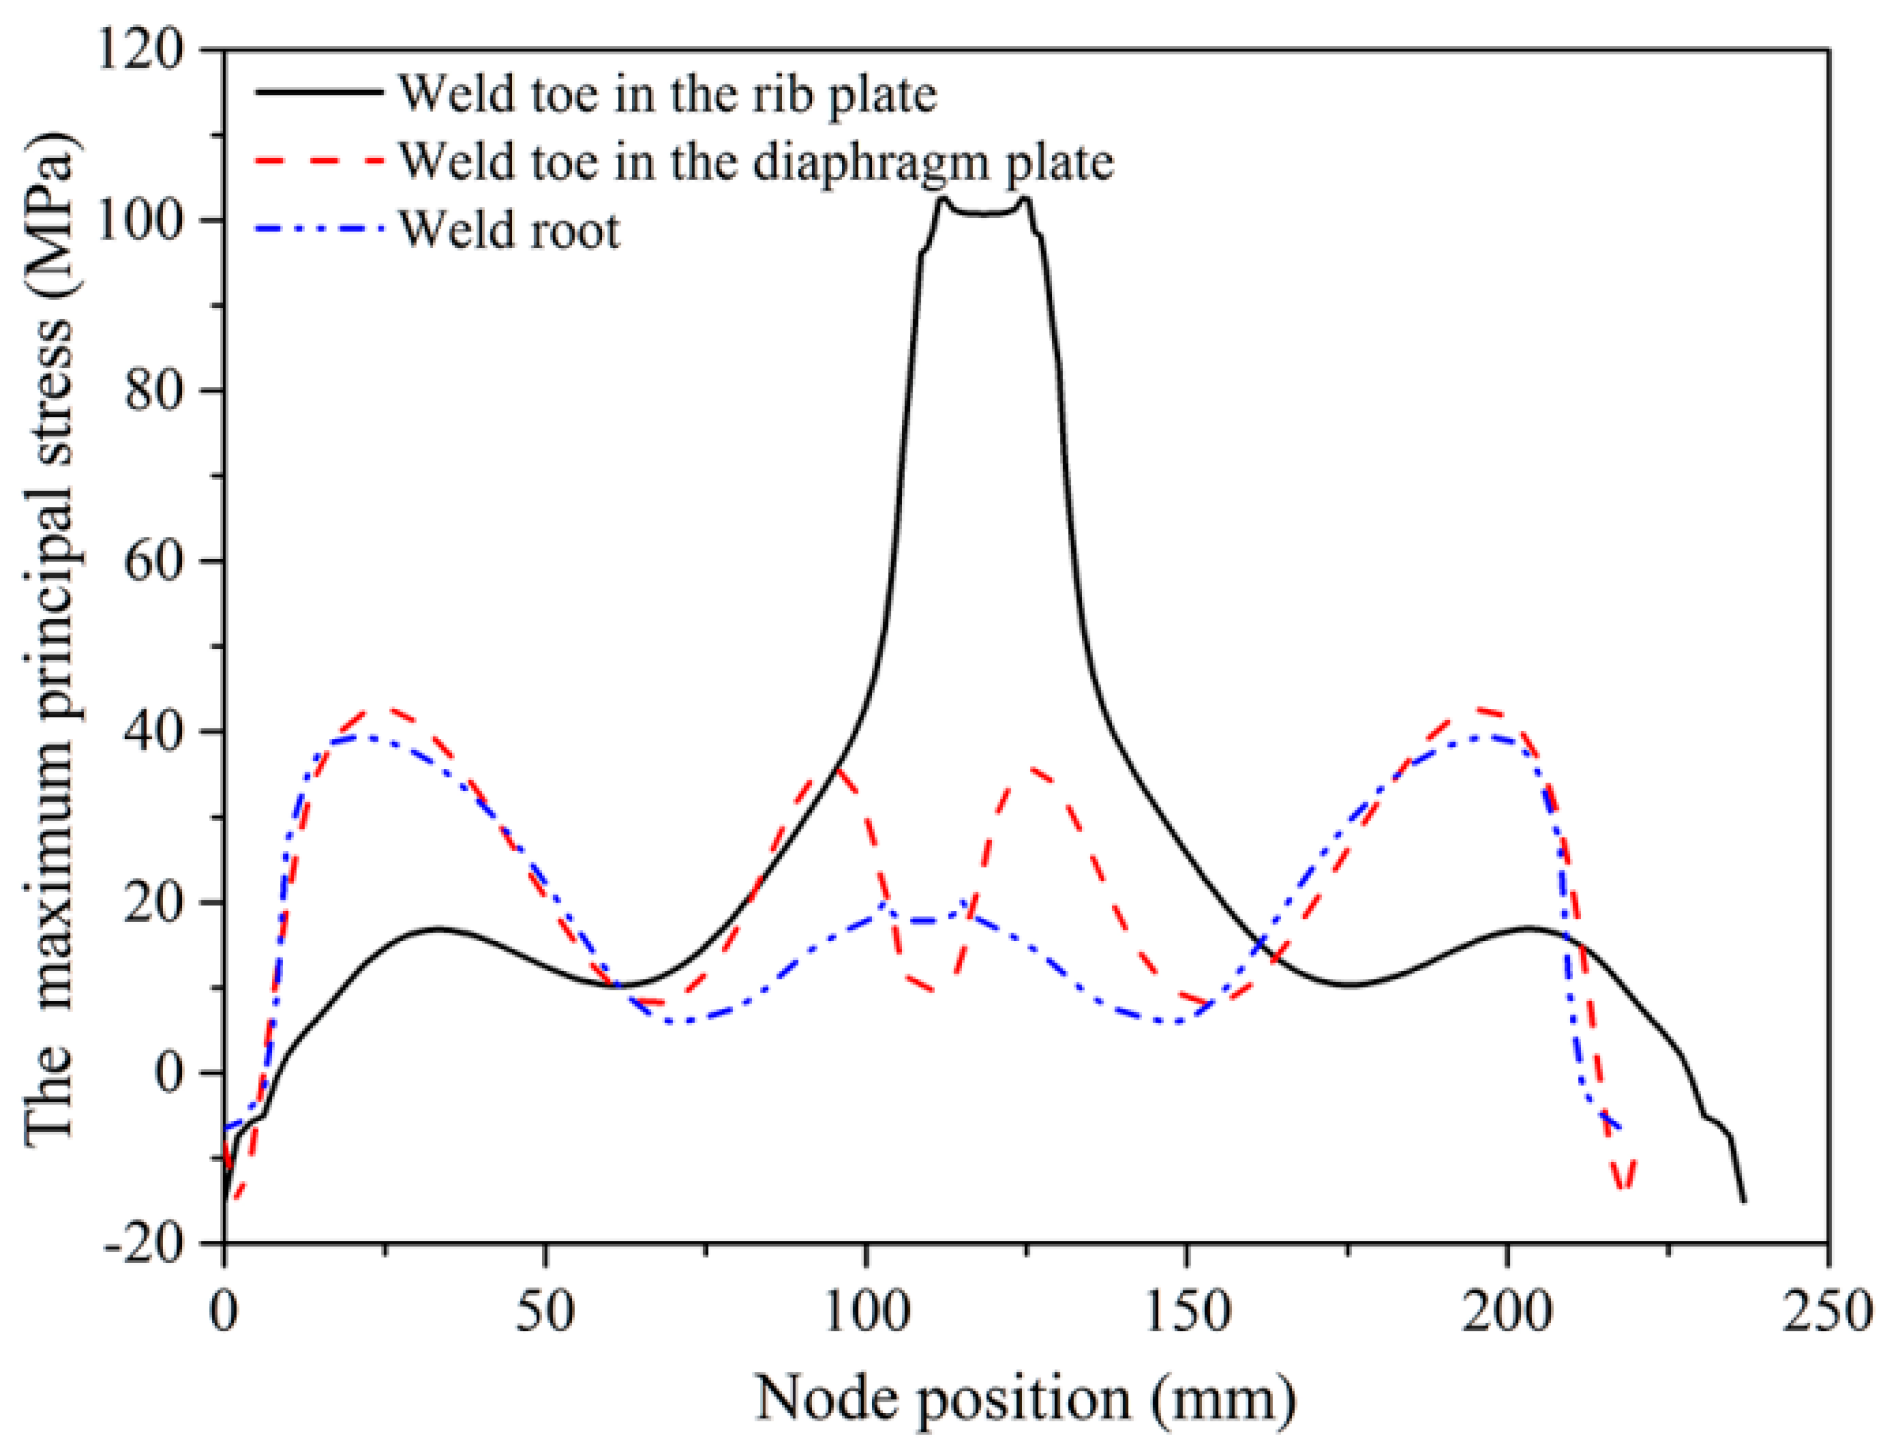
| Weld toe in the closed rib plate (MPa) | 70.023 | 45.135 | 46.711 | 52.8 | |
| Weld toe in the diaphragm plate (MPa) | 32.397 | 56.49 | 37.99 | 32.673 | |
| Weld root (MPa) | 39.359 | 39.65 | 40.51 | 40.532 | |
© 2020 by the authors. Licensee MDPI, Basel, Switzerland. This article is an open access article distributed under the terms and conditions of the Creative Commons Attribution (CC BY) license (http://creativecommons.org/licenses/by/4.0/).
Share and Cite
Li, D.; Zhang, C.; Lu, P. Fatigue Property and Improvement of a Rounded Welding Region between the Diaphragm Plate and Closed Rib of an Orthotropic Steel Bridge Deck. Metals 2020, 10, 161. https://doi.org/10.3390/met10020161
Li D, Zhang C, Lu P. Fatigue Property and Improvement of a Rounded Welding Region between the Diaphragm Plate and Closed Rib of an Orthotropic Steel Bridge Deck. Metals. 2020; 10(2):161. https://doi.org/10.3390/met10020161
Chicago/Turabian StyleLi, Datao, Chunguo Zhang, and Pengmin Lu. 2020. "Fatigue Property and Improvement of a Rounded Welding Region between the Diaphragm Plate and Closed Rib of an Orthotropic Steel Bridge Deck" Metals 10, no. 2: 161. https://doi.org/10.3390/met10020161
APA StyleLi, D., Zhang, C., & Lu, P. (2020). Fatigue Property and Improvement of a Rounded Welding Region between the Diaphragm Plate and Closed Rib of an Orthotropic Steel Bridge Deck. Metals, 10(2), 161. https://doi.org/10.3390/met10020161