1. Introduction
The technology of soldering/brazing at higher application temperatures is considerably extended at present, and provides irreplaceable properties to the resultant products, such as excellent thermal conductivity and high reliability, and the possibility of product miniaturization [
1,
2].
Pb5Sn- and Pb10Sn-type high-lead solders are currently used for high-temperature applications. The greatest demand for higher application temperatures solders is shown within the electronics industry, mainly in the progressive die attach technologies. Die attach is a process of connecting a silicon chip to a substrate and/or to the support structure of a semiconductor case [
3]. Progressive die attach technologies are currently in high demand, since there is great pressure exerted on electronic devices to operate faster and to be smaller, lighter and multifunctional at the same time. For this reason, many die attach technologies use high-temperature solders. These are, for example, the ball grid array (BGA), flip-chip technology (C4), chip-scale package (CSP) and/or multi-chip module (MCM) technologies [
4]. Health and environmental hazards connected with the use of lead are the reason that the development of high-temperature lead-free solders have become a serious issue at present. The use of lead-free braze fillers also applies to brazing, which is confirmed by authors [
5,
6,
7,
8]. Unfortunately, in the case of soldering, there are presently only a limited number of high-temperature, lead-free alloys that would be at least partially capable of replacing high-lead solders [
9].
The alternative alloy systems are, for example, hypo-eutectic Bi–Ag, Sb–Sn and Au–Sn alloys [
10,
11,
12]. The other alloy systems comprise the Zn–Al solders (alloyed with Mg, Ge, Ga, Sn and Bi), which have a promising future due to their low price. Zn–Al alloys were used for a long time as high-temperature solders for structural applications. These alloys have great potential from the commercial viewpoint, since zinc is even cheaper than Pb. Small additions of Mg and/or Ga to these alloys lower the melting point and form a ternary alloy, which preserves the desirable solidification criteria for soldering at higher application temperatures [
1,
13]. Zn–Al based alloys for the electronics industry have a suitable melting range, good electrical and thermal conductivity, and an acceptable price. They were, therefore, chosen by the authors [
14] as a basis for their alloy. They also added Mg and Ga, resulting in Zn4Al3Mg3Ga. Copper and silicon metallized with a Ti/Ni/Ag layer were used as the substrates. Soldering was performed at 370–400 °C in automatic equipment used for die attach technology. The ZnAlMgGa/Cu joints attained a shear strength from 21.8 to 29.4 MPa at soldering temperatures of 370–400 °C, which is a value comparable to the strength of Pb5Sn/Cu joints, namely 28.2 MPa [
14].
Rettenmayr et al. [
15] oriented to four alternative alloys (Zn6Al, Zn6Al1Ga, Zn3Al3Mg and Zn4Al3Ga3Mg) that could substitute for classical, high-lead alloys, and they studied their microstructure and mechanical properties. They found that the temperature dependence of Ga solubility in the hexagonal lattice (hcp) of zinc, in combination with Ga affinity with the surface of phases rich in Al and Zn, is the main reason for solder brittleness. This brittleness may be reduced by lowering the solubility at higher temperatures.
The addition of Sn to the Zn4Al3Mg alloy resulted in a tensile strength increase. Zn content was added to the alloy at 0, 6, 8 and 13.2 wt %. Sn addition also resulted in reduced yield point and solidus temperature [
16]. A similar solution, and addition of Sn, In and Ga elements to Zn4Al3Mg and Zn6Al5Ge alloys, was selected by Shmizu et al. [
17]. Similar to the previous case, no improvement in properties was observed.
Directly soldering SiC ceramics with ultrasound assistance was studied by Chen et al. [
18]. The SiC ceramic substrates were soldered in air using Zn8.5Al1Mg solder at 420 °C. The joint shear strength increased with prolonged ultrasound activation time. The highest strength (148.1 MPa) was achieved with ultrasound assistance for 8 s. A new amorphous layer, from 2 to 6 nm thick, was formed on the solder/substrate boundary. The atoms of the eroded SiO
2 layer from the SiC substrate surface diffuse quickly to the solder due to the jet effect generated by the ultrasound. The strong bond between SiC substrate and the Zn–Al–Mg solder is attributed to the transfer of SiO
2 mass to the Zn–Al–Mg solder by induced cavitation erosion.
Directly soldering sapphire (a crystalline form of Al
2O
3) with ultrasound and an application of Sn10Zn2Al solder was the subject of study of Cui et al. [
19]. The ultrasound supported the oxidation reaction between Al from the solder and sapphire substrate. A nanocrystalline α-Al
2O
3 (layer 2 nm in thickness) was formed on the Sn–Zn–Al/sapphire boundary during soldering in the air at 230 °C. This layer enabled bond formation.
Cui et al. [
20] also dealt with soldering sapphire using ultrasound assistance. Soldering was performed using Zn4Al solder. To lower the thermal expansivity coefficient of solder in the soldered joint, a composite SiCp/A356 interlayer was applied. The interlayer improved the shear strength of joints, even up to ~155 MPa, which represents an increase of ~250% compared to a joint where Zn–Al soldering alloy was used. The fracture morphology shows a strong bond between the Zn–Al alloy and sapphire with a mixed fracture mechanism shown in the shear test.
The aims of the presented research comprised analyzing soldering alloy type Zn5Al–Mg. The Zn, Al and Mg elements in the solder were selected because all three of them are active elements with a strong chemical affinity to oxygen. The preferred composition is Zn5Al3Mg. The composition of ZnAl5Mg3 solder corresponds approximately to a eutectic point [
21]. In the point of eutectic transformation, it is valid that the solder transfers from the solid state immediately to a liquid state. However, if the solder would not be eutectic or close-to-eutectic, it would occur in the two-phase region with a certain proportion of solid phase. Thus, it would not exert sufficient viscosity [
21].
The compositions were selected to be suitable for soldering the AlN ceramics and copper substrate at the defined conditions. To improve the wettability of ceramic material with Zn–Al–Mg solder, soldering with ultrasound assistance was employed. The research thus consisted of the study of solder proper and the interactions at the solder/substrate boundary.
2. Experimental
The preparation of experimental Zn–Al–Mg-Based soldering alloys consisted of a determination of weight proportions of individual weighing components and the proper manufacture of solder in an as-cast condition. The individual weighed components were of 4N purity in the form of zinc granules, 10 mm in diameter and 3 mm in thickness, and the aluminum granules 6 mm in diameter and 8 mm in thickness. Solder fabrication was realized in a vacuum oven. The procedure was as follows. Weighted amounts of alloy components were loaded into a graphite load with a 50 mm diameter siliceous glass tube. The tube was inserted into a horizontal vacuum resistance oven, so that the boat was in the heated zone. If needed, the tube could be washed with Ar, thanks to an inlet flange at its beginning and an outlet at its end. Due to significant evaporation, it was more suitable to prepare the filler metal in Ar. Magnesium was supplied in solid state in the form of pellets. It is delivered in shielding atmosphere. After taking out from the package it was wrapped with a zinc foil, and in such a combination it was dipped to a zinc melt with the temperature of 800 °C. Several metals have good solubility in the base matrix. The dissolving and homogenization of filler alloy components lasted approximately 1 h, while the melt was freely cooled down under Ar shielding. Solder alloy was remelted in a graphite crucible, thoroughly stirred and cast into a graphite mold. The soldering alloys were manufactured in the as-cast condition in the form of plates in dimensions of 100 mm × 40 mm × 4 mm.
The experimentally prepared composition of soldering alloys is given in
Table 1. The chemical analysis of alloys was performed using atomic emission spectrometry with induction coupled plasma (ICP-AES). The analysis was performed on a SPECTRO VISION EOP. The alloy samples ICP-AES analysis were dissolved in suitable acid and base solutions. The analysis proper was performed on an emission atomic spectrometer with a pneumatic atomizer and Scott’s atomizing chamber.
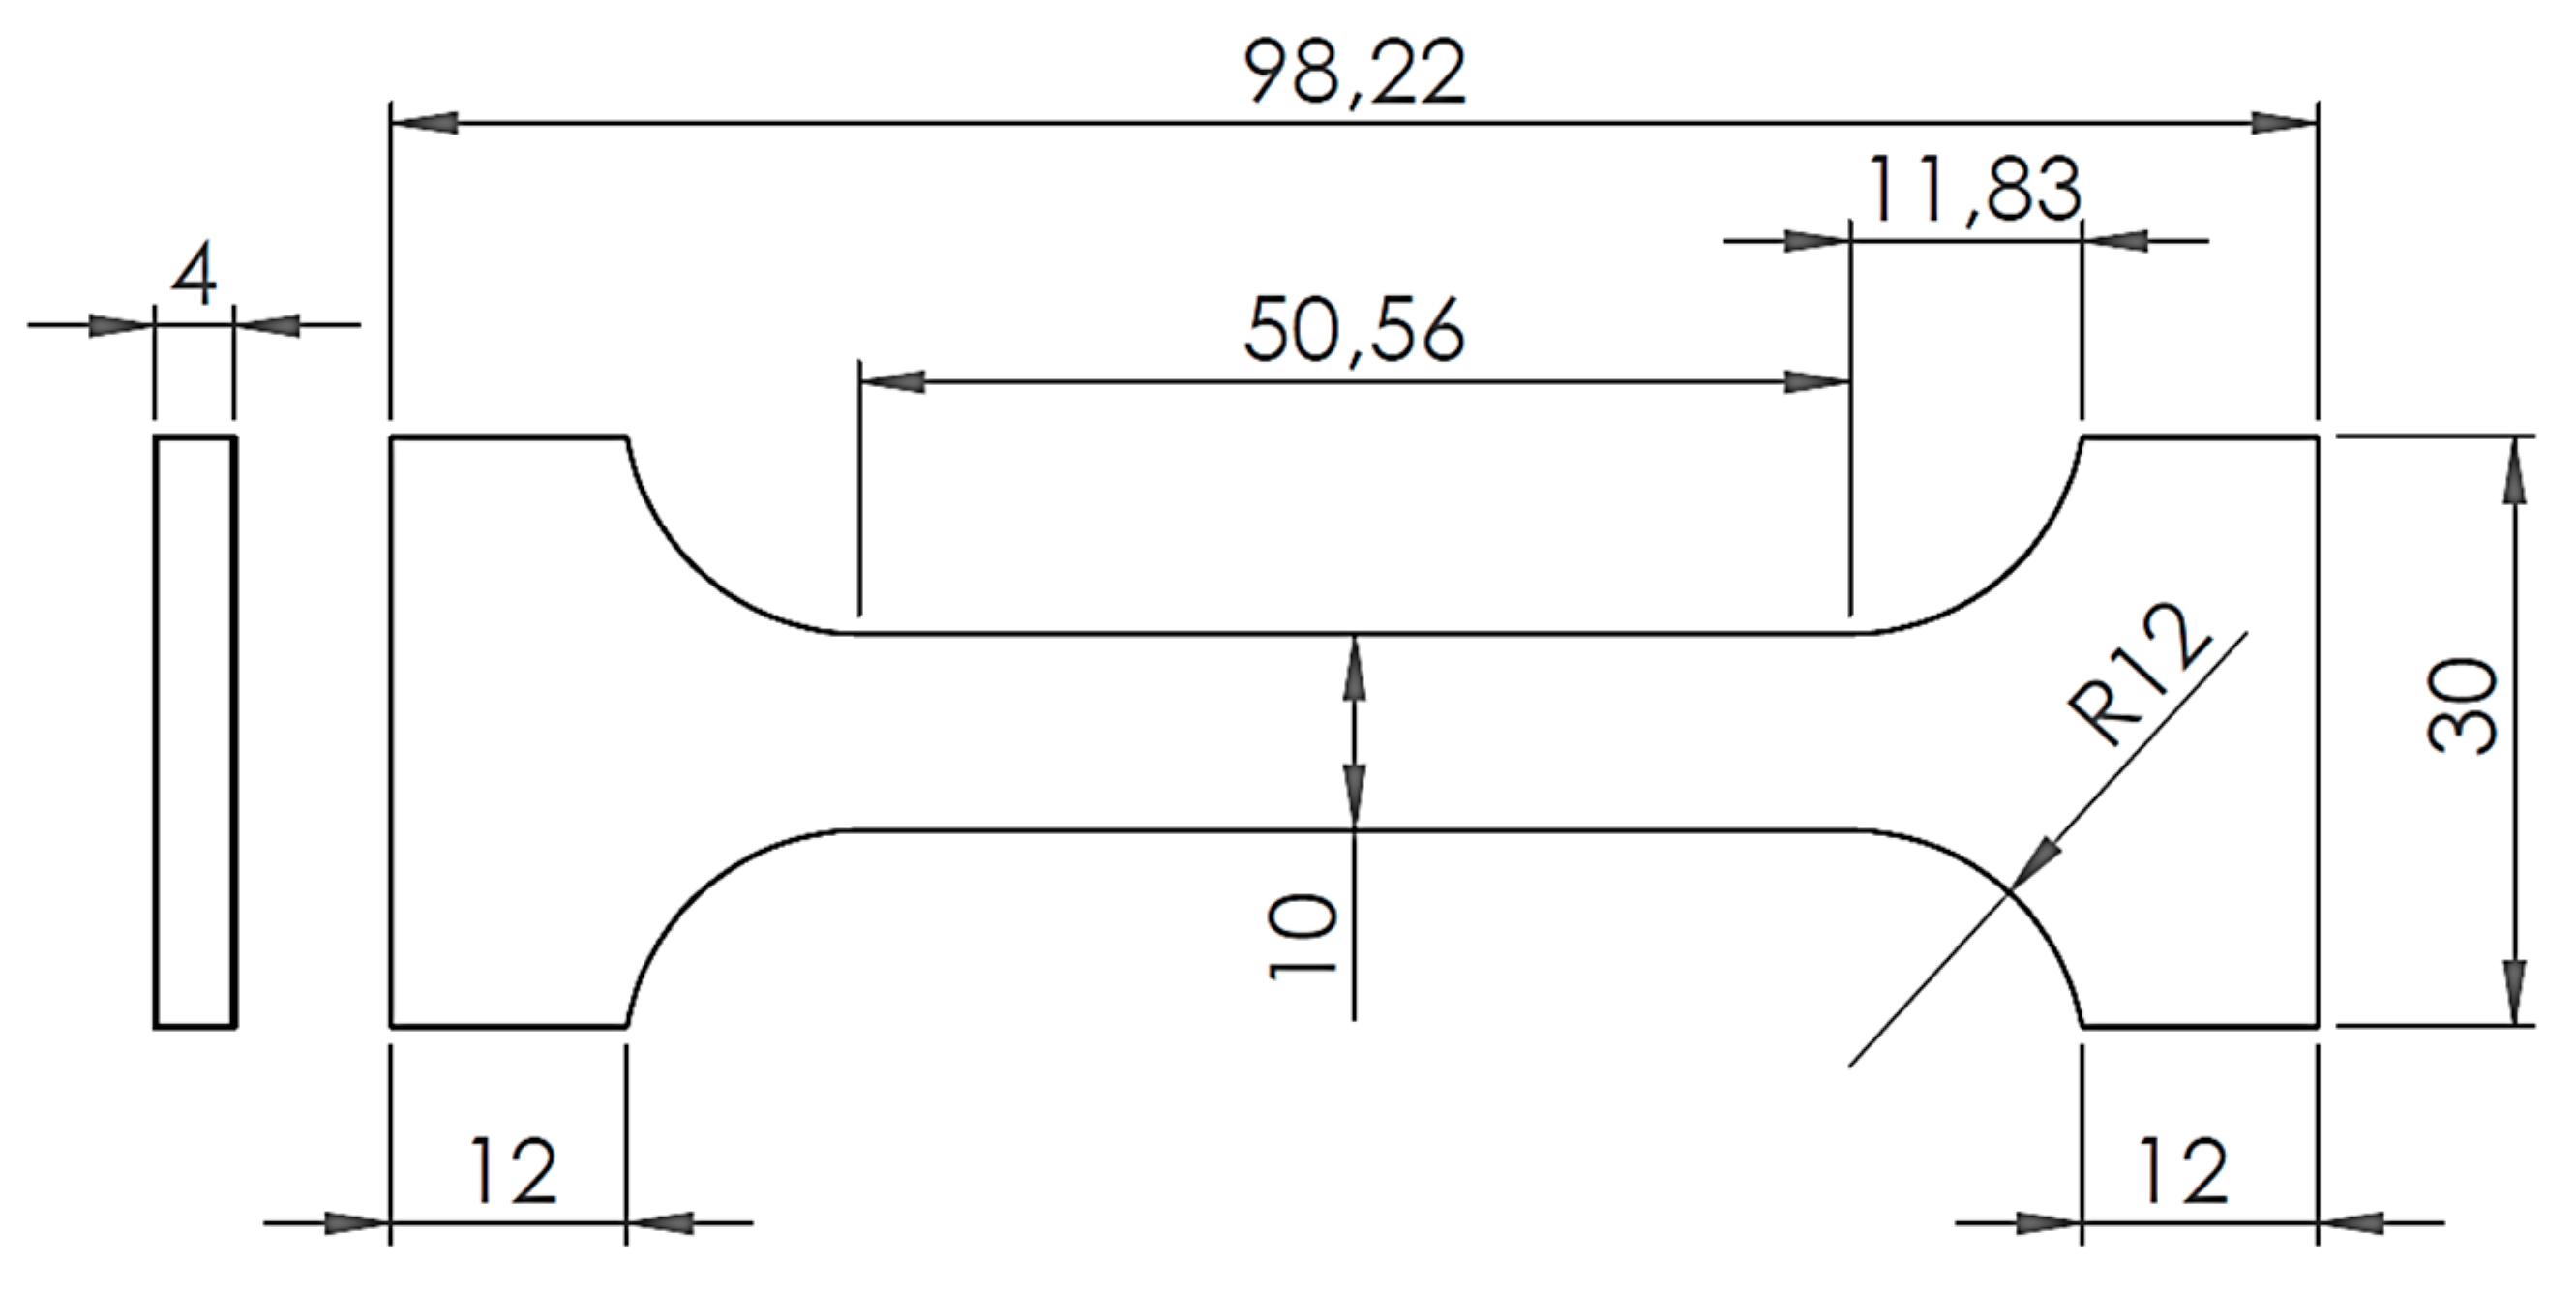
Test pieces for the tensile test were subsequently prepared from these alloys (
Figure 1). The dimensions given in
Figure 1 are in mm. The pieces for tensile tests were prepared by water beam cutting from the cast plates in dimensions of 100 mm × 40 mm × 4 mm.
Substrates of the following materials were used in experiments:
AlN ceramic substrate from Flocculus Ltd. (Libina, Czech Republic) in the form of discs Ø 15 × 3 mm. The purity of this AlN substrate was 3 N, and it exerted a hexagonal crystalline structure of wurtzite type.
Al2O3 ceramic substrate from the Flocculus Ltd. (Libina, Czech Republic) in the form of discs Ø 15 mm × 3 mm with 3N purity,
SiC ceramic substrate (namely SiSiC-infiltrated silicon carbide) from the CeramTec Ltd. (Šumperk, Czech Republic) in the form of discs Ø 15 mm × 3 mm,
4N purity metallic Cu substrate in the shape of discs with dimensions Ø 15 mm × 2 mm and in the shape of square in dimension 10 mm × 10 mm × 3 mm.
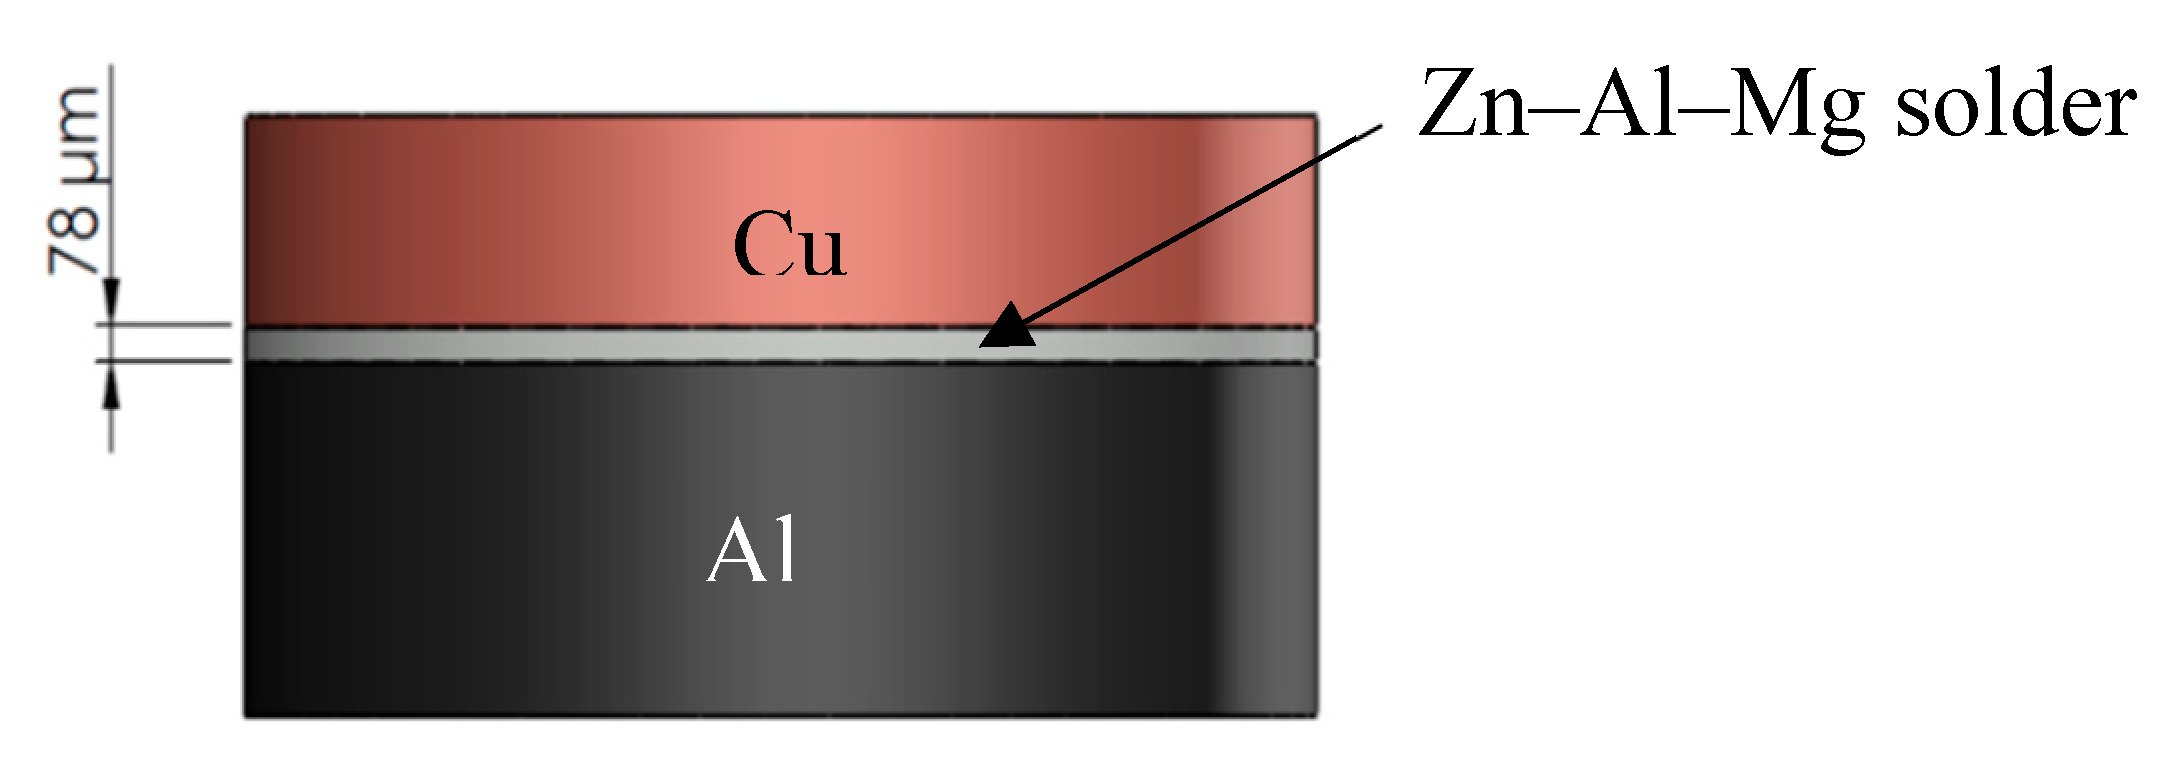
The soldered joint scheme is shown in
Figure 2.
Solder joints Cu/Cu, AlN/Cu, SiC/Cu and Al
2O
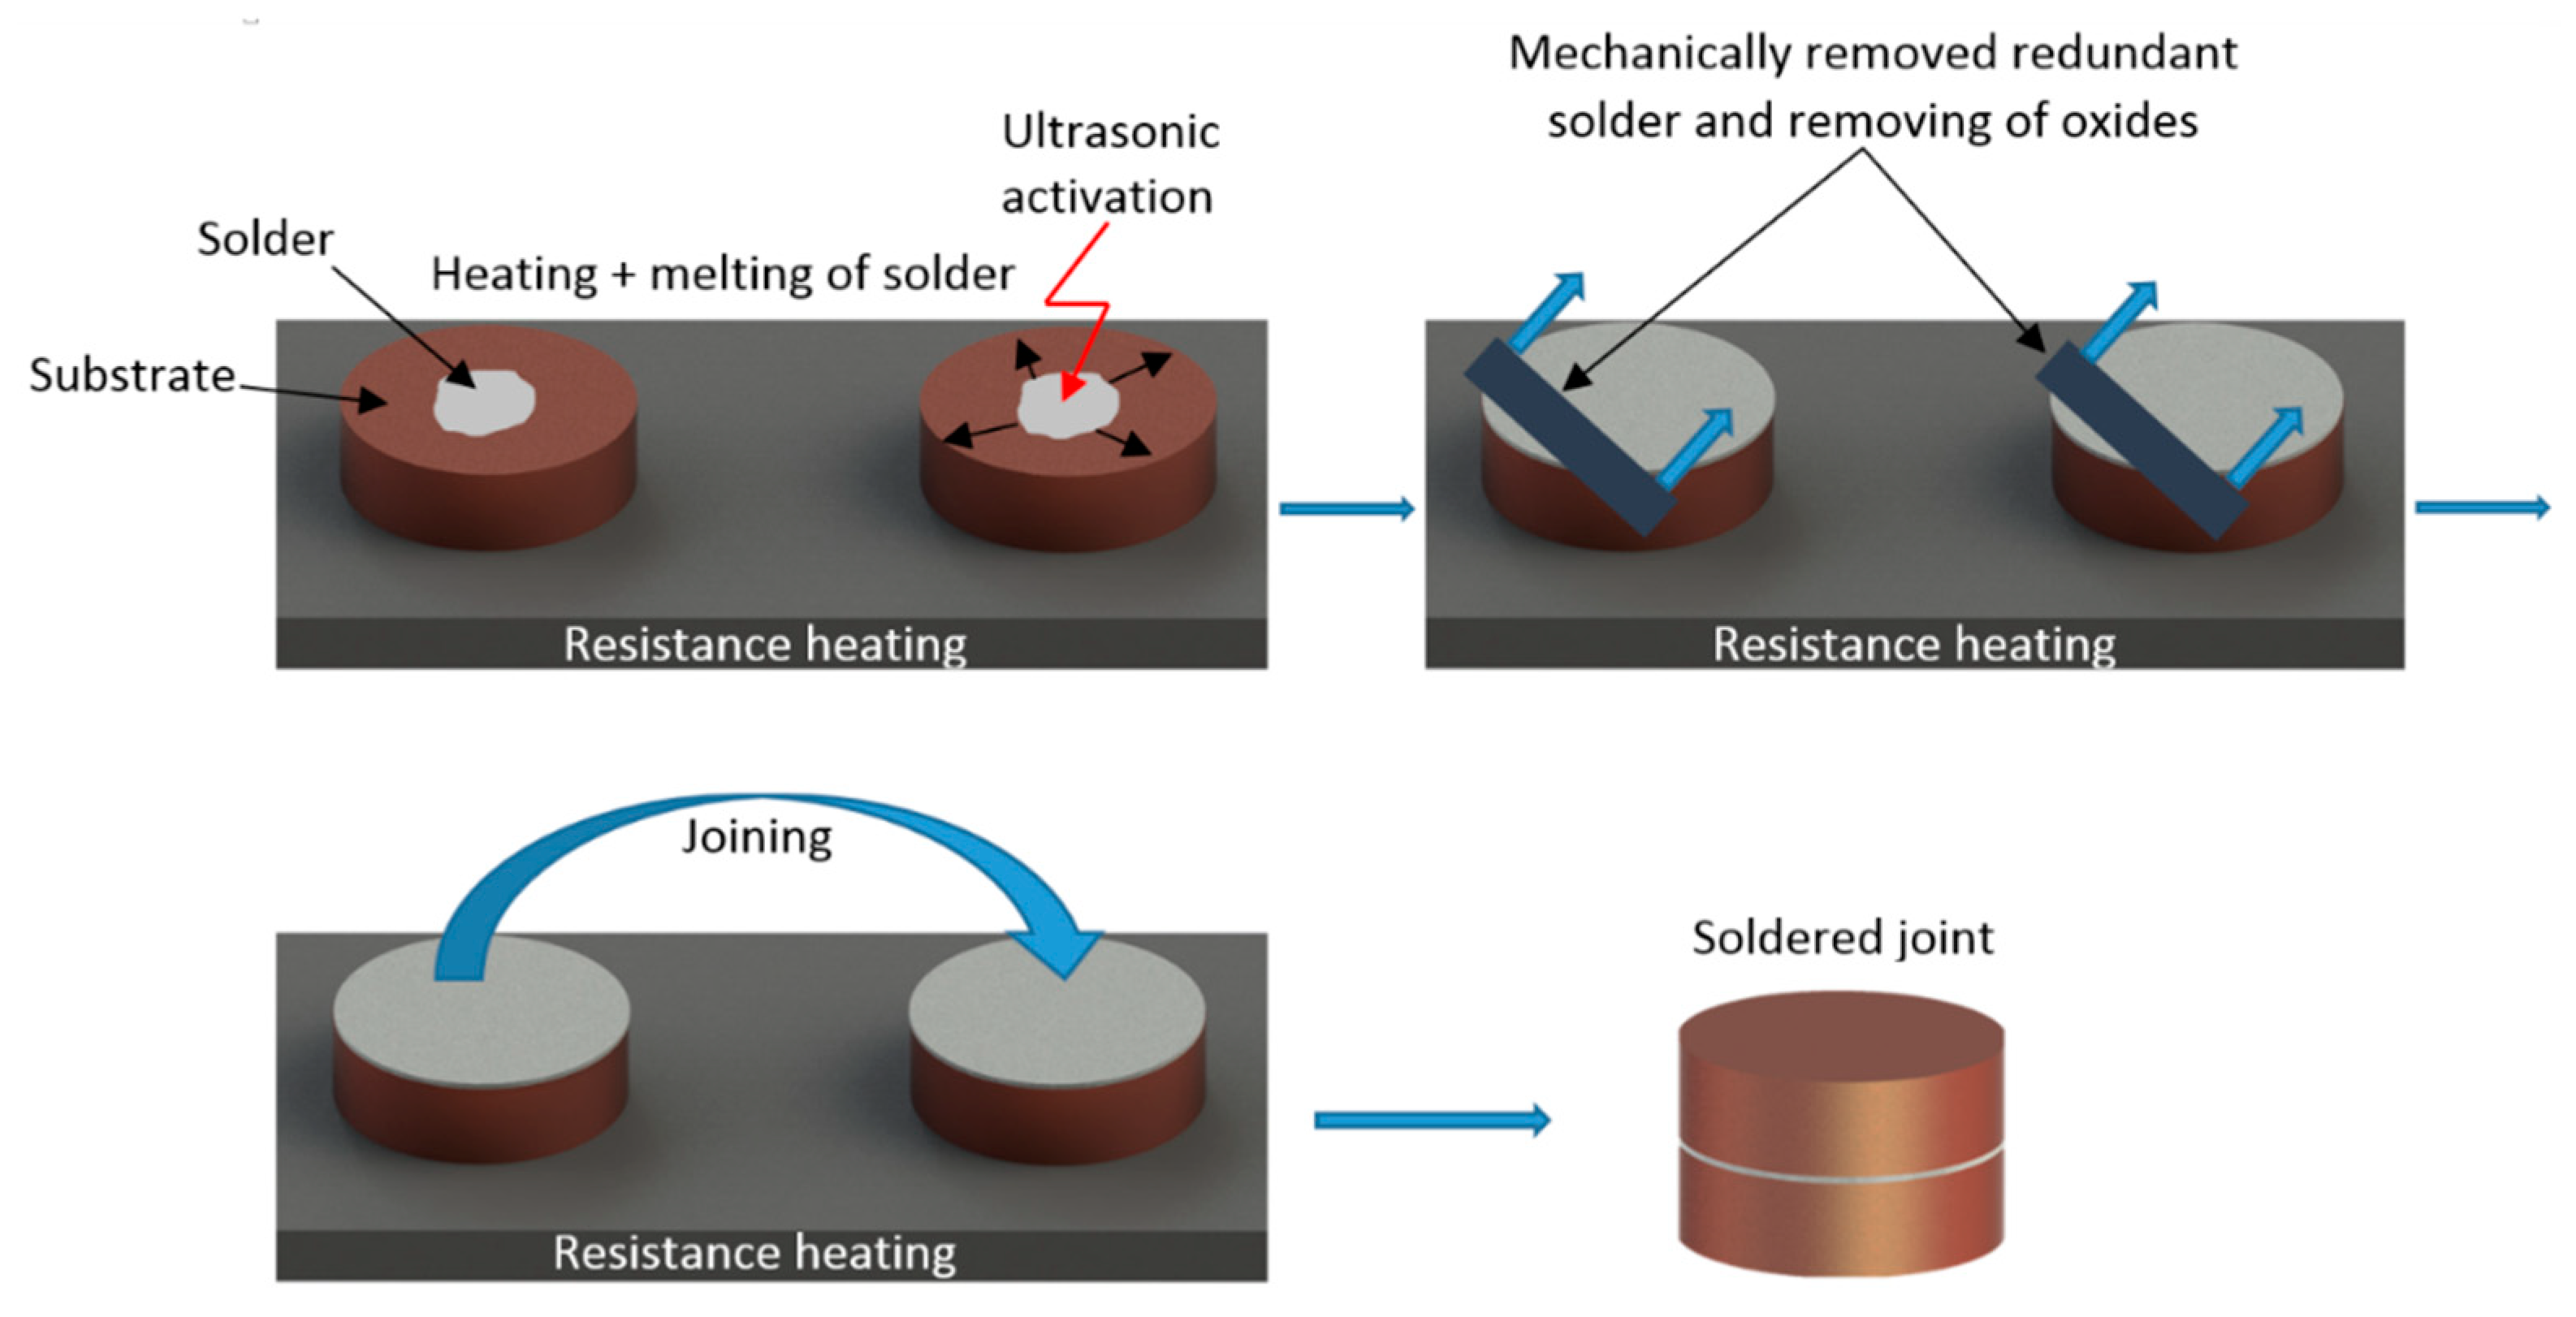
3/Cu were fabricated using the hot plate. The temperature was controlled with the thermostatic heat control regulator. The AlN ceramic was laid on this hot plate and filler metal in the form of a cube in the dimension of 4 mm × 4 mm, heated to soldering temperature, was deposited onto it. A flux-less soldering process using Hanuz UT2 type ultrasonic equipment was performed. The parameters of the soldering process are given in
Table 2. Filler metal was activated via an ultrasonic transducer with a piezoelectric oscillating system and a titanium sonotrode with a Ø 3 mm end tip. Sufficient viscosity of solder occurs in the case, when the solder does not contain any proportion of solid phase. In accordance with the STN 050,040 Standard—Soldering and brazing. Soldering and brazing of metals. Basic terms—The optimum level of soldering temperature varies approximately from 20 to 50 °C above the liquidus temperature of the solder. The melting point of the solder was 354 to 356 °C. The temperature of soldering was measured by a NiCr/NiSi thermocouple. The ultrasonic power acting time was 5 s. The oxide layer on the surface of the liquid filler metal was then removed. A similar procedure was realized with Cu substrate. Subsequently, both substrates with liquid filler were put onto each other, and thus, the solder joint was created. This process is illustrated in
Figure 3.
Metallographic preparation of specimens from soldered joints was realized by standard metallographic procedures used for specimen preparation. Grinding was performed using SiC emery papers with 240, 320 and 1200 grains/cm2 granularity. Polishing was performed with diamond suspensions with 9, 6 and 3 μm grain sizes. The final polishing was performed using a type OP-S (Struers) polishing emulsion with 0.2 μm granularity.
The solder microstructure was studied using scanning electron microscopy (SEM) on TESCAN VEGA 3 (Tescan orsay holding, Brno, Czech Republic) and JEOL 7600 F (JEOL Ltd., Tokyo, Japan) with X-ray micro-analyzer type Microspec WDX-3PC microscopes (Microspec Corporation, Peterborough, NH, USA) for performing qualitative and semi-quantitative chemical analyses.
X-ray diffraction (XRD) analysis was performed to identify the solder phase composition. This analysis was done on a 10 × 10 mm solder sample using a PANalytical X’Pert PRO XRD diffractometer (Malvern Panalytical LtD., Malvern, UK).
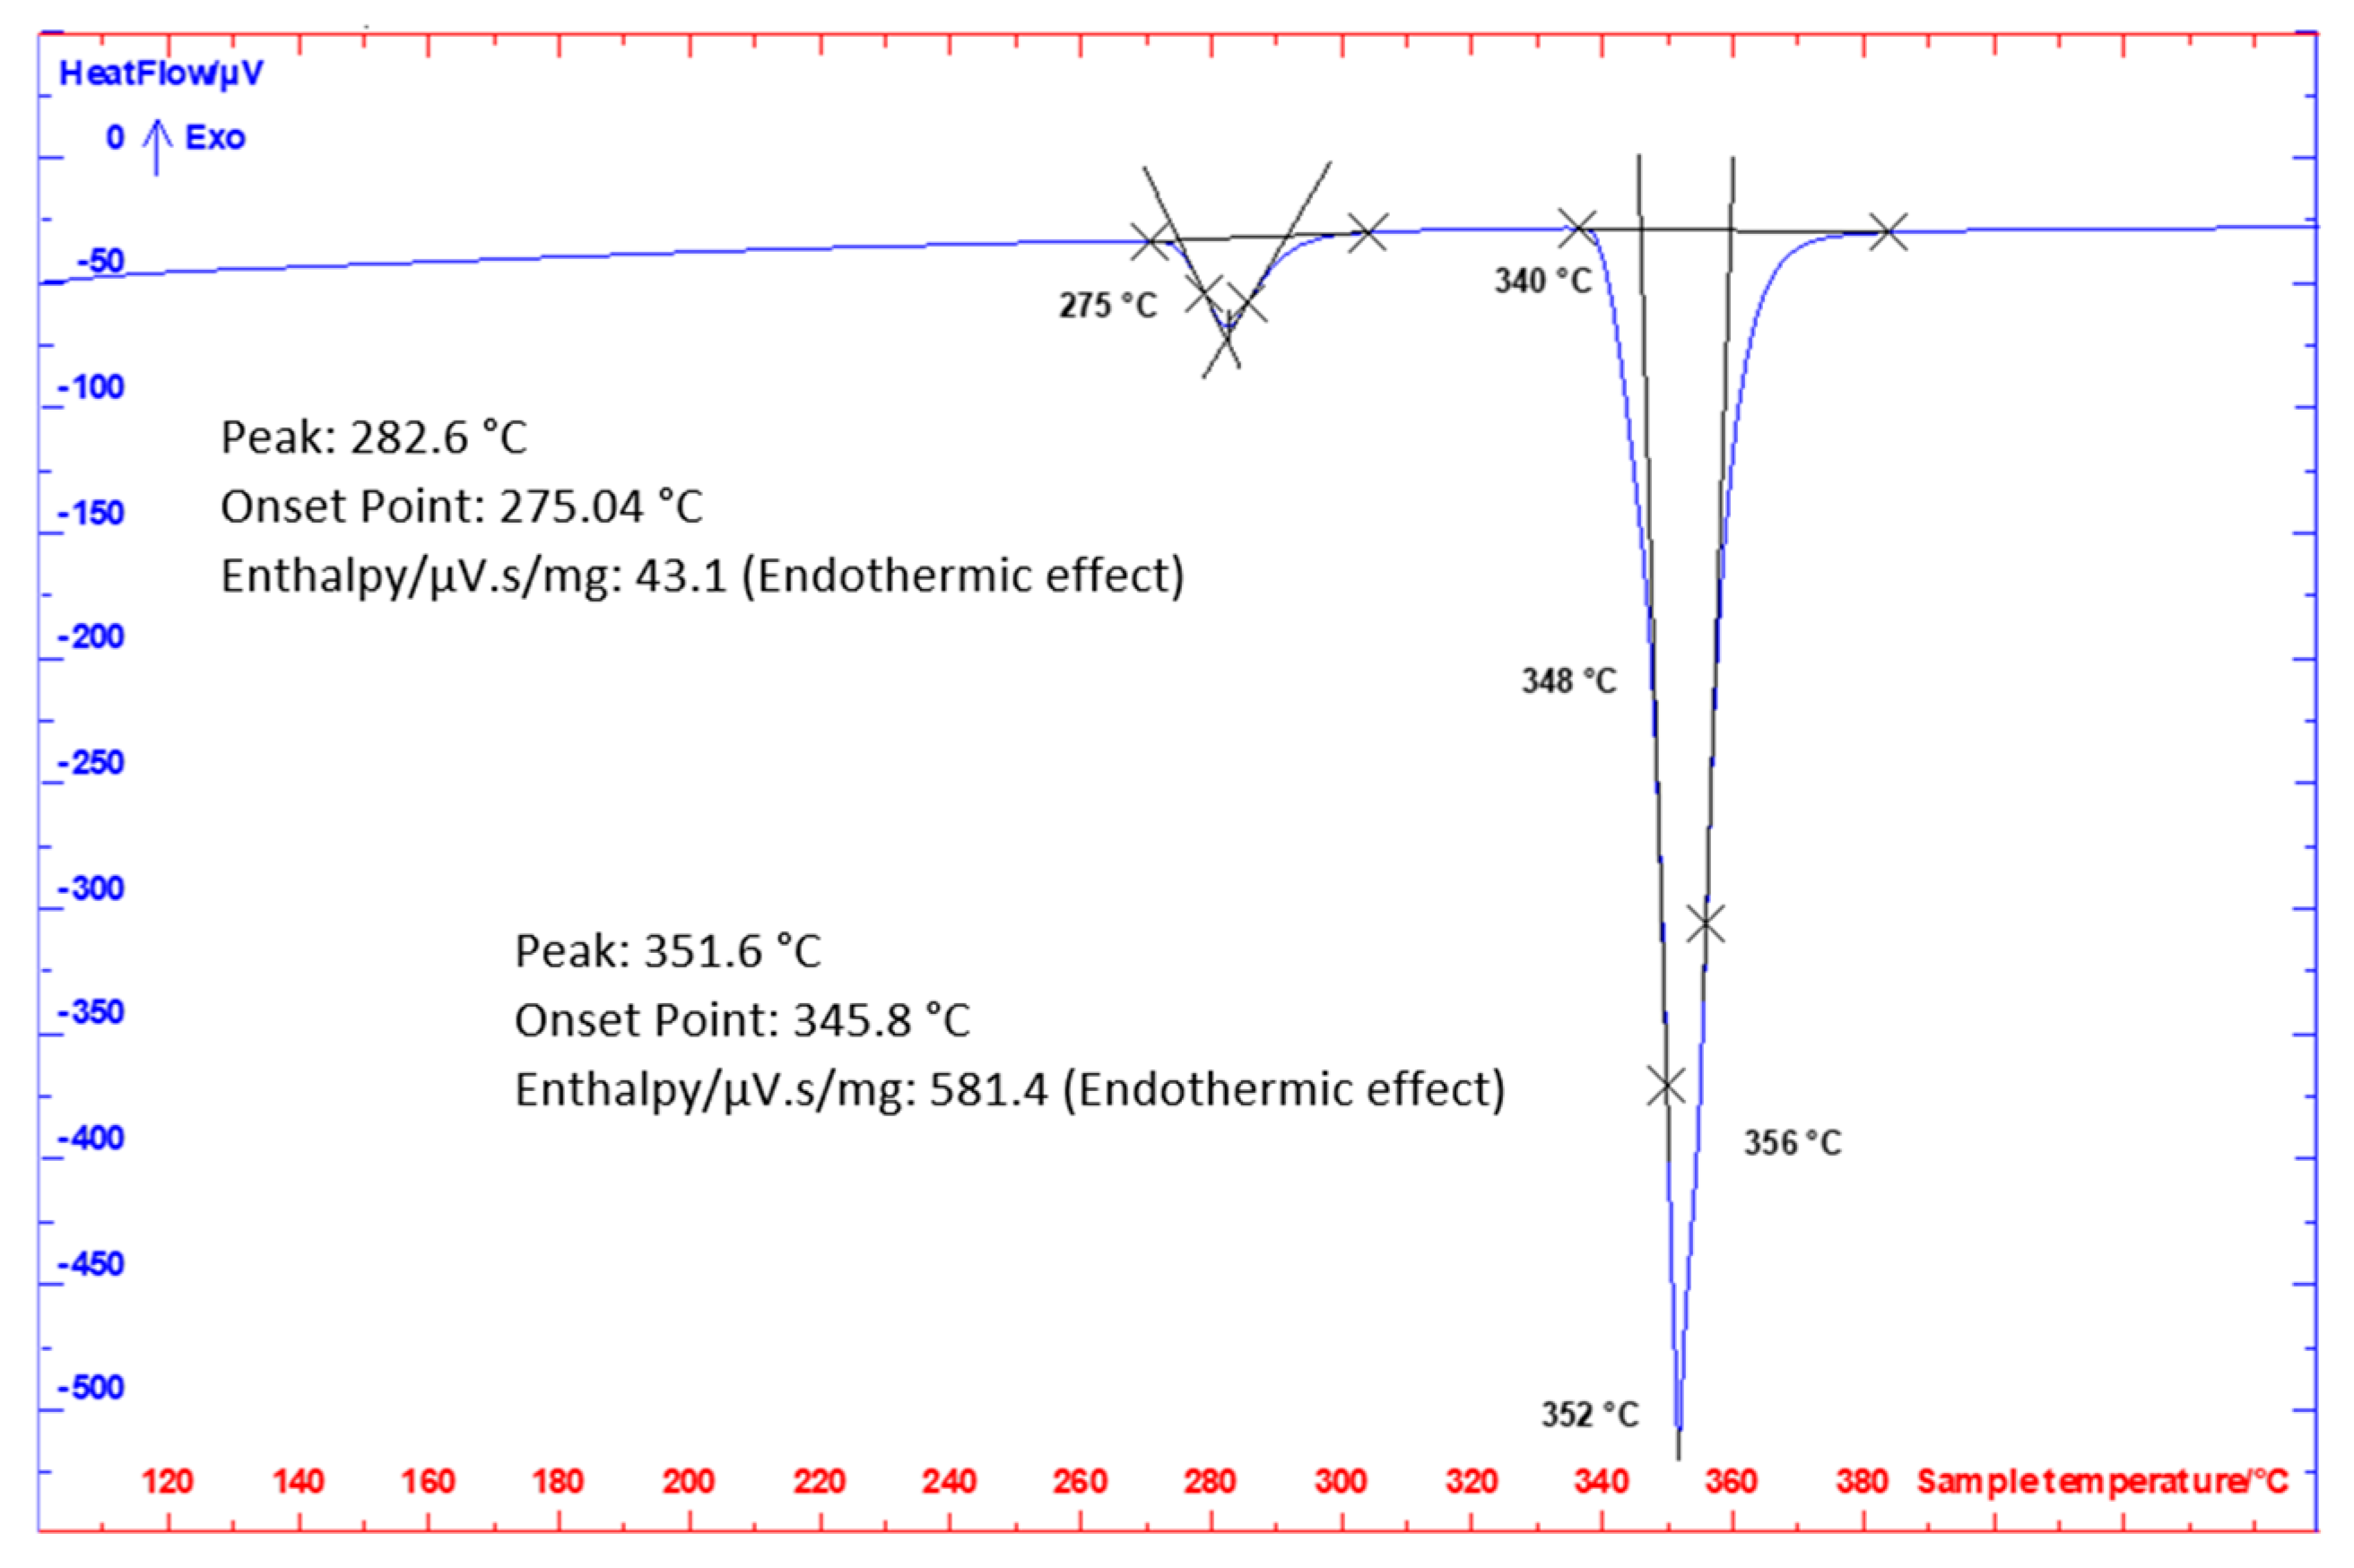
The differential scanning calorimetry (DSC) analysis was performed on a Setaram SETSYS 18TM with a DSC sensor type E (SETARAM Instrumentation LtD., Caluire, France). The alloy specimen analyses were performed in corundum crucibles with lids in an inert Ar atmosphere (6 N). The heating and cooling rate was 5 °C/min. The weight of analyzed specimens was 100–120 mg. The specimens were ground and cleaned in acetone with simultaneous ultrasound action prior to analysis. Prior to analysis, the inner oven space was washed with Ar (6 N). The space around the specimen was vacuum pumped and then filled with Ar, while a constant dynamic atmosphere of Ar (6 N, 2 l/h) was maintained around the specimen during the entire analysis.
Shear tests were subsequently performed for determining mechanical properties.
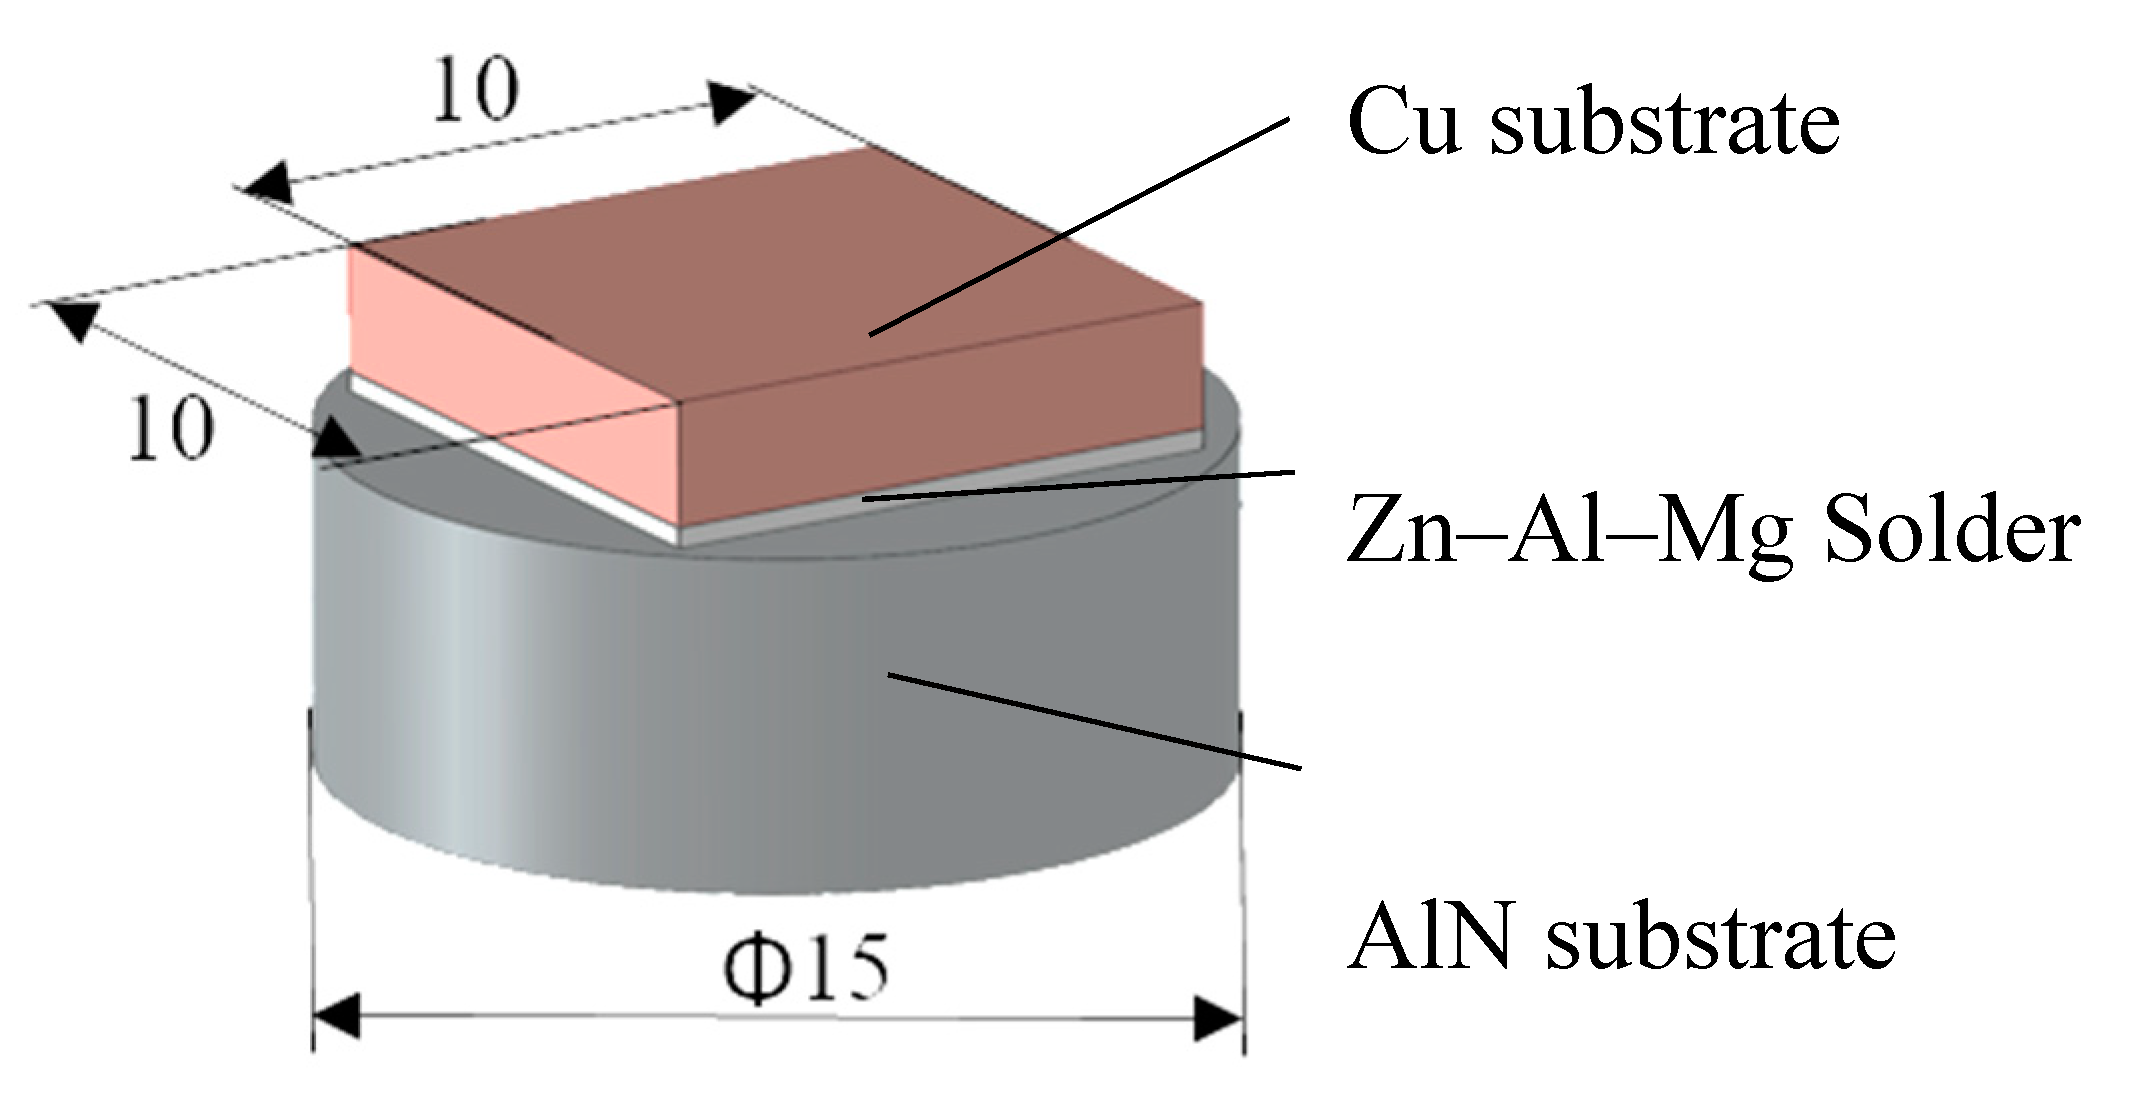
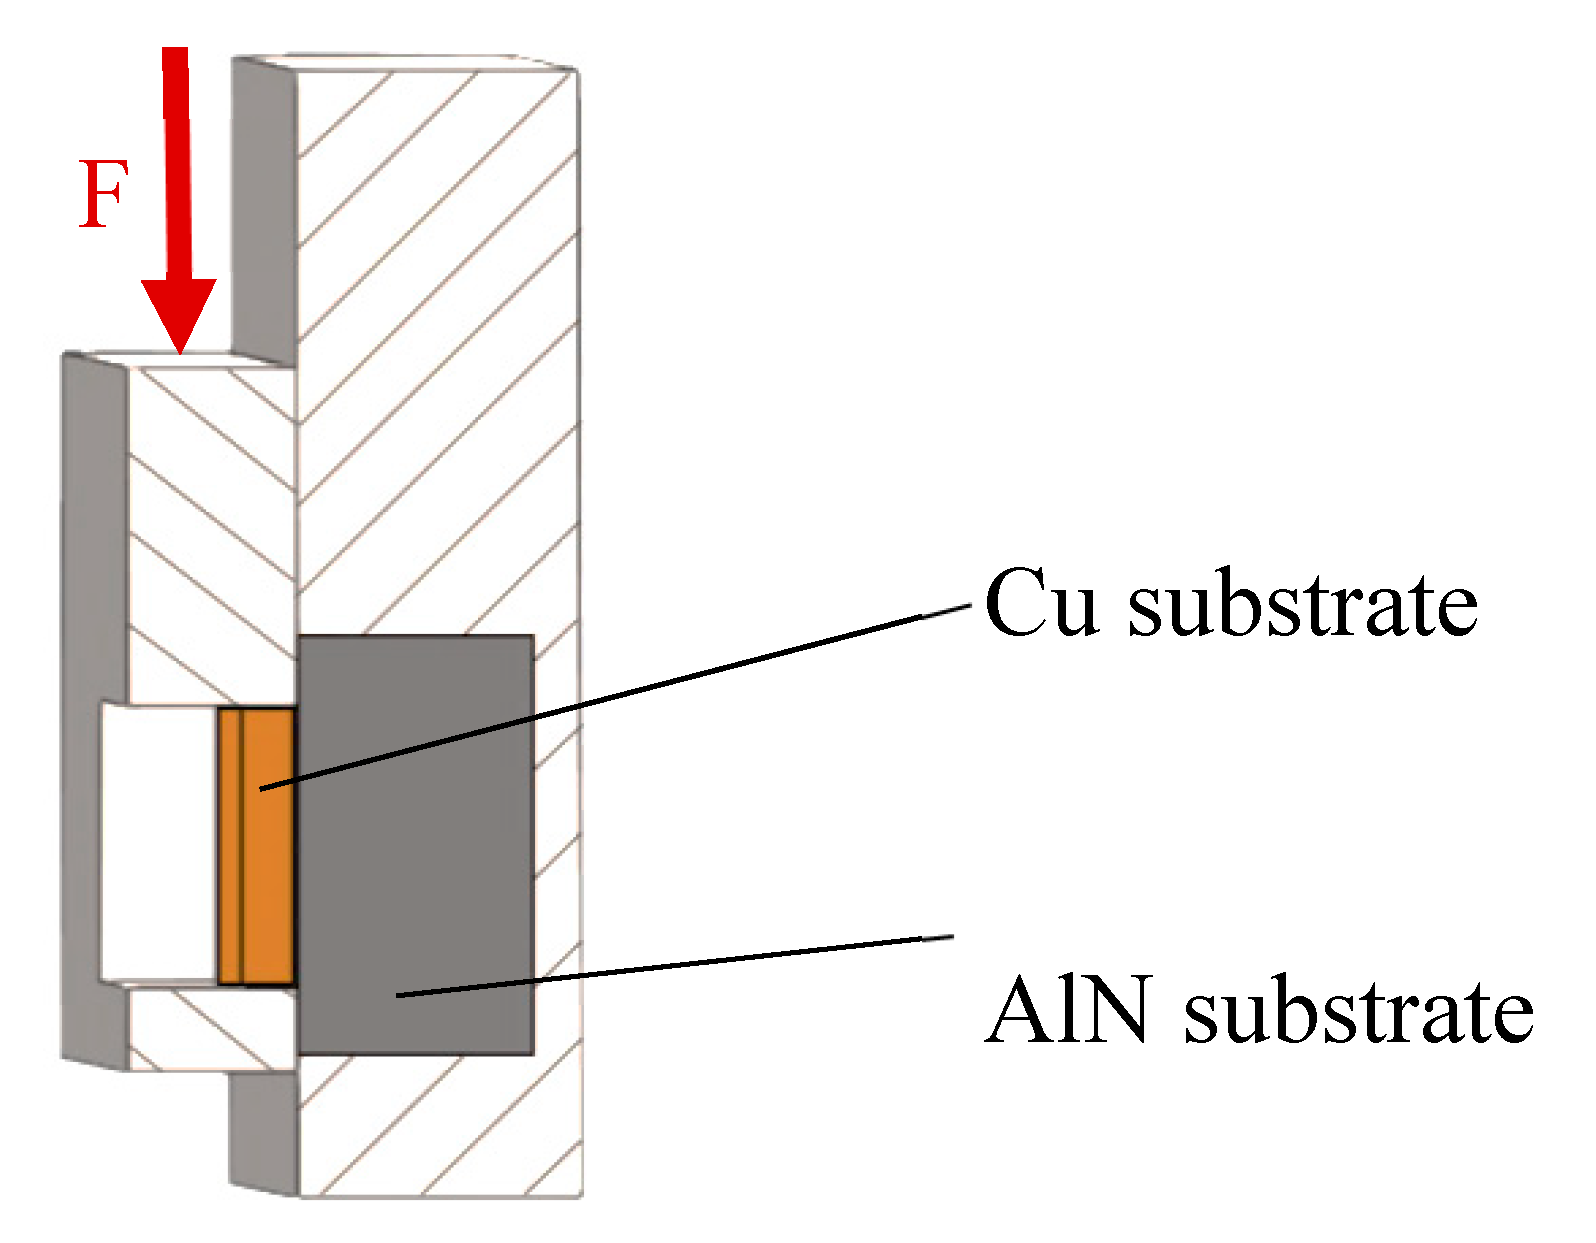
A schematic representation of a shear test specimen is shown in
Figure 4. The shear strength was determined on a versatile tearing machine, LabTest 5.250SP1-VM (Labortech Ltd., Praque, Czech Republic). For changing the direction of the loading force acting upon the test specimen, a jig with a defined test specimen shape was used (
Figure 5). This shearing jig ensures a uniform shear loading in the solder/substrate boundary plane.
Author Contributions
Supervision, R.K.; Investigation, I.K.; Formal analysis, J.D. and P.Z.; Data curation, M.K. All authors have read and agreed to the published version of the manuscript.
Funding
This research was funded by Slovak Research and Development Agency under contract no. APVV-17-0025; Slovak Scientific Grant Agency VEGA under contract no. VEGA 1/0303/20; and Project 1393 – Soldering - Excellent teams.
Acknowledgments
The paper was also prepared in cooperation with the VSB-Technical University of Ostrava, FMT-Faculty of Materials Science and Technology, Department of Non-ferrous Metals, Refining and Recycling.
Conflicts of Interest
The authors declare no conflict of interest.
References
- Suganuma, K.; Kim, S.J.; Kim, K.S. High-Tepmerature Lead-Free Solders: Properties and Possibilities. JOM 2009, 61, 64–71. [Google Scholar] [CrossRef]
- Chidambaram, V.; Hattel, J.; Hald, J. Design of lead-free candidate alloys for high-temperature soldering based on the Au–Sn system. Mater. Des. 2010, 31, 4638–4645. [Google Scholar] [CrossRef]
- Watson, J.; Castro, G. High-Temperature Electronics Pose Design and Reliability Challenges. Analog Dialogue 2012, 46, 3–9. [Google Scholar]
- Kim, J.H.; Jeong, S.W.; Lee, H.M. Thermodynamics aided alloy design and evaluation of Pb-free solders for high-temperature applications. Mater. Trans. 2002, 43, 1873–1878. [Google Scholar] [CrossRef][Green Version]
- Mician, M.; Konar, R. Repairs of damaged castings made of graphitic cast iron by means of brazing. Arch. Foundry Eng. 2017, 17, 91–96. [Google Scholar] [CrossRef]
- Bobzin, K.; Schlafer, T.; Kopp, N. Thermochemistry of brazing ceramics and metals in air. Int. J. Mater. Res. 2011, 102, 972–976. [Google Scholar] [CrossRef]
- Zhao, Y.X.; Wang, M.R.; Cao, J.; Song, X.G.; Tang, D.Y.; Feng, J.C. Brazing TC4 alloy to Si3N4 ceramic using nano-Si3N4 reinforced AgCu composite filler. Mater. Des. 2015, 76, 40–46. [Google Scholar] [CrossRef]
- Hong, L.; Xuan, L.; Haixin, H. Microstructure and properties of ZrO2 ceramic and Ti-6Al-4V alloy vacuum brazed by Ti-28Ni filler metal. Weld. Technol. Rev. 2019, 91, 35–41. [Google Scholar] [CrossRef]
- Chidambaram, V.; Hald, J.; Hattel, J. Development of Au-Ge based candidate alloys as an alternative to high-lead content solders. J. Alloys Compd. 2010, 490, 170–179. [Google Scholar] [CrossRef]
- Kroupa, A.; Andersson, D.; Hoo, N.; Pearce, J.; Watson, A.; Dinsdale, A.; Mucklejohn, S. Current Problems and Possible Solutions in High-Temperature Lead-Free Soldering. J. Mater. Eng. Perform. 2011, 21, 629–637. [Google Scholar] [CrossRef]
- Rettenmayr, M.; Lambracht, P.; Kempf, B.; Graff, M. High melting Pb-free solder for die-attach applications. J. Adv. Eng. Mater. 2005, 7, 965–969. [Google Scholar] [CrossRef]
- Hodúlová, E.; Li, H.; Šimeková, B.; Kovaříková, I. Structural analysis of SAC solder with Bi addition. Weld. World 2018, 62, 1311–1322. [Google Scholar] [CrossRef]
- Cay, F.; Kurnaz, S.C. Hot tensile and fatigue of zinc-aluminium alloys produced by gravity and squeeze casting. Mater. Des. 2005, 26, 479–485. [Google Scholar] [CrossRef]
- Haque, A.; Lim, B.H.; Haseeb, A.S.M.A.; Masjuki, H.H. Die attach properties of Zn-Al-Mg-Ga based high-temperature lead-free solder on Cu lead-frame. J. Mater. Sci. Mater. Electron. 2012, 23, 115–123. [Google Scholar] [CrossRef]
- Rettenmayr, M.; Lambracht, P.; Kempf, B.; Tschudin, C. Zn-Al based alloys as Pb-free solders for die attach. J. Electron. Mater. 2002, 31, 278–285. [Google Scholar] [CrossRef]
- Cheng, F.; Gao, F.; Wang, Y.; Wu, Y.; Ma, Z.; Yang, J. Sn addition on the tensile properties of high temperature Zn-4Al-3Mg solder alloys. Microelectron. Reliab. 2012, 52, 579–584. [Google Scholar] [CrossRef]
- Shimizu, T.; Ishikawa, H.; Ohnuma, I.; Ishida, K. Zn-Al-Mg-Ga Alloys as Pb-Free Solder for Die-Attaching Use. J. Electron. Mater. 1999, 28, 1172–1175. [Google Scholar] [CrossRef]
- Chen, X.; Yan, J.; Ren, S.; Wang, Q.; Wei, J.; Fan, G. Microstructure, mechanical properties, and bonding mechanism of ultrasonic-assisted brazed joints of SiC ceramics with ZnAlMg filler metals in air. Ceram. Int. 2014, 40, 683–689. [Google Scholar] [CrossRef]
- Cui, W.; Yan, J.; Dai, Y.; Li, D. Building a nano-crystalline α-alumina layer at a liquid metal/sapphire interface by ultrasound. Ultrason. Sonochem. 2015, 22, 108–112. [Google Scholar] [CrossRef]
- Cui, W.; Li, S.; Yan, J.; Zhang, X. Microstructure and mechanical performance of composite joints of sapphire by ultrasonic-assisted brazing. J. Mater. Process. Technol. 2018, 257, 1–6. [Google Scholar] [CrossRef]
- Binary Alloy Phase Diagrams; ASM International: Materials Park, OH, USA, 2000.
- Kartavykh, A.V.; Tcherdyntsev, V.V.; Zollinger, J. TiAl–Nb melt interaction with AlN refractory crucibles. Mater. Chem. Phys. 2009, 116, 300–304. [Google Scholar] [CrossRef]
Figure 1.
Test piece of solder for static tensile test. Unit: mm.
Figure 2.
The fit-up of soldered joints.
Figure 3.
Schematic representation of the soldering process with ultrasound assistance.
Figure 4.
Specimen for shear testing the Cu/Zn–Al–Mg/AlN joint. Unit: mm.
Figure 5.
Scheme of shear strength measurement.
Figure 6.
The differential scanning calorimetry (DSC) record for Zn5Al3Mg alloy, heating rate 5 °C/min.
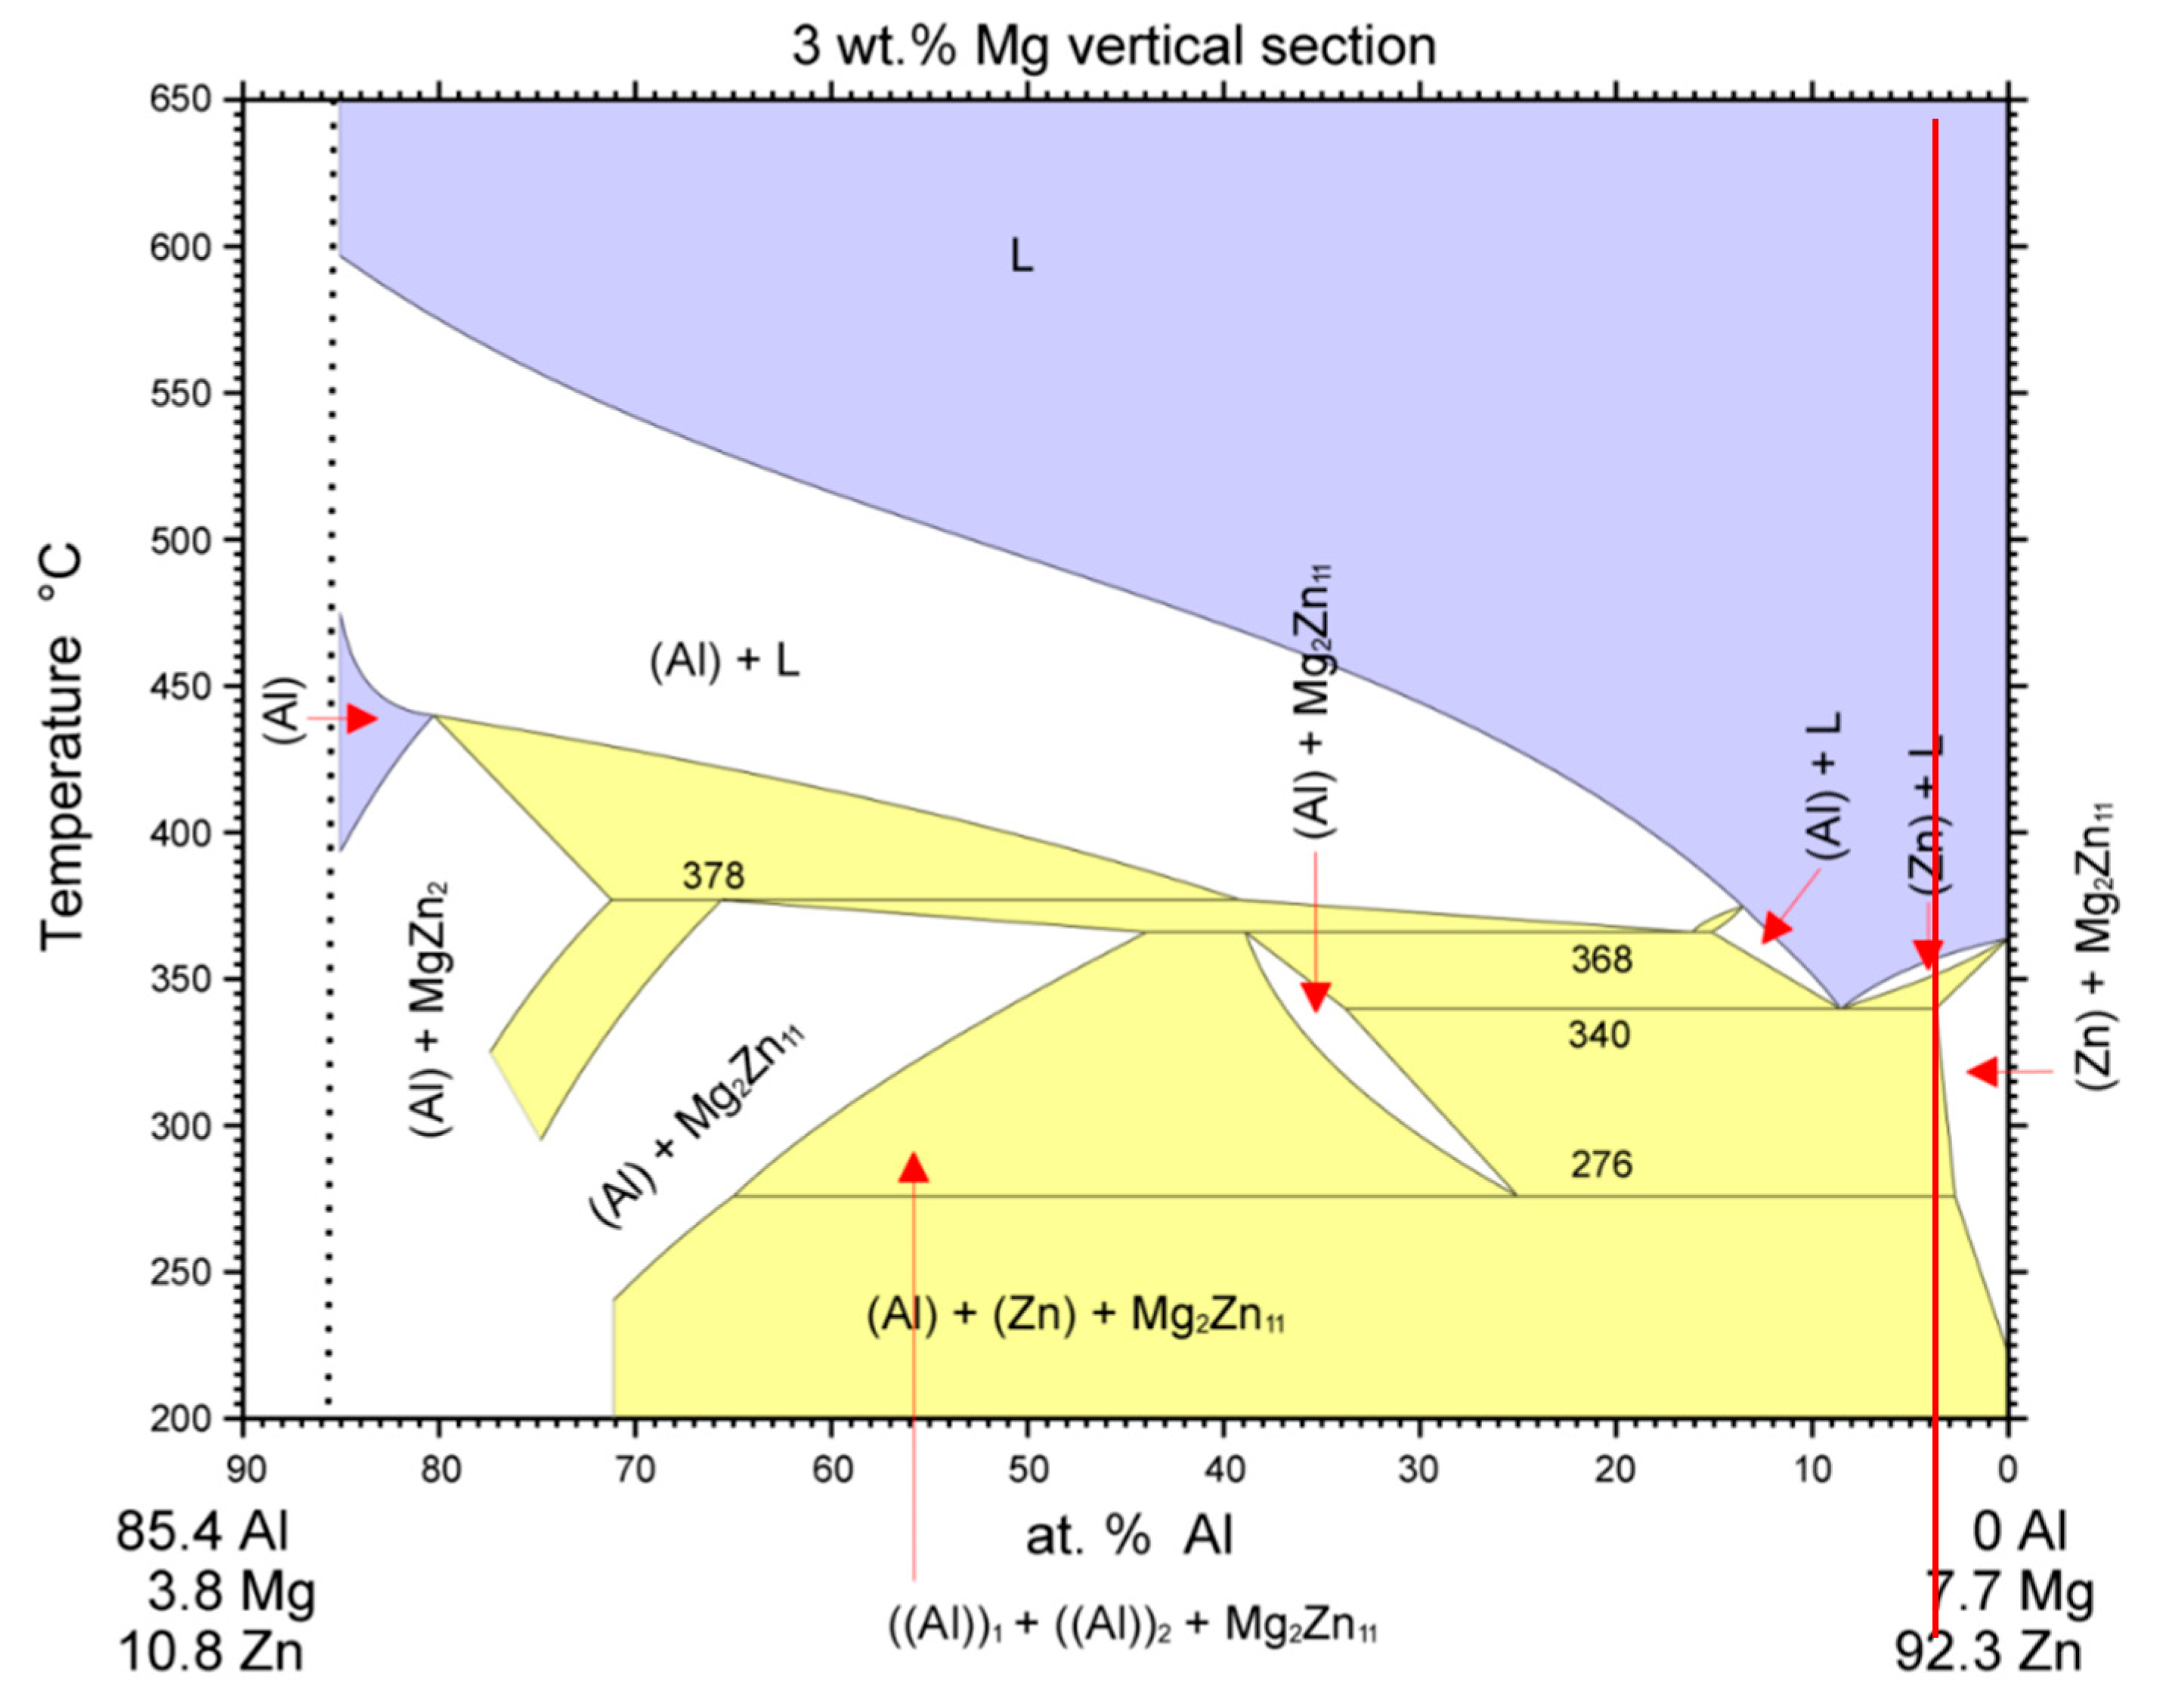
Figure 7.
Isopletic cross-section through the ternary system of Al–Mg–Zn for 3 wt % Mg [
22]. The red line shows the concentration of Zn5Al3Mg solder.
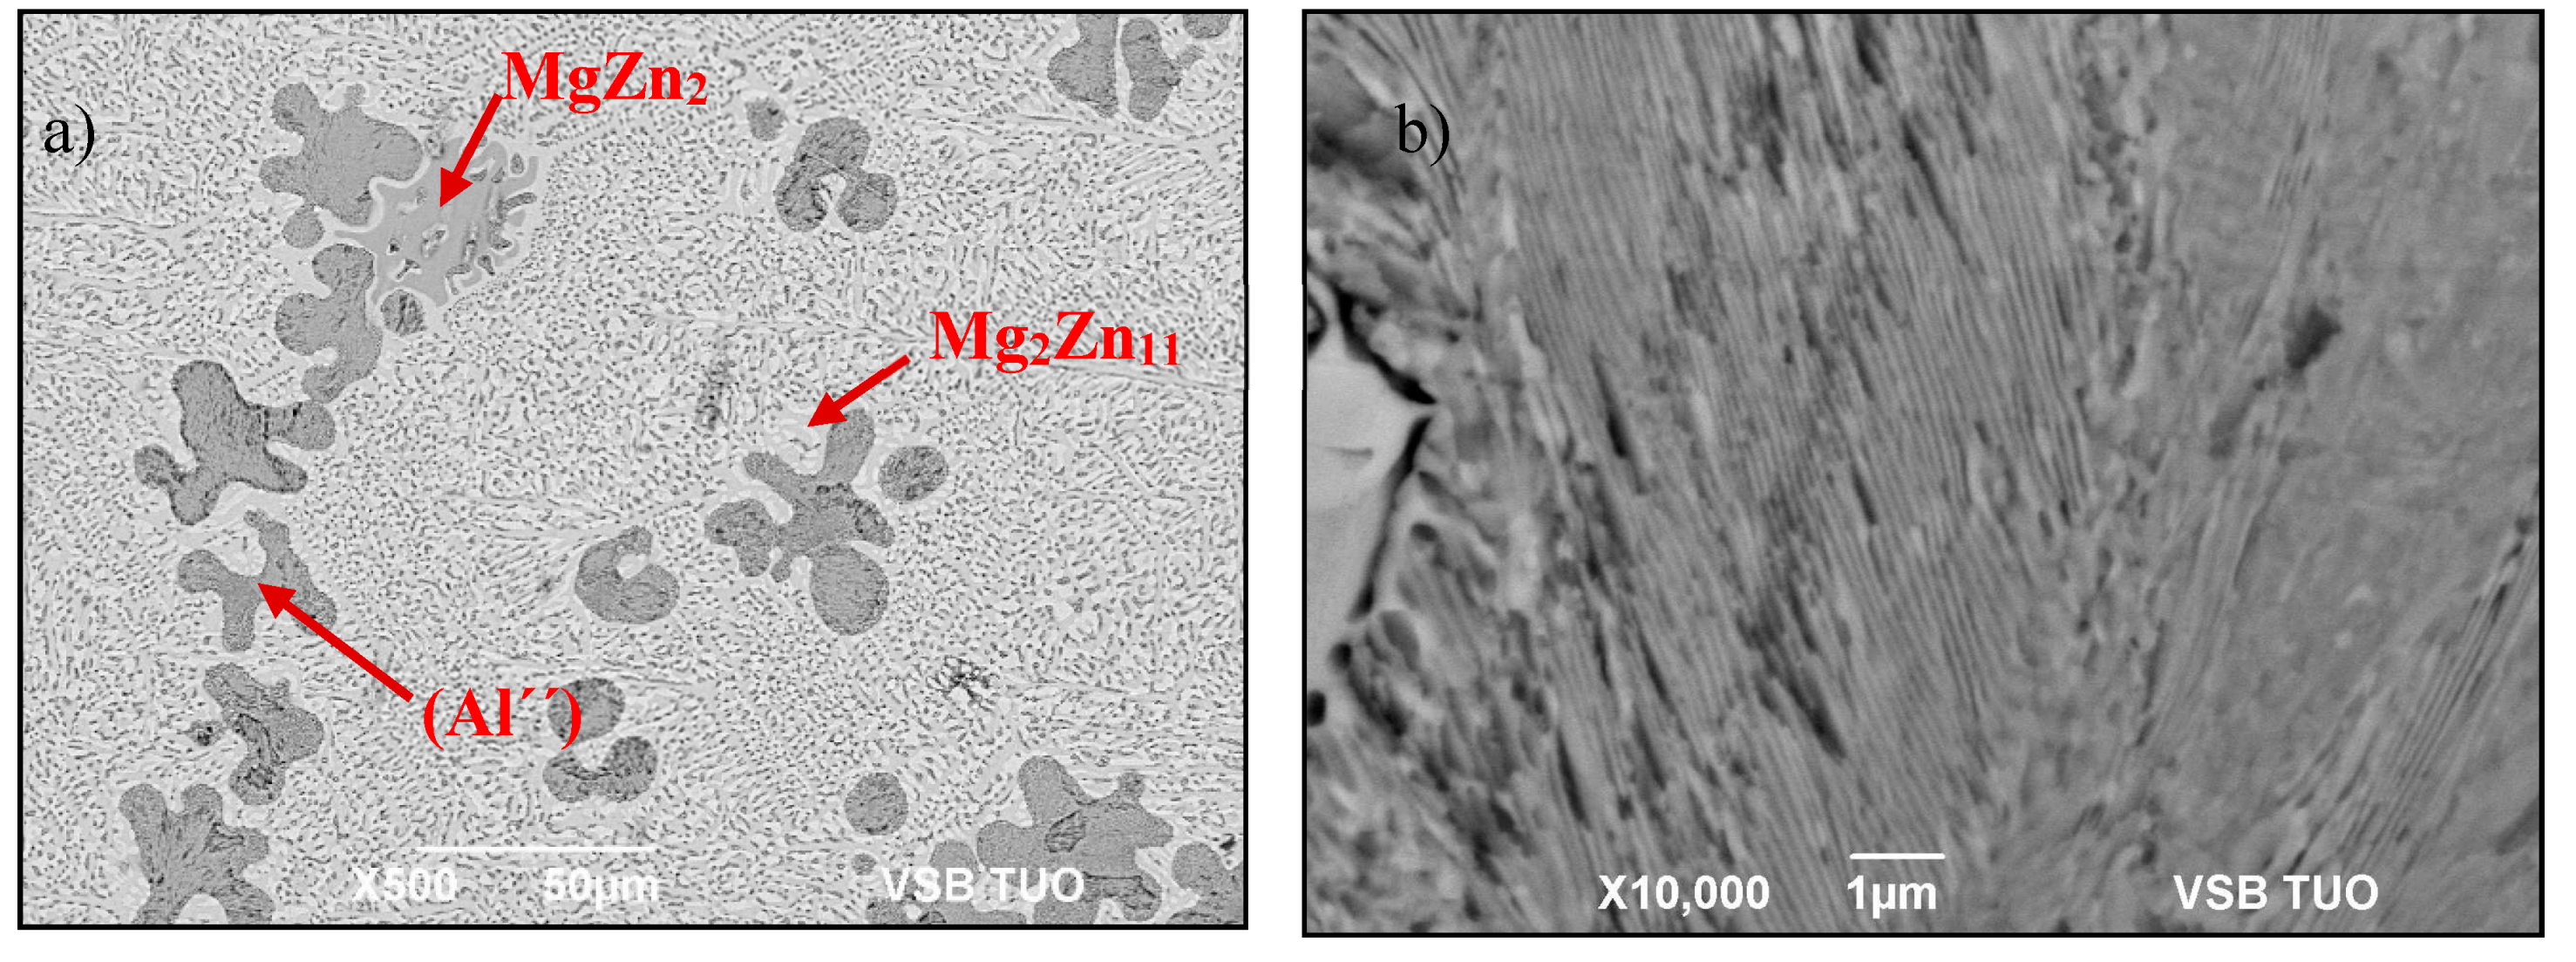
Figure 8.
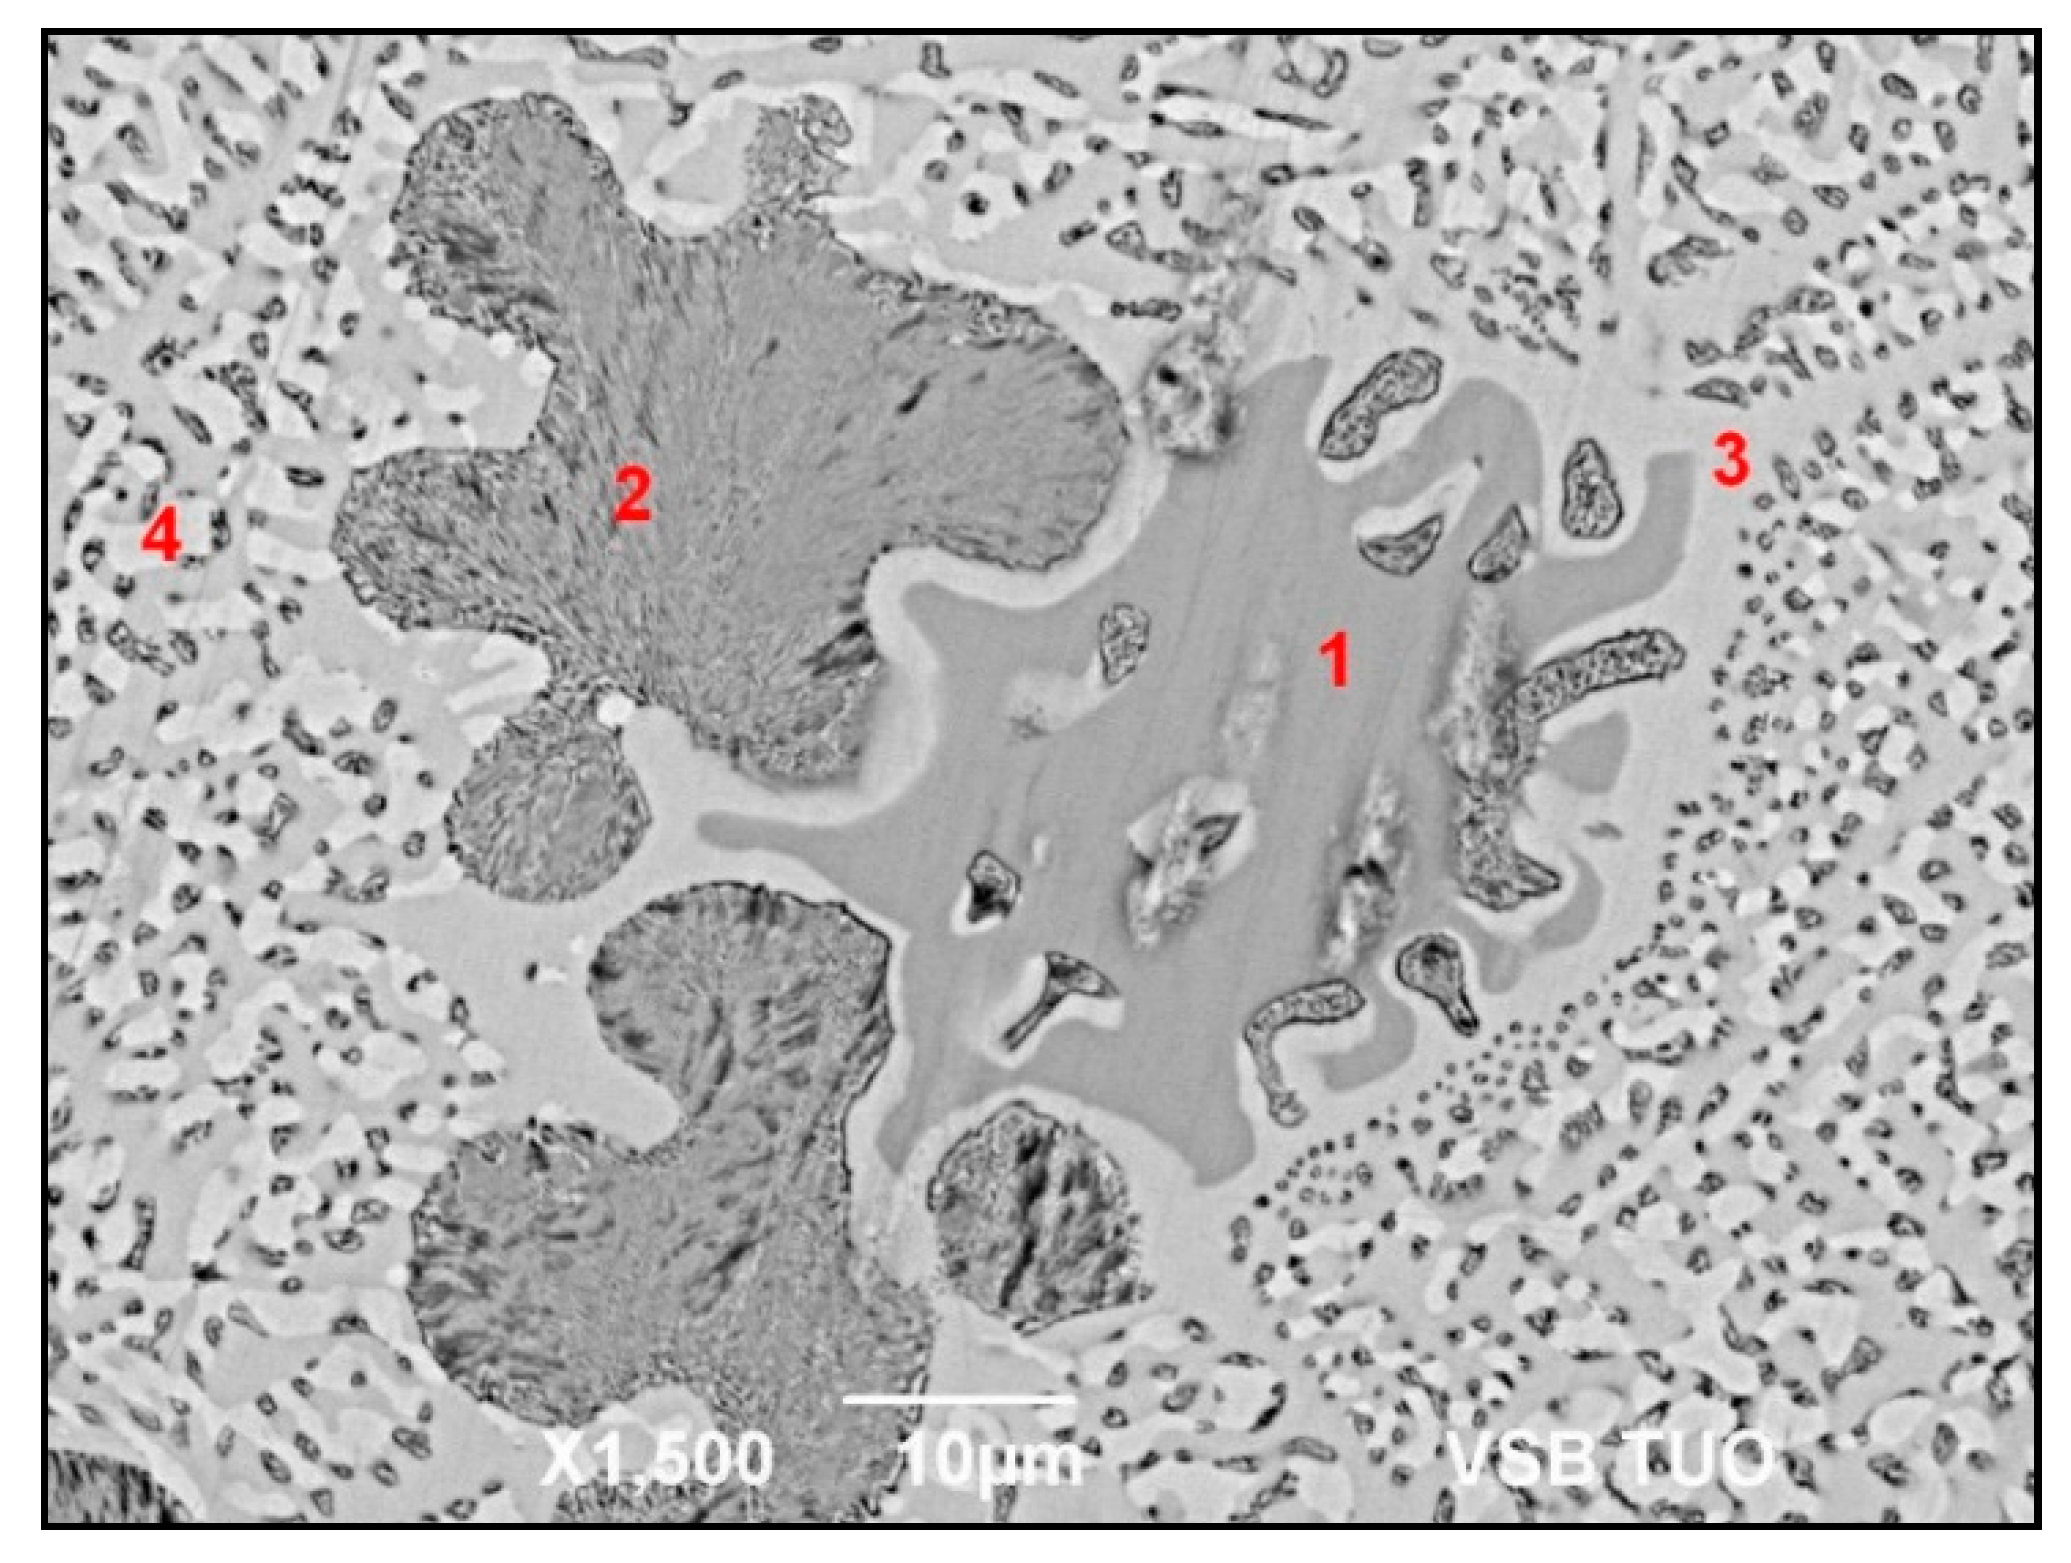
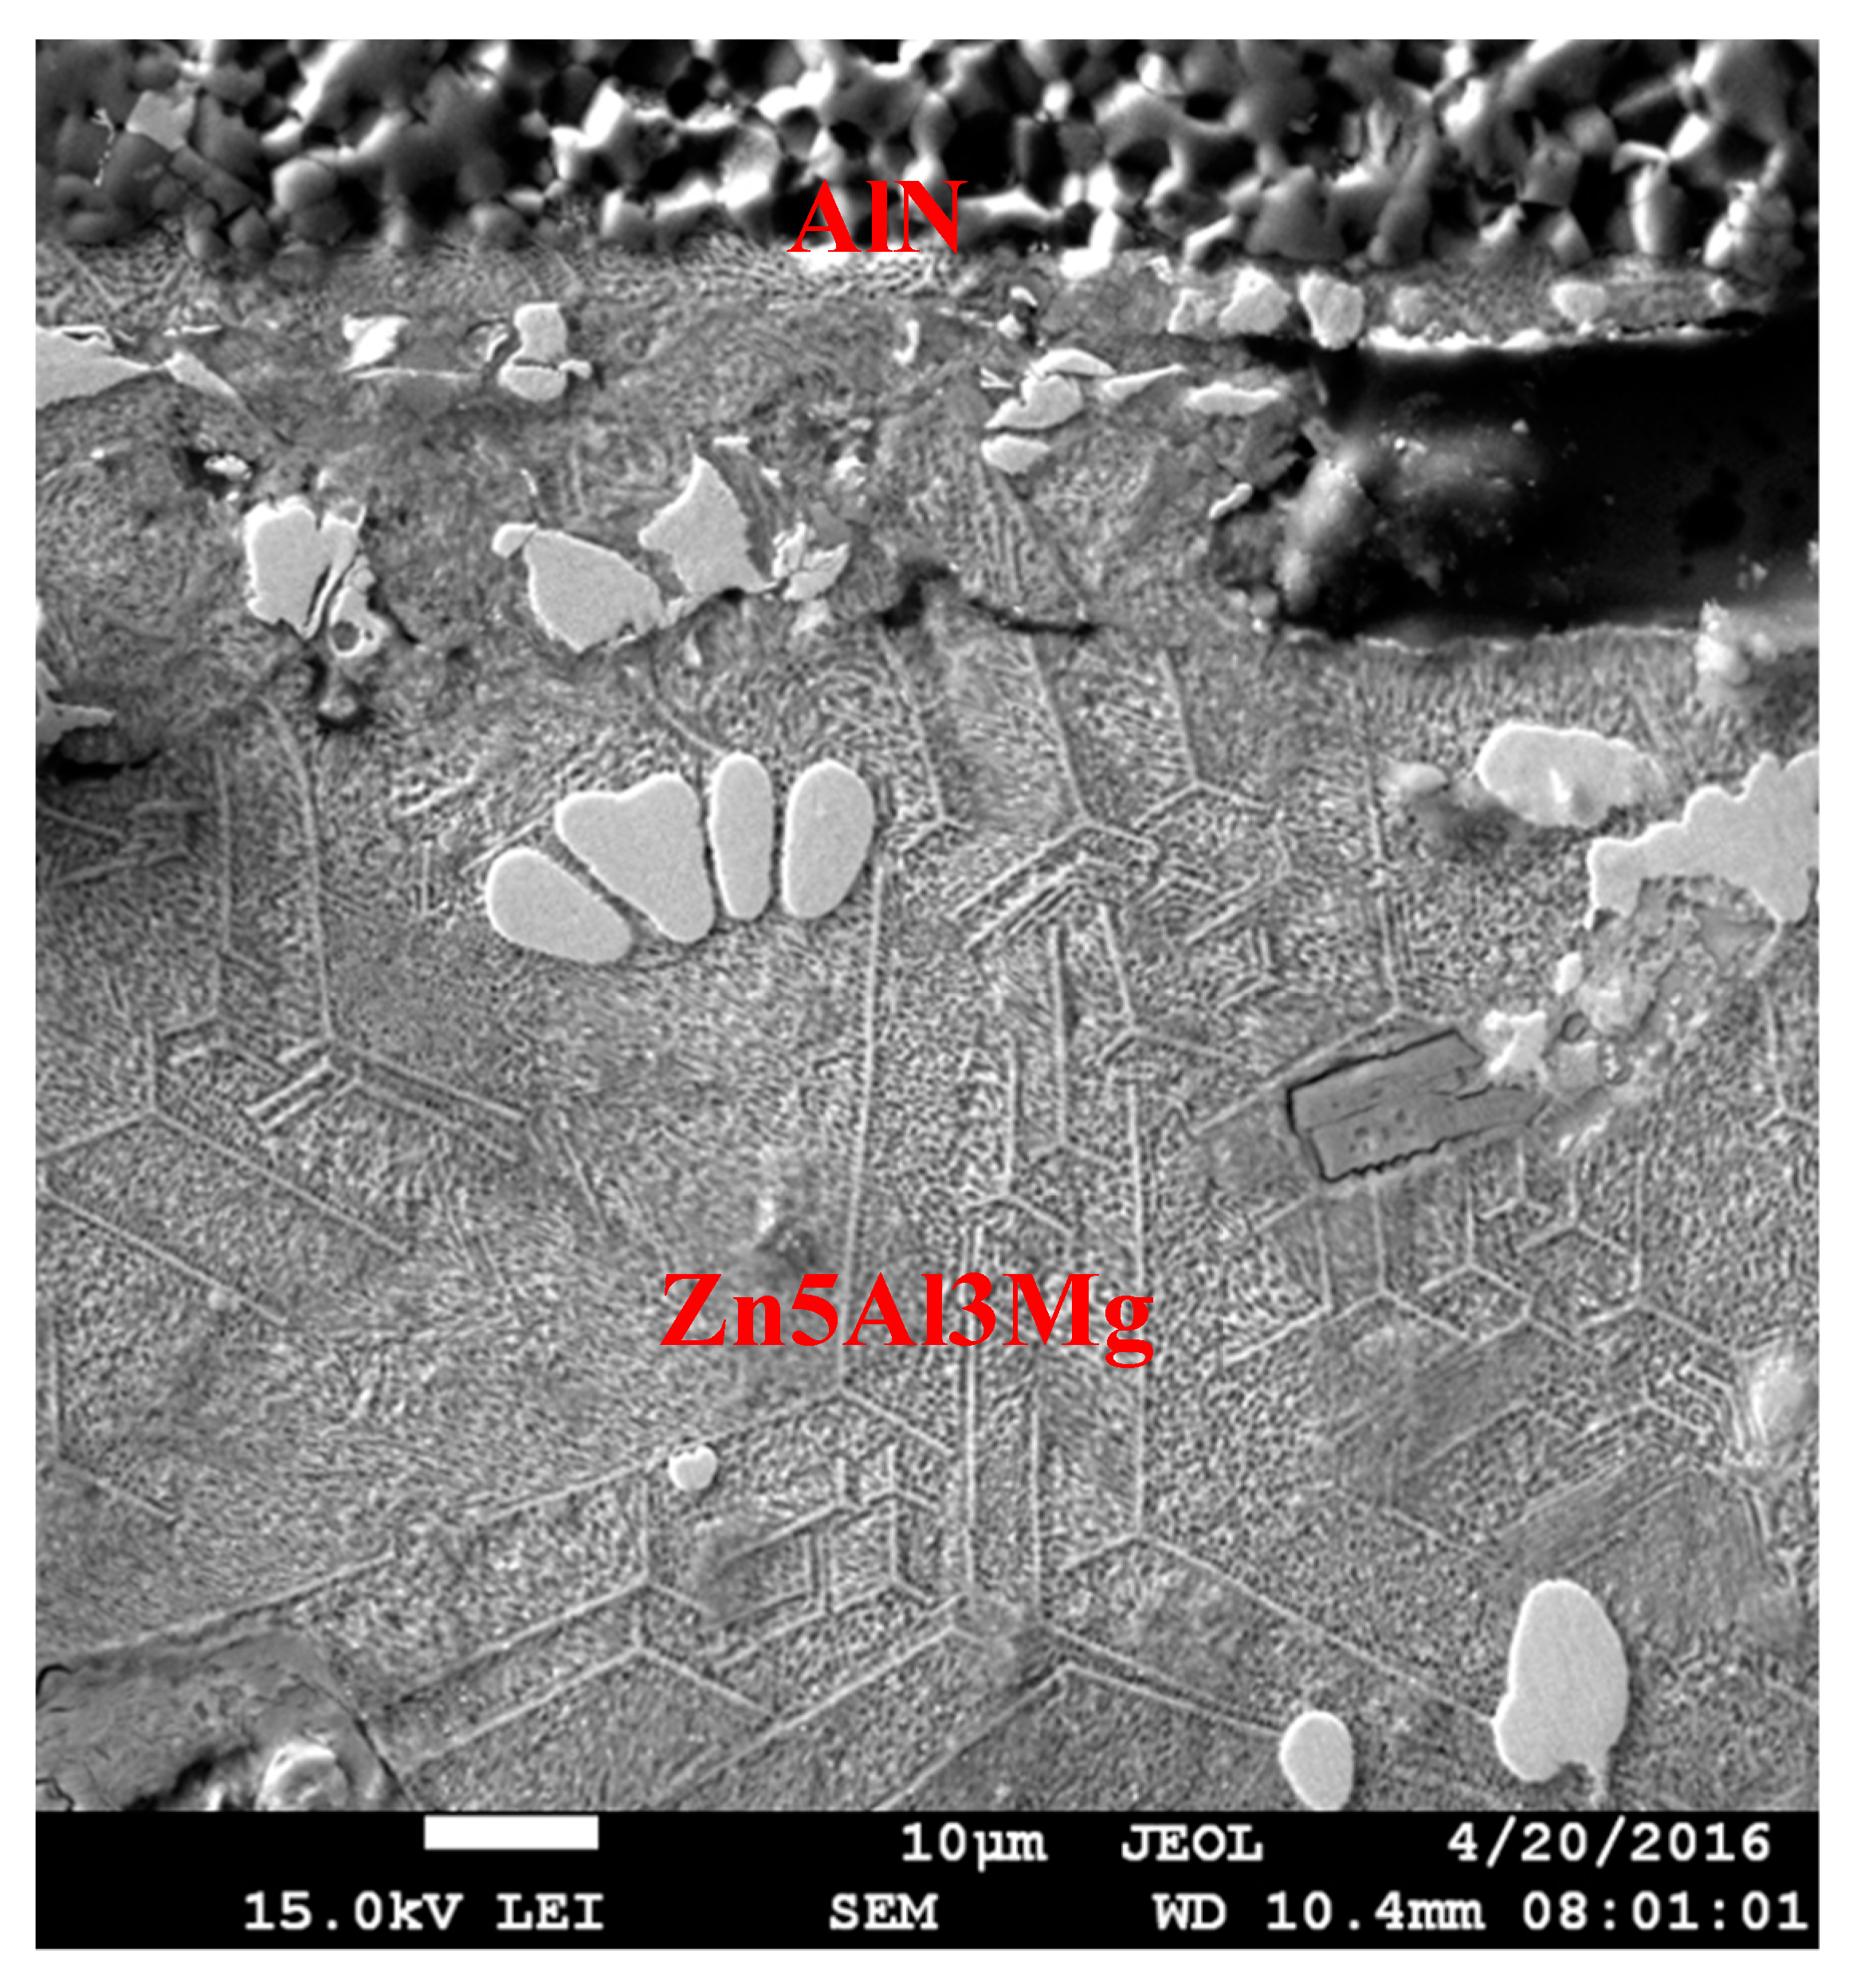
The Zn5Al3Mg solder (a) microstructure, (b) detailed view of darker phase (Al“).
Figure 9.
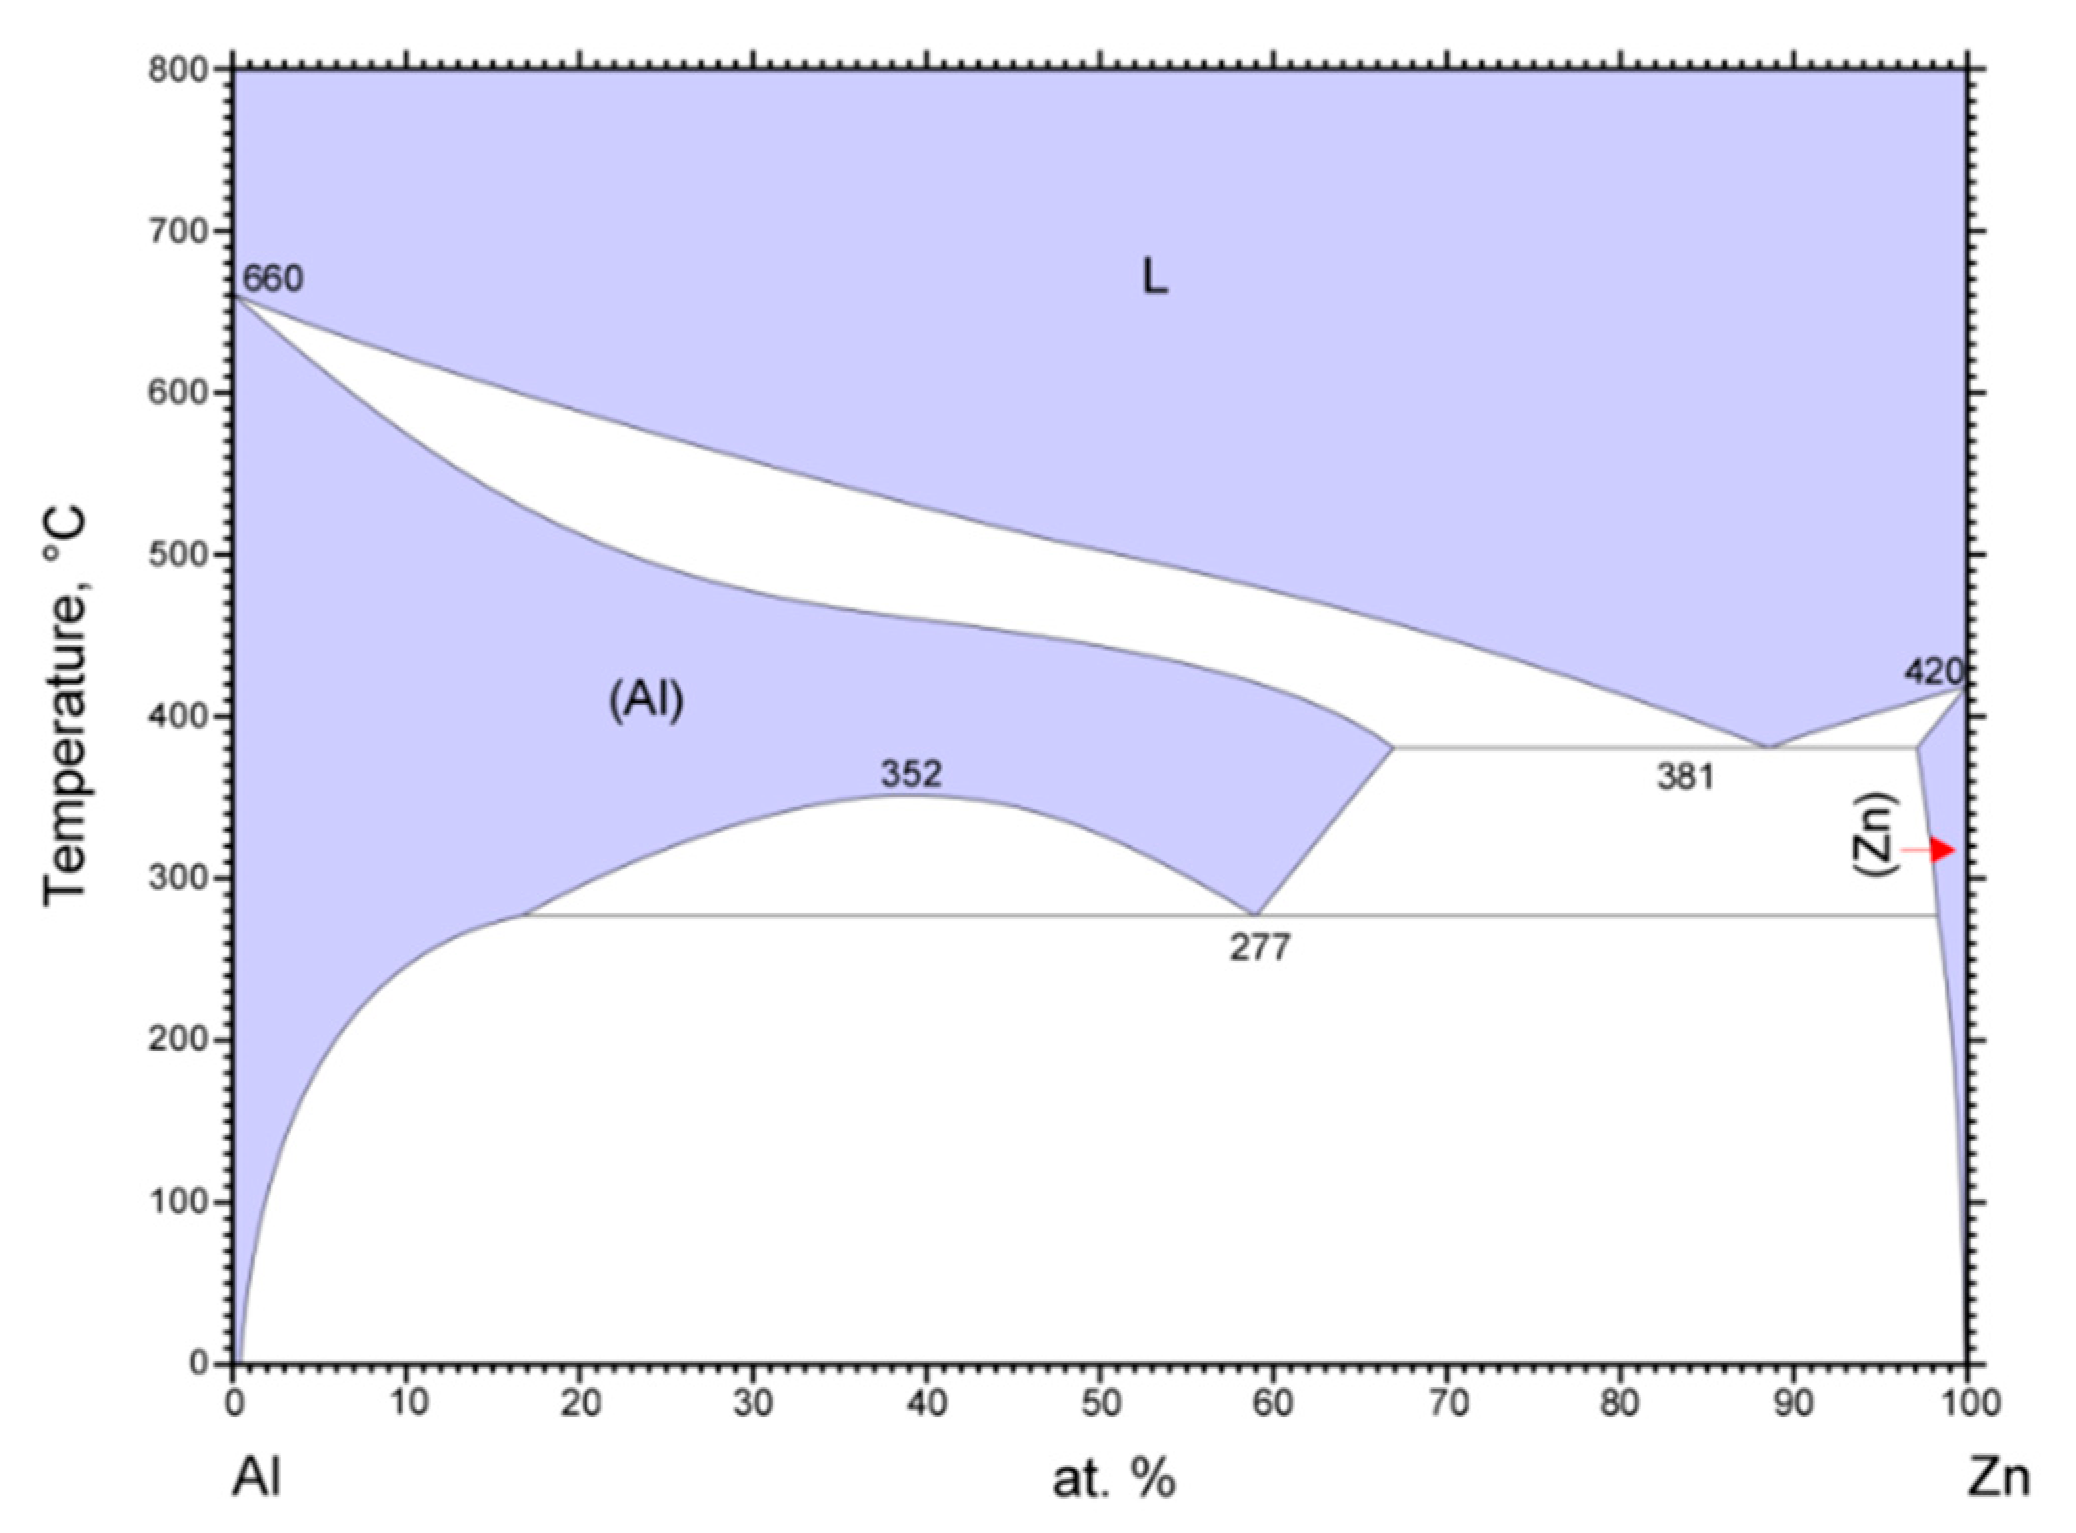
Phase diagram of Zn–Al [
22].
Figure 10.
The energy-dispersive X-ray spectroscopy (EDX) analysis of Zn5Al3Mg soldering alloy.
Figure 11.
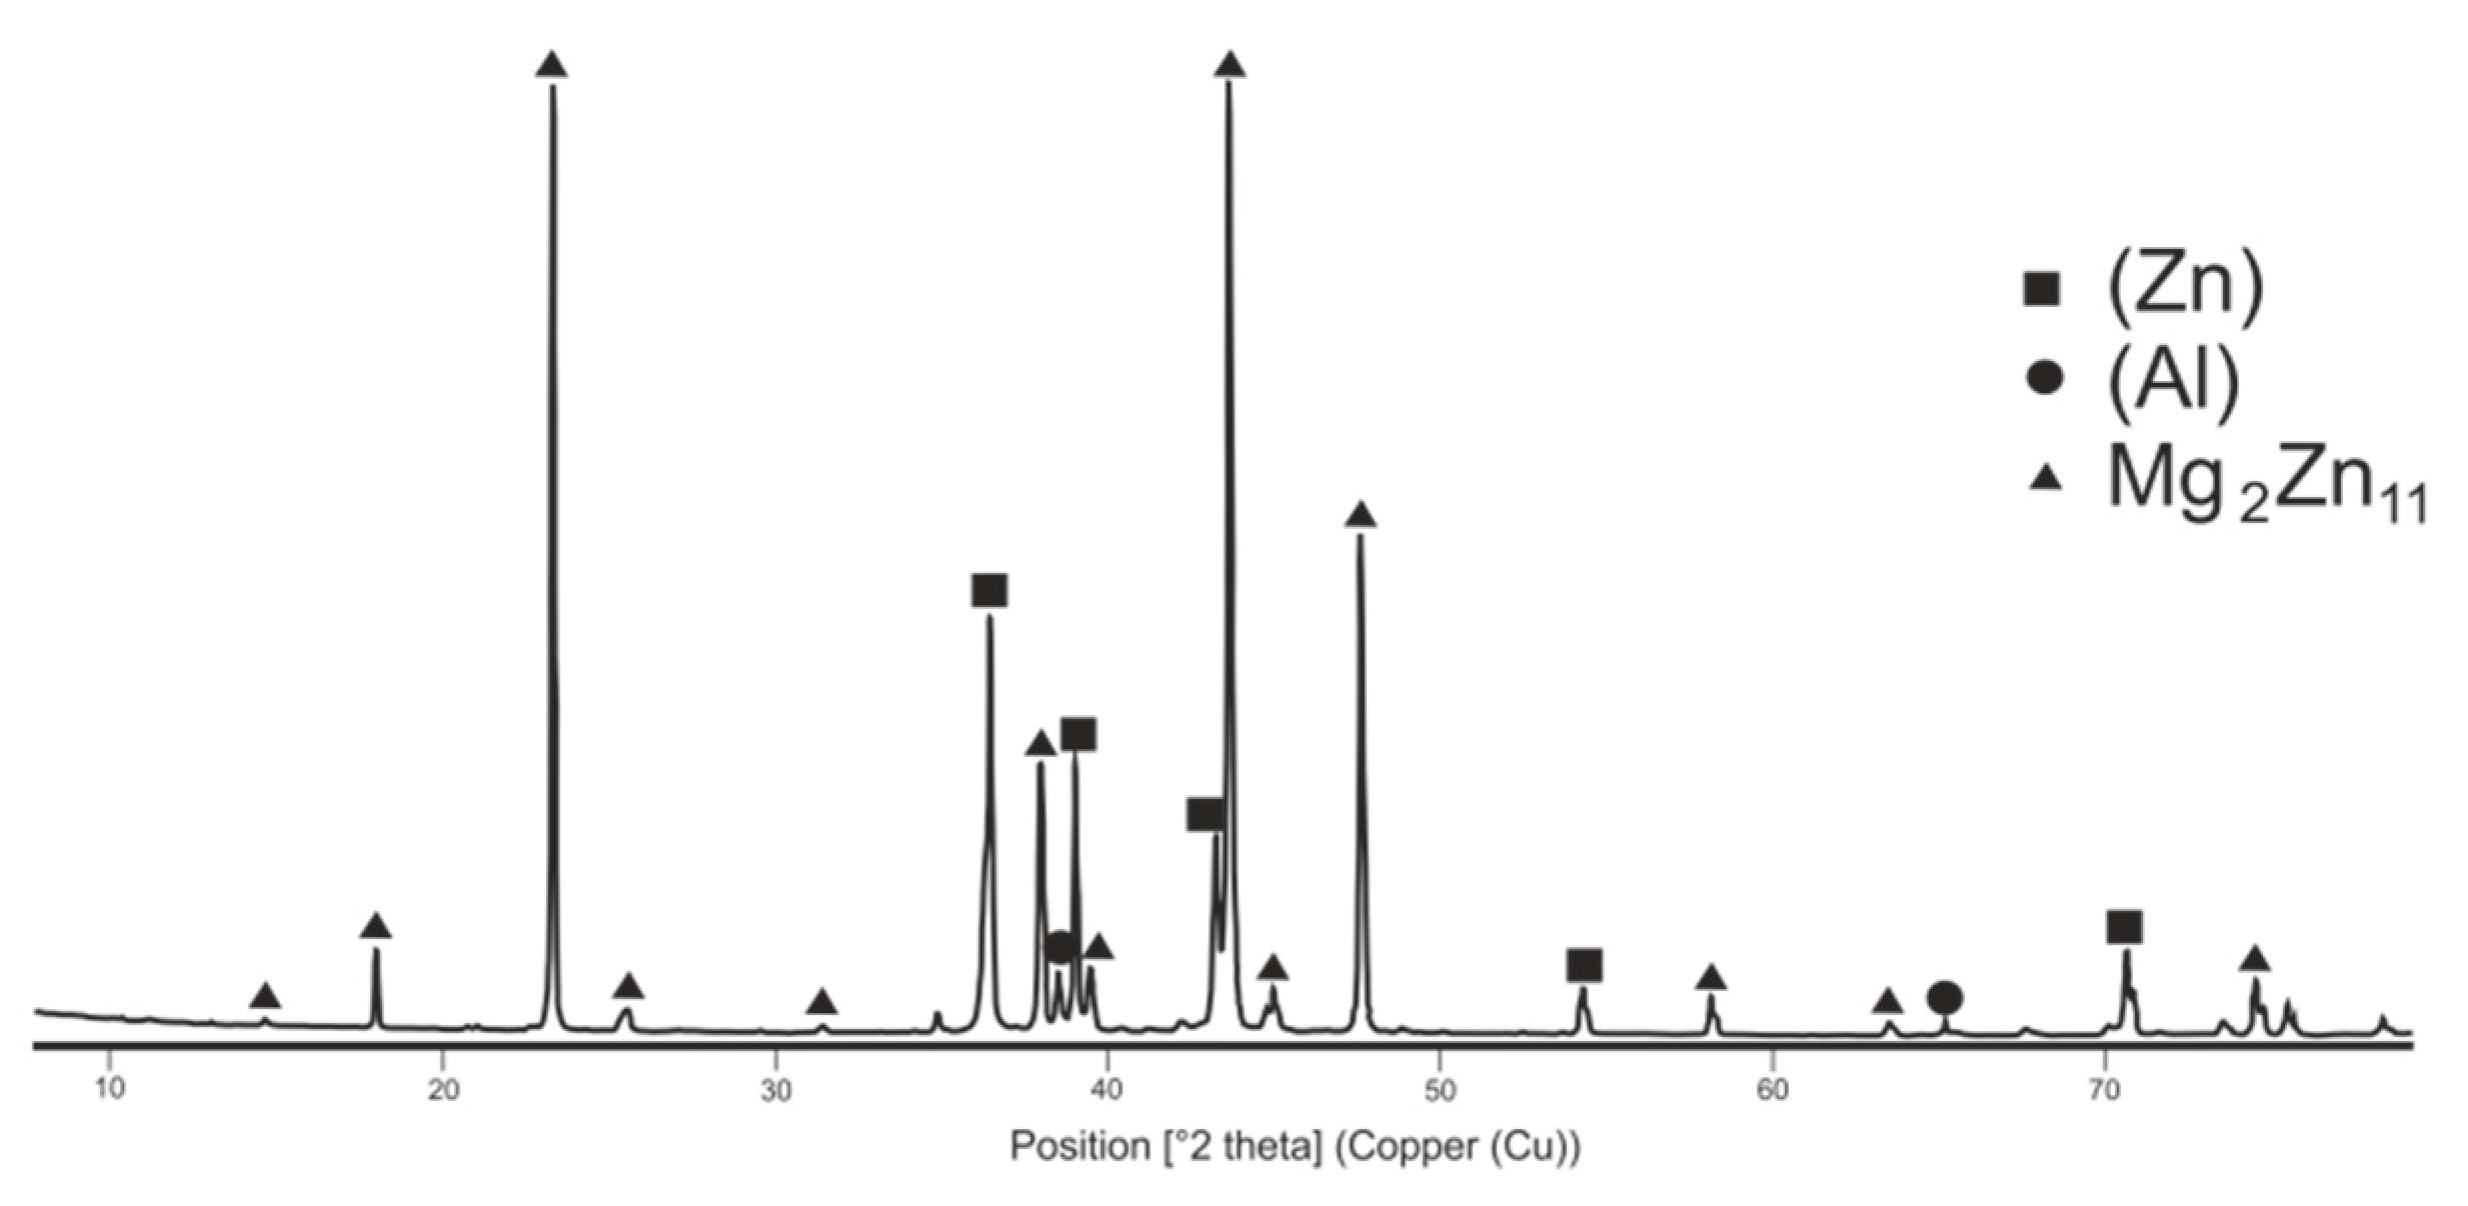
The diffraction record of Zn5Al3Mg solder.
Figure 12.
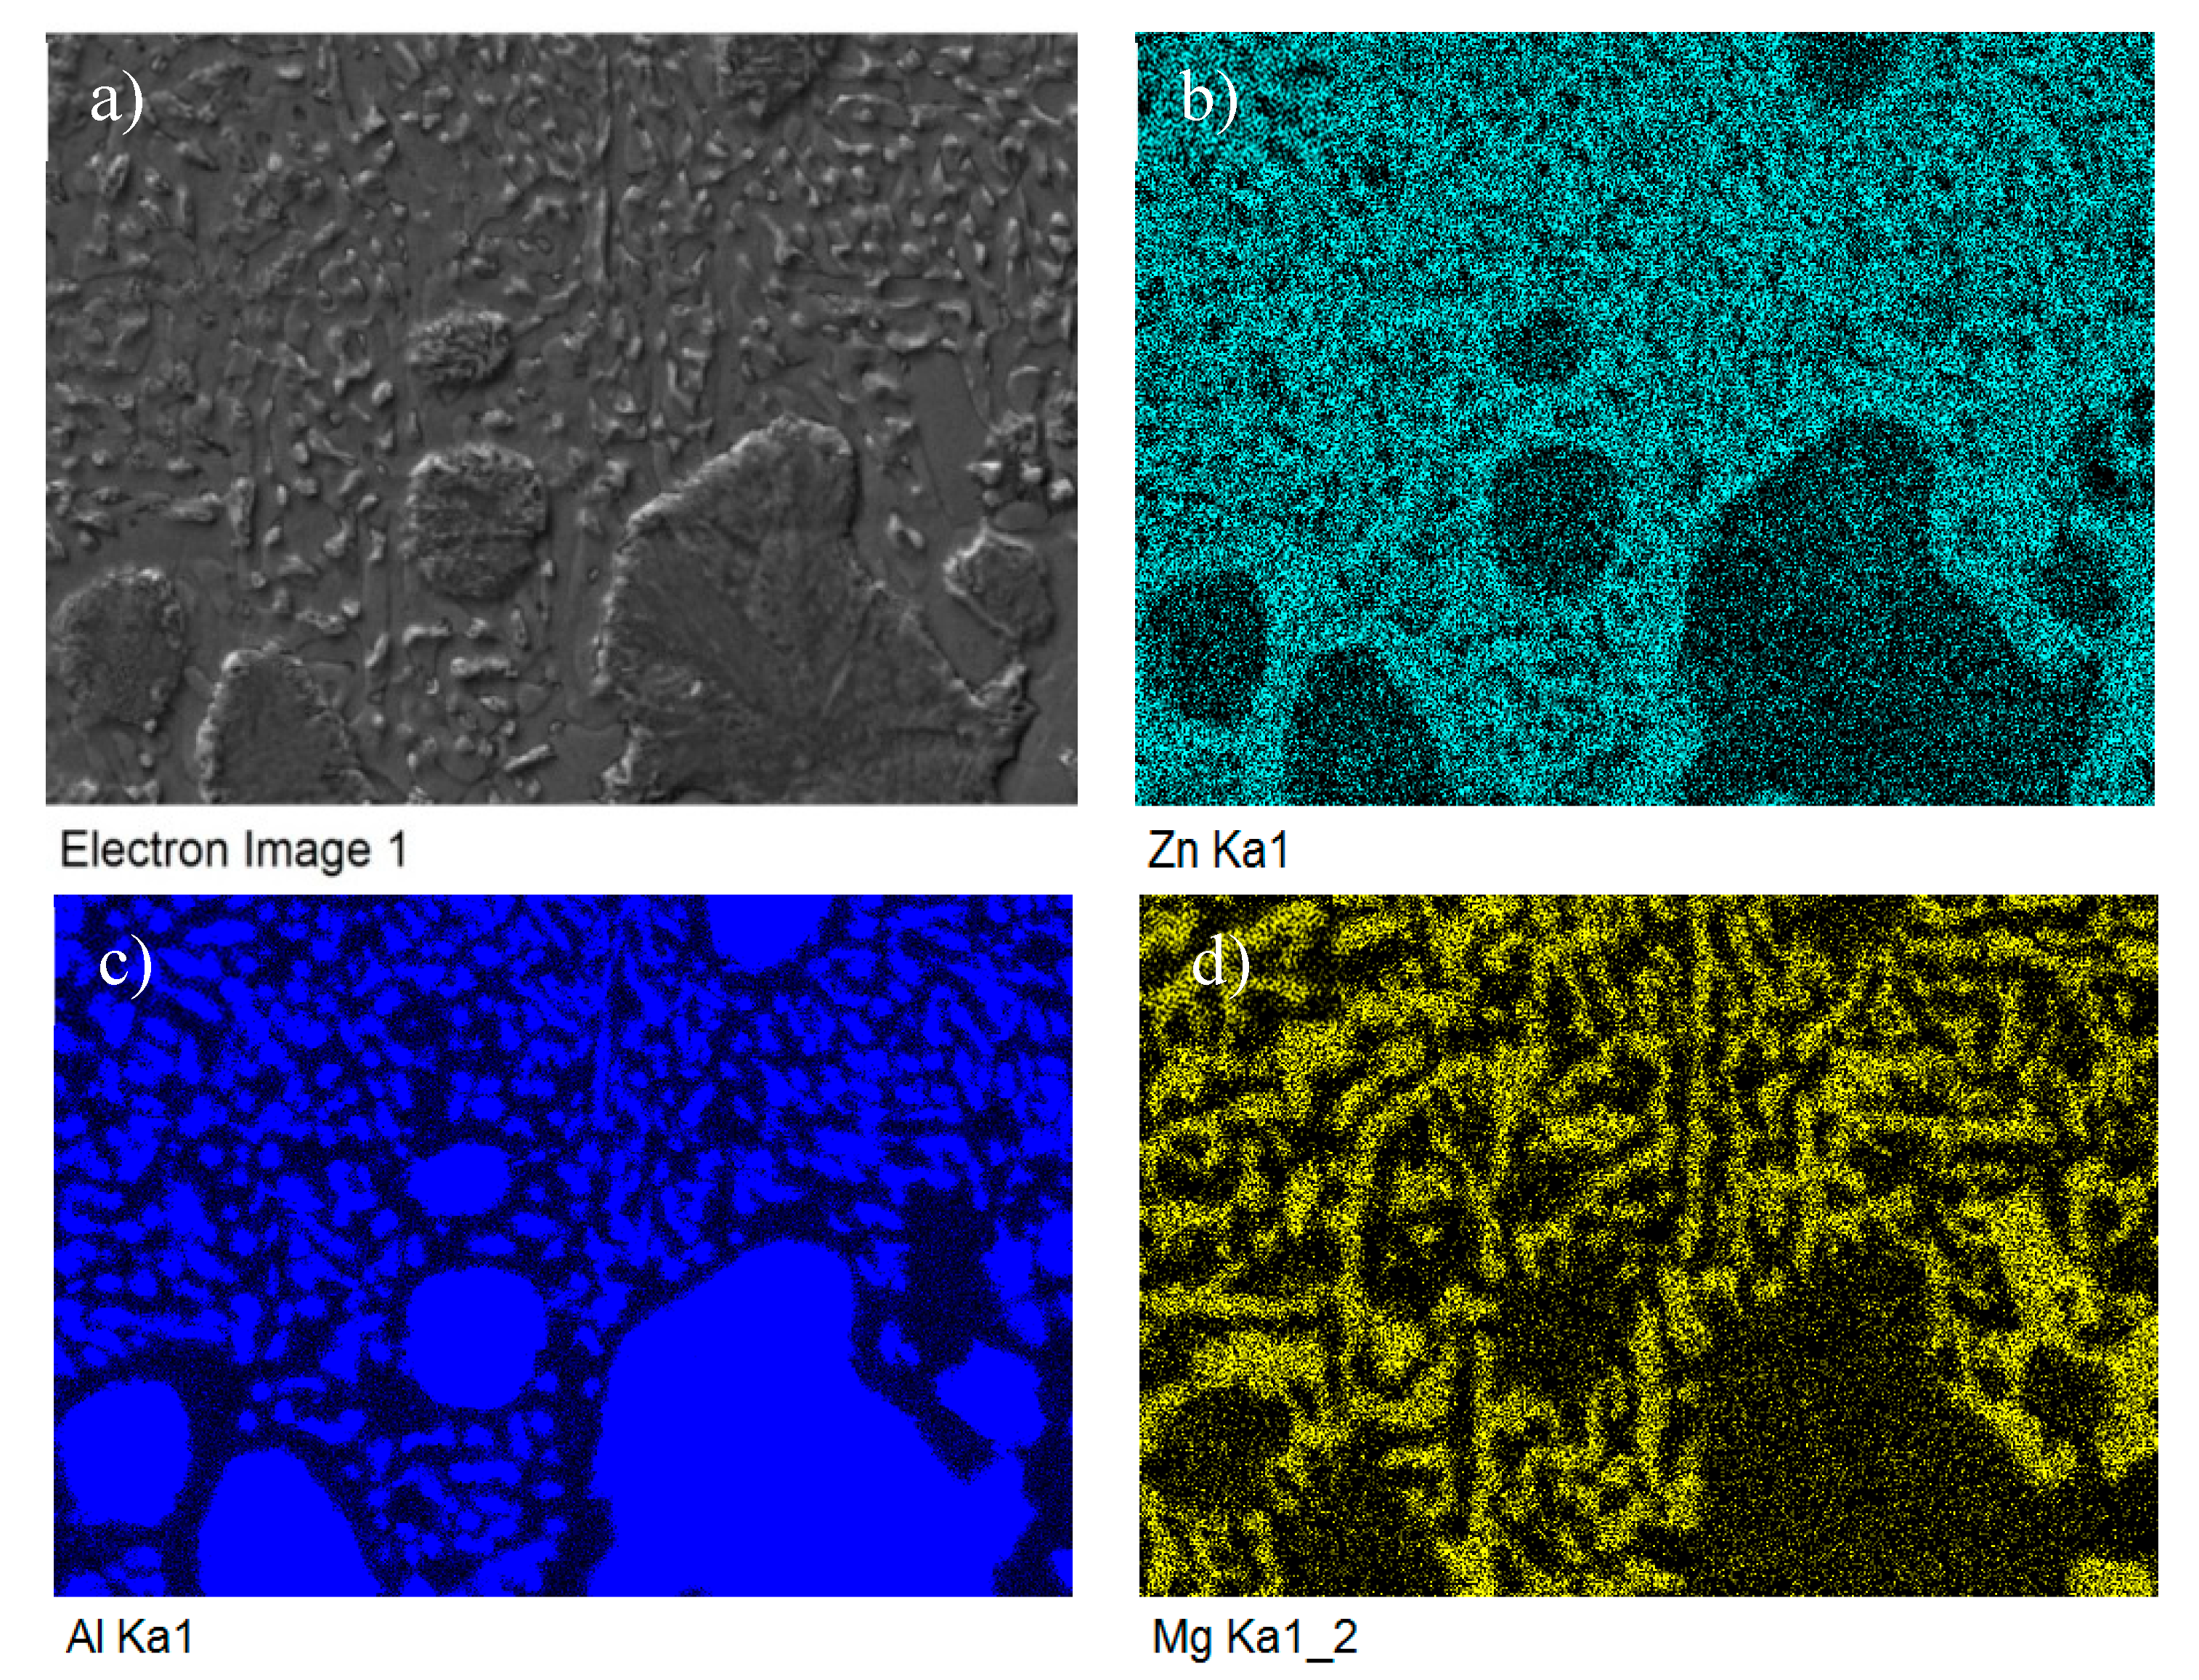
The map of Mg, Zn and Al elements in the structure of Zn5Al3Mg solder.
Figure 13.
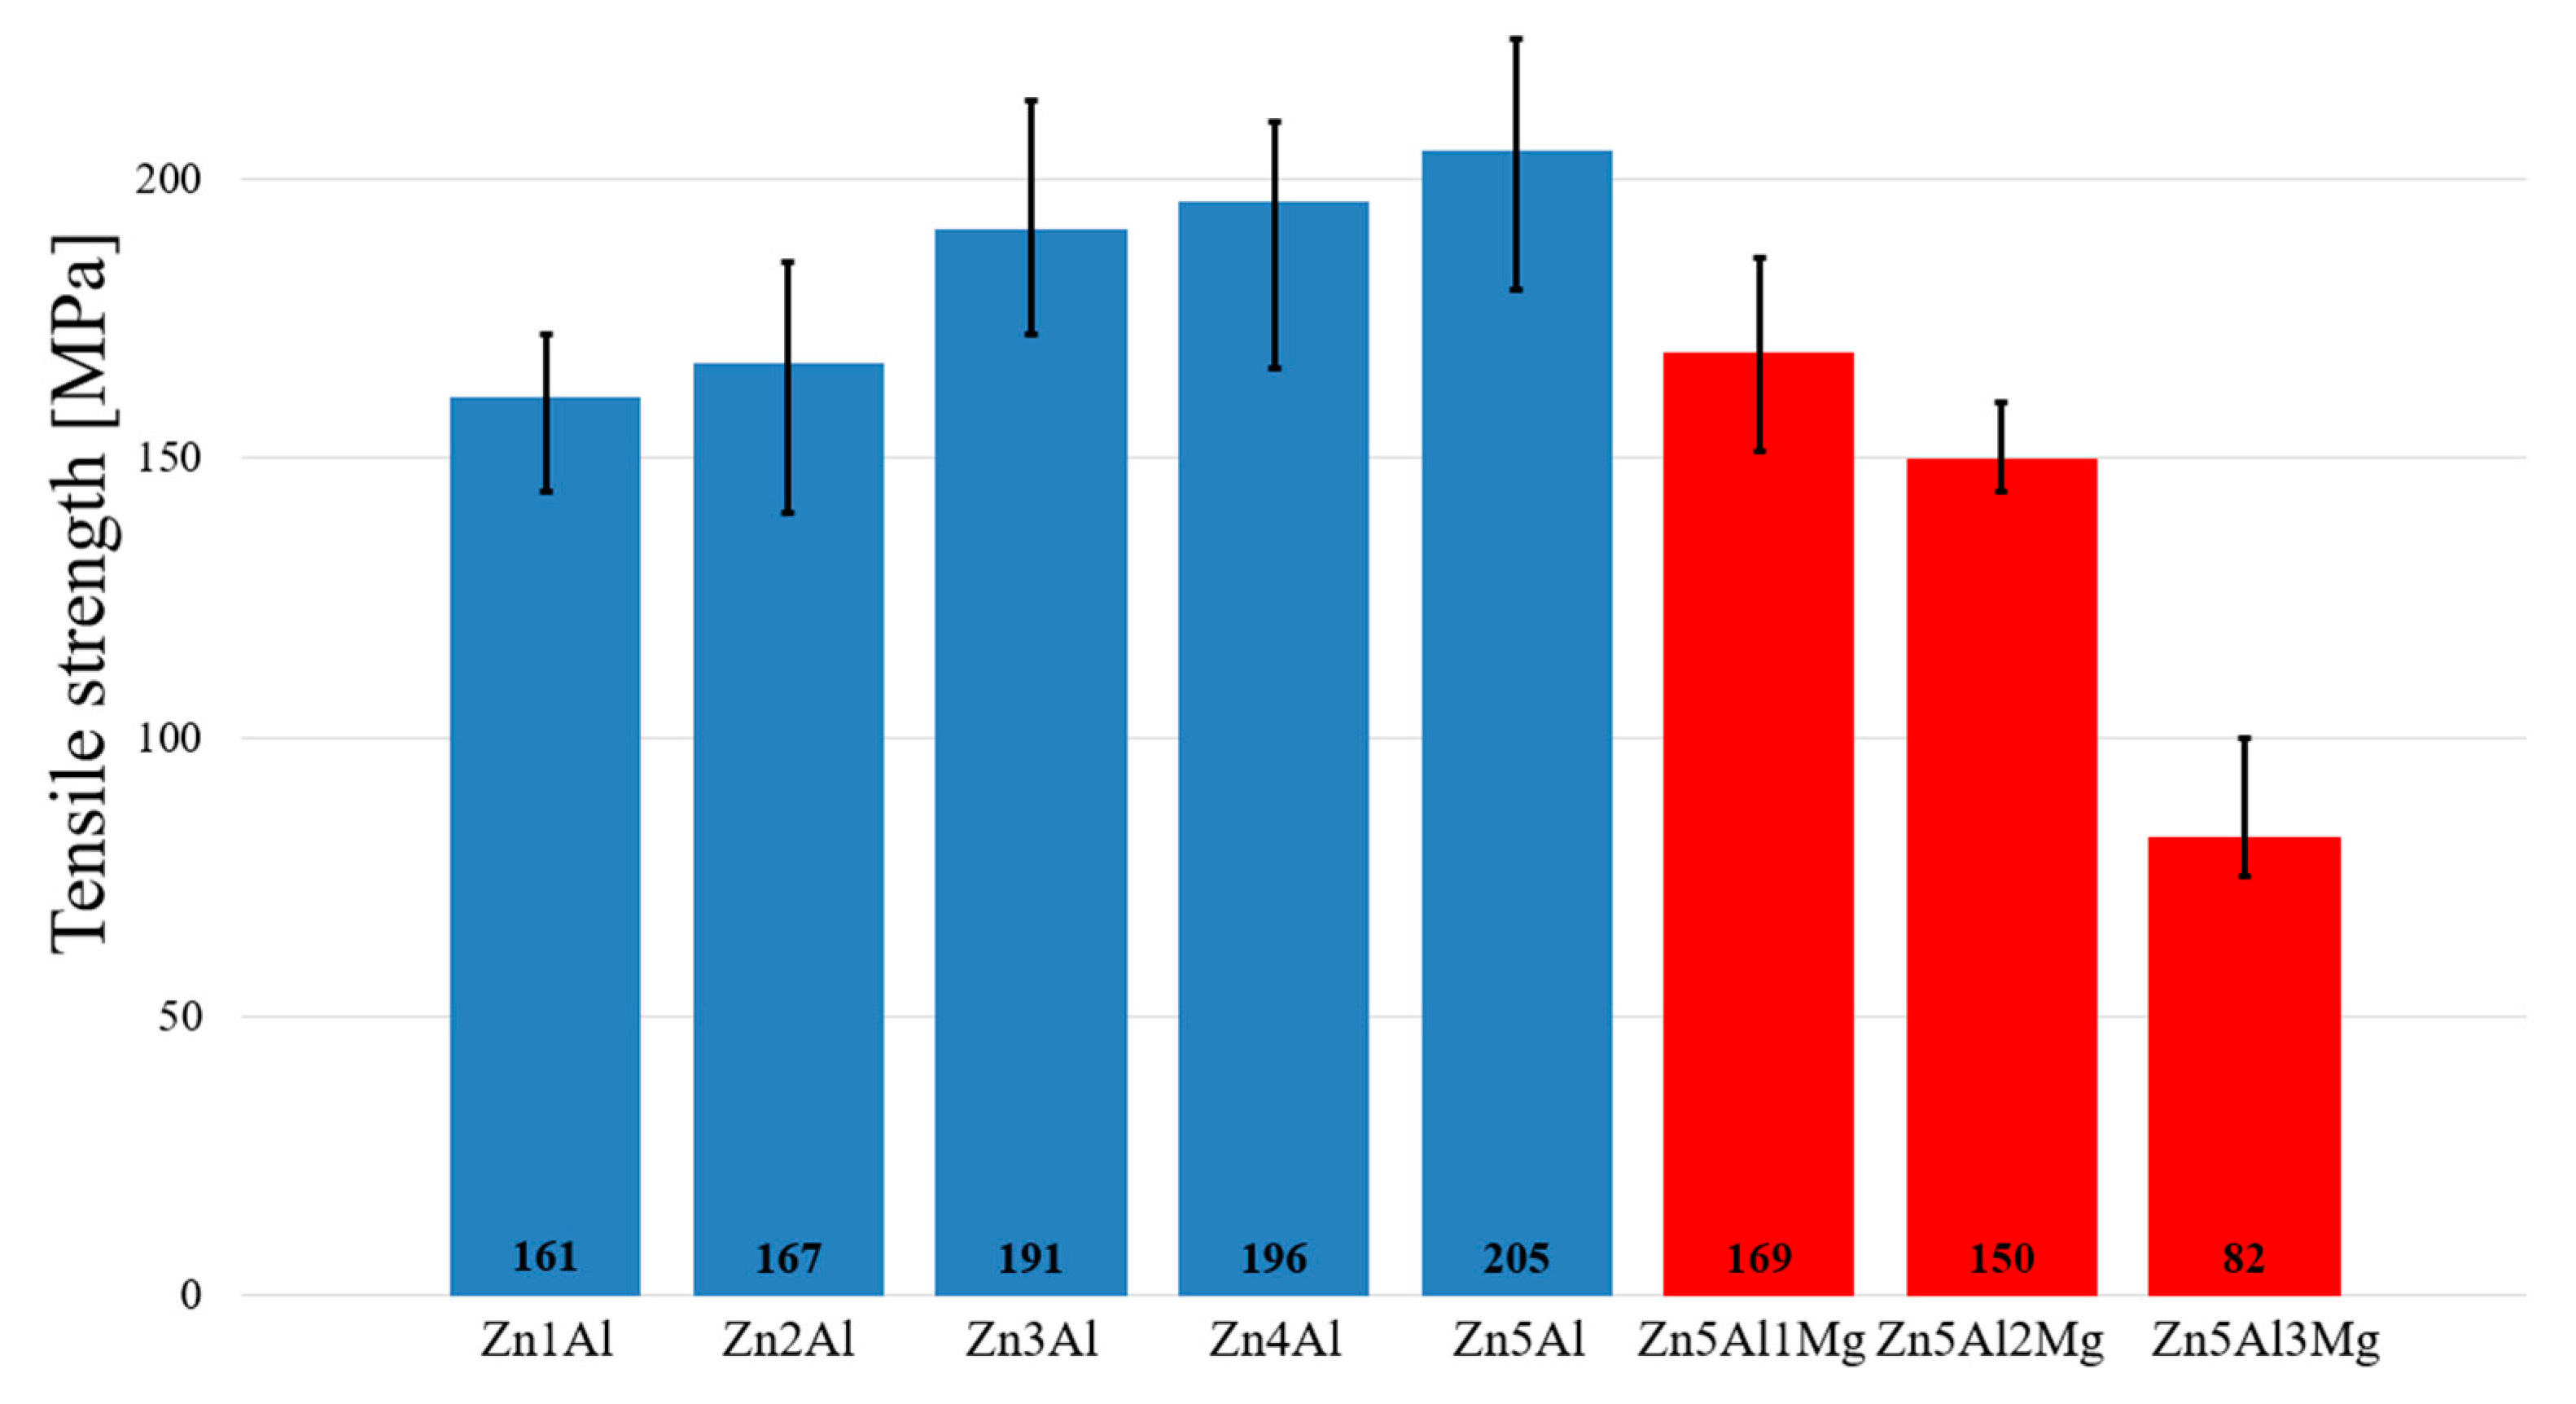
Tensile strength of Zn–Al–Mg soldering alloys depending on Al and Mg content.
Figure 14.
Microstructure of the AlN/Zn5Al3Mg boundary.
Figure 15.
The EDX analysis of the AlN/Zn–Al–Mg joint boundary (marked AlN ceramics).
Figure 16.
Concentration profiles of elements in the boundary of the AlN/Zn–Al–Mg joint, (a) joint microstructure, (b) Mg profile, (c) Al profile, (d) Zn profile.
Figure 17.
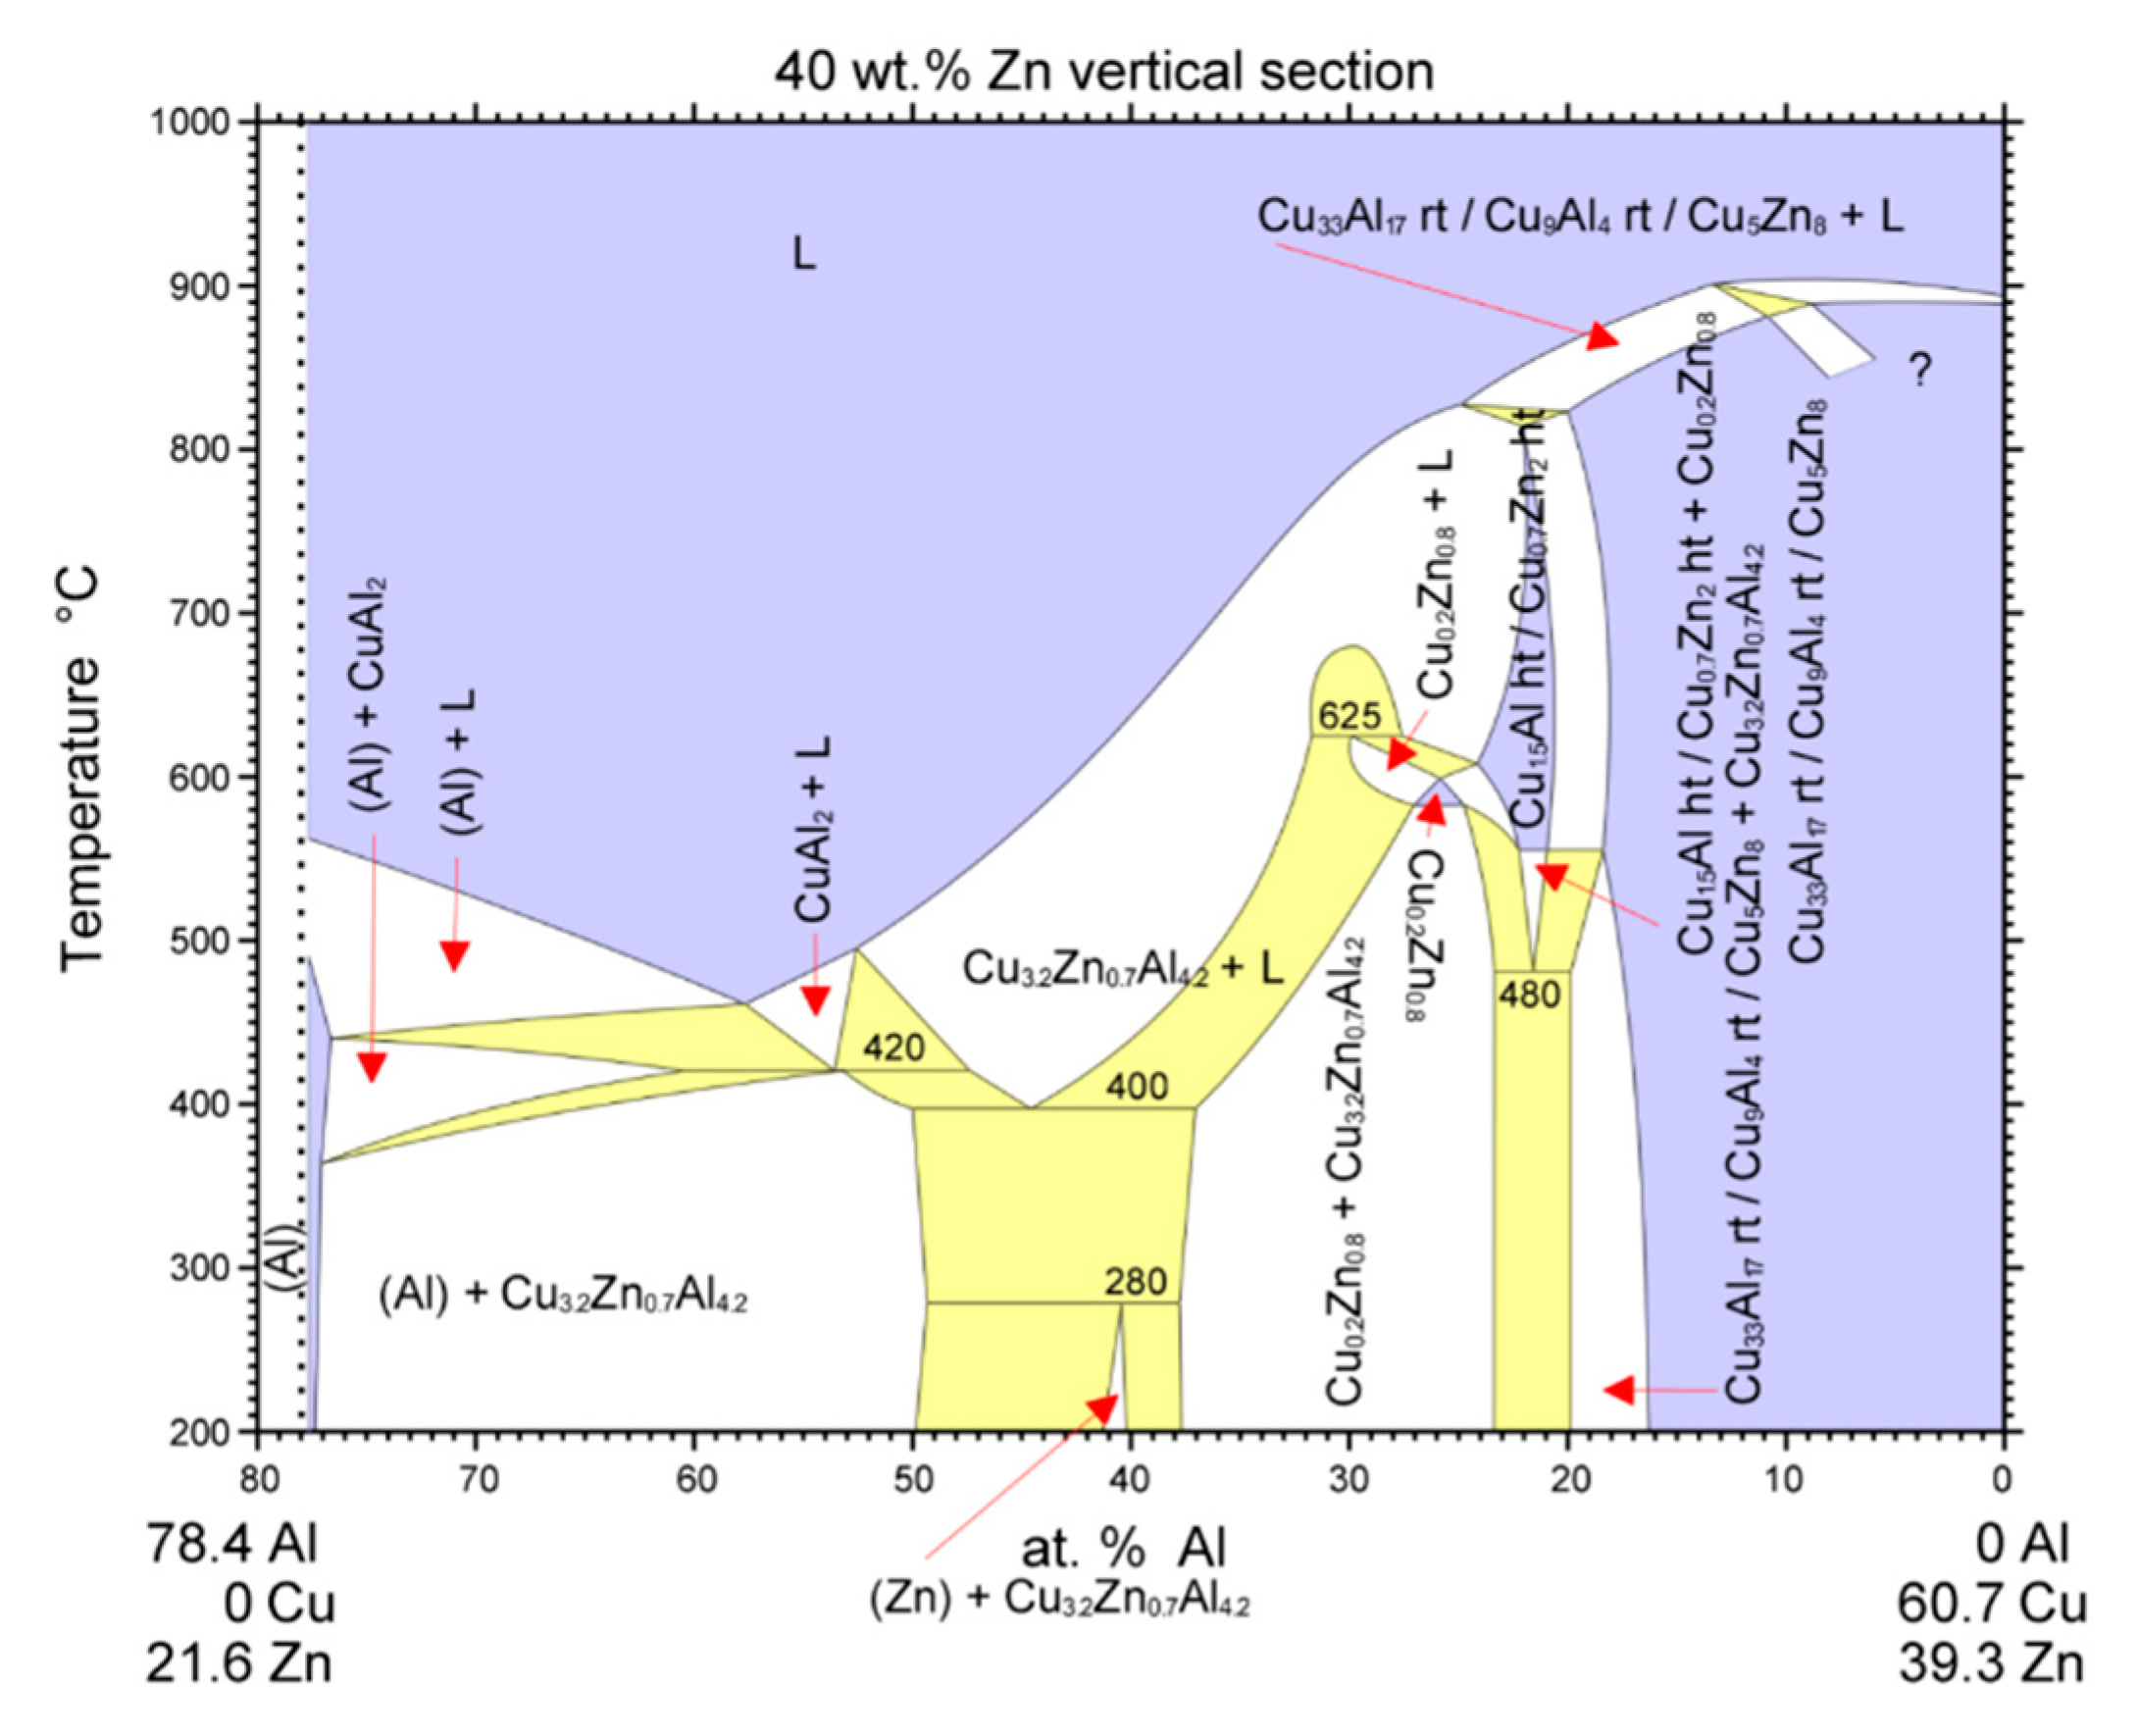
Isopletic section of ternary system Al-Cu for 40 wt % of Zn [
22].
Figure 18.
The EDX point analysis of the Cu/Zn5Al3Mg boundary.
Figure 19.
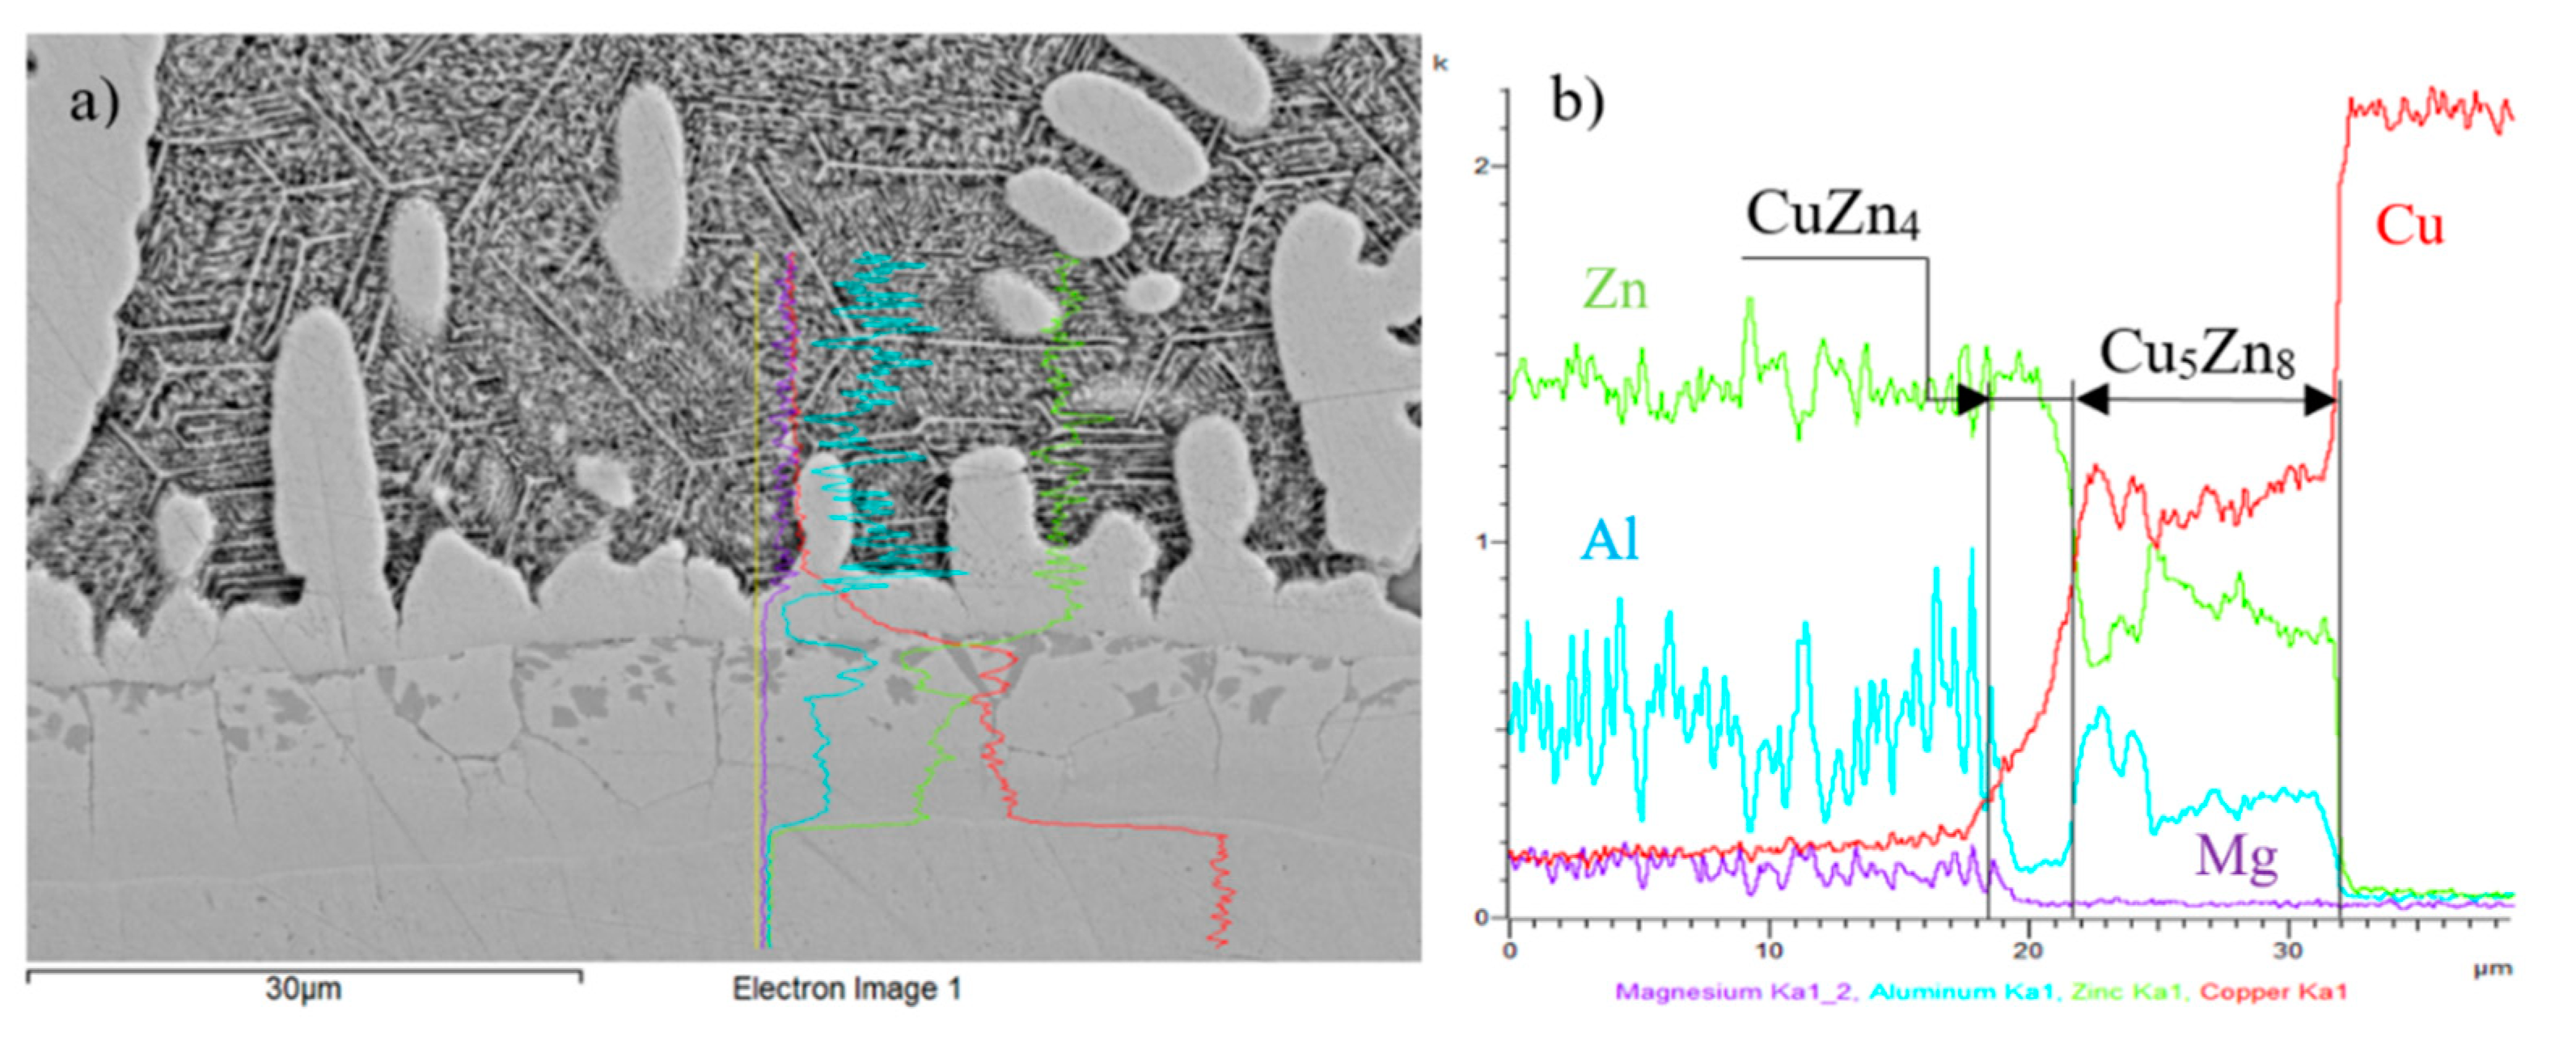
EDX analysis of the Cu/Zn5Al3Mg boundary; (a) microstructure of examined boundary; (b) concentration profiles of Zn, Cu, Al and Mg elements.
Figure 20.
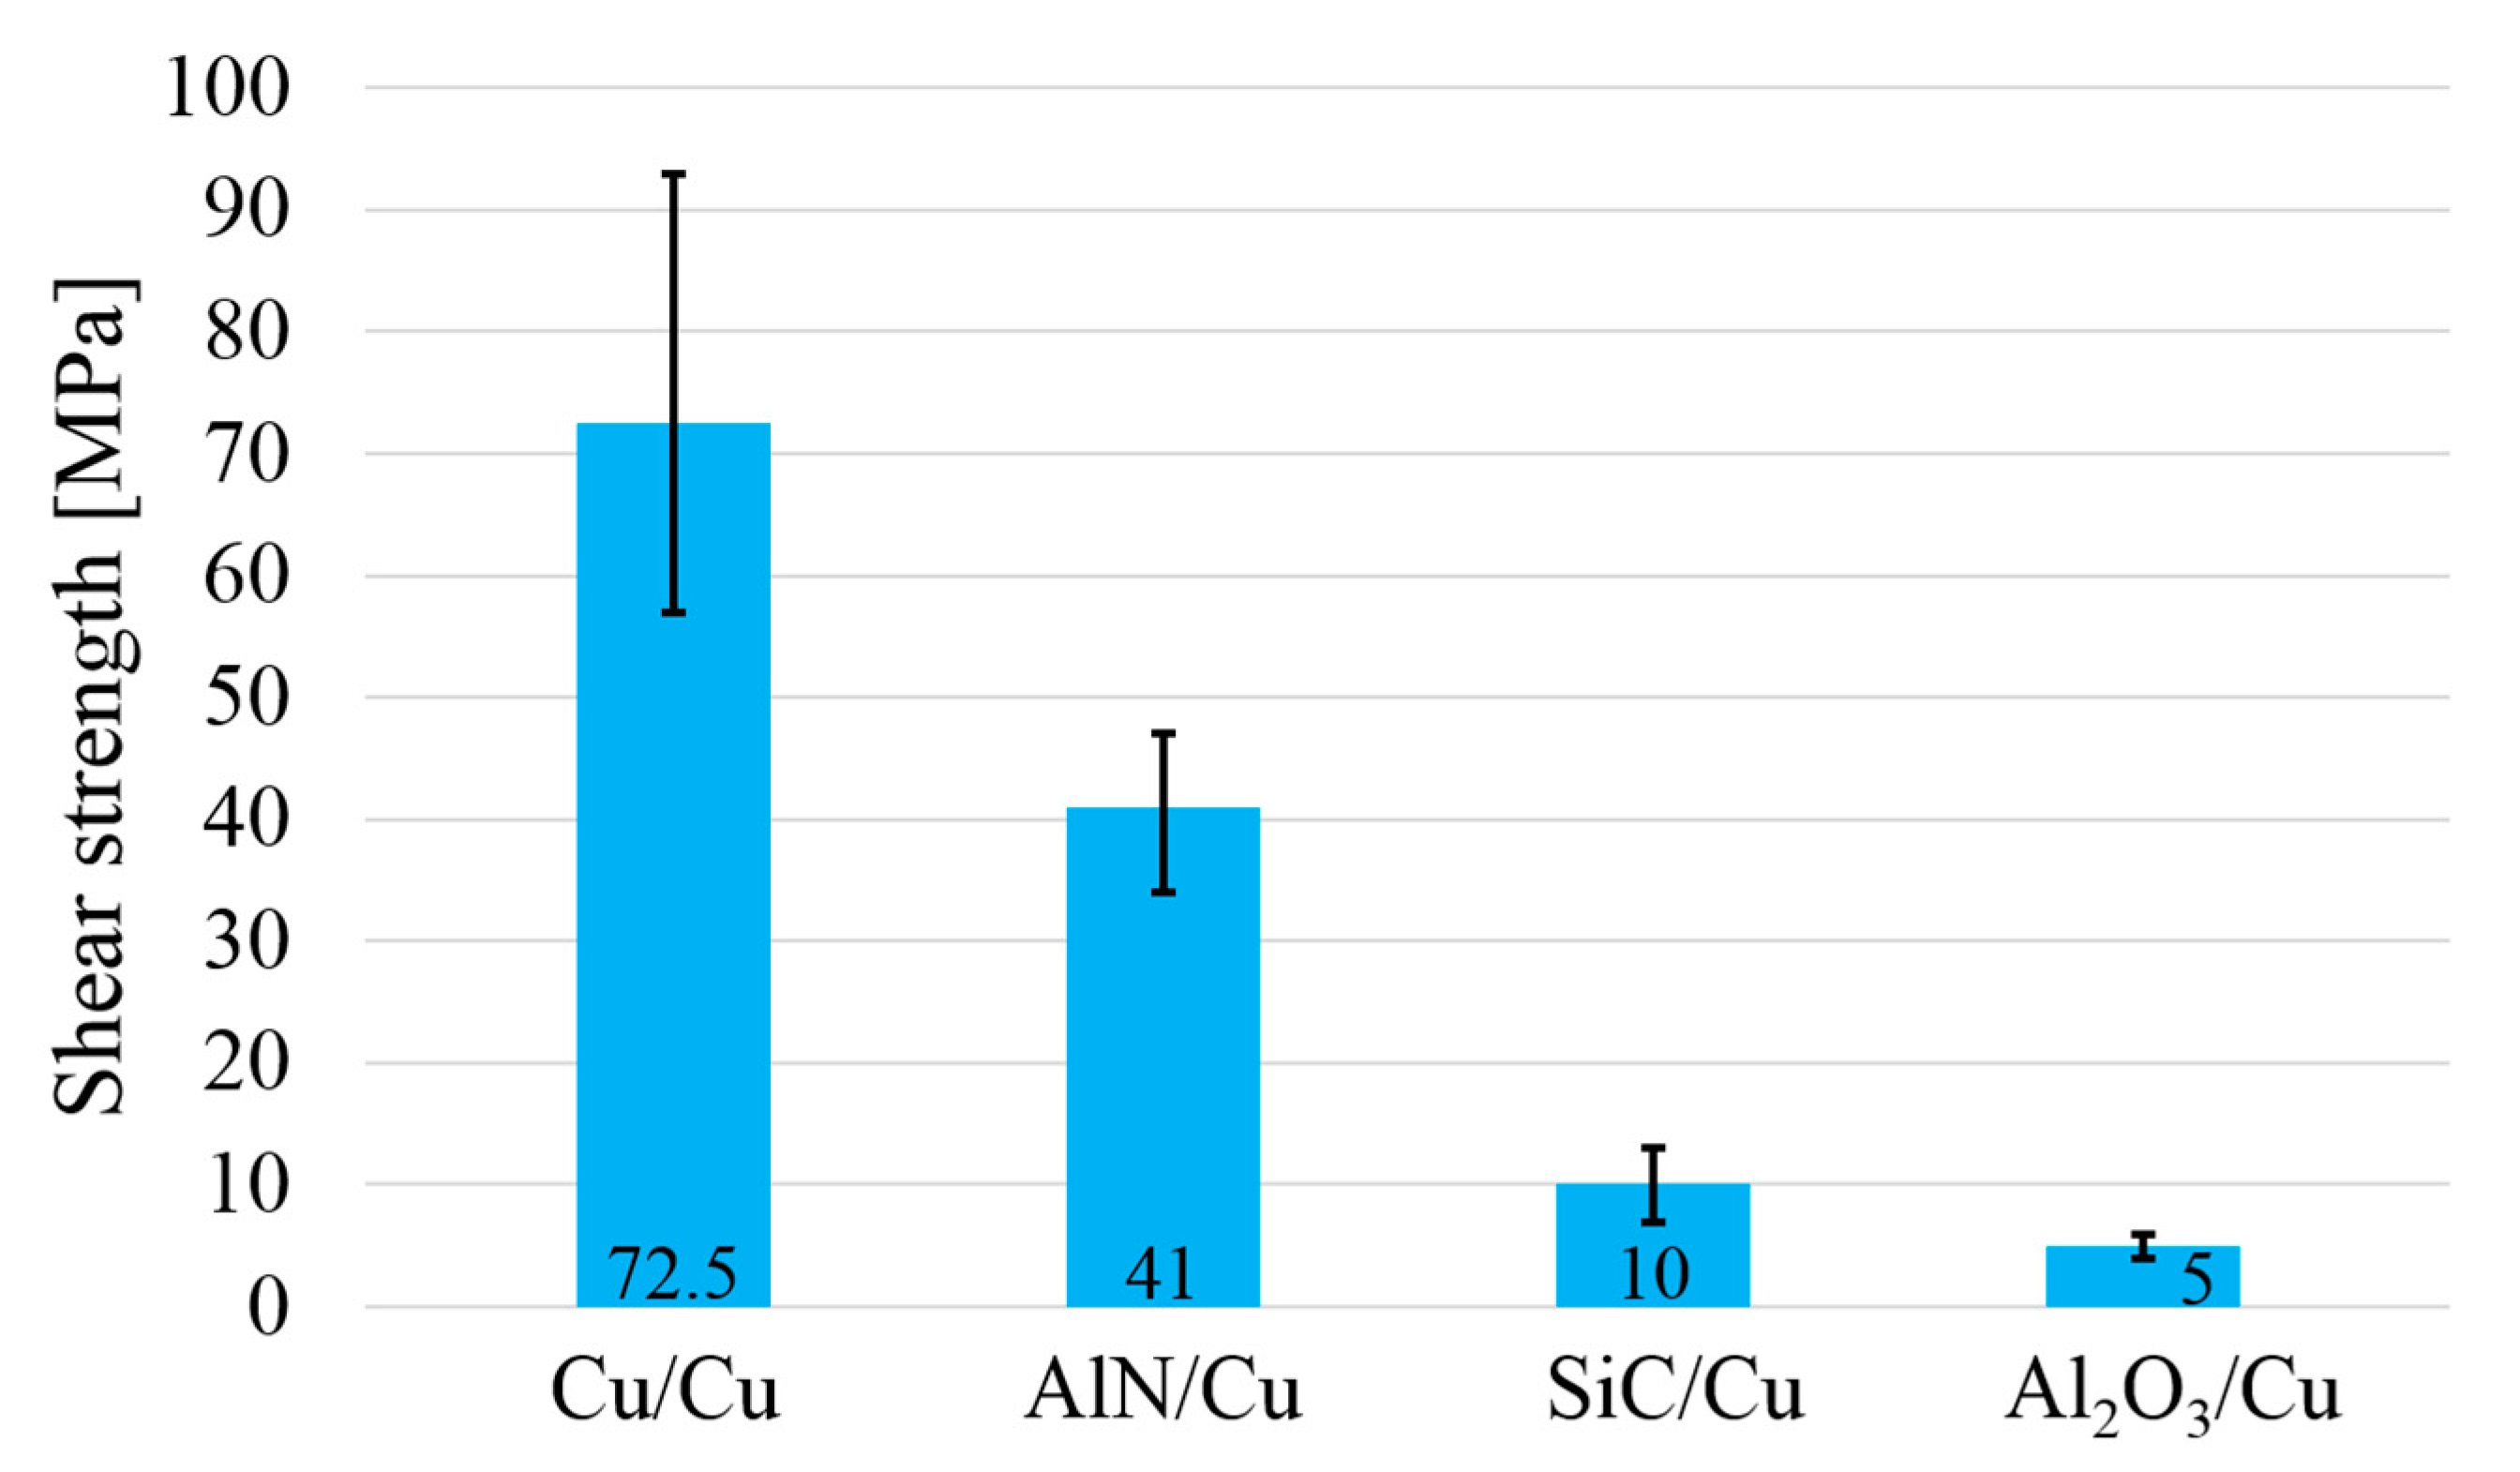
The shear strength of soldered joints.
Figure 21.
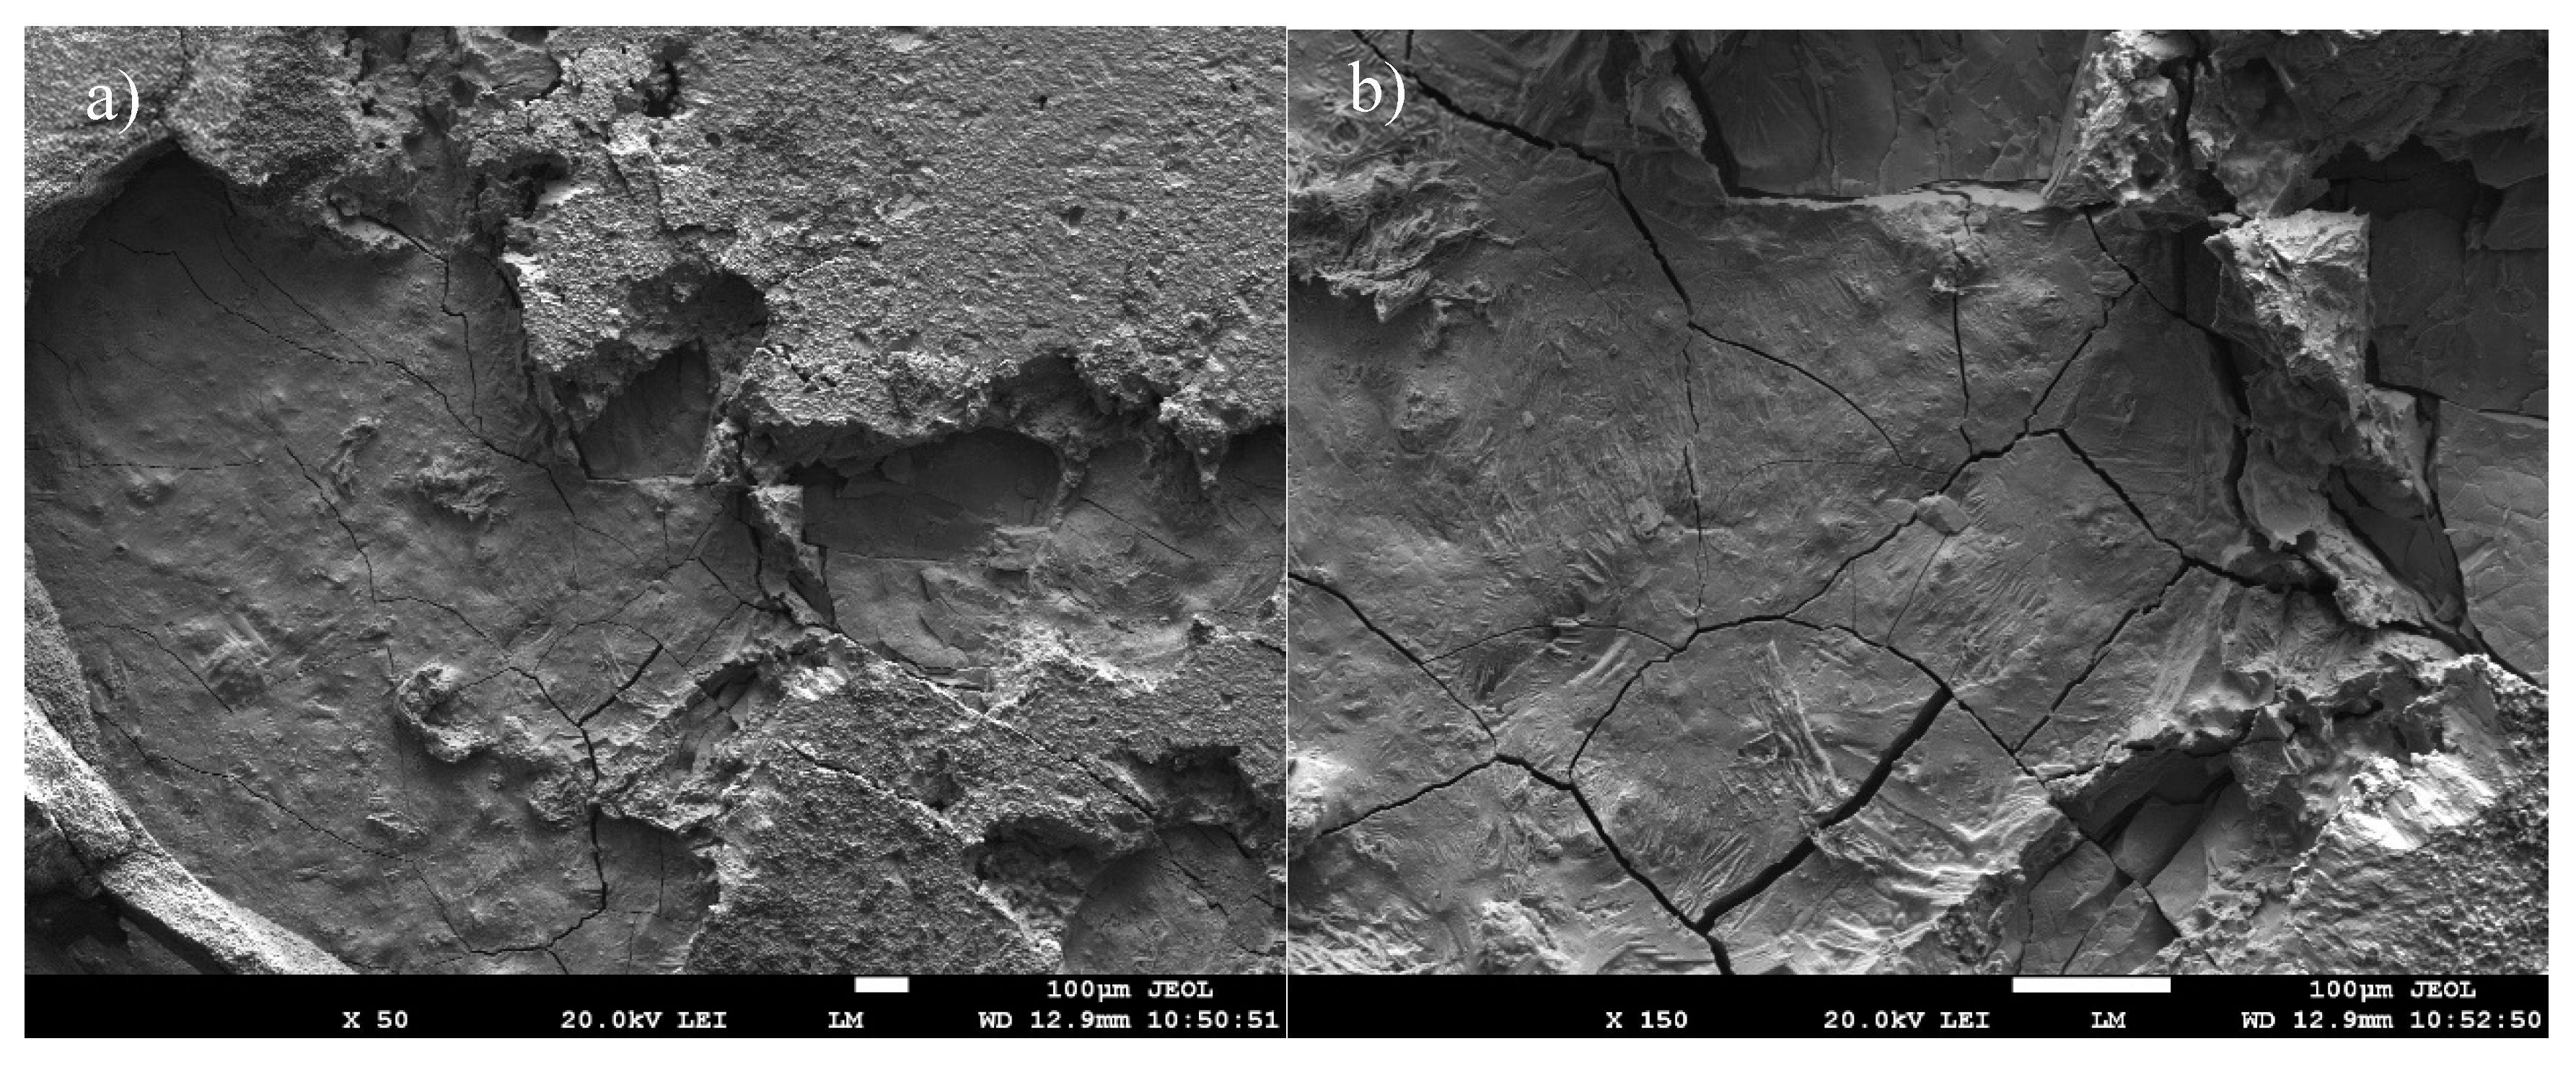
Fractured surface of soldered AlN/Zn5Al3Mg/Cu joint (a) magnification 50×, (b) magnification 150×.
Figure 22.
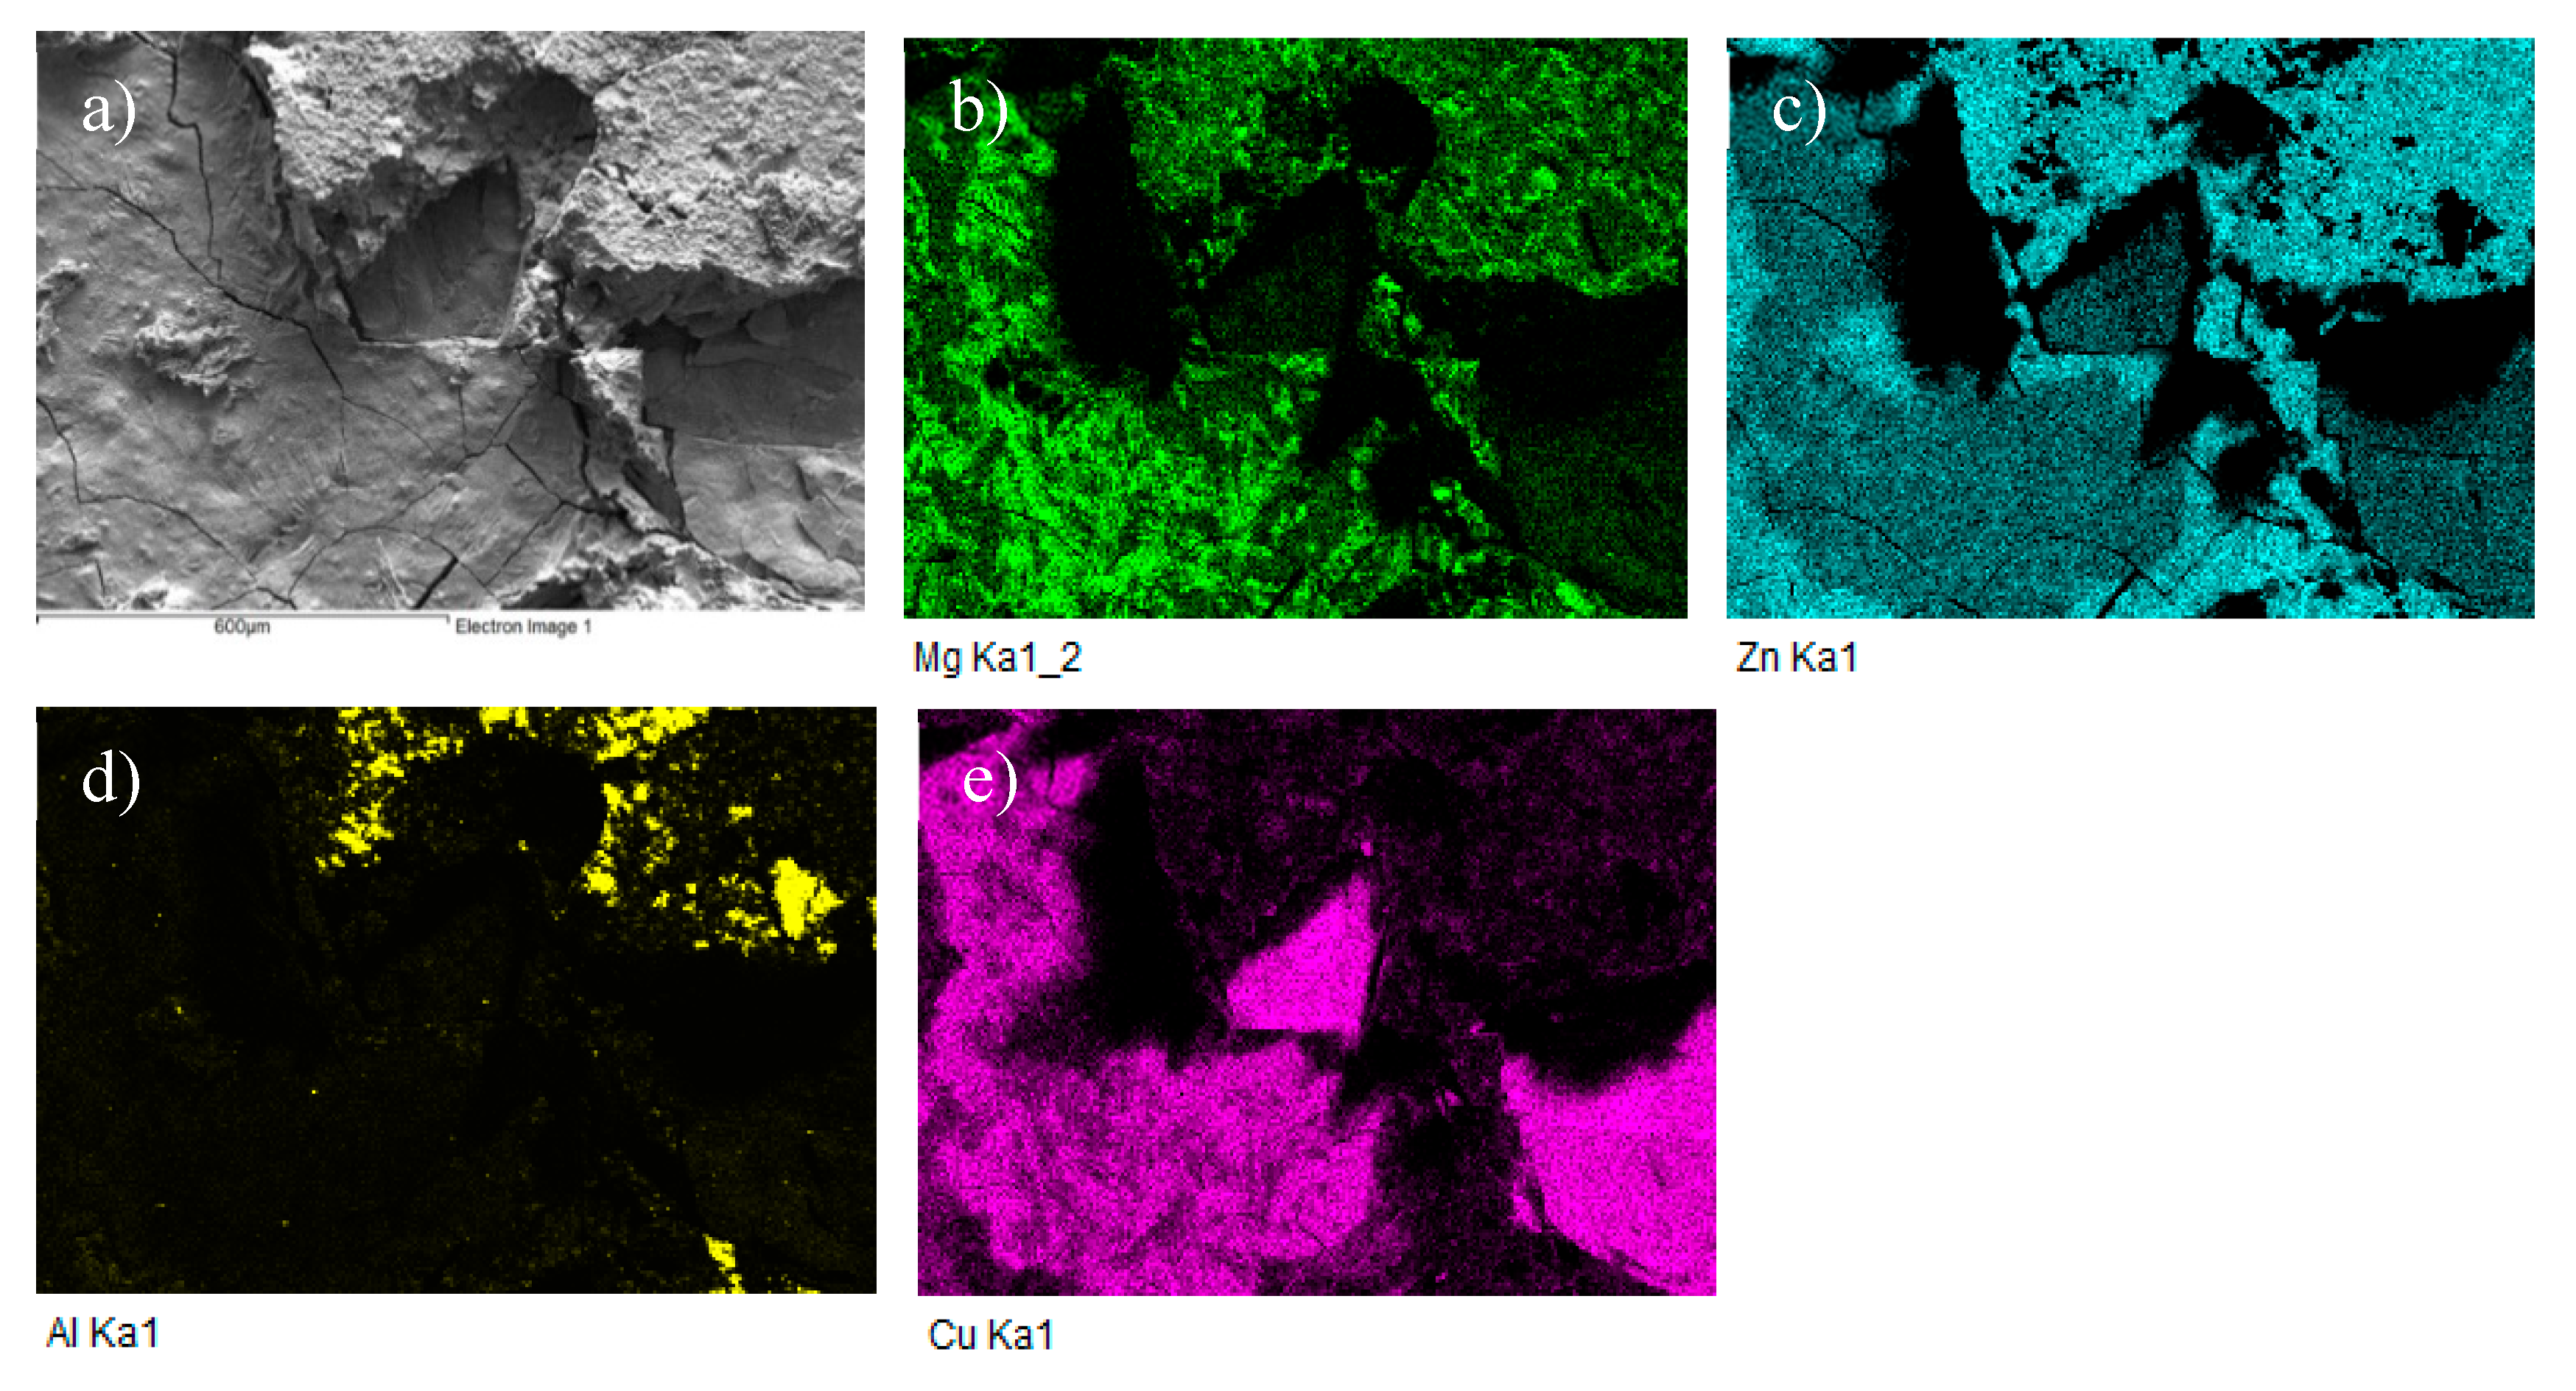
Fractured surface of soldered AlN/Zn5Al3Mg/Cu joint and the planar distribution of individual elements (a) fracture structure; (b) Mg; (c) Zn; (d) Al; (e) Cu.
Figure 23.
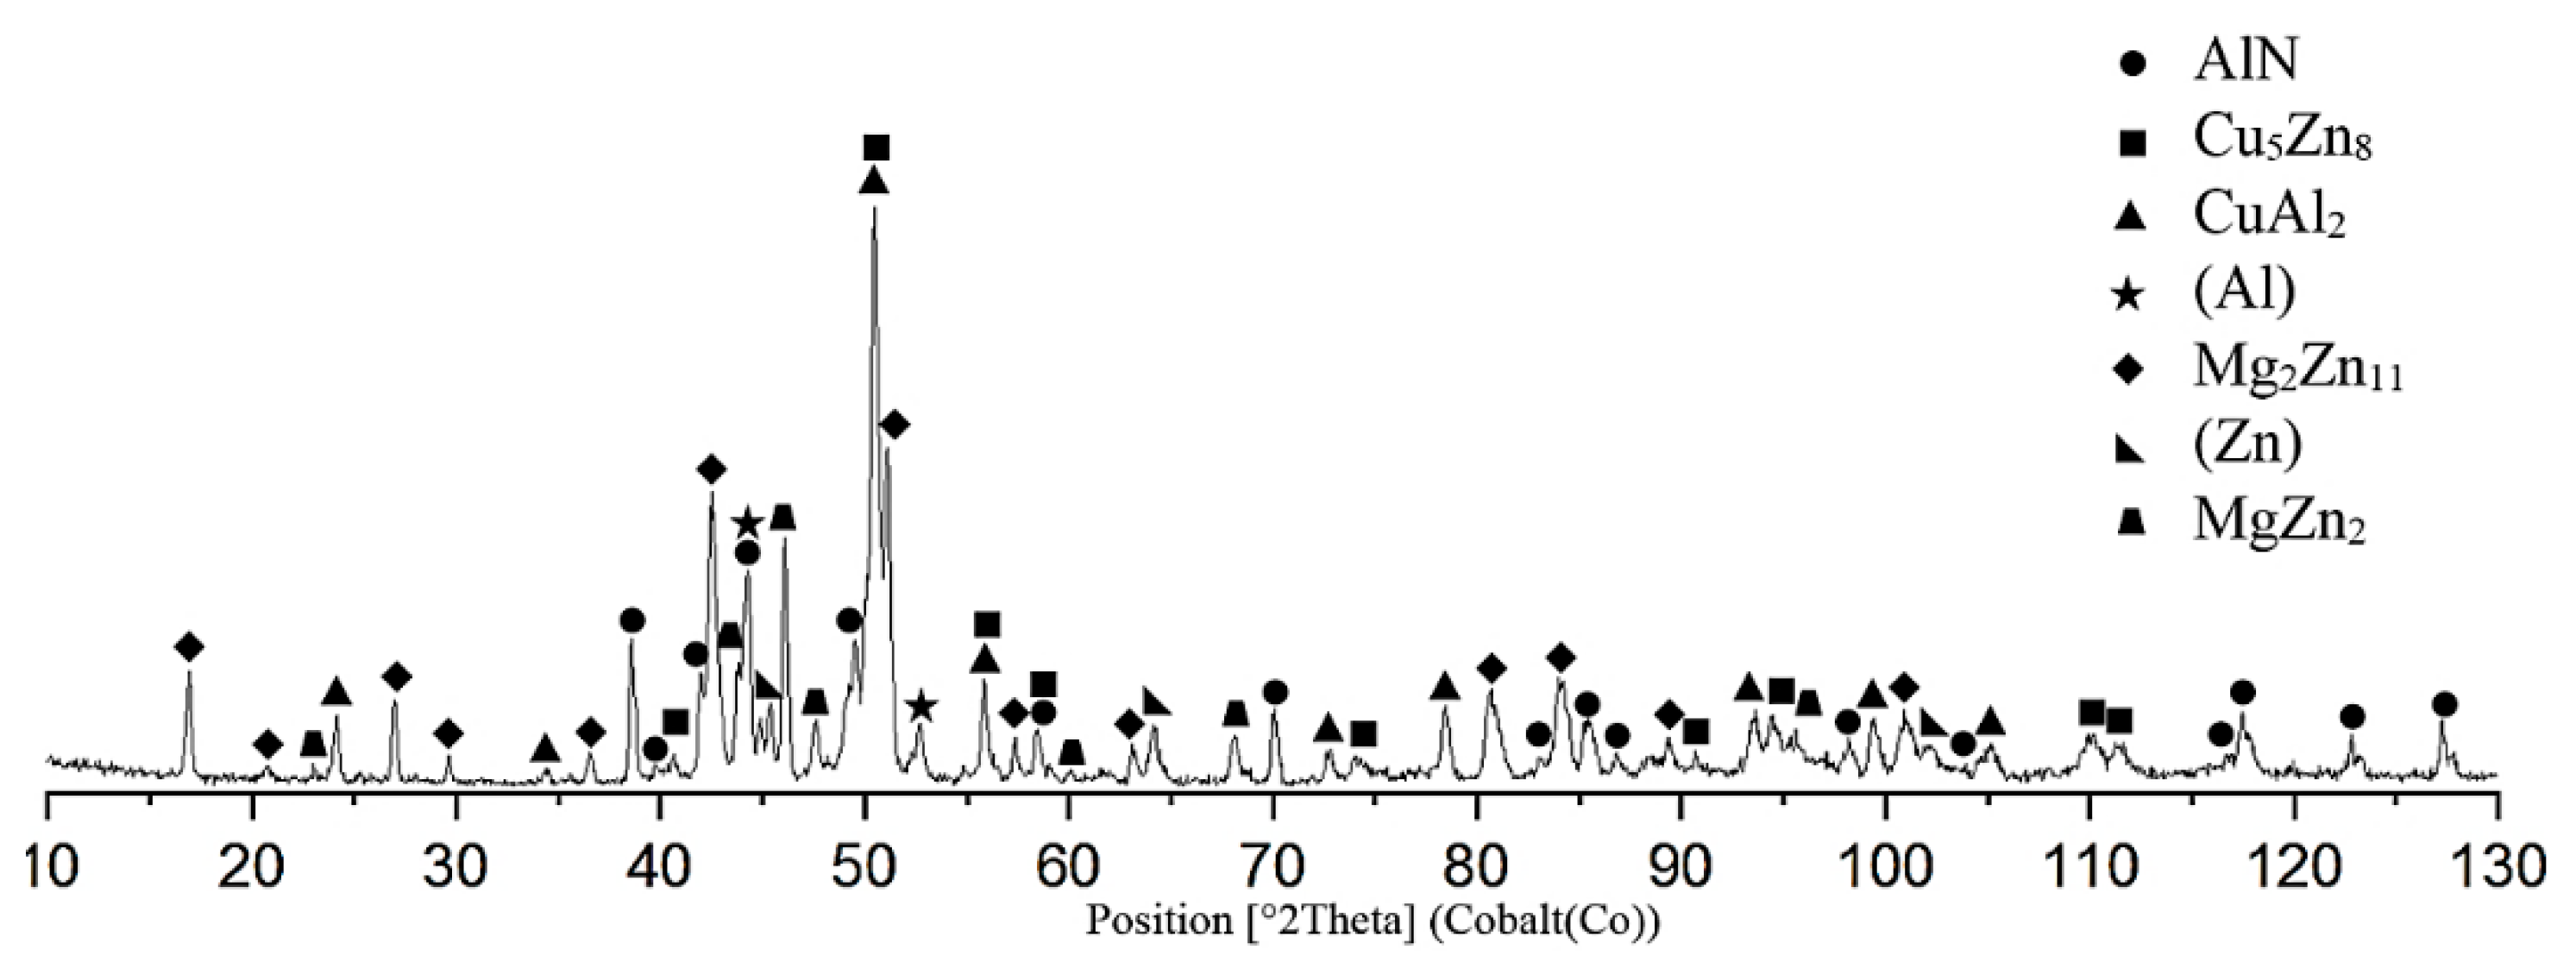
The XRD analysis of the fractured surface of AlN/Zn5Al3Mg/Cu joint.
Table 1.
Composition of Zn–Al and Zn–Al–Mg alloys and the results of chemical analysis by atomic emission spectrometry with induction coupled plasma (ICP-AES) [wt %].
| Sample | Charge [wt %] | ICP-AES [wt %] |
|---|
| Zn | Al | Mg | Zn | Al | Mg |
|---|
| Zn1Al | 99 | 1 | - | 99.07 | 0.93 ± 0.05 | - |
| Zn2Al | 98 | 2 | - | 97.97 | 2.03 ± 0.13 | - |
| Zn3Al | 97 | 3 | - | 97.12 | 2.88 ± 0.14 | - |
| Zn4Al | 96 | 4 | - | 95.99 | 4.01 ± 0.21 | - |
| Zn5Al | 95 | 5 | - | 94.89 | 5.11 ± 0.19 | - |
| Zn5Al1Mg | 94.0 | 5.0 | 1.0 | 94.26 | 4.71 ± 0.24 | 1.03 ± 0.06 |
| Zn5Al2Mg | 93.0 | 5.0 | 2.0 | 92.84 | 5.13 ± 0.26 | 2.03 ± 0.11 |
| Zn5Al3Mg | 92.0 | 5.0 | 3.0 | 91.98 | 5.07 ± 0.21 | 2.95 ± 0.18 |
Table 2.
Soldering parameters.
| Ultrasound Power | 400 | [W] |
| Working frequency | 40 | [kHz] |
| Amplitude | 2 | [μm] |
| Soldering temperature | 370 | [°C] |
| Time of ultrasound activation | 5 | [s] |
Table 3.
Temperatures of phase transformations by DSC analysis.
| Alloy | Heating [°C] |
|---|
| TL | T1 | T2 | T3 |
|---|
| Zn5Al3Mg | 356 | 348 | 340 | 275 |
| 354 | 346 | 339 | 275 |
Table 4.
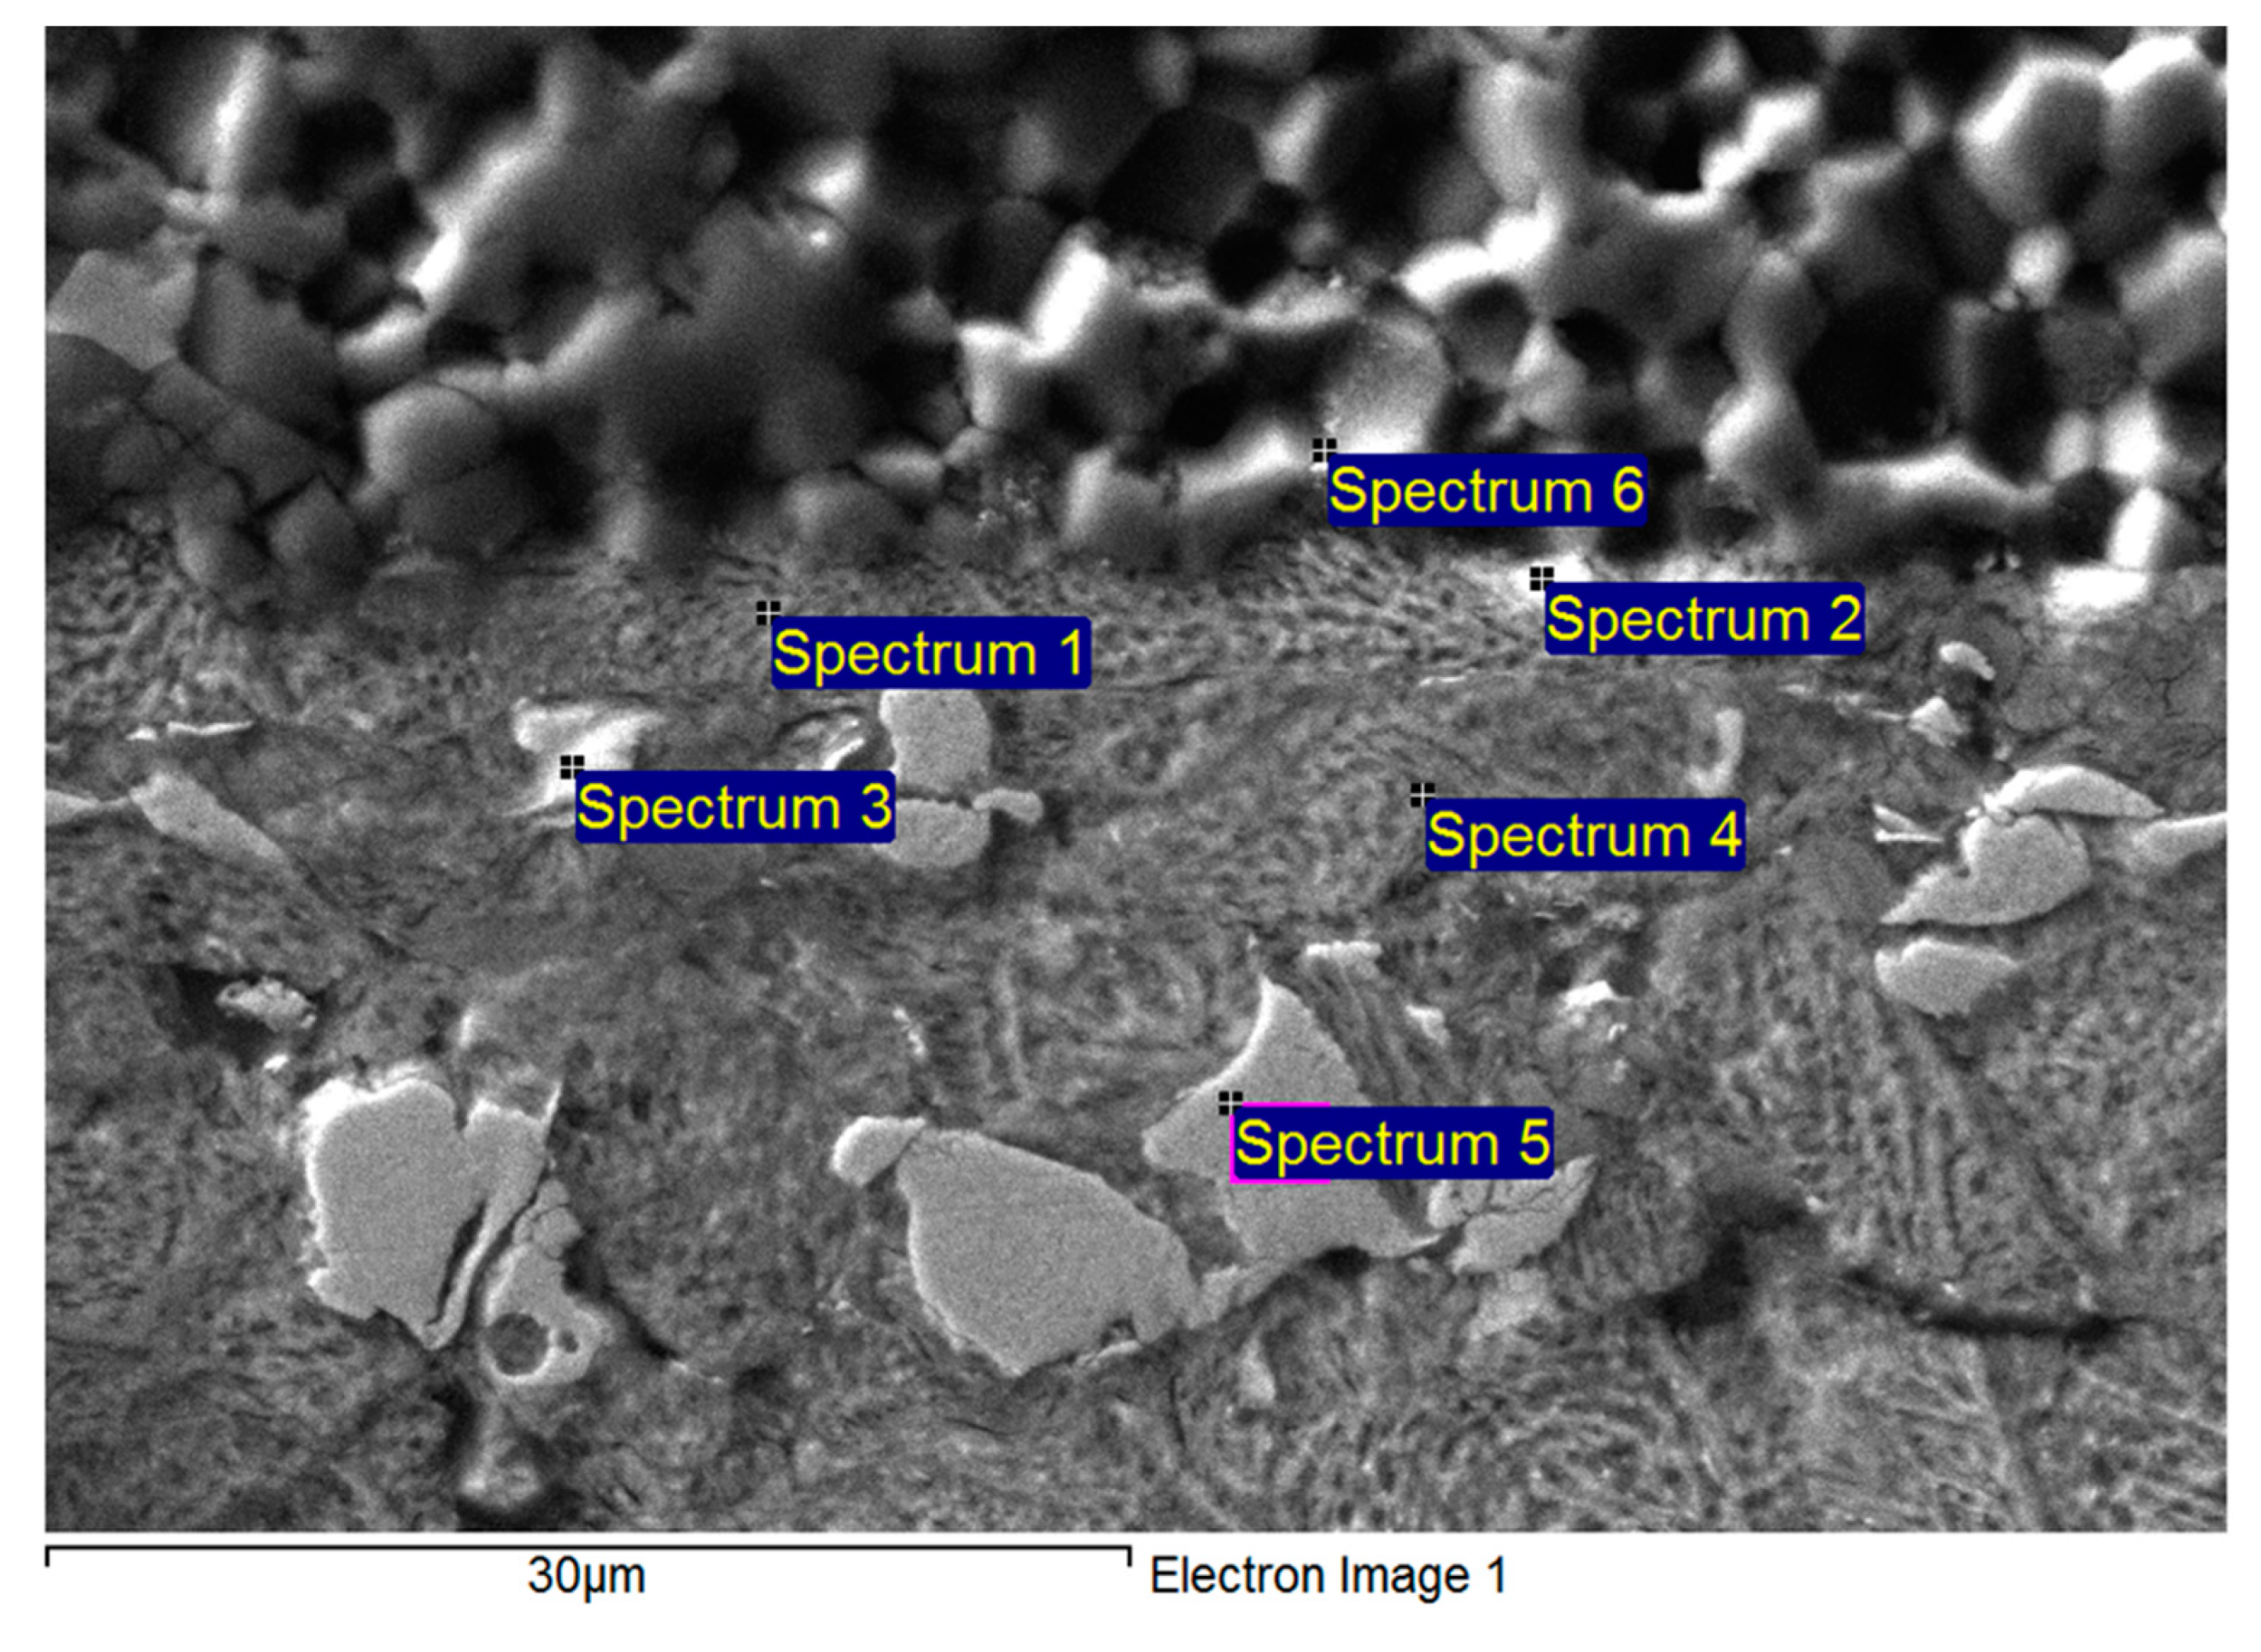
The phase composition results of Zn5Al3Mg solder alloy.
| Spectrum | Zn [wt %] | Al [wt %] | Mg [wt %] | Solder Component |
|---|
| Spectrum 1 | 82.022 | 2.014 | 15.964 | MgZn2 phase |
| Spectrum 1 | 81.623 | 1.957 | 16.420 | MgZn2 phase |
| Spectrum 2 | 78.405 | 21.595 | 0 | (Al“) phase |
| Spectrum 2 | 76.335 | 23.645 | 0 | (Al“) phase |
| Spectrum 3 | 90.836 | 1.744 | 7.420 | Mg2Zn11 phase |
| Spectrum 3 | 91.515 | 1.756 | 6.728 | Mg2Zn11 phase |
| Spectrum 4 | 96.941 | 3.059 | 0 | Zn–Al eutectic |
| Spectrum 4 | 98.235 | 1.765 | 0 | Zn–Al eutectic |
Table 5.
The phase composition results of AlN/Zn-Al-Mg joint boundary.
| Spectrum | Zn [wt.%] | Al [wt.%] | Mg [wt.%] | Cu [wt.%] | Component |
|---|
| Spectrum 1 | 55.43 | 29.35 | 6.76 | 8.45 | Solder matrix |
| Spectrum 2 | 47.11 | 39.42 | 7.18 | 6.29 | - |
| Spectrum 3 | 78.68 | 1.94 | 16.16 | 3.22 | MgZn2 phase |
| Spectrum 4 | 49.52 | 36.12 | 9.35 | 5.01 | Solder matrix |
| Spectrum 5 | 80.68 | 0.90 | 0 | 18.42 | CuZn4-ε phase |
| Spectrum 6 | 2.11 | 93.38 | 0.29 | 4.22 | AlN ceramics |
Table 6.
The phase composition results of Cu/Zn5Al3Mg boundary.
| Spectrum | Zn [wt %] | Al [wt %] | Mg [wt %] | Cu [wt %] | Component |
|---|
| Spectrum 3 | 73.88 | 2.18 | 16.46 | 7.48 | MgZn2 phase |
| Spectrum 3 | 73.22 | 2.12 | 16.51 | 8.14 | MgZn2 phase |
| Spectrum 4 | 80.56 | 2.00 | 0 | 17.44 | CuZn4 phase |
| Spectrum 4 | 78.63 | 2.63 | 0 | 18.74 | CuZn4 phase |
| Spectrum 5 | 76.43 | 2.80 | 14.08 | 6.79 | Probably MgZn2 phase |
| Spectrum 6 | 39.71 | 8.38 | 0 | 51.91 | Cu5Zn8 phase |
| Spectrum 6 | 42.10 | 7.77 | 0 | 50.13 | Cu5Zn8 phase |
| Spectrum 7 | 33.41 | 13.26 | 0 | 53.53 | - |
| Spectrum 7 | 33.84 | 13.21 | 0 | 52.96 | - |
| Spectrum 8 | 0 | 0 | 0 | 100 | pure Cu |
© 2020 by the authors. Licensee MDPI, Basel, Switzerland. This article is an open access article distributed under the terms and conditions of the Creative Commons Attribution (CC BY) license (http://creativecommons.org/licenses/by/4.0/).


