Article

Flotation Separation of Chalcopyrite and Molybdenite Assisted by Microencapsulation Using Ferrous and Phosphate Ions: Part I. Selective Coating Formation

1
Division of Sustainable Resources Engineering, Faculty of Engineering, Hokkaido University, Sapporo 060-8628, Japan
2
Cooperative Program for Resources Engineering, Graduate School of Engineering, Hokkaido University, Sapporo 060-8628, Japan
*
Author to whom correspondence should be addressed.
Metals 2020, 10(12), 1667; https://doi.org/10.3390/met10121667
Submission received: 6 November 2020 / Revised: 9 December 2020 / Accepted: 9 December 2020 / Published: 13 December 2020
(This article belongs to the Special Issue Advances in Selective Flotation and Leaching Process in Metallurgy)

Abstract

:
Porphyry Cu-Mo deposits, which are the most important sources of copper and molybdenum, are typically processed by flotation. In order to separate Cu and Mo minerals (mostly chalcopyrite and molybdenite), the strategy of depressing chalcopyrite while floating molybdenite has been widely adopted by using chalcopyrite depressants, such as NaHS, Na2S, and Nokes reagent. However, these depressants are potentially toxic due to their possibility to emit H2S gas. Thus, this study aims at developing a new concept for selectively depressing chalcopyrite via microencapsulation while using Fe2+ and PO43− forming Fe(III)PO4 coating. The cyclic voltammetry results indicated that Fe2+ can be oxidized to Fe3+ on the chalcopyrite surface, but not on the molybdenite surface, which arises from their different electrical properties. As a result of microencapsulation treatment using 1 mmol/L Fe2+ and 1 mmol/L PO43−, chalcopyrite was much more coated with FePO4 than molybdenite, which indicated that selective depression of chalcopyrite by the microencapsulation technique is highly achievable.

1. Introduction

Porphyry Cu-Mo deposits are the most important sources of copper (Cu) and molybdenum (Mo), because they account for about 60% and 50% of the world’s Cu and Mo productions [1]. In porphyry Cu-Mo deposits, chalcopyrite (CuFeS2) and molybdenite (MoS2) are the predominant Cu and Mo minerals [2,3], and they are separately recovered as Cu and Mo concentrates via a two-step process: (i) bulk flotation in order to produce Cu-Mo bulk concentrates; (ii) the selective flotation of molybdenite from Cu-Mo bulk concentrates. Bulk flotation is conducted with the assistance of proper collectors, such as xanthate for chalcopyrite and insoluble nonpolar oily collectors (e.g., diesel, kerosene, or fuel oil) for molybdenite [4,5], and pH adjuster (e.g., quick lime (CaO) or slaked lime (Ca(OH)2) to increase the pulp pH at >10 where iron sulfides (mostly pyrite (FeS2)) are depressed due to the competitive adsorption of OH that inhibits xanthate adsorption on the surface of iron sulfides [6]. After this, the Cu-Mo bulk concentrates are treated with chalcopyrite depressant (e.g., sodium hydrosulfide (NaHS), sodium sulfide (Na2S), and Nokes reagent (P2S5 + NaOH)) in order to depress chalcopyrite while floating molybdenite [5]. These reagents function as chalcopyrite depressants by producing HS that desorbs the adsorbed xanthate on the chalcopyrite surface and/or reduces the pulp potential, in which chalcopyrite does not float [7].
Although the conventional chalcopyrite depressants are effective in separating Cu and Mo minerals from bulk Cu-Mo bulk concentrates, these have the potential to generate toxic hydrogen sulfide gas (H2S(g)) when pulp pH is not properly controlled [3,5,8]. At a pH below 10, for example, H2S(aq) species starts forming and it is readily vaporized due to its high vapor pressure [7]. Thus, the flotation circuits should consist of covered flotation cells with an active ventilation system to avoid the accident that is caused by H2S emission [5,7,9]. Moreover, the corrosive nature of H2S that destroys pipelines and imperfect molybdenite recovery are other drawbacks of using conventional depressants [3,7,8,10].
Because of the above-mentioned limitations, there have been many attempts to replace the conventional chalcopyrite depressants with alternative depressants for molybdenite (e.g., dextrin [11,12], lignosulfonates [13], O-carboxymethyl chitosan [14,15], carboxymethylcellulose [16], humic acid [17], etc.) and chalcopyrite (e.g., sodium sulfite (Na2SO3) [3], pseudo-glycolythiourea acid (PGA) [18], 2,3-disulfanylbutanedioic acid (DMSA) [19], disodium bis (carboxymethyl) trithiocarbonate (DBT) [20], chitosan [21], etc.). Between these two approaches, the strategy of depressing chalcopyrite is more preferred than depressing molybdenite, because, in porphyry deposits, the amount of molybdenite is lower when compared to that of chalcopyrite (i.e., Cu grade, 0.44%; Mo grade, 0.018%) [2]. In the case that molybdenite depresses while chalcopyrite floats, the mechanical entrainment of molybdenite could occur within a large volume of froth products, resulting in the loss of valuable molybdenite, which is critical, because molybdenite recovery is of importance for Cu-Mo processing plants to be economically viable [22].
Miki et al. [9] reported that the difference in electrical resistivity between chalcopyrite and molybdenite can be utilized for reducing the floatability of chalcopyrite selectively. The electrical resistances of chalcopyrite and molybdenite are 234 Ω and 1.2–1.5 MΩ, respectively, so electrochemical reactions occur more preferably on the surface of chalcopyrite than that of molybdenite [9]. Based on these distinctively different electrical properties of minerals, this study investigated the application of microencapsulation technique while using ferrous (Fe2+) and phosphate (PO43−) ions as a pretreatment for depressing the floatability of chalcopyrite. Due to the extremely high electrical resistivity of molybdenite, Fe2+ is hardly oxidized to ferric ion (Fe3+); however, chalcopyrite has a low electrical resistivity and, thus, Fe2+ can be oxidized to Fe3+, which then reacts with PO43− and forms ferric phosphate (FePO4) on the surface of chalcopyrite, rendering it hydrophilic. This is the first part of a two-part paper, the aim of which is to investigate whether microencapsulation while using Fe2+ and PO43− can selectively create FePO4 coating on the surface of chalcopyrite rather than that of molybdenite. Specifically, the overall scope of this part is as follows: (i) elucidating the mechanism of selective coating formation via an electrochemical technique (i.e., cyclic voltammetry (CV)) and (ii) confirming whether chalcopyrite is selectively coated with FePO4 via shake-flask experiments that are coupled with surface characterizations (i.e., scanning electron microscopy with energy-dispersive X-ray spectroscopy (SEM-EDX) and X-ray photoelectron spectroscopy (XPS)). A follow-up paper will discuss the effect of microencapsulation using Fe2+ and PO43− on the selective depression of chalcopyrite in Cu-Mo flotation separation.

2. Materials and Methods

2.1. Mineral Samples

Chalcopyrite and molybdenite were obtained from Copper Queen Mine, Cochise County, AZ, USA and Spain Mine, Renfrew County, ON, Canada, respectively. The samples were crushed by a jaw crusher (BB 51, Retsch Inc. Haan, Germany), ground by a vibratory disc mill (RS 100, Retsch Inc., Haan, Germany), and then screened in order to obtain a size fraction of less than 75 µm. Mineralogical and chemical compositions of the samples were determined by X-ray diffraction (XRD; Figure 1) and X-ray fluorescence (XRF; Table 1). The chalcopyrite sample is composed of mainly chalcopyrite with pyrite and silicate minerals (e.g., quartz (SiO2), amesite (Mg2Al2SiO5(OH)4), and actinolite (Ca2(Mg,Fe2+)5Si8O22(OH)2)) as impurities, while molybdenite sample is highly pure and only contains trace amounts of impurities, as can be seen.

2.2. Stability of Fe2+ in the Presence of PO43− vs. pH

The stability of Fe2+ in the presence of PO43− was investigated as a function of pH in order to decide the suitable pH condition for FePO4 coating formation on chalcopyrite to be selective. For this, a solution containing 1 mmol/L FeSO4·7H2O and 1 mmol/L KH2PO4 was prepared, and its pH was adjusted in the pH range of 2–6 while using dilute HCl and NaOH. All of the chemicals used in this study were of reagent grade (Wako Pure Chemical Industries, Ltd., Osaka, Japan). After pH adjustment, the solution was allowed to stabilize for 10 min. at room temperature under magnetic stirring (400 rpm). Afterwards, the solutions were filtered through 0.2 μm syringe-driven membrane filters (LMS Co. Ltd., Tokyo, Japan), and then analyzed by inductively coupled plasma atomic emission spectrometer (ICP-AES, ICPE-9820, Shimadzu Corporation, Kyoto, Japan) in order to identify the changes in dissolved Fe concentration.

2.3. Electrochemical Behaviors of Fe2+ on Chalcopyrite and Molybdenite

The electrochemical behaviors of Fe2+ on chalcopyrite and molybdenite were investigated by CV while using an electrochemical measurement unit (SI 1280B, Solartron Analytical, Farnborough, UK) with a conventional three-electrode system consisting of a mineral (chalcopyrite or molybdenite) working electrode, a platinum (Pt) counter electrode, and an Ag/AgCl (saturated KCl) reference electrode. The mineral electrodes were prepared in an identical way that was illustrated in our previous works [23,24]. Two types of electrolyte solutions were prepared: (i) 0.1 mol/L Na2SO4 and (ii) 1 mmol/L FeSO4·7H2O and 0.1 mol/L Na2SO4, both of which were adjusted to pH 4. The solution was equilibrated at 25 °C and then deoxygenated by N2 purging for 30 min. After this, three electrodes were inserted and equilibrated at open circuit potential (OCP), and then CV was measured under the following conditions: initial scan polarity, positive; potential scan range, −0.8 to +0.8 V; scan rate, 30 mV/s.

2.4. Microencapsulation Treatment

Prior to the microencapsulation treatment, mineral samples were washed in order to remove the effects that are caused by the presence of oxidized layers formed during sample preparation. The washing procedure is as follows: ultrasonic cleaning in ethanol, acid washing (1.0 M HNO3), triple rinsing with de-ionized (DI) water (18.2 MΩ·cm), dewatering with acetone, and drying in a vacuum desiccator [25].
For the microencapsulation treatment, 1 g of washed mineral (e.g., chalcopyrite or molybdenite) and 10 mL of a solution containing 1 mmol/L Fe2+ and 1 mmol/L PO43− (pH 4) were put into a 50-mL Erlenmeyer flask and then shaken in a constant temperature water bath at 25 °C and 120 min−1 for 1–6 h. After predetermined time intervals, the suspensions were filtered through 0.2 μm syringe-driven membrane filters and then analyzed by ICP-AES. Treated minerals were thoroughly washed with DI water, dried in a vacuum dry oven (40 °C), and then analyzed by SEM-EDX (JSM-IT200, JEOL Ltd., Tokyo, Japan) and XPS (JPS-9200, JEOL Ltd., Tokyo, Japan). The XPS analysis was conducted using an Al Kα X-ray source operated at 100 W (Voltage, 10 kV; Current, 10 mA) under ultrahigh vacuum conditions (approximately 10−7 Pa). The narrow scan spectra were calibrated while using the binding energy of adventitious carbon (C 1s) (285.0 eV) for charge correction. For deconvolutions of the spectra, XPSPEAK version 4.1 (Raymond WM Kwok, Chinese University of Hong Kong, Hong Kong, China) was used with an 80% Gaussian–20% Lorentzian peak model and a true Shirley background [26,27].

3. Results

3.1. Stability of Fe2+ in the Presence of PO43− vs. pH

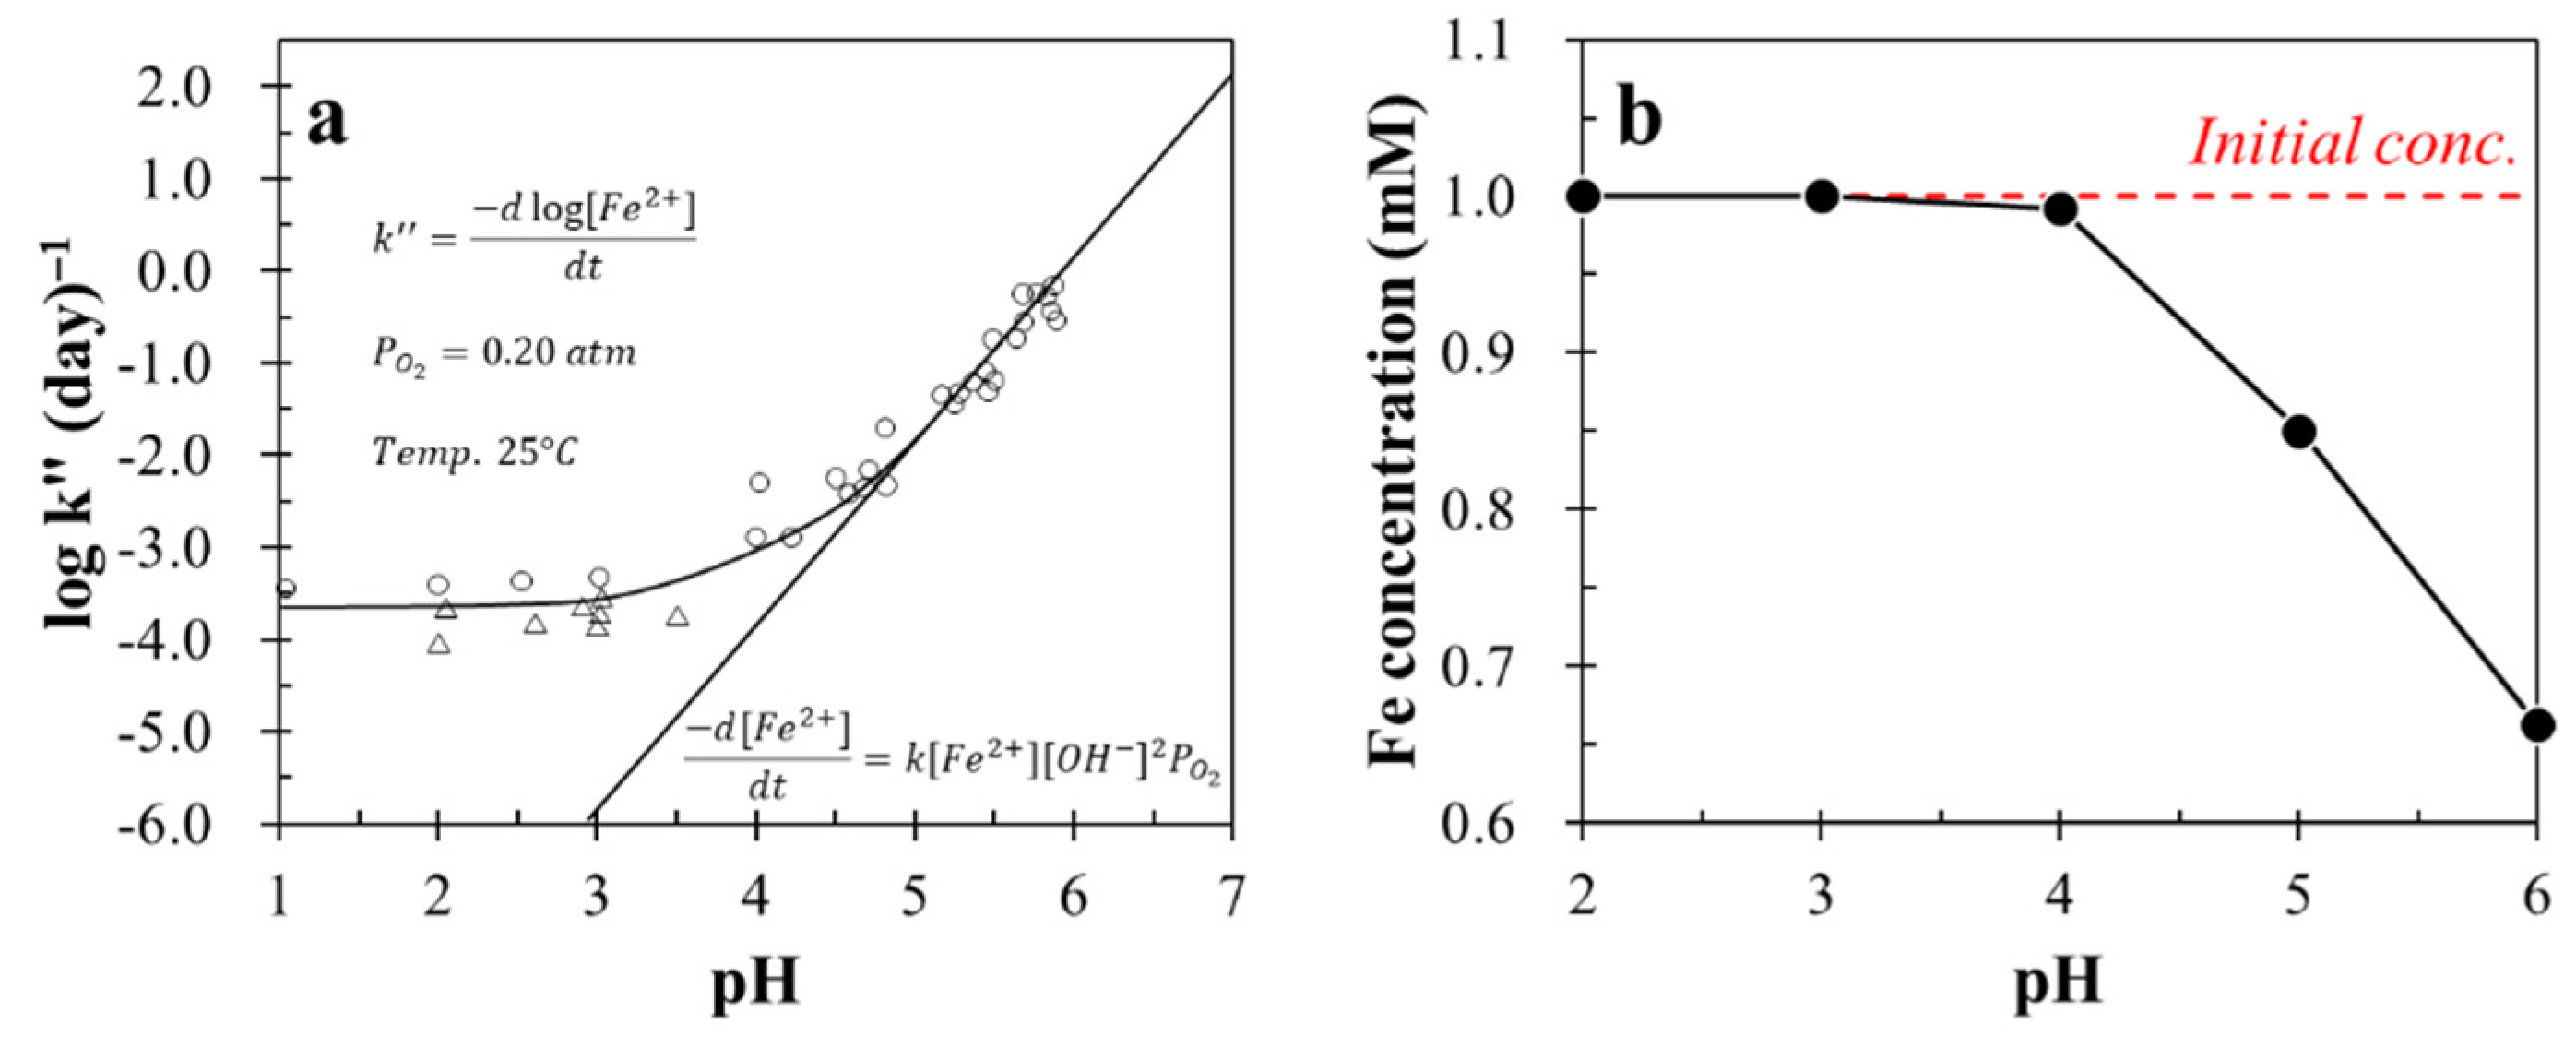
The oxidation rate of Fe2+ to Fe3+ by dissolved oxygen (DO) is known to be pH-dependent [28,29]. Fe2+ oxidation rate under acidic conditions (i.e., pH < 4) is very slow and independent of pH, as shown in Figure 2a. However, at pH ≥ 5 Fe2+, the Fe2+ oxidation rate shows the second order dependence on [OH], indicating that a 100-fold increase in the rate occurs for a unit increase in pH [28]. In the studied system, not only Fe2+, but also PO43− coexist, so the stability of Fe2+ in the presence of PO43− as a function of pH was investigated (Figure 2b). The concentration of Fe2+ was almost not changed between pH 2 and 4, but above which Fe2+ concentration decreases rapidly. This result is identical to that reported by previous works [28,29], indicating that Fe2+ is stable at pH < 4, even in the presence of PO43−. The oxidation of Fe2+ by DO is not preferred, because the selective coating formation could only be achieved when Fe2+ oxidation occurs on the surface of chalcopyrite. Thus, pH 4 was selected for microencapsulation treatment to be selective.

3.2. Electrochemical Behavior of Fe2+ on Chalcopyrite and Molybdenite

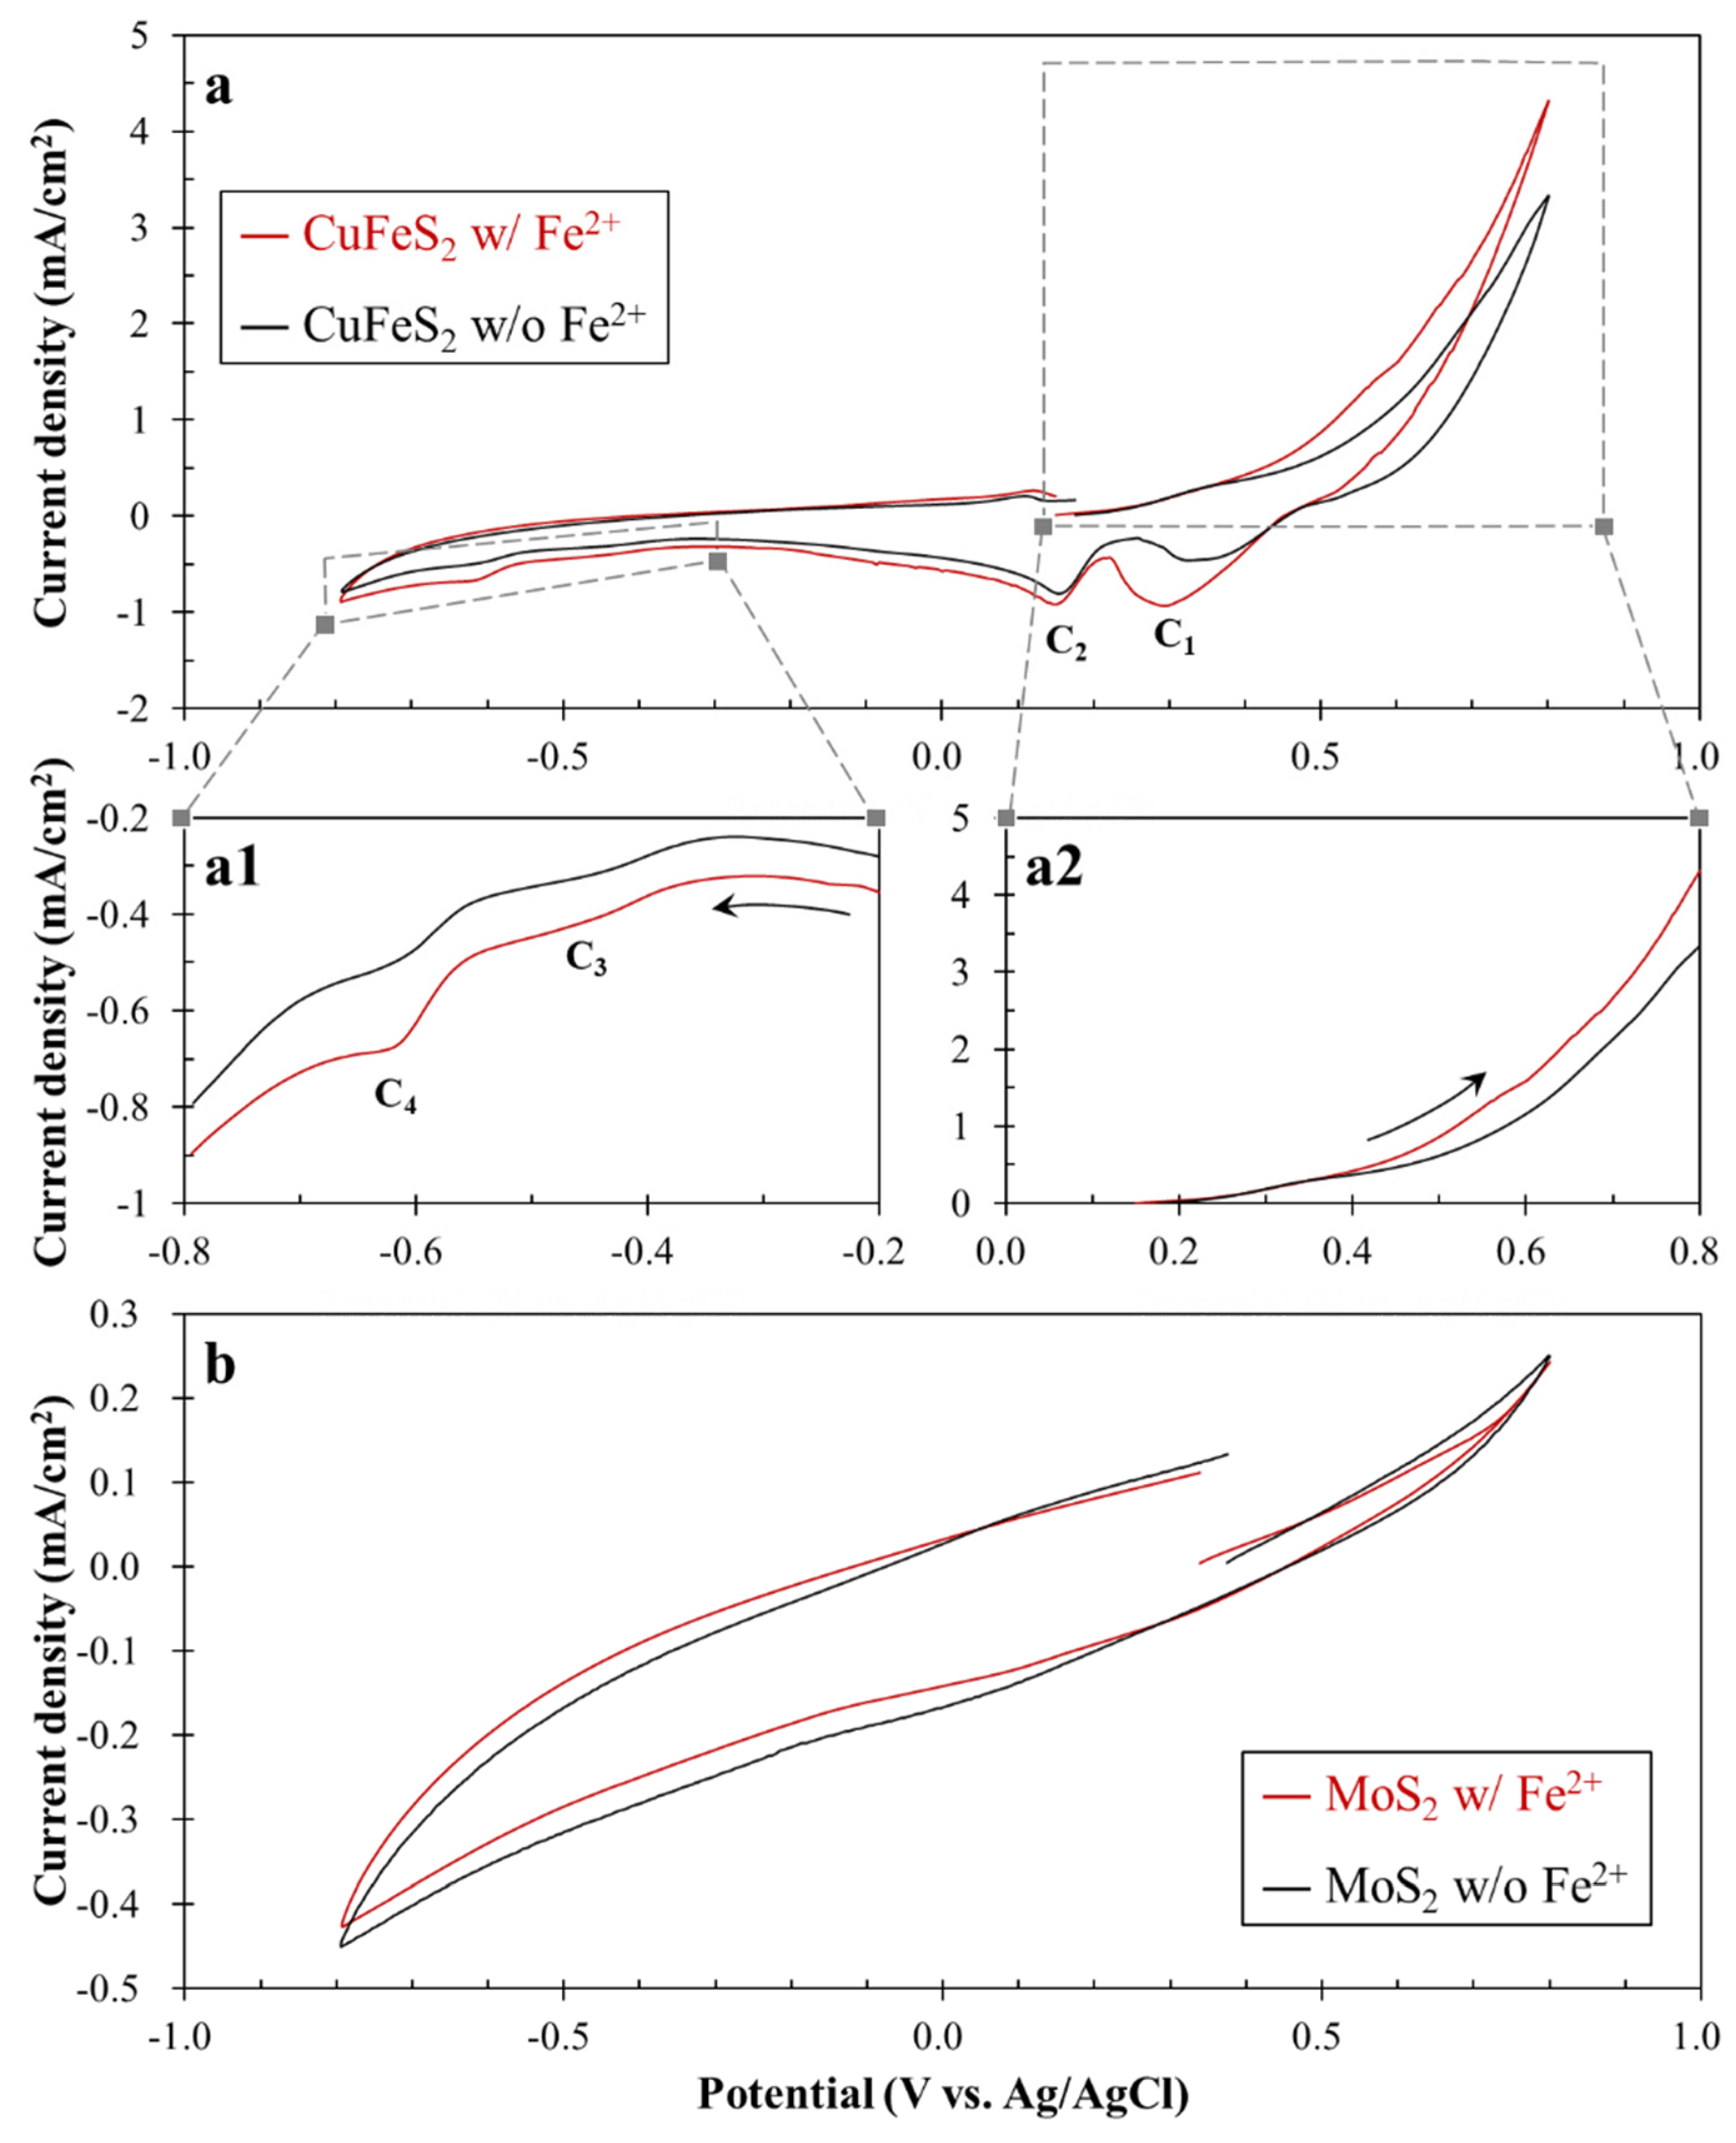
Figure 3 shows the cyclic voltammograms of chalcopyrite (Figure 3a) and molybdenite (Figure 3b) in the absence and presence of 1 mmol/L Fe2+. The current density was continuously increased as the applied potential increased, which means that chalcopyrite as well as its oxidation products (e.g., Fe2+) were oxidized (Equations (1) and (2)), as shown in the first anodic scan of chalcopyrite in the absence of Fe2+ (Figure 3(a2)) [30,31,32]. When 1 mmol/L Fe2+ was present, the current density was apparently increased as compared to that without Fe2+. This increase in current density most likely resulted from the oxidation of Fe2+ to Fe3+ (Equation (2)).
CuFeS2 → Cu(1 − x)Fe(1 − y)S(2 − z) + xCu2+ + yFe2+ + zS0 + 2(x + y)e
Fe2+ → Fe3+ + e
During the cathodic scan in the absence of 1 mmol/L Fe2+, it exhibited four cathodic peaks (C1, C2, C3, and C4), as shown in Figure 3a,(a1). According to Holiday and Richmond [31], the first two cathodic peaks (C1 and C2) were due to the reduction of dissolved species, like Fe3+ and Cu2+. Holiday and Richmond [31] executed cathodic linear-sweep voltammetry while using stationary and rotating chalcopyrite electrodes, both of which were pretreated at 0.65 V vs. SCE for 2 min., and found out that two cathodic peaks at 0.38 and 0.15 V vs. SCE observed in the voltammogram using a stationary electrode were absent when the electrode was rotated. Thus, the appearance of C1 and C2 can be explained by the reduction of Fe3+ to Fe2+ at 0.3–0.4 V (Equation (3)) and the formation of covellite (CuS) at 0.1–0.2 V (Equation (4)), respectively. At the applied potential between −0.4 and −0.7 V, two additional peaks (C3 and C4) were observed (Figure 3(a1)), which resulted from the reduction of CuS to chalcocite (Cu2S) and S0 to H2S, as illustrated in Equations (5) and (6) [30,31,32].
Fe3+ + e → Fe2+
Cu2+ + S0 + 2e → CuS
2CuS + 2H+ + 2e → Cu2S + H2S
S0 + 2H+ + 2e → H2S
Similarly, these four cathodic peaks (C1, C2, C3, and C4) were also observed in the voltammogram in the presence of 1 mmol/L Fe2+; however, it is important to note that the current density of C1 was obviously increased. This indicates that more Fe3+ was generated during the anodic scan of chalcopyrite in the presence of 1 mmol/L Fe2+ as compared to that of control. On the other hand, cyclic voltammograms of molybdenite showed that there is no clear difference between the absence and presence of 1 mmol/L Fe2+ (Figure 3b). It is most likely attributed to the low electrical conductivity of molybdenite, making the electrochemical reactions of Fe2+/Fe3+ redox couple hard to occur on its surface. Therefore, the cyclic voltammetry results imply that the selective oxidation of Fe2+ on the chalcopyrite surface is highly possible.

3.3. Microencapsulation Treatment for Chalcopyrite and Molybdenite

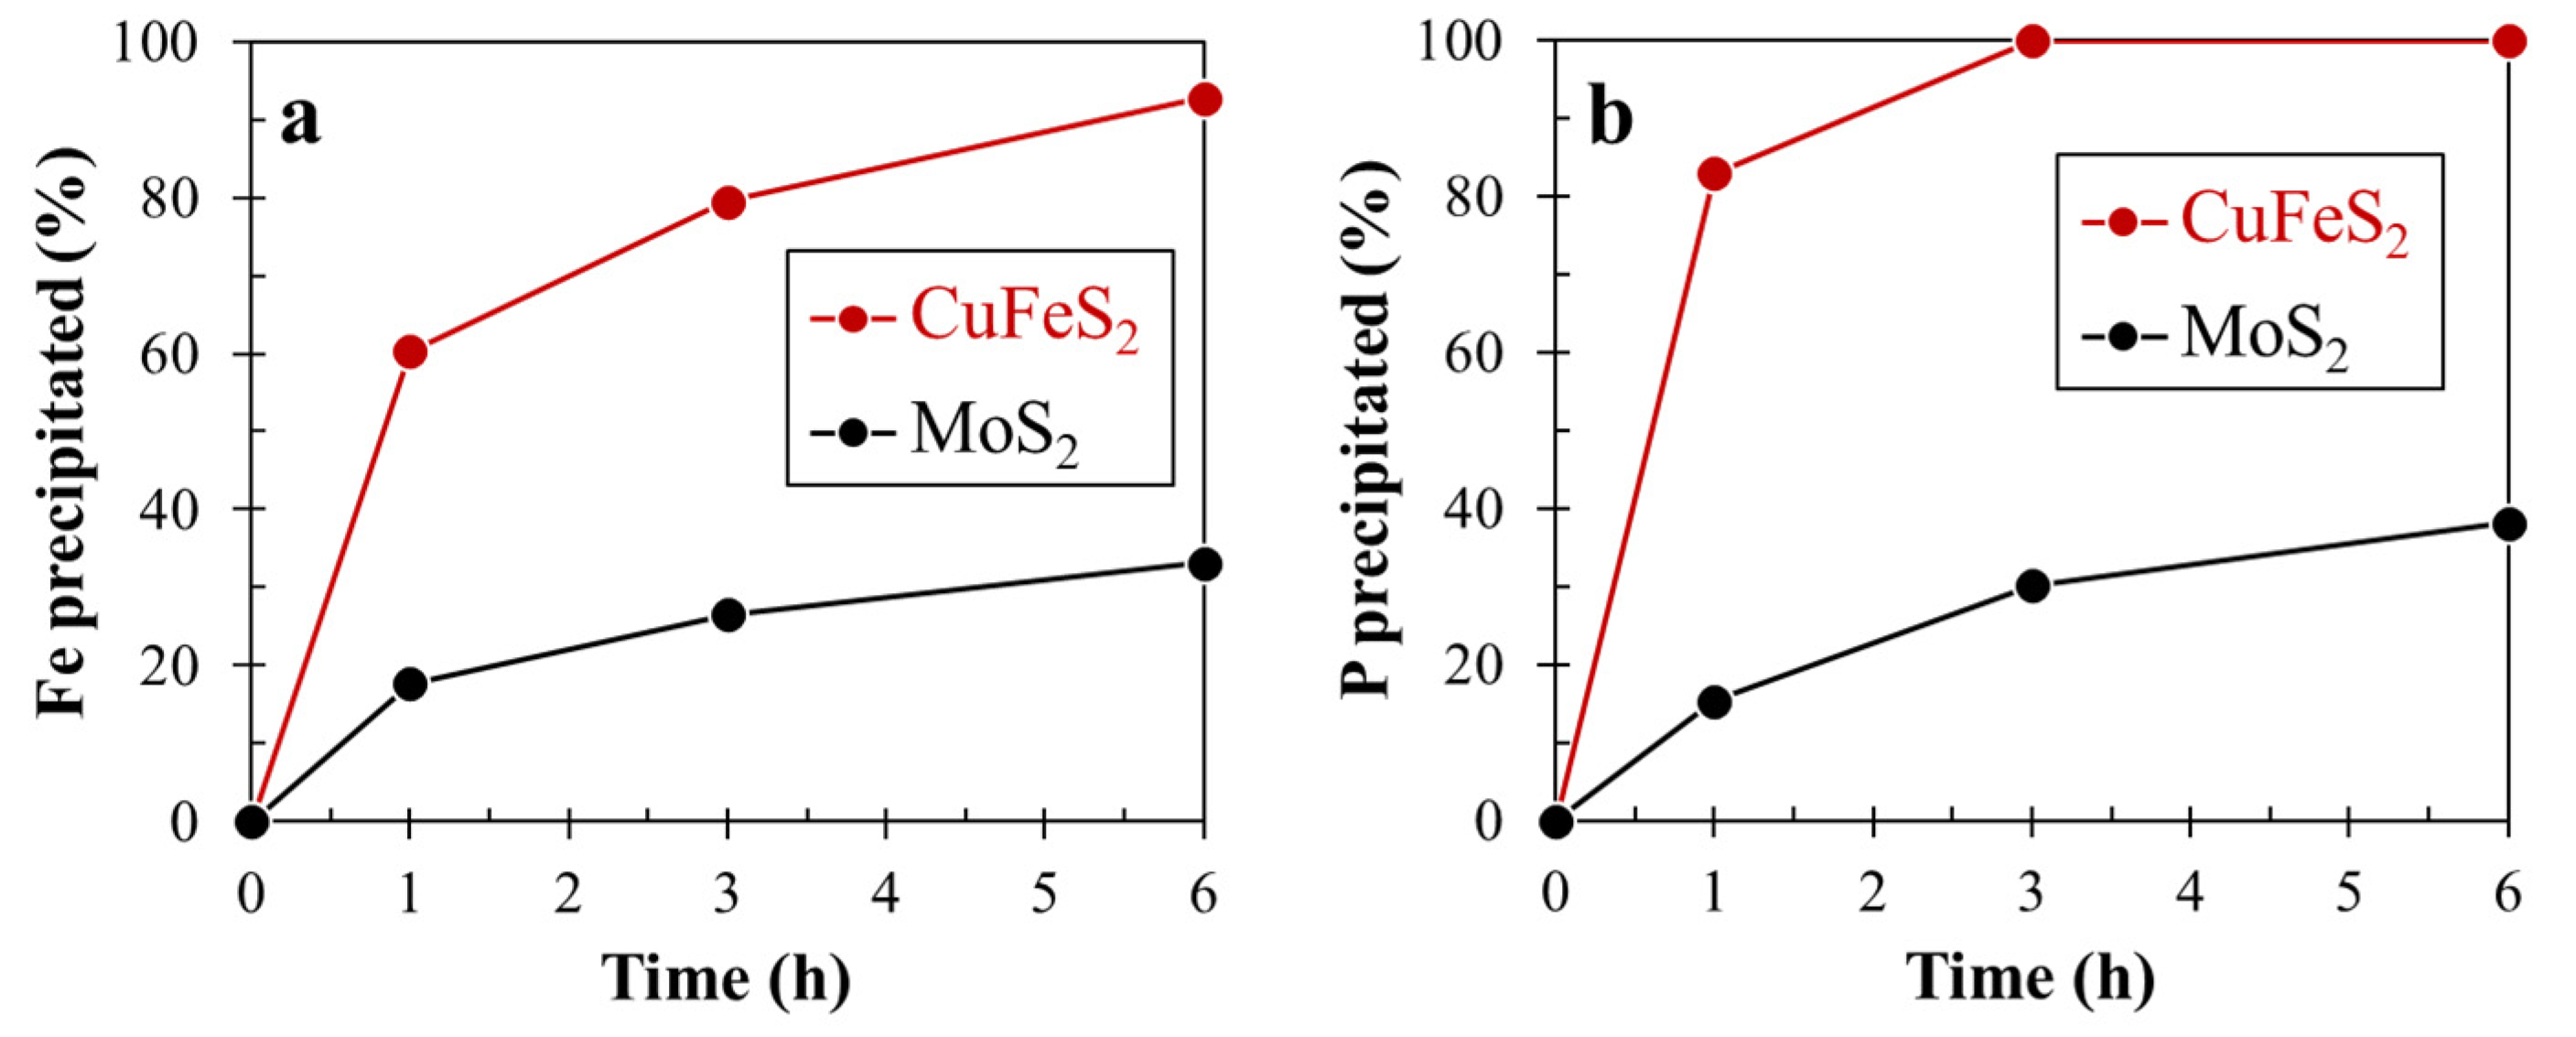
Figure 4 shows the precipitation rates of dissolved Fe and P during microencapsulation treatment for chalcopyrite and molybdenite. The precipitation rate is calculated by the following equation:
Precipitation rate (%) = (Ci − Ct)/Ci × 100%
where Ci is the initial concentration of dissolved Fe or P in mg/L, and Ct is the concentration of dissolved Fe or P in mg/L at time t. As shown in Figure 4a, the precipitation of dissolved Fe considerably occurred in the presence of chalcopyrite; that is, around 60% of Fe2+ was precipitated after 1 h treatment and it reached 93% after 6 h. Similarly, dissolved P was also significantly precipitated with chalcopyrite (Figure 4b). When compared to the precipitation rate of dissolved P, the precipitated amount of dissolved Fe was a bit low. This is probably due to chalcopyrite dissolution that releases Fe2+/3+, resulting in the lowering of the Fe precipitation rate. These results indicate that Fe2+ is oxidized to Fe3+ on the surface of chalcopyrite, then, the resultant product (i.e., Fe3+) reacts with H2PO4, a dominant species of phosphate at pH 4, forming FePO4, as shown in the following equation:
Fe3+ + H2PO4 → FePO4↓ + 2H+
It is interesting to note that, even during microencapsulation treatment for molybdenite, around 20–40% of dissolved Fe and P were precipitated (Figure 4a,b). Although the CV results indicated that Fe2+ oxidation could not occur on the surface of molybdenite (Figure 3b), the precipitation of dissolved Fe and P apparently occurred in the presence of molybdenite. These opposite results are attributed to the different electrical resistivity of different sides (e.g., basal and edge planes) of molybdenite [9]. Miki et al. [9] investigated electrolysis oxidation treatment while using basal- and edge-plane-oriented molybdenite electrodes and confirmed that electron transfer was actively pursued through the edge plane when compared to that through the basal plane. At an applied potential of 1.0 V vs. SHE, for example, the current density of the edge-plane electrode was around 0.1 mA/cm2, lasting for 800 s, while it was closed to 0 mA/cm2 in the case of the basal-plane electrode. The particle size of molybdenite used in this study is less than 75 μm. As the size of molybdenite particle reduces, the ratio of basal-plane/edge-plane also decreases [33]. This means that electron transfer reactions, like Fe2+ oxidation on fine molybdenite, become easier to occur when compared to coarse molybdenite. Thus, approximately 20–40% of dissolved Fe and P were precipitated during the reaction with molybdenite (Figure 4).
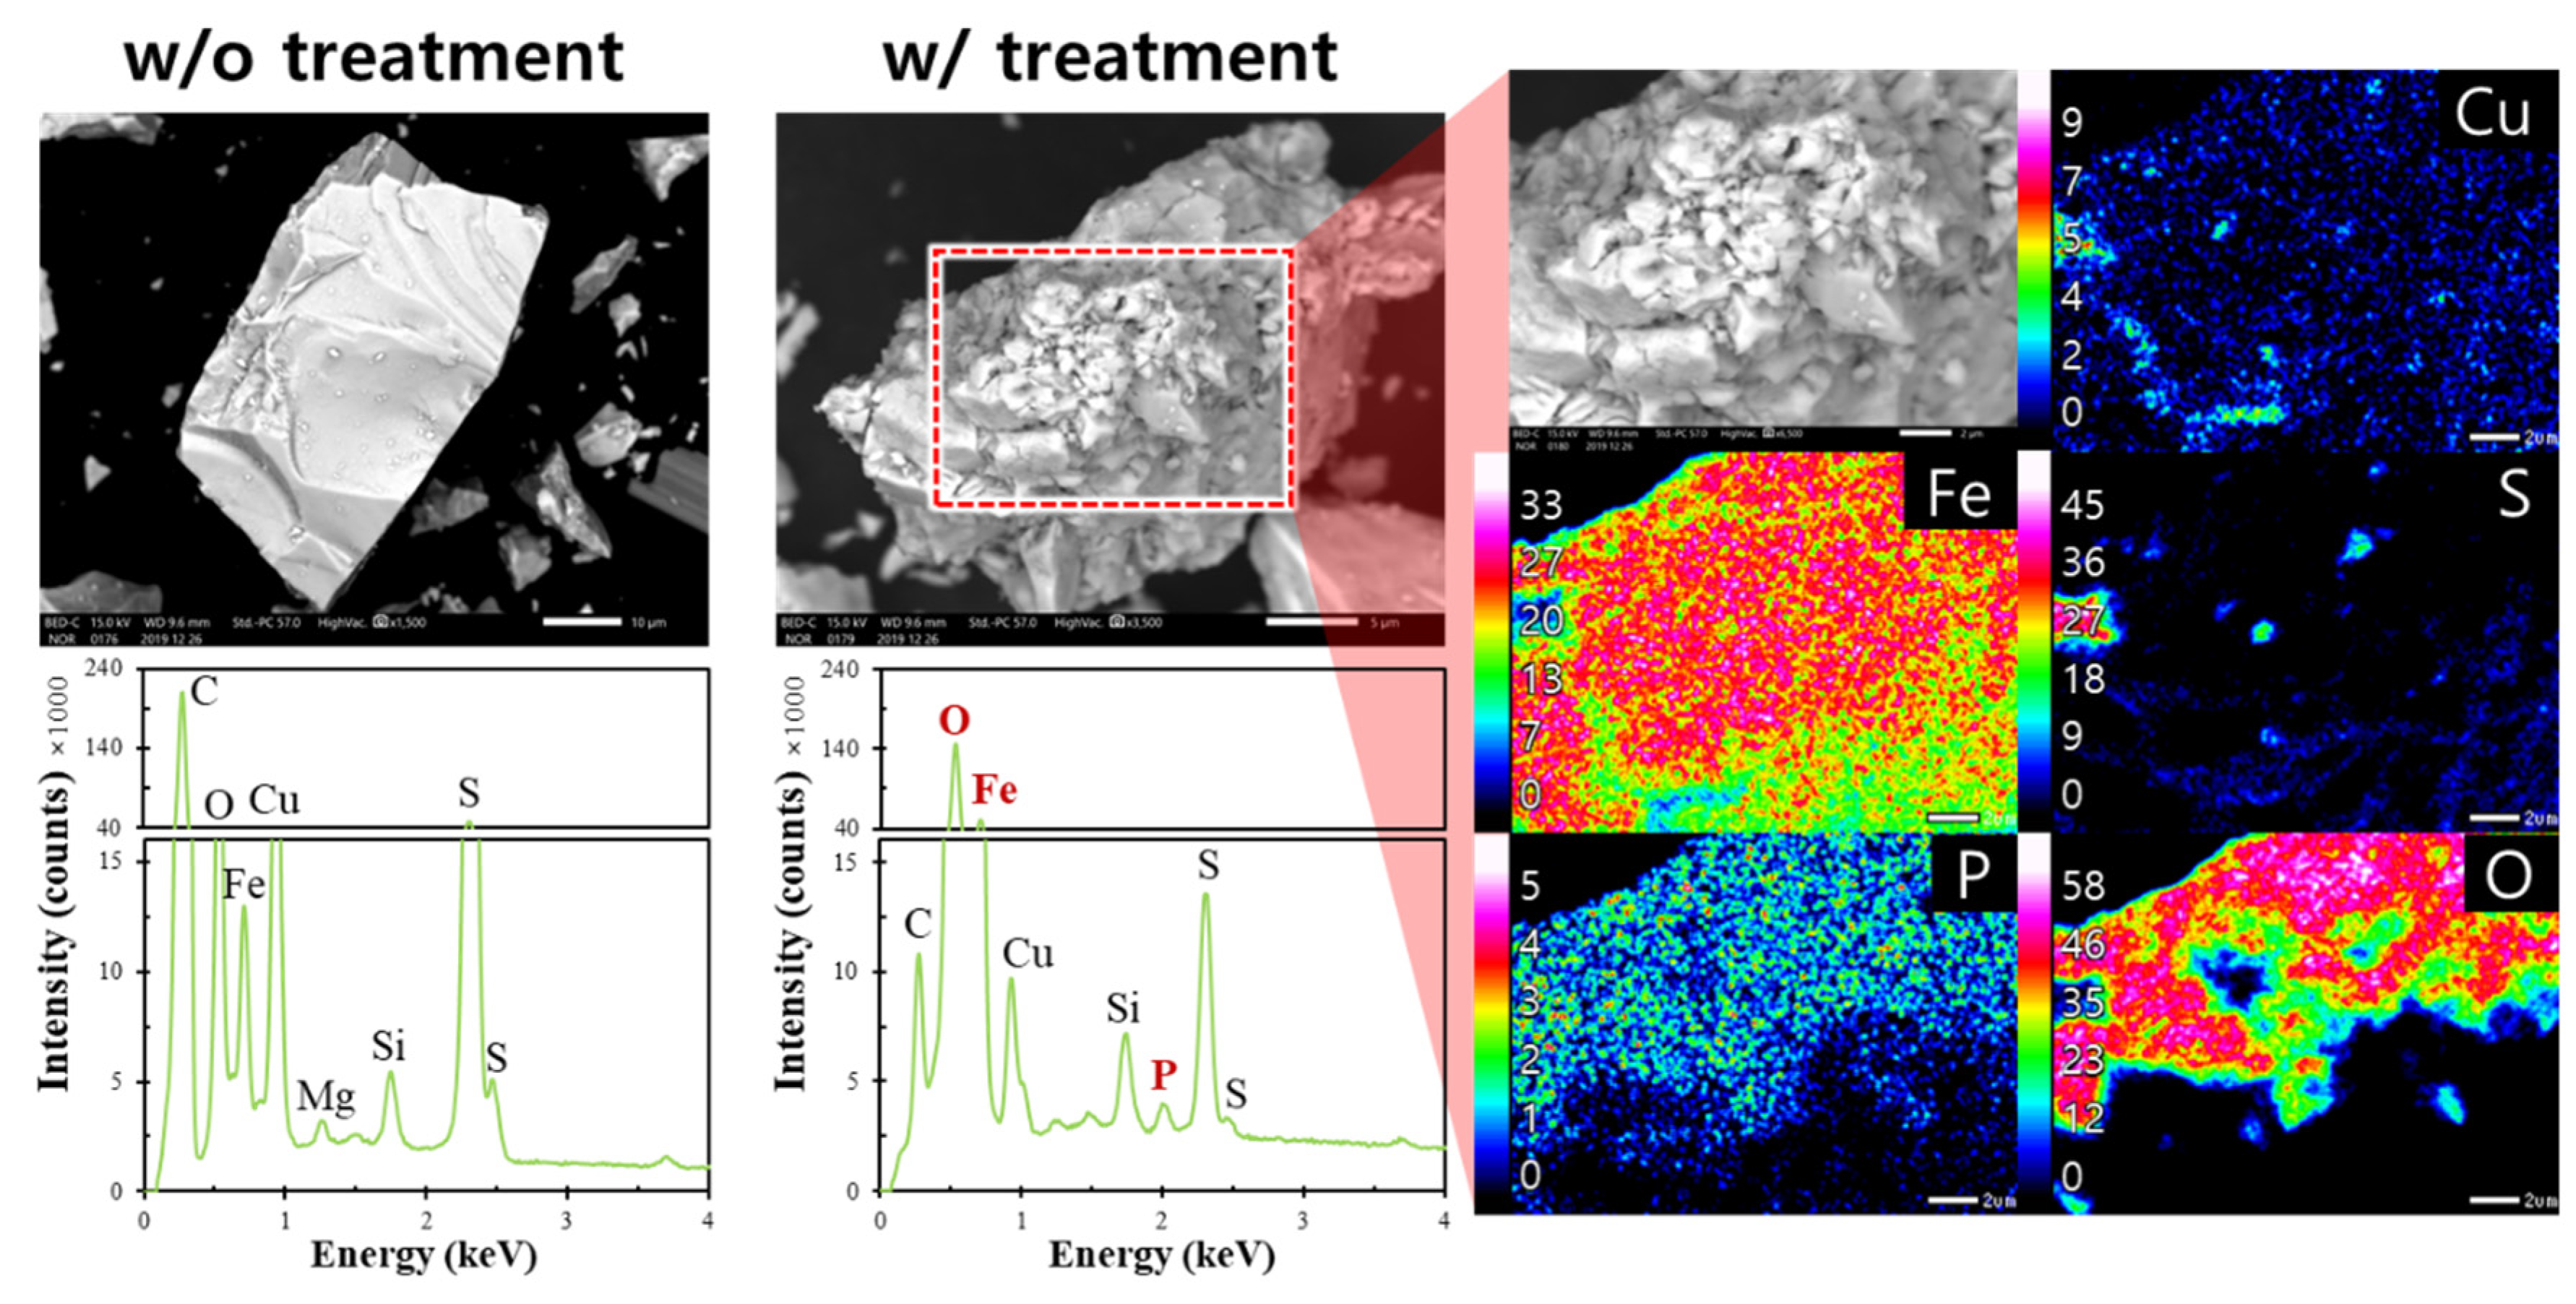
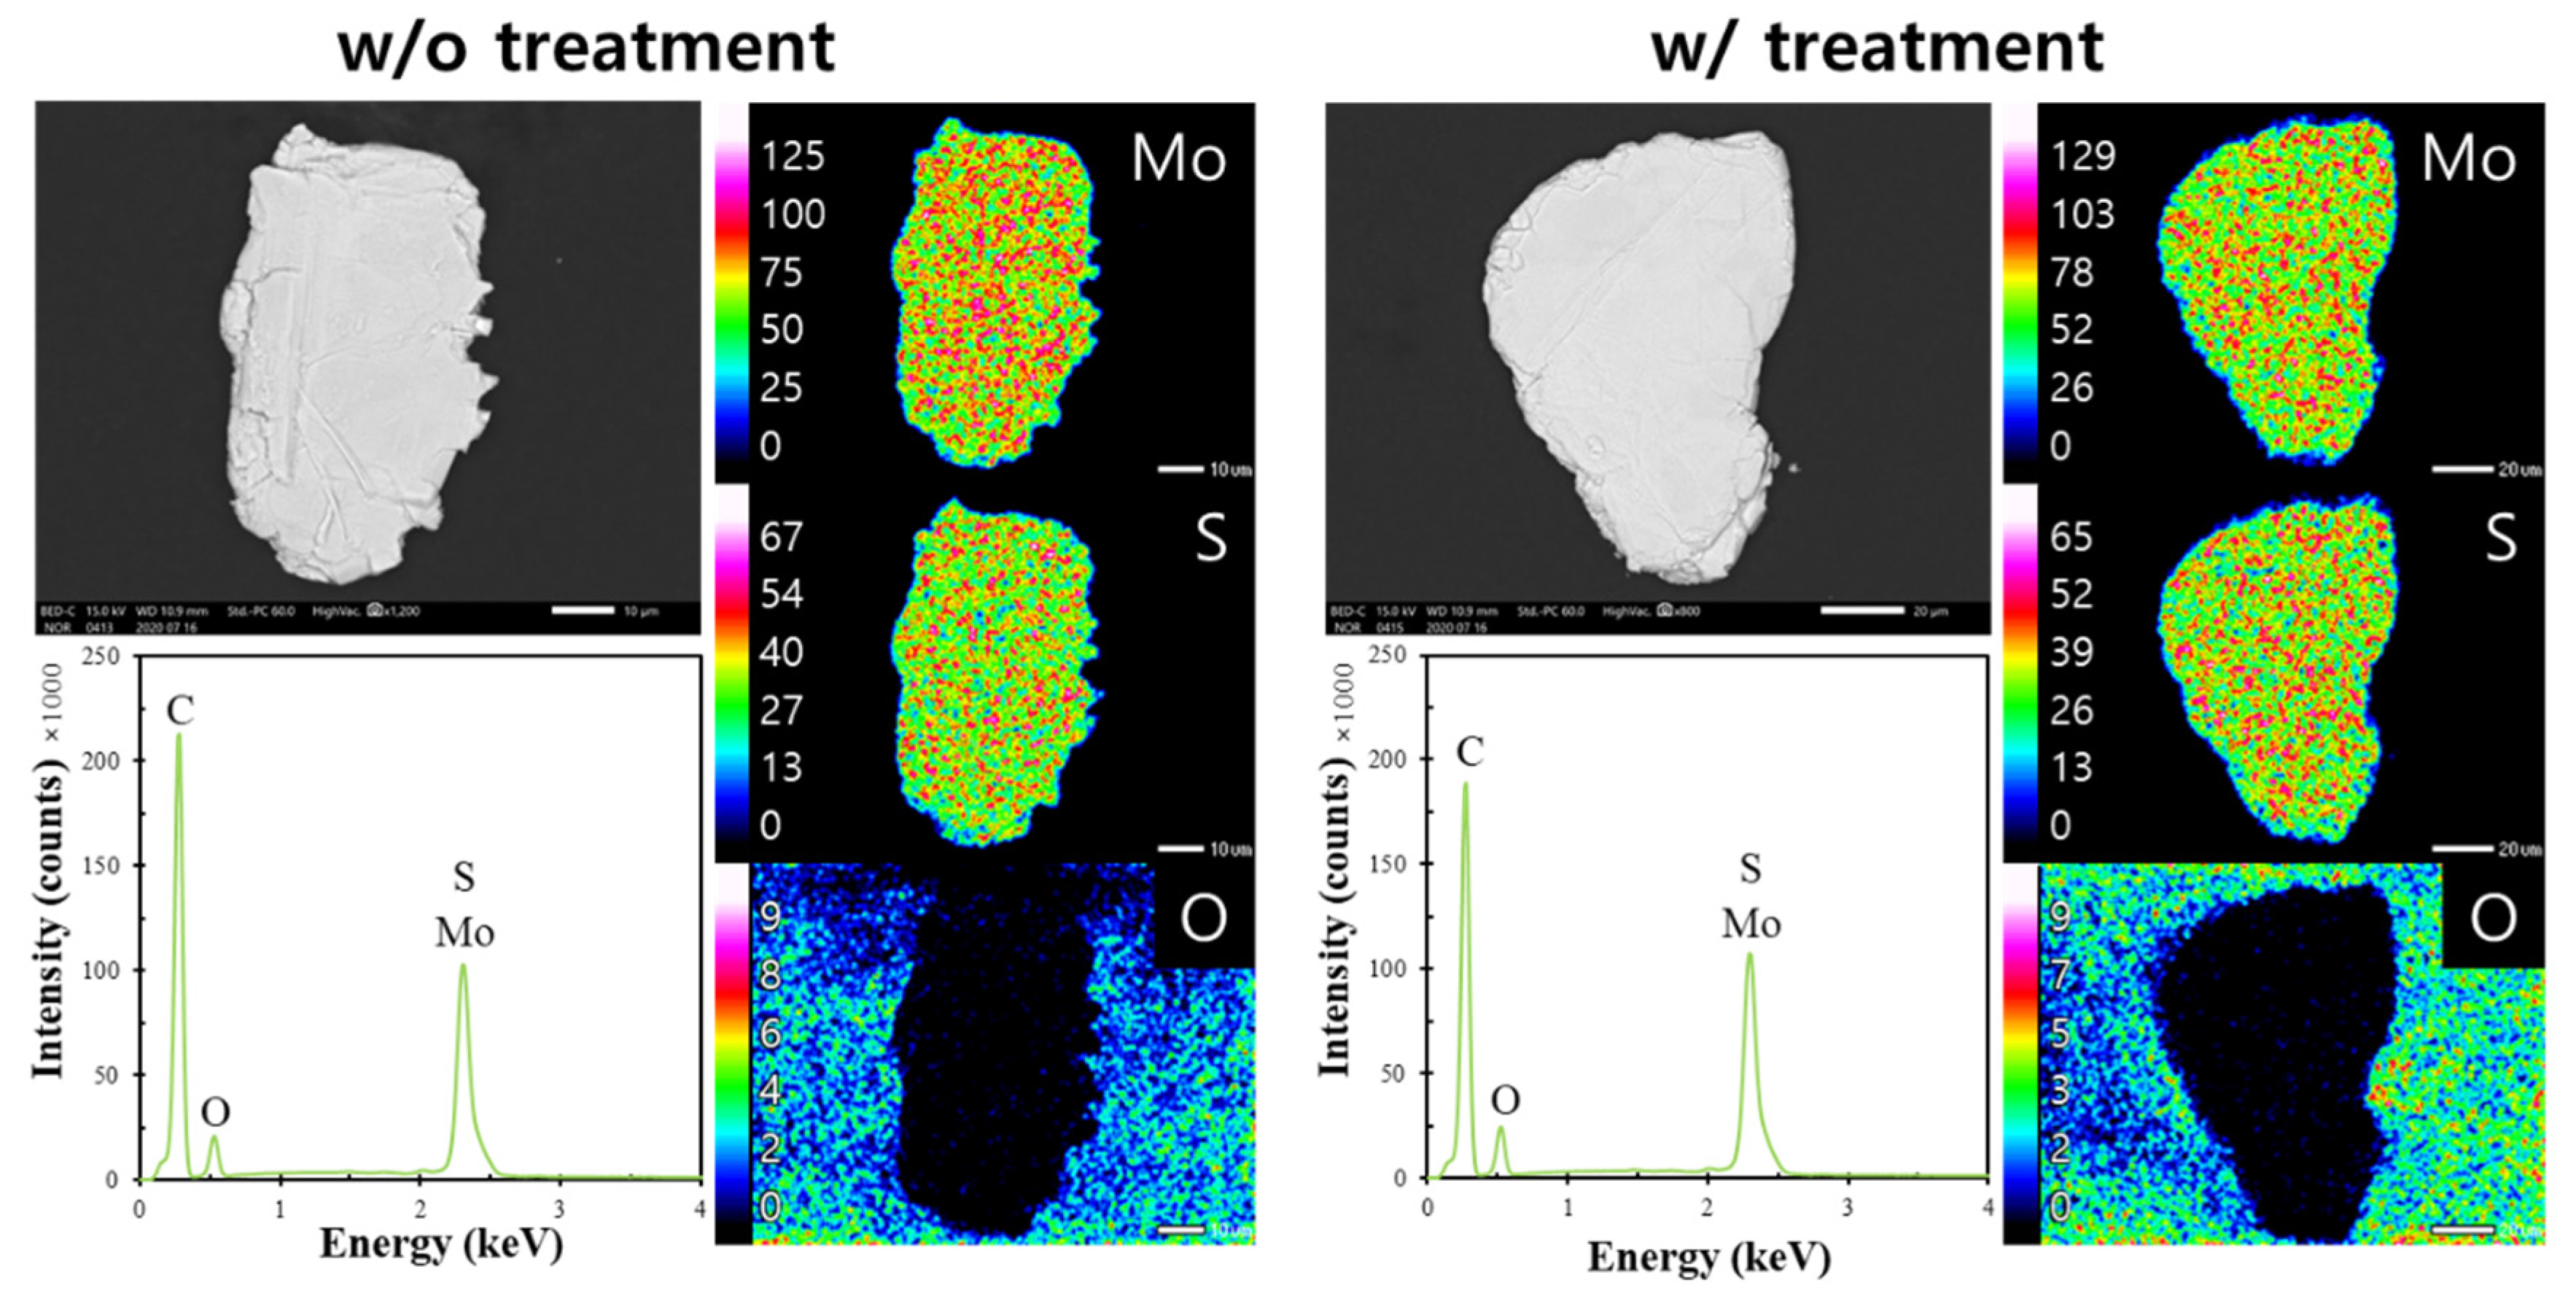
Figure 5 shows the SEM-EDX results of untreated- and treated-chalcopyrite. As can be seen in the SEM image of untreated chalcopyrite, its surface was smooth and clear; however, after microencapsulation treatment, the surface morphology dramatically changed the secondary precipitates that covered the surface of chalcopyrite. Untreated chalcopyrite exhibited strong signals of Cu, Fe, and S, while treated chalcopyrite showed that the signals of Cu and S were decreased, but signals of Fe and O were increased, as shown in the EDX spectra of these samples. In addition, the P signal appeared in the spectrum of treated chalcopyrite. These increased (i.e., Fe, P, and O) and decreased (i.e., Cu and S) signals were also found in the elemental maps of treated chalcopyrite. These results indicate that, after microencapsulation treatment, Fe–P–O-containing coatings were formed on the chalcopyrite surface. On the other hand, the SEM-EDX results of molybdenite with and without treatment (Figure 6) showed that there is no clear difference between the two samples, although 40% of dissolved Fe and P were precipitated (Figure 4). It could be speculated that the signals of Fe and P are almost noise levels due to the small amount of precipitate present on the molybdenite surface or the precipitates do not exist on the molybdenite surface.
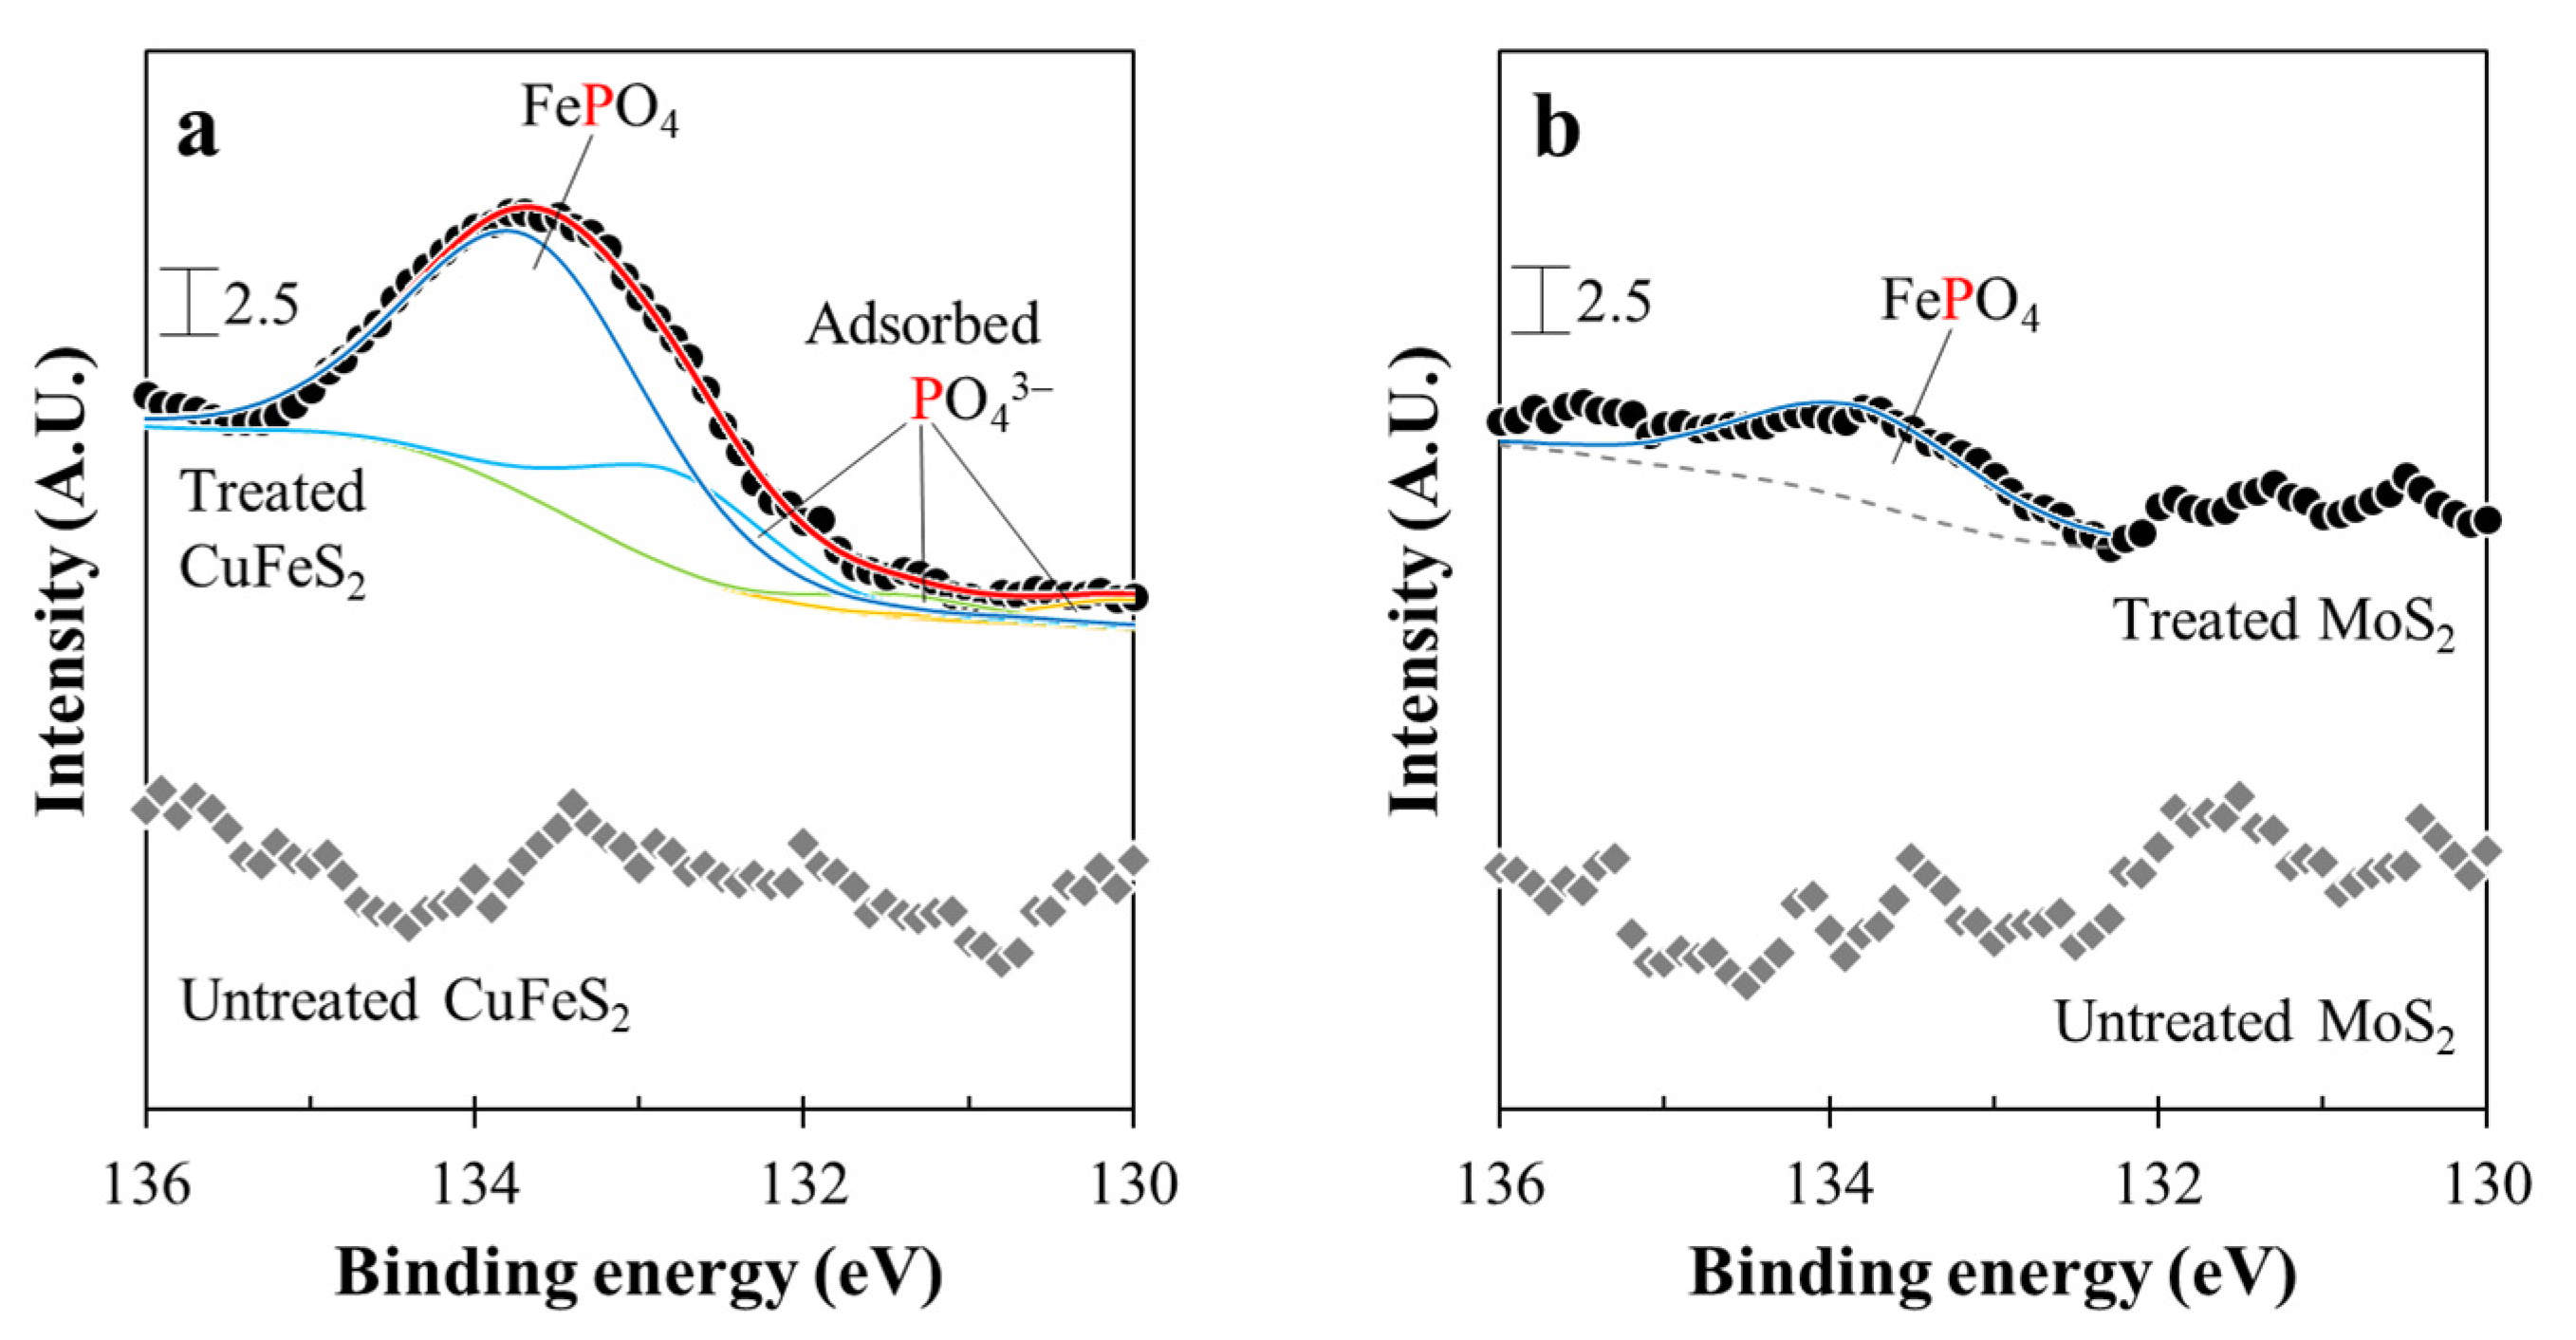
In order to further characterize the surfaces of untreated and treated minerals, XPS analysis was adopted, which can analyze a very thin layer of coating (around ~6 nm) and give the information on the chemical state of the element. Figure 7a shows the XPS P 2p spectra of untreated and treated chalcopyrite. As it can be seen, treated chalcopyrite exhibited a broad peak that was centered at around 133.5 eV composed of adsorbed PO43− (130.0, 131.4 and 132.8 eV) [34] and P(V) of FePO4 (133.7 eV) [34,35], which support that FePO4 coating was formed on the chalcopyrite surface by microencapsulation while using Fe2+ and PO43−. In the case of the XPS spectrum of treated molybdenite (Figure 7b), a weak and gentle peak of FePO4 was observed. The peak area of FePO4 in the XPS spectrum of treated chalcopyrite was three times higher than that of treated molybdenite, which indicated that more FePO4 is present on the chalcopyrite surface, as confirmed by Figure 4, Figure 5 and Figure 6. All of the results that were obtained in this study imply that Fe2+ oxidation, followed by FePO4 precipitation, preferably occurs on the chalcopyrite surface rather than on the molybdenite surface, so the selective depression of chalcopyrite in the flotation of bulk concentrates is highly achievable, which will be evaluated in detail in Part 2 of this study.

4. Conclusions

This study investigated microencapsulation while using Fe2+ and PO43− in order to selectively coat chalcopyrite with FePO4 with the aim of improving Cu-Mo flotation separation. The findings of this study are summarized, as follows:
  • In the presence of phosphate ion, Fe2+ was stable at pH ≤ 4, above which, however, Fe2+ became unstable due to its rapid oxidation to Fe3+, which was then precipitated as FePO4 and/or FeO(OH). Thus, microencapsulation treatment using Fe2+ and PO43− is recommended to be conducted at pH 4 in order to achieve the selective Fe2+ oxidation on chalcopyrite surface.
  • The CV results indicated that Fe2+ oxidation can occur on the chalcopyrite surface, but not on the molybdenite surface, due to their different electrical properties.
  • After microencapsulation treatment using Fe2+ and PO43−, SEM-EDX and XPS analyses confirmed that chalcopyrite was more coated with FePO4 than molybdenite.

Author Contributions

Conceptualization, I.P., S.J., M.I. and N.H.; methodology, I.P.; investigation, I.P. and S.H.; data curation, I.P. and S.H.; writing—original draft preparation, I.P.; writing—review and editing, I.P., S.H., S.J., M.I. and N.H. All authors have read and agreed to the published version of the manuscript.

Funding

This study is financially supported by Japan Oil, Gas and Metals National Corporation (JOGMEC).

Conflicts of Interest

The authors declare no conflict of interest.

References

  1. Bulatovic, S.M. 12-Flotation of Copper Sulfide Ores. In Handbook of Flotation Reagents; Bulatovic, S.M., Ed.; Elsevier: Amsterdam, The Netherlands, 2007; pp. 235–293. ISBN 978-0-444-53029-5. [Google Scholar]
  2. Ayuso, R.A.; Barton, M.D.; Blakely, R.J.; Bodnar, R.J.; Dilles, J.H.; Gray, F.; Graybeal, F.T.; Mars, J.L.; McPhee, D.K.; Seal II, R.R.; et al. Porphyry Copper Deposit Model: Chapter B in Mineral Deposit Models for Resource Assessment; Scientific Investigations Report; U.S. 2010-5070-B; Geological Survey: Reston, VA, USA, 2010. [Google Scholar]
  3. Miki, H.; Hirajima, T.; Muta, Y.; Suyantara, G.P.W.; Sasaki, K. Effect of Sodium Sulfite on Floatability of Chalcopyrite and Molybdenite. Minerals 2018, 8, 172. [Google Scholar] [CrossRef] [Green Version]
  4. Johnston, A.; Meadows, D.G.; Cappuccitti, F. Copper Mineral Processing. In SME Mineral Processing & Extractive Metallurgy Handbook; Society for Mining, Metallurgy & Exploration (SME): Englewood, CO, USA, 2019; Volume 2, pp. 1615–1641. [Google Scholar]
  5. Amelunxen, P.; Schmitz, C.; Hill, H.; Goodweiler, N.; Andres, J. Molybdenum. In SME Mineral Processing & Extractive Metallurgy Handbook; Society for Mining, Metallurgy & Exploration (SME): Englewood, CO, USA, 2019; Volume 2, pp. 1891–1916. [Google Scholar]
  6. Sutherland, K.L.; Wark, I.W. Depressants. In Principles of Flotation; Australasian Institute of Mining and Metallurgy: Melbourne, Australia, 1955; pp. 113–153. [Google Scholar]
  7. Park, I.; Hong, S.; Jeon, S.; Ito, M.; Hiroyoshi, N. A Review of Recent Advances in Depression Techniques for Flotation Separation of Cu–Mo Sulfides in Porphyry Copper Deposits. Metals 2020, 10, 1269. [Google Scholar] [CrossRef]
  8. Hirajima, T.; Miki, H.; Suyantara, G.P.W.; Matsuoka, H.; Elmahdy, A.M.; Sasaki, K.; Imaizumi, Y.; Kuroiwa, S. Selective flotation of chalcopyrite and molybdenite with H2O2 oxidation. Miner. Eng. 2017, 100, 83–92. [Google Scholar] [CrossRef]
  9. Miki, H.; Matsuoka, H.; Hirajima, T.; Suyantara, G.P.W.; Sasaki, K. Electrolysis Oxidation of Chalcopyrite and Molybdenite for Selective Flotation. Mater. Trans. 2017, 58, 761–767. [Google Scholar] [CrossRef] [Green Version]
  10. Yin, Z.; Sun, W.; Hu, Y.; Zhang, C.; Guan, Q.; Zhang, C. Separation of Molybdenite from Chalcopyrite in the Presence of Novel Depressant 4-Amino-3-thioxo-3,4-dihydro-1,2,4-triazin-5(2H)-one. Minerals 2017, 7, 146. [Google Scholar] [CrossRef] [Green Version]
  11. Wie, J.M.; Fuerstenau, D.W. The effect of dextrin on surface properties and the flotation of molybdenite. Int. J. Miner. Process. 1974, 1, 17–32. [Google Scholar] [CrossRef]
  12. Jorjani, E.; Barkhordari, H.R.; Tayebi Khorami, M.; Fazeli, A. Effects of aluminosilicate minerals on copper–molybdenum flotation from Sarcheshmeh porphyry ores. Miner. Eng. 2011, 24, 754–759. [Google Scholar] [CrossRef]
  13. Ansari, A.; Pawlik, M. Floatability of chalcopyrite and molybdenite in the presence of lignosulfonates. Part II. Hallimond tube flotation. Miner. Eng. 2007, 20, 609–616. [Google Scholar] [CrossRef]
  14. Yuan, D.; Cadien, K.; Liu, Q.; Zeng, H. Flotation separation of Cu-Mo sulfides by O-Carboxymethyl chitosan. Miner. Eng. 2019, 134, 202–205. [Google Scholar] [CrossRef]
  15. Yuan, D.; Cadien, K.; Liu, Q.; Zeng, H. Adsorption characteristics and mechanisms of O-Carboxymethyl chitosan on chalcopyrite and molybdenite. J. Colloid Interface Sci. 2019, 552, 659–670. [Google Scholar] [CrossRef]
  16. Kor, M.; Korczyk, P.M.; Addai-Mensah, J.; Krasowska, M.; Beattie, D.A. Carboxymethylcellulose Adsorption on Molybdenite: The Effect of Electrolyte Composition on Adsorption, Bubble–Surface Collisions, and Flotation. Langmuir 2014, 30, 11975–11984. [Google Scholar] [CrossRef] [PubMed]
  17. Yuan, D.; Cadien, K.; Liu, Q.; Zeng, H. Selective separation of copper-molybdenum sulfides using humic acids. Miner. Eng. 2019, 133, 43–46. [Google Scholar] [CrossRef]
  18. Chen, J.; Lan, L.; Liao, X. Depression effect of pseudo glycolythiourea acid in flotation separation of copper–molybdenum. Trans. Nonferrous Met. Soc. China 2013, 23, 824–831. [Google Scholar] [CrossRef]
  19. Li, M.; Wei, D.; Shen, Y.; Liu, W.; Gao, S.; Liang, G. Selective depression effect in flotation separation of copper–molybdenum sulfides using 2,3-disulfanylbutanedioic acid. Trans. Nonferrous Met. Soc. China 2015, 25, 3126–3132. [Google Scholar] [CrossRef]
  20. Yin, Z.; Sun, W.; Hu, Y.; Guan, Q.; Zhang, C.; Gao, Y.; Zhai, J. Depressing behaviors and mechanism of disodium bis (carboxymethyl) trithiocarbonate on separation of chalcopyrite and molybdenite. Trans. Nonferrous Met. Soc. China 2017, 27, 883–890. [Google Scholar] [CrossRef]
  21. Li, M.; Wei, D.; Liu, Q.; Liu, W.; Zheng, J.; Sun, H. Flotation separation of copper–molybdenum sulfides using chitosan as a selective depressant. Miner. Eng. 2015, 83, 217–222. [Google Scholar] [CrossRef]
  22. Laskowski, J.S.; Castro, S.; Ramos, O. Effect of seawater main components on frothability in the flotation of Cu-Mo sulfide ore. Physicochem. Probl. Miner. Process. 2013, 17–29. [Google Scholar] [CrossRef]
  23. Park, I.; Tabelin, C.B.; Seno, K.; Jeon, S.; Inano, H.; Ito, M.; Hiroyoshi, N. Carrier-microencapsulation of arsenopyrite using Al-catecholate complex: Nature of oxidation products, effects on anodic and cathodic reactions, and coating stability under simulated weathering conditions. Heliyon 2020, 6, e03189. [Google Scholar] [CrossRef] [Green Version]
  24. Park, I.; Tabelin, C.B.; Seno, K.; Jeon, S.; Ito, M.; Hiroyoshi, N. Simultaneous suppression of acid mine drainage formation and arsenic release by Carrier-microencapsulation using aluminum-catecholate complexes. Chemosphere 2018, 205, 414–425. [Google Scholar] [CrossRef]
  25. McKibben, M.A.; Barnes, H.L. Oxidation of pyrite in low temperature acidic solutions: Rate laws and surface textures. Geochim. Cosmochim. Acta 1986, 50, 1509–1520. [Google Scholar] [CrossRef]
  26. Shirley, D.A. High-Resolution X-Ray Photoemission Spectrum of the Valence Bands of Gold. Phys. Rev. B 1972, 5, 4709–4714. [Google Scholar] [CrossRef] [Green Version]
  27. Nesbitt, H.W.; Muir, I.J. X-ray photoelectron spectroscopic study of a pristine pyrite surface reacted with water vapour and air. Geochim. Cosmochim. Acta 1994, 58, 4667–4679. [Google Scholar] [CrossRef]
  28. Stumm, W.; Morgan, J.J. Aquatic Chemistry: Chemical Equilibria and Rates in Natural Waters; Wiley-Interscience: New York, NY, USA, 1996. [Google Scholar]
  29. Morgan, B.; Lahav, O. The effect of pH on the kinetics of spontaneous Fe(II) oxidation by O2 in aqueous solution–basic principles and a simple heuristic description. Chemosphere 2007, 68, 2080–2084. [Google Scholar] [CrossRef] [PubMed]
  30. Qin, W.Q.; Yang, C.R.; Wang, J.; Zhang, Y.; Jiao, F.; Zhao, H.B.; Zhu, S. Effect of Fe2+ and Cu2+ Ions on the Electrochemical Behavior of Massive Chalcopyrite in Bioleaching System. Adv. Mater. Res. 2013, 825, 472–476. [Google Scholar] [CrossRef]
  31. Holliday, R.I.; Richmond, W.R. An electrochemical study of the oxidation of chalcopyrite in acidic solution. J. Electroanal. Chem. Interfacial Electrochem. 1990, 288, 83–98. [Google Scholar] [CrossRef]
  32. Liang, C.-L.; Xia, J.-L.; Yang, Y.; Nie, Z.-Y.; Zhao, X.-J.; Zheng, L.; Ma, C.-Y.; Zhao, Y.-D. Characterization of the thermo-reduction process of chalcopyrite at 65 °C by cyclic voltammetry and XANES spectroscopy. Hydrometallurgy 2011, 107, 13–21. [Google Scholar] [CrossRef]
  33. Castro, S.; Lopez-Valdivieso, A.; Laskowski, J.S. Review of the flotation of molybdenite. Part I: Surface properties and floatability. Int. J. Miner. Process. 2016, 148, 48–58. [Google Scholar] [CrossRef]
  34. Park, I.; Higuchi, K.; Tabelin, C.B.; Jeon, S.; Ito, M.; Hiroyoshi, N. Suppression of arsenopyrite oxidation by microencapsulation using ferric-catecholate complexes and phosphate. Chemosphere. under review.
  35. Zeng, L.; Li, X.; Shi, Y.; Qi, Y.; Huang, D.; Tadé, M.; Wang, S.; Liu, S. FePO4 based single chamber air-cathode microbial fuel cell for online monitoring levofloxacin. Biosens. Bioelectron. 2017, 91, 367–373. [Google Scholar] [CrossRef]
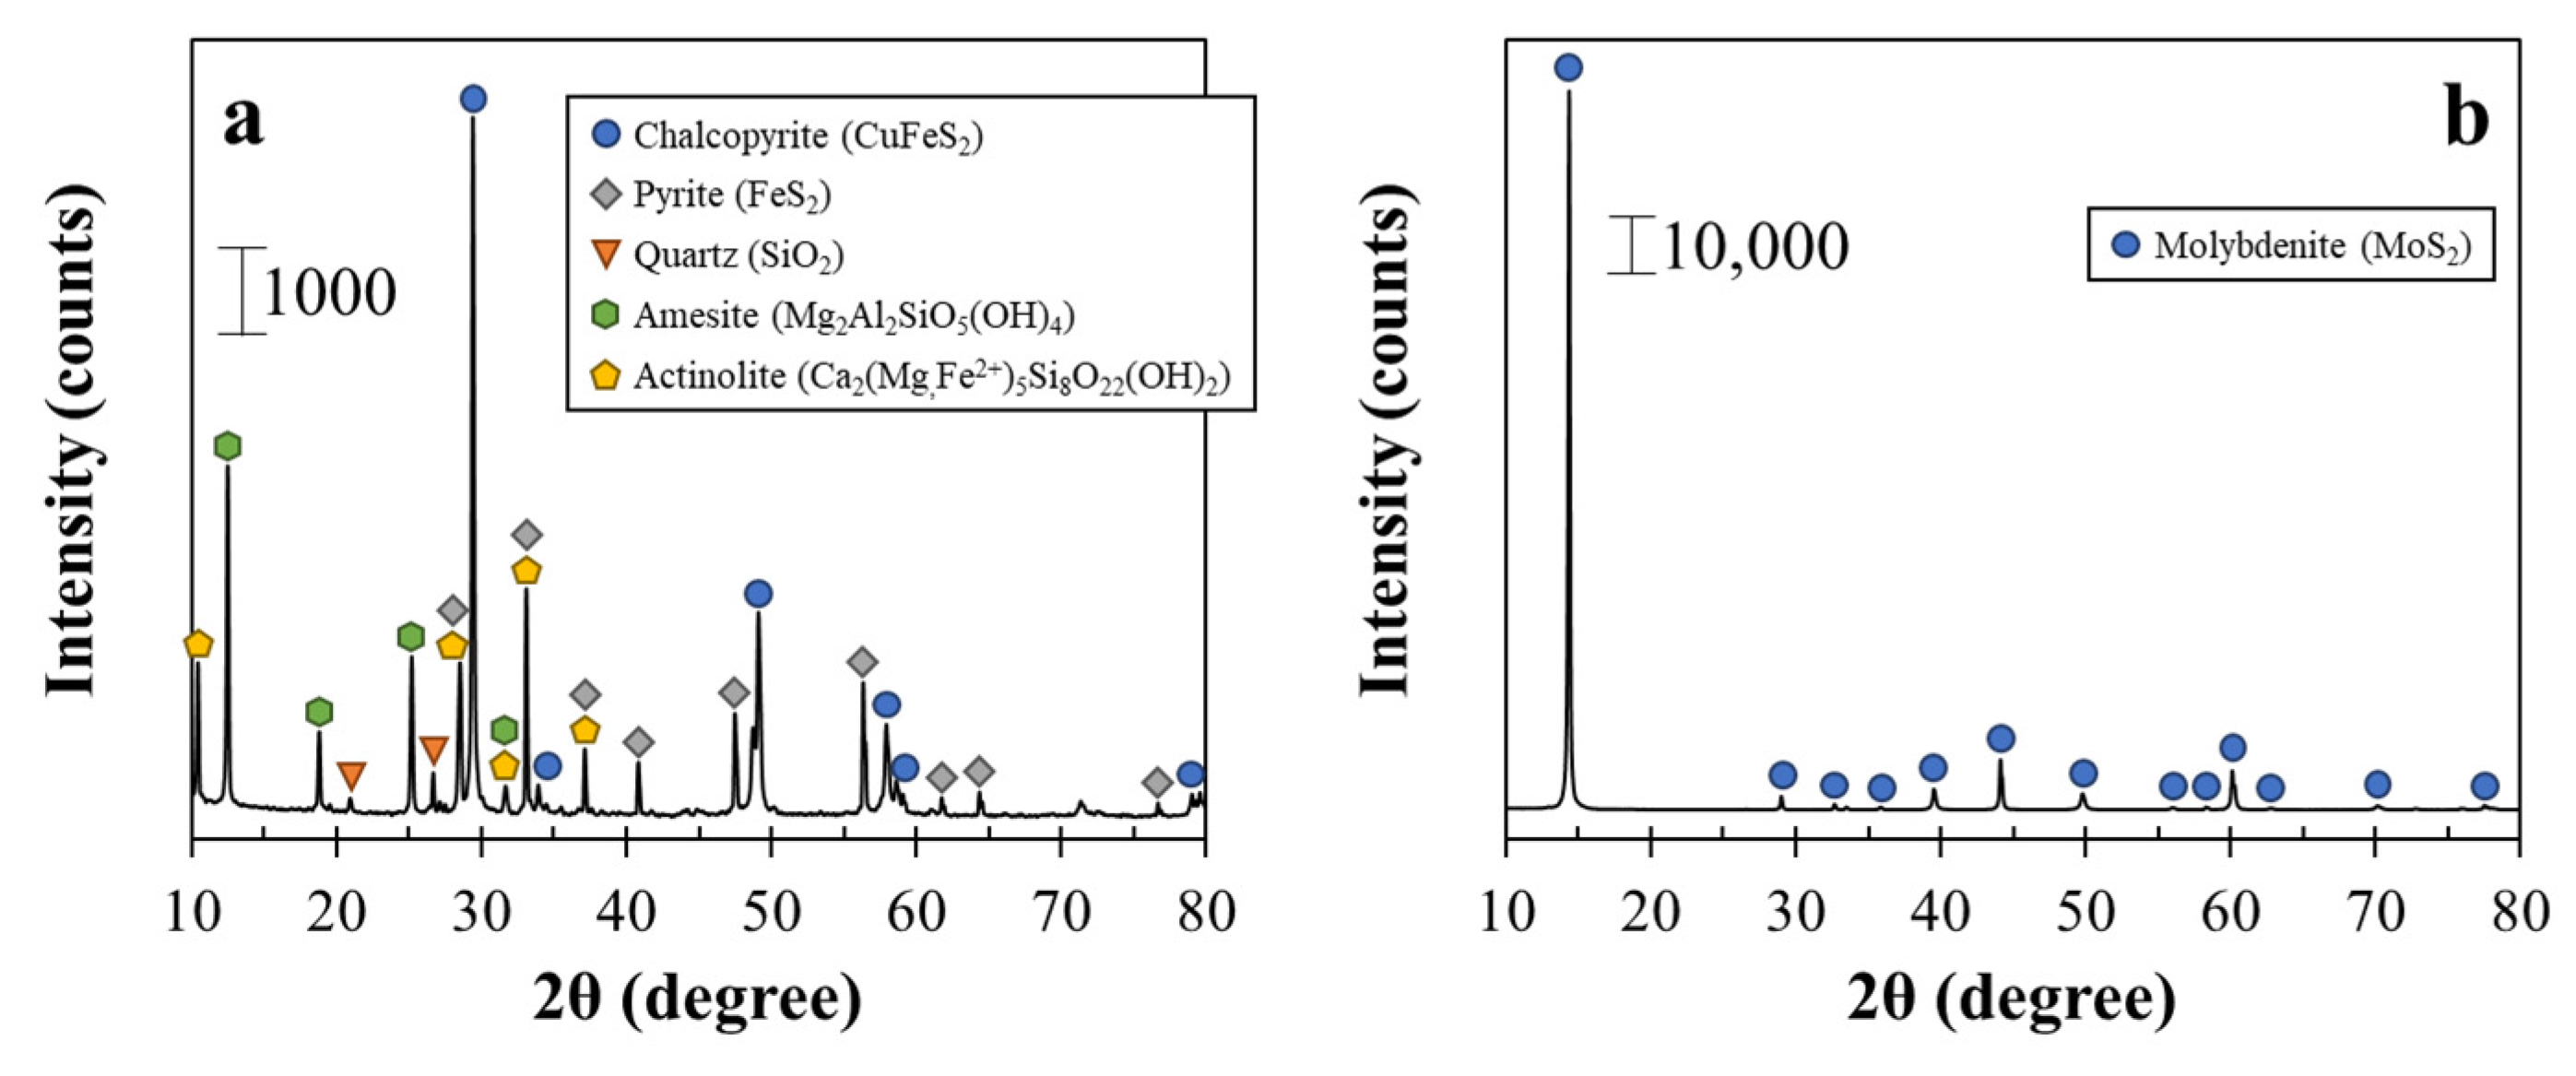
Figure 1. X-ray diffraction (XRD) patterns of (a) chalcopyrite and (b) molybdenite.
Metals 10 01667 g001
Figure 2. (a) Oxidation rate of ferrous iron species as a function of pH (reprinted with permission from Morgan and Lahav [29], copyright (2007) Elsevier) and (b) the change in dissolved Fe concentration ([Fe2+]initial = 1 mmol/L) in the presence of 1 mmol/L PO43− as a function of pH.
Metals 10 01667 g002
Figure 3. Cyclic voltammograms of (a) chalcopyrite (a1: cathodic scan from −0.2 to −0.8 V, a2: anodic scan from open circuit potential (OCP) to 0.8 V) and (b) molybdenite in the absence and presence of 1 mmol/L Fe2+. Note that the arrows in Figure 3(a1,a2) denote the sweep direction.
Metals 10 01667 g003
Figure 4. Precipitation rates of dissolved Fe (a) and P (b).
Metals 10 01667 g004
Figure 5. Scanning electron microscopy with energy-dispersive X-ray spectroscopy (SEM-EDX) results of chalcopyrite with and without microencapsulation treatment.
Metals 10 01667 g005
Figure 6. SEM-EDX results of molybdenite with and without microencapsulation treatment.
Metals 10 01667 g006
Figure 7. X-ray photoelectron spectroscopy (XPS) P 2p spectra of (a) chalcopyrite and (b) molybdenite with and without microencapsulation treatment.
Metals 10 01667 g007
Table 1. Elemental compositions of chalcopyrite and molybdenite.
ChalcopyriteMolybdenite
Elementswt.%Elementswt.%
Cu23.2Mo56.8
Fe32.6S43.0
S29.4Others0.2
Si9.5--
Others5.3--
Publisher’s Note: MDPI stays neutral with regard to jurisdictional claims in published maps and institutional affiliations.