Production of Fe–Ti Alloys from Mixed Slag Containing Titanium and Fe2O3 via Direct Electrochemical Reduction in Molten Calcium Chloride

 ,
,
Abstract
1. Introduction
2. Materials and Methods
2.1. Materials and Characterization Methods
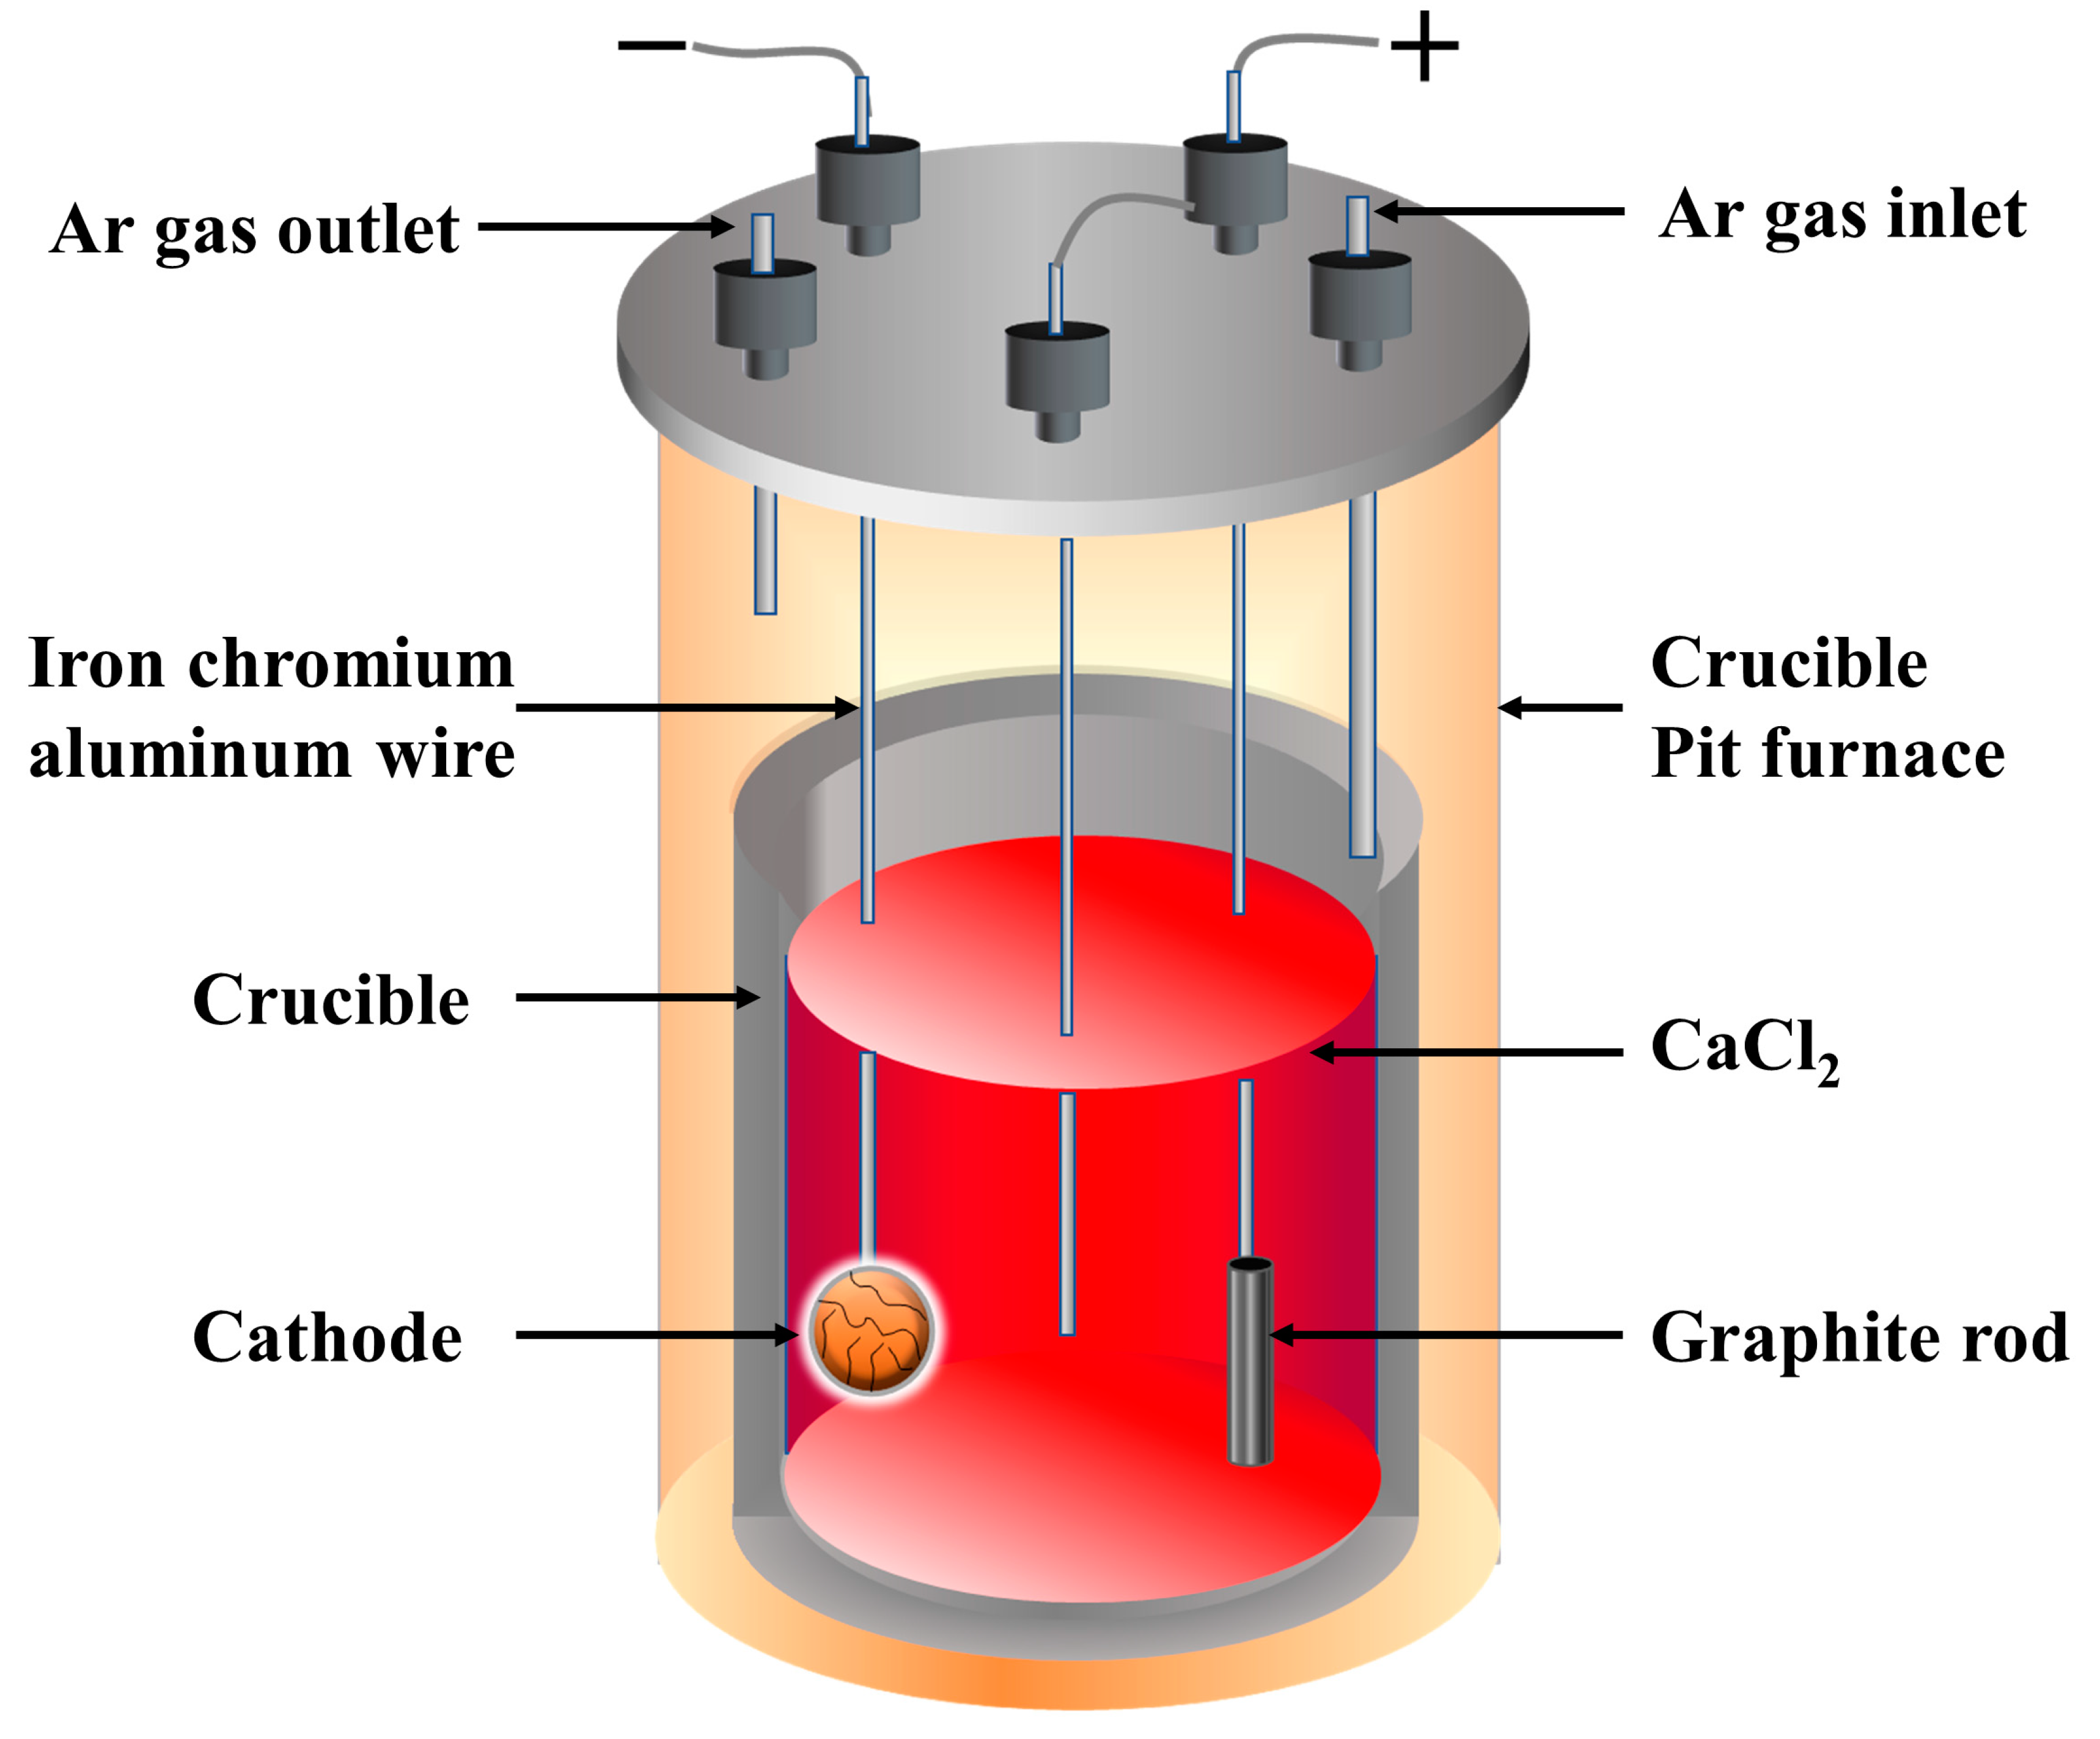
2.2. Experimental Method
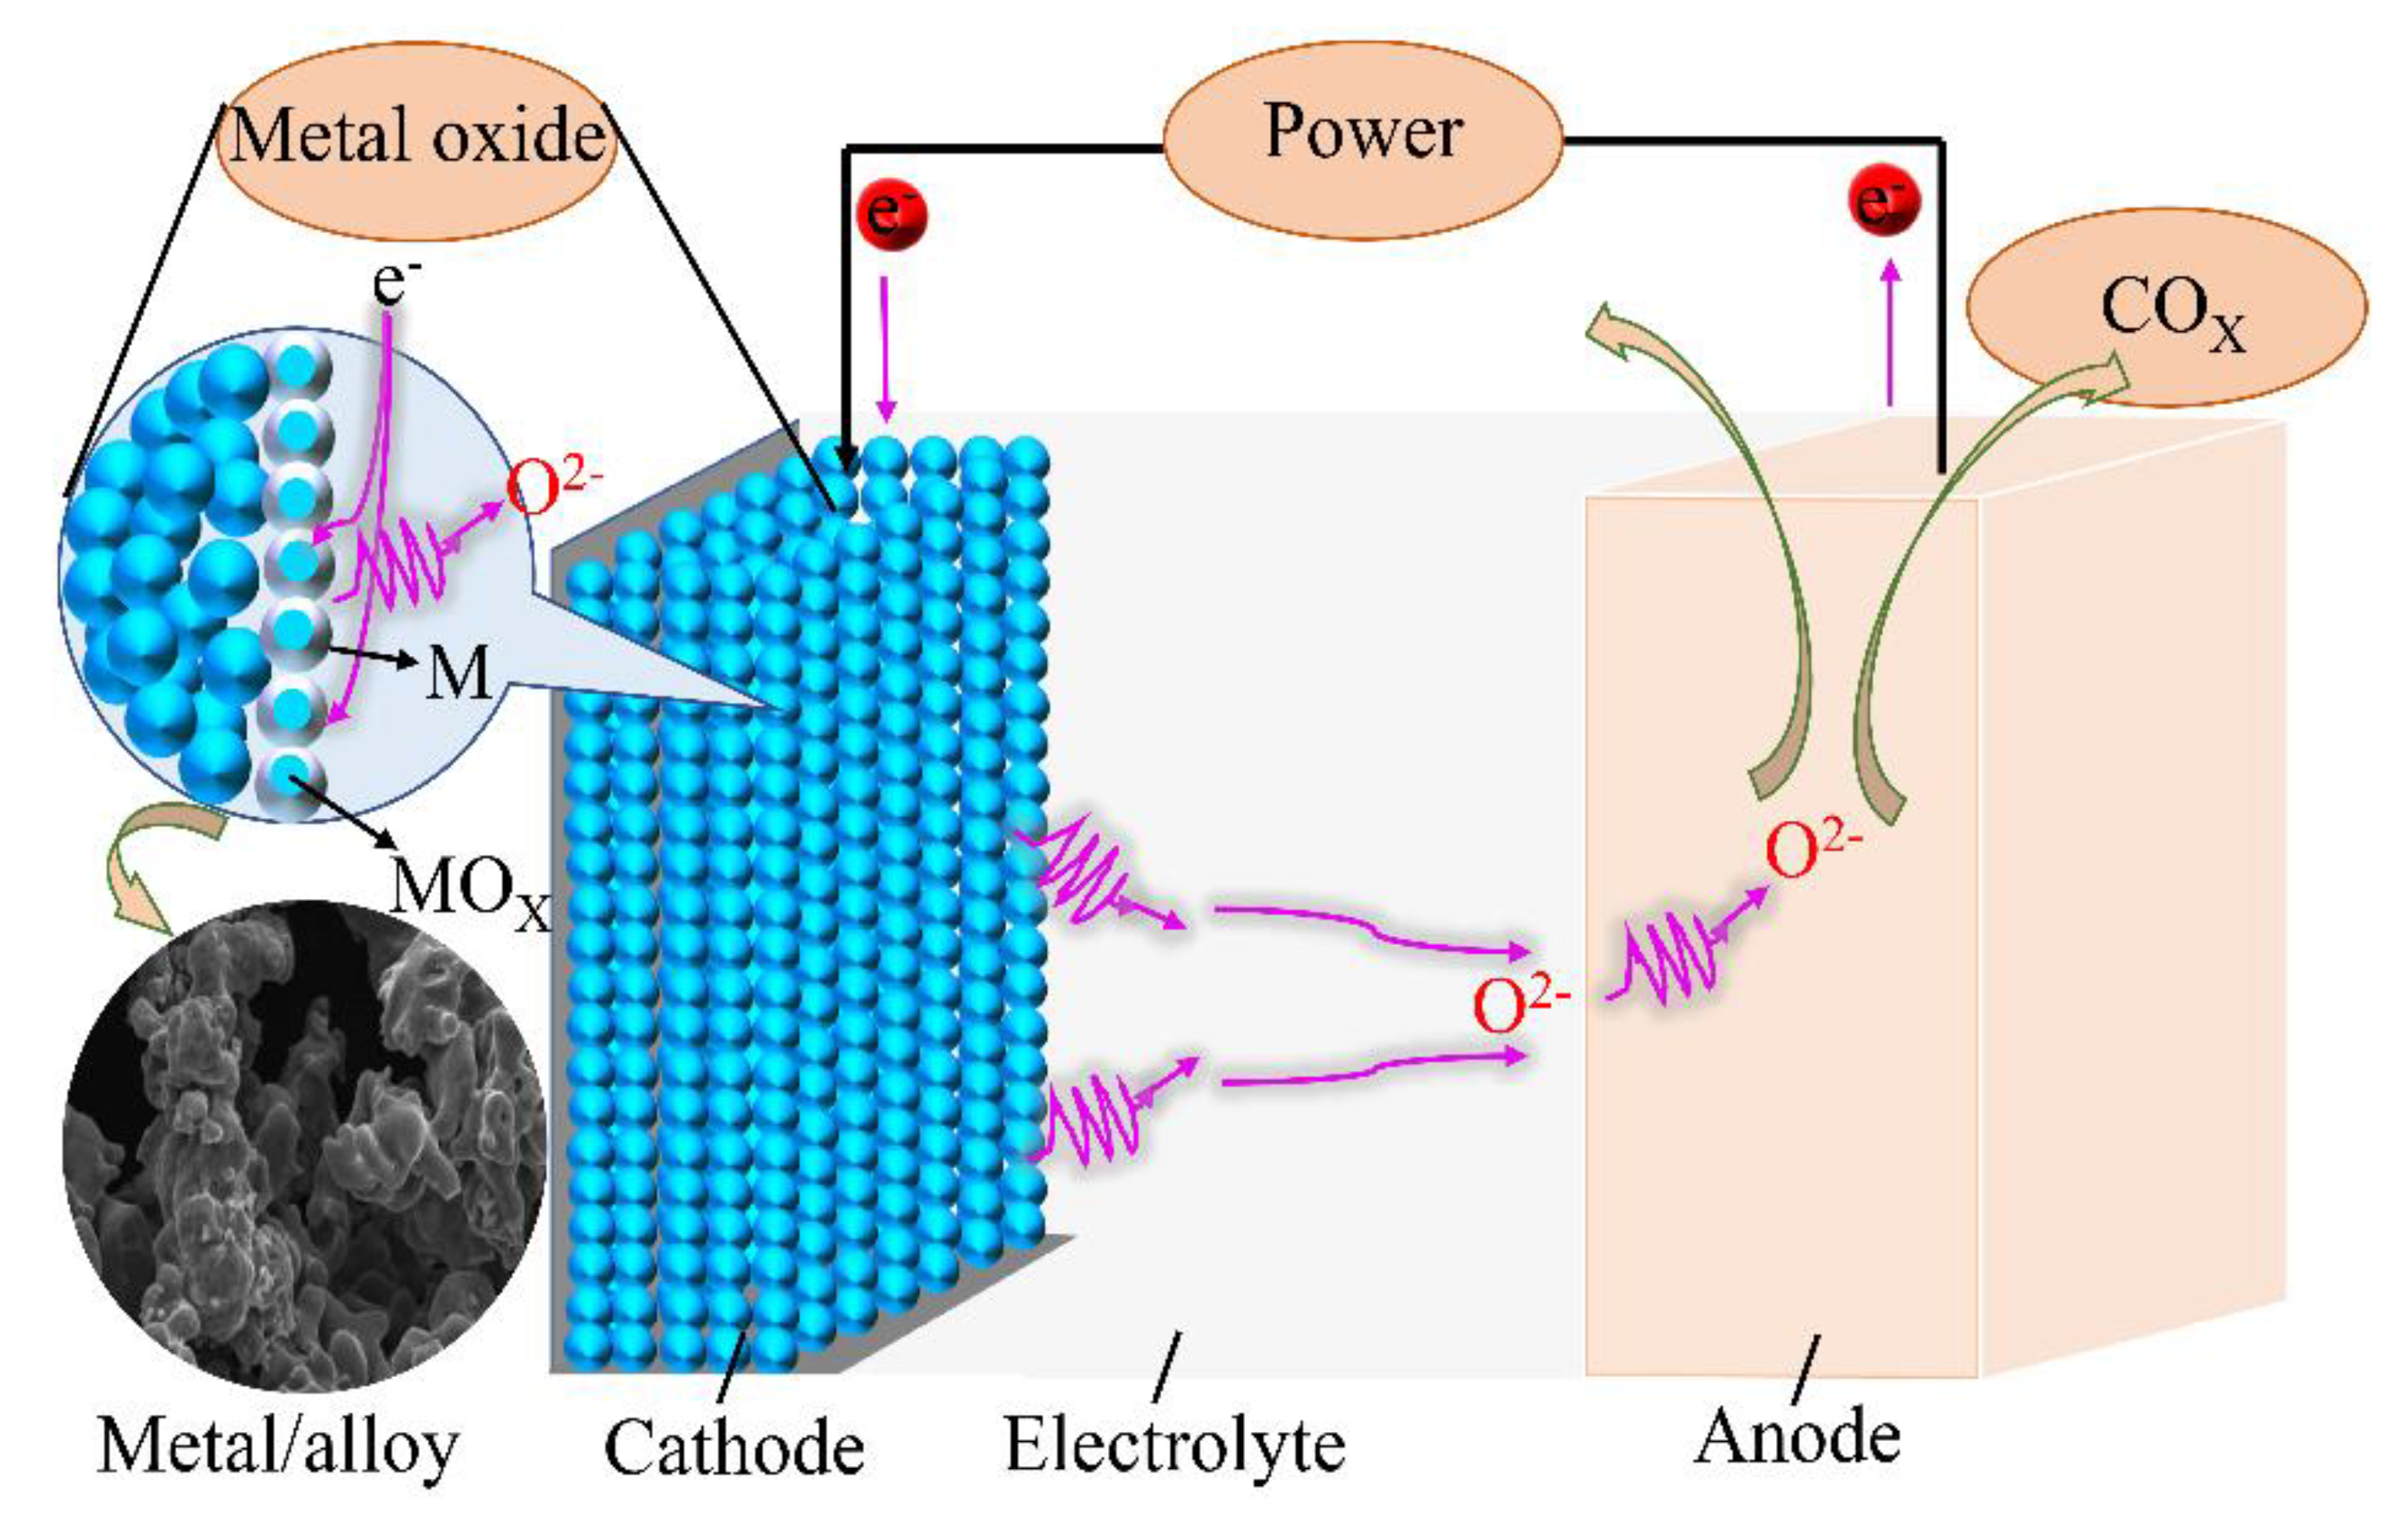
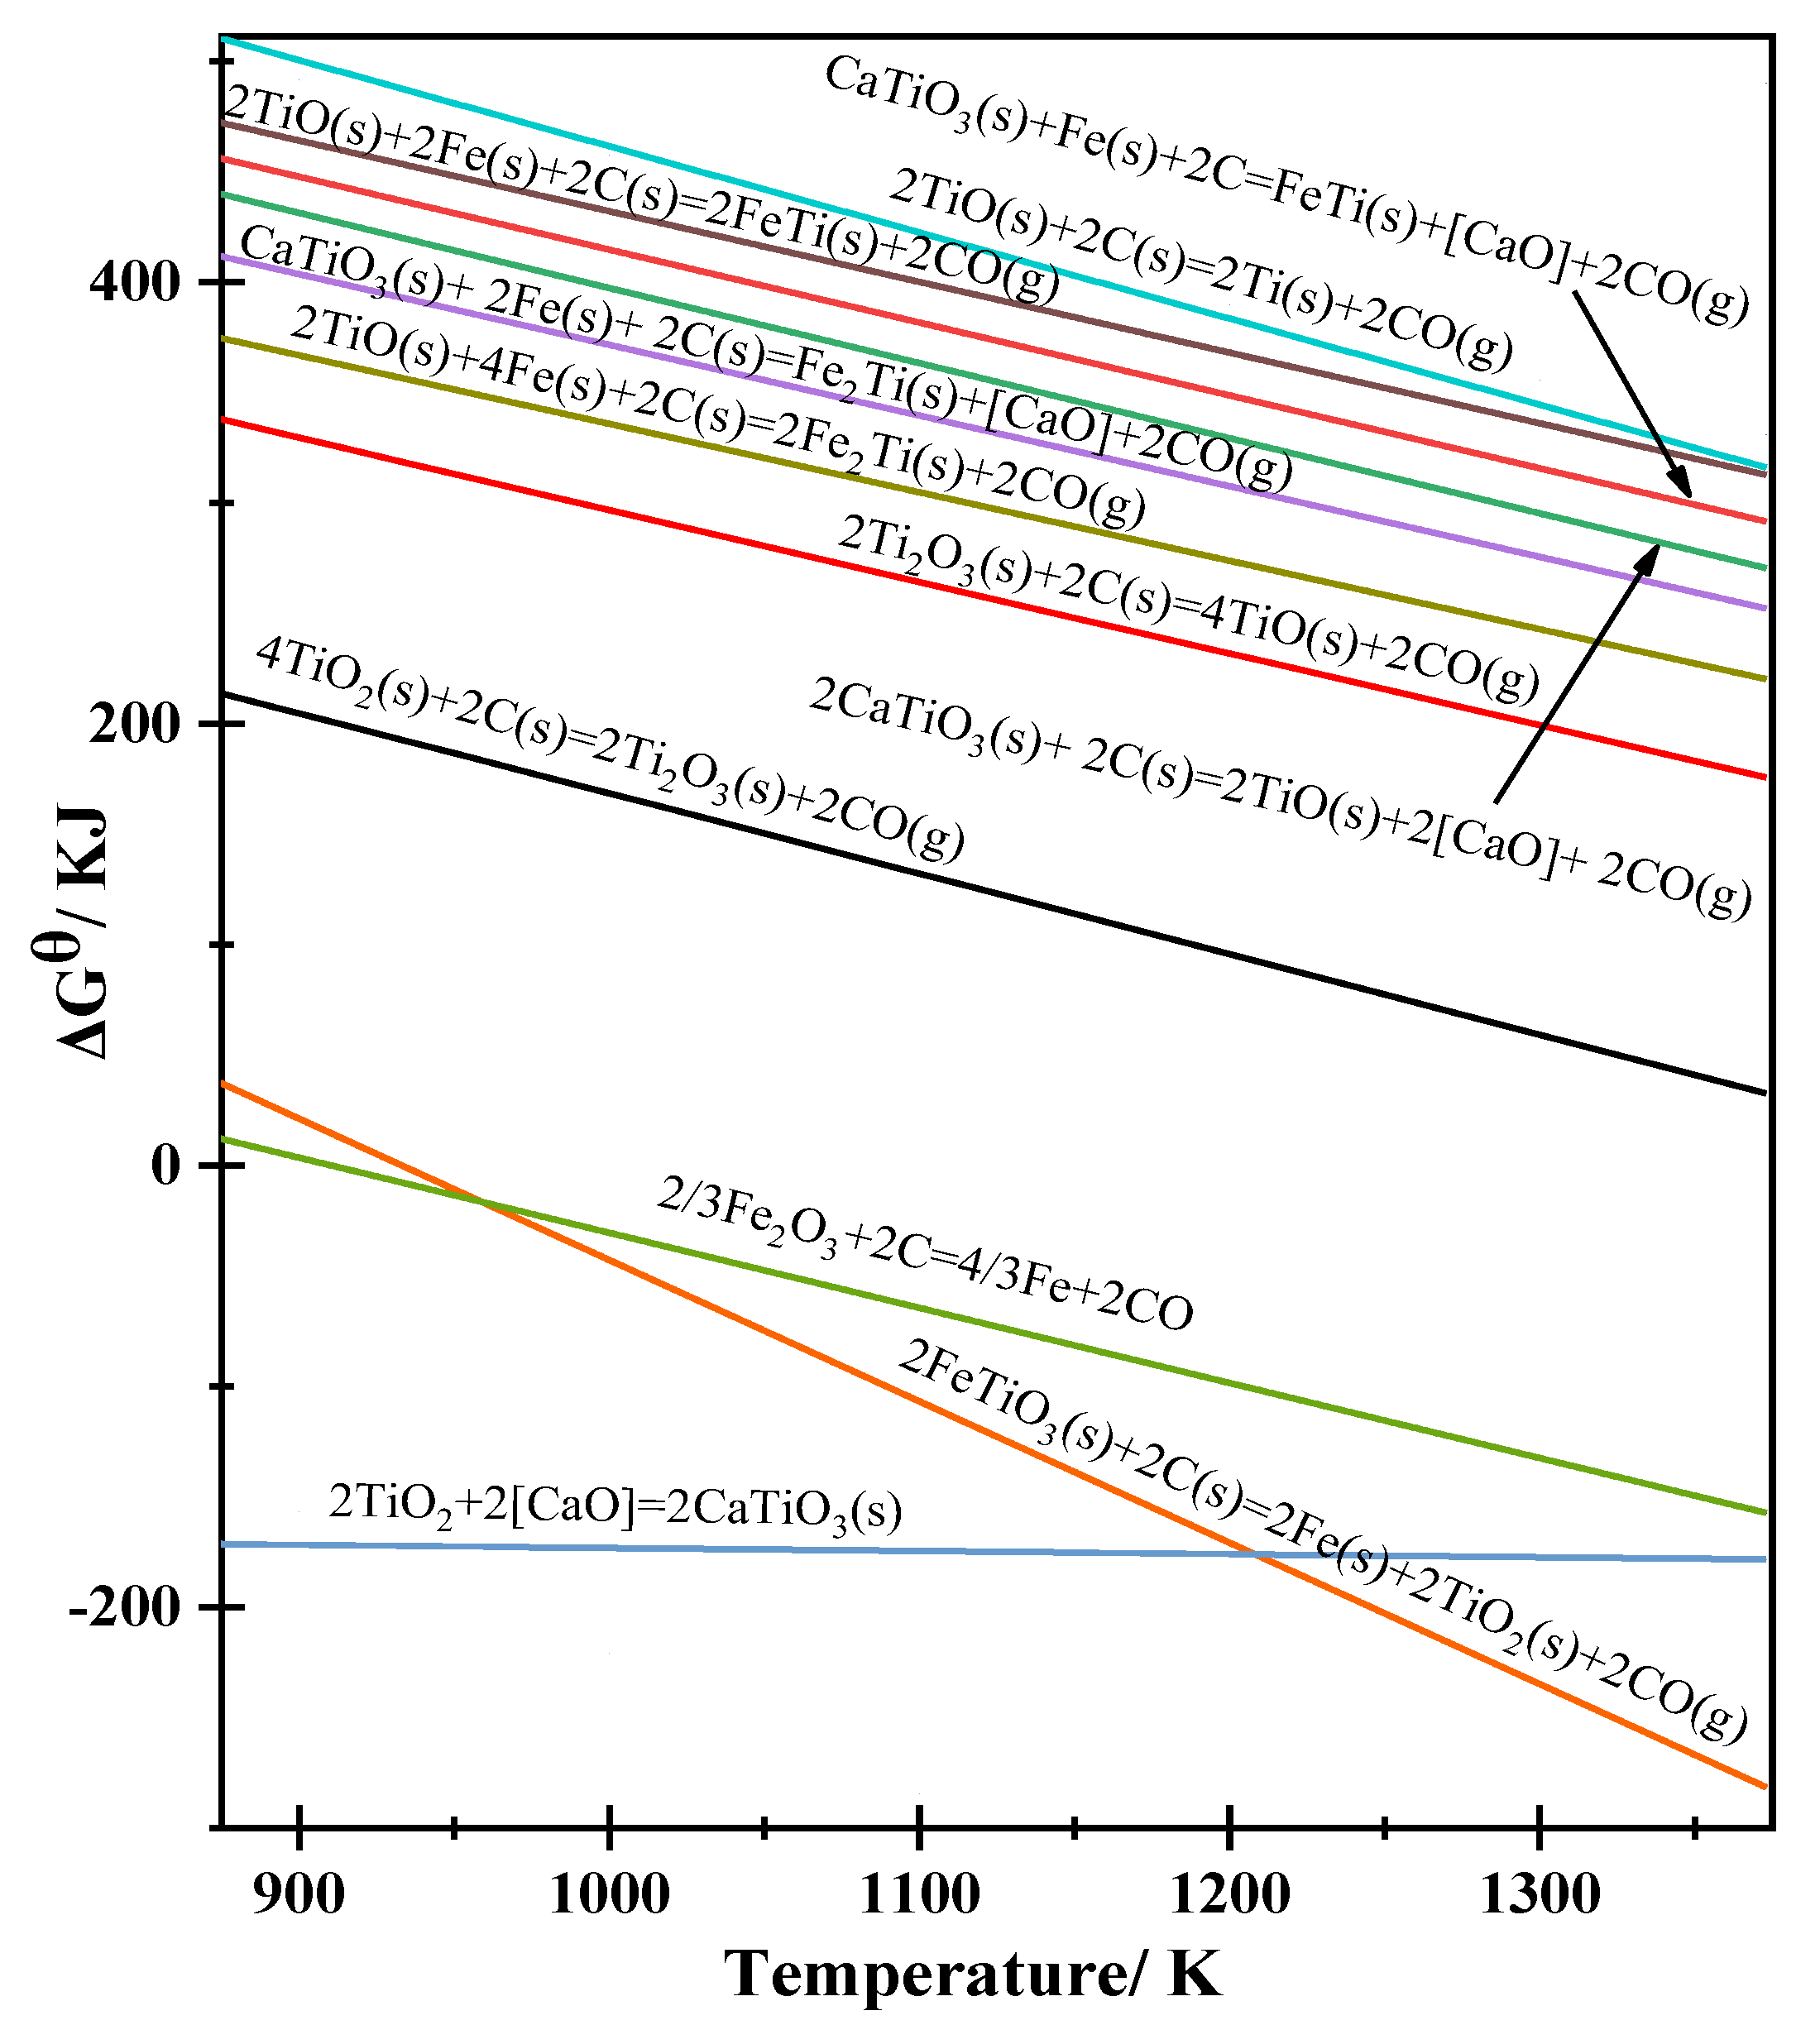
2.3. Experimental Principle
3. Results and Discussion
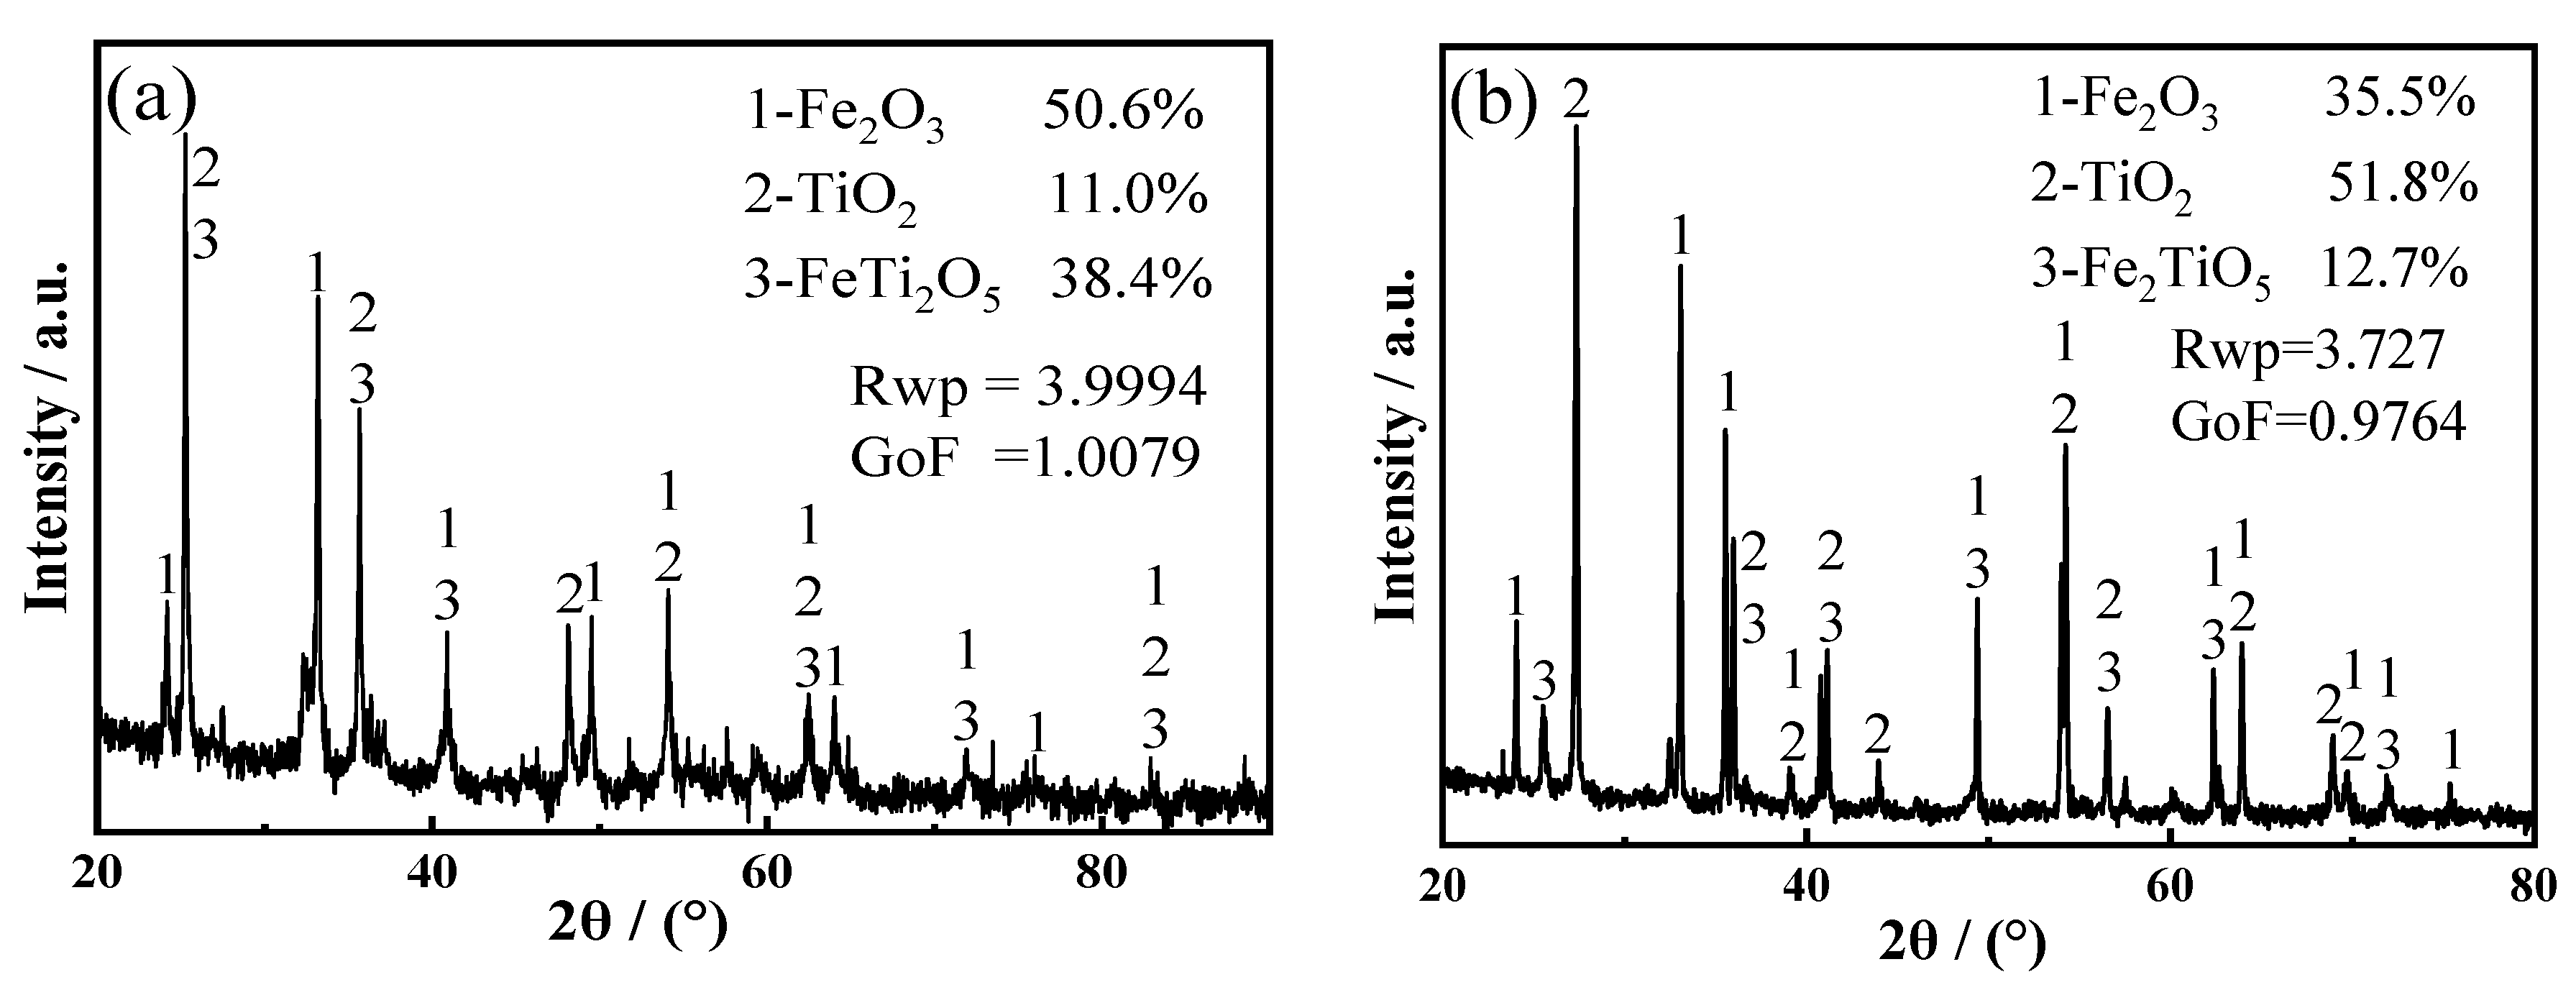
3.1. Mixed Oxide Cathode
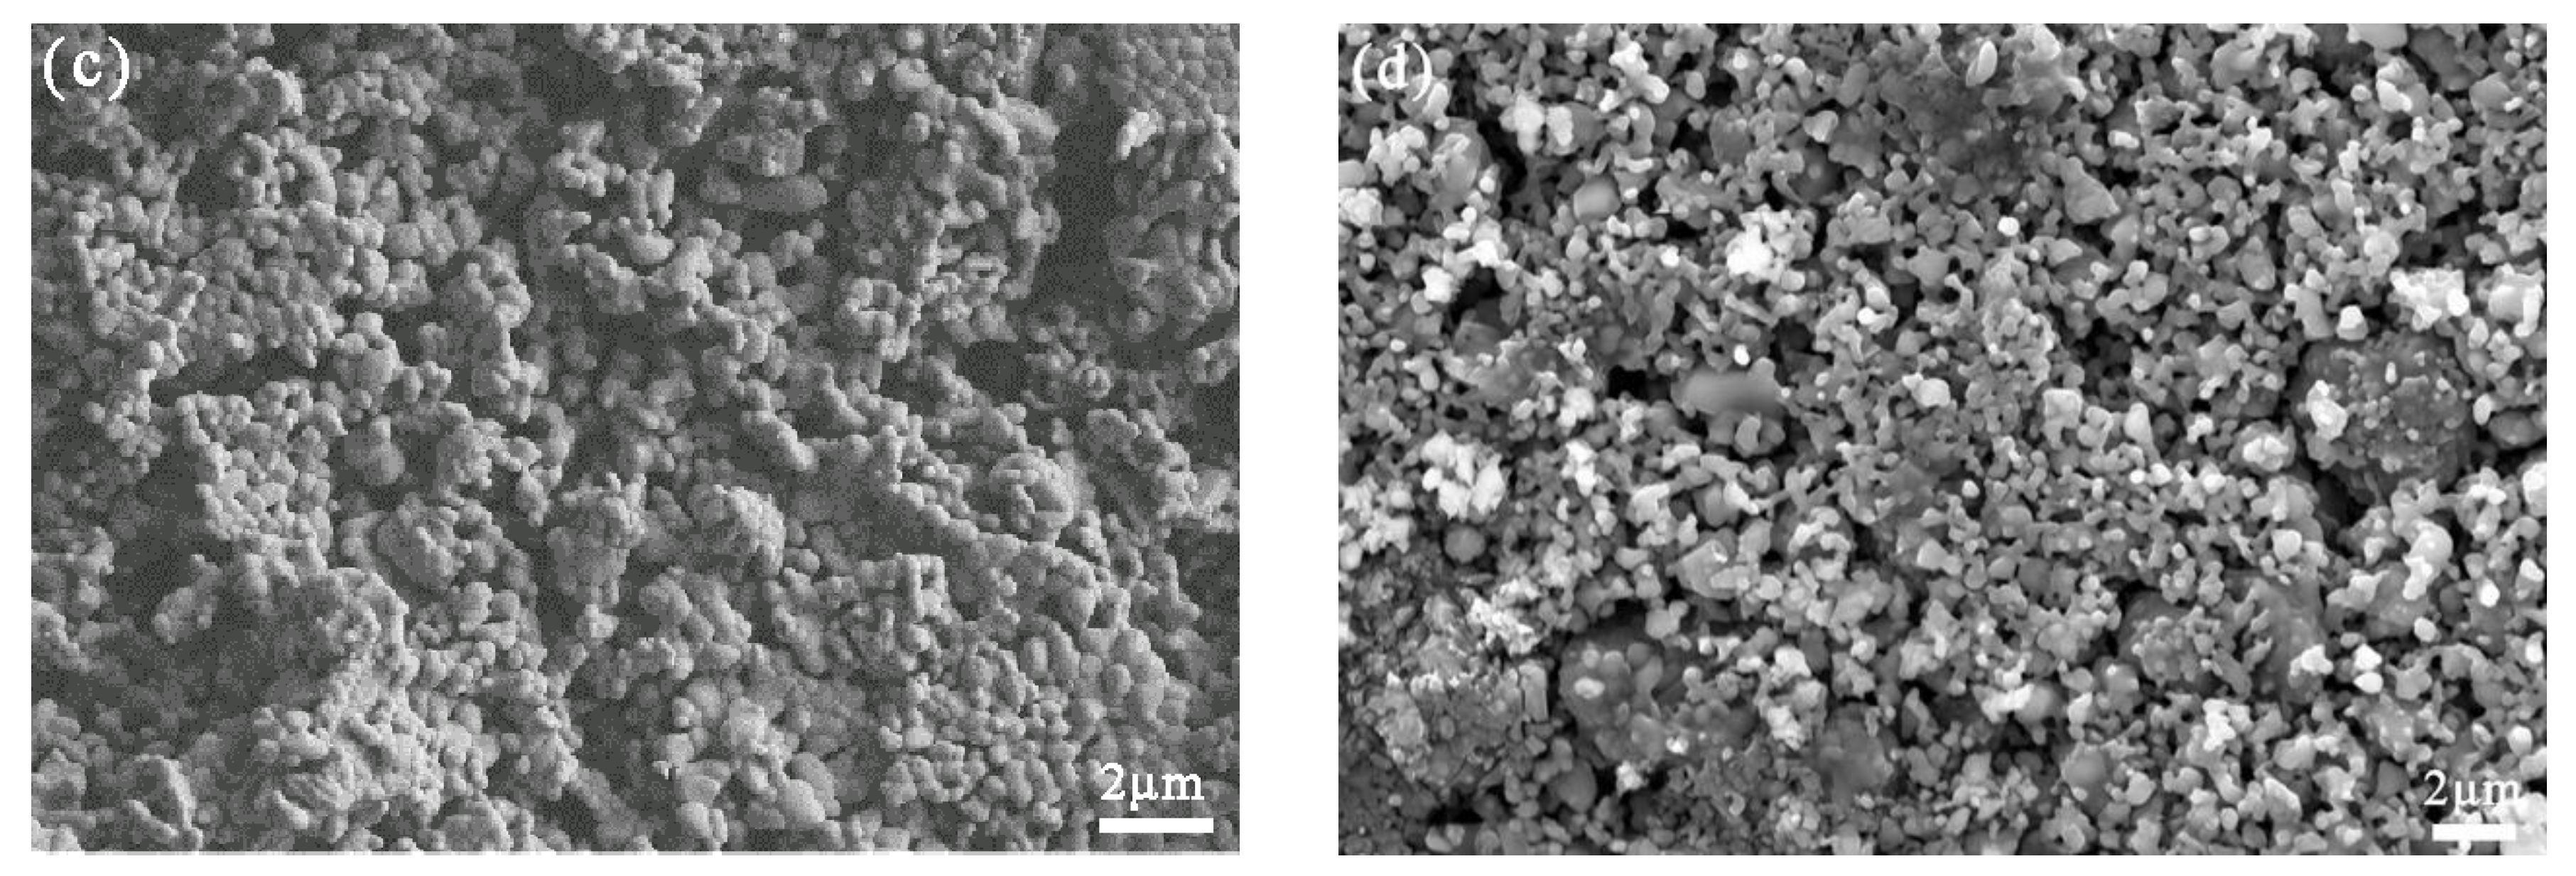
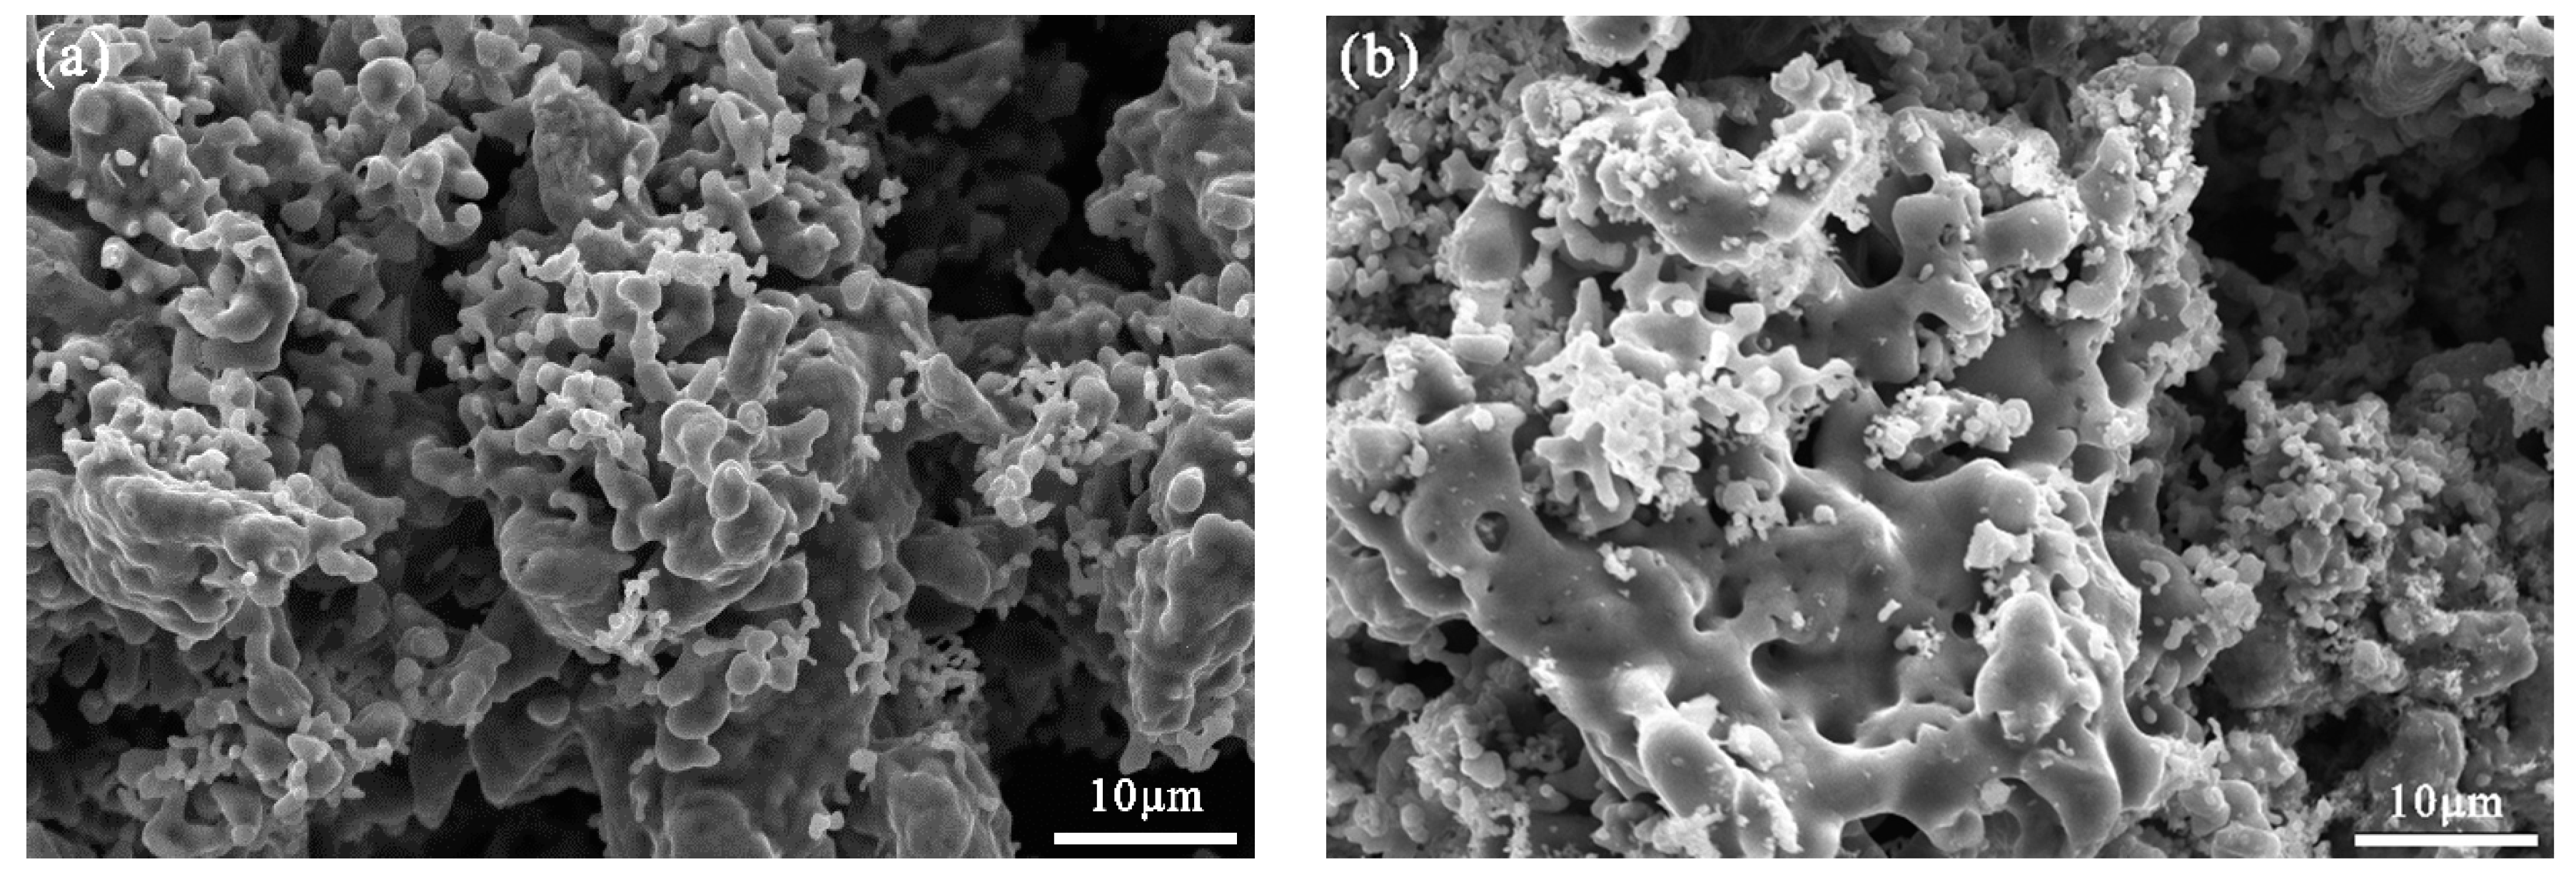
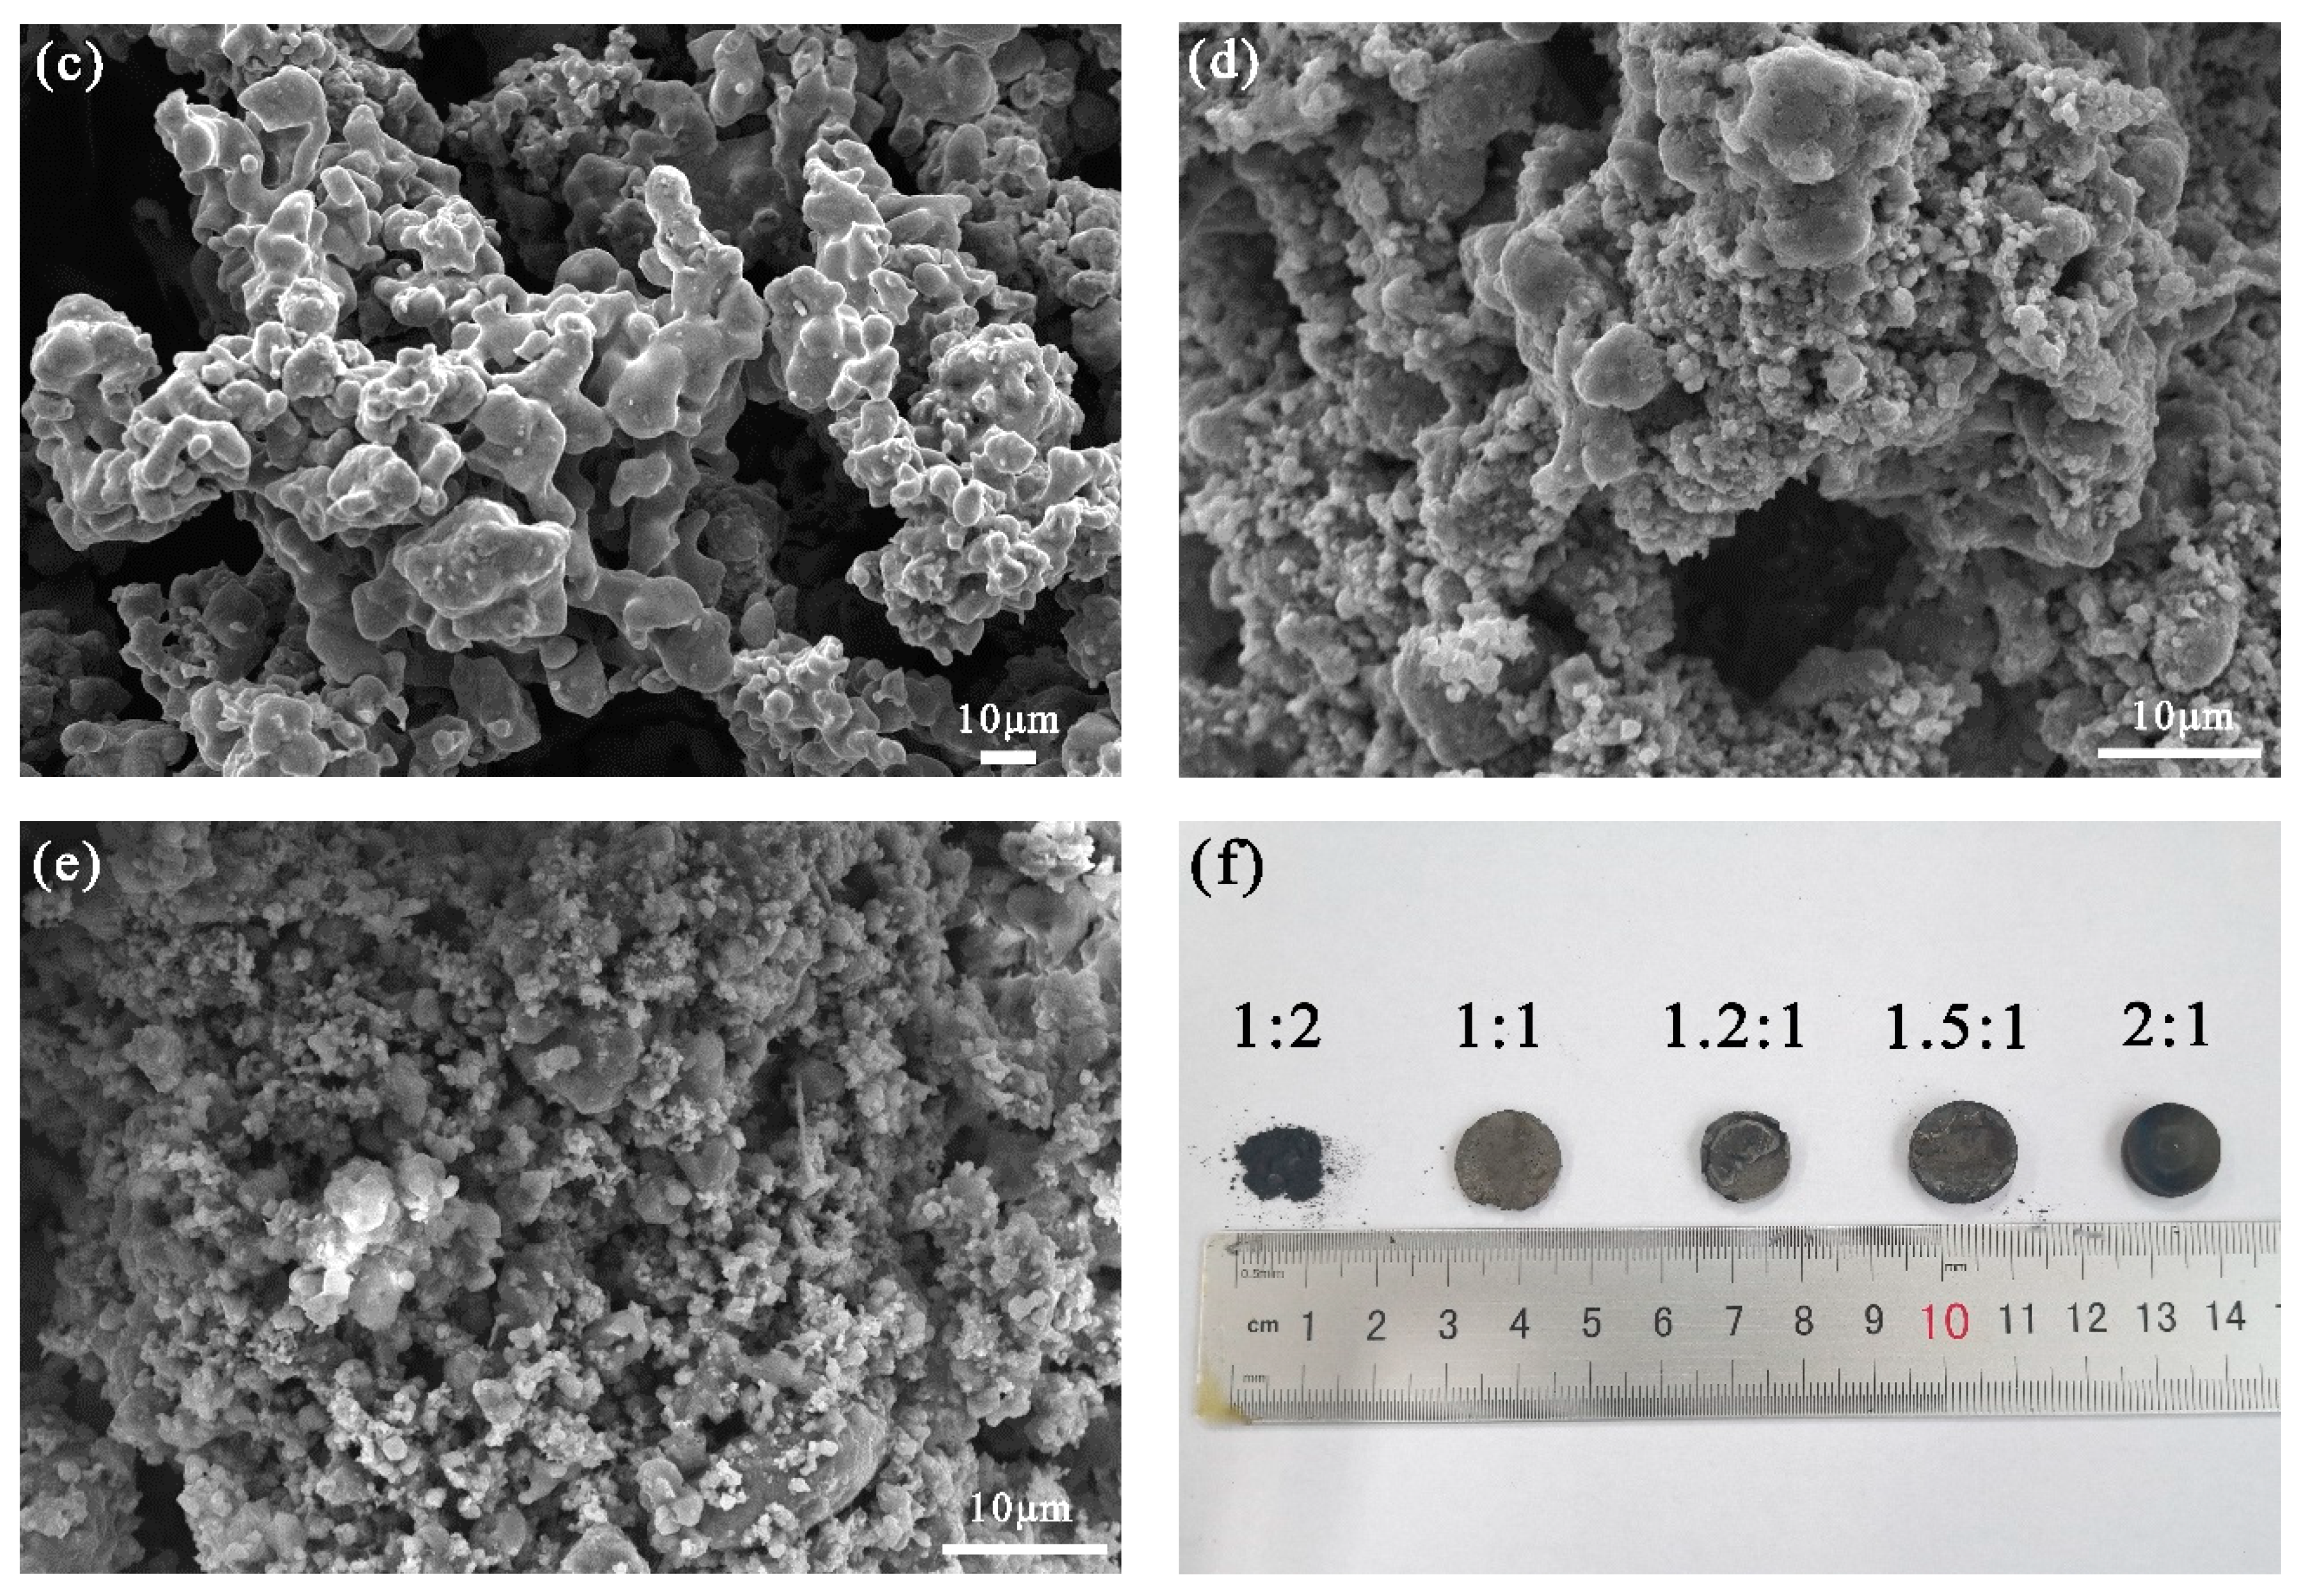
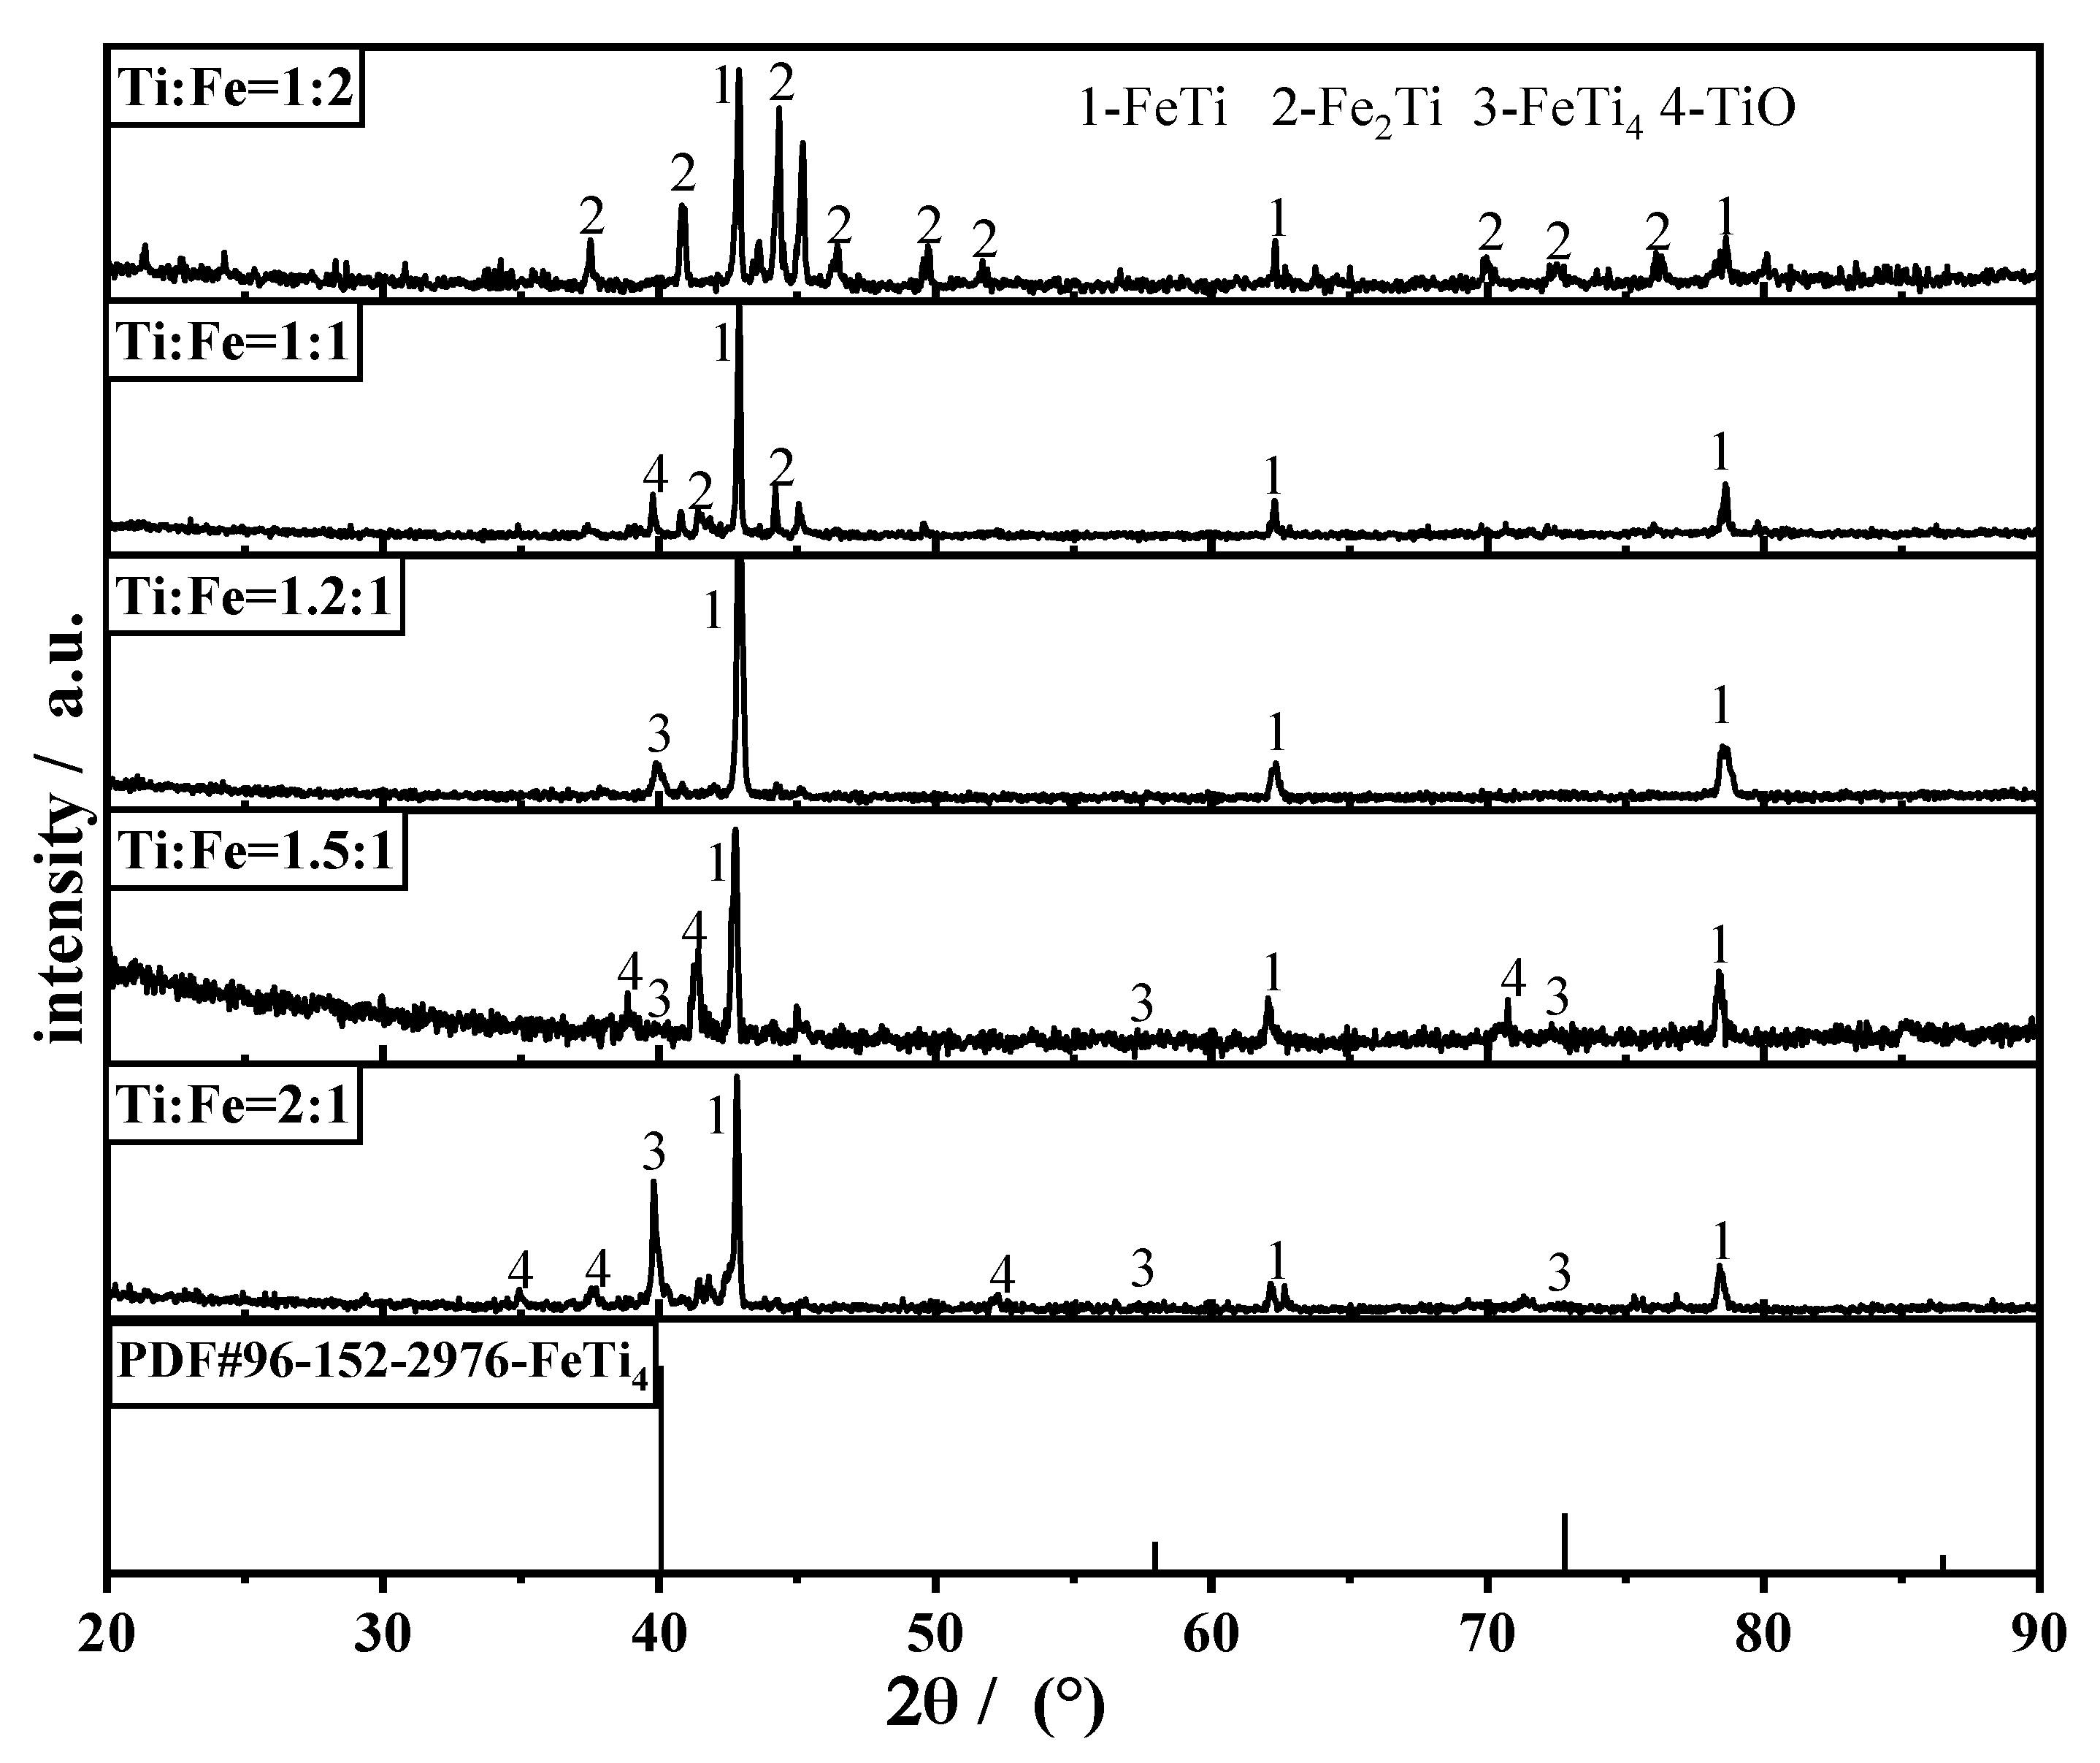
3.2. Effect of Raw Material Ratio on the Morphology of the Product and Its Elemental Composition
3.3. Effect of Raw Material Ratio on the Electrolysis Process
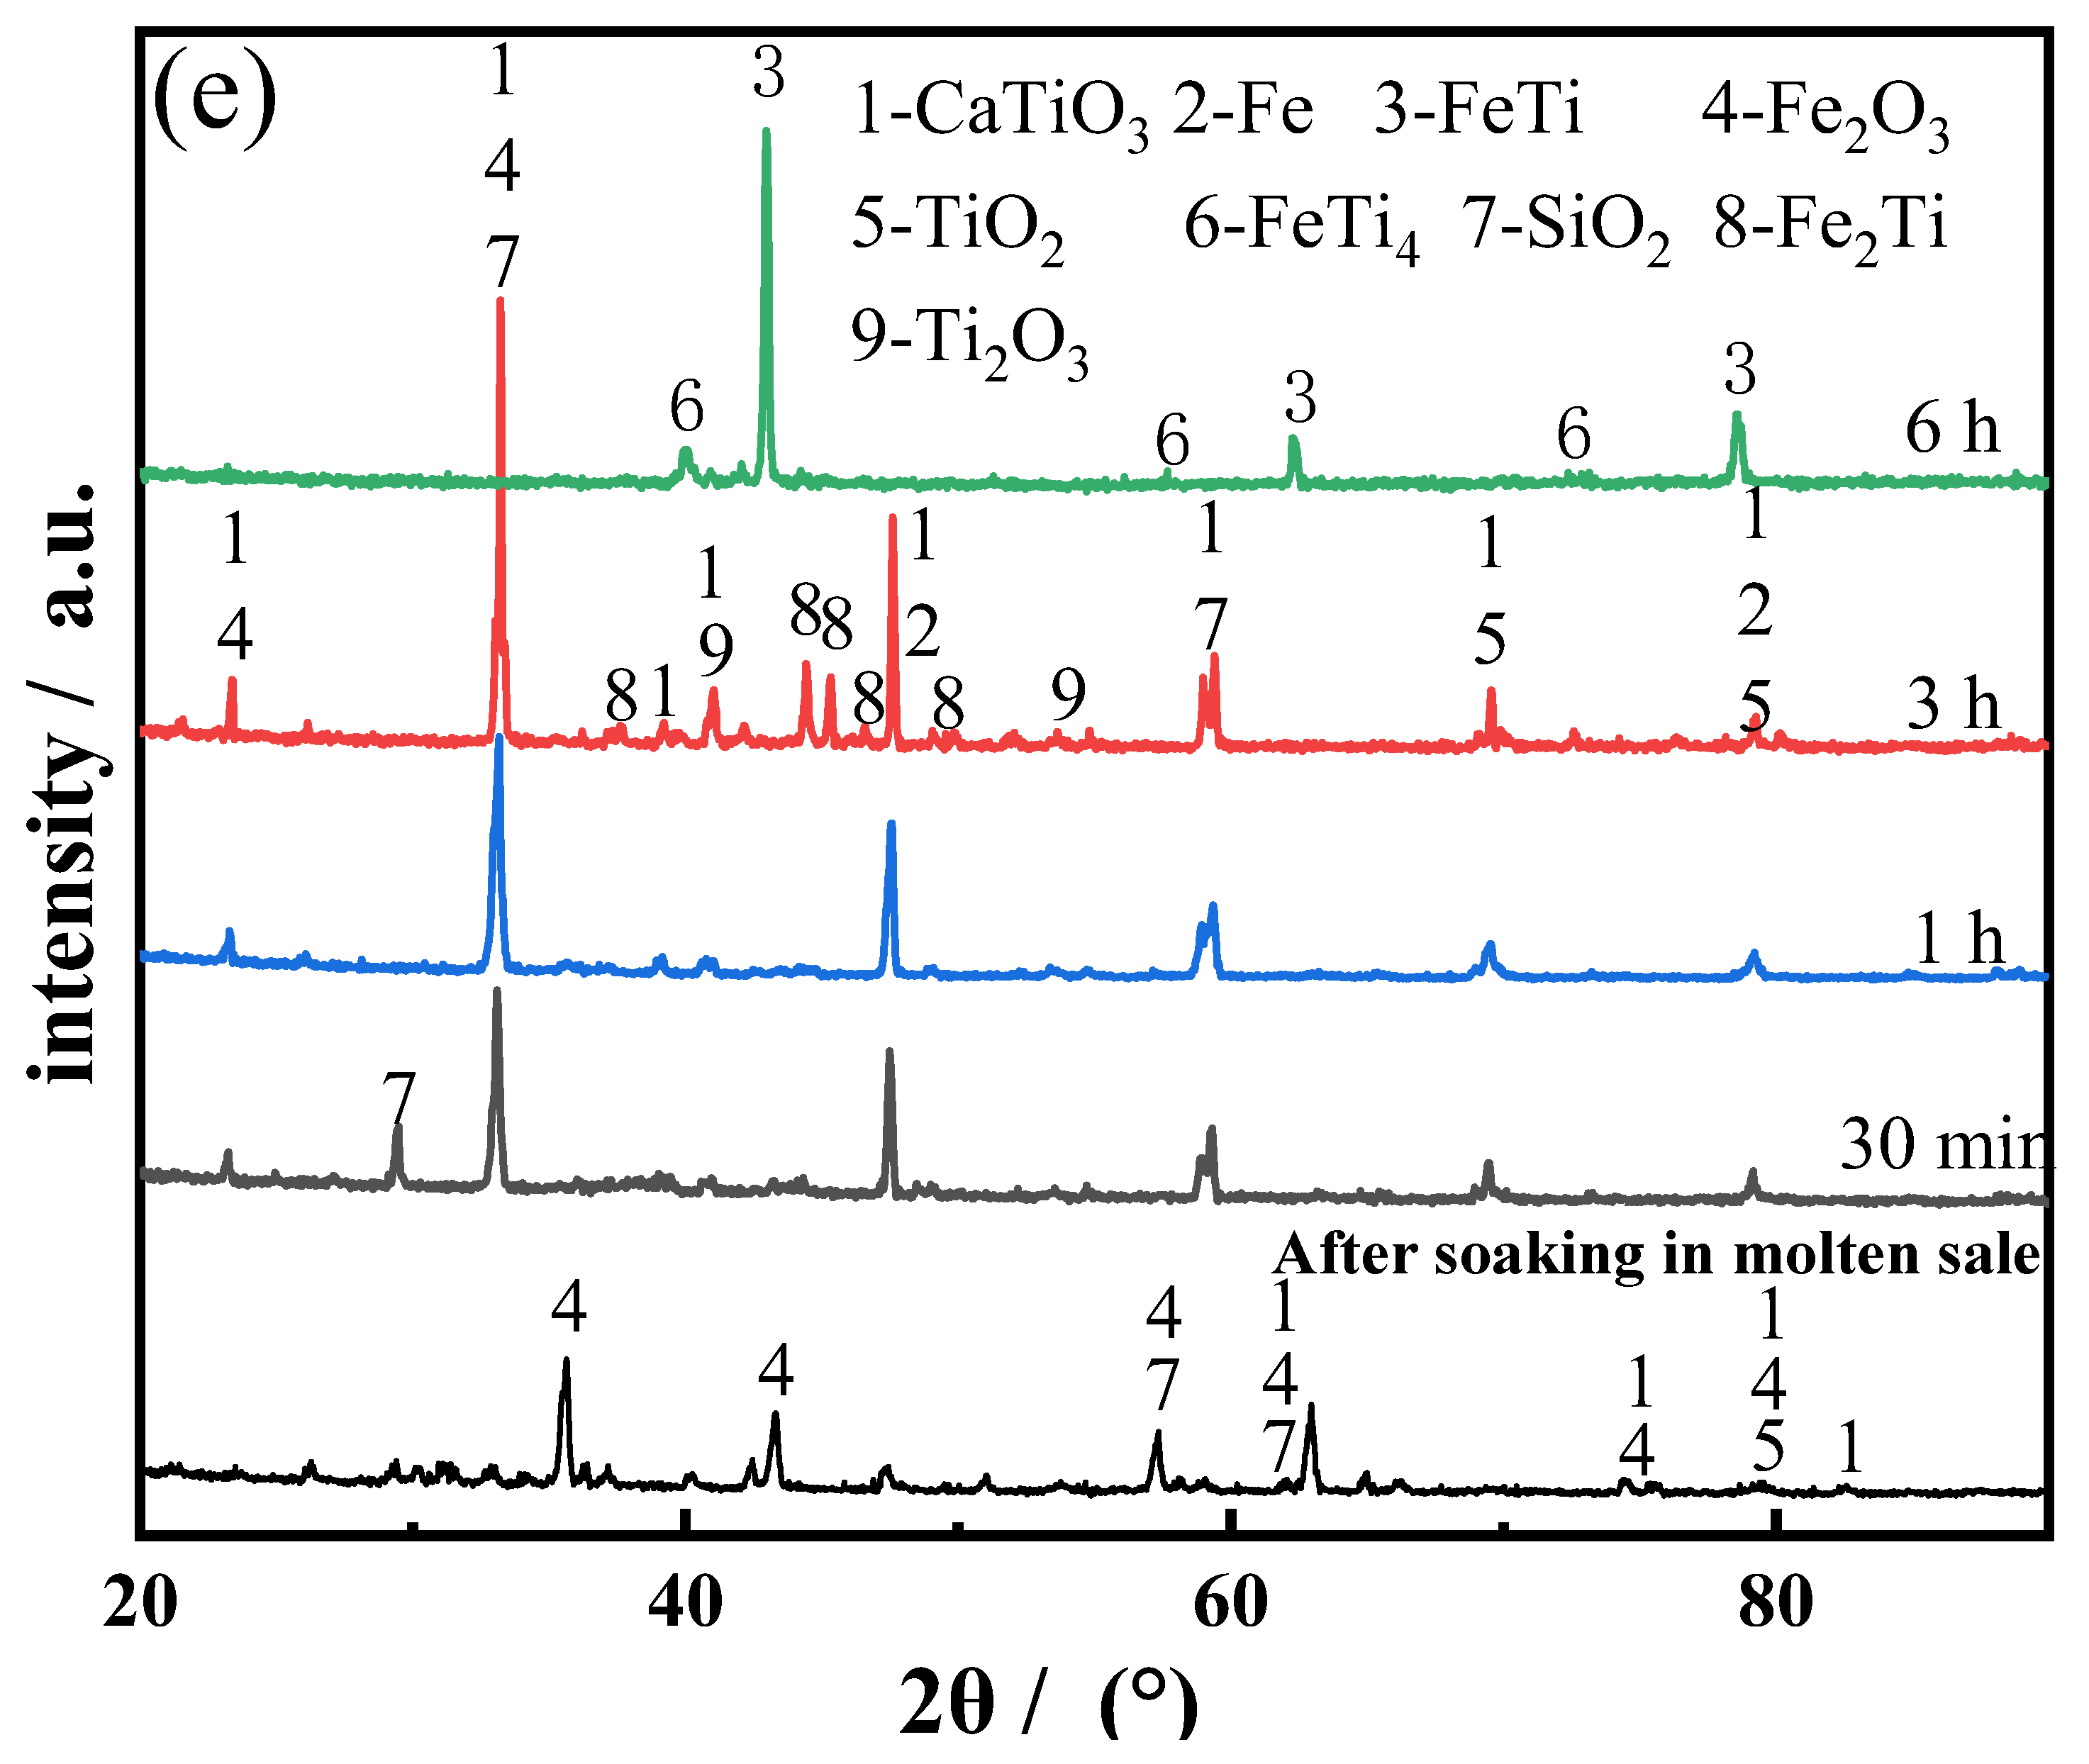
3.4. Effect of the Duration of the Electrolysis Process on the Physical Properties of the Alloys
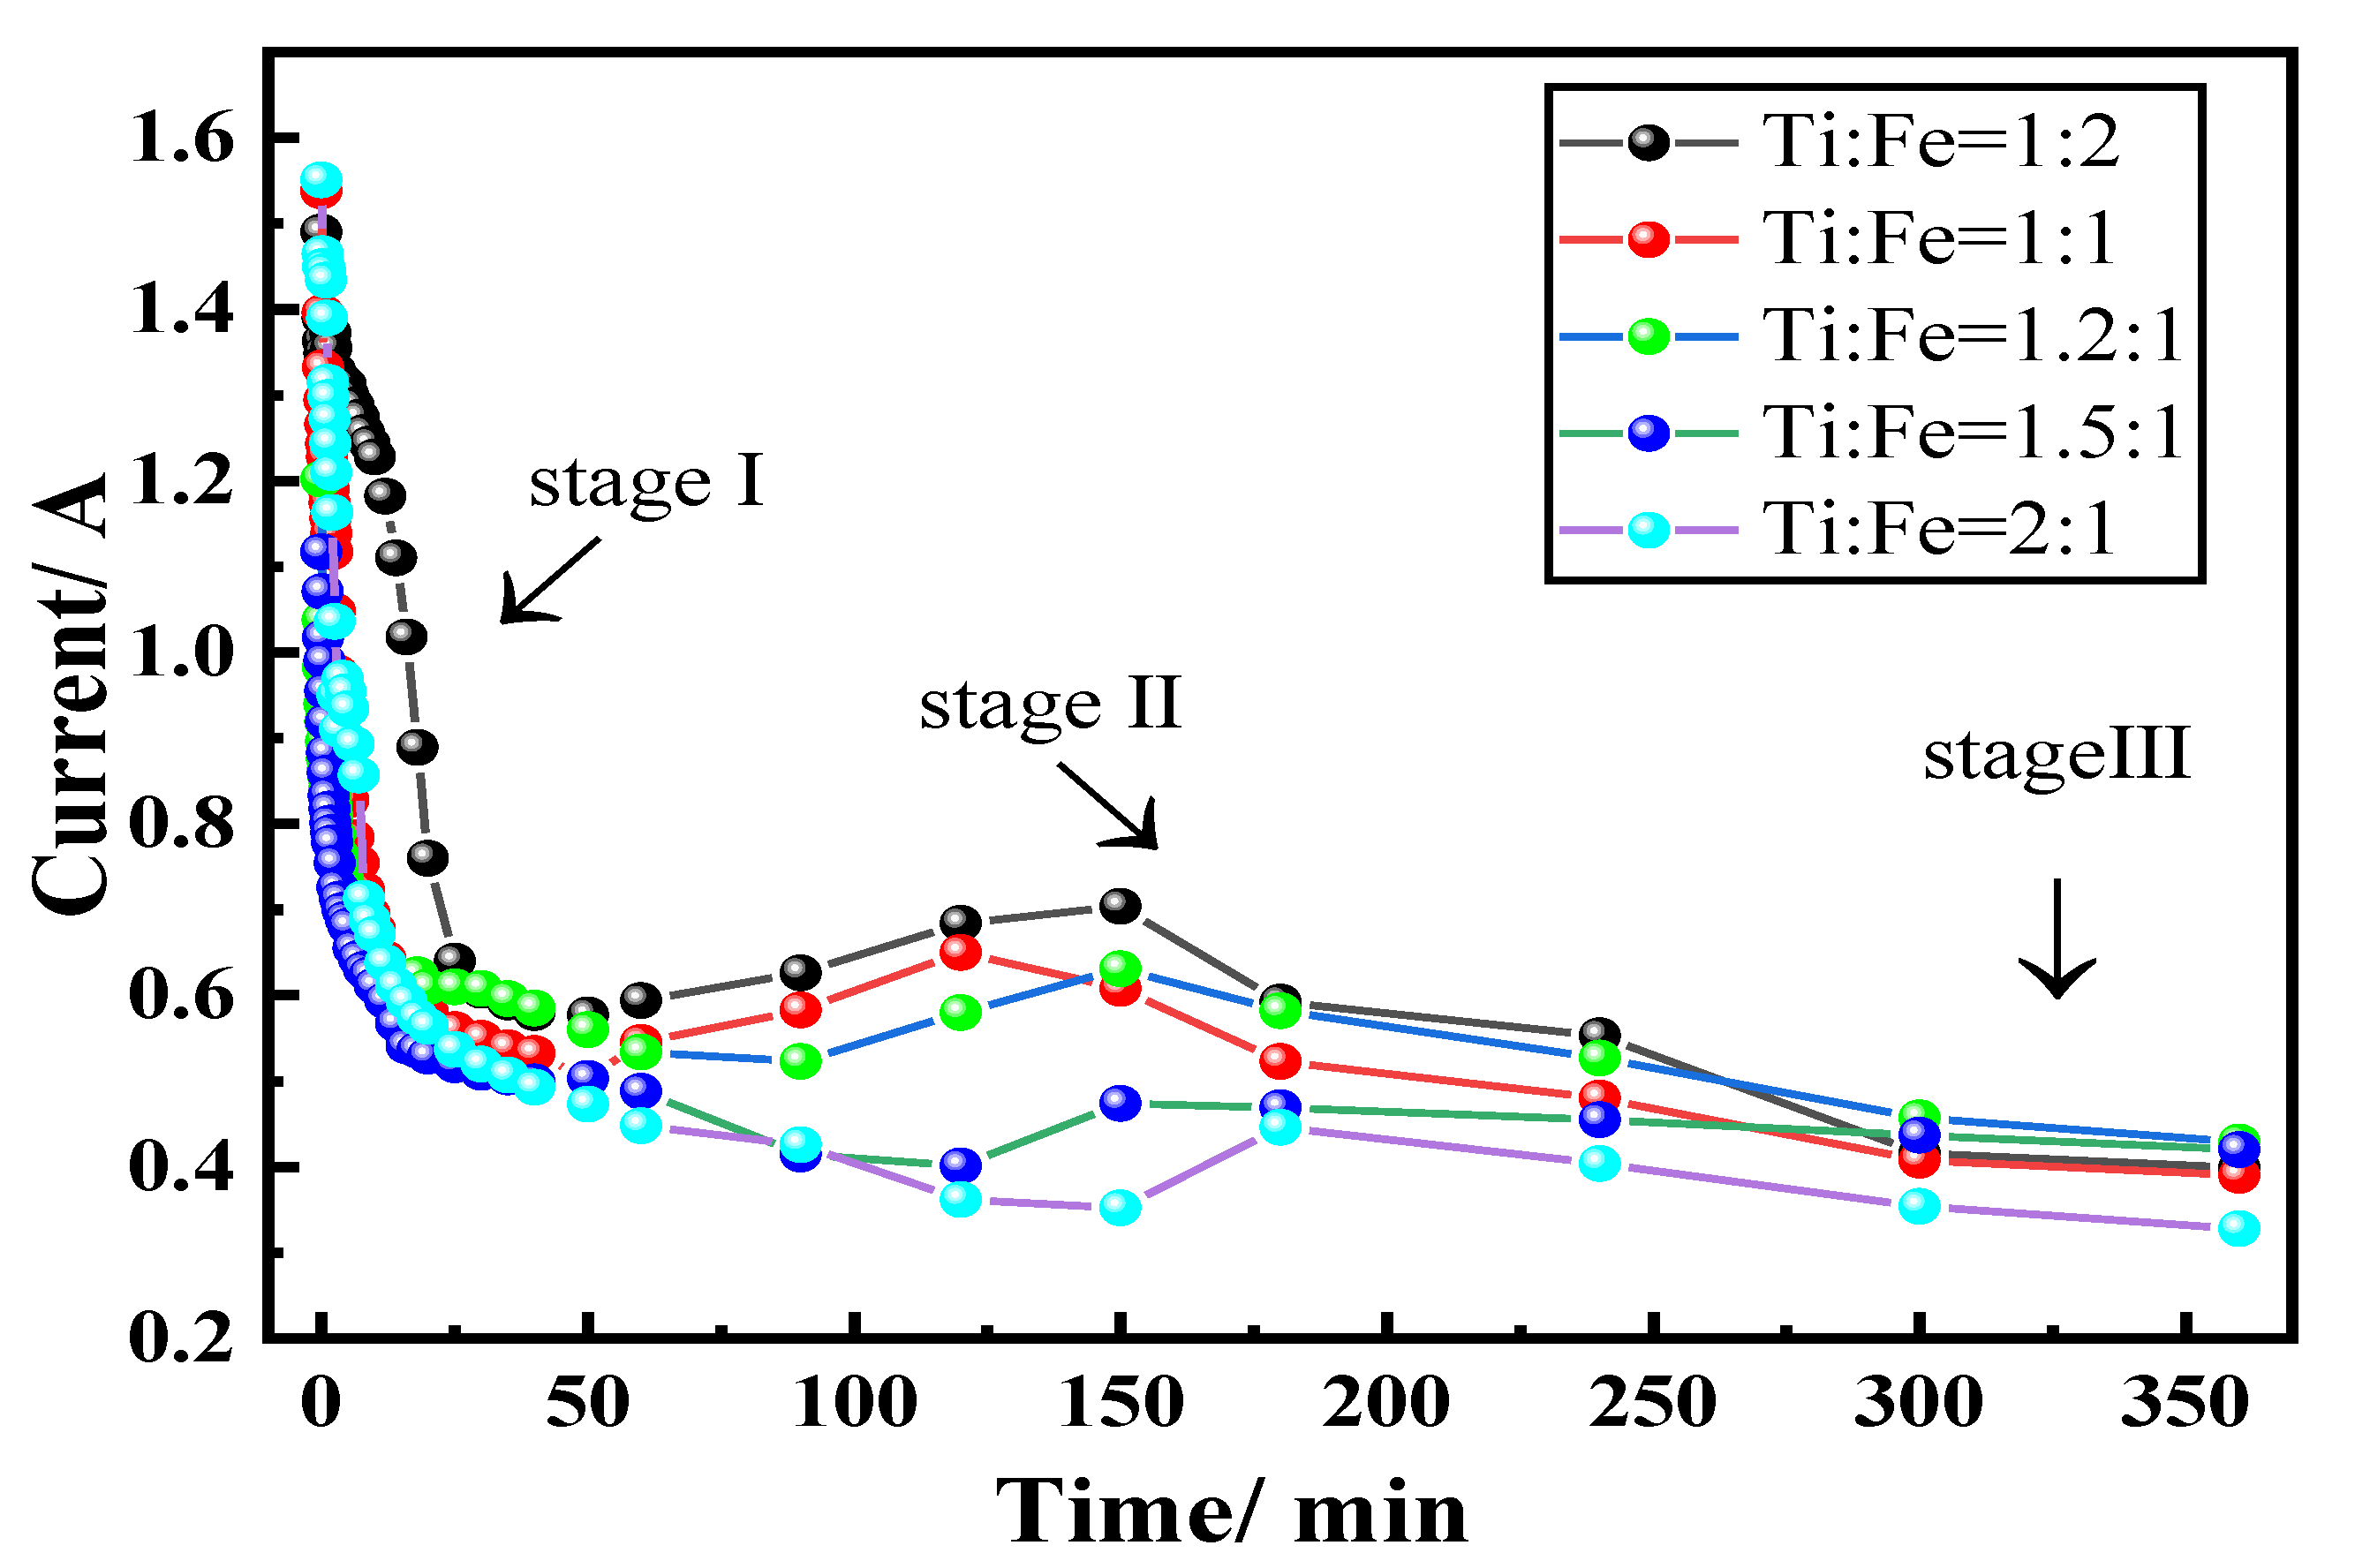
3.5. Effect of the Ratio of Raw Material on the Electrolysis Current
4. Conclusions
- High-purity FeTi and FeTi4 alloys were successfully prepared from the mixed titanium-containing waste slag and Fe2O3 by electrolysis at 900 °C and 3.1 V for 6 h in molten calcium chloride. As the atomic ratio of Ti increased, the Fe2Ti phase decreased while that of FeTi4 increased. The morphology of the product gradually became dense, and impurities such as carbon particles were absent in the dense structure of the FeTi and β-Ti alloys. A lower porosity of the pellet limited the transfer of electrons and oxygen ions, which would further limit the removal of oxygen ions and other impurity elements from the cathode pellet.
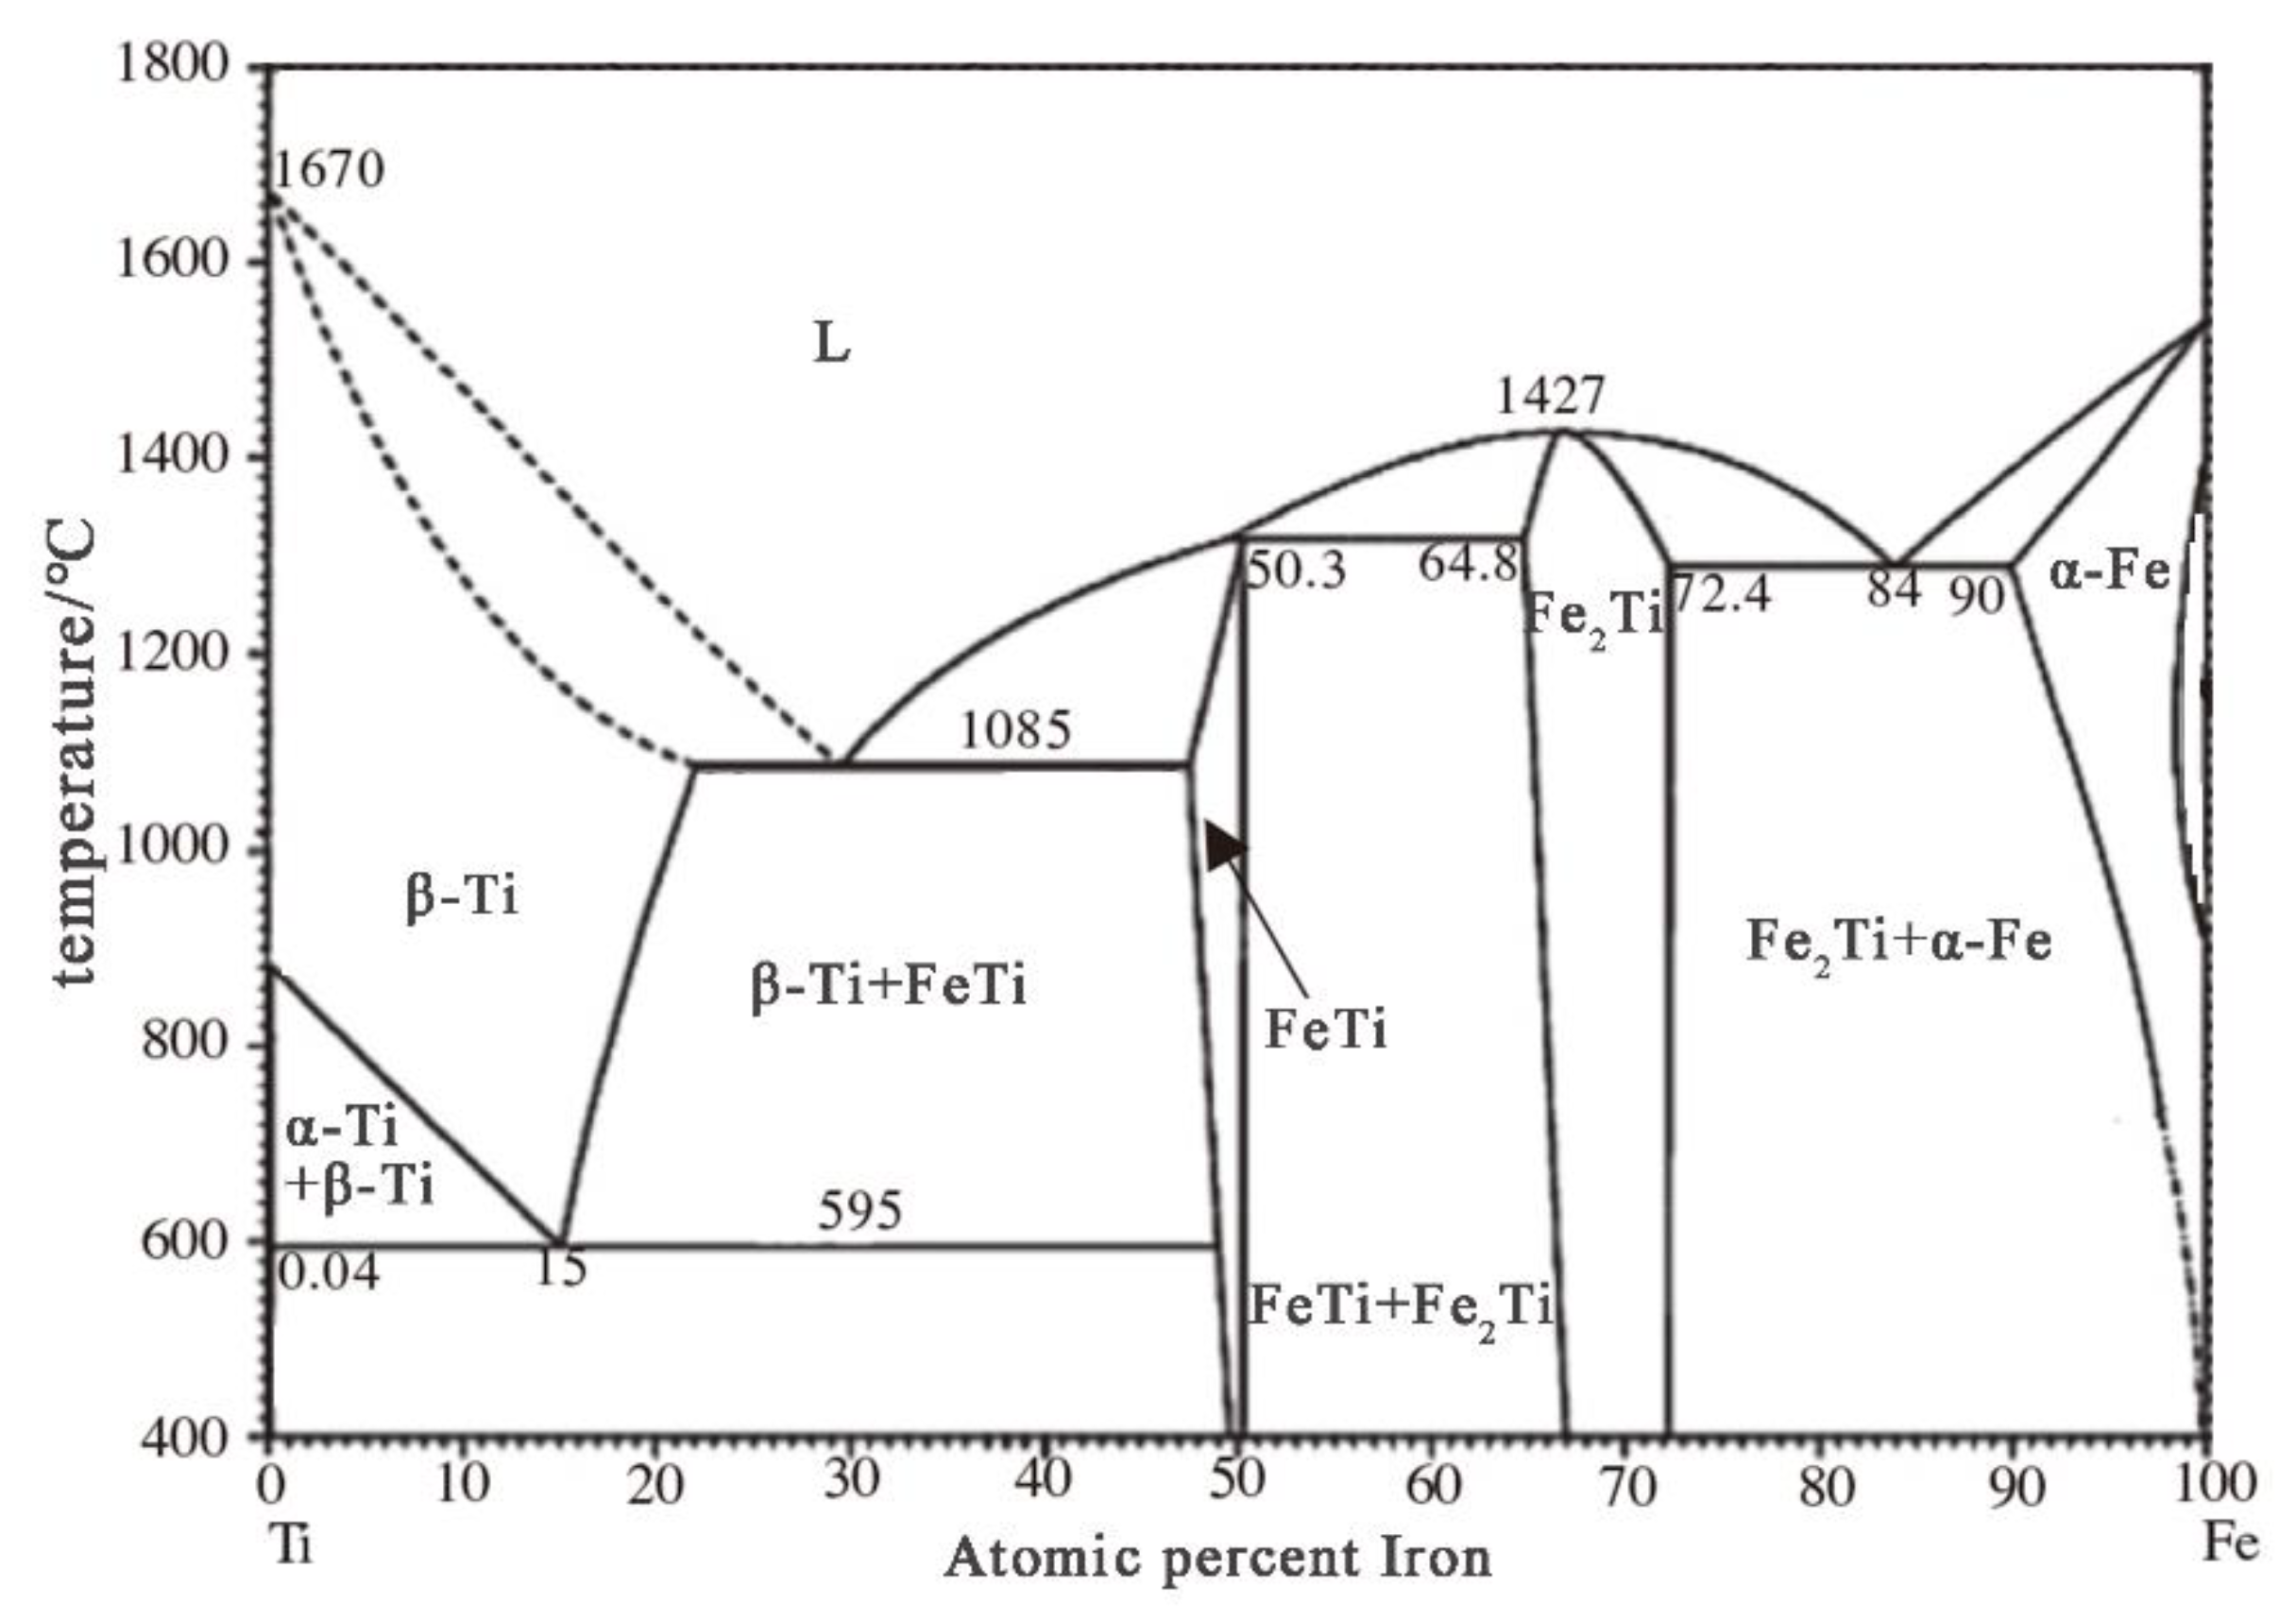
- The alloying process of ferrotitanium can be divided into two routes, depending on the proportion of the iron atoms in the raw materials. When the atomic ratio of Ti and Fe is 1.2:1, both alloying routes coexist simultaneously. At this atomic ratio, the microscopic morphology of the cathode is uniform and it displayed a sponge-like structure.
- The current–time curve of the electrolytic process can be divided into three main stages. As the proportion of the iron atoms decreased, the time required for the start of the second stage and the current efficiency gradually decreased.
Author Contributions
Funding
Conflicts of Interest
References
- Kuenen, J. Ferro-Alloy Production. In EMEP/EEA Emission Inventory Guidebook; EEA: Copenhagen, Denmark, 2009; pp. 3–7. [Google Scholar]
- Smirnov, L.A.; Grabeklis, A.A.; Demin, B.L. Processing slag from ferroalloy production. Steel Transl. 2009, 39, 93–96. [Google Scholar] [CrossRef]
- Tripathy, P.K.; Gauthier, M.; Fray, D.J. Electrochemical Deoxidation of Titanium Foam in Molten Calcium Chloride. Met. Mater. Trans. A 2007, 38, 893–900. [Google Scholar] [CrossRef]
- Zhao, K.; Wang, Y.; Gao, F. Electrochemical extraction of titanium from carbon-doped titanium dioxide precursors by electrolysis in chloride molten salt. Ionics 2019, 25, 6107–6114. [Google Scholar] [CrossRef]
- Li, J.; Zhang, X.Y.; Liu, Y.B.; Li, Y.G.; Liu, R.P. Electrochemical behavior of tungsten in (NaCl-KCl-NaF-WO3) molten salt. Rare Met. 2013, 32, 512. [Google Scholar] [CrossRef]
- Chen, G.Z.; Fray, D.J.; Farthing, T.W. Direct Electrochemical Reduction of Titanium Dioxide to Titanium in Molten Calcium Chloride. Nature 2000, 407, 361–364. [Google Scholar] [CrossRef]
- Han, W.; Li, M.; Zhang, M.-L.; Yan, Y.-D. Progress in preparation of rare earth metals and alloys by electrodeposition in molten salts. Rare Met. 2016, 35, 811–825. [Google Scholar] [CrossRef]
- Zhou, Z.; Hua, Y.; Xu, C.; Li, J.; Li, Y.; Gong, K.; Ru, J.; Xiong, L. Preparation of Ferrotitanium from Ilmenite by Electrolysis-Assisted Calciothermic Reduction in CaCl2-NaCl Molten Salt. JOM 2015, 68, 532–539. [Google Scholar] [CrossRef]
- Tan, S.; Örs, T.; Aydınol, M.K.; Anikina, E.; Karakaya, I. Synthesis of FeTi from mixed oxide precursors. J. Alloys Compd. 2009, 475, 368–372. [Google Scholar] [CrossRef]
- Panigrahi, M.; Iizuka, A.; Shibata, E.; Nakamura, T. Electrolytic reduction of mixed (Fe, Ti) oxide using molten calcium chloride electrolyte. J. Alloys Compd. 2013, 550, 545–552. [Google Scholar] [CrossRef]
- Shi, R.M.; Bao, L.F.; Zhang, B. Effect of Temperature on the Ti-Fe Alloy Prepared by Molten Salt Electrolysis. Adv. Mater. Res. 2014, 936, 1189–1194. [Google Scholar] [CrossRef]
- Du, J.; Li, Q.; Yang, S.; Yang, C.; Li, Z.; Xi, Z. Preparation of TiFe alloy by ilmenite electrolysis in molten salt. Rare Met. Mater. Eng. 2010, 39, 2247–2250. [Google Scholar]
- Guo, X.; Guo, Z.; Wang, Z. Direct preparation of TiFe alloy by electrolytic reduction from TiO2 and Fe2O3. J. Univ. Sci. Technol. Beijing 2008, 30, 620–624. [Google Scholar]
- Ding, M.T. Ratio of magnesium in prepared high titanium ferroalloy with titanium concentrate and titanium slag by therite reduction. Adv. Mater. Res. 2012, 581, 1092–1095. [Google Scholar] [CrossRef]
- Lu, X.; Zou, X.; Li, C.; Zhong, Q.; Ding, W.; Zhou, Z. Green Electrochemical Process Solid-Oxide Oxygen-Ion-Conducting Membrane (SOM): Direct Extraction of Ti-Fe Alloys from Natural Ilmenite. Met. Mater. Trans. A 2012, 43, 503–512. [Google Scholar] [CrossRef]
- Mohanty, J. Electrolytic Reduction of Titania Slag in Molten Calcium Chloride Bath. JOM 2012, 64, 582–584. [Google Scholar] [CrossRef]
- Li, Z.-Q.; Ru, L.-Y.; Bai, C.-G.; Zhang, N.; Wang, H.-H. Effect of sintering temperature on the electrolysis of TiO2. Int. J. Miner. Met. Mater. 2012, 19, 636–641. [Google Scholar] [CrossRef]
- Shen, Y.Y.; Chen, C.Y.; Li, J.Q. Preparation of titanium by SOM electrolytic process from ultrafine high titanium slag. Rare Met. Mater. Eng. 2019, 48, 1671–1676. [Google Scholar]
- Panigrahi, M.; Shibata, E.; Iizuka, A.; Nakamura, T. Production of Fe-Ti alloy from mixed ilmenite and titanium dioxide by direct electrochemical reduction in molten calcium chloride. Electrochim. Acta 2013, 93, 143–151. [Google Scholar] [CrossRef]
- Chen, C.; Yang, X.; Li, J.; Lu, X.; Yang, S. Direct Electrolytic Reduction of Solid Ta2O5 to Ta with SOM Process. Met. Mater. Trans. A 2016, 47, 1727–1735. [Google Scholar] [CrossRef]
- Zhou, Z.; Hua, Y.; Xu, C.; Li, J.; Li, Y.; Zang, Q.; Zang, Y.; Kuang, W. Synthesis of micro-FeTi powders by direct electrochemical reduction of ilmenite in CaCl2-NaCl molten salt. Ionics 2017, 23, 213–221. [Google Scholar] [CrossRef]
- Wang, S.L.; Li, S.C.; Wan, L.F.; Wang, C.H. Electro-deoxidation of V2O3 in molten CaCl2-NaCl-CaO. Int. J. Miner. Met. Mater. 2012, 19, 212. [Google Scholar] [CrossRef]
- Wang, S.L.; Wang, W.; Li, S.C.; Cao, S.H. Cathodic behavior of molten CaCl2-CaO and CaCl2-NaCl-CaO. Int. J. Miner. Met. Mater. 2010, 17, 791. [Google Scholar] [CrossRef]
- Rong, L.; He, R.; Wang, Z.; Peng, J.; Jin, X.; Chen, G.Z. Investigation of electrochemical reduction of GeO2 to Ge in molten CaCl2-NaCl. Electrochim. Acta 2014, 147, 352–359. [Google Scholar] [CrossRef]
- Kartal, L.; Daryal, M.B.; Şireli, G.K.; Timur, S. One-step electrochemical reduction of stibnite concentrate in molten borax. Int. J. Miner. Met. Mater. 2019, 26, 1258–1265. [Google Scholar] [CrossRef]
- Song, J.X.; Wang, Q.Y.; Hu, G.J.; Zhu, X.B.; Jiao, S.Q.; Zhu, H.M. Equilibrium between titanium ions and high-purity titanium electrorefining in a NaCl-KCl melt. Int. J. Miner. Met. Mater. 2014, 21, 660. [Google Scholar] [CrossRef]
- Chen, S.; Liao, C.F.; Lin, J.Y.; Cai, B.Q.; Wang, X.; Jiao, Y.F. Electrical conductivity of molten LiF-DyF3-Dy2O3-Cu2O system for Dy-Cu intermediate alloy production. Int. J. Miner. Met. Mater. 2019, 26, 701–709. [Google Scholar] [CrossRef]


| Elements | Ti | O | Al | Si | Ca | Fe | Mn | Mg |
|---|---|---|---|---|---|---|---|---|
| Content (wt%) | 50.15 | 40.65 | 1.22 | 2.01 | 0.65 | 3.61 | 1.43 | 0.28 |
| Electrode Reaction | ΔGθ—T | ΔGθ (T = 1173 K) | Eθ |
|---|---|---|---|
| 2 TiO2 + 2 [CaO] = 2 CaTiO3 (s) | −159.2–0.014T (1) | −175.622 | - |
| 2 FeTiO3 (s) + 2 C (s) = 2 Fe (s) + 2 TiO2 (s )+ 2 CO (g) | 597.14–0.64T (2) | −153.58 | - |
| Fe2O3 + 3 C = 2 Fe + 3 CO | 472.40–0.510T (3) | −125.677 | - |
| 2 CaTiO3 (s) + 2 C (s) = 2 TiO (s) +2 [CaO] + 2 CO (g) | 737.22–0.34T (4) | 338.4 | 0.89 |
| CaTiO3 (s) + 2 Fe (s) + 2 C (s) = Fe2Ti (s) + [CaO] + 2 CO (g) | 691.48–0.32T (5) | 316.12 | 0.82 |
| 2 TiO (s) + 2 C (s) = 2 Ti (s) + 2 CO (g) | 851.38–0.39T (6) | 393.91 | 1.02 |
| 4TiO2 + 2 C = 2Ti2O3 + 2 CO | 531.74–0.364T (7) | 104.768 | 0.27 |
| 2 Ti2O3 + 2 C = 4 TiO + 2 CO | 622.89–0.326T (8) | 240.492 | 0.62 |
| CaTiO3 (s) + Fe (s) + 2 C = FeTi (s) + [CaO] + 2 CO (g) | 744.60–0.33T (9) | 357.51 | 0.93 |
| 2 TiO (s) + 2 Fe (s) + 2 C (s) = 2 FeTi (s) + 2 CO (g) | 751.98–0.32T (10) | 376.62 | 0.98 |
| 2 TiO (s) + 4 Fe (s) + 2 C (s) = 2 Fe2Ti (s) + 2 CO (g) | 645.74–0.31T (11) | 282.11 | 0.73 |
| Elements | Electrode Reaction | Electrode Potential/V |
|---|---|---|
| Ca | Ca2+ + 2e− → Ca | −2.866 |
| Si | Si4+ + 4e− → Si | −0.843 |
| Al | A13+ + 3e− → Al | −1.662 |
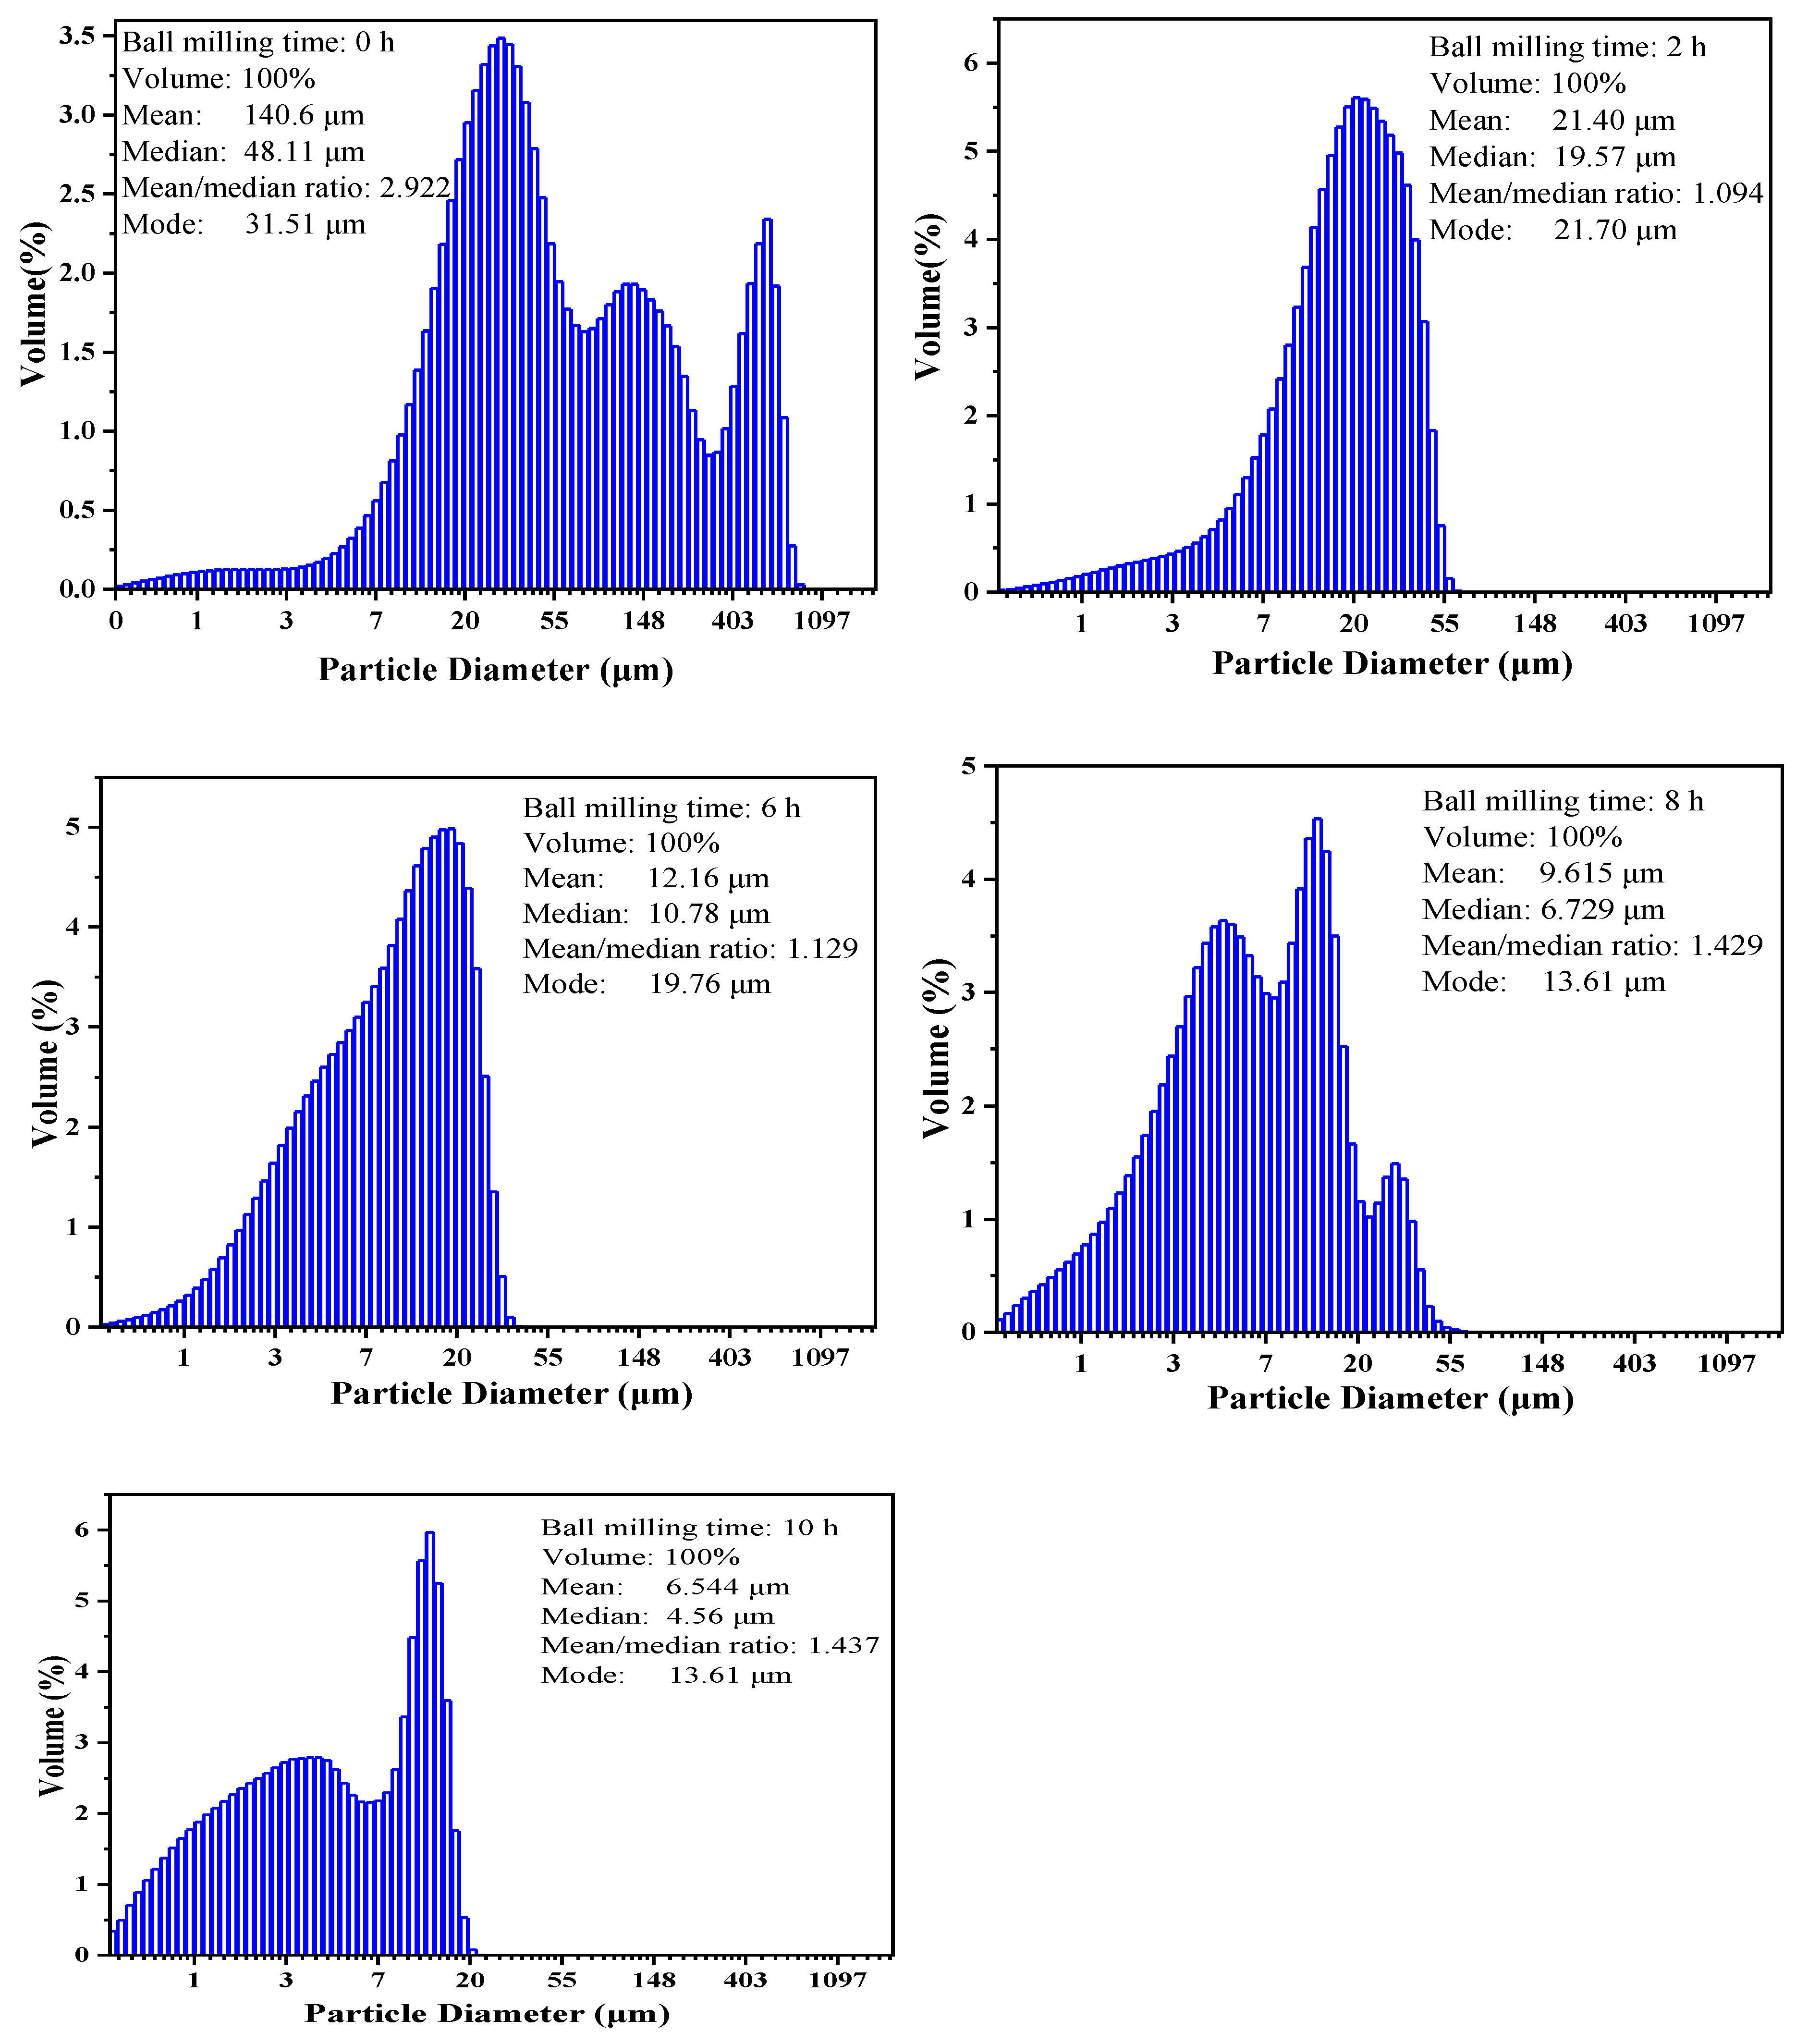
| Time | Raw Ore | 2 h | 6 h | 8 h | 10 h |
|---|---|---|---|---|---|
| Granularity (Median) | 48.11 μm | 19.57 μm | 10.78 μm | 6.73 μm | 4.55 μm |
| Ti:Fe | O | Ti | Fe | C | Si | Ca |
|---|---|---|---|---|---|---|
| 1:2 | 1.95 | 24.53 | 65.3 | 7.65 | 0.57 | - |
| 1:1 | 2.08 | 45.63 | 45.82 | 5.04 | 1.43 | - |
| 1.2:1 | 0.69 | 49.34 | 45.43 | 2.67 | 1.87 | - |
| 1.5:1 | 2.05 | 44.62 | 47.69 | 2.02 | 2.1 | 1.52 |
| 2:1 | 6.49 | 57.4 | 29.92 | 2.06 | 2.04 | 2.09 |
| Atomic Ratio (Ti:Fe) | Ti | Fe | Main Phase | Rwp | GoF |
|---|---|---|---|---|---|
| 1:2 | 27.11 | 61.50 | Fe2Ti: 73.2%; FeTi: 26.8 | 3.8886 | 0.9955 |
| 1:1 | 41.39 | 35.88 | Fe2Ti: 39.2%; FeTi: 58.8%; TiO: 2.0% | 5.9063 | 1.1227 |
| 1.2:1 | 46.81 | 36.89 | FeTi4: 16.0%; FeTi: 84% | 4.1006 | 1.0048 |
| 1.5:1 | 40.02 | 36.66 | FeTi4: 18.7%; FeTi: 44.3%; TiO: 37% | 7.4289 | 1.1794 |
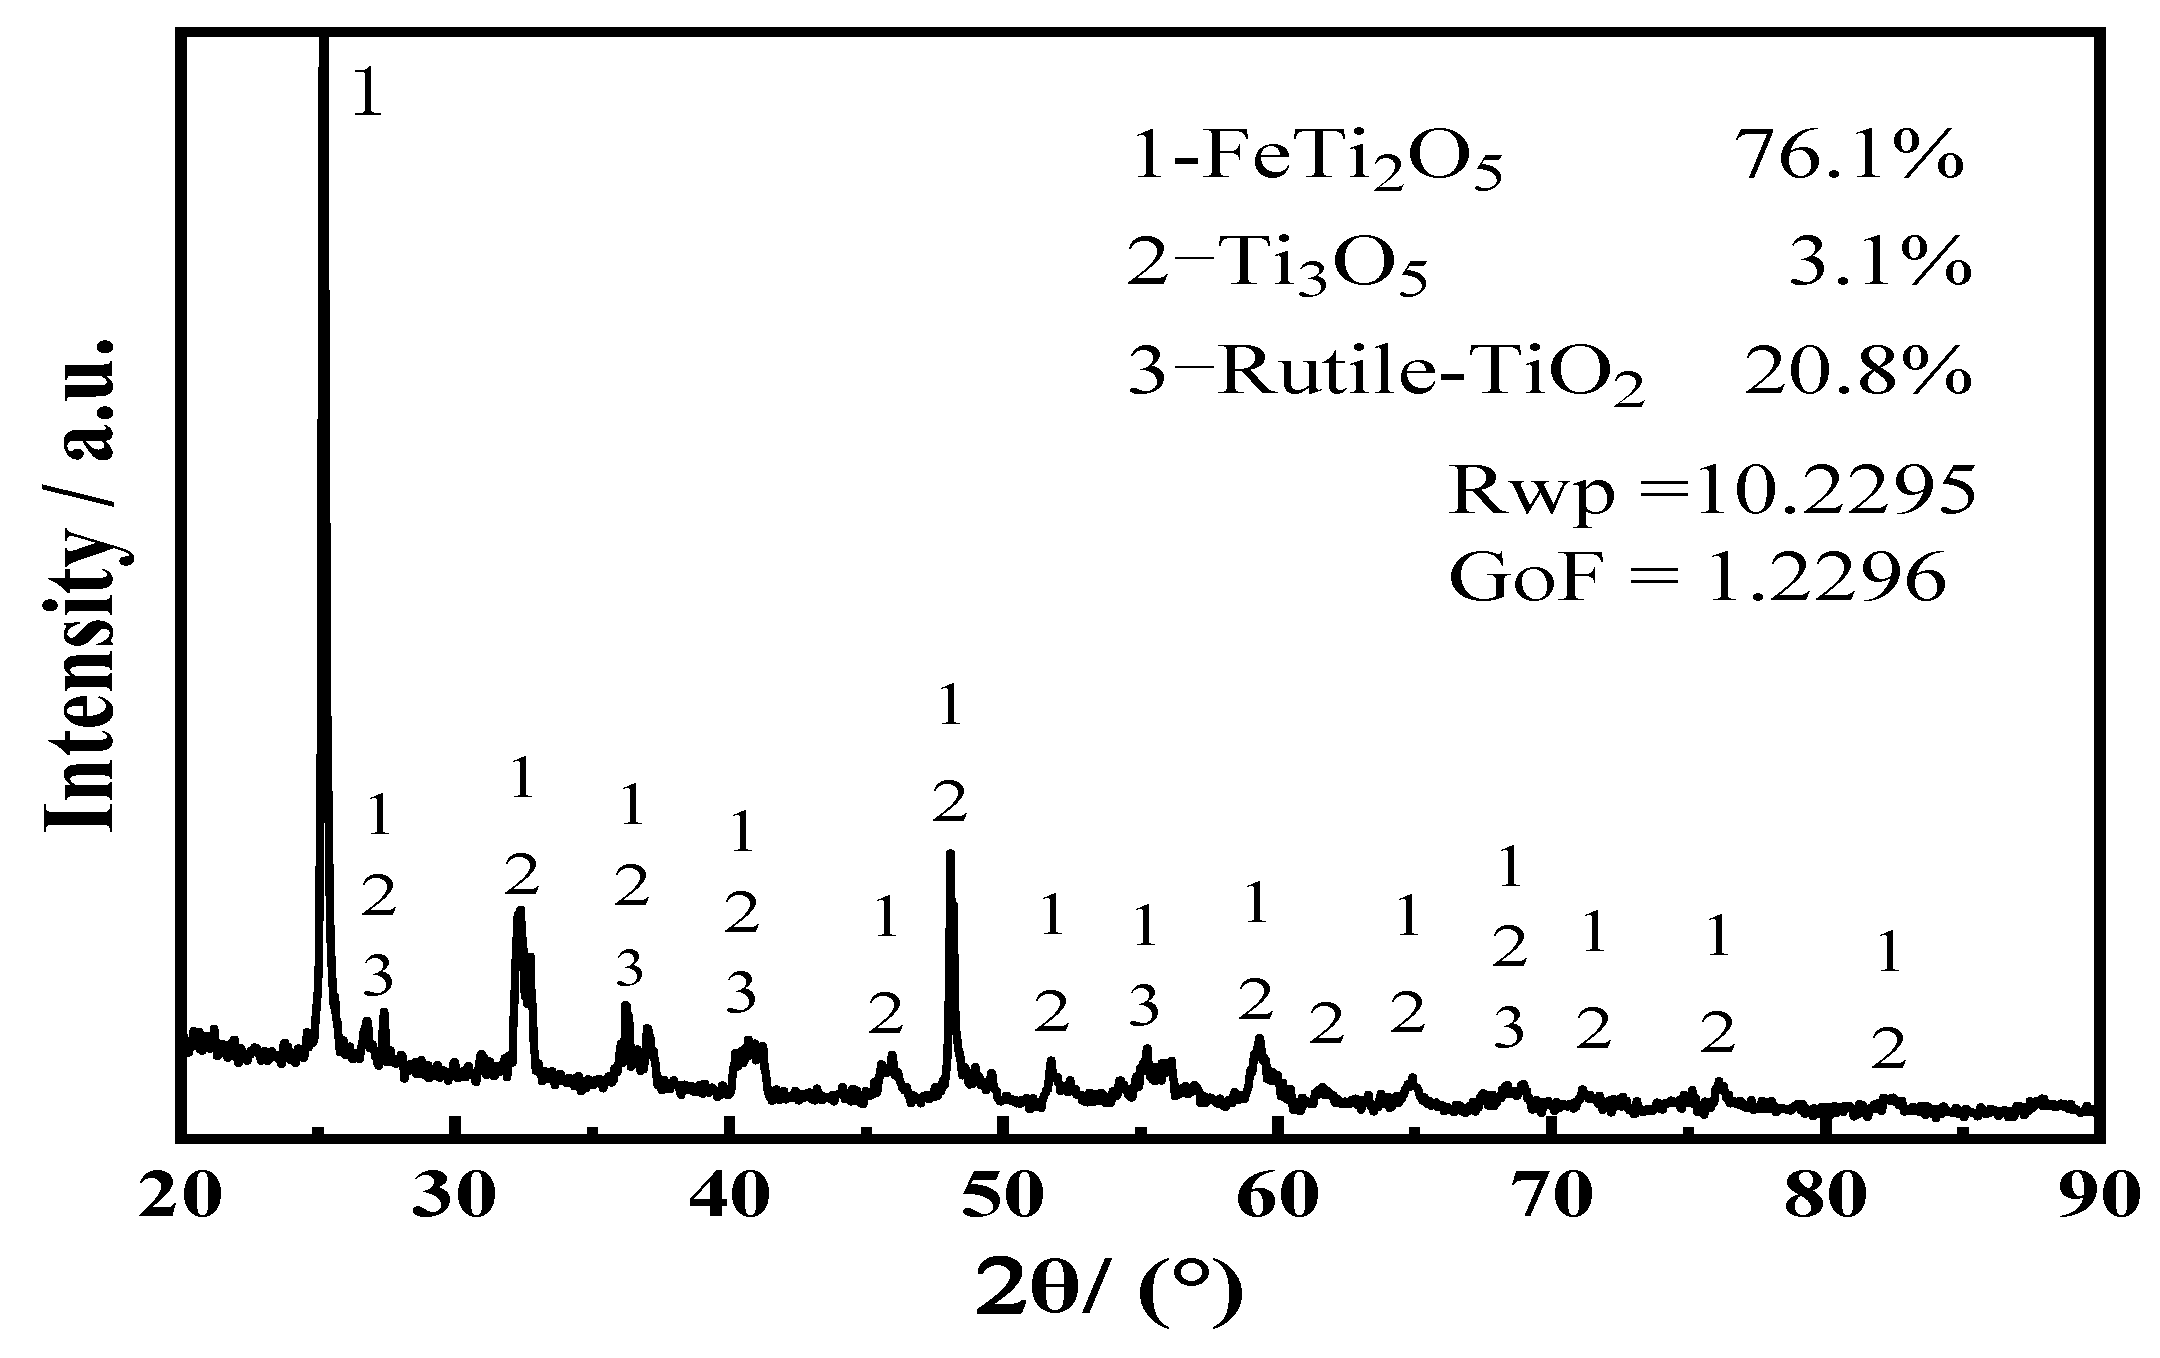
| 2:1 | 40.72 | 18.01 | FeTi4: 76.1%; FeTi: 12%; TiO: 11.9% | 5.7525 | 1.0404 |
| Atomic Ratio (Ti:Fe) | Current Efficiency |
|---|---|
| 1:2 | 15.3243% |
| 1:1 | 17.2082% |
| 1.2:1 | 20.2135% |
| 1.5:1 | 18.5583% |
| 2:1 | 13.6615% |
Publisher’s Note: MDPI stays neutral with regard to jurisdictional claims in published maps and institutional affiliations. |
© 2020 by the authors. Licensee MDPI, Basel, Switzerland. This article is an open access article distributed under the terms and conditions of the Creative Commons Attribution (CC BY) license (http://creativecommons.org/licenses/by/4.0/).
Share and Cite
Wang, B.; Chen, C.-y.; Li, J.-q.; Wang, L.-z.; Lan, Y.-p.; Wang, S.-y. Production of Fe–Ti Alloys from Mixed Slag Containing Titanium and Fe2O3 via Direct Electrochemical Reduction in Molten Calcium Chloride. Metals 2020, 10, 1611. https://doi.org/10.3390/met10121611
Wang B, Chen C-y, Li J-q, Wang L-z, Lan Y-p, Wang S-y. Production of Fe–Ti Alloys from Mixed Slag Containing Titanium and Fe2O3 via Direct Electrochemical Reduction in Molten Calcium Chloride. Metals. 2020; 10(12):1611. https://doi.org/10.3390/met10121611
Chicago/Turabian StyleWang, Bo, Chao-yi Chen, Jun-qi Li, Lin-zhu Wang, Yuan-pei Lan, and Shi-yu Wang. 2020. "Production of Fe–Ti Alloys from Mixed Slag Containing Titanium and Fe2O3 via Direct Electrochemical Reduction in Molten Calcium Chloride" Metals 10, no. 12: 1611. https://doi.org/10.3390/met10121611
APA StyleWang, B., Chen, C.-y., Li, J.-q., Wang, L.-z., Lan, Y.-p., & Wang, S.-y. (2020). Production of Fe–Ti Alloys from Mixed Slag Containing Titanium and Fe2O3 via Direct Electrochemical Reduction in Molten Calcium Chloride. Metals, 10(12), 1611. https://doi.org/10.3390/met10121611