Article

Recovery of Chromium from Slags Leachates by Electrocoagulation and Solid Product Characterization

1
Faculty of Materials, Metallurgy and Recycling, Technical University of Kosice, Letna 9, 042 00 Kosice, Slovakia
2
FEhS–Institut fürBaustoff-Forschung e. V., 47229 Duisburg, Germany
3
Institute of Materials Research, Slovak Academy of Sciences, Watsonova 47, 040 01 Kosice, Slovakia
4
Institute of Experimental Physics, Slovak Academy of Sciences, Watsonova 45, 040 01 Kosice, Slovakia
5
Faculty of Nuclear Sciences and Physical Engineering, Czech Technical University in Prague, V Holesovickach 2, 180 00 Prague, Czech Republic
6
Institute of Geotechnics, Slovak Academy of Sciences, Watsonova 45, 040 01 Kosice, Slovakia
*
Author to whom correspondence should be addressed.
Metals 2020, 10(12), 1593; https://doi.org/10.3390/met10121593
Submission received: 16 October 2020 / Revised: 25 November 2020 / Accepted: 26 November 2020 / Published: 27 November 2020
(This article belongs to the Section Extractive Metallurgy)

Abstract

:
Slags produced in the steelmaking industry could be a source of chromium. Slags contain, depending on different types of slags, between 2 to 5 wt.% of Cr. Roasting of slag with NaOH, followed by subsequent leaching can produce leachates which can be efficiently processed using electrocoagulation (EC). This paper provides results from the EC process optimization for Cr(VI) solutions with initial concentration 1000 mg/L of Cr(VI). Influence of pH, current intensity and NaCl concentration on the efficiency of chromium recovery, energy consumption as well as solid product composition is discussed in detail. Optimum of pH = 6 was chosen for EC processing of Cr leachates as well as current intensities of 0.1–0.5 A because of the higher Cr/Fe ratio in solid product compared to higher current intensities. Results of EC processing of four real leachates of electric arc furnace carbon steel slag (EAFC), electric arc furnace stainless steel slag (EAFS), low carbon ferrochrome slag (LC FeCr) and high carbon ferrochrome slag (HC FeCr) were evaluated. Comparison of the results of four real leachate samples is presented. Obtained final solid product was identified as (Fe0.6 Cr0.4)2O3 and with up to 20% of Cr could be used as source of chromium in the ferrochrome production.

Graphical Abstract

1. Introduction

Chromium is an important element in the steelmaking industry, whether it is a production of steel, stainless steel or ferrochrome. During these processes, several by-products, such as slags, dusts, mill-scales and sludges are produced. It is 200 kg (in the scrap-based steelmaking) and 400 kg (in the iron ore-based steelmaking) per one ton of produced steel. According to the type of steel or ferrochrome, there are different levels of content of chromium present. The industry is working proactively to produce slag that can be used in different applications [1] by making sure the chromium found in the slag is in stable spinel compounds which have very low solubility [2]. Depending on the type of slag and its quality, the leachability characteristics may lead to it being classified as waste, based on local regulations, which restricts its use [3]. Chromium can exist in unstable phases, such as dicalcium silicate (Ca2SiO4,), merwinite (Ca3MgSi2O8), melilite (Ca2Mg2SiO7), gehlenite (Ca2Al2SiO7) and periclase (MgO). Cr(II) and Cr(III) can be released after phase decomposition, followed by oxidation to Cr(VI) [4]. While Cr(III) is an essential trace element, the Cr(VI) compounds are very toxic (100–1000 times more toxic than Cr(III)) and highly leachable.
In terms of metal recovery, slag is a source of Cr, V, Mn or Mo, obtainable by applying appropriate extensive treatment to the slag to liberate part of these elements in oxide form which can be recovered by electrocoagulation (EC).
Electrocoagulation is a simple electrochemical method exploiting in situ production of coagulant agent (metallic cations) by electrodissolution of soluble anodes, usually made of iron or aluminum. Production of H2 typically occurs at the cathode. Electrocoagulation has been successfully used to treat different industrial wastewaters such as: textile wastewater [5], chemical mechanical polishing wastewater [6], sanitary landfill leachates [7], waste metal cutting fluids [8], paper mill wastewater [9], pesticide [10] and phosphate and nitrogen removal [11]. Research in the last few decades have proved that EC is an effective technology for treatment of industrial wastewaters for the recovery of different metal ions, such as Cr(III), Cr(VI), Ni(II), Cu(II), As(V), Al(III), Zn(II), Ag(I) [12,13,14,15,16,17,18,19] with efficiencies of 90–100%, depending on the specific conditions of the experiment. Many papers have focused on the removal of Cr(VI) and Cr(III) from different types of models or real wastewaters by applying electrocoagulation or another electrochemical methods [16,20,21,22,23]. In order to optimize the EC removal efficiency of Cr(VI), different parameters such as initial Cr(VI) concentration, temperature, pH, current density as well as the influence of different supporting electrolytes (NaCl, Na2SO4 and NaNO3) have been systematically investigated [12,13,24]. According to E-pH diagram, the pH plays a significantly important role for Cr(VI) treatment due to the highly pH-dependent speciation and solubility of reaction products [25]. Jin et al. [25] described the Cr(VI) removal efficiency of nearly 99% in the range of pH between 5 and 8. In contrast, pH higher than 8 significantly decreased the removal efficiency of Cr(VI). This resulted from the reduction of Cr(VI) to Cr(III) as the solubility of formed hydroxides increased in alkaline solution. Approximately 50% Cr(III) remained dissolved in the solution at pH 4.5 [25]. Therefore, pH lower than 5 is not recommended. Results of Lakshmipathiraj et al. [24], showed that Cr(VI) concentration was reduced more efficiently in the presence of NaCl, while there was smaller removal in the presence of Na2SO4 or NaNO3. Passivation of the electrodes and subsequent disabling of the anode dissolution plays a key role in the EC process. However, this passivation could be limited, and the dissolution of iron was promoted by the presence of chloride ion [26].
Vasudevan et al. [27], investigated the effect of anode materials (Al-Zn-In alloy material and Fe) towards the Cr(VI) electrocoagulation, and found the removal efficiency in the case of Al anode was lower than with mild steel. Barrera-Diaz et al. [28] compared the effect of different cathodic materials, such as Al, stainless steel and copper. The conclusion was that the copper is the best one due to its higher electrocatalytic activity towards the direct reduction of Cr(VI). Many combinations of anode and cathode materials were tested, including aluminum, steel, stainless steel, copper and carbon. The combination of steel–steel as cathode and anode forms an inexpensive and highly effective pair of materials.
Arroyo et al. [12] described the mechanisms and reactions involved in the electrocoagulation of Cr(VI) as follows:
  • Formation of coagulants by electrolytic oxidation of the anode.
  • Destabilization of the contaminants, particulate suspension and breaking of emulsions.
  • Aggregation of the destabilized phases to form flocks.
If iron is employed as an anode material, its electrochemical oxidation generates Fe2+ ions which can directly reduce Cr(VI) to Cr(III). Depending on the solution pH, the generated Fe3+ ions will immediately undergo further spontaneous reactions to produce various monomeric and/or polymeric metal hydroxides complexes which remain in the aqueous stream and which can remove the pollutants from wastewater either by complexation or by electrostatic attraction, followed by coagulation. The increase of the solution pH due to hydroxyl ions which are produced at the cathode causes the coprecipitation of Cr(III) and Fe(III) as CrxFe1−x(OH)3 between pH 2 and 6, acting synergistically to remove the pollutants from water. At a higher pH, Cr3+ ions can precipitate as Cr(OH)3. If the anode potential is sufficiently high, secondary reactions may occur at the anode surface, such as the oxidation of H2O and Cl ion [12].
The present paper provides results of the EC process optimization for Cr(VI) solutions with initial concentration of Cr(VI) of 1000 mg/L. The efficiency of chromium recovery, energy consumption as well as solid product composition is correlated with pH, current intensity and NaCl concentration. Results of EC processing of real leachates (chromium concentration from 687 to 2191 mg/L) of different slags are also presented.

2. Materials and Methods

2.1. Leachates Preparation

Electrocoagulation experiments with model solutions prepared from potassium dichromate were realized for concentration of 1000 mg/L of Cr as well as the real leachates of 4 different slag types: electric arc furnace carbon steel slag (EAFC) (2.33% of Cr), electric arc furnace stainless steel slag (EAFS) (0.82% of Cr), low carbon ferrochrome slag (LC FeCr) (1.10% of Cr) and high carbon ferrochrome slag (HC FeCr) (11.21% of Cr). EAFC, EAFS, HC FeCr slags had grain size <1 mm while LC FeCr slag had grain size of 2–4 mm (In further texts, these marks will be used for leachates of particular slags and solid products prepared by EC process). The grain size was chosen based on previous tests, which showed the maximum efficiency that can be reached. A total of 100 g of each slag was roasted with an addition of 20 g of NaOH at 1000 °C for 4 h. The energy for running the laboratory furnace was 70 kWh during 4 h, however 25 crucibles with 150 g of sample could fit in the furnace at the same time. In total, 2 consecutive leaching tests were conducted on each roasted slag sample. A total of 100 g of each slag was mixed with 500 mL of water, weighted and mixed overhead for 1 h, then the slag was allowed to settle down and water was separated from it. The sample was weighted, and additional water was added to reach the initial weight. The same procedure was repeated second time. The two obtained solutions were mixed and used in EC process. Chemical and mineralogical composition of slags was previously published by Horckmans et al. [29]. Table 1 lists parameters of tested real leachates including pH adjustment with NaCl amount crystalized and solution conductivity.

2.2. EC Process Conditions

A Laboratory Power Supply EA-PS 3032-10B (ELEKTRO-AUTOMATIK), max output 10 A and 32 V—DC source, shaft stirrer WISESTIR HT50DX (witeg Labortechnik GmbH, Wertheim, Germany) with rpm regulation and pH meter ORION 3 STAR (Thermo Fisher Scientific Inc., Waltham, MA, USA) were employed in experiments.
In total, 2 steel plates, ST37-2, with dimensions of 150 × 40 × 2 mm3 and active surface with dimensions 50 × 40 × 2 mm3 were used as electrodes.
Influence of NaCl concentration on EC of chromium was verified for 6 concentrations: 1000, 2000, 3000, 10,000, 30,000 and 50,000 mg/L of NaCl.
Influence of pH on EC of chromium was verified for 3 values: 4.5, 6 and 8. For adjustment of pH at the beginning of experiment and regulation for the entire duration of the experiment, solution of 1:1 hydrochloric acid was used.
Current intensities of 0.1, 0.5, 1 and 2 A were tested in EC process.
Volume of solutions and rotations of shaft stirrer were constant for each experiment, 350 mL and 250 rpm, respectively.
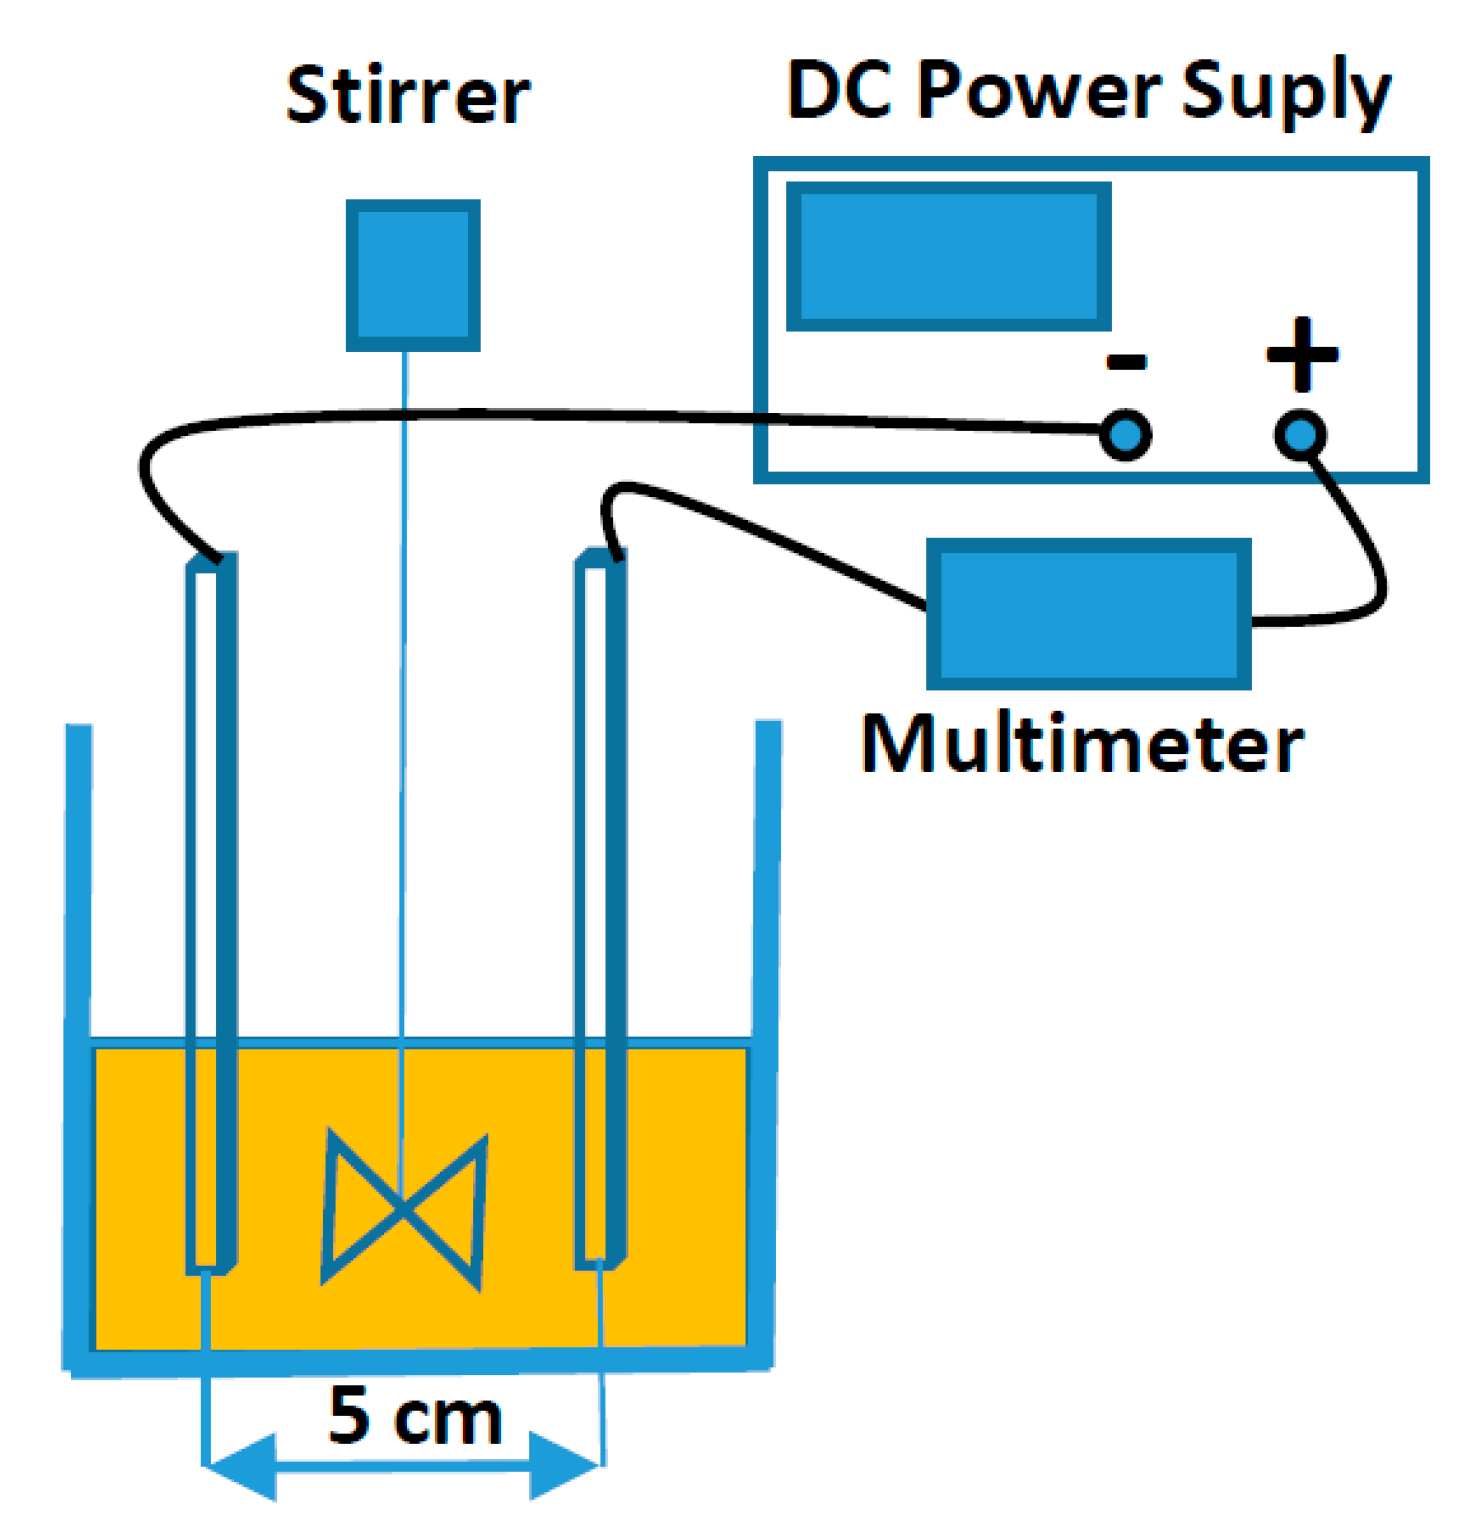
EC experiments with model solution lasted for 120 min and samples of 6 mL were taken to determine the Cr concentration at the following intervals: 0, 5, 10, 15, 20, 30, 40, 50, 60, 80, 100, 120 min. After optimization, for real leachate samples, different sampling intervals were chosen because a longer time was needed to recover all of the Cr from solution (up to 8 h depending on the Cr concentration in leachate). Samples were filtered and the filtrates were analyzed for Cr concentration by atomic absorption spectrometry (VARIAN 20+) (in all tables, graphs and calculations, concentration of 0 mg/L means it was under LOQ of AAS). AAS was also used for Cr and Fe analysis in the solid product (after decomposition). Experimental setup of EC experiment is shown in Figure 1.

2.3. Methods Used for Solid Product Characterization

Solid product characterization was also realized by TG analysis, XRF, EDX, XRD analysis and Mössbauer spectroscopy. Derivatograph C, MOM, was used for TGA measurements of direct EC process product weight change under heating conditions. Thermal gradient of sample heating was 10 °C/min. XRF analysis was realized before and after thermal treatment of samples (850 °C for 2 h) by portable XRF analyzer THERMO NITON XL3 GOLD (Thermo Fisher Scientific Inc., Waltham, MA, USA), in the ore mode, based on the oxidic character of samples. XRD measurements were realized by RIGAK ULTIMA IV type II (Rigaku Corporation, Tokyo, Japan) with a Cu lamp. Diffraction pattern was refined by Rietveld method using MAUD software (University of Trento, Trento, Italy) [30] with focusing to determine the lattice parameter of the powder. Scanning electron microscope (SEM), TESCAN MIRA 3 FE (TESCAN ORSAY HOLDING, a.s., Brno, Czech Republic), with microanalytical EDX equipment, OXFORD INSTRUMENTS (Oxford Instruments plc, Abingdon, UK), was used for characterization. Mössbauer spectra were recorded in transmission geometry using constant acceleration spectrometer with a 57Co/Rh source. Spectra were recorded at room temperature (RT) and at 4.2 K using a liquid helium bath cryostat. All the resulting isomer shifts were quoted relative to the spectrum of 12.5 μm thin bcc-Fe foil recorded at RT. The spectral parameters comprising of the isomer shift (IS), quadrupole splitting/quadrupole shift (QS), hyperfine magnetic field (B), line width (Γ), and area (A) of spectral components were refined by the CONFIT curve-fitting program [31].

3. Results and Discussion

3.1. Influence of pH

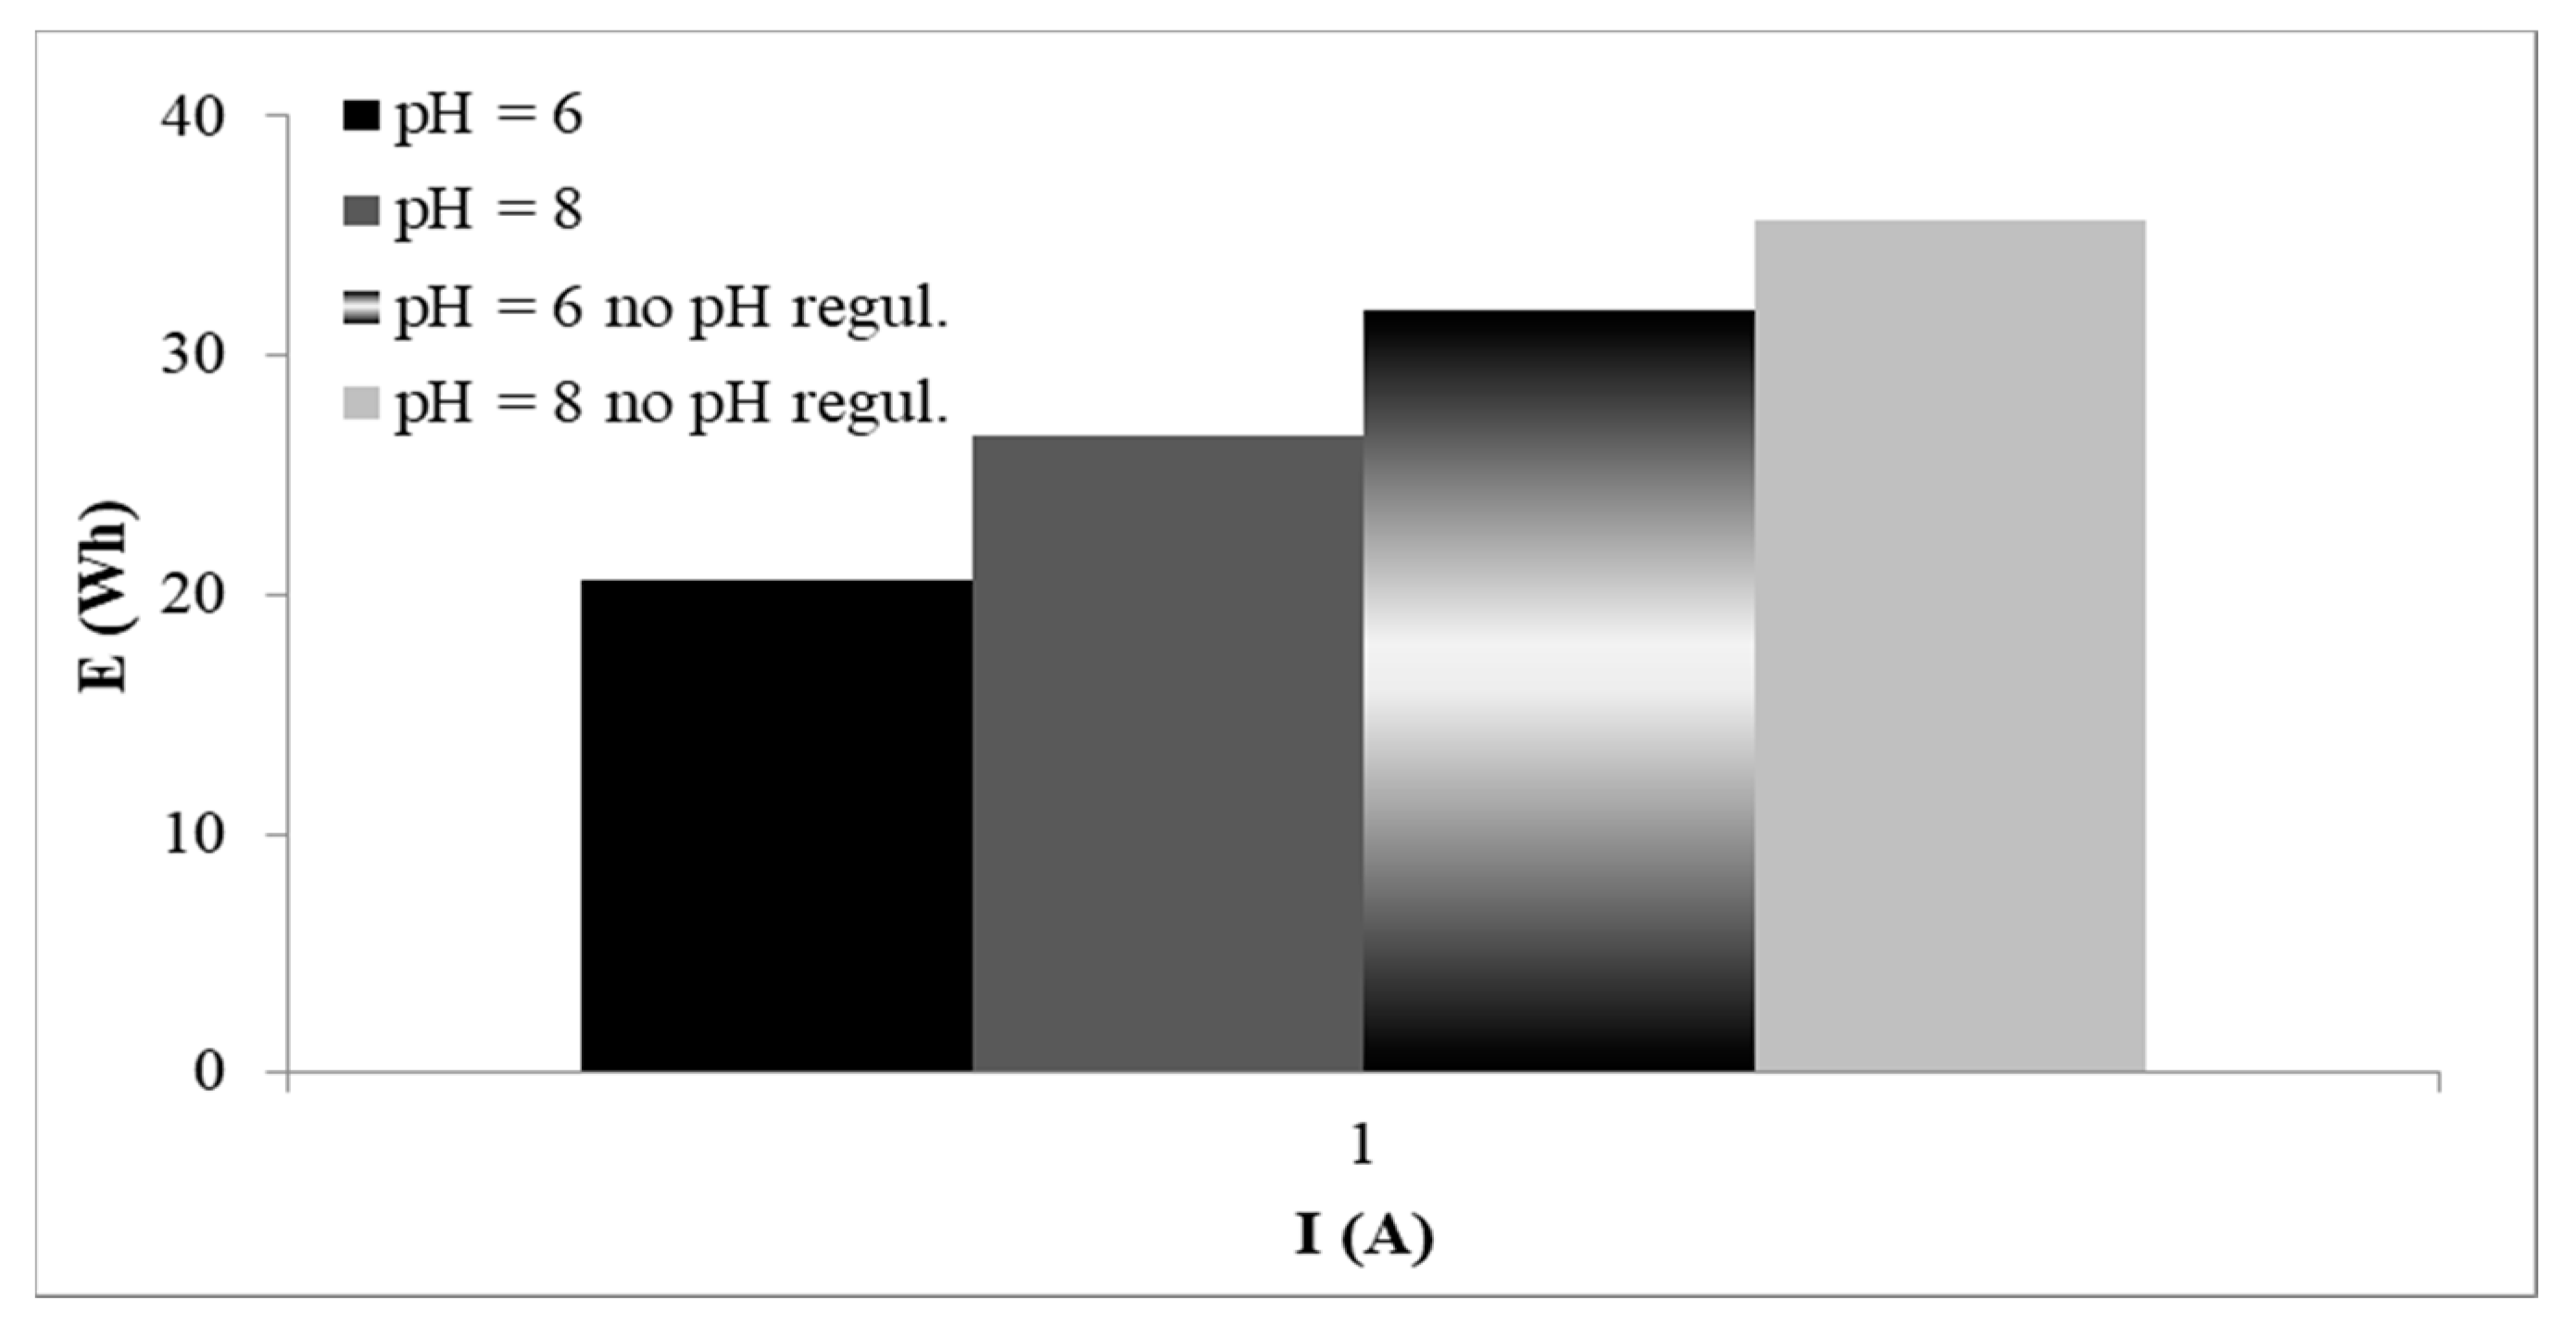
To determine the influence of pH on removal of chromium from solution, experiments with model solutions were realized and pH was kept constant, at a value of 4.5, 6 or 8, for the entire duration of the experiment. The results showed that for pH values higher or lower than 6, longer EC duration was necessary to achieve 100% efficiency of chromium removal. At pH 4.5 and 8, experiments ended (the concentration of Cr in solution reached 0 mg/L) approximately around 20 and 40 min later, respectively, than in the case of pH 6 (Figure 2). Experiments without pH regulation were also completed, where the pH was set at the beginning to be either 6 or 8 but not regulated by addition of HCl during the experiment. These experiments lasted about 20 min longer than when the pH was maintained at 6 or 8 through the whole experiment (higher energy consumption). pH value of 6 was chosen as optimal for this procedure, due to shorter duration to complete the precipitation of Cr which results in lower energy consumption.

3.2. Influence of Current Intensity

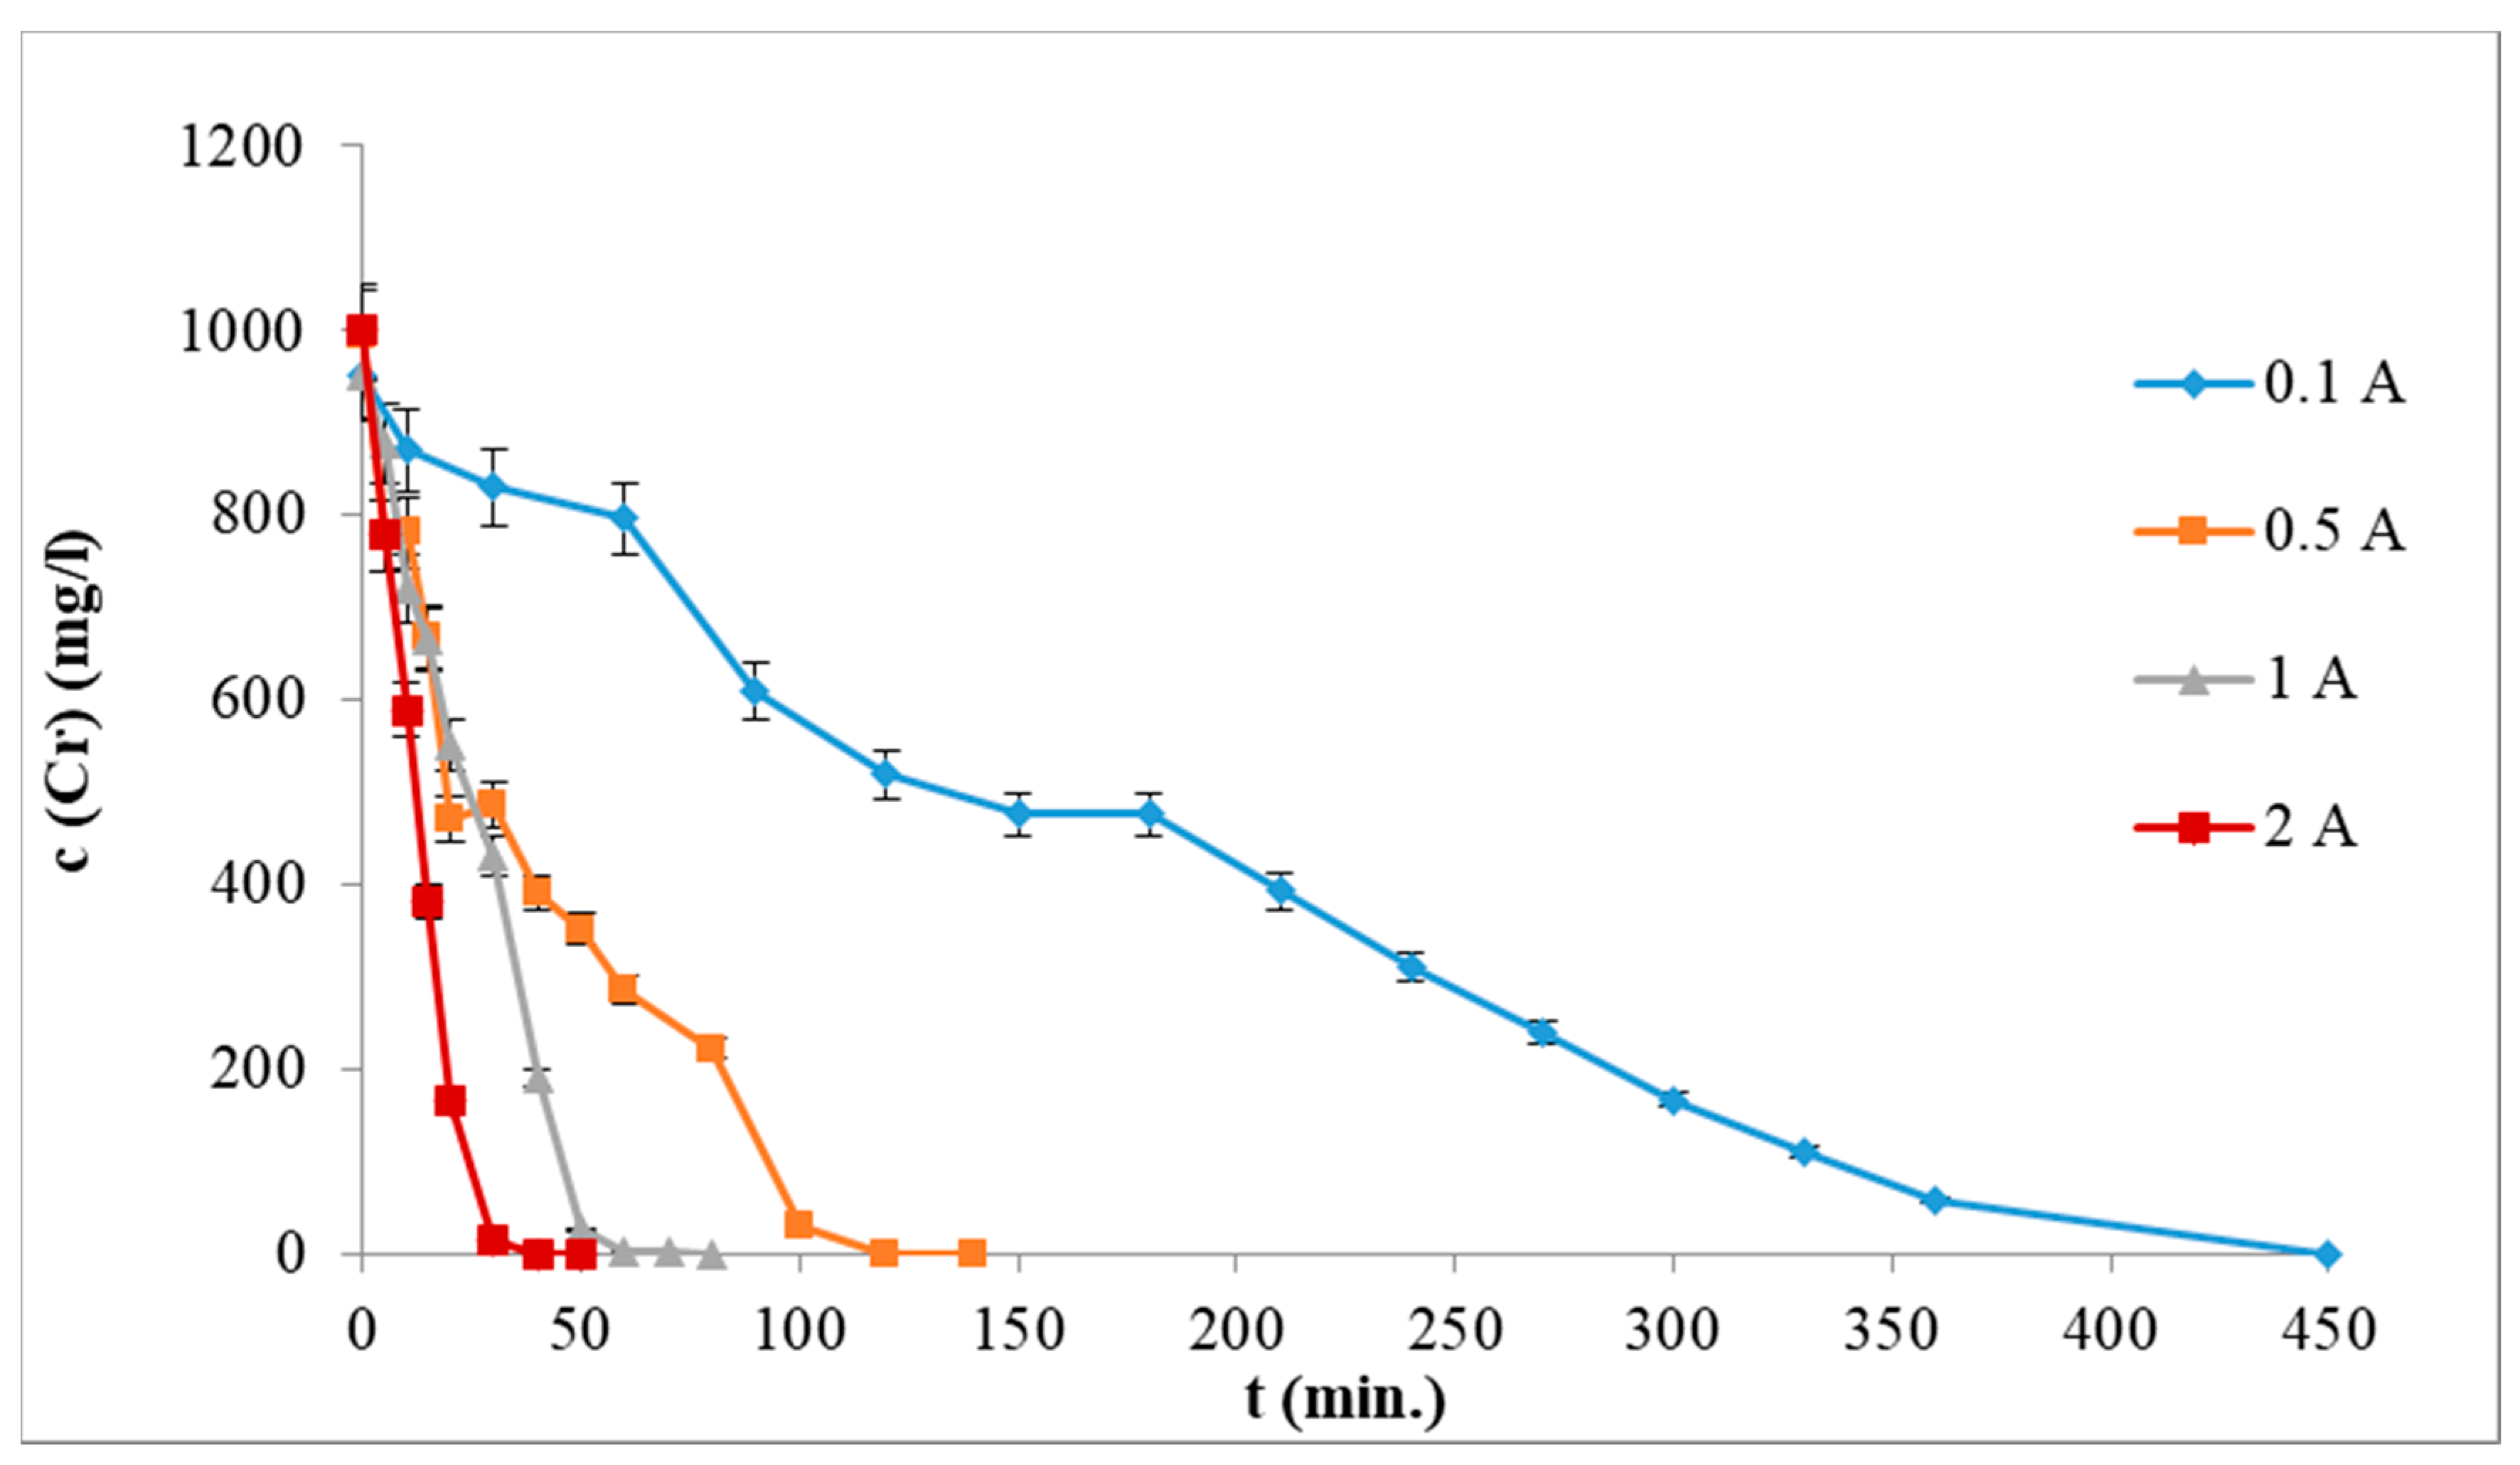
The concentration of chromium in solution is an important parameter for the EC process. It dictates the current intensity that is needed for its fast removal. Current intensity influence was studied for values of 0.1, 0.5, 1 and 2 A. Application of higher current intensities (1 or 2 A) led to shorter time of EC process necessary for the total Cr removal from solution. The time reduction was 80 and 50 min, respectively, instead of 120 min, but at the same time it led to the solution overheating up to 60 °C.
For lower current intensities 0.1 and 0.5 A only 67% and 97% chromium removal efficiencies were achieved in 120 min and working temperatures were in the range of 25–30 °C (Figure 3). A 100% efficiency of chromium removal was achieved for 0.5 A after 140 min and for 0.1 A after 430 min of the EC process.

3.3. Influence of NaCl

Dissolved sodium chloride plays many roles in the EC process [24] including:
  • prevention of electrode passivation,
  • anode corrosion agent, liberating Fe(II) ions into the solution,
  • ameliorating the conductivity of the solution.
The presence of sodium chloride is effective for successful Cr recovery, but very high NaCl concentrations could be counterproductive, as it would lead to a greater proportion of Fe in the solid product. The concentration of 1000, 2000 or 3000 mg/L of NaCl (conductivities of solutions were G = 4, 6 or 7.2 mS) were used in the experiments. In experiment without the presence of NaCl, no solid product was created for 2 h, and after the addition of NaCl (1000 mg/L), the chromium concentration rapidly declined (decrease of 37.5%) and solid product was formed within 40 min. Additionally, experiments with 10,000, 30,000 and 50,000 mg/L of NaCl (conductivity G = 18.2, 42 or 60 mS) were realized to investigate the effect of more typical NaCl concentration found in real leachates. As the results showed, concentration of NaCl (when the same conditions of pH and current intensity were applied) had no influence on the experiment duration but affected the proportion of Fe in the solid product, as well as the energy consumption during experiments. A higher NaCl concentration equals lower energy consumption (Figure 4).

3.4. Energy Consumption of EC Process

Energy consumption was calculated from the initial time until Cr concentration was zero in the solution for each experiment. For higher NaCl concentrations with higher solution conductivity, lower current intensities, resulting in lower energy consumption, could be applied (Figure 4). These results are in good agreement with the results of Khan et al. [17]. The pH of 6 appears to be the optimal working pH for these experiments. Other pH values (4.5 and 8) require higher energy consumption. Results in Figure 5 suggest the necessity of pH regulation for the entire duration of the experiment.
The following optimized parameters for the EC process have been derived from the experimental work with model solutions:
  • an optimized pH of 6,
  • optimized energy consumption and presence of iron in the product requires a moderate concentration of NaCl of around 3000 mg/L,
  • to maximize the Cr/Fe ratio, low current intensities (0.1–0.5 A) are needed (energy consumption is always lowered by decreasing the current intensity),
  • to remove all of Cr from solution in shorter time, high current intensities (2 A) must be employed.

3.5. Real Leachates

The influence of NaCl was studied with real leachate of EAFC sample. The sample had sufficient conductivity, but pH was over 12. When an experiment with this original solution was realized, no solid product was obtained. Therefore, it was necessary to adjust the pH to this optimized value of 6 before starting the EC process. Immediately after the pH was adjusted with addition of HCl (1:1), sodium chloride crystallization from solution was observed (identified by XRD analysis). The white crystals that appeared in the solution were filtered out. The conductivity was still sufficient and higher than for the model solutions with addition of NaCl. No addition of NaCl to real leachate was therefore needed. The efficiency of chromium recovery was 100% and the duration of the experiment was the same as with NaCl addition in model samples. For further experiments, the pH was adjusted with HCl (1:1), without NaCl addition and the current intensity was 0.1 A. Parameters of tested real leachates are in Table 1.
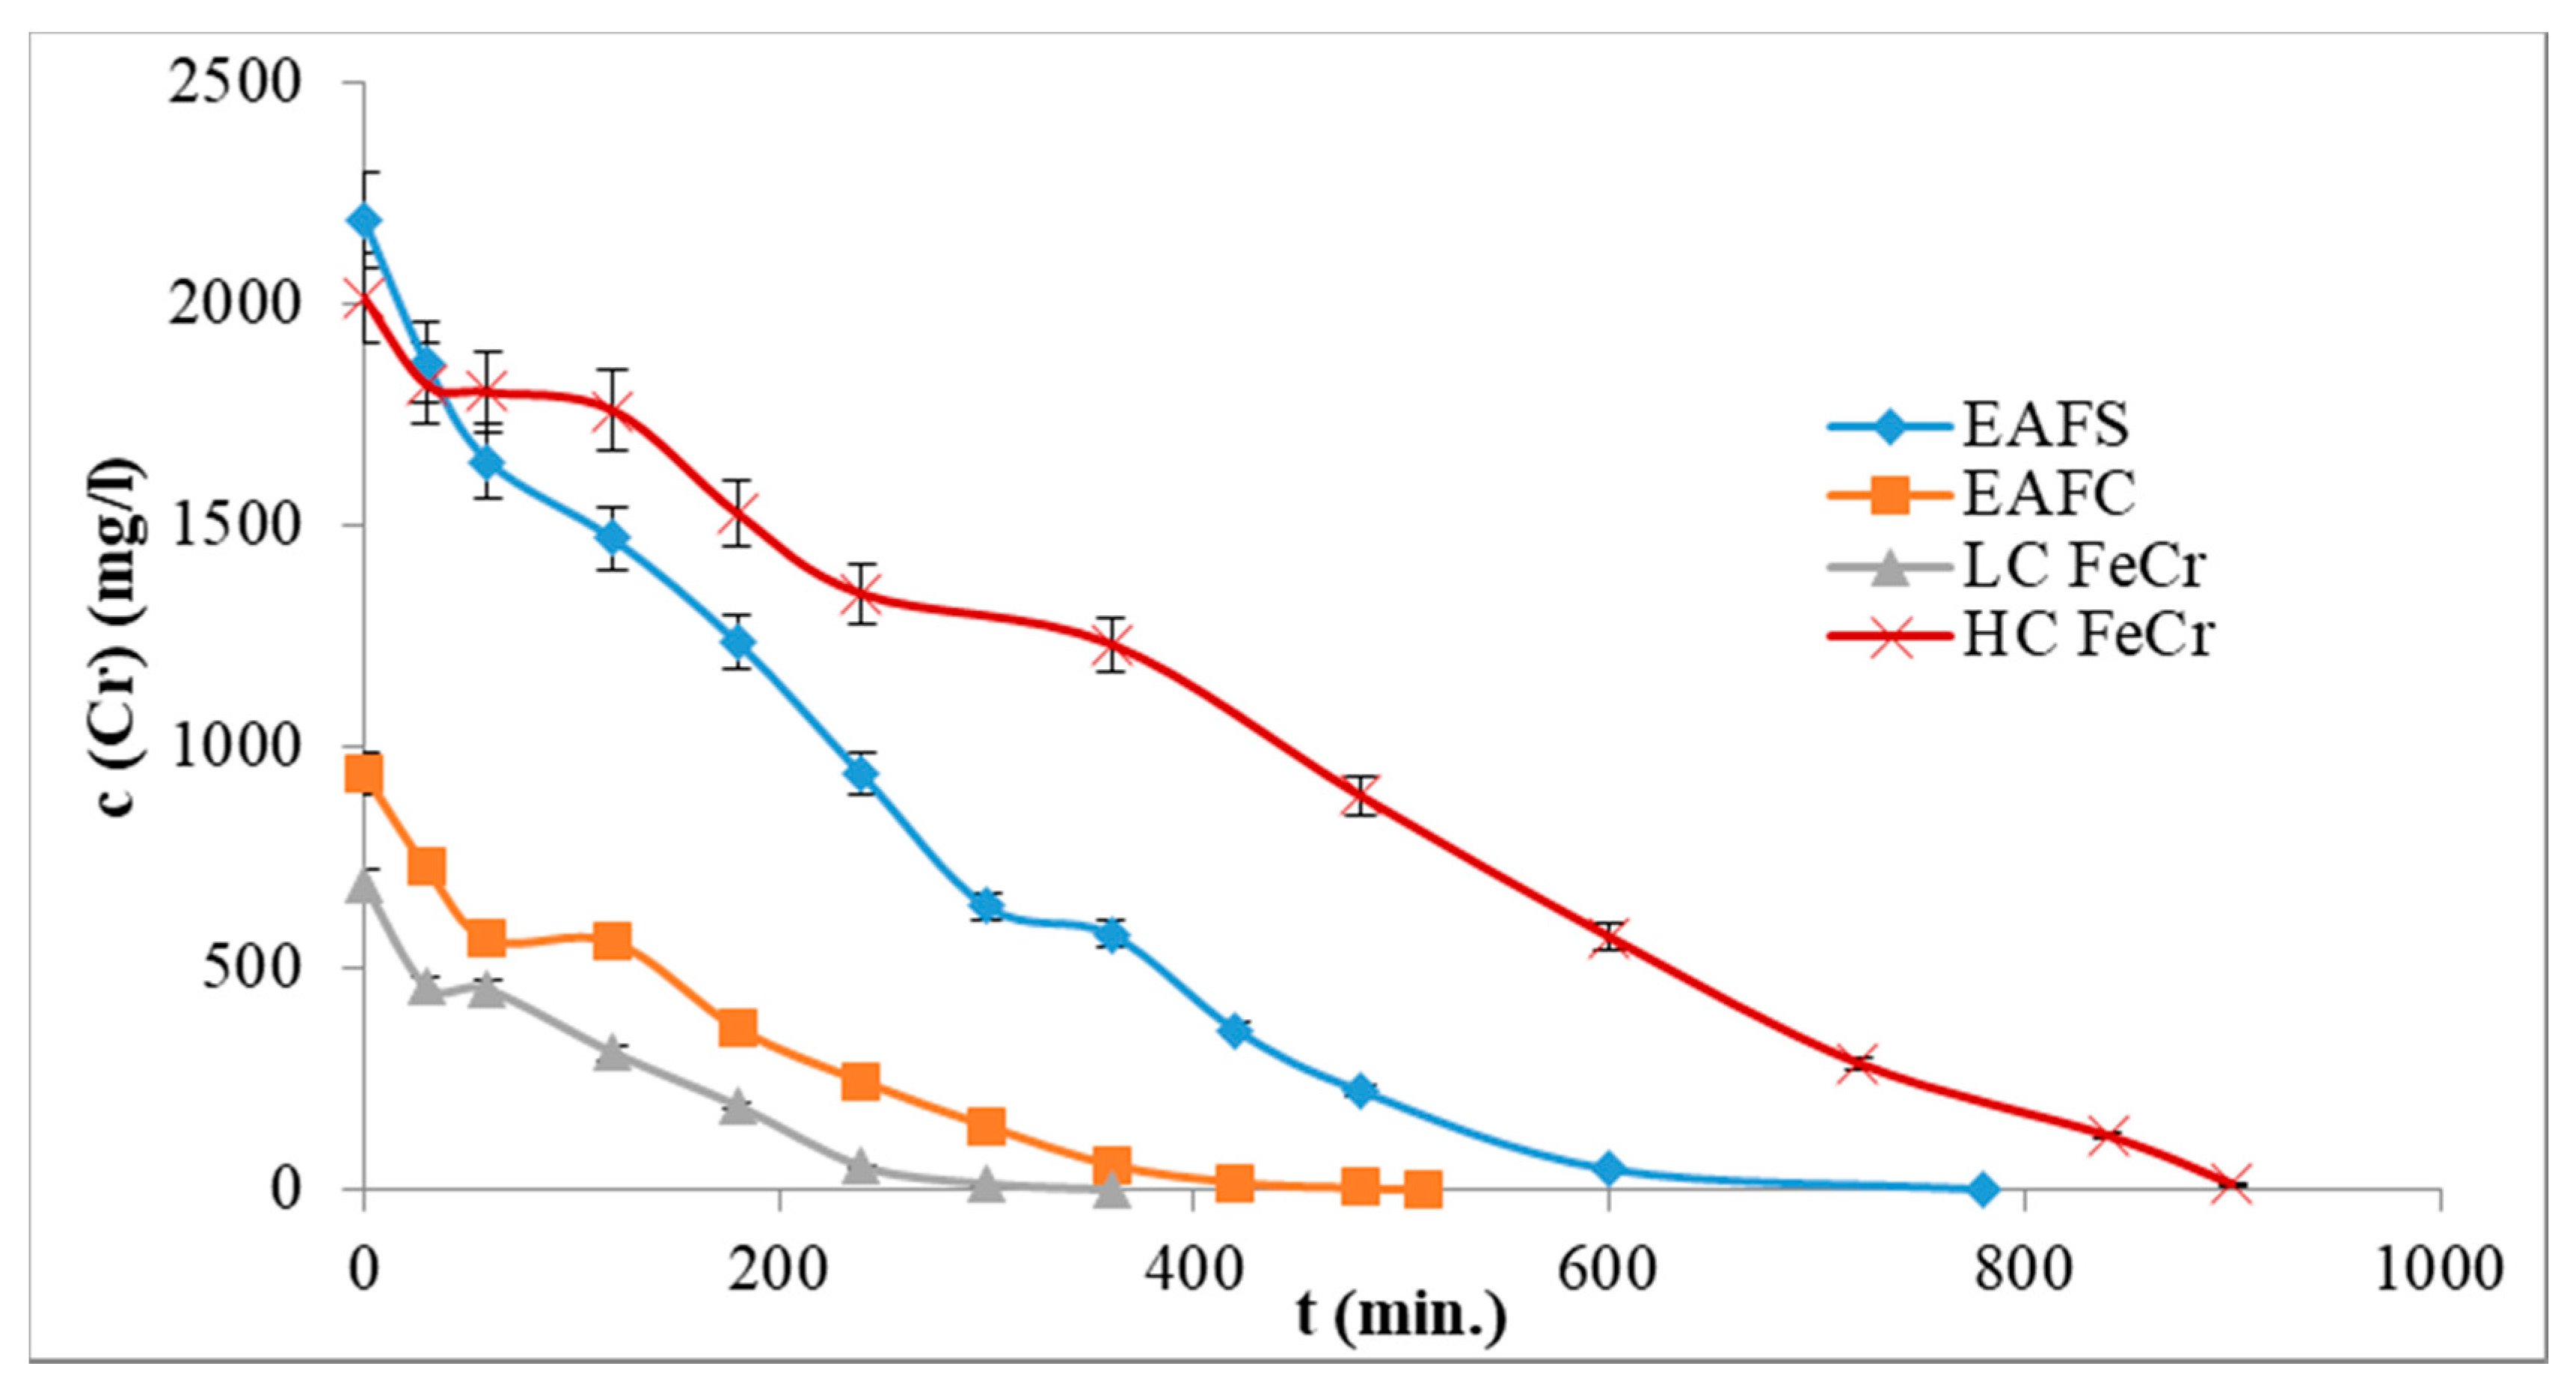
Chromium decrease from solution was time dependent (Figure 6). Duration of experiment was proportional to the initial Cr concentration (higher concentration, longer time), but not in all cases. HC FeCr had lower initial concentration of Cr, but complete removal of Cr took about 120 min longer than for EAFS. This was due to higher conductivity in HC FeCr sample, resulting in more frequent interactions of solution ions with Fe electrode, which lead to the production of Fe ions and subsequent coagulation of Cr from solution.

3.6. EC solid Product Characterisation

After EC process, solid product was filtered and dried at 90 °C to constant weight. AAS analysis of Fe and Cr was realized and results were used for Cr/Fe ratio calculation. Experimental conditions including pH, NaCl and current intensity exert an influence on the ratio of Cr/Fe in the solid product (Table 2). Low current intensities resulted in higher Cr/Fe ratio in the solid product as could be seen from the model solution with c (Cr) = 1000 mg/L, the Cr/Fe ratio increased from 0.1818 at 2 A to 0.3614 at 0.1 A. Concentration of NaCl in solution influenced the Cr/Fe ratio as well. Increasing of NaCl concentration from 3000 to 50,000 mg/L caused Cr/Fe ratio to decrease in value of 0.2922 to 0.1351. Energy consumption necessary for processing of 1 m3 of different solutions was also calculated and results are summarized in Table 2. Higher current intensities led to a faster decrease of Cr concentration in the solution, but at the same time a higher Fe amounts were present in the solid products.
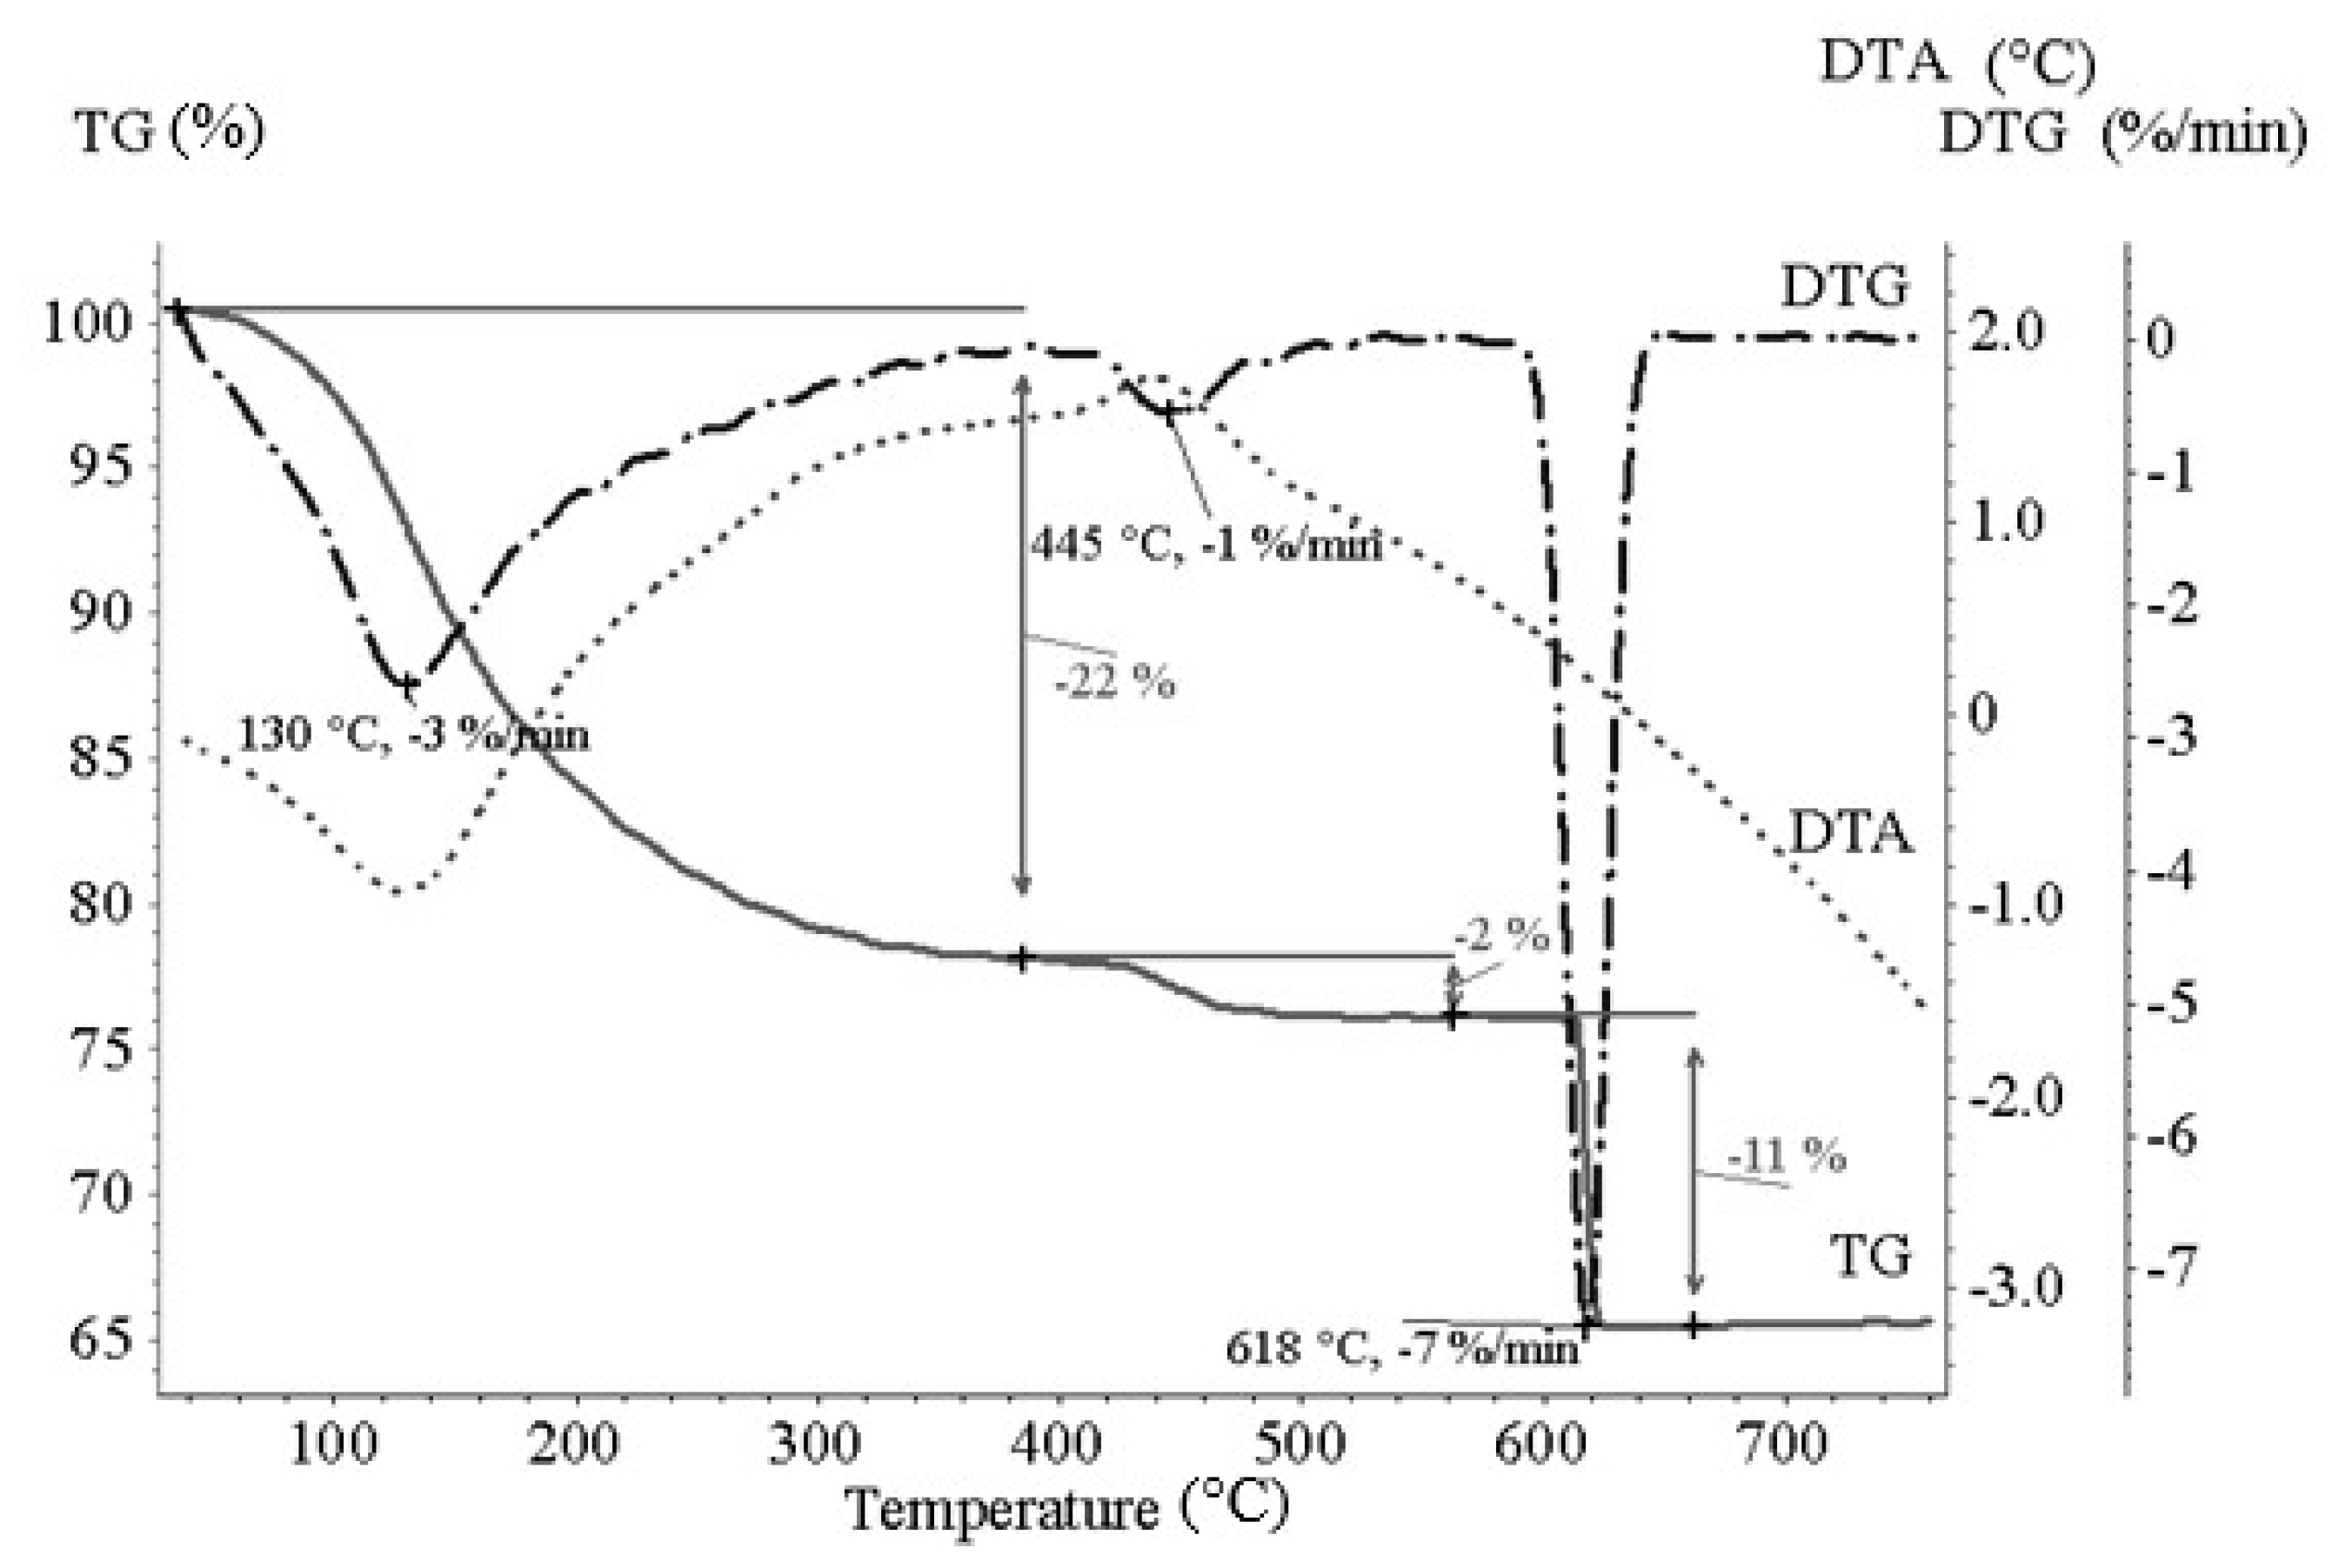
According to the literature, the final product of chromium electrocoagulation with Fe electrodes should be chromite (FeCr2O4,) or a mixture of FeCr2O4, Fe2O3, Cr2O3 and/or Cr and Fe hydroxides. Based on XRD analysis of the solid product, its amorphousness was evident, probably in the form of iron and chromium hydroxides. This amorphousness made it impossible to identify the composition in more detail. Therefore, thermogravimetric analysis was performed for identification of volatile substances and to find thermal conditions for further EC process product treatment to get nonamorphous product with signal at XRD. Thermogravimetric analysis (TGA) combined with XRF analysis before and after TGA measurement was performed to obtain more detailed information on the composition of the product and its behavior at elevated temperatures. The focus was on future heat treatment and subsequent XRD analysis to obtain information on the form of Cr in the solid product. TGA measurement showed the total change in mass loss which in TG analysis was approximately 34 wt.% (Figure 7). This decrease was recorded in several steps with different intensity and width of the interval. In the first step of weight loss there is a gradual loss of mass up to 400 °C with a maximum rate of 3%/min. at 130 °C. In this range, physisorbed water, low molecular weight volatile compounds, solvents and trapped gases could be evolved. The endothermic effect occurred up to approximately 180 °C. This phase corresponds to dehydration, where from about 200 °C either (a) low-volatile components producing an exothermic effect (C-H-O-N based components) can be released in the oxidizing atmosphere, or (b) the reaction of chlorine as a weak acid with K2O and Na2O oxides form chlorides or the oxychlorides of the alkali components, the products of which can subsequently be converted into a gaseous state under given temperature conditions. The binding and form of sulfur in the input samples is unclear. Reduced sulfur and chlorine contents after annealing are therefore a prerequisite for the reactions associated with their transition to the gas phase (Cl2, SOx). In the range of 400–460 °C, a decrease of about 2% of mass loss was observed with a maximum intensity at 445 °C. If the solid product of EC process was in the form of hydroxides (as was assumed), mass decrease of approx. 24% in the temperature range of 0–460 °C may represent water vapor production. Around 600–650 °C there was 11% final loss of mass representing the final phase of decomposition, which is probably related to the evaporation of the gas phase of chloride and sulfur components at the end of which is the non-amorphous product in the oxide phase. Above this temperature no weight loss was observed in TG analysis. Based on the results of TGA analysis, temperature of 850 °C was chosen for EC solid product treatment, after which XRD characterization was applied.
Table 3 shows the XRF analysis before and after sample thermal treatment at 850 °C for 2 h (energy consumption was 13 kWh). Changes in the element percentage, mainly Fe and Cr, were observed after samples thermal treatment. The XRF analysis assumes the oxidic character of the samples, which was taken into account in the element analysis in the “balance” item. From the input analysis proportions of iron, chromium, magnesium and sulfur can be confirmed, which however differs in individual samples. In the solid product there are also other elements P, Si, Al, Co, K, Ca, Ti, V and Mn each under 1 wt.% (these elements are also included in the Ʃ elem.)
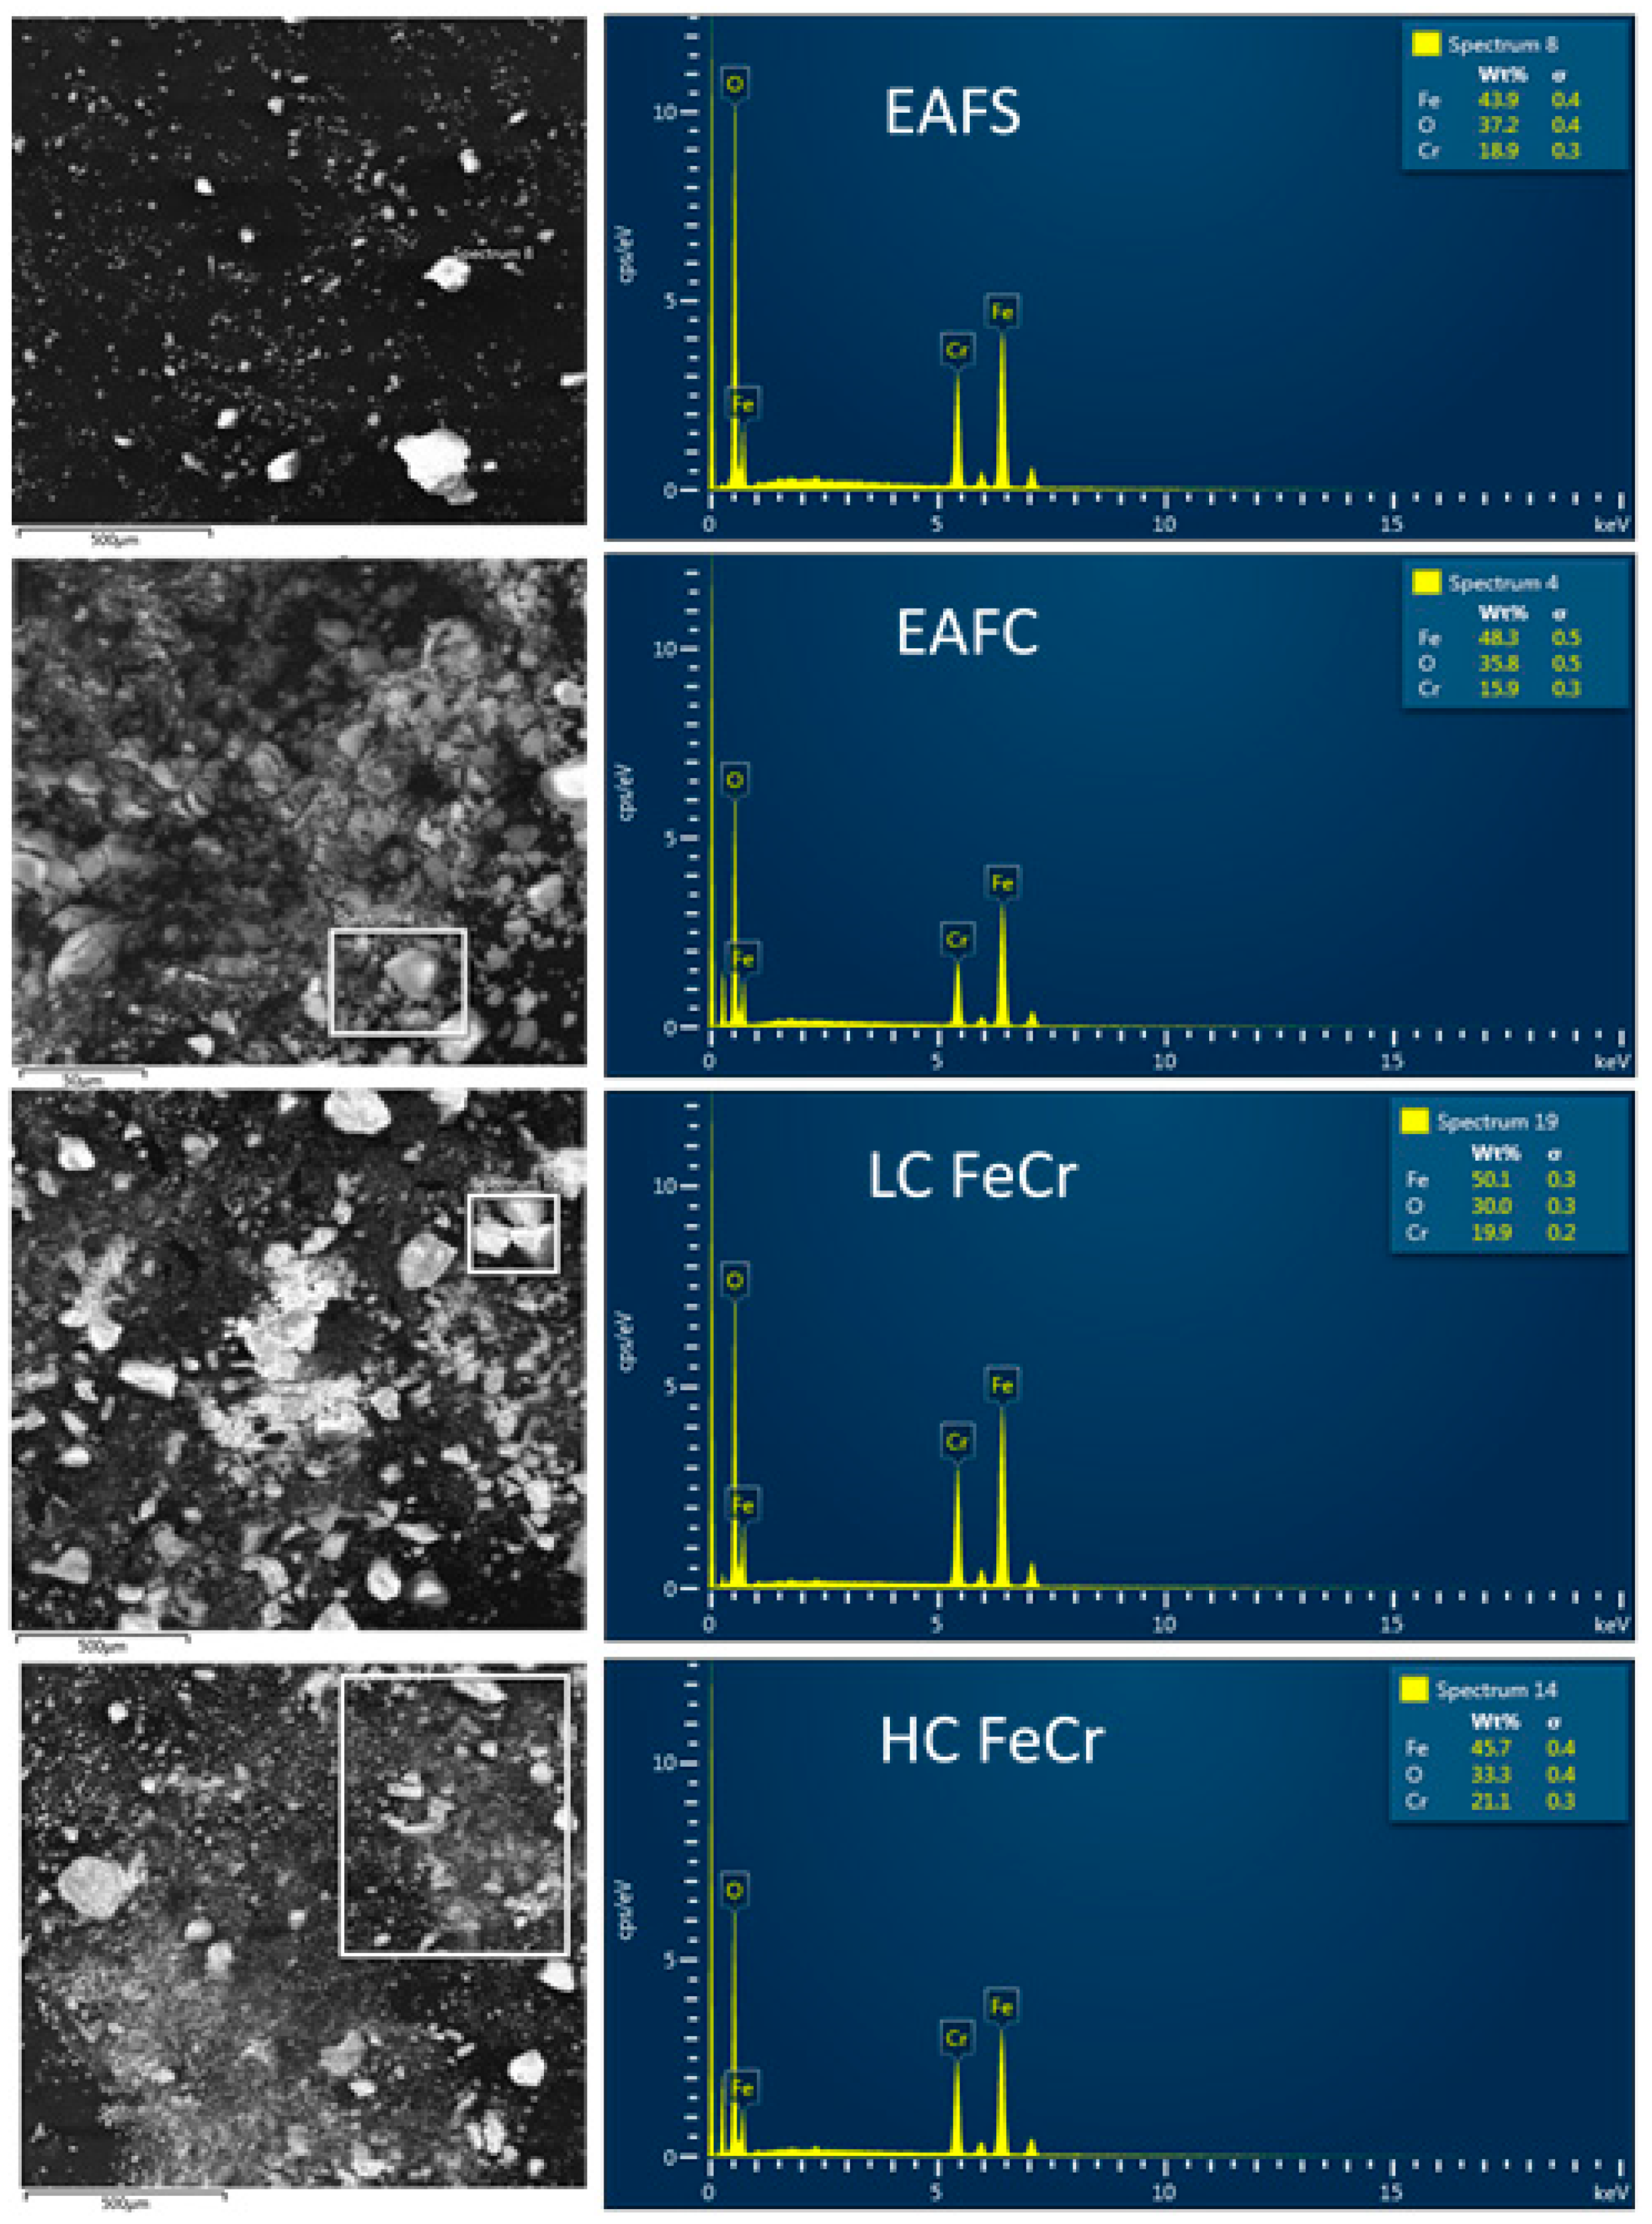
According to results from the TGA analysis, EC solid product samples were treated at 850 °C for 2 h to get oxidic form of the product suitable for XRD and SEM-EDX analysis. The aggregates formed during the thermal treatment were homogenized in a mortar. Aliquots of samples EAFS, EAFC, LC FeCr and HC FeCr were taken for SEM-EDX analysis for confirmation of the composition (Figure 8). The amount of Cr varied from 15.9% in EAFC to 21.1% in HC FeCr. Cr/Fe ratio calculated from SEM-EDX analysis was 0.4305 for EAFS, 0.3292 for EAFC, 0.3972 for LC FeCr and 0.4617 for HC FeCr. The SEM-EDX analysis confirmed the composition and amounts of Fe and Cr, which were in good agreement with those from XRF and AAS analysis (compared XRF (Table 3), AAS (Table 2) and SEM-EDX calculated Cr/Fe ratio).
XRD analysis was realized to obtain the information about phase of Cr and Fe in the solid product. In Figure 9 is the spectrum for EC solid product prepared from leachate of HC FeCr sample, which was the highest amount of Cr from all samples. Composition of chromite (FeCr2O4), which was expected as mentioned in the literature, corresponds to rhombohedral crystallographic system (space group no. 167) which is known for Fe2O3 or Cr2O3 phases. In the inset plot, the dependence of the lattice parameter a and c taken from the PDF2 database (namely: Cr2O3 no. 38-1479, Cr1.3Fe0.7O3 no.35-1112, (Fe0.6Cr0.4)2O3 no. 34-412 and Fe2O3 no. 33-664) on the Cr ration in (Fe,Cr)2O3 phase is shown. The determined lattice parameters from sample HC FeCr were entered into the graph and one could notice that the lattice parameter corresponds to the Cr fraction approximately 0.3 (the plotted fraction is 0.32).
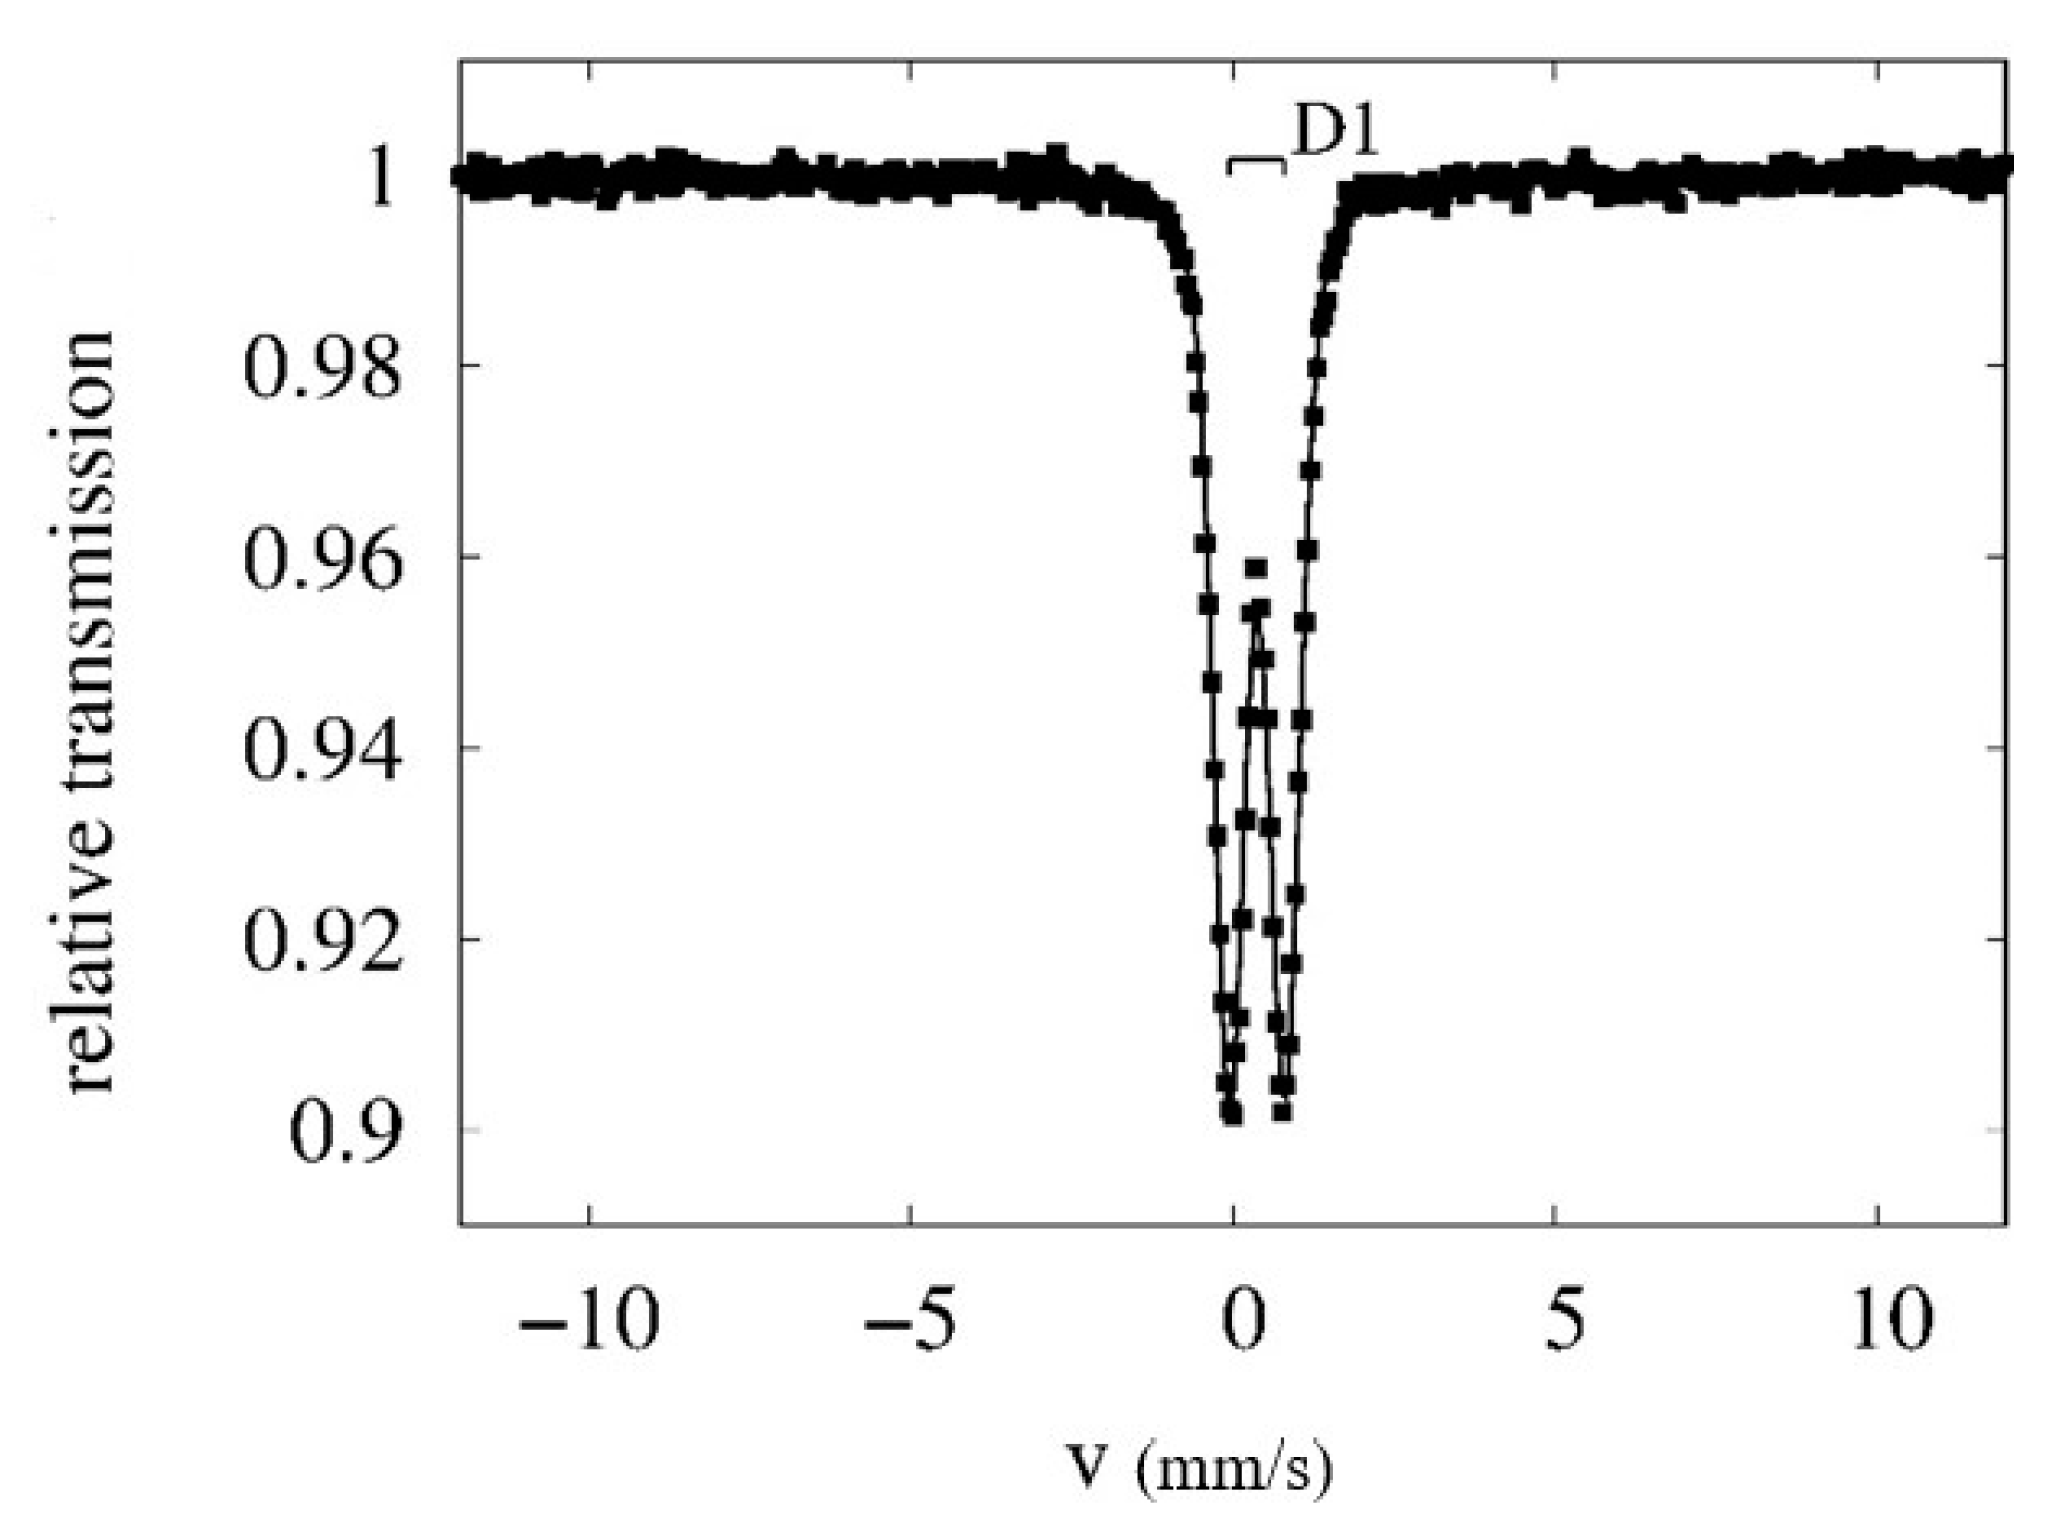
For confirmation of XRD results, Mössbauer spectroscopy was realized with the aim to characterize the phase composition of the solid product directly after EC process, as well as after its thermal treatment. Room temperature (RT) spectrum of the sample denoted as EAFS (before thermal treatment) is shown in Figure 10. Spectrum recorded at RT exhibits broadened superparamagnetic doublet. The doublet changes to the broadened magnetic six-line pattern at 4.2 K which is shown in Figure 11. Such a pattern is characteristic for structurally disordered or weakly ordered materials. This spectrum was fitted using distribution of hyperfine magnetic field. Hyperfine parameters are listed in Table 4. Measured data suggest possible presence of iron oxyhydroxide. Similar results were reported by [32,33].
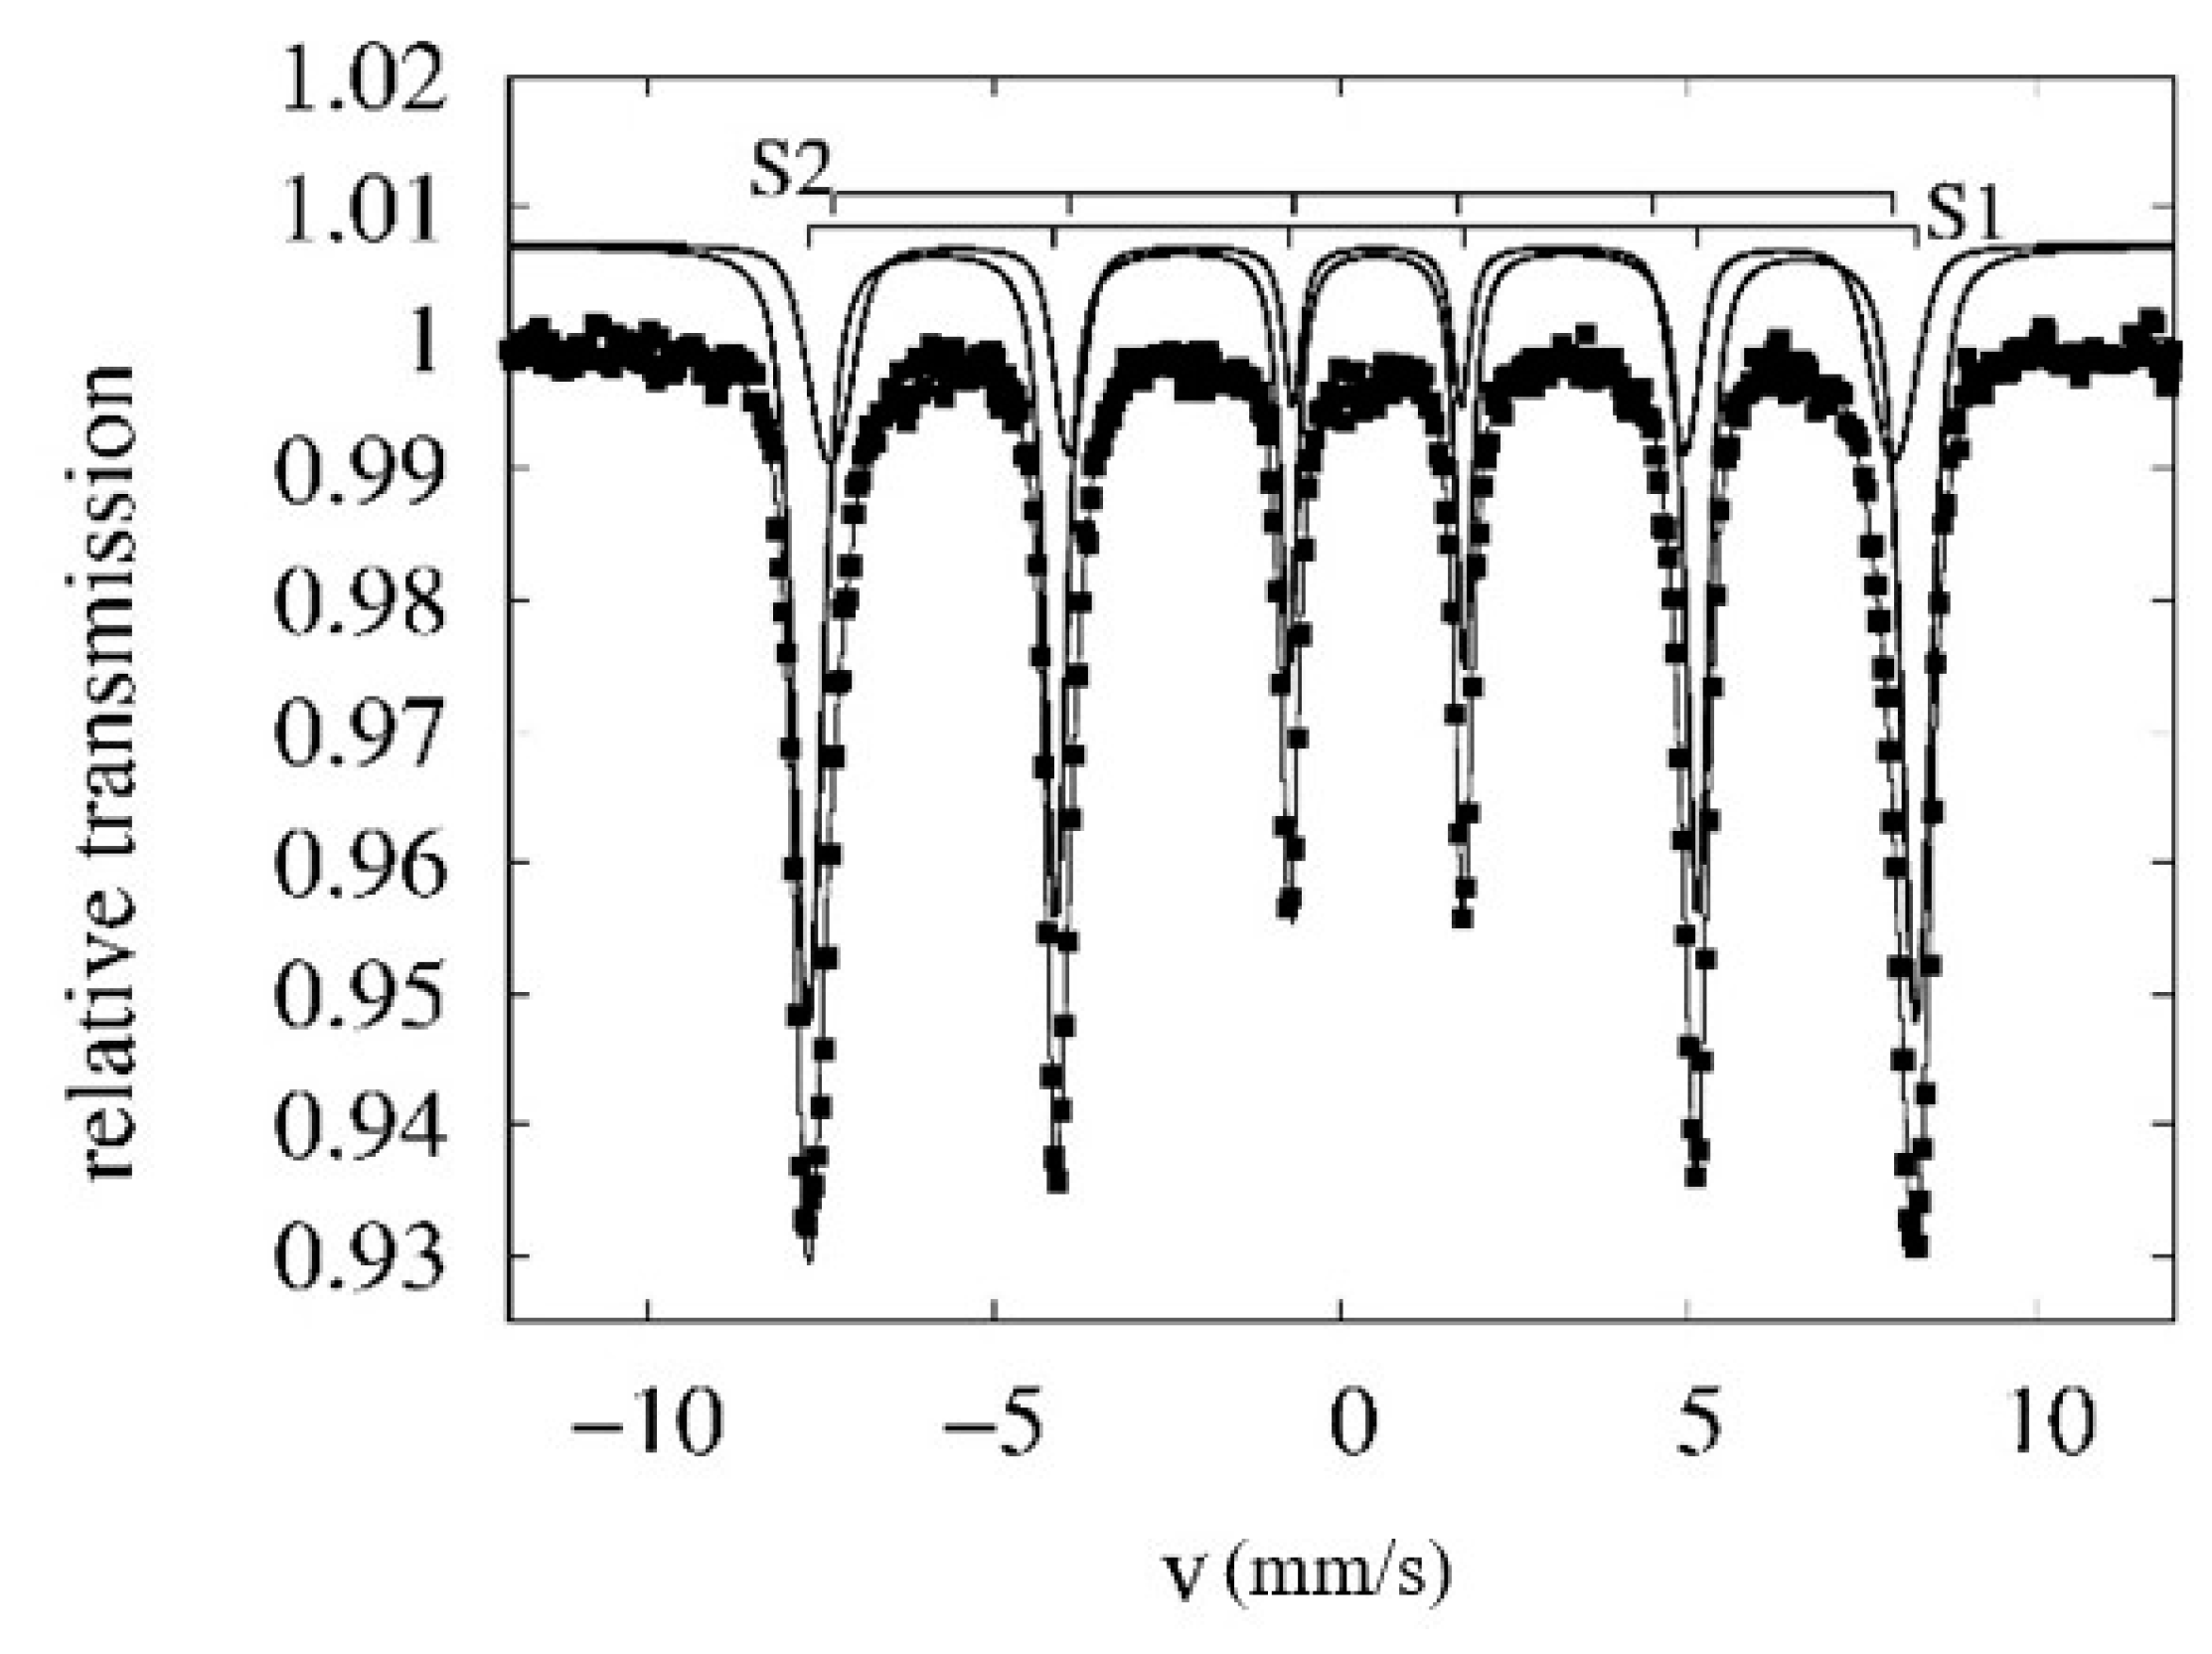
Annealed sample EAFS* (after thermal treatment) exhibits at RT measurement six-line pattern, which can be seen in Figure 12. Fitting model consists of two sextets denoted as S1 and S2. Hyperfine parameters of these spectral components are listed in Table 5. Sextet S1 exhibits very narrow distribution of hyperfine magnetic field. Values of isomer shift and quadrupole shift are very similar to parameters of hematite. However, the mean value of hyperfine magnetic field is significantly lower. As it was reported earlier by Bhattacharya et al. and Yogi et al., the substitution of iron by chromium in hematite can significantly decrease the value of hyperfine magnetic field [34,35]. Sextet S2 is relatively broad and might be assigned to magnetic relaxation of smaller particles. The low-temperature spectrum corresponding to the sample EAFS* is shown in Figure 13. As it can be seen the model consists of only one sextet. The hyperfine parameters of this component are listed in Table 5. The value of quadrupole shift suggests that the hematite did not undergo Morin transition. This means that the structure remains ferromagnetic, which is possibly caused by the substituent of iron in the structure.
Results from XRD and Mössbauer spectroscopy are in good agreement and showed us the final product as mixed Fe and Cr oxide (EC solid product after thermal treatment). Arroyo et al. [12] described production of CrxFe1−x(OH)3 between pH 2 and 6. The same product was prepared in this work, converted after thermal treatment into the phase (Fe0.6 Cr0.4)2O3. There was max. 20% of Cr in the produced solid product, and the chromium-to-iron ratio was max. 0.46.
Chromite ore has a spinel structure with a general formula of (Fe,Mg)O.(Cr,Al,Fe)2O3. Chromite ore is used for production of ferrochromium alloy. The content of Cr2O3 for metallurgical-grade chromite ore is in the range 42–55% (this means a chromium content of 28–37%) and the chromium-to-iron ratio is higher than 1.5 [36]. The present paper showed the possibilities of processing secondary waste material (slag) leachates and preparing solid product with parameters approaching chromite ore for further chromium production.

4. Conclusions

The evaluated method of electrocoagulation was applied on model and real samples of slag leachates, and proved its relevance for chromium recovery. The broad implication of the presented experimental results provides the basis for the following conclusions:
  • Electrocoagulation is an effective tool for removing chromium from the leachates by concentrating in a solid product useful in the production of chromium.
  • pH value of 6 was optimal for EC procedure, due to the reduction of the experiment duration for total precipitation of Cr and thus minimization the energy consumption.
    Concentration of NaCl, under the same conditions of pH and current intensity, had no influence on the experiment duration. This parameter affected only the proportion of Fe in the solid product and the energy consumption during experiments.
  • Application of higher current intensities (1 or 2 A) led to shortening the time of EC process necessary for the total Cr removal from solution but it led to solution overheating up to 60 °C. 100% efficiency of chromium removal was achieved for 0.5 A after 140 min and for 0.1 A after 430 min of EC process.
  • Thermogravimetric analysis, XRD analysis and Mössbauer spectroscopy of solid products provided description of key product parameters in detail.
  • Final EC solid products reached up to 20% of chromium in the form of substituted hematite. Initial amount of 2–5% of chromium in slags used for leachates preparation is stated for comparison.
  • EC demands application of high current intensities when it is used as waste water treatment technology (solid product composition is insignificant).
  • Metals recovery from secondary raw materials could be achieved by employing of low current intensities (metal concentration increases in the final solid product).

Author Contributions

Electrocoagulation experiments, manuscript conception, writing and corrections, L.P. and M.H.; slags leachates preparation and characterization, A.M. and D.A.; TGA experiments and description, R.F.; XRD measurements and description, O.M.; Mössbauer experiments and comments, M.C.; EDX, SEM experiments and description, J.B. All authors have read and agreed to the published version of the manuscript.

Funding

This research was funded by project CHROMIC—efficient mineral processing and Hydrometallurgical Recovery of byproduct Metals from low-grade metal containing secondary raw materials, which received funding from the European Union’s Horizon 2020 Research and Innovation program under Grant Agreement n° 730471 and European Regional Development Fund Project “Center for Advanced Applied Sciences” No. CZ.02.1.01/0.0/0.0/16 019/0000778.

Acknowledgments

This work was supported by project CHROMIC—efficient mineral processing and Hydrometallurgical Recovery of byproduct Metals from low-grade metal containing secondary raw materials, which received funding from the European Union’s Horizon 2020 Research and Innovation program under Grant Agreement n° 730471 and European Regional Development Fund Project “Center for Advanced Applied Sciences” No. CZ.02.1.01/0.0/0.0/16 019/0000778.

Conflicts of Interest

The authors declare no conflict of interest.

References

  1. Worldsteel Association. Steel Industry Co-Products. Available online: https://www.worldsteel.org/en/dam/jcr:1b916a6d-06fd-4e84-b35d-c1d911d18df4/Fact_By-products_2018.pdf (accessed on 20 January 2020).
  2. Garcia-Ramos, E.; Romero-Serrano, A.; Zeifert, B.; Flores-Sanchez, P.; Hallen-Lopez, M.; Palacios, E.G. Immobilization of chromium in slags using MgO and Al2O3. Steel Res. Int. 2008, 79, 332–339. [Google Scholar] [CrossRef]
  3. Panda, C.R.; Mishra, K.K.; Nayak, B.D.; Rao, D.S.; Nayak, B.B. Release behaviour of chromium from ferrochrome slag. Int. J. Environ. Technol. Manag. 2012, 15, 261–274. [Google Scholar] [CrossRef]
  4. Qing, Z.; Chengjun, L.; Longhu, C.; Xiang, Z.; Maofa, J. Effect of Lime on Stability of Chromium in Stainless Steel Slag. Minerals 2018, 8, 424. [Google Scholar] [CrossRef] [Green Version]
  5. Bayramoglu, M.; Eyvaz, M.; Kobya, M. Treatment of the textile wastewater by electrocoagulation: Economical evaluation. Chem. Eng. J. 2007, 128, 155–161. [Google Scholar] [CrossRef]
  6. Wang, C.T.; Chou, W.L. Performance of COD removal from oxide chemical mechanical polishing wastewater using iron electrocoagulation. J. Environ. Sci. Health Part A 2009, 44, 1289–1297. [Google Scholar] [CrossRef]
  7. Fernandes, A.; Spranger, P.; Fonseca, A.D.; Pacheco, M.J.; Ciríaco, L.; Lopes, A. Effect of electrochemical treatments on the biodegradability of sanitary landfill leachates. Appl. Catal. B Environ. 2014, 144, 514–520. [Google Scholar] [CrossRef]
  8. Kobya, M.; Ciftci, C.; Bayramoglu, M.; Sensoy, M.T. Study on the treatment of waste metal cutting fluids using electrocoagulation. Sep. Purif. Technol. 2008, 60, 285–291. [Google Scholar] [CrossRef]
  9. Zodi, S.; Louvet, J.N.; Michon, C.; Potier, O.; Pons, M.N.; Lapicque, F.; Leclerc, J.P. Electrocoagulation as a tertiary treatment for paper mill wastewater: Removal of non-biodegradable organic pollution and arsenic. Sep. Purif. Technol. 2011, 81, 62–68. [Google Scholar] [CrossRef]
  10. Behloul, M.; Grib, H.; Drouiche, N.; Abdi, N.; Lounici, H.; Mameri, N. Removal of Malathion Pesticide from Polluted Solutions by Electrocoagulation: Modeling of Experimental Results using Response Surface Methodology. Sep. Sci. Technol. 2013, 48, 664–672. [Google Scholar] [CrossRef]
  11. Inan, H.; Alaydin, E. Phosphate and nitrogen removal by iron produced in electrocoagulation reactor. Desalin. Water Treat. 2014, 52, 1396–1403. [Google Scholar] [CrossRef]
  12. Aroyo, M.G.; Pérez-Herranz, V.; Montanés, M.T.; García-Antón, J.; Guinón, J.L. Effect of pH and chloride concentration on the removal of hexavalent chromium in a batch electrocoagulation reactor. J. Hazard. Mater. 2009, 169, 1127–1133. [Google Scholar] [CrossRef] [PubMed]
  13. Keshmirizadeh, E.; Yousefi, S.; Rofouei, M.K. An investigation on the new operational parameter effective in Cr(VI) removal efficiency: A study on electrocoagulation by alternating pulse current. J. Hazard. Mater. 2011, 190, 119–124. [Google Scholar] [CrossRef] [PubMed]
  14. Xu, H.Y.; Yang, Z.H.; Luo, Y.L.; Zeng, G.M.; Huang, J.; Wanga, L.; Song, P.P.; Yang, X. A novel approach to sustain Fe0-electrocoagulation for Cr(VI) removal by optimizing chloride ion. Sep. Purif. Technol. 2015, 156, 200–206. [Google Scholar] [CrossRef]
  15. Janin, A.; Zaviska, F.; Drogui, P.; Blais, J.F.; Mercier, G. Selective recovery of metals in leachate from chromated copper arsenate treated wastes using electrochemical technology and chemical precipitation. Hydrometallurgy 2009, 96, 318–326. [Google Scholar] [CrossRef]
  16. Golder, A.K.; Samanta, A.N.; Ray, S. Removal of Cr3+ by electrocoagulation with multiple electrodes: Bipolar and monopolar configurations. J. Hazard. Mater. 2007, 141, 653–661. [Google Scholar] [CrossRef]
  17. Khan, S.U.; Islam, D.T.; Farooqi, I.H.; Ayub, S.; Basheer, S. Hexavalent chromium removal in an electrocoagulation column reactor: Process optimization using CCD, adsorption kinetics and pH modulated sludge formation. Process Saf. Environ. Prot. 2019, 122, 118–130. [Google Scholar] [CrossRef]
  18. Cherifi, M.; Hazourli, S.; Pontvianne, S.; Lapicque, F.; Leclerc, J.P. Electrokinetic removal of aluminum and chromium from industrial wastewater electrocoagulation treatment sludge. Desalin. Water Treat. 2015, 57, 1–16. [Google Scholar] [CrossRef] [Green Version]
  19. Heidmann, I.; Calmano, W. Removal of Zn(II), Cu(II), Ni(II), Ag(I) and Cr(VI) presentin aqueous solutions by aluminium electrocoagulation. J. Hazard. Mater. 2008, 152, 934–941. [Google Scholar] [CrossRef]
  20. Zewail, T.M.; Yousef, N.S. Chromium ions (Cr6+ & Cr3+) removal from synthetic wastewaterby electrocoagulation using vertical expanded Fe anode. J. Electroanal. Chem. 2014, 735, 123–128. [Google Scholar] [CrossRef]
  21. Mouedhen, G.; Feki, M.; De Petris-Wery, M.; Ayedi, H.F. Electrochemical removal of Cr(VI)from aqueous media using iron and aluminum as electrode materials: Towards a better understanding of the involved phenomena. J. Hazard. Mater. 2009, 168, 983–991. [Google Scholar] [CrossRef]
  22. Kakakhel, L.; Lutfullah, G.; Bhanger, M.I.; Shah, A.; Niaz, A. Electrolytic recovery of chromium salts from tannery wastewater. J. Hazard. Mater. 2007, 148, 560–565. [Google Scholar] [CrossRef]
  23. Benhadji, A.; Ahmed, M.T.; Maachi, R. Electrocoagulation and effect of cathode materials on the removal of pollutants from tannery wastewater of Rouïba. Desalination 2011, 277, 128–134. [Google Scholar] [CrossRef]
  24. Lakshmipathiraj, P.; Raju, G.B.; Basariya, M.R.; Parvathy, S.; Prabhakar, S. Removal of Cr(VI) by electrochemical reduction. Sep. Purif. Technol. 2008, 60, 96–102. [Google Scholar] [CrossRef]
  25. Jin, W.; Du, H.; Zheng, S.; Zhang, Y. Electrochemical processes for the environmental remediation of toxic Cr(VI): A review. Electrochim. Acta 2016, 191, 1044–1055. [Google Scholar] [CrossRef]
  26. Kim, J.D.; Pyun, S.I. The effects of applied potential and chloride ion on the repassivation kinetics of pure iron. Corros. Sci. 1996, 38, 1093–1102. [Google Scholar] [CrossRef]
  27. Vasudevan, S.; Lakshmi, J.; Sozhan, G. Studies on the Al-Zn-In-alloy as anode material for the removal of chromium from drinking water in electrocoagulation process. Desalination 2011, 275, 260–268. [Google Scholar] [CrossRef]
  28. Barrera-Diaz, C.; Lugo-Lugo, V.; Roa-Morales, G.; Natividad, R.; Martinez-Delgadillo, S.A. Enhancing the electrochemical Cr(VI) reduction in aqueous solution. J. Hazard. Mater. 2011, 185, 1362–1368. [Google Scholar] [CrossRef]
  29. Horckmans, L.; Möckel, R.; Nielsen, P.; Kukurugya, F.; Vanhoof, C.; Morillon, A.; Algermissen, D. Multi-Analytical Characterization of Slags to Determine the Chromium Concentration for a Possible Re-Extraction. Minerals 2019, 9, 646. [Google Scholar] [CrossRef] [Green Version]
  30. Lutterotti, L. Total pattern fitting for the combined size–strain–stress–texture determination in thin film diffraction. Nucl. Instrum. Methods Phys. Res. Sect. B 2010, 268, 334–340. [Google Scholar] [CrossRef]
  31. Žák, T.; Jirásková, Y. CONFIT: Mössbauer spectra fitting program. Surf. Interface Anal. 2006, 38, 710–714. [Google Scholar] [CrossRef]
  32. Parga, J.R.; Cocke, D.L.; Valverde, V.; Gomes, J.A.G.; Kesmez, M.; Moreno, H.; Weir, M.; Mencer, D. Characterization of Electrocoagulation for Removal of Chromium and Arsenic. Chem. Eng. Technol. 2005, 28, 605–612. [Google Scholar] [CrossRef]
  33. Parga, J.R.; Vazquez, V.; Gonzalez, G.; Cisneros, M.M. Thermodynamic Studies of Chromium Adsorption on Iron Species Generated by Electrocoagulation. Chem. Eng. Technol. 2010, 33, 1582–1590. [Google Scholar] [CrossRef]
  34. Bhattacharya, A.K.; Hartridge, A.; Mallick, K.K.; Majumdar, C.K.; Das, D.; Chintalapudi, S.N. An X-ray diffraction and Mössbauer study of nanocrystalline Fe2O3–Cr2O3 solid solutions. J. Mater. Sci. 1997, 32, 557–560. [Google Scholar] [CrossRef]
  35. Yogi, A.; Varshney, D. Magnetic and structural properties of pure and Cr-doped haematite: α-Fe2-xCrxO3 (0 ≤ x ≤ 1). J. Adv. Ceram. 2013, 2, 360–369. [Google Scholar] [CrossRef] [Green Version]
  36. Buschow, K.H.J.; Cahn, R.W.; Flemings, M.C.; Ilschner, B.; Kramer, E.J.; Mahajan, S.; Veyssière, P. Production of Chromium Ferroalloys. In Encyclopedia of Materials: Science and Technology; Elsevier Ltd.: Oxford, UK; Pergamon: Oxford, UK, 2001; ISBN 978-0-08-043152-9. [Google Scholar]
Publisher’s Note: MDPI stays neutral with regard to jurisdictional claims in published maps and institutiona affiliations.
Figure 1. Electrocoagulation (EC) experimental setup of slag leachates processing.
Metals 10 01593 g001
Figure 2. Decrease of Cr concentration in model solutions for different pH values, c (NaCl) = 3000 mg/L, I = 1 A.
Metals 10 01593 g002
Figure 3. Decrease of Cr concentration for different current intensities, model solution, c (NaCl) = 3000 mg/L, pH = 6.
Metals 10 01593 g003
Figure 4. Dependence of EC energy consumption on current intensity and NaCl concentration. Volume = 350 mL, model solution, pH = 6.
Metals 10 01593 g004
Figure 5. EC energy consumption with and without pH regulation. Volume = 350 mL, model solution, c (NaCl) = 3000 mg/L.
Metals 10 01593 g005
Figure 6. Time dependence of EC process on Cr concentration for real leachates of slags EAFS, EAFC, LC FeCr, HC FeCr, I = 0.1 A, pH = 6.
Metals 10 01593 g006
Figure 7. Thermogravimetric analysis (TGA) of EC solid product prepared from leachate of EAFS slag.
Metals 10 01593 g007
Figure 8. SEM-EDX analysis of EC solid products prepared from leachates EAFS, EAFC, LC FeCr, HCFeCr.
Metals 10 01593 g008
Figure 9. XRD spectrum of EC solid product prepared from leachate of HC FeCr refined for lattice parameter determination of (Fe,Cr)2O3 phase. The insert graph shows the place of fitted values between known parameters from PDF2 database.
Metals 10 01593 g009
Figure 10. Room temperature (RT) Mössbauer MS spectrum of the EC solid product prepared from leachate of EAFS.
Metals 10 01593 g010
Figure 11. Low temperature Mössbauer spectrum of the EC solid product prepared from leachate of EAFS.
Metals 10 01593 g011
Figure 12. RT Mössbauer spectrum of the EC solid product prepared from leachate of EAFS*.
Metals 10 01593 g012
Figure 13. Low temperature Mössbauer spectrum of the EC solid product prepared from leachate of EAFS*.
Metals 10 01593 g013
Table 1. Real leachates parameters.
Real Leach. Markc (Cr)(mg/L)Original pHV (HCl 1:1) Added to 100 mL of Leachate for pH Adjusting to 6 (mL)NaCl Produced from 100 mL of Leachate (g)G *(mS)
EAFS219112.52.360.41417.37
EAFC94212.61.690.41612.67
LC FeCr68712.61.330.3339.4
HC FeCr201310.50.67-8.8
* Conductivity was measured after pH was adjusted to 6 and after filtration of crystallized NaCl.
Table 2. Amount of Cr and Fe in the EC solid product and energy consumption for different current intensities and NaCl concentrations at pH = 6.
Sample c (Cr) (mg/L)I (A)U (V)c (NaCl) (mg/L)Cr (g/kg) *Fe (g/kg) *Ratio Cr:FeEnergy Consumption (kWh/m3)
model 110000.12.63000138.9384.30.36145.57
model 210000.58.53000107.5367.90.292224.65
model 31000116300095.8388.30.246759.00
model 41000225300079.6437.80.1818107.52
model 510000.5410,00079.5364.30.218213.83
model 610000.52.530,00084.3384.50.219212.98
model 710000.5250,00098.3727.80.13516.76
EAFS21910.11.8not add.156.6357.90.43766.64
EAFC9420.11.8not add.140340.60.41104.21
LC FeCr6870.12.2not add.141.1346.10.40773.74
HC FeCr20130.12.5not add.111.1222.20.50010.99
* Fe a Cr amounts were determined by AAS after sample decomposition.
Table 3. XRF analysis results of EC solid products before and after (*) samples thermal treatment at 850 °C.
SampleFeCrClSMgƩ Elem.BalanceTotal %Ratio Cr/Fe
model 144.8814.930.3513.533.8570.8729.0099.870.3327
model 1 *51.7216.960.0700.4644.6577.4322.4899.900.3279
EAFS42.3115.562.051.042.9872.3032.8799.790.3678
EAFS *46.7517.390.0750.9884.0373.7727.3599.840.3720
EAFC41.8715.361.460.5783.7674.1534.1599.890.3668
EAFC *48.3016.790.0690.1233.6973.6327.7599.840.3476
LC FeCr43.2015.131.530.3054.2274.8632.5899.850.3502
LC FeCr *50.9717.790.0840.2624.1974.0023.3499.850.3490
HC FeCr34.2815.770.8230.5033.1173.2242.6099.840.4600
HC FeCr *43.5920.110.0700.4663.0273.8729.4999.840.4613
Table 4. Hyperfine parameters of the sample EAFS.
Conditions<IS> [mm/s]<QS> [mm/s]<Bhf> [T]
RT0.37 ± 0.020.87 ± 0.02-
4.2 K0.47 ± 0.020.00 ± 0.0246.2 ± 0.3
Table 5. Hyperfine parameters of the sample EAFS*.
Conditions<IS> [mm/s]<QS> [mm/s]<Bhf> [T]
RTS10.40 ± 0.02−0.21 ± 0.0249.6 ± 0.3
S20.40 ± 0.02−0.21 ± 0.0247.6 ± 0.3
4.2 KS10.48 ± 0.02−0.20 ± 0.0252.6 ± 0.3
Publisher’s Note: MDPI stays neutral with regard to jurisdictional claims in published maps and institutional affiliations.