Article

Study of HCAP-PC to Enhance Process Efficiency for Age-Hardened Aluminum Alloys Based on Grey Relational Analysis

1
School of Mechanical and Electrical Engineering, Xuzhou University of Technology, Xuzhou 221018, China
2
School of Chemical Engineering and Technology, China University of Mining and Technology, Xuzhou 221116, China
*
Author to whom correspondence should be addressed.
Metals 2020, 10(12), 1594; https://doi.org/10.3390/met10121594
Submission received: 4 November 2020 / Revised: 23 November 2020 / Accepted: 25 November 2020 / Published: 28 November 2020
(This article belongs to the Section Metal Casting, Forming and Heat Treatment)

Abstract

:
A multi-pass equal-channel angular pressing (helical channel angular pressing-parallel channel, HCAP-PC) is proposed to enhance process efficiency and avoid plastic deformation damage during the preparation of ultrafine-grained age hardened aluminum alloys. Multiple shear and twist deformations are provided at the single extrusion channel. The channel parameters were optimized by using grey relational analysis (GRA). An orthogonal L16-4-5 test array containing five factors ( ψ , ϕ , γ , m and the length of L1 section) and four levels was collected to investigate the influence of channel parameters on the effective strain, the effective stress, the amount of damage and the deformation homogeneity coefficients. Based on the GRA, the grey relational coefficients and the grey relational grades were calculated to report the significant channel parameters which affect the extrusion quality and efficiency. Furthermore, according to the results of segregated grey relational grades, the contribution orders from high to low were listed as ψ , ϕ , γ , m and L1. The extrusion experiments were carried out with aluminum alloy 2024 after solid solution treatment and at the HCAP-PC die with geometry of ψ 20°, ϕ 90°, γ 73°, m 1.35 and 1d. The ultrafine-grained age hardened aluminum alloys were prepared and the process time was decreased to less than 120 min.

1. Introduction

The equal-channel angular pressing (ECAP) process is regarded as an efficient and feasible method to prepare bulk ultrafine-grained materials which exist with average grain sizes of less than 1 µm. The microstructure is quite homogeneous and consists of an array of essentially equiaxed grains with many boundaries having high angles of misorientation [1]. In past studies, a minimum of 4 extrusion passes were required to obtain the ultrafine-grained microstructure at ECAP [2]. Each pass had a different slip system and generated a different strain value in the sample. Four pressing routes A, C, BA and BC were introduced to improve deformation homogeneity. Experiments on face-centered cubic (fcc) aluminum alloys have shown that route BC is the optimal processing route for having better microstructure and mechanical properties [3,4]. However, it is difficult for the extruded specimen to be pushed into the ECAP channel again once the billet has been extruded out from the channel because the original size cannot always be maintained. In consequence, mechanical treatments are needed to make the extruded specimen fit the geometry of the ECAP channel after each pass. A lot of time is consumed for machining activities but not for the extrusion operation itself [5]. In particular, excessive time consumption is a big problem when working age-hardening aluminum alloys. Increasing process efficiency, in the sense of imposing larger strains during individual pass to reduce the number of process passes for the similar levels of grain size, is thus one of the desired goals [5,6]. Recently, multi-pass ECAP techniques have attracted more attention for the beneficial application of intense strain on material in one pressing.
The first solution is the application of ECAP with parallel channels [7,8]. These approaches were implemented using a parallel [7] and interconnected multi-pass die [8]. The second solution is to twist the sample in the channel, which allows multiple shear deformations without removing the sample away from the die [6,9,10,11]. In order to enhance process efficiency for time-dependent age-hardened aluminum alloys further, in the present study a multi-pass ECAP process but with intense strain is proposed that is composed of multiple helical channels and angular pressing channels, combining the two advantages mentioned above and named helical channel angular pressing-parallel channel (HCAP-PC). Multiple shear and twist deformations were conducted without removing the sample away from the die, while route Bc was achieved. Considering round bar is a semi-product shape frequently encountered in metal working, the HCAP-PC process is available in particular for age-hardened aluminum alloys with a circular cross-section because of less processing time. The shear directions are altered in the helical channel to increase the deformation homogeneity.

2. Methods and Materials

2.1. Principle of Helical Channel Angular Pressing-Parallel Channel (HCAP-PC)

A schematic diagram for the proposed HCAP-PC technique is shown in Figure 1. The extrusion die consisted of the five passes marked in Figure 1. These were three equal channel angular pressing passes, marked 1, 3 and 5, and two helical channels for altering the shear directions and accumulating strain, marked 2 and 4. Passes 1, 3 and 5 were parallel to each other and conducted the angular pressing. Passes 2 and 4 were intersected and performed the twist extrusion. The areas of cross-section through the channel are equal throughout the whole extrusion process if the friction is not taken into account. Then the helical channels 2 and 4 are divided into three sections; the first section is a straight channel marked as L1/L4, the second section is a helical elliptical section channel marked as L2/L5, and the third section is the straight channel marked as L3/L6. The shear directions and angles of a cylindrical sample are constantly changed throughout the extrusion in the L2/L5 section. Only the sections of L1, L2 and L3 are discussed because the identical shape is applied in two helical channels. The other sections of L4, L5 and L6, were designed with the same shape parameters as L1, L2 and L3. Furthermore, the length of L1 is equal to L3, so only L1 and L2 are discussed in the following section.
The shear deformation occurs mainly in the angular channel (1, 3 and 5) where the grains are refined [12]. The angular channel is defined by two angles where the channel angle ϕ represents the angle between the two sections of the channel (equals to 90° in Figure 1), and the curvature angle ψ represents the angle at the outer arc of curvature where the two sections of the channel intersect [1]. Only one angular section is discussed here because the identical shape is applied at all angular sections.
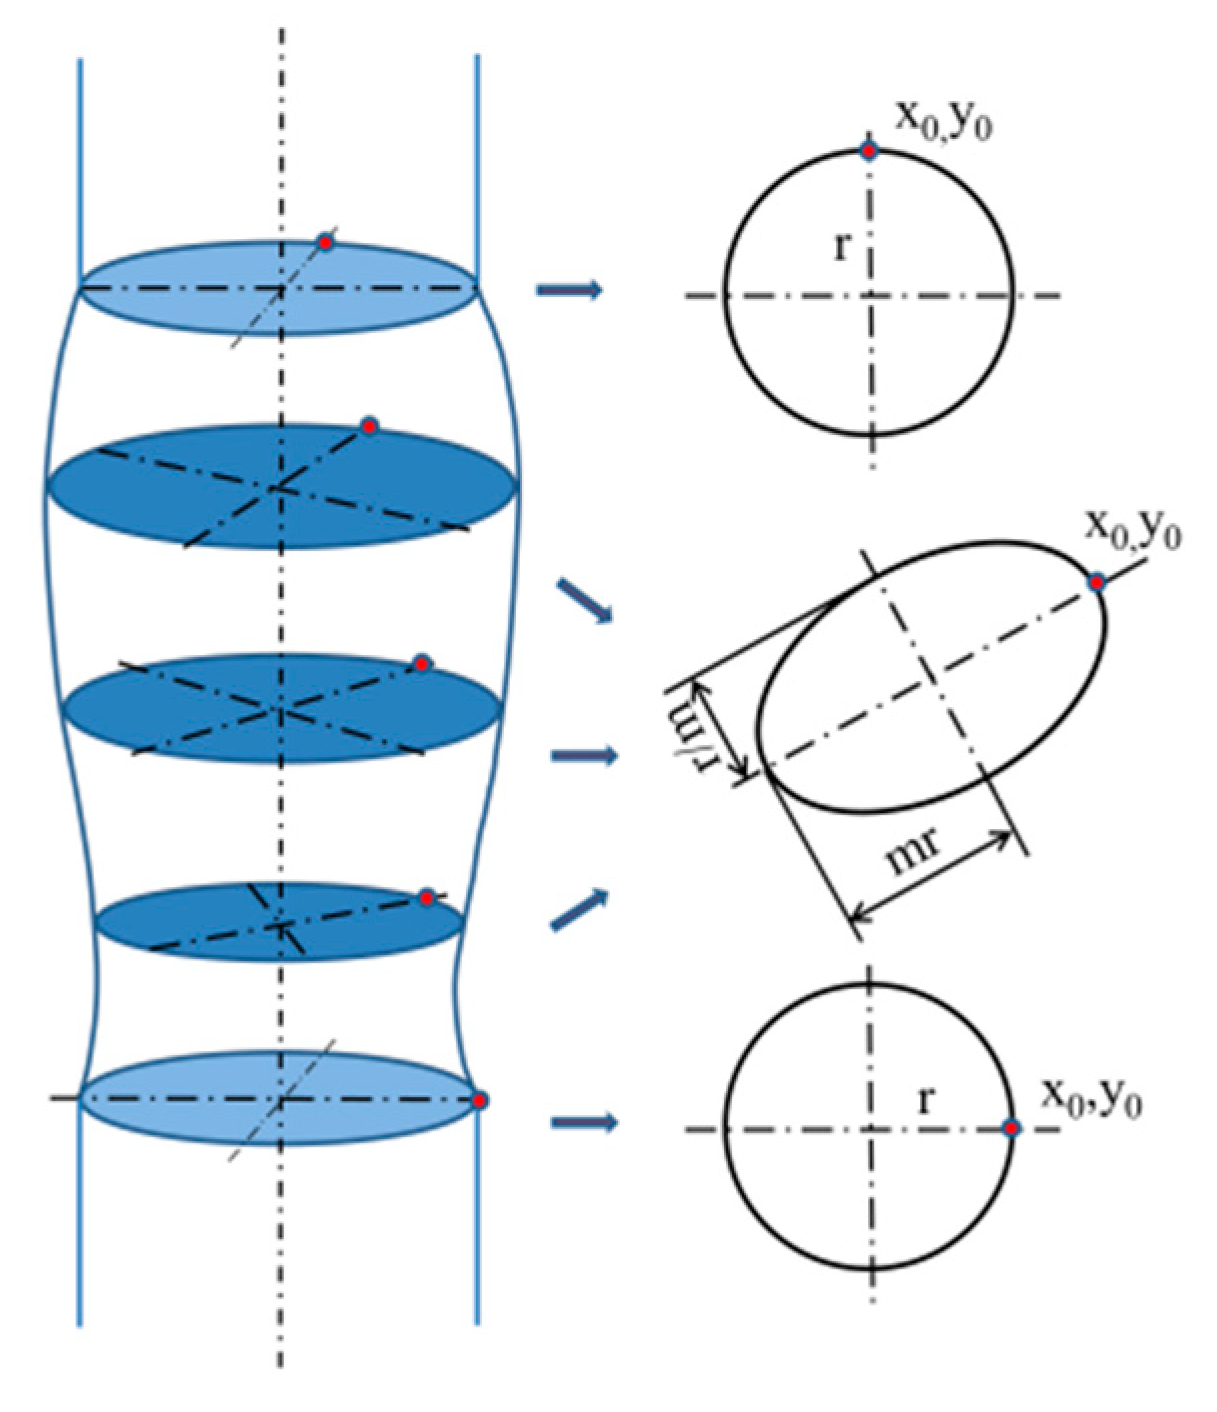
The twist deformation occurs mainly in the helical section channel (2 and 4). Furthermore, passes 2 and 4 are involved in a vortex flux. In these passes, the material elements are engaged in translational movement and at the same time are rotated about an axis parallel to the extrusion axis. θ represents the rotated angle. As will be shown below, such a vortex flow can be used to form a helical-shaped architecture within the round bar. The construction of the helical channel and the evolution of the elliptical section are shown in Figure 2 where an elliptical factor, m , is chosen to describe the ratio of the major-axis and minor-axis lengths in the elliptical section. The major-axis length is illustrated as m × r and the minor-axis length is expressed as r / m , where r is the radius of the cylindrical samples to be extruded. Consequently, an elliptical cross-section area of π r 2 is equal to the circular cross-section area.
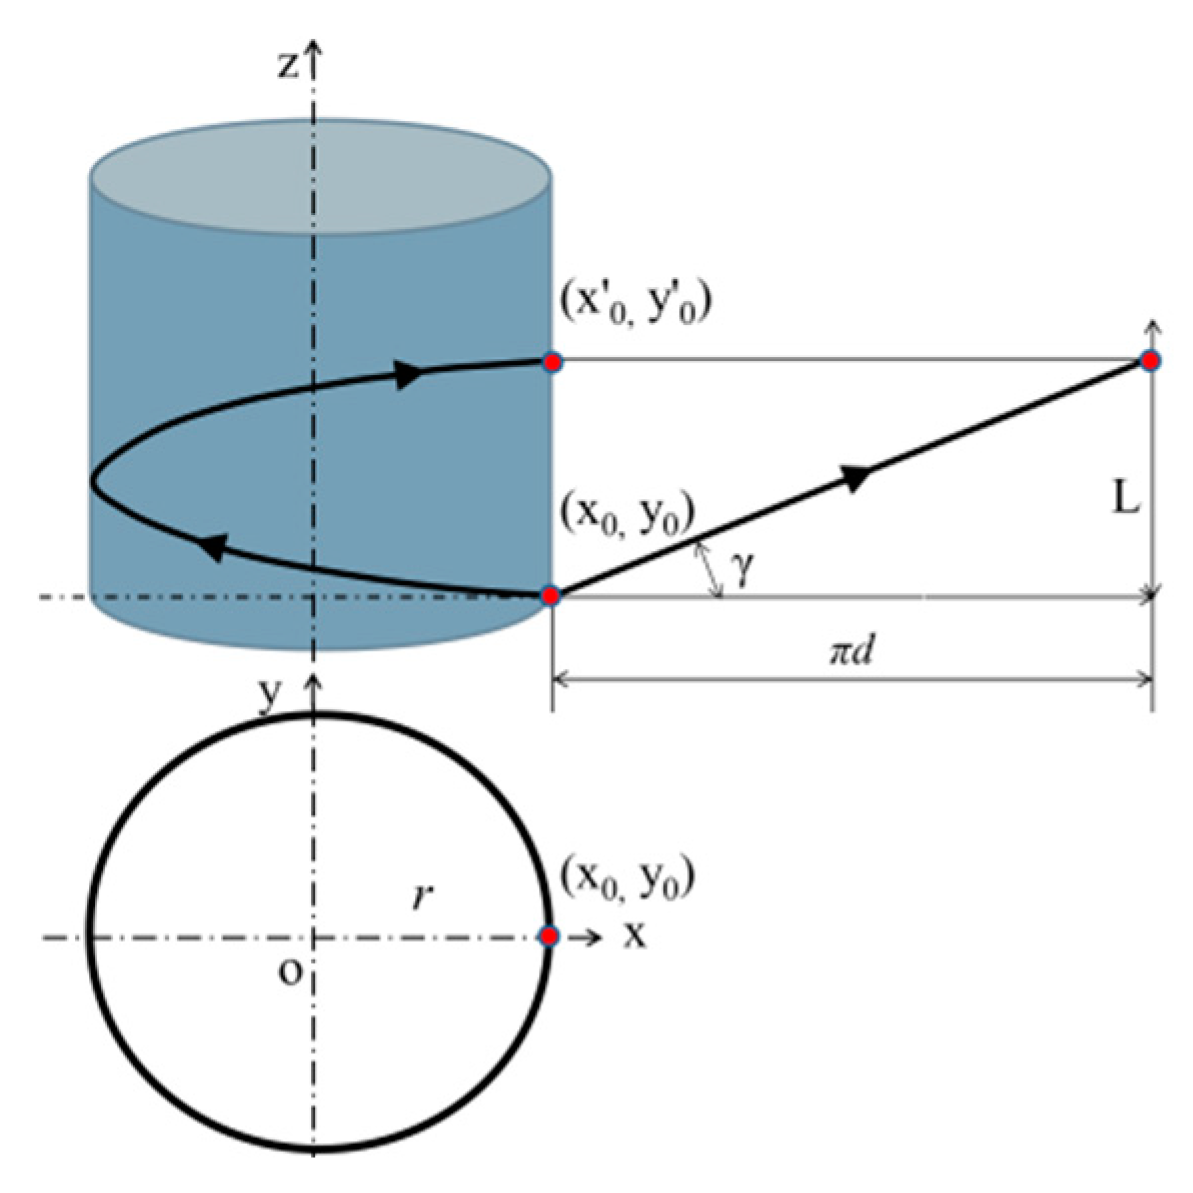
In order to describe the track of driving the sample to rotate θ (90°) while travelling some distance along the direction of extrusion in Section L2, the cylindrical helix equation is applied. The principle is shown in Figure 3 where an orthogonal x , y , z coordinate system is defined, x o y plane denotes the cross-sectional plane, z direction denotes the direction of extrusion and γ denotes the lead angle. The starting point ( x 0 , y 0 ) is defined, and the distance from the original spot o is r . When the point of ( x 0 , y 0 ) is driven 360° according to the cylindrical helix equation and arrives at the location of ( x 0 , y 0 ), the projected perimeter to x o y plane is equal to π d where d is the diameter of the cylindrical sample and L is the distance of the points on the round bar traveling along the z direction (from x 0 , y 0 to x 0 , y 0 ).
Consequently, the length of L2 is formulated as:
L 2 = π d tan γ 4 ,
where d is the diameter of cylinder and γ is the lead angle in the cylindrical helix equation.
In summary, the shape of the whole channel is mainly controlled by five parameters, which are: ϕ , ψ , γ , m and the length of L1.

2.2. Channel Parameters Design and Optimization Based on Grey Relational Analysis (GRA)

The accumulated plastic deformation is affected synthetically by the five channel parameters. In order to investigate economically the influence of these parameters on the accumulated plastic deformation, the Taguchi test method was applied to extract channel parameters and reduce the number of tests. Based on Taguchi method, the five parameters, ϕ , ψ , γ , m and the length of L1, were picked out as the control factors for the orthogonal array, in accordance with the principle of HCAP-PC mentioned previously, and four levels for each of the five factors were chosen. Consequently, the L16-5-4 orthogonal array with 5 factors and 4 levels were managed and are summarized in the following Table 1.
The grey relational analysis (GRA) method [13,14] is applied to investigate the significant channel parameters which affect the extrusion process. The grey relational grade reports the level of similarity or dissimilarity among influencing parameters. A higher grey relational grade value implies higher influence. Before analysis, all original data must be normalized according to the type of characteristics: the higher-the-better or the lower-the-better is defined as the grey relational generation.
With reference to the effective strain, the desired characteristic is higher-the-better. Therefore, the effective strain is normalized according to Equation (2):
X t ( n ) = x t ( n ) min x t ( n ) max x t ( n ) min x t ( n ) ,   t = 1 , 2 , 3 , 4 ,   n = 1 , 2 , , 16
In contrast, the desired characteristic of effective stress, deformation uniformity coefficient and damage variable are lower-the-better. These parameters are normalized according to Equation (3):
X t ( n ) = max x t ( n ) x t ( n ) max x t ( n ) min x t ( n ) ,   t = 1 , 2 , 3 , 4 ,   n = 1 , 2 , , 16
where t ranges from 1 to 4, n is the number of orthogonal array and ranges from 1 to 16. x t ( n ) is the n th simulated value under the t th parameter, then X t ( n ) is the n th normalized sequence under the t th parameter.
After normalization, all data under the four output parameters are converted to a value ranging from 0 to 1. The grey relational coefficients reveal the proximity between the simulated results and the desired values. The grey relational coefficients ζ i ( j ) are calculated according to Equation (4):
ζ t ( n ) = min t ( | X t ( 0 ) X t ( n ) | ) + ξ max t ( | X t ( 0 ) X t ( n ) | ) | X t ( 0 ) X t ( n ) | + ξ max t ( | X t ( 0 ) X t ( n ) | ) ,   t = 1 , 2 , 3 , 4 ,   n = 1 , 2 , , 16
where ζ t ( n ) is the grey relational coefficient of the n th value under the t th parameter, ξ is the distinguishing coefficient with ξ [ 0 , 1 ] and generally ξ = 0.5 [15,16]. X t ( 0 ) is the optimal normalized value. | X t ( 0 ) X t ( n ) | is the deviation value between X t ( 0 ) and X t ( n ) . min t ( | X t ( 0 ) X t ( n ) | ) is the minimum value of the | X t ( 0 ) X t ( n ) | values and max t ( | X t ( 0 ) X t ( n ) | ) is the maximum value of the | X t ( 0 ) X t ( n ) | values. Due to the grey relational generation, X t ( 0 ) is equal to 1, min t ( | X t ( 0 ) X t ( n ) | ) is equal to 0 and max t ( | X t ( 0 ) X t ( n ) | ) is equal to 1 here. Consequently, the grey relational coefficients ζ t ( n ) in this study were also calculated by the following Equation (5):
ζ t ( n ) = 0 + 0.5 × 1 | 1 X t ( n ) | + 0.5 × 1   t = 1 , 2 , 3 , 4 ,   n = 1 , 2 , , 16 ,
Furthermore, the grey relational grade λ ( n ) was calculated by the following Equation (6):
λ ( n ) = 1 4 t = 1 4 ζ t ( n ) ,   n = 1 , 2 , , 16 ,

2.3. Material and Extrusion Process

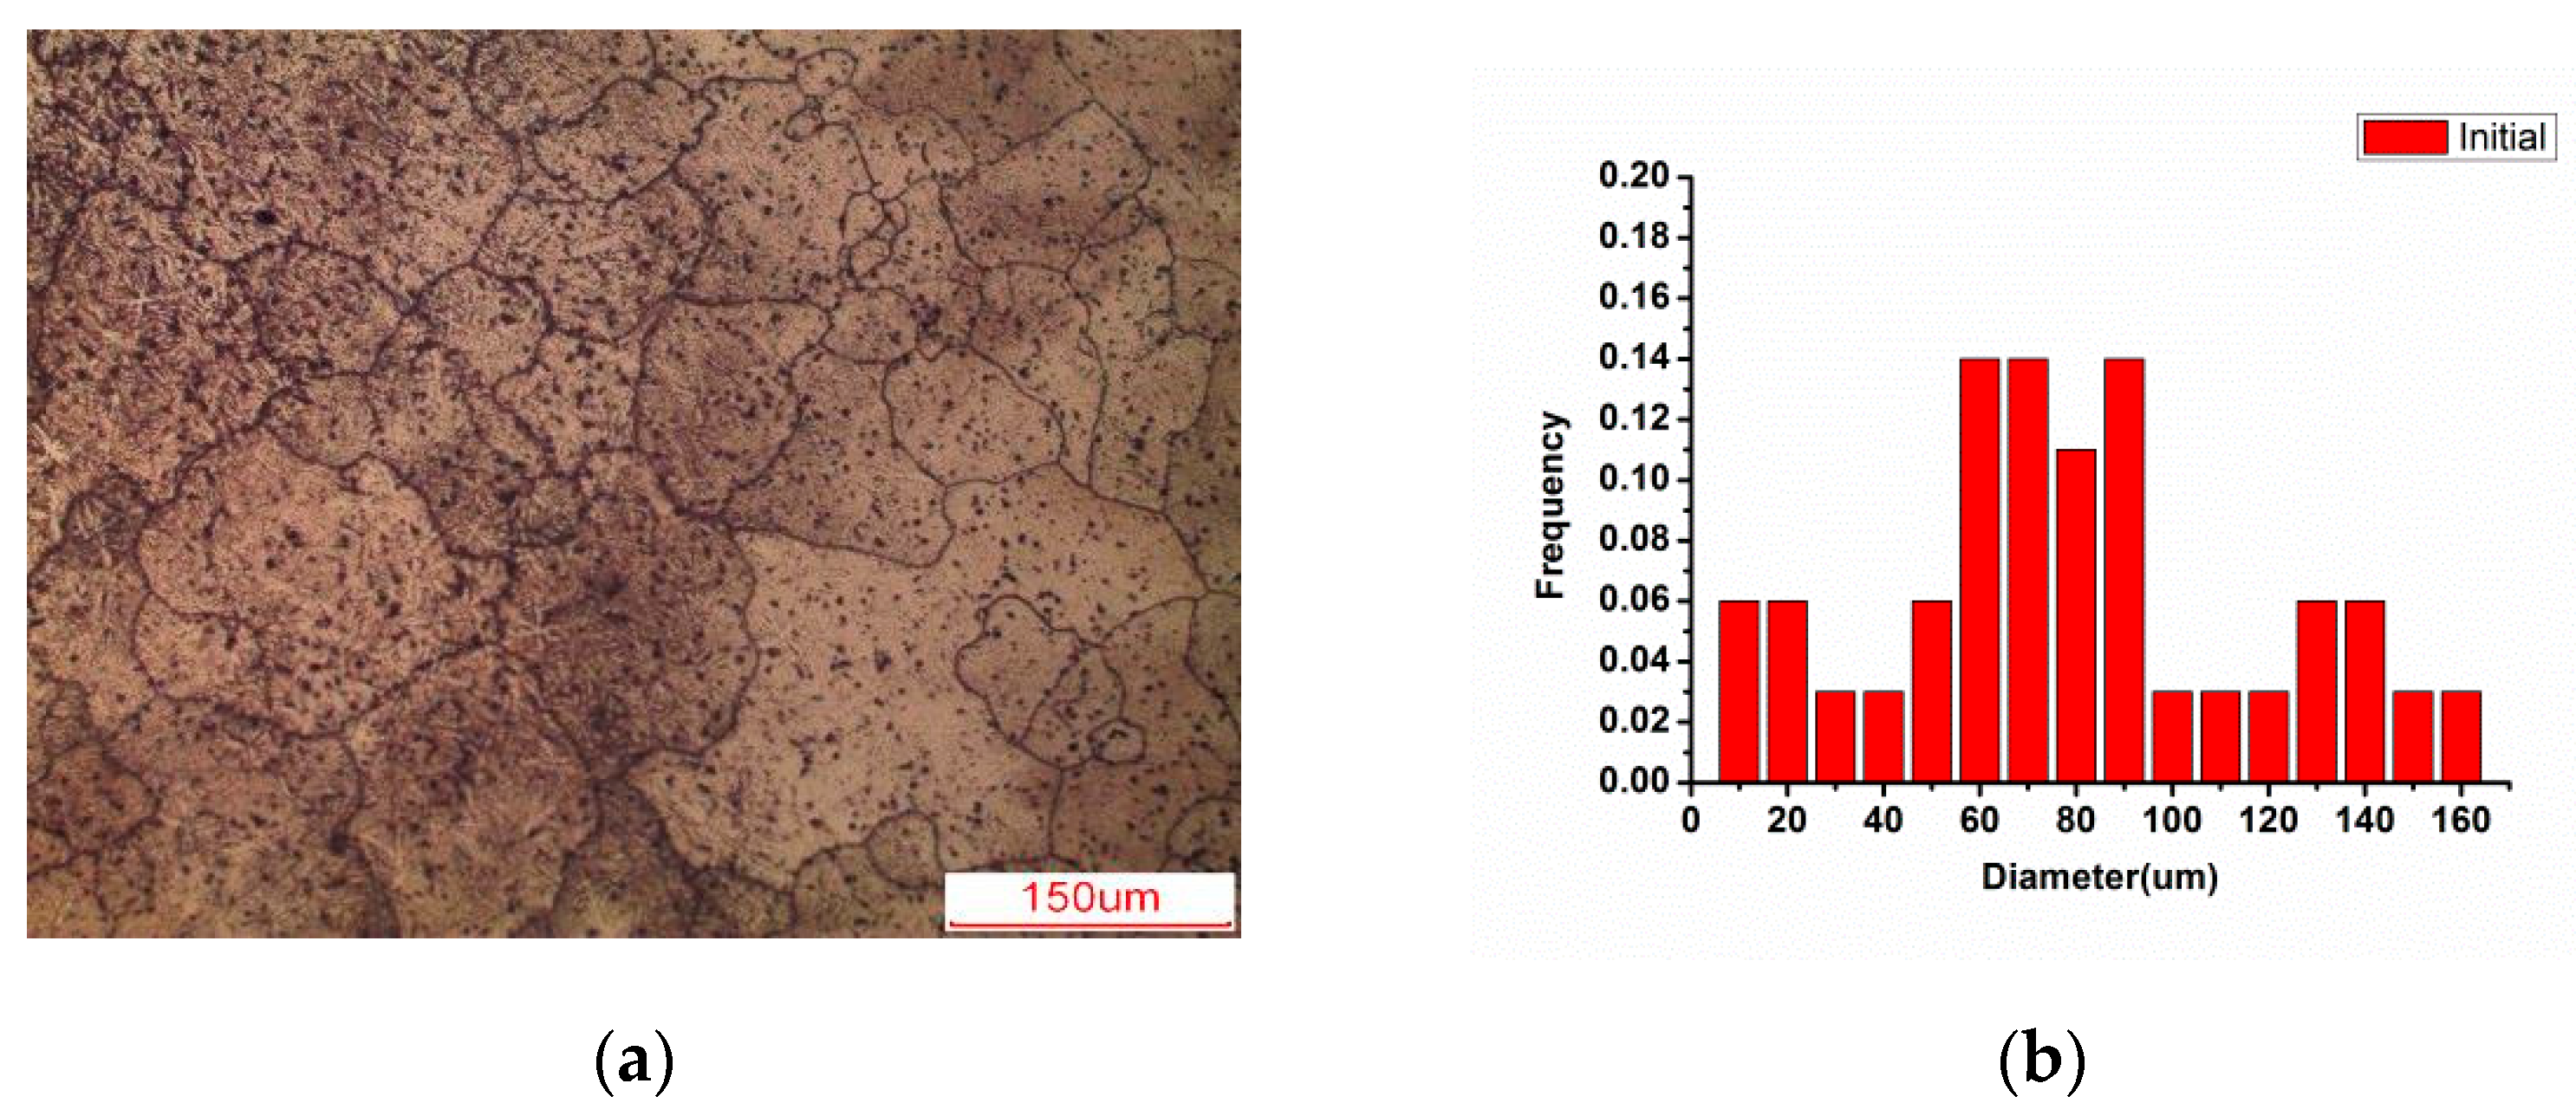
The extrusion was conducted with aluminum alloy 2024 heated at 768 K for 1 h then quenched in water to room temperature (solid solution treatment). The chemical composition and the mechanical properties of this alloy are given in Table 2 and Table 3, respectively. The Vickers hardness decreased from 105 (HV10/15) before heat treatment to 30 (HV10/15) and kept stable within 300 min. The initial average grain size was approximately 70.5 µm determined by the line intercept method. Some coarse grains are observed in Figure 4a. Moreover, the grain size distribution is pictured in Figure 4b.
Considering the plastic deformation will lower the artificial aging temperature [17,18], the extrusion was conducted immediately while the temperature of sample reached 393 K. The speed of the punch was set as 6 mm/s and 16% graphite-grease was used as lubrication. The diameter of the sample was 10 mm with a length of 60 mm.
The corresponding 16 groups of finite element simulations were conducted with DEFORM-3D software (V11, SFTC, Columbus, OH, USA) according to the orthogonal array (listed in Table 1). The friction coefficient used at the simulation was set as 0.14 measured by the friction experiment.

3. Results

3.1. Original Output Results

In principle, the amount of plastic deformation is reflected mainly by the effective strain. The capability of resisting deformation can be reported by the effective stress, which also means the capability of material fluency in the channel. More effective stress is associated with more difficult extrusion and a lower extrusion rate. The strain-induced internal fracture in the sample was reflected by damage variable (D) during the simulated pressing procedure, damage specifies the damage variable at each element. The normalized Cockcroft and Latham damage model is applied in this work [19]. Fracturing occurs once D has reached its critical value. The critical value of D must be determined through physical experimentation. D is defined by:
D = σ * σ d ε ,
where σ * is the tensile maximum principal stress, σ is the effective stress, and d ε is the effective strain increment.
The overall range of D is 0–1. When D is near 0, bars with good ductility can be deformed plastically and sudden over-loading is prevented. When D is near 1, the material becomes extremely brittle. It cannot be deformed plastically any further and will brittle-rupture [20].
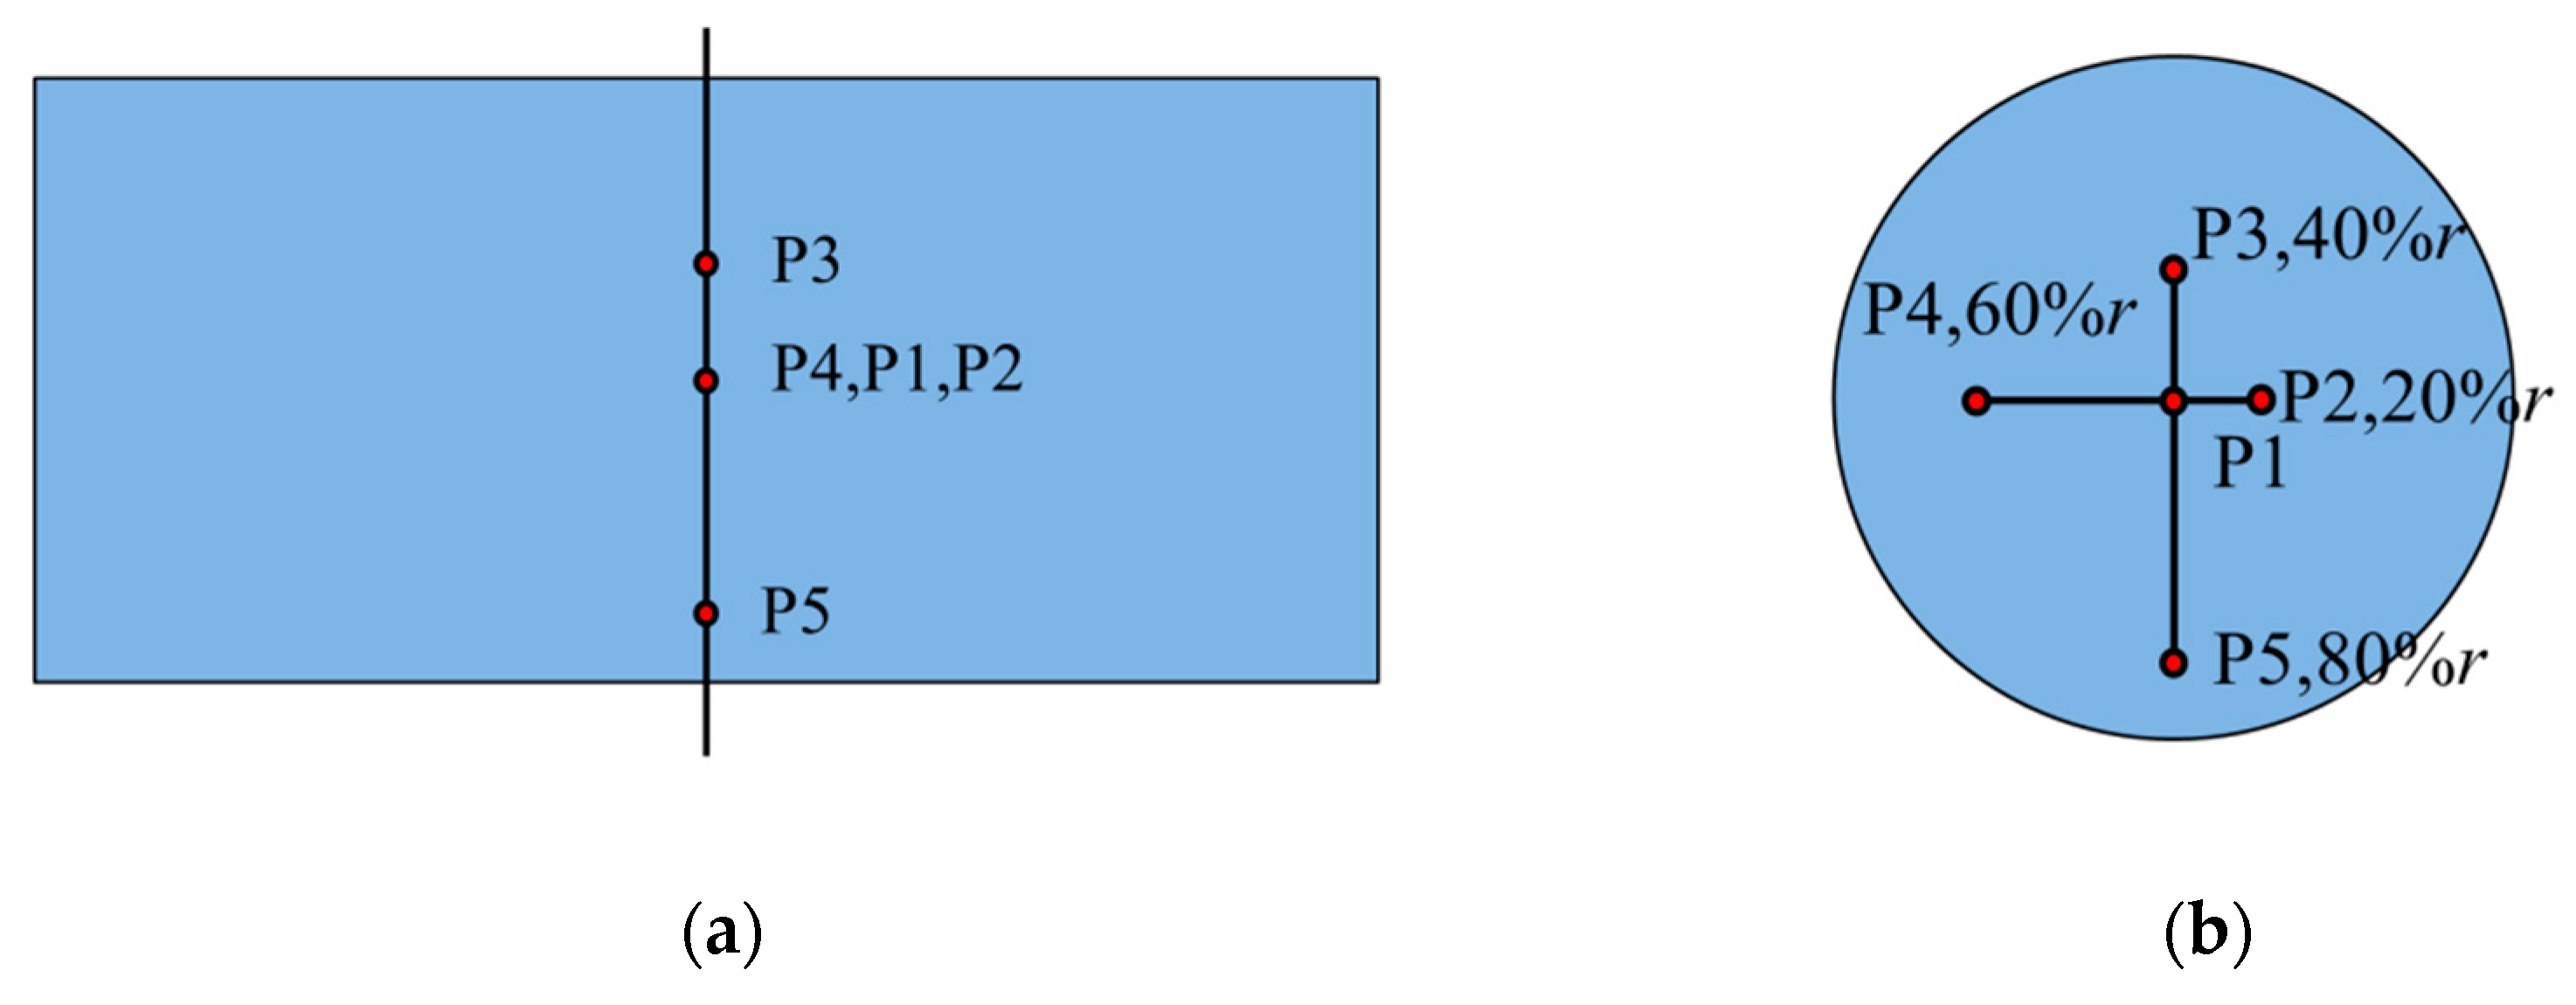
In order to report comprehensively the output parameter curves over the whole cross-section during the simulated deformations, the five tracking points are picked out from the center to the edge on the middle cross-section in the undeformed specimen, while avoiding selection of those points on the sample surface where the results probably would be abnormal. The precise locations of the five points are labeled P1–P5 in the schematic illustration in Figure 5 where P1 is the center. The rest of the points are located in 20% r , 40% r , 60% r , and 80% r respectively, where r is the radius of the cylinder, and all angles are 90° between both neighboring points. With the development of deformation, five tracking points may move to various planes due to material flow. During the whole process, the curves of the tracking points including effective strain, effective stress, and damage variable were output and recorded.

3.2. Processed Output Parameters

After ECAP, the severe plastic deformation had taken place and the dislocation walls were broken [1]. Then, new and more refined grains were generated. The deformation homogeneity is a reflection of the strain distribution when pressing the samples. Furthermore, the better deformation homogeneity allows higher processing rates and less damage. A deformation homogeneity coefficient, α , is applied to describe the deformation homogeneity during the HCAP-PC procedure, which is calculated as follows:
α = ε max ε min ε ave ,
where ε max , ε min , and ε ave are the maximum, minimum, and average effective strain values in the cross-section of the sample, respectively. A smaller coefficient denotes more uniform deformation in the specimen.
ε ave is calculated by Equation (9):
ε ave = Σ i = 1 n ε i n ,
where ε i is the effective strain values extracted from n spots on the billet.
In summary, the accumulated effective strain, the maximum effective stress, the maximum damage variable and the deformation uniformity coefficient at the final forming stage (after pass 5) are selected as the output parameters on which to base an estimate of the deformation quantity and quality.
Every maximum effective strain is extracted from the five effective strain curves of the tracking points. The average of the five maximum effective strains is regarded as the effective strain value. Consequently, 16 effective strains, effective stresses and damage values were obtained from 16 groups of simulation results and are presented in Table 4. Moreover, 16 deformation homogeneity coefficients were calculated according to Equation (8) and also are presented in Table 4. In accordance with the original outputs listed in Table 4 and Equations (5) and (6), the grey relational coefficients and grey relational grades were calculated and listed in Table 5.

4. Discussion

4.1. Influence of Multiple Factors on Multiple Output Parameters Based on GRA

In order to study the effect of the five factors ( ϕ , ψ , γ , m , L1) on the grey relational grade, the segregated grey relational grades for multi factors, Λ f ( l ) , f = 1 , 2 , 3 , 4 , 5 , l = 1 , 2 , 3 , 4 where f indicates the factor and l indicates the level, were extracted for all factors and levels. Hence, 20 grey relational grades Λ f ( l ) were obtained.
Then, an analysis of variance (ANOVA) was conducted to investigate the significance of multi factors on multi-output parameters. The sum of squares of deviations was calculated by the following Equation (10) and is shown in Table 6:
S S ( f ) = f = 1 5 ( Λ f ( l ) Λ m ) 2 ,
where S S ( f ) is the sum of squares of deviations from the mean of Λ m ; f includes the five factors; l includes the four levels; Λ m is the average for all Λ f ( l ) data for one factor.
The contribution of the five factors for the HCAP-PC deformation process is indicated by the value of S S ( f ) . In according to the value of S S ( f ) listed in Table 6, the contribution rank of the five factors were ψ > ϕ > γ > m > L1.

4.2. Optimized Channel Parameters

According to the contribution order of the factors, the effect of channel parameters on deformation quantity were, ψ > ϕ > γ > m > L1. Consequently, the three channel parameters of ψ , ϕ , γ were firstly optimized. Taking into account the simulation results and the contribution ranks, the optimized channel parameters were ψ 20°, ϕ 90°, γ 73°, m 1.35, L1 1 d.
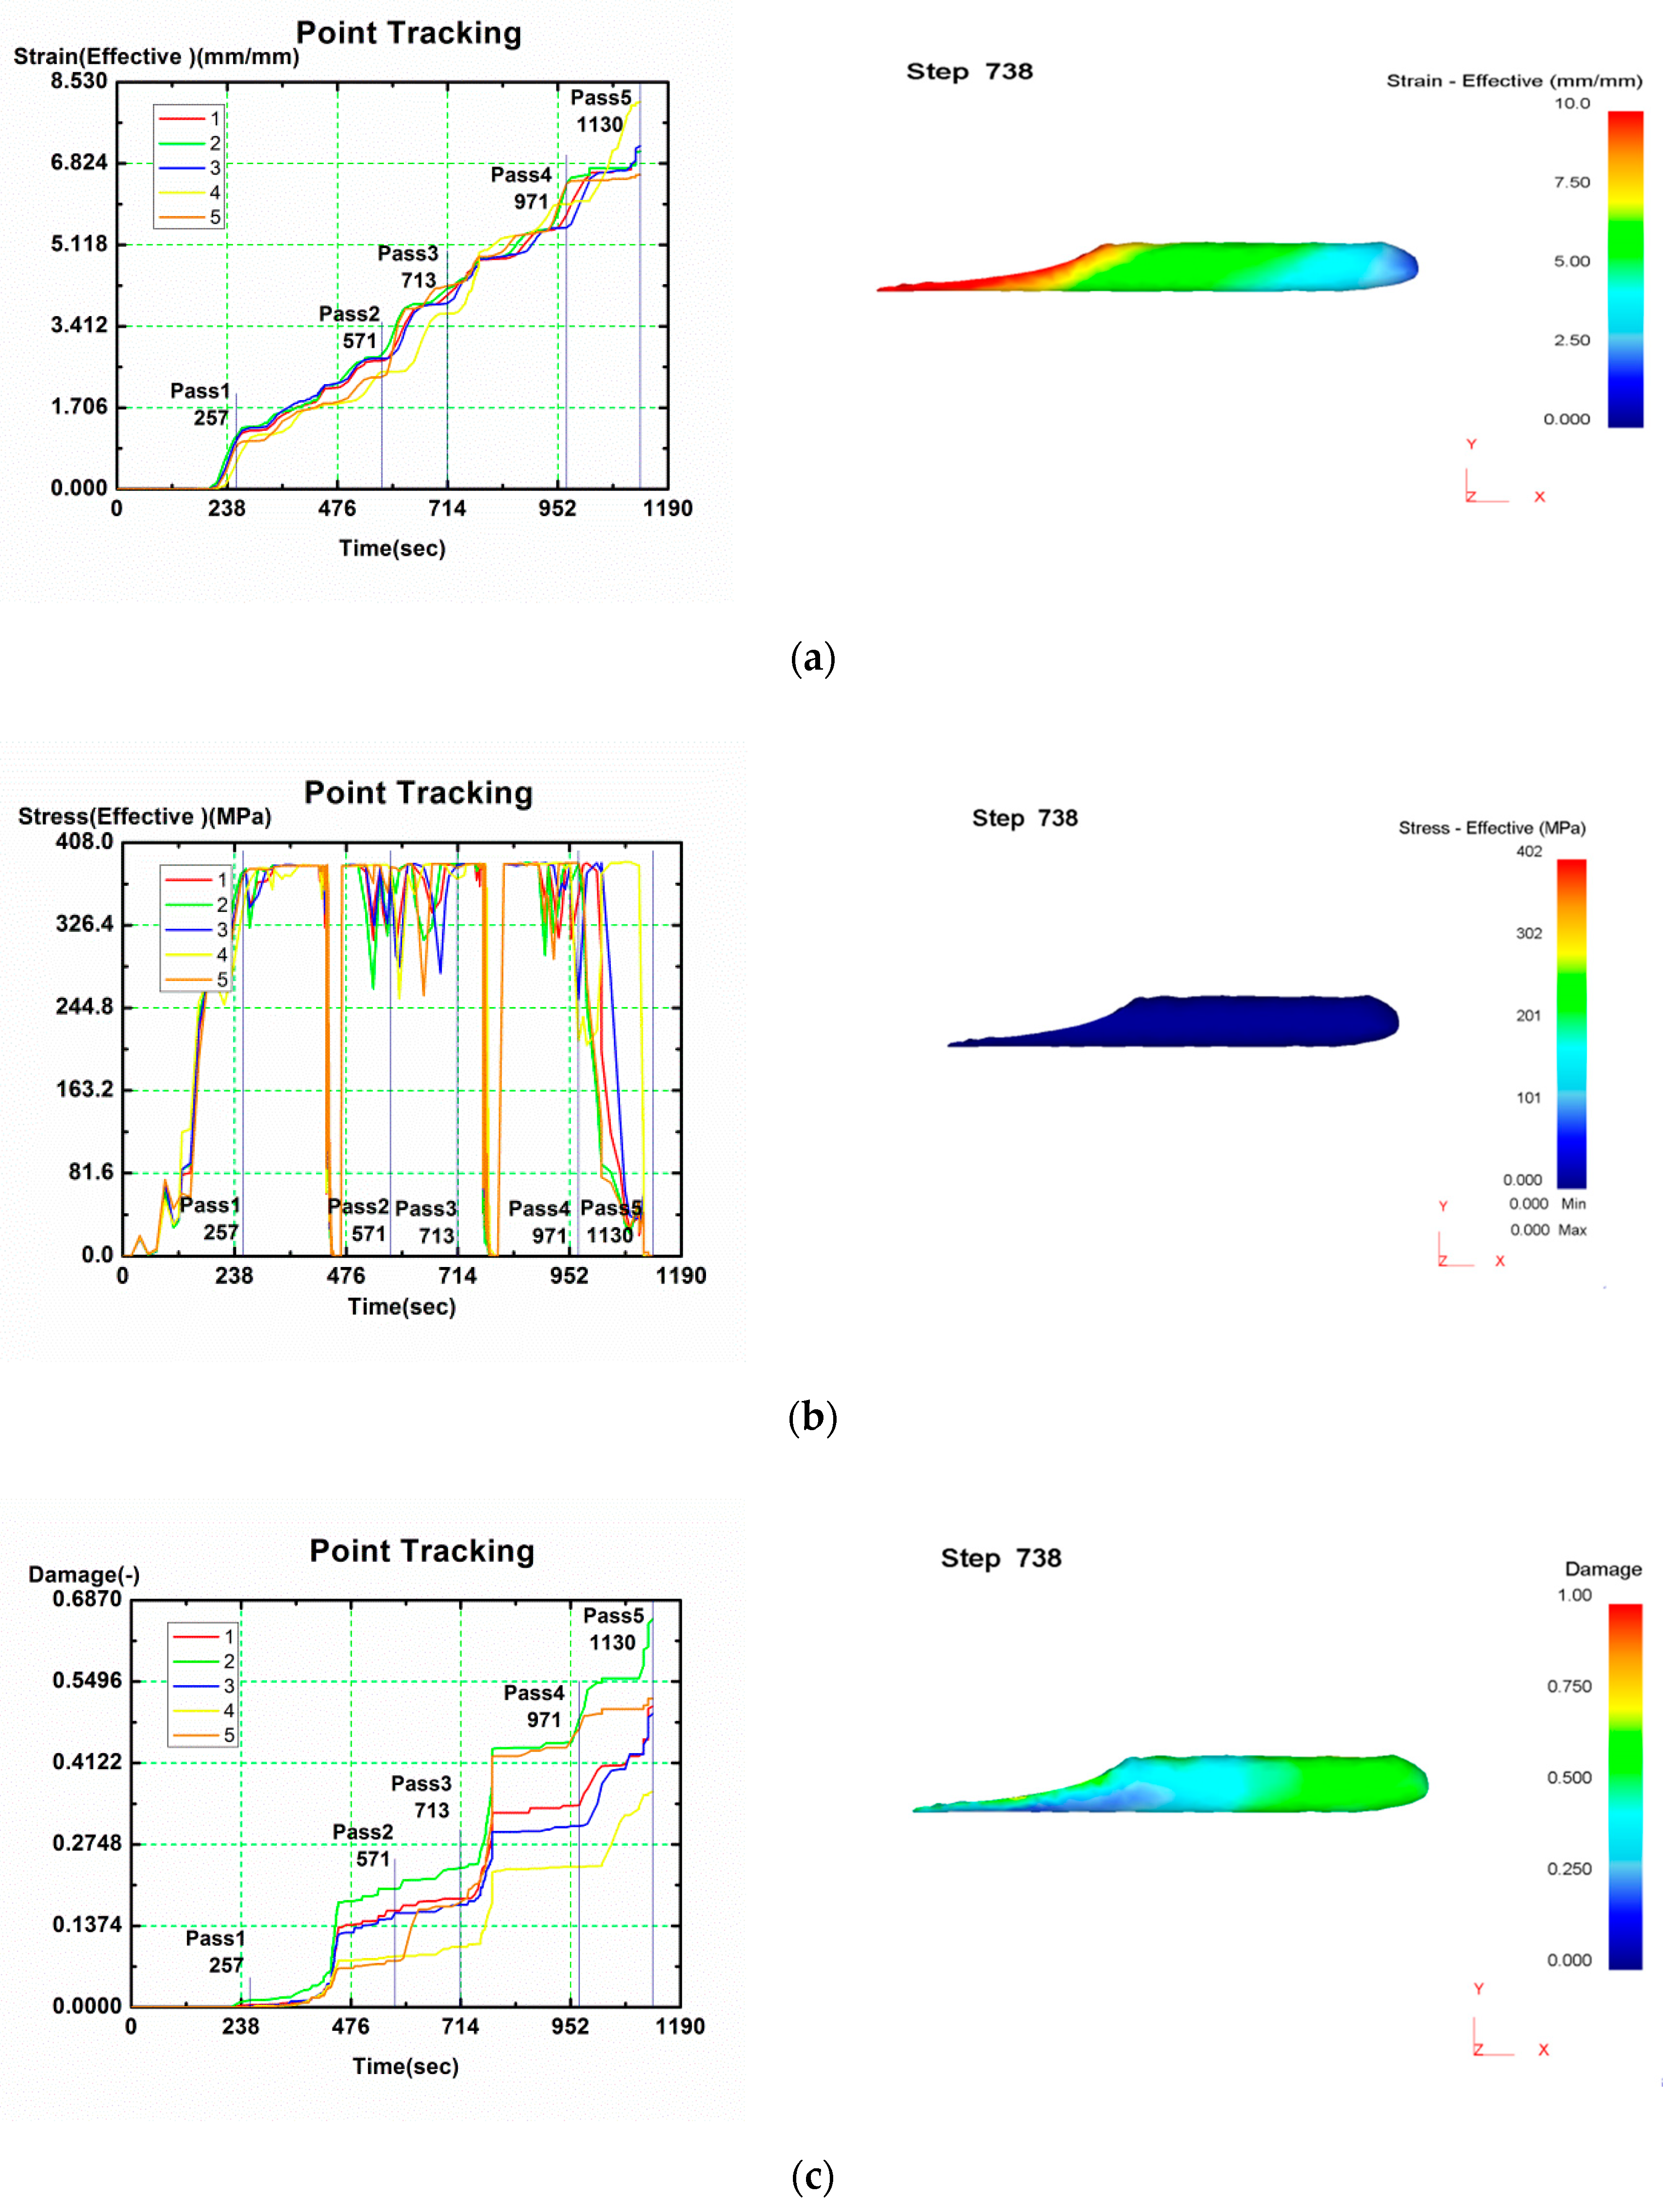
The evolution results of the five tracking points, including the effective strain, the effective stress and the damage variable after 5 passes, were output and are shown in Figure 6a–c respectively. The four output parameters for the optimized channel are summarized in Table 7.

4.3. Extruding Aluminum Alloy 2024 with HCAP-PC

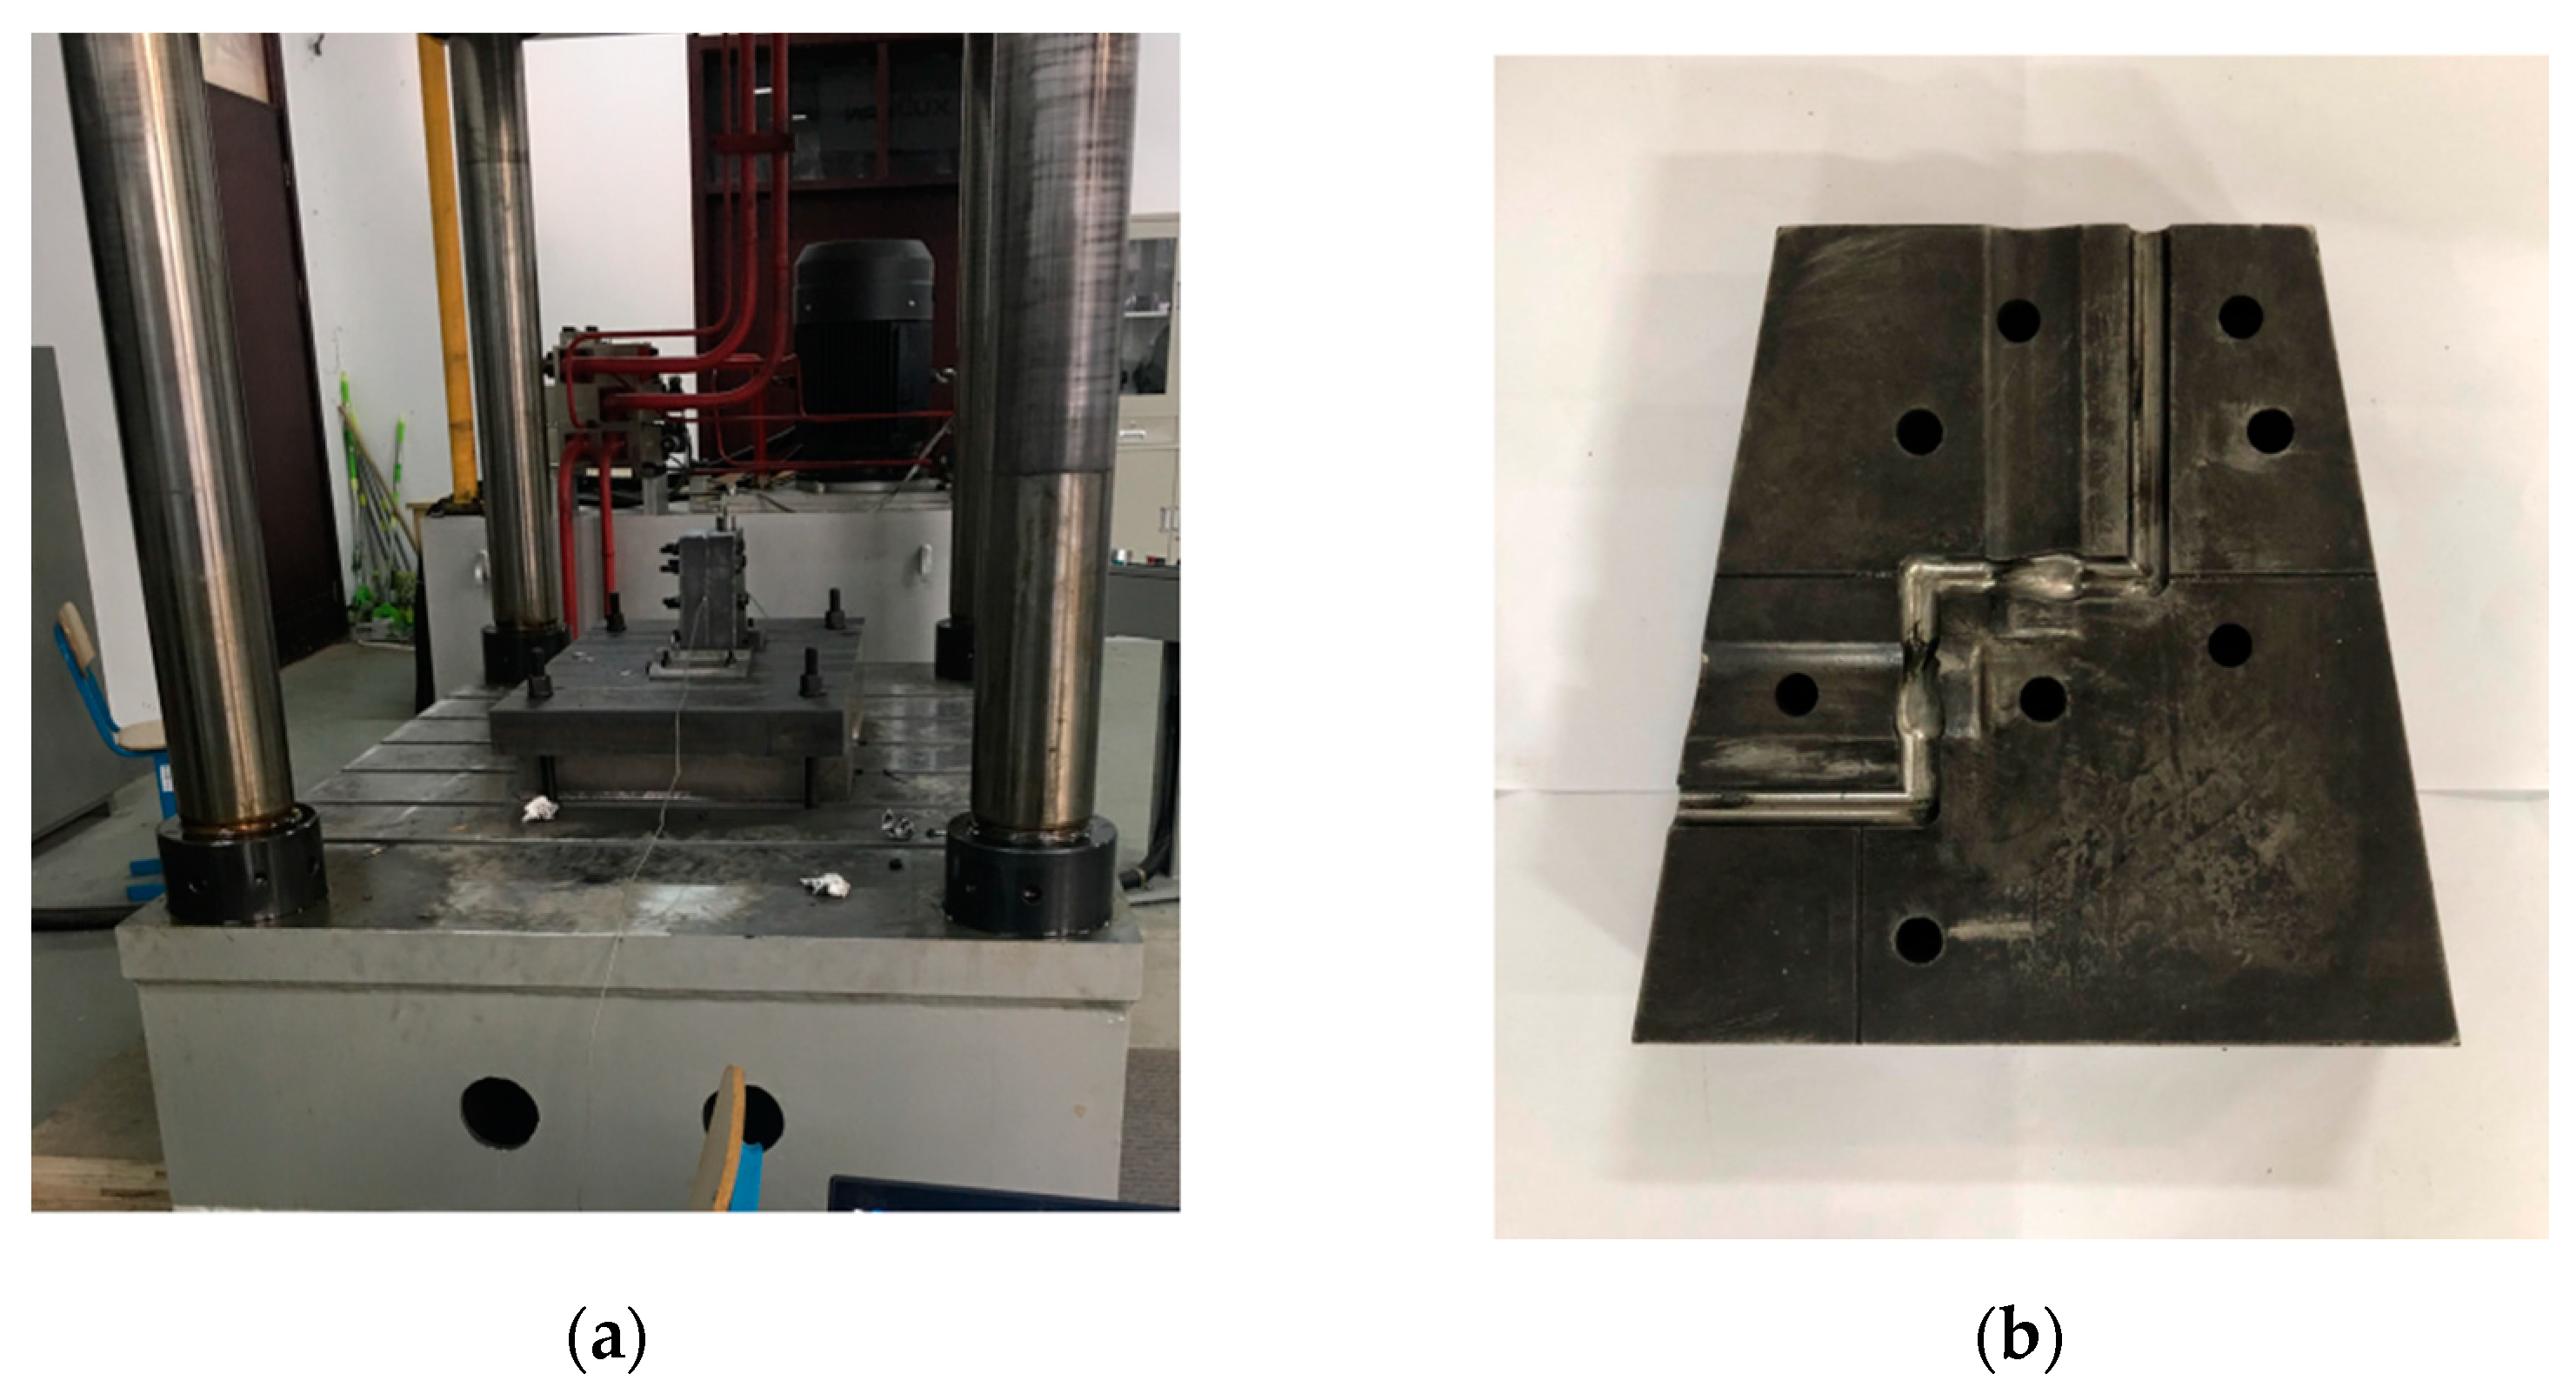
According to the optimized channel parameters, the HCAP-PC die with the geometries of ψ 20°, ϕ 90°, γ 73°, m 1.35, L1/L3 1d was manufactured. The hydraulic press and the HCAP-PC die set-up are shown in Figure 7.
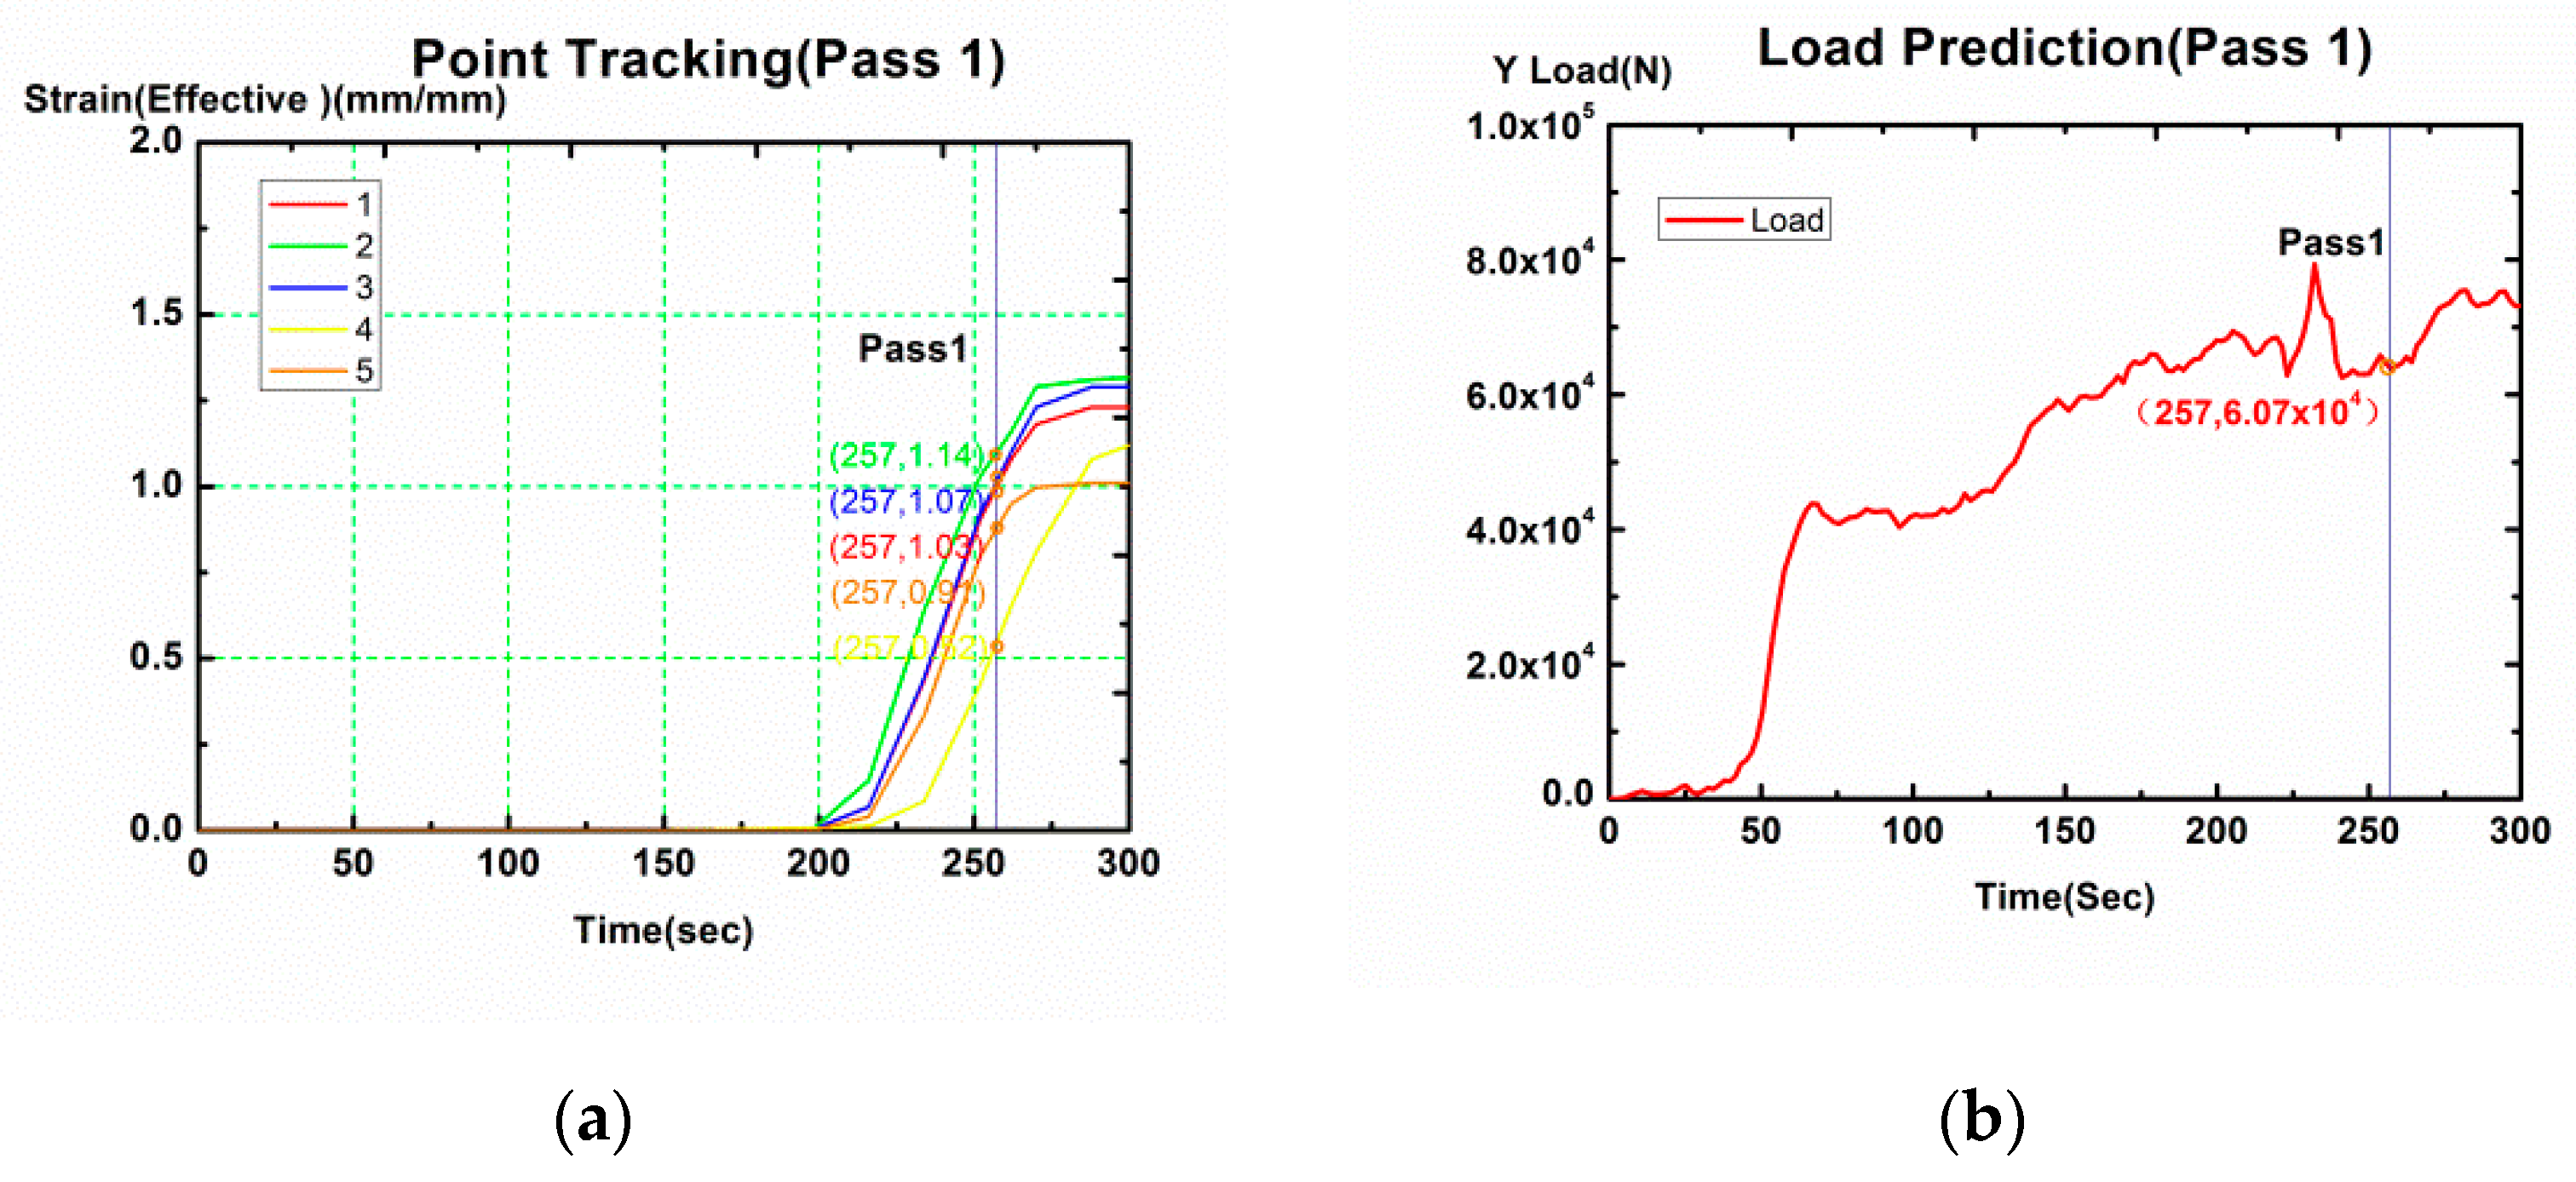
The deformed sample in the experimental work and simulation analysis after pass 1 are shown in Figure 8. The simulation effective strain is collected by the same strategy as mentioned in Figure 5a. The spots on the cross-section are the same as those in Figure 5b. If the punch force in the simulation meets that in the experiment at the same punch position well, the parameters used in the simulation are considered as optimal [7]. After pass 1, the pressing load magnitudes obtained by the experimental work shown on the hydraulic press and the simulation results are 5.96 × 10⁴ N and 6.07 × 10⁴ N in Figure 9b, respectively. Equation (11) represents the effective strain imposed to the sample during the ECAP process. The magnitude of effective strain after N passes is given by the following relationship [21]:
ε e q = N 3 1 / 2 [ 2 cot ( ( ϕ + ψ ) 2 ) + ψ cos ec ( ( ϕ + ψ ) 2 ) ] ,
where N, ϕ , ψ are 1, 90° and 20°, respectively. The simulation results (Figure 9a) and the magnitude of the effective strain calculated by Equation (11) are 0.934 and 0.887, respectively. There is a 5% discrepancy between the experimental and the numerical results, which for all practical purposes is acceptable. Good agreement between experiment and simulation has been achieved.
To understand the level of grain refinement and the deformation characteristics before and after HCAP-PC, the further extrusion was carried out and the grain sizes were observed. The entire extrusion was completed within 120 min. Compared with the conventional single channel process of 4 passes 13.58 h, two turns ECAP of 4 passes at 7.68 h and three turns ECAP of 4 passes at 6.78 h were investigated by Atul Dayal [5], the average processing time was cut down in this work. The age hardening does not take extra effect on the plastic deformation because the alloy used in this work had more than 300 min aging time. The further processing extrusion had an even greater influence on the grain size and distribution. The grain sizes after HCAP-PC were observed with transmission electron microscopy (TEM) and the grain size distribution was calculated as shown in Figure 10. Compared with the original average grain size of 70.5 µm (Figure 4), the measured average grain size after the pass 5 was 295 nm. Figure 10b has shown the histograms variation of the grain size distribution and frequency after HCAP-PC processed samples and the population of grains with a size of <300 nm reaches the value close to 55%, and the maximum diameter of grains is 700 nm.

5. Conclusions

The HCAP-PC process is proposed to improve extrusion efficiency and reduce time consumption during the processing of age-hardening aluminum alloys. The round bar can be rotated 90° in the channel during the extrusion process. The HCAP-PC process consists of three angular channels and two helical channels. After one pressing, the sample exhibits 3 passes ECAP and 2 passes of twist extrusions. For two 90° rotations in the same direction, the BC route is obtained to improve the deformation homogeneity. The accumulated plastic strain obtained is approximately 7–8. The grain sizes were refined from 70.5 µm to 700 nm. No further machinery processing was required.
The L16-4-5 orthogonal array containing five factors and four levels was established to estimate the influence rules of the channel parameters. Considering the account of accumulated plastic strain and the deformation homogeneity, the five channel parameters were extracted; those were the channel angle ϕ , the curvature angle ψ , the lead angle γ , the elliptical factor m , the length of straight channel L1. Four levels were chosen for each of the five factors. Then, 16 orthogonal array simulations were conducted. The GRA method was applied to present the significant channel parameters which affect the extrusion process. According to the segregated grey relational grade, the contribution order of the channel parameters was ψ > ϕ > γ > m > L1. Taking into account the contribution order, the optimal channel parameters were predicted to be 20° ψ , 90° ϕ , 73° γ , 1.35 m and 1 d respectively. ϕ and ψ have greater effect on the transiting action of the angular channels and γ and m have taken more effect on the flowing action of the helical channel. Aluminum alloy 2024 after solution treatment was extruded using the HCAP-PC die and bulk ultrafine-grained material without damage was obtained for age-hardened aluminum alloys. The process time was decreased to less than 120 min.

Author Contributions

Conceptualization, M.H. and Q.W.; methodology, M.H.; Formal analysis, Q.W.; writing—original draft preparation, M.H. and Q.W.; writing—review and editing, F.Y., D.S.; funding acquisition, M.H. and D.S. All authors have read and agreed to the published version of the manuscript.

Funding

This research was funded by National Natural Science Foundation of China, grant number 51401177, Natural Science Foundation of Jiangsu Higher Education Institution of China, grant number 17KJA460010, Jiangsu “333 Project”, grant number BRA2020248, and Xuzhou Science and Technology Project, grant number KC20189.

Acknowledgments

The authors would like to acknowledge the assistance of Jiangsu Overseas Visiting Scholar Program and Sridhar Komarneni at Material Research Institute of The Pennsylvania State University for this investigation.

Conflicts of Interest

The authors declare no conflict of interest.

References

  1. Langdon, T.G. Research on bulk nanostructured materials in Ufa: Twenty years of scientific achievements. Mater. Sci. Eng. A 2009, 503, 6–9. [Google Scholar] [CrossRef]
  2. Nishida, Y.; Arima, H.; Kim, J.C.; Ando, T. Rotary-die equal-channel angular pressing of an Al-7 mass% Si-0.35 mass% Mg alloy. Scr. Mater. 2001, 45, 261–266. [Google Scholar] [CrossRef]
  3. Zhilyaev, A.; Swisher, D.; Oh-Ishi, K.; Langdon, T.; McNelley, T.R. Microtexture and microstructure evolution during processing of pure aluminum by repetitive ECAP. Mater. Sci. Eng. A 2006, 429, 137–148. [Google Scholar] [CrossRef] [Green Version]
  4. Venkatachalam, P.; Kumar, S.R.; Ravisankar, B.; Paul, V.T.; Vijayalakshmi, M. Effect of processing routes on microstructure and mechanical properties of 2014 Al alloy processed by equal channel angular pressing. Trans. Nonferrous Met. Soc. China 2010, 20, 1822–1828. [Google Scholar] [CrossRef]
  5. Dayal, A.; Raj, K.H.; Sharma, R.S. Investigation of ECAP process for enhancing process efficiency. Mater. Today Proc. 2018, 5, 878–884. [Google Scholar] [CrossRef]
  6. Kocich, R.; Kunčická, L.; Mihola, M.; Skotnicová, K. Numerical and experimental analysis of twist channel angular pressing (TCAP) as a SPD process. Mater. Sci. Eng. A 2013, 563, 86–94. [Google Scholar] [CrossRef]
  7. Djavanroodi, F.; Ebrahimi, M. Effect of die parameters and material properties in ECAP with parallel channels. Mater. Sci. Eng. A 2010, 527, 7593–7599. [Google Scholar] [CrossRef]
  8. Cerri, E.; De Marco, P.; Leo, P. FEM and metallurgical analysis of modified 6082 aluminium alloys processed by multipass ECAP: Influence of material properties and different process settings on induced plastic strain. J. Mater. Process. Technol. 2009, 209, 1550–1564. [Google Scholar] [CrossRef]
  9. Latypov, M.I.; Alexandrov, I.; Beygelzimer, Y.; Lee, S.; Kim, H.S. Finite element analysis of plastic deformation in twist extrusion. Comput. Mater. Sci. 2012, 60, 194–200. [Google Scholar] [CrossRef]
  10. Kulagin, R.; Latypov, M.I.; Kim, H.S.; Varyukhin, V.; Beygelzimer, Y. Cross flow during twist extrusion: Theory, experiment, and application. Met. Mater. Trans. A 2013, 44, 3211–3220. [Google Scholar] [CrossRef] [Green Version]
  11. Mani, B.; Jahedi, M.; Paydar, M.H. Consolidation of commercial pure aluminum powder by torsional-equal channel angular pressing (T-ECAP) at room temperature. Powder Technol. 2012, 219, 1–8. [Google Scholar] [CrossRef]
  12. Sahai, A.; Raj, K.H.; Gupta, N. Mechanical Behaviour and Surface Profile Analysis of Al6061 alloy Processed by Equal Channel Angular Extrusion. Procedia Eng. 2017, 173, 956–963. [Google Scholar] [CrossRef]
  13. Acır, A.; Canlı, M.E.; Ata, I.; Çakıroğlu, R. Parametric optimization of energy and exergy analyses of a novel solar air heater with grey relational analysis. Appl. Therm. Eng. 2017, 122, 330–338. [Google Scholar] [CrossRef]
  14. Baruah, A.; Pandivelan, C.; Jeevanantham, A. Optimization of AA5052 in incremental sheet forming using grey relational analysis. Measurement 2017, 106, 95–100. [Google Scholar] [CrossRef]
  15. Turgut, E.; Çakmak, G.; Yıldız, C. Optimization of the concentric heat exchanger with injector turbulators by Taguchi method. Energy Convers. Manag. 2012, 53, 268–275. [Google Scholar] [CrossRef]
  16. Pandey, R.K.; Panda, S. Optimization of bone drilling parameters using grey-based fuzzy algorithm. Measurement 2014, 47, 386–392. [Google Scholar] [CrossRef]
  17. Dadbakhsh, S.; Taheri, A.K.; Smith, C. Strengthening study on 6082 Al alloy after combination of aging treatment and ECAP process. Mater. Sci. Eng. A 2010, 527, 4758–4766. [Google Scholar] [CrossRef]
  18. Kim, W.; Chung, C.; Ma, D.; Hong, S.; Kim, H. Optimization of strength and ductility of 2024 Al by equal channel angular pressing (ECAP) and post-ECAP aging. Scr. Mater. 2003, 49, 333–338. [Google Scholar] [CrossRef]
  19. Cockroft, M.G.; Latham, D.J. Ductility and the Workability of Metals. J. Inst. Metals 1968, 96, 33–39. [Google Scholar]
  20. He, M.; Li, F.; Ali, N. A normalized damage variable for ductile metals based on toughness performance. Mater. Sci. Eng. A 2011, 528, 832–837. [Google Scholar] [CrossRef]
  21. Iwahashi, Y.; Wang, J.; Horita, Z.; Nemoto, M.; Langdon, T.G. Principle of equal-channel angular pressing for the processing of ultra-fine grained materials. Scr. Mater. 1996, 35, 143–146. [Google Scholar] [CrossRef]
Figure 1. Schematic diagram of helical channel angular pressing-parallel channel (HCAP-PC) process.
Metals 10 01594 g001
Figure 2. Construction of the helical channel.
Metals 10 01594 g002
Figure 3. Principle and parameters of the circular helix equation.
Metals 10 01594 g003
Figure 4. Microstructure of aluminum alloy 2024 after solid solution treatment: (a) optical microstructure (b) grain size distribution.
Metals 10 01594 g004
Figure 5. Schematic diagram of tracking points: (a) vertical section presented the location of tracking points, (b) cross-section presented the location of tracking points.
Metals 10 01594 g005
Figure 6. Simulation results of tracking points for optimized channel geometry model: (a) effective strain; (b) effective stress; (c) damage.
Metals 10 01594 g006
Figure 7. HCAP-PC set-up for experimental work: (a) hydraulic press and (b) HCAP-PC die with the channel angle of 90° and curvature corner of 20°.
Metals 10 01594 g007
Figure 8. Experimental and simulated HCAP-PCed samples after Pass 1: (a) experimental result; (b) simulated result.
Metals 10 01594 g008
Figure 9. Simulation results of HCAP-PC samples after Pass 1: (a) effective strain; (b) load.
Metals 10 01594 g009
Figure 10. Microstructure of cross-section and corresponding grain size distribution: (a) transmission electron microscopy (TEM) bright field images after HCAP-PC; (b) grain size distribution.
Metals 10 01594 g010
Table 1. L16-5-4 orthogonal array of five factors and four levels.
Five Factors ϕ (°) ψ (°) γ (°) m L1
Four Levels90,100,
110,120
10,20,
30,40
60,67,
73,80
1.2,1.25,
1.35,1.4
1d,1.17d,
1.32d,1.5d
Test No.
19010601.21 d
29020671.251.17 d
39030731.351.32 d
49040801.41.5 d
510010671.351.5 d
610020601.41.32 d
710030801.21.17 d
810040731.251 d
911010731.41.17 d
1011020801.351 d
1111030601.251.5 d
1211040671.21.32 d
1312010801.251.32 d
1412020731.21.5 d
1512030671.41 d
1612040601.351.17 d
d is the diameter of cylinder sample.
Table 2. Chemical composition of 2024 aluminum alloy wt.%.
CuMgMnFeSiZnTiCrAl
4.21.30.60.50.50.250.150.1Bal.
Table 3. Mechanical properties of 2024 aluminum alloy.
E σ 0 σ b δ A
66 GPa95 MPa177 MPa33.729.4
Table 4. Sixteen results of four output parameters based on orthogonal array.
No.Effective StrainDamage
Indicator
Effective Stress (MPa)Deformation Homogeneity Coefficient (DHC)
18.77940.4705388.350.4510
26.98160.5727386.860.1874
37.1710.8286388.030.0867
46.4440.6584387.770.0907
54.24430.1774386.890.0896
66.49820.1934387.570.3820
74.25190.4982387.120.0962
85.20120.4858387.540.1100
95.65060.434387.640.0676
104.59220.3971387.270.0761
116.00530.5357387.650.1332
124.68020.5334387.280.1932
133.48610.5405386.790.0795
143.79790.5586386.850.0854
155.58610.4655387.690.0701
166.97670.5272388.210.0715
Table 5. Grey relational coefficients and grey relational grades.
No.Grey Relational GenerationGrey Relational Coefficients
ζ t ( n )
Grey Relational Grades
λ ( n )
Normalized Effective Strain
X 1 ( n )
Normalized Damage
X 2 ( n )
Normalized Effective Stress
X 3 ( n )
Normalized DHC
X 4 ( n )
Optimal Normalized Value
X t ( 0 )
Effective Strain
ζ 1 ( n )
Damage
ζ 2 ( n )
Effective Stress
ζ 3 ( n )
DHC
ζ 4 ( n )
110.549900.1020110.52630.33330.35770.5543
20.66040.39300.95510.268810.59550.45170.91760.40610.5927
30.696100.20510.087310.62200.33330.38610.35390.4238
40.55880.26140.3718010.53120.40370.44320.33330.4279
50.143210.9359110.368510.886410.8137
60.56900.97540.50.921110.53710.95320.50.86370.7135
70.14470.50740.78850.149510.36890.50370.70270.37020.4864
80.32400.52640.51920.359610.42520.51360.50980.43850.4718
90.40890.60600.45510.283810.45830.55930.47850.41110.4768
100.20900.66260.69230.170910.38730.597100.61900.37620.4949
110.47590.44980.44870.496710.48820.47610.47560.49830.4846
120.22560.45330.68590.464410.39230.47770.61420.48280.4918
1300.442410.251810.33330.472810.40060.5517
140.05890.41460.96150.310510.34700.46070.92860.42030.5391
150.39670.55760.42310.720710.45320.53060.46430.64160.5224
160.65940.46280.08970.805410.59480.48210.35450.71990.5378
Table 6. Segregated grey relational grades and rank of contribution for multi factors.
Segregated Grey Relational Grade Λ f ( l ) S S ( f ) Contribution Order
l l 1 l 2 l 3 l 4
f
ϕ 0.58090.63960.58310.64030.00342
ψ 0.66180.63510.58230.56480.00611
γ 0.57240.64100.60410.62650.00273
m0.58610.61130.64840.59820.00224
L10.59100.62080.59100.64120.00185
Table 7. Output parameters for optimized die.
Effective StrainDamageEffective Stress (MPa)Deformation Homogeneity Coefficient
7.20980.5085388.22510.2131
Publisher’s Note: MDPI stays neutral with regard to jurisdictional claims in published maps and institutional affiliations.