Article

Effect of Alloying Mn by Selective Laser Melting on the Microstructure and Biodegradation Properties of Pure Mg

1
School of Materials Science and Engineering, Central South University, Changsha 410083, China
2
Centre for Advanced Materials Processing and Manufacturing (AMPAM), School of Mechanical and Mining Engineering, University of Queensland, Brisbane, QLD 4072, Australia
*
Author to whom correspondence should be addressed.
Metals 2020, 10(11), 1527; https://doi.org/10.3390/met10111527
Submission received: 9 October 2020 / Revised: 12 November 2020 / Accepted: 13 November 2020 / Published: 18 November 2020

Abstract

:
This work studied the effect of alloying Mn by selective laser melting on the microstructure and biodegradation properties of pure Mg. The grains in the microstructure were quasi-polygon in shape. The average grain size was similar (~10 μm) for the SLMed Mg-xMn with different Mn contents. The XPS spectra of the corrosion surface showed that alloying Mn into Mg by SLM produced a relatively protective manganese oxide film, which contributed to decreasing the biodegradation rate. All the results of the electrochemistry test, immersion test and the corrosion surface morphologies coincided well. The SLMed Mg-0.8Mn had the lowest biodegradation rate. When Mn content was more than 0.8 wt.%, the influence of the undissolved Mn phase on the decrease of the biodegradation resistance counteracted the influence of the relatively protective manganese oxide layer on the increase of the biodegradation resistance.

Graphical Abstract

1. Introduction

In recent years, Mg alloys are attracting much attention as novel biodegradable metallic implant materials in orthopedical and cardiovascular applications, due to their compatible density and elastic modulus to those of human natural bone and good biocompatibility [1,2,3]. However, their inherently rapid corrosion rate restricts their wider medical application, which causes loss of mechanical integrity and inadequate service performance [4]. One approach to control the corrosion rate of Mg alloys is to add some essential nontoxic alloying elements into the Mg substrate [5,6,7].
Mn is one of the essential trace elements in the human body. Appropriate Mn content can promote the growth and development of bones and improve the hematopoietic function of the body [8]. Hence alloying Mn into Mg may provide an alloy with good prospects for biomedical applications, when the degradation and the toxicity is taken into consideration. So far, much work has shown that Mg alloys containing Mn have enhanced corrosion resistance [5,9,10,11,12,13,14]. Gu et al. demonstrated that as-cast Mg-1Mn had better strength and corrosion resistance than as-cast Mg [5]. Yang et al. proposed that Mg-2Mn is a potential candidate for future bone implants [9]. Ha et al. reported that alloying Mn into extruded Mg-8Sn-1Zn-1Al improved corrosion resistance [10]. The following mechanisms have been proposed by which Mn increases corrosion resistance: (i) the grain refinement of the Mg alloy induced by alloying with Mn [11], (ii) the increase of corrosion potential by dissolving the more noble Mn into the Mg alloy [12], (iii) transforming Fe and other impurities into harmless intermetallic compounds and thereby decreasing local galvanic corrosion [13], and (iv) promoting the formation of the corrosion products in the absence of Mn products [14]. However, further extensive study is still needed. Pure Mg has a lower corrosion rate than most Mg alloys, which means that except for the grain refinement contribution to corrosion resistance, other factors must play a role in corrosion resistance, because alloying of almost any element into the Mg substrate can refine grain size due to the pinning effect of alloying elements, but may cause a different effect on the corrosion resistance from Mn. Given the concerns on the solid solution contribution of Mn to the corrosion resistance, alloying Mn into an Mg substrate with the hypothesis that beyond the solid solubility limit, Mn will precipitate in the Mg matrix, which will not only enhance mechanical properties but also increase the degradation rate by forming local galvanic cells. For high-purity Mg, Fe and other impurities as harmless intermetallic compounds are negligible, and the contribution of Mn in promoting formation the other alloyed corrosion products in the absence of Mn products are also negligible. In these cases, an understanding of the contribution of alloying Mn to the corrosion resistance of Mg needs further investigation.
This work attempts to clarify this aspect using Mg-xMn alloys (x = 0, 0.4, 0.8, 1.2 and 1.6 wt.%) prepared by selective laser melting (SLM) using high purity Mg powders and Mn powders.

2. Experiments

High purity Mn powder (D10 ≈ 7 μm, D50 ≈ 13 μm, D90 ≈ 16 μm, purity 99.99%, Naiou Nano technology Co., Ltd., Shanghai, China) with irregular shape were mixed with high purity spherical Mg powders (D10 ≈ 30 μm, D50 ≈ 74 μm, D90 ≈ 100 μm, purity 99.99%, Naiou Nano technology Co., Ltd., Shanghai, China). The resultant Mg-xMn powders (x = 0, 0.4, 0.8, 1.2 and 1.6 wt.%) were designated as Mg, Mg-0.4Mn, Mg-0.8Mn, Mg-1.2Mn, and Mg-1.6Mn, respectively, and were ground using ball mills for 3 h under the protection of SF6 and CO2 atmospheres. The Mg-xMn alloys were fabricated by a self-regulated SLM system [9,15] as shown in Figure 1a, which consisted of a fiber laser, three-dimensional motion platform, a working platform, an argon gas protection system, and a computer control system. The laser power was controlled by the computer control system. The scanning line, scanning pitch and scanning speed were determined by the X-axial and Y-axial movement of the motion platform, which was also controlled by the computer control system. The laser power and the scanning speed were carefully optimized to prevent the laser energy density from becoming over high. The optical system had a focal distance of 160 mm with a spot size of 50 µm, and the laser spot size could be adjusted by changing the distance between the scanning region and lens. High purity argon gas was fed into the sealed building chamber before the experiments, and circulated to ensure the chamber filled with argon gas during the process to prevent the Mg powder from oxidating or flaming. A thin powder layer was then paved onto the substrate, and was scanned with an “S” line by the laser beam spot afterwards. The samples were built up layer-by-layer with the scanning lines of upper and lower layers interlaced as demonstrated in Figure 1b–d. The layer thickness was controlled by the Z-axial movement of the motion platform. The process parameters were optimized based on our previous work [16] and listed in Table 1. Samples with a diameter of 6 mm and a height of 5 mm were built up, with built layers set up to 100. The relative densities of the pure Mg, Mg-0.4Mn, Mg-0.8Mn, Mg-1.2Mn and Mg-1.6Mn were 96.4, 96.5, 96.3, 96.2 and 96.3%, respectively, measured using Archimedes’ principle.
Specimens for microstructure characterization were successively ground with SiC sand papers down to 2000 grit, polished with diamond polishing paste, ultrasonic cleaned in acetone and then in distilled water, and etched with a Nital (3 wt%) for 20 s. The microstructures were characterized using optical microscopy (OM, Leica DMI 3000 L, Wetzla, Germany), and X-ray diffraction (XRD, Rigaku D/Max 2500, Tokyo, Japan) with Cu Kα radiation generated at 40 kV and 250 mA radiation with 2θ from 30° to 80° at a scanning rate of 8° min−1.
Potentiodynamic polarization tests and immersion tests were performed at 37 ± 0.5 °C in the Hanks’ solution with the compositions: NaCl 8.0 g L−1, D-Glucose 1.0 g L−1, KCl 0.4 g L−1, NaHCO3 0.35 g L−1, CaCl2 0.14 g L−1, MgSO4·7H2O 0.2 g L−1, Na2HPO4·12H2O 0.12 g L−1, KH2PO4 0.06g L−1. The pH value of the Hanks’ solution was adjusted to 7.6. The samples (exposed surface area of 1 cm2 in contact with the electrolyte) for the corrosion evaluation (including potentiodynamic polarisation curves and immersion mass loss) were mechanically ground to 1200 grit SiC paper, washed with distilled water and dried with warm flowing air. An electrochemical workstation with a three-electrode cell (Metrohm Multi AutolabM204, Herisau, Swiss) was used to measure potentiodynamic polarization curves, in which the sample acted as the working electrode, a platinum foil acted as the counter electrode and a saturated calomel electrode (SCE) acted as the reference electrode. The potential was recorded with a scanning rate of 1 mV/s versus the open circuit potential (OCP) which was determined after the OCP was stable. The biodegradation rate, Pi (mm year−1), was evaluated from the corrosion current density, icorr (current density) (mA cm−2), using the conversion Pi = 22.85 icorr [17]. Immersion tests were conducted for 168 h. The ratio of surface area/solution volume was 1.25 cm2/mL according to ISO10993 [18]. After immersion tests, the samples were cleaned by chromic acid solution (300 g/L Cr2O3 + 10 g/L AgNO3) to remove the surface corrosion products, and then were weighed. The biodegradation rate, Pw (mm year−1), was evaluated from the weight loss rate, ΔW (mg cm−2 d−1) using the conversion Pw = 2.1 ΔW [17]. The corrosion surfaces after immersion in the Hanks’ solution for 48 h were observed using scanning electron microscopy (SEM, FEI FEG Quanta-200, Hillsboro, OR, USA), and the surface products were examined by X-ray photoelectron spectroscopy (XPS, ThermoFisher ESCALAB 250Xi, Waltham, MA, USA).

3. Results and Discussion

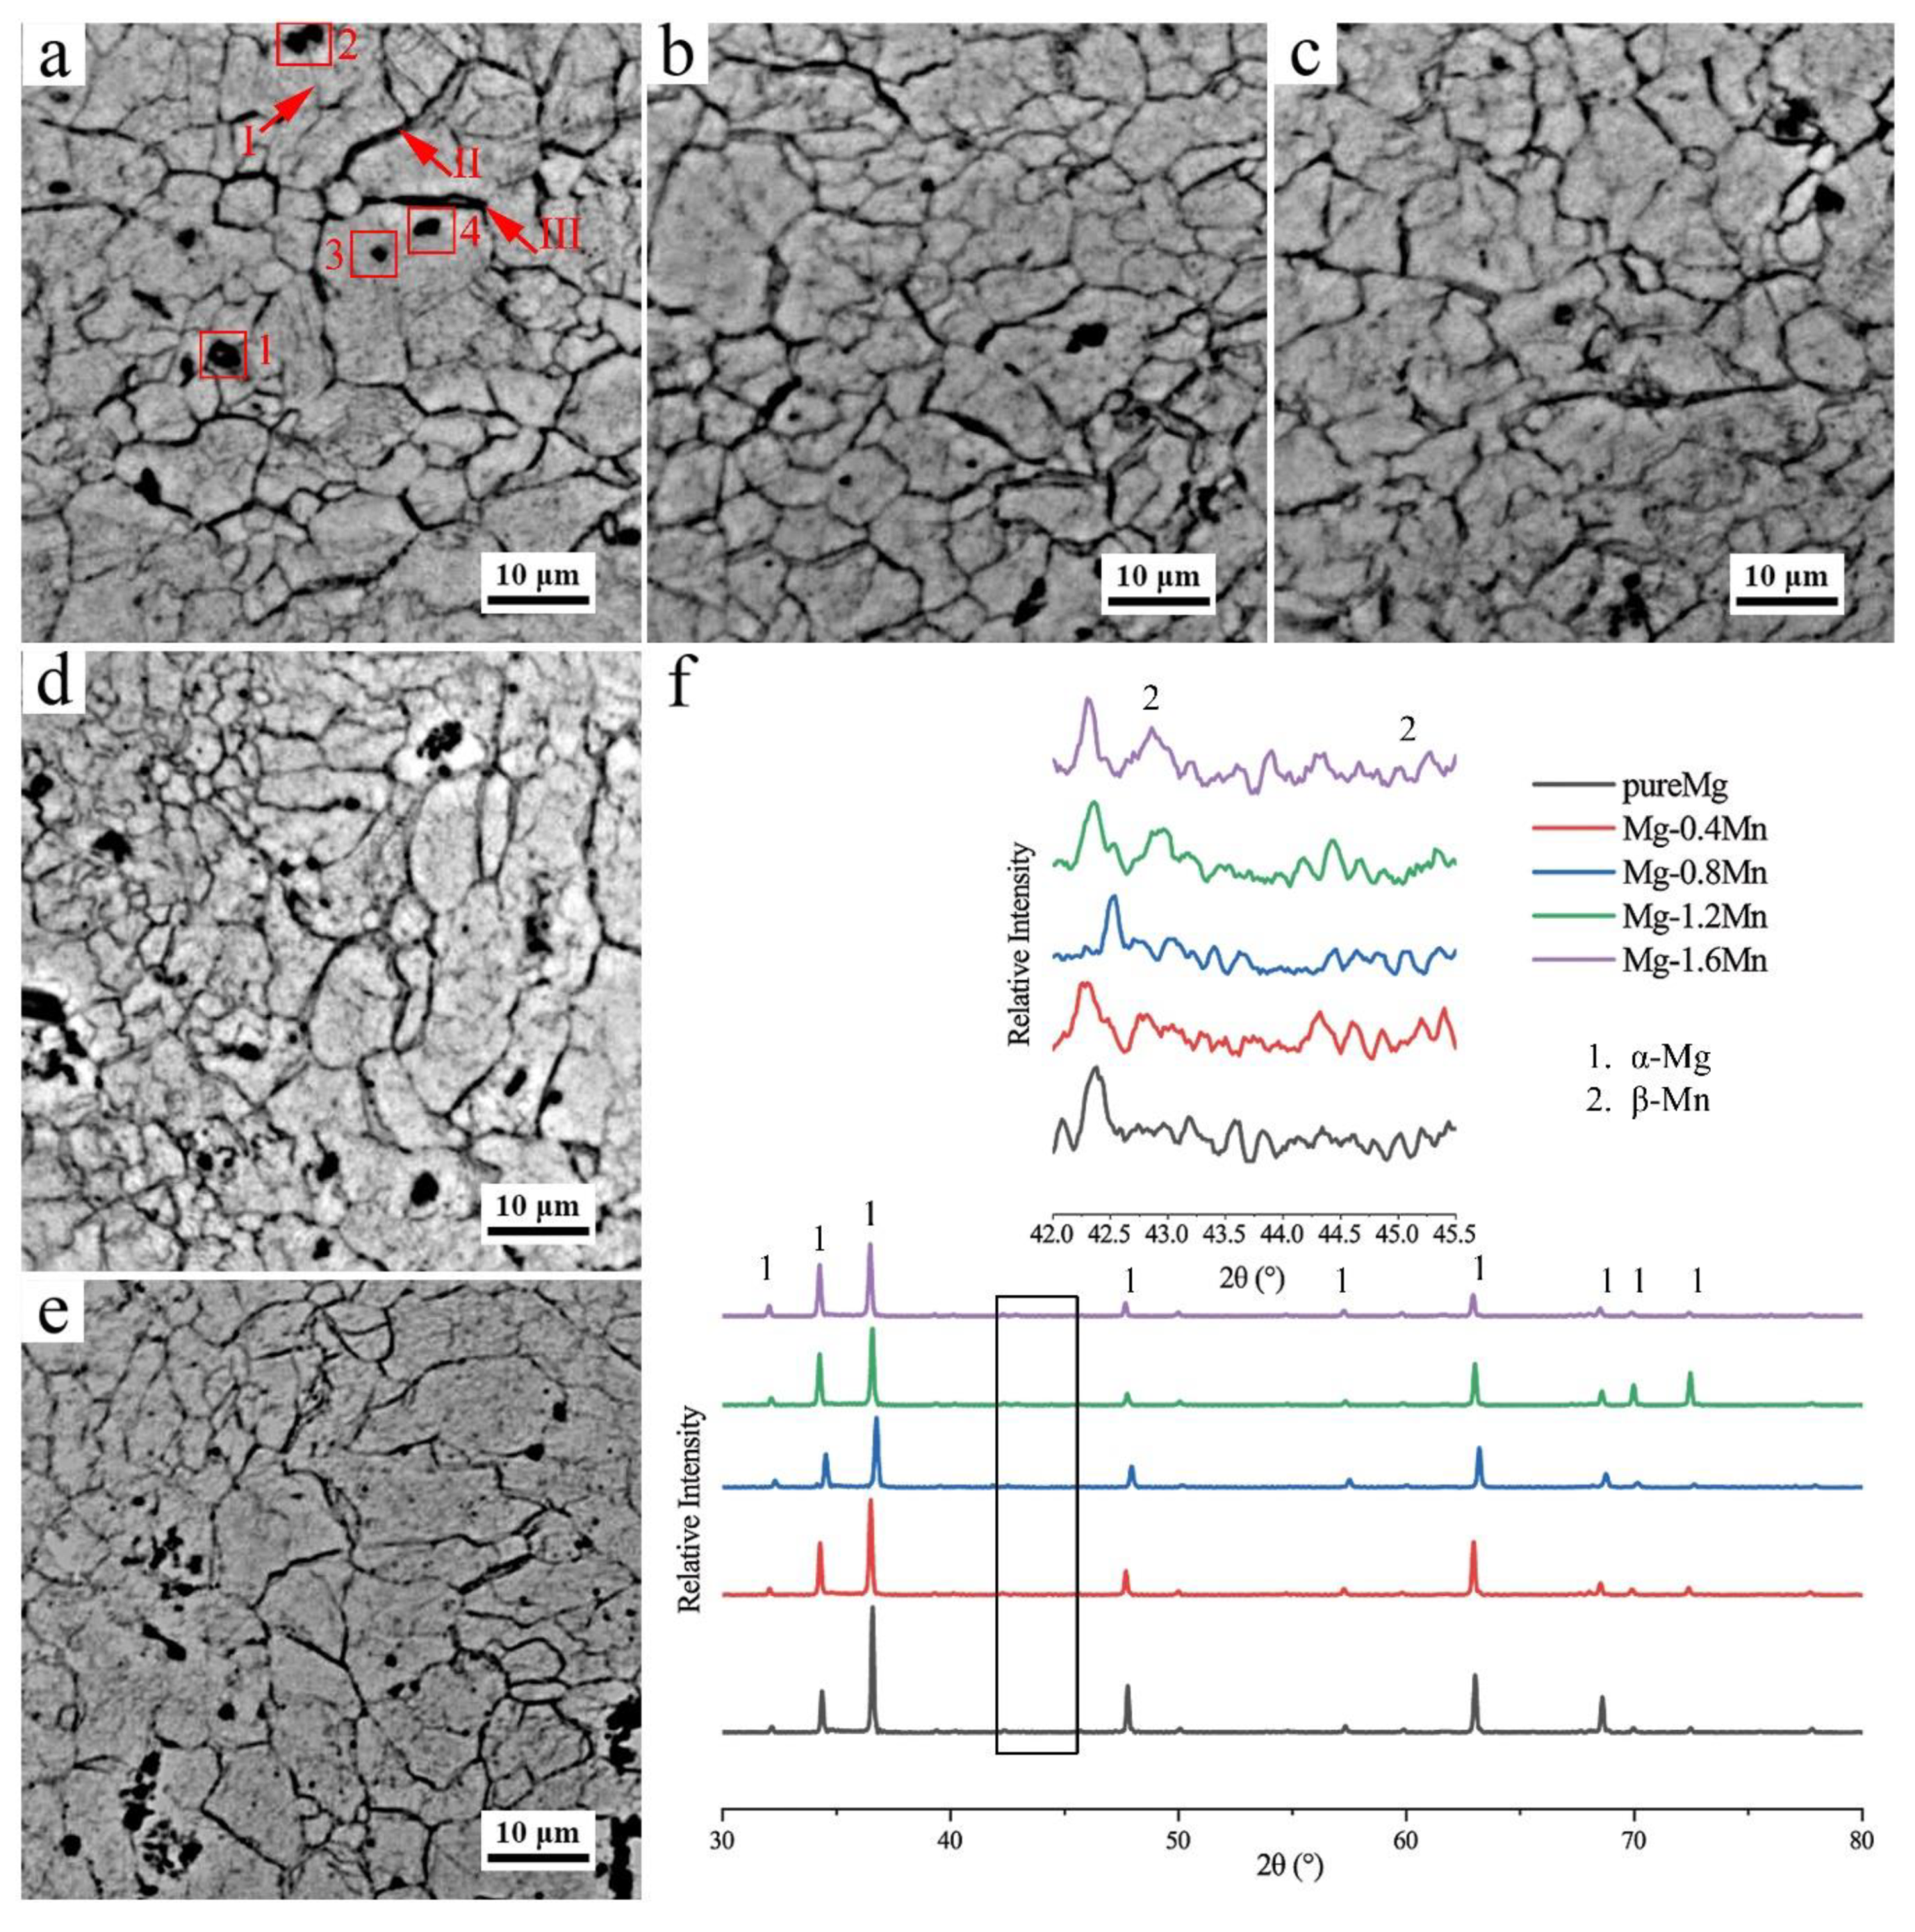
Figure 2 shows the optical microstructures and the XRD patterns of the SLMed Mg-xMn, depicting a similar microstructural characteristic. The grains were quasi-polygon in shape. The average grain size was similar in each case: ~10 μm for the SLMed Mg-xMn with different Mn contents. As shown in the red squares 1 and 2 in Figure 2a, most porosities were located at the grain boundaries indicated by red arrows I and II in Figure 2a. A few incomplete fusion holes were located inside the grains as indicated by red squares 3 and 4 in Figure 2a. There were few cracks located along the grain boundaries as showed by red arrow III in Figure 2a. The XRD patterns of the SLMed Mg-xMn indicated that there were peaks of β-Mn only when Mn contents were 1.2 and 1.6 wt.%, while there were no peaks when Mn contents were lower than 1.2 wt.%. This implies that the Mn almost completely dissolved into the Mg-matrix when the Mn content was less than 1.2 wt.% due to the rapid solidification of the SLM and to precipitate in the Mg-matrix as the second phase when the Mn content reached 1.2 wt% or was higher.
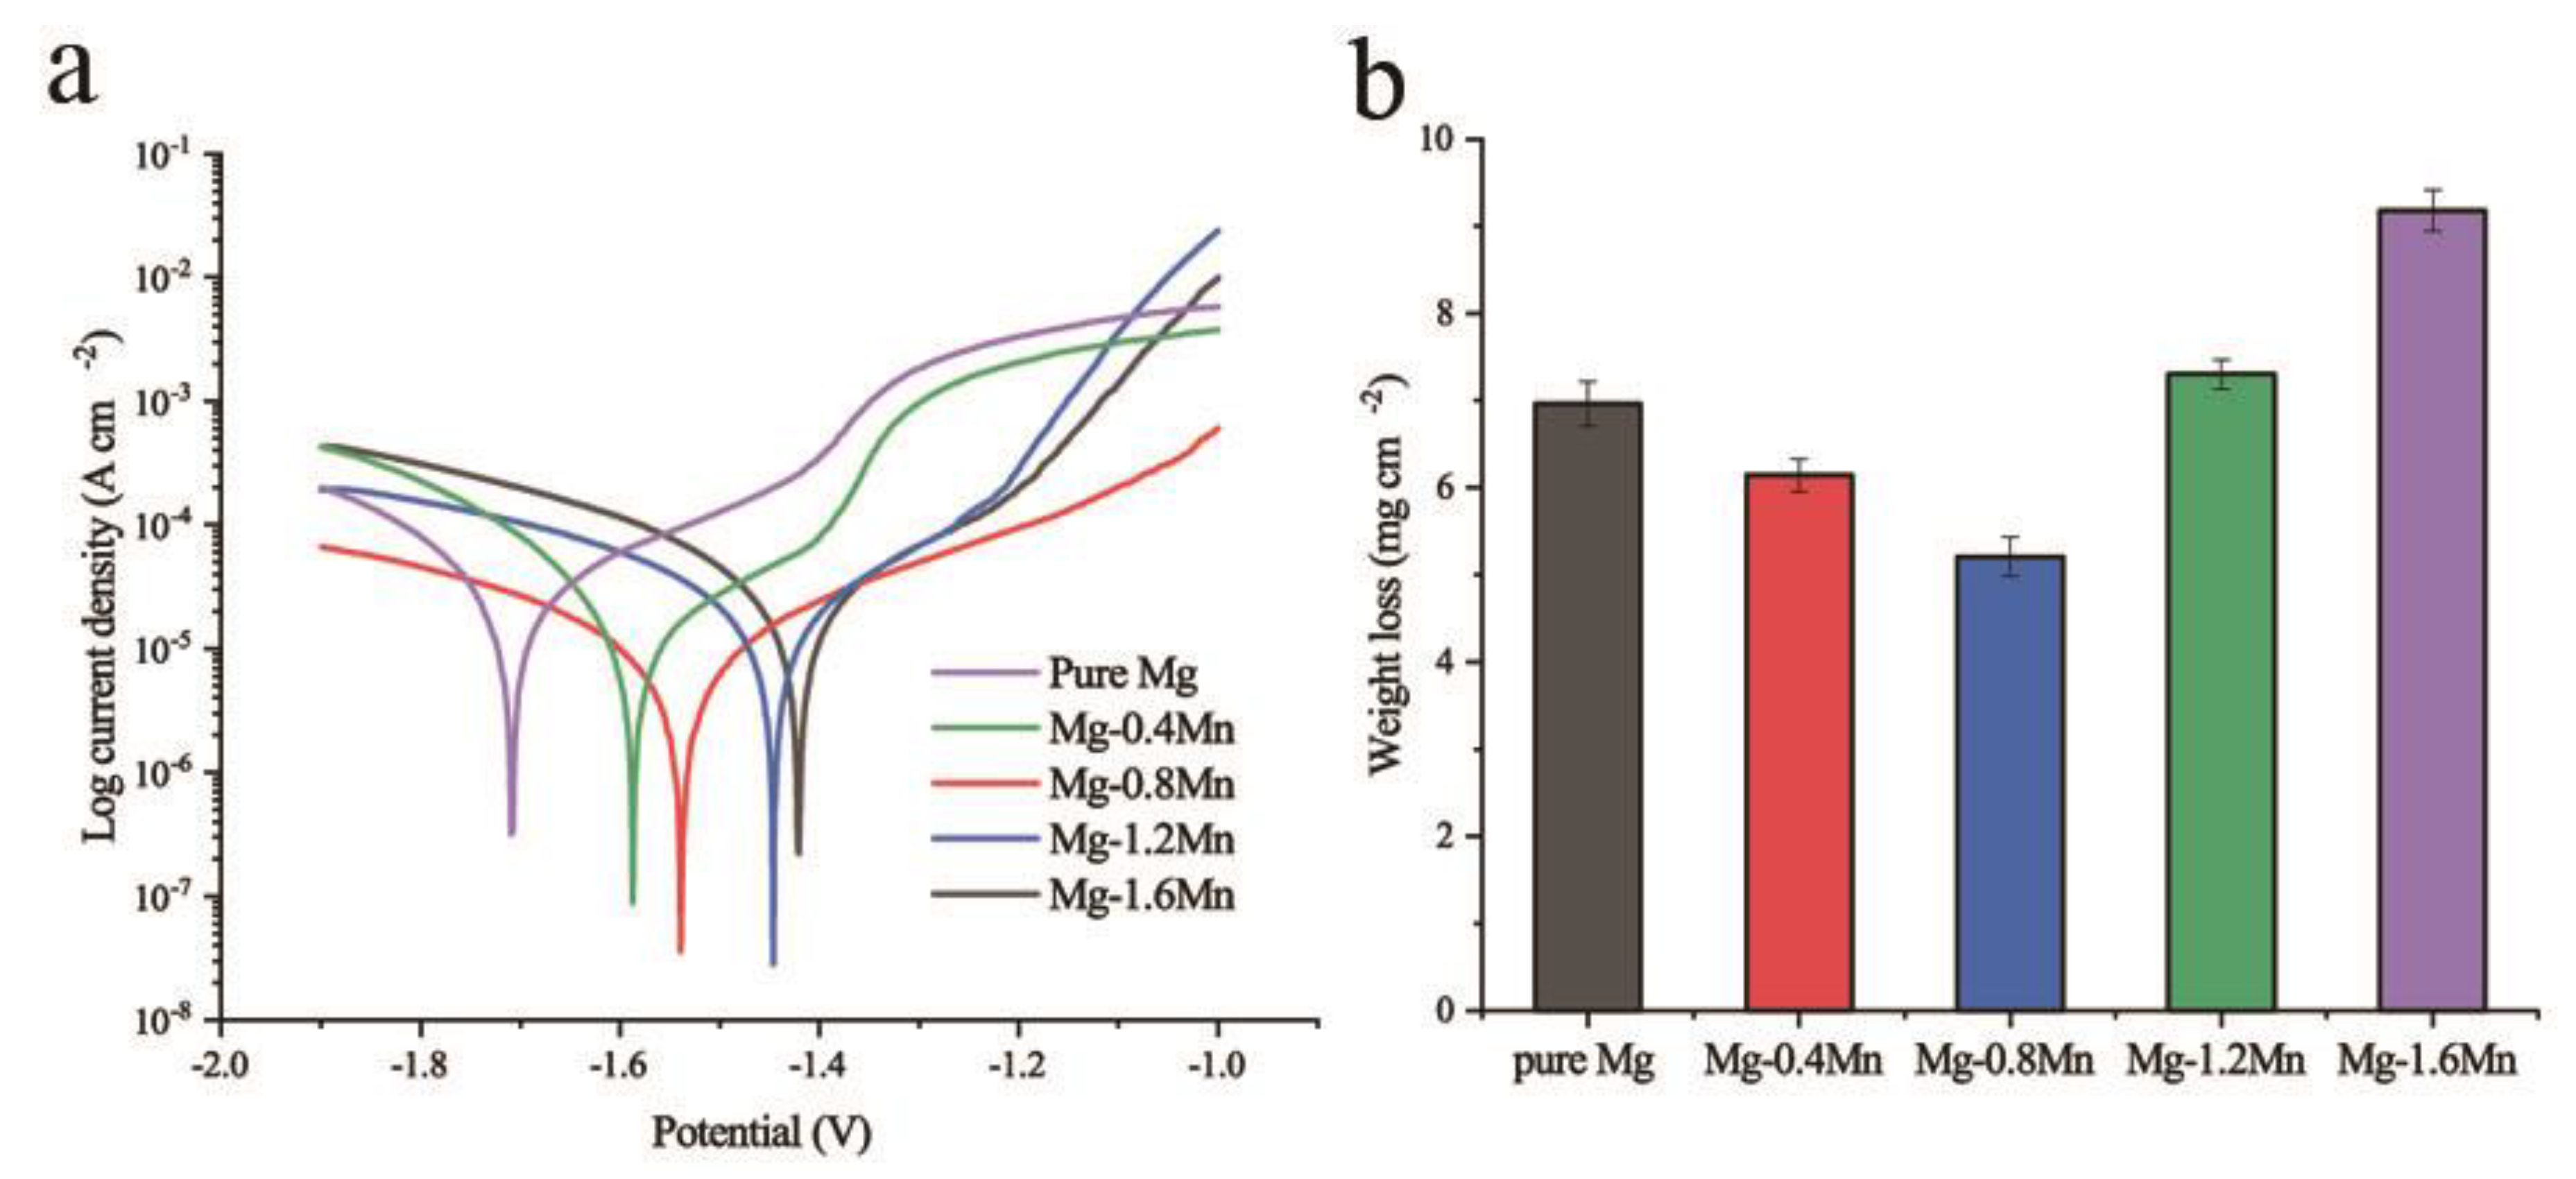
Figure 3a shows the potentiodynamic polarization curves of the SLMed Mg-xMn. Alloying Mn into Mg by SLM caused an obvious change in the corrosion potential (Ecorr) and the corrosion current density (icorr). The Ecorr increased with increasing Mn content, which might be attributed to the more positive electrochemical potential of Mn, compared to Mg. The icorr values derived from the linear part of the cathodic branch of the polarization potential curves using Tafel extrapolation [19] are listed in Table 2. The icorr value of the SLMed Mg was 29 μA/cm2. Alloying Mn into Mg by SLM first decreased the icorr values, and the icorr values of the SLMed Mg-0.8Mn reached the minimum (10 μA/cm2). Thereafter, the icorr increased with increasing Mn content. The corresponding biodegradation rates calculated from the icorr were also listed in Table 2.
Figure 3b shows the weight loss data of the SLMed Mg-xMn, immersed in the Hanks’ solution for 168 h (i.e., 7 days). The weight loss rate first decreased and reached the minimum with increasing Mn content at 0.8 wt.%, and then increased when the Mn content was further increased. The biodegradation rates calculated from the weight loss rate are also listed in Table 2. The corrosion rates from the immersion tests and from the polarization curves showed the same trends, i.e., the order of these two corrosion rates was SLMed Mg-1.6Mn > SLMed Mg or SLMed Mg-1.2Mn > SLMed Mg-0.4Mn > SLMed Mg-0.8Mn. The SLMed Mg-0.8Mn had the lowest corrosion rate. The corrosion rates from immersion tests related to the corrosion onset, while the biodegradation rates calculated from weight loss rate related to average corrosion during a considerable period after corrosion onset.
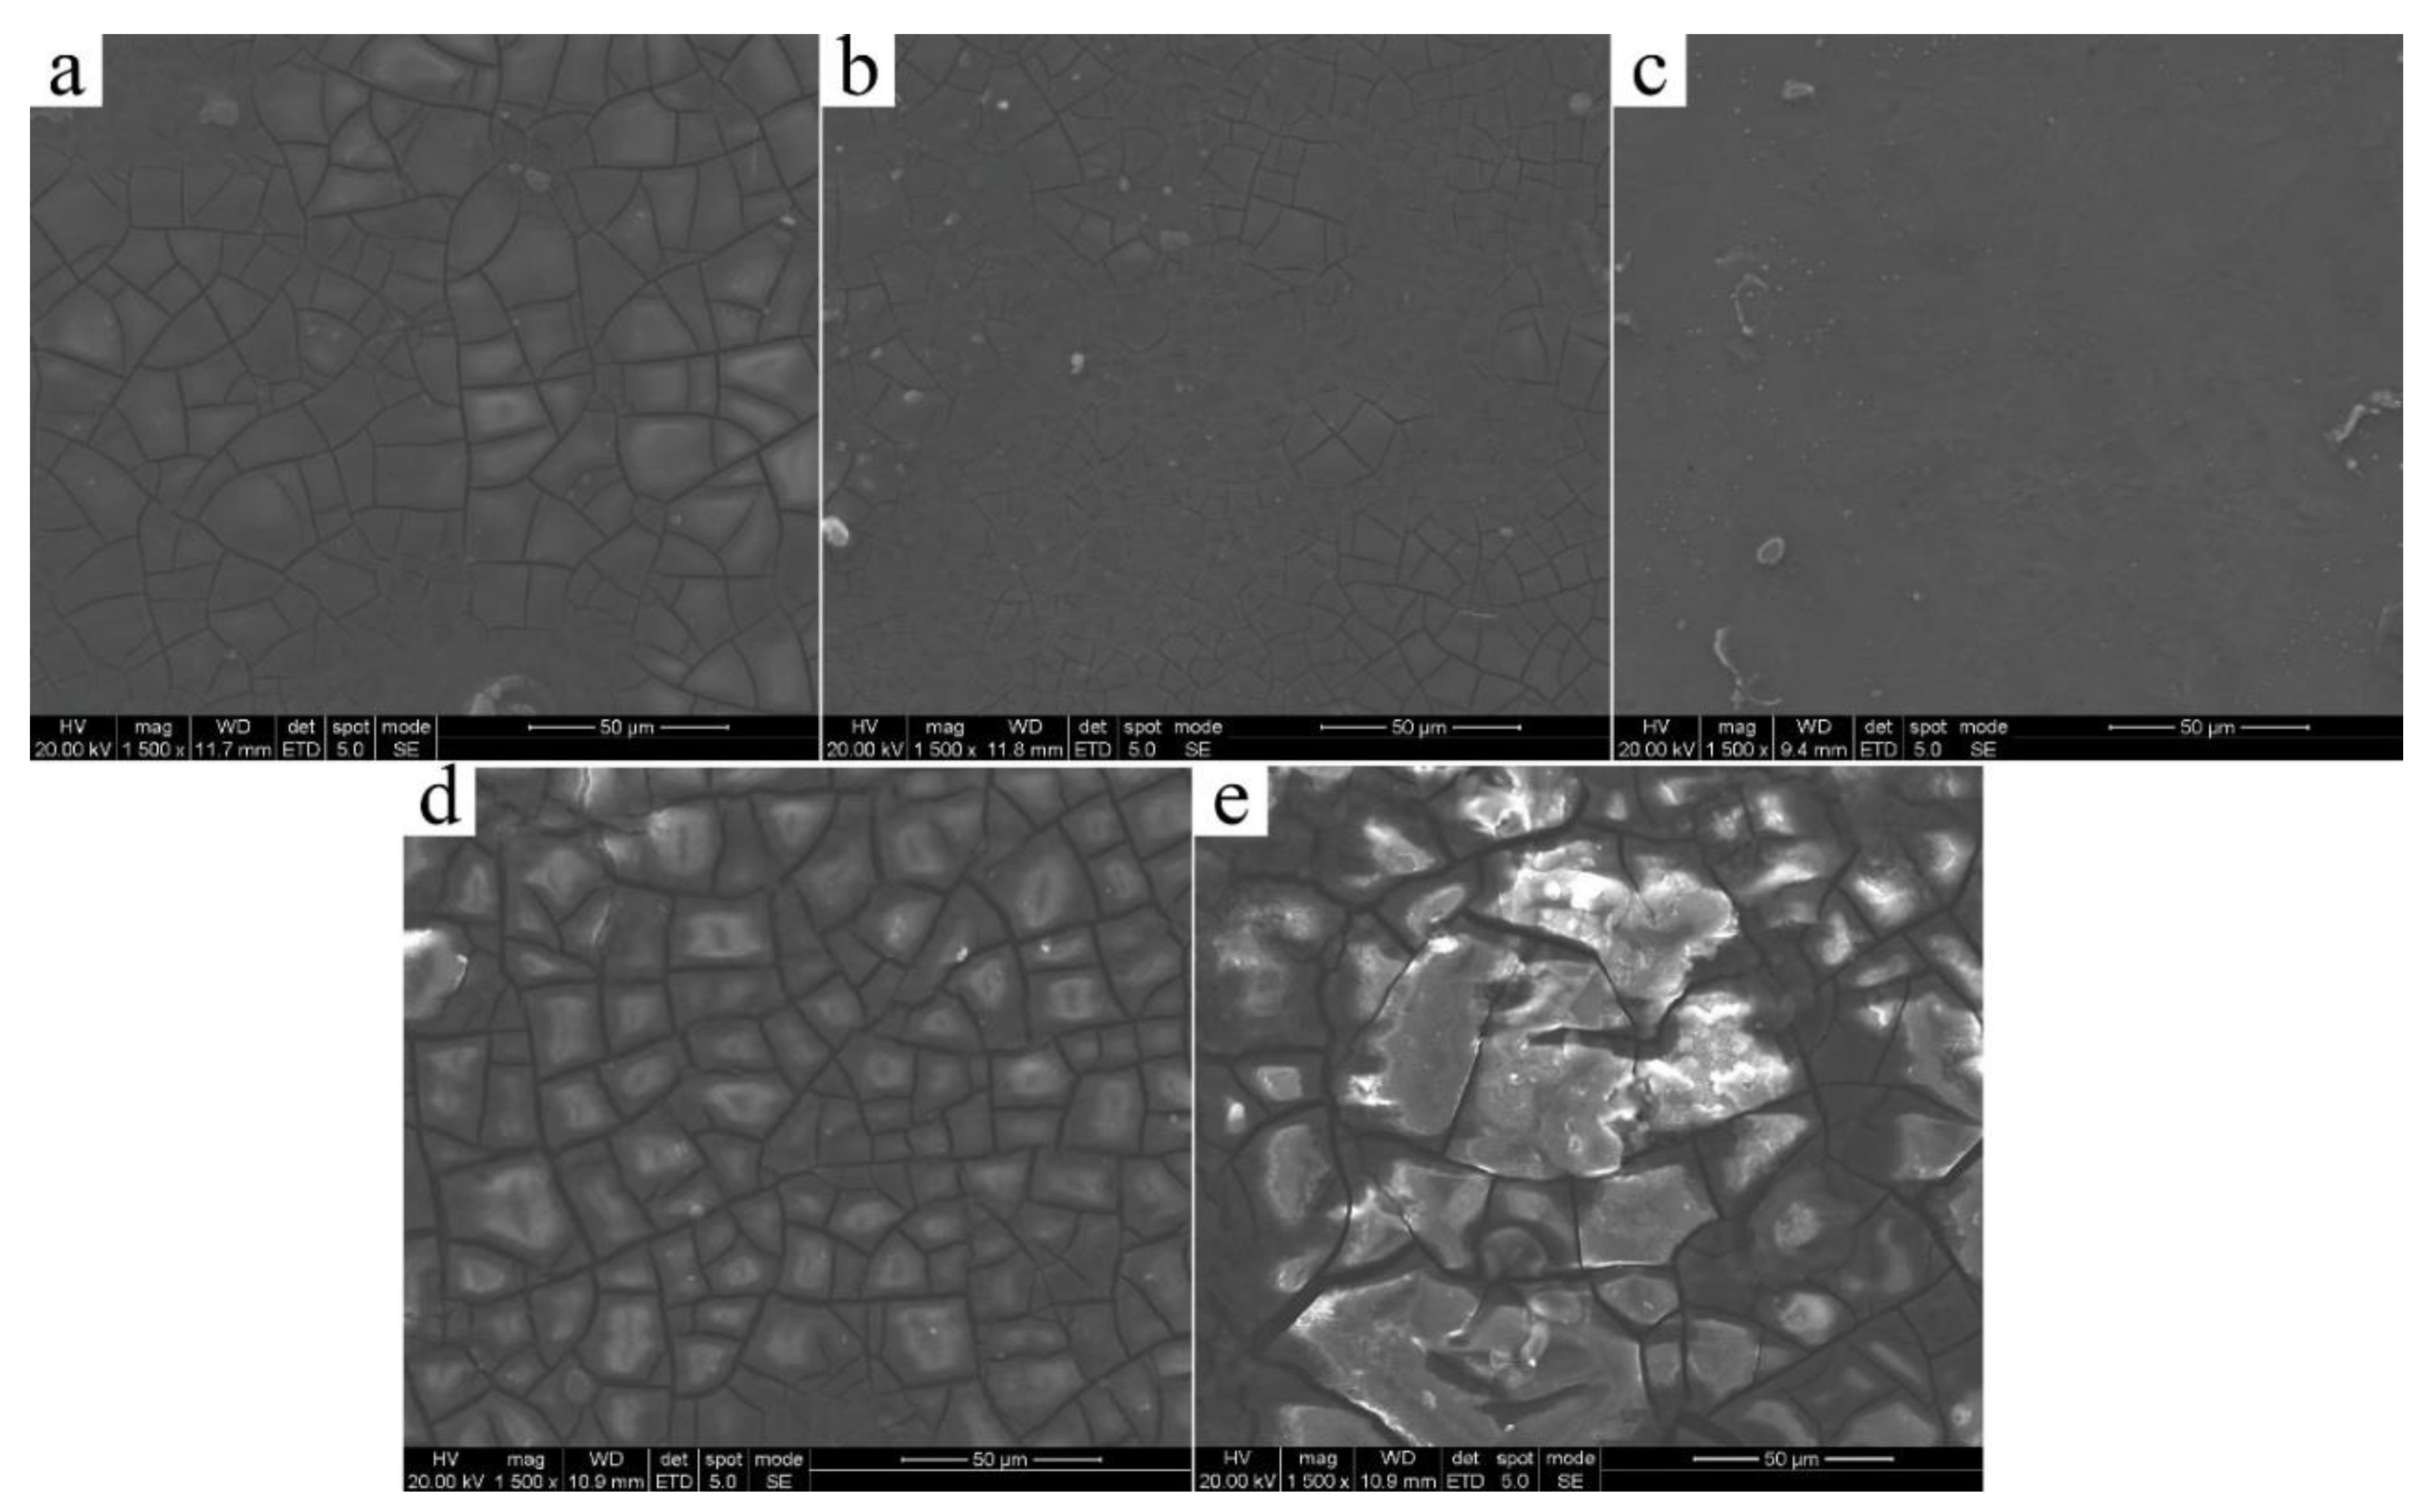
Figure 4 shows the corrosion surface morphologies of the SLMed Mg-xMn after 48 h immersion, depicting different appearance characteristics. There were many visible cracks on the corrosion surface of the SLMed Mg, the SLMed Mg-1.2Mn and the SLMed Mg-1.6Mn. Especially, the corrosion surface of the SLMed Mg-1.6Mn was covered with thick cracked-mud corrosion product. The numbers and the depth of cracks decreased on the mud corrosion surface of the SLMed Mg-0.4Mn. The cracks almost completely disappeared on the mud corrosion surface of the SLMed Mg-0.8Mn, containing a continuous uncracked-mud corrosion film, which implied that the corrosion of the SLMed Mg-0.8Mn was relatively slight. This result coincided with the above conclusions derived from the electrochemistry test and the weight loss test.
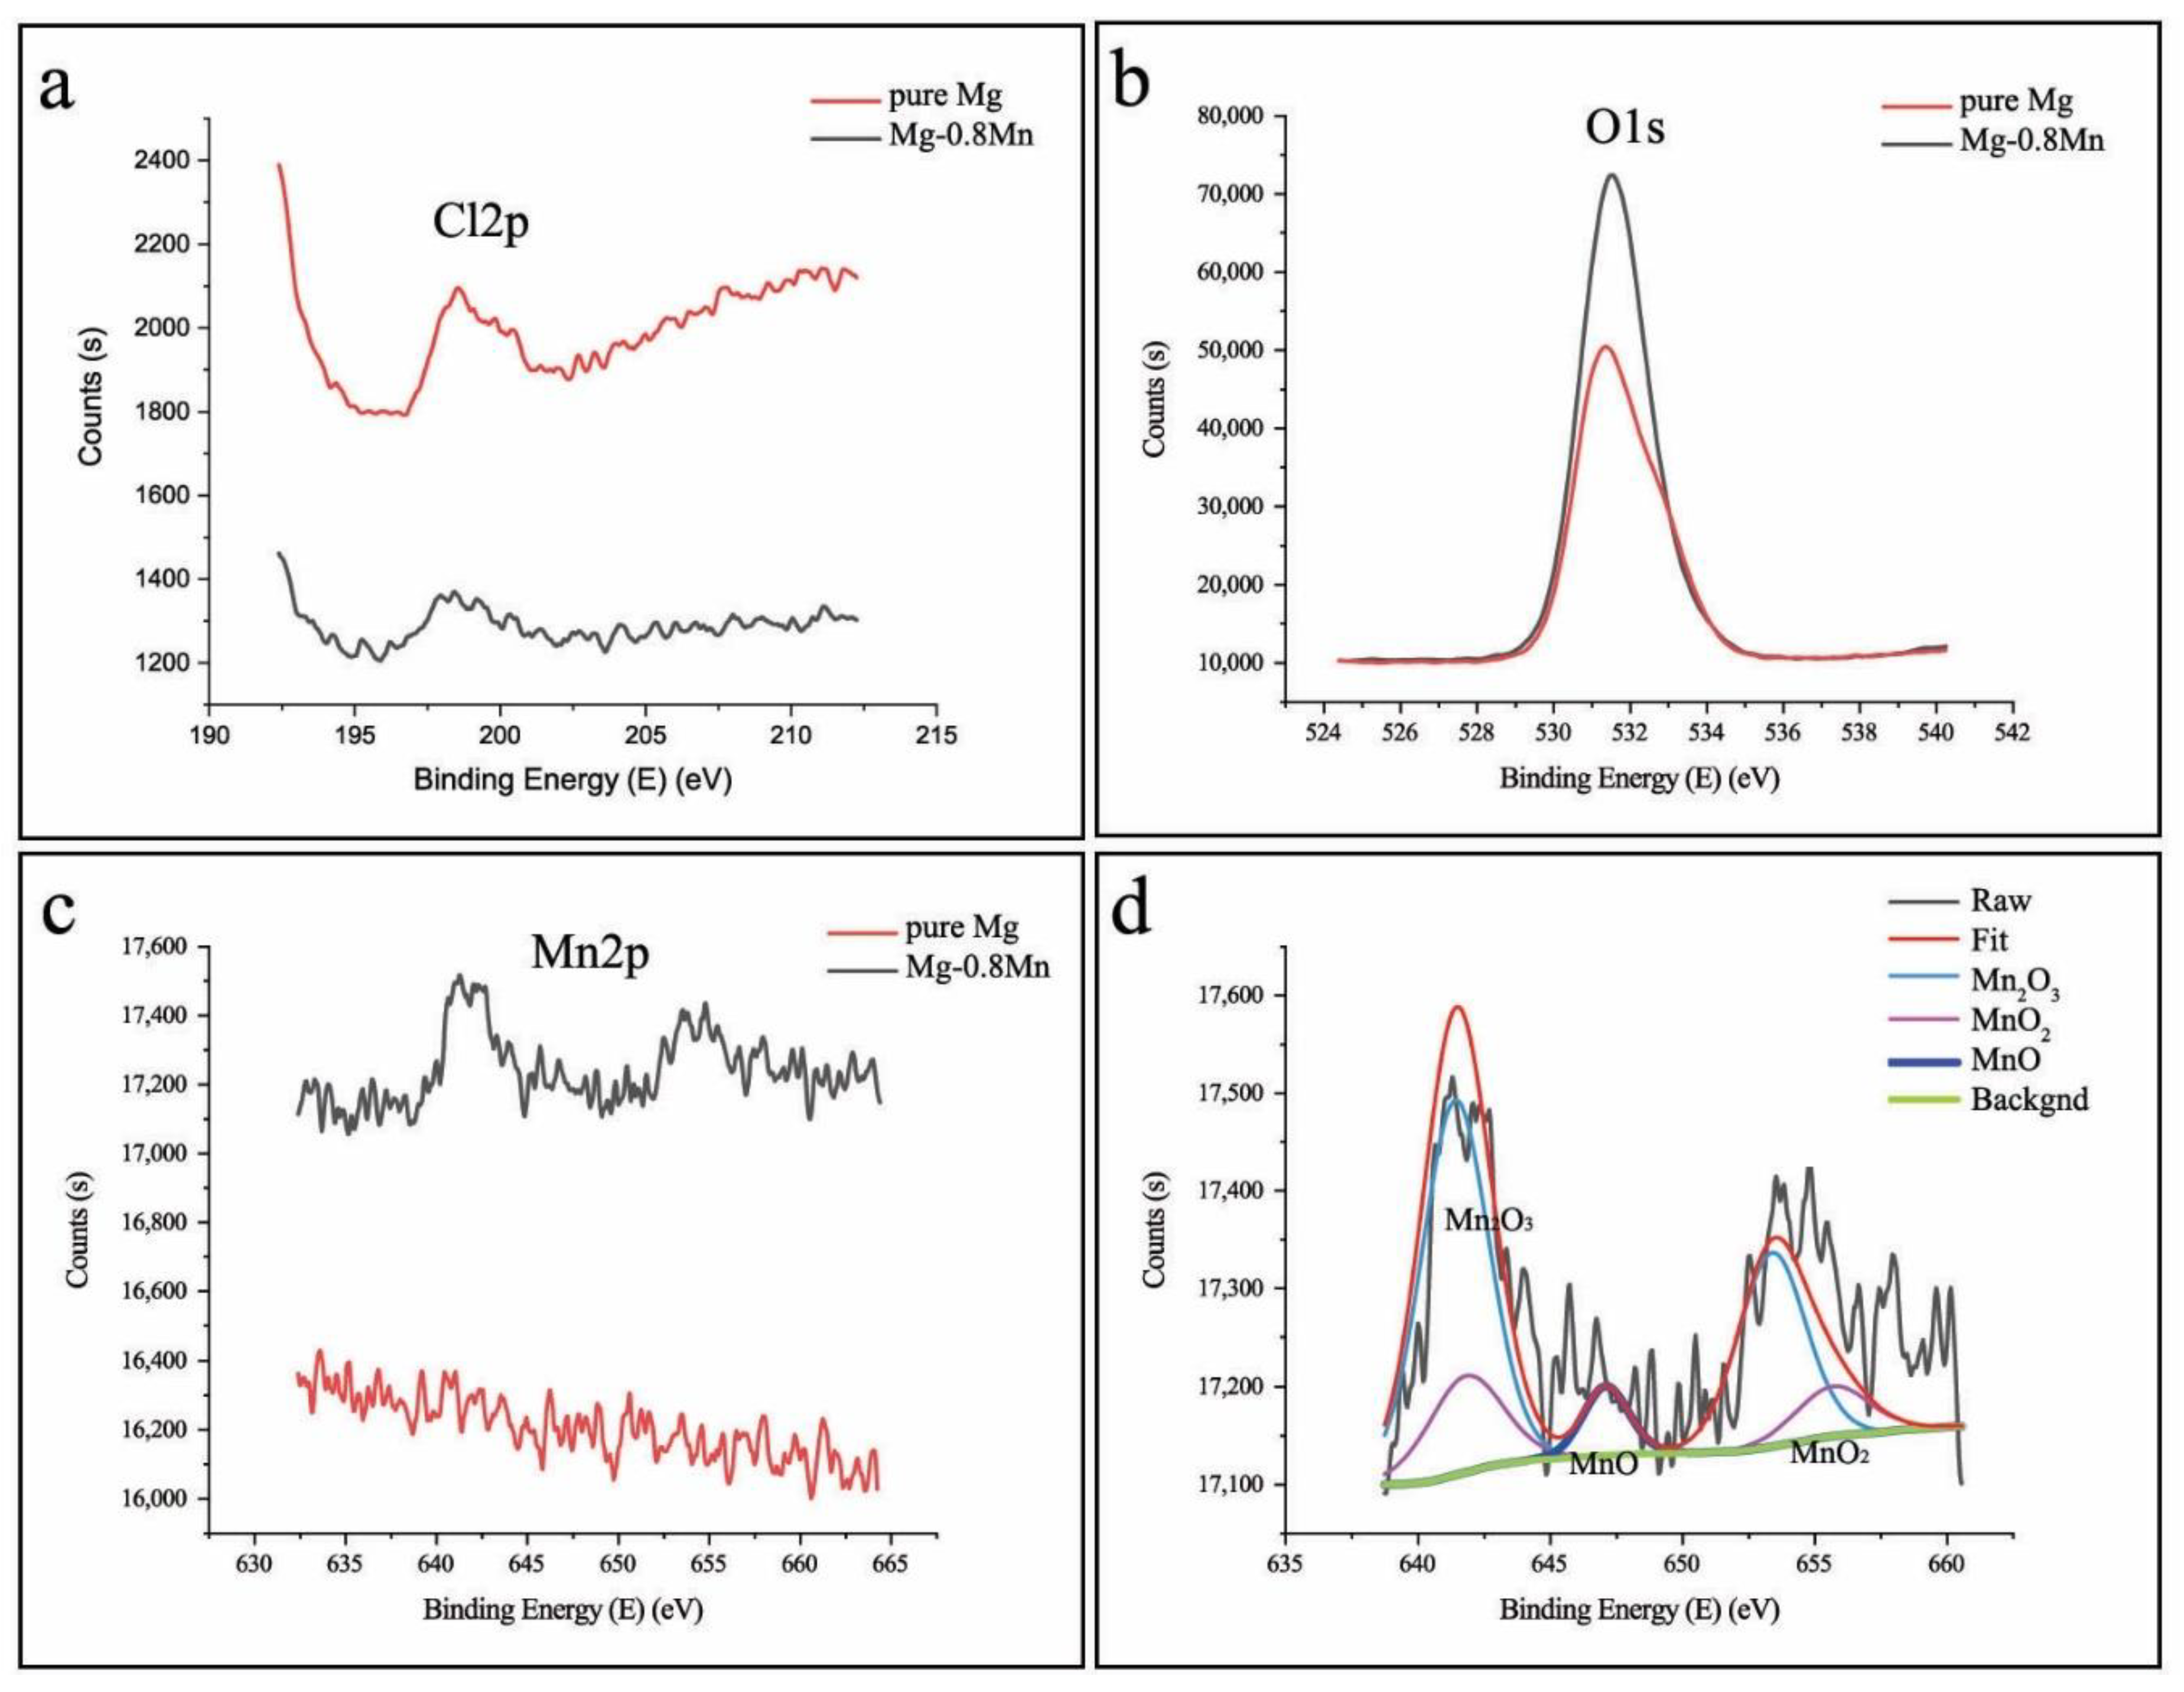
Figure 5 shows the XPS spectra of the corrosion surfaces of the SLMed Mg and the SLMed Mg-0.8Mn after immersion in the Hanks’ solution for 48 h. The SLMed Mg-0.8Mn had higher O 1s peaks and lower Cl 2p peaks than the SLMed Mg (Figure 5a,b). This meant that less chloride and more hydroxide/oxide were caused on the corrosion surface of the SLMed Mg-0.8Mn. Usually, a Mg(OH)2 layer forms on the surface of the Mg matrix as corrosion products can easily react with the chloride ion and transform to MgCl2 [20,21]. Therefore, the transformation from Mg(OH)2 to MgCl2 in the SLMed Mg-0.8Mn was less, compared to the SLMed Mg. It is well known that MgCl2 is more soluble than magnesium oxide and magnesium hydroxide and brings about corrosion penetrating deeply into the Mg substrate. As a result, pitting corrosion occurs and becomes deeper and larger, with even more cracks generated. In other words, the biodegradation would be improved by prohibiting Mg(OH)2 from transforming to MgCl2. The peaks of Mn as shown in Figure 5c manifested the presence of Mn element in the corrosion products of the SLMed Mg-0.8Mn. According to Biesinger et al. [22], the result of Mn 2p peak curve fitting indicated that manganese oxide was certainly present on the corrosion surface of the SLMed Mg-0.8Mn (Figure 5d). Metalnikov [10] reported that Mn alloying into a Mg-5Al-based alloy formed a relatively protective manganese oxide film and inhibited the penetration of the chloride ion. Therefore, the formation of a manganese oxide layer on the SLMed Mg-0.8Mn was expected to make a significant contribution to decrease the biodegradation rate in the Hanks’ solution containing Cl ions.
The SLMed Mg-xMn was a multiphase alloy with different micro-constituents, i.e., the Mg matrix and the second phase particles, which caused strong micro galvanic corrosion [23,24]. As described above, the peaks of the β-Mn could only be recognized when Mn contents were 1.2 and 1.6 wt.%. In these cases, Mn precipitated in the Mg matrix as the second phase, which served as a cathode and caused galvanic corrosion with the Mg matrix (as anode). The influence of the undissolved Mn phase on the decrease of the biodegradation resistance counteracted the influence of the relatively protective manganese oxide layer on the increase of the biodegradation resistance. Consequently, the biodegradation rate first decreased while the Mn content increased and reached a minimum when Mn content was 0.8 wt.%, and then increased with the Mn content further increased.

4. Conclusions

In this paper, an understanding of the contribution of alloying Mn to the corrosion resistance of Mg has been investigated by fabricating Mg-xMn alloys (x = 0, 0.4, 0.8, 1.2 and 1.6 wt.%) with selective laser melting (SLM). The results of the microstructural characters and biodegradation behaviors showed that alloying Mn into the Mg by SLM produced a relatively protective manganese oxide film, which contributed to decreasing the biodegradation rate. However, if too much Mn was added (more than 0.8 wt.% in our work), the negative influence of the undissolved Mn phase on the biodegradation resistance counteracted the positive influence of the relatively protective manganese oxide layer on the biodegradation resistance.

Author Contributions

Conceptualization, B.X. and M.-C.Z.; methodology, Y.-C.Z.; investigation, B.X. and M.-C.Z.; resources, D.Y., C.G. and C.S.; data curation, Y.T.; writing—original draft preparation, B.X.; writing—review and editing, M.-C.Z., D.Y. and A.A.; visualization, B.X.; supervision, M.-C.Z.; project administration, M.-C.Z.; funding acquisition, D.Y. All authors have read and agreed to the published version of the manuscript.

Funding

This research was funded by Natural Science Foundation of China, grant number 51874368, and Guangdong Provincial Applied Science and Technology Research and Development Program, grant number 2015B090926007.

Conflicts of Interest

The authors declare no conflict of interest.

References

  1. Sezer, N.; Evis, Z.; Kayhan, S.M.; Tahmasebifar, A.; Koç, M. Review of magnesium-based biomaterials and their applications. J. Magnes. Alloys 2018, 6, 23–43. [Google Scholar] [CrossRef]
  2. Chen, J.; Zhang, Y.; Ibrahim, M.; Etim, I.P.; Tan, L.; Yang, K. In vitro degradation and antibacterial property of a copper-containing micro-arc oxidation coating on Mg-2Zn-1Gd-0.5Zr alloy. Colloids Surf. B Biointerfaces 2019, 179, 77–86. [Google Scholar] [CrossRef]
  3. Chen, C.; Chen, J.; Wu, W.; Shi, Y.; Jin, L.; Petrini, L.; Shen, L.; Yuan, G.; Ding, W.; Ge, J.; et al. In vivo and in vitro evaluation of a biodegradable magnesium vascular stent designed by shape optimization strategy. Biomaterials 2019, 221, 119414. [Google Scholar] [CrossRef]
  4. Song, J.; She, J.; Chen, D.; Pan, F. Latest research advances on magnesium and magnesium alloys worldwide. J. Magnes. Alloys 2020, 8, 1–41. [Google Scholar] [CrossRef]
  5. Gu, X.; Zheng, Y.; Cheng, Y.; Zhong, S.; Xi, T. In vitro corrosion and biocompatibility of binary magnesium alloys. Biomaterials 2009, 30, 484–498. [Google Scholar] [CrossRef]
  6. Walker, J.; Shadanbaz, S.; Woodfield, T.B.F.; Staiger, M.P.; Dias, G.J. Magnesium biomaterials for orthopedic application: A review from a biological perspective: Magnesium Biomaterials for Orthopedic Application. J. Biomed. Mater. Res. B Appl. Biomater. 2014, 102, 1316–1331. [Google Scholar] [CrossRef]
  7. Tao, J.-X.; Zhao, M.-C.; Zhao, Y.-C.; Yin, D.-F.; Liu, L.; Gao, C.; Shuai, C.; Atrens, A. Influence of graphene oxide (GO) on microstructure and biodegradation of ZK30-xGO composites prepared by selective laser melting. J. Magnes. Alloys 2020, 8, 952–962. [Google Scholar] [CrossRef]
  8. Liu, Y.; Koltick, D.; Byrne, P.; Wang, H.; Zheng, W.; Nie, L.H. Development of a transportable neutron activation analysis system to quantify manganese in bone in vivo: Feasibility and methodology. Physiol. Meas. 2013, 34, 1593–1609. [Google Scholar] [CrossRef] [Green Version]
  9. Yang, Y.; Wu, P.; Wang, Q.; Wu, H.; Liu, Y.; Deng, Y.; Zhou, Y.; Shuai, C. The Enhancement of Mg Corrosion Resistance by Alloying Mn and Laser-Melting. Materials 2016, 9, 216. [Google Scholar] [CrossRef] [Green Version]
  10. Ha, H.-Y.; Kim, H.J.; Baek, S.-M.; Kim, B.; Sohn, S.-D.; Shin, H.-J.; Jeong, H.Y.; Park, S.H.; Yim, C.D.; You, B.S.; et al. Improved corrosion resistance of extruded Mg–8Sn–1Zn–1Al alloy by microalloying with Mn. Scr. Mater. 2015, 109, 38–43. [Google Scholar] [CrossRef]
  11. Metalnikov, P.; Ben-Hamu, G.; Templeman, Y.; Shin, K.S.; Meshi, L. The relation between Mn additions, microstructure and corrosion behavior of new wrought Mg-5Al alloys. Mater. Charact. 2018, 145, 101–115. [Google Scholar] [CrossRef]
  12. Cho, D.H.; Lee, B.W.; Park, J.Y.; Cho, K.M.; Park, I.M. Effect of Mn addition on corrosion properties of biodegradable Mg-4Zn-0.5Ca-xMn alloys. J. Alloys Compd. 2017, 695, 1166–1174. [Google Scholar] [CrossRef]
  13. Gandel, D.S.; Easton, M.A.; Gibson, M.A.; Birbilis, N. Influence of Mn and Zr on the Corrosion of Al-Free Mg Alloys: Part 2—Impact of Mn and Zr on Mg Alloy Electrochemistry and Corrosion. Corrosion 2013, 69, 744–751. [Google Scholar] [CrossRef]
  14. Nam, N.D.; Mathesh, M.; Forsyth, M.; Jo, D.S. Effect of manganese additions on the corrosion behavior of an extruded Mg–5Al based alloy. J. Alloys Compd. 2012, 542, 199–206. [Google Scholar] [CrossRef]
  15. Zhao, Y.-C.; Tang, Y.; Zhao, M.-C.; Liu, C.; Liu, L.; Gao, C.-D.; Shuai, C.; Atrens, A. Study on Fe-xGO Composites Prepared by Selective Laser Melting: Microstructure, Hardness, Biodegradation and Cytocompatibility. JOM 2020, 72, 1163–1174. [Google Scholar] [CrossRef]
  16. Xu, R.; Zhao, M.-C.; Zhao, Y.-C.; Liu, L.; Liu, C.; Gao, C.; Shuai, C.; Atrens, A. Improved biodegradation resistance by grain refinement of novel antibacterial ZK30-Cu alloys produced via selective laser melting. Mater. Lett. 2019, 237, 253–257. [Google Scholar] [CrossRef]
  17. Zhang, W.; Tan, L.; Ni, D.; Chen, J.; Zhao, Y.-C.; Liu, L.; Shuai, C.; Yang, K.; Atrens, A.; Zhao, M.-C. Effect of grain refinement and crystallographic texture produced by friction stir processing on the biodegradation behavior of a Mg-Nd-Zn alloy. J. Mater. Sci. Technol. 2019, 35, 777–783. [Google Scholar] [CrossRef]
  18. Díaz, I.; Pacha-Olivenza, M.Á.; Tejero, R.; Anitua, E.; González-Martín, M.L.; Escudero, M.L.; García-Alonso, M.C. Corrosion behavior of surface modifications on titanium dental implant. In situ bacteria monitoring by electrochemical techniques. J. Biomed. Mater. Res. B Appl. Biomater. 2018, 106, 997–1009. [Google Scholar] [CrossRef]
  19. McCafferty, E. Validation of corrosion rates measured by the Tafel extrapolation method. Corros. Sci. 2005, 47, 3202–3215. [Google Scholar] [CrossRef]
  20. Xin, Y.; Hu, T.; Chu, P.K. In vitro studies of biomedical magnesium alloys in a simulated physiological environment: A review. Acta Biomater. 2011, 7, 1452–1459. [Google Scholar] [CrossRef]
  21. Cui, L.-Y.; Li, X.-T.; Zeng, R.-C.; Li, S.-Q.; Han, E.-H.; Song, L. In vitro corrosion of Mg–Ca alloy—The influence of glucose content. Front. Mater. Sci. 2017, 11, 284–295. [Google Scholar] [CrossRef]
  22. Biesinger, M.C.; Payne, B.P.; Grosvenor, A.P.; Lau, L.W.M.; Gerson, A.R.; Smart, R.S.C. Resolving surface chemical states in XPS analysis of first row transition metals, oxides and hydroxides: Cr, Mn, Fe, Co and Ni. Appl. Surf. Sci. 2011, 257, 2717–2730. [Google Scholar] [CrossRef]
  23. Bakhsheshi-Rad, H.R.; Hamzah, E.; Farahany, S.; Staiger, M.P. The Mechanical Properties and Corrosion Behavior of Quaternary Mg-6Zn-0.8Mn-xCa Alloys. J. Mater. Eng. Perform. 2015, 24, 598–608. [Google Scholar] [CrossRef]
  24. Kim, W.-C.; Kim, J.-G.; Lee, J.-Y.; Seok, H.-K. Influence of Ca on the corrosion properties of magnesium for biomaterials. Mater. Lett. 2008, 62, 4146–4148. [Google Scholar] [CrossRef]
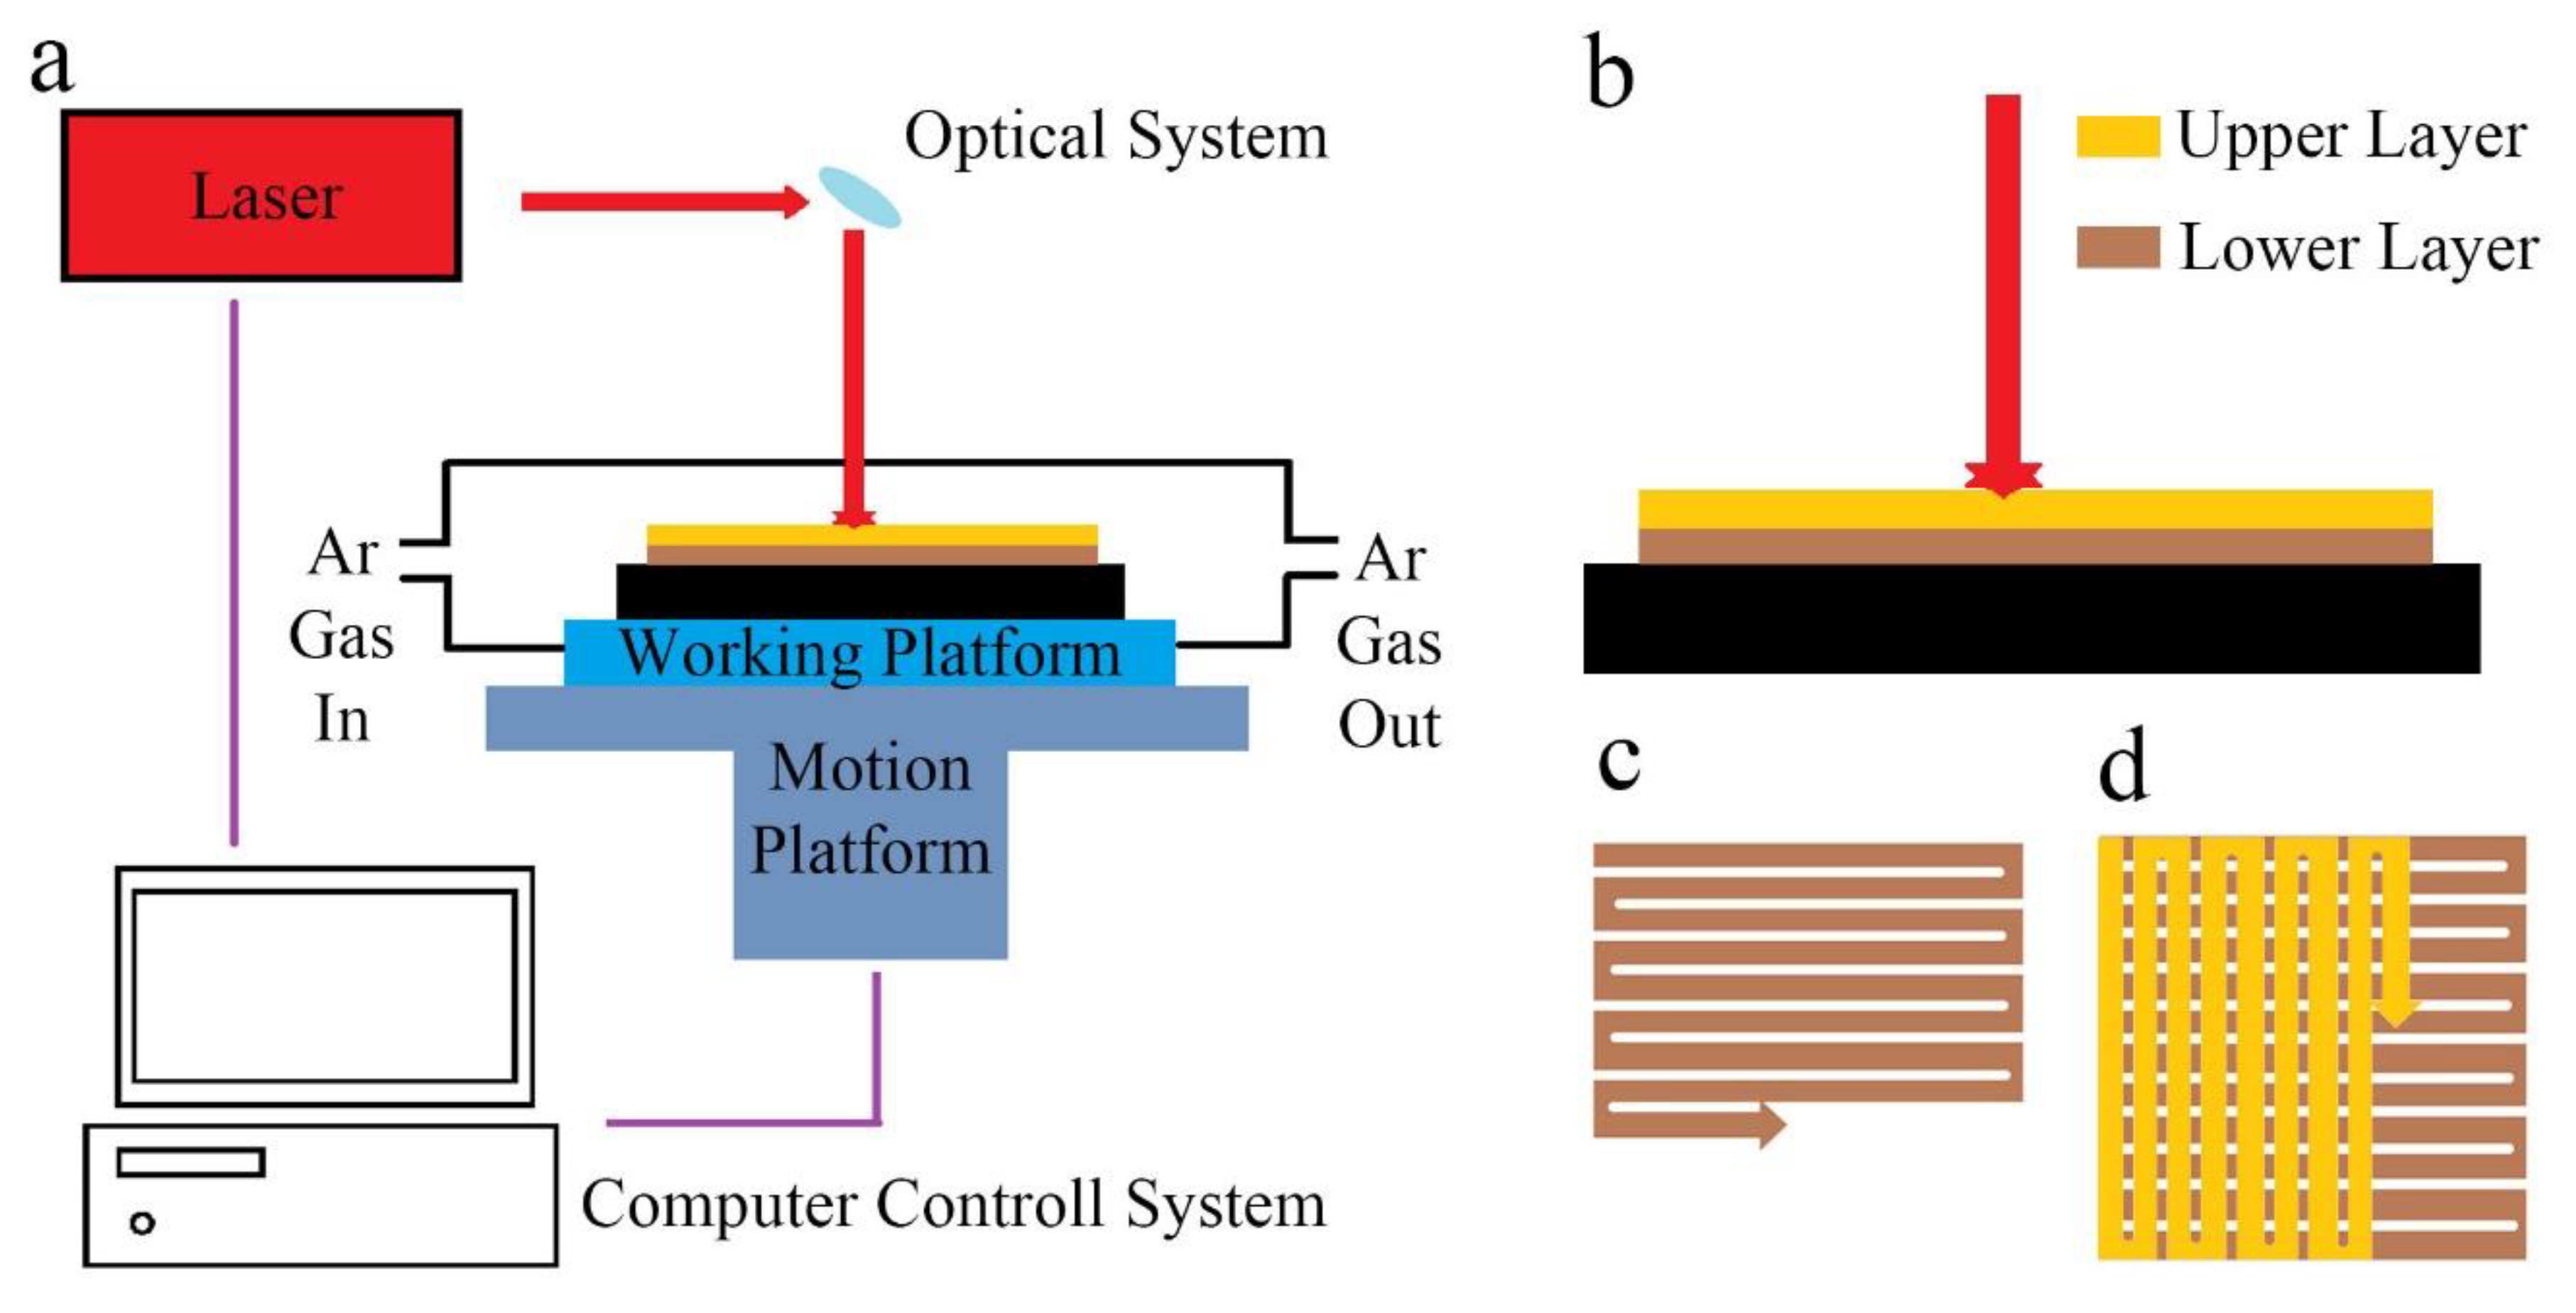
Figure 1. (a) Schematic of the self-regulated SLM system, (b) Layer-by-layer building procedure, (c) “s” style scanning lines of the lower layer and (d) scanning lines of the upper layer.
Metals 10 01527 g001
Figure 2. Optical microstructures and XRD patterns of the SLMed Mg-xMn: (a) x = 0, (b) x = 0.4, (c) x = 0.8, (d) x = 1.2, (e) x = 1.6, and (f) XRD patterns.
Metals 10 01527 g002
Figure 3. (a) Potentiodynamic polarization curves and (b) weight loss after immersion for 168 h of the SLMed Mg-xMn.
Metals 10 01527 g003
Figure 4. SEM corrosion surface morphologies of the SLMed Mg-xMn (a) x = 0, (b) x = 0.4, (c) x = 0.8, (d) x = 1.2, (e) x = 1.6.
Metals 10 01527 g004
Figure 5. XPS spectra of the corrosion surface of the SLMed Mg and SLMed Mg-0.8Mn: (a) Cl2p; (b) O1s; (c) Mn2p; (d) curve fitting of Mn2p for the SLMed Mg-0.8Mn.
Metals 10 01527 g005
Table 1. The SLM process parameters.
Laser PowerScaning SpeedLaser SpotLayer ThicknessScanning Pitch
75 W15 mm/s150 μm50 μm70 μm
Table 2. Electrochemical data and immersion data of the SLMed Mg-xMn.
MaterialsMgMg-0.4MnMg-0.8MnMg-1.2MnMg-1.6Mn
icorr (μA cm−2)29.2122.0810.1828.2537.82
Pi (mm year−1)0.670.500.230.650.86
ΔW (mg (cm2 day)−1)0.99 ± 0.040.88 ± 0.030.74 ± 0.031.04 ± 0.021.31 ± 0.03
Pw (mm year−1)2.09 ± 0.081.84 ± 0.061.56 ± 0.072.19 ± 0.052.75 ± 0.07
Publisher’s Note: MDPI stays neutral with regard to jurisdictional claims in published maps and institutional affiliations.