Article

Laser Powder Bed Fusion of NiTiHf High-Temperature Shape Memory Alloy: Effect of Process Parameters on the Thermomechanical Behavior

1
Dynamic and Smart Systems Lab, Mechanical, Industrial, and Manufacturing Engineering Department, University of Toledo, Toledo, OH 43606, USA
2
Smart Materials Laboratory, Department of Mechanical Engineering, University of Kentucky, Lexington, KY 40506, USA
3
Department of Materials Science and Engineering, The Ohio State University, Columbus, OH 43210, USA
4
NASA Glenn Research Center, Cleveland, OH 44135, USA
*
Author to whom correspondence should be addressed.
Metals 2020, 10(11), 1522; https://doi.org/10.3390/met10111522
Submission received: 27 October 2020 / Revised: 13 November 2020 / Accepted: 13 November 2020 / Published: 17 November 2020
(This article belongs to the Special Issue Advanced Manufacturing Processes for Shape Memory Alloys)

Abstract

:
Laser powder bed fusion has been widely investigated for shape memory alloys, primarily NiTi alloys, with the goal of tailoring microstructures and producing complex geometries. However, processing high temperature shape memory alloys (HTSMAs) remains unknown. In our previous study, we showed that it is possible to manufacture NiTiHf HTSMA, as one of the most viable alloys in the aerospace industry, using SLM and investigated the effect of parameters on defect formation. The current study elucidates the effect of process parameters (PPs) on the functionality of this alloy. Shape memory properties and the microstructure of additively manufactured Ni-rich NiTiHf alloys were characterized across a wide range of PPs (laser power, scanning speed, and hatch spacing) and correlated with energy density. The optimum laser parameters for defect-free and functional samples were found to be in the range of approximately 60–100 J/mm3. Below an energy density of 60 J/mm3, porosity formation due to lack-of-fusion is the limiting factor. Samples fabricated with energy densities of 60–100 J/mm3 showed comparable thermomechanical behavior in comparison with the starting as-cast material, and samples fabricated with higher energy densities (>100 J/mm3) showed very high transformation temperatures but poor thermomechanical behavior. Poor properties for samples with higher energies were mainly attributed to the excessive Ni loss and resultant change in the chemical composition of the matrix, as well as the formation of cracks and porosities. Although energy density was found to be an important factor, the outcome of this study suggests that each of the PPs should be selected carefully. A maximum actuation strain of 1.67% at 400 MPa was obtained for the sample with power, scan speed, and hatch space of 100 W, 400 mm/s, and 140 µm, respectively, while 1.5% actuation strain was obtained for the starting as-cast ingot. These results can serve as a guideline for future studies on optimizing PPs for fabricating functional HTSMAs.

1. Introduction

High-temperature shape memory alloys (HTSMAs) are a subgroup of shape memory alloys (SMAs) with a martensitic transformation temperature (TT) above 100 °C. HTSMAs are receiving increasing attention in a variety of applications, including energy, automotive, and aerospace applications [1]. Examples of the potential implementation of HTSMAs in aeronautics include actuators for the deployment mechanism of protective shrouds and seals for booster ring segments of rockets [2], variable geometry chevrons for jet noise reduction [3], adaptive components for gas turbines [4], and more recently, the development of NiTiHf/Zr torque tubes for shape-morphing airplanes [5].
Ternary or quarterly elemental addition to binary NiTi, commonly used for many applications [6,7,8,9], can result in various ranges of TTs up to 900 °C based on the type of element and the concentration. NiTiPd alloys with Pd less than 35 at.% showed high irrecoverable strain during thermal cycling under load. However, they displayed other favorable characteristics, such as good work output, low hysteresis, and a reasonable shape memory effect (SME) under some loading conditions [10]. TiNiPt with 20 at.% Pt showed reasonably high TTs, low hysteresis, good work output, and dimensional stability below 350 °C, and good oxidation resistance below 500 °C [10]. Zr and Hf are other elements used for raising the TTs and are becoming more of interest due to their lower cost compared to precious metals (e.g., Au, Pd, or Pt). Hf/Zr addition provides a reasonable increase in TTs with a lower amount of material concentration, which are important factors for low-cost, high-performance, and lightweight actuators [10,11,12,13]. Zr addition of more than 10 at.% increases martensite start (Ms) temperature at a rate of 18 °C/at.%, while the addition of 5–10 at.% and 10–25 at.% of Hf increases binary NiTi TTs at a rate of 5 °C/at.% and 20 °C/at.%, respectively, up to 400 °C. Hence, Hf can increase TTs more effectively [10,14]. Moreover, NiTiHf shows better SME and dimensional stability [15] compared to NiTiZr. Similar to NiTi alloys, properties can be further enhanced in NiTiHf through aging and heat treatment. In Ni-rich NiTiHf alloys, aging leads to precipitation strengthening via nanometer-sized precipitates known as H-phase precipitates. More importantly, 10–20 nm H-phase precipitates have been shown to produce stable NiTiHf both dimensionally and microstructurally, which results in high-strength alloys with excellent superelasticity and actuation, with significantly less training time compared to the binary counterpart [16,17].
As alloys mature and the need for new forms emerges, the development of advanced manufacturing techniques becomes more essential. Conventionally, NiTi-based SMAs have been produced through commonly used processes [18], such as vacuum induction melting [19], vacuum arc melting [20], self-propagating high-temperature synthesis [21], powder metallurgy [22], and mechanical alloying [23]. More recently, additive manufacturing (AM) techniques have been widely investigated [24] to address difficulties in fabricating these hard-to-process alloys, particularly for complex geometries. SLM [25,26,27,28,29,30,31,32,33], wire arc AM [34], electron beam melting [35,36], and direct energy deposition [37,38] are among the AM techniques used to fabricate complex NiTi geometries [39]. A previous study used the laser powder bed fusion or selective laser melting (SLM) technique to additively manufacture Ni-rich NiTiHf20. A set of 30 process parameters (PPs) was used to assess manufacturability, compositional changes, sample densities, and TTs [40]. It was shown that not all the conditions resulted in defect-free samples and by altering PPs suitable range of power and energy density were found to build crack free samples with high density and low porosity level. Later, two representative SLM-fabricated samples with high and low laser powers were mechanically tested which exhibited shape memory behavior and superelasticity [41]. However, the one fabricated with low laser power of 100 W showed comparable results to that of the starting ingot. Building on this work, this study focuses on the thermomechanical properties of several SLM-fabricated NiTiHf specimens with multiple PPs and the effects of SLM PPs on the microstructure and properties.

2. Materials and Methods

A Ni-rich Ni50.4Ti29.6Hf20 (at.%) alloy was produced using the vacuum induction skull melting method followed by casting into rods (Flowserve US Inc, heat designated as FS#9). Electrode induction-melting gas atomization (EIGA) by TLS Technique GMbh (Bitterfeld, Germany) was then employed to produce NiTiHf powder. The particle size distribution of 25 to 75 µm was achieved via a sieving process using the hydraulic Hi-Sifter (Elcan Industries, Tuckahoe, NY, USA). Cuboid parts having a 4 × 4   mm 2 cross section and height of 10   mm were additively manufactured by a SLM machine (Phenix Systems PXM by 3D Systems) equipped with a 300-W ytterbium fiber laser with a wavelength of 1070 nm and spot size of 80 μ m . Laser power (P), scanning speed (v), hatch spacing (H), and layer thickness (t) were considered as the main PPs of the SLM method. Thirty different combinations of P, v, and H were fabricated, while t was kept at 30   μ m . Delamination, cracks, and pores were common defects observed in some combinations of PPs. A detailed study on the SLM builds can be found in our previous work [24,25], and therefore will only be discussed briefly here. Out of 30 fabrication conditions, 17 samples (A1-A17) that were defect free and/or in conditions to be tested were selected for characterization and evaluation. The other 13 samples (A18-A30) with incomplete build or large cracks were not mechanically tested work but were considered in the manufacturability studies. The PPs and related volume energy density ( E = P v h t   J / m m 3 ) are shown in Table 1. The Ni, Ti, and Hf contents were determined using inductively coupled plasma atomic emission spectroscopy (ICP-AES) for selected samples as shown in the Appendix A. Differential scanning calorimetry (DSC, Perkin-Elmer Pyris 1) was used to determine TT. DSC analysis was run twice for each sample under nitrogen atmosphere with a heating/cooling rate of 10   / min . The samples were tested mechanically by using a 100 kN load frame (MTS Landmark servohydraulic test platform). To measure the strain, an MTS high-temperature extensometer was attached to the compression grippers. A mica band heater and internal liquid nitrogen flow through the grippers were used for heating and cooling of the samples, respectively. An X-ray diffraction (XRD) unit (Rigaku D/Max) with wavelength of 1.5418 Å and operated at 40 KV and 44 mA was used to carry out the phase analysis. Bragg–Brentano mode was used for the XRD measurement and Jade software was used for phase identification. Scanning electron microscopy (SEM) and scanning transmission electron microscopy (STEM) were performed with a FEI Quanta 3D FEG and a Tecnai F20, respectively. TEM samples were prepared through focused ion beam (FIB) and samples were grinded and polished for XRD analysis. Polished samples were then etched using a H2O (92%) + HNO3 (6%) + HF (2%) solution for 100 s after mounting on epoxy for optical micrographs.

3. Results and Discussion
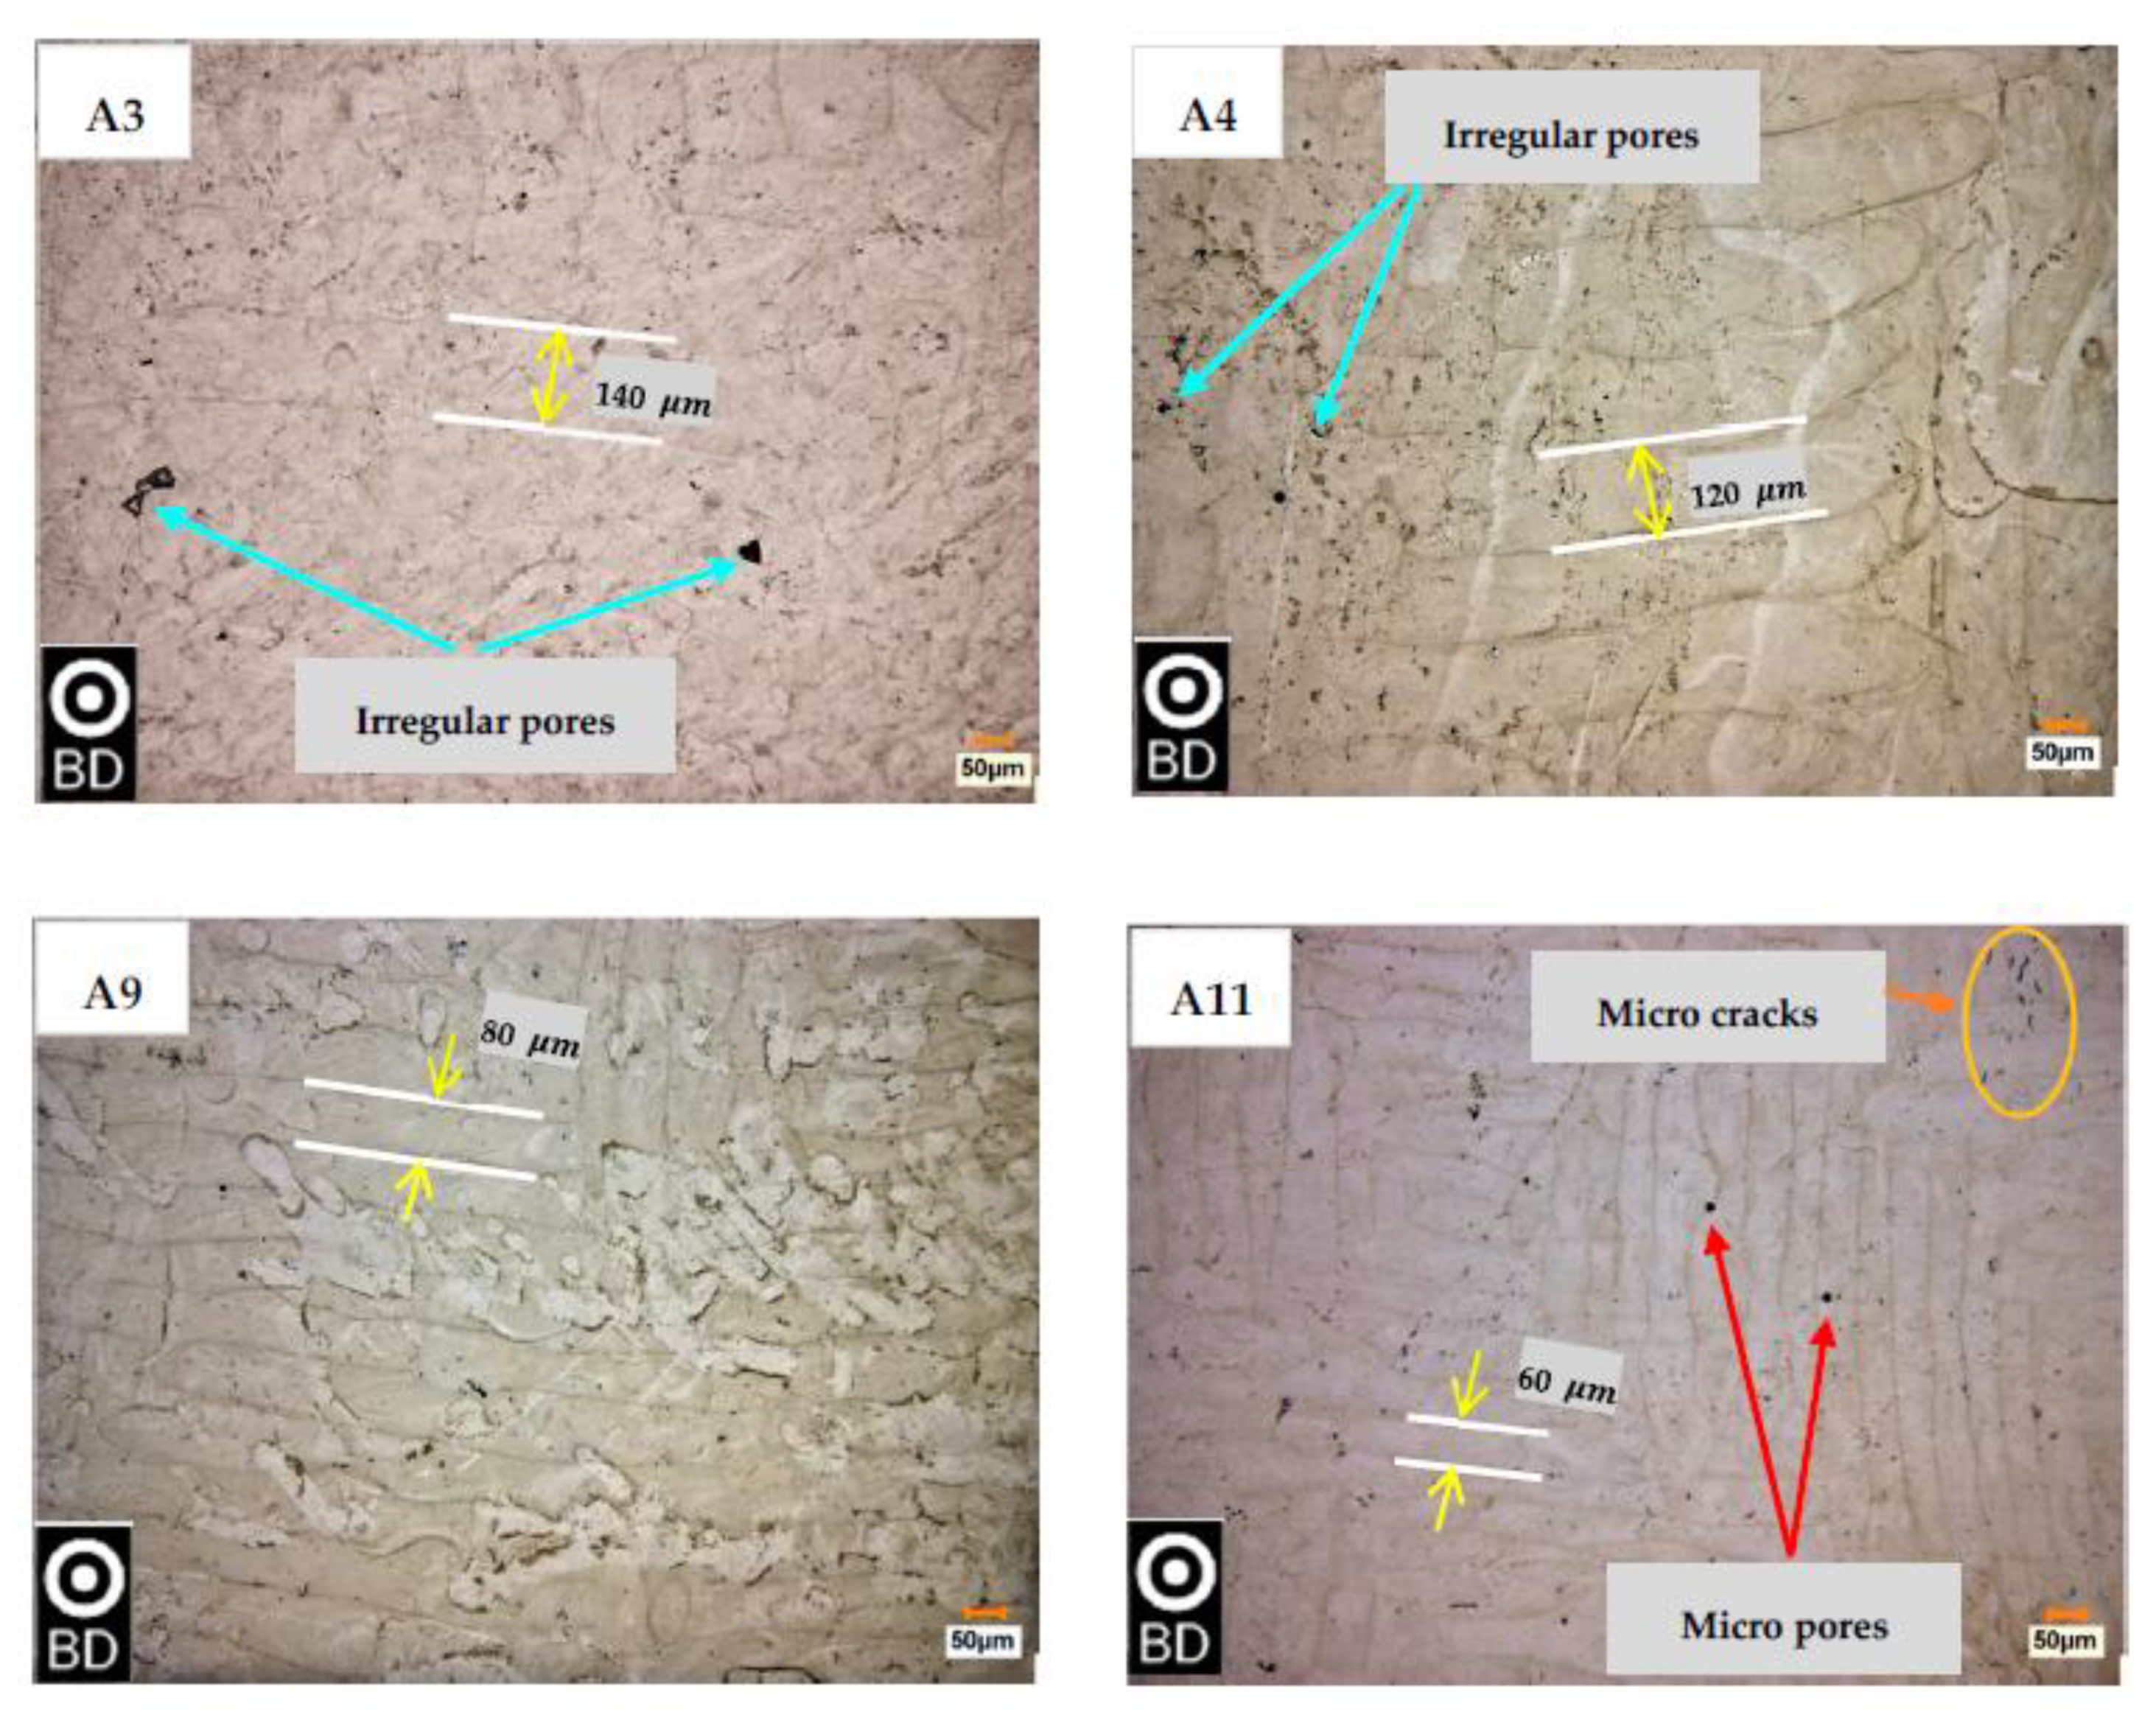
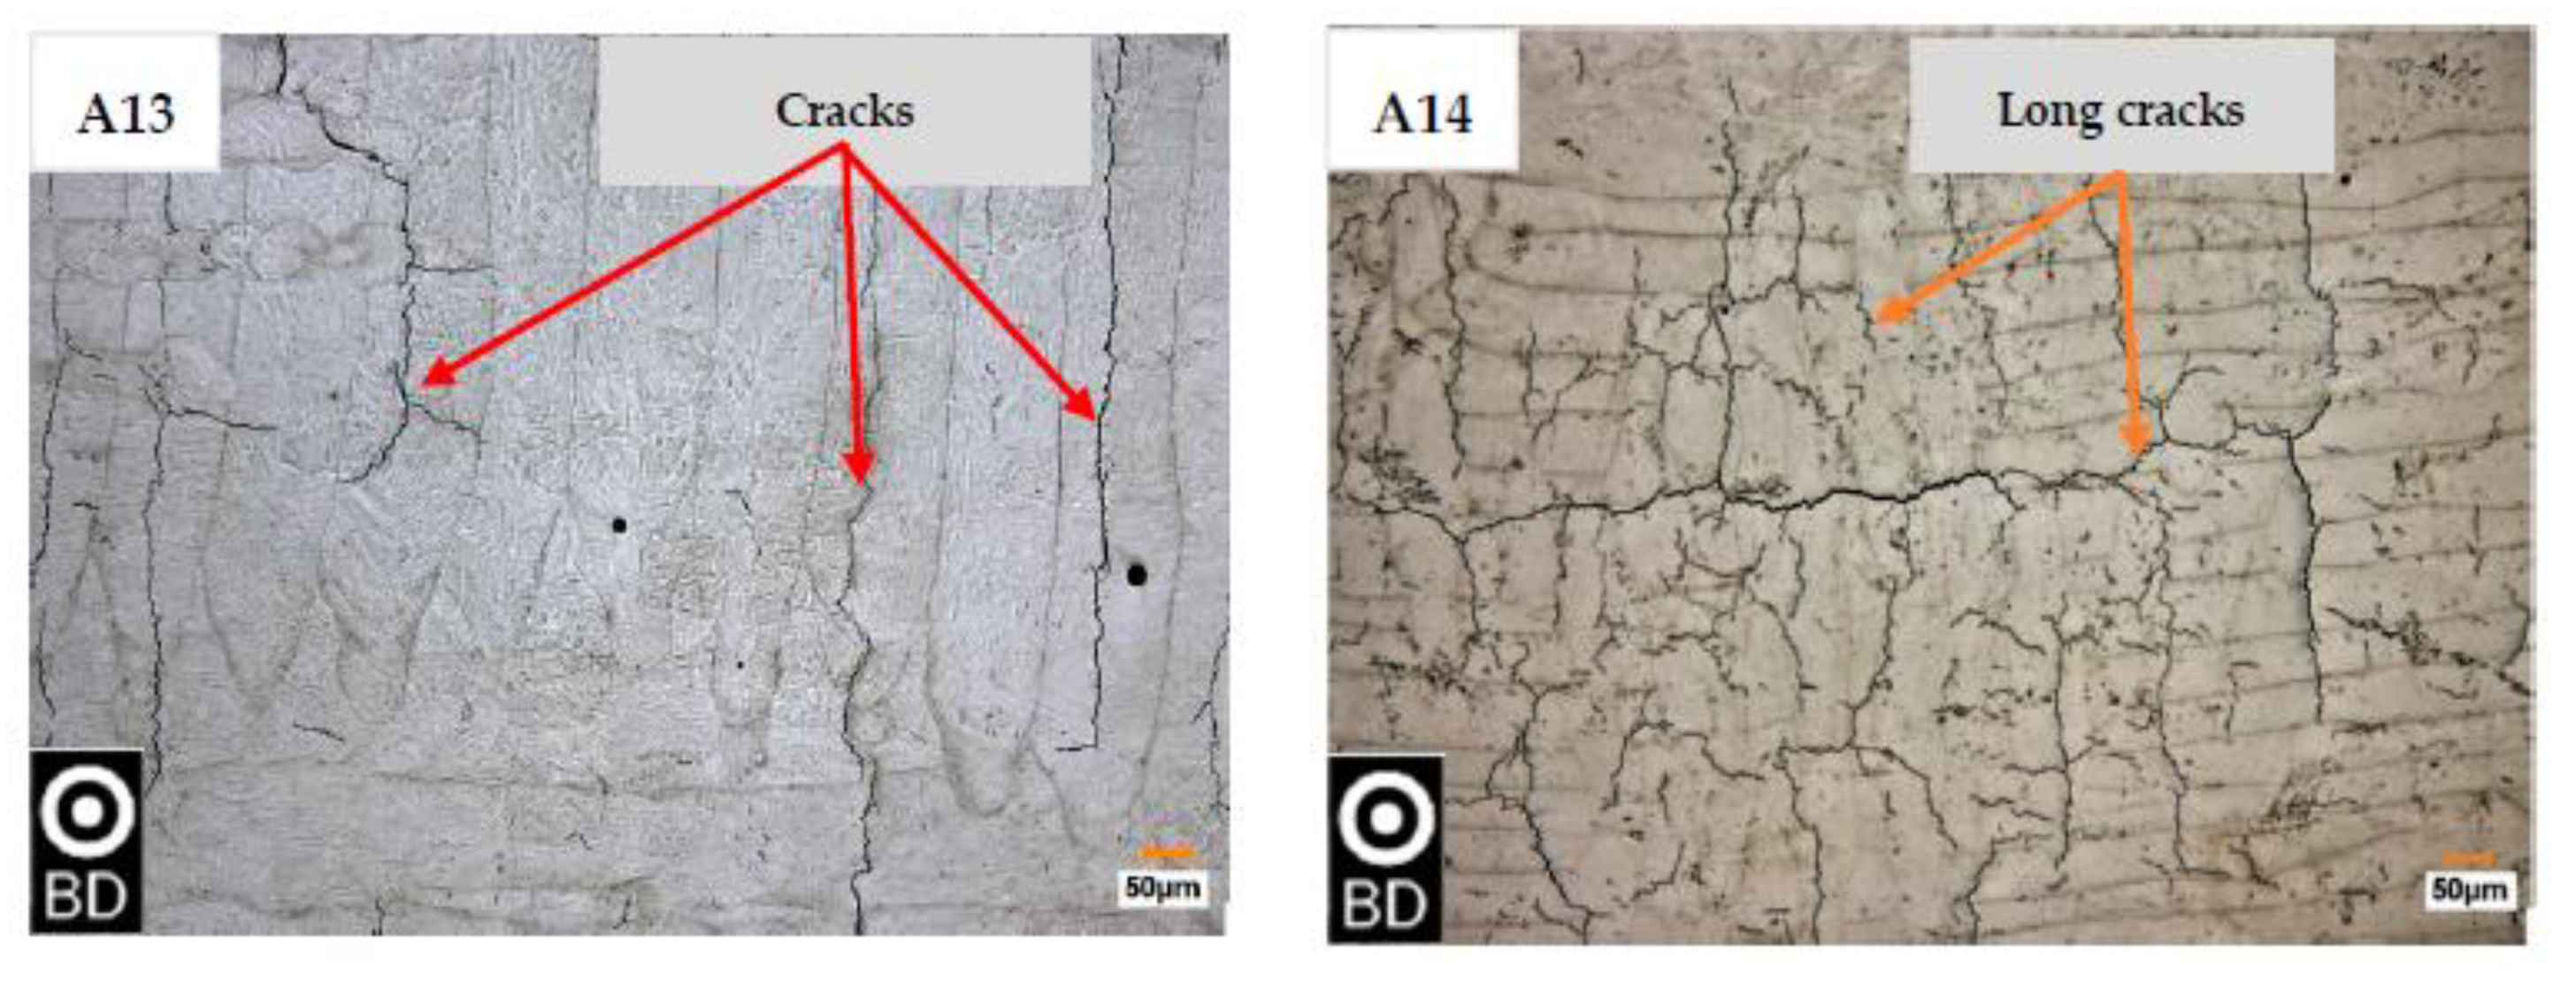
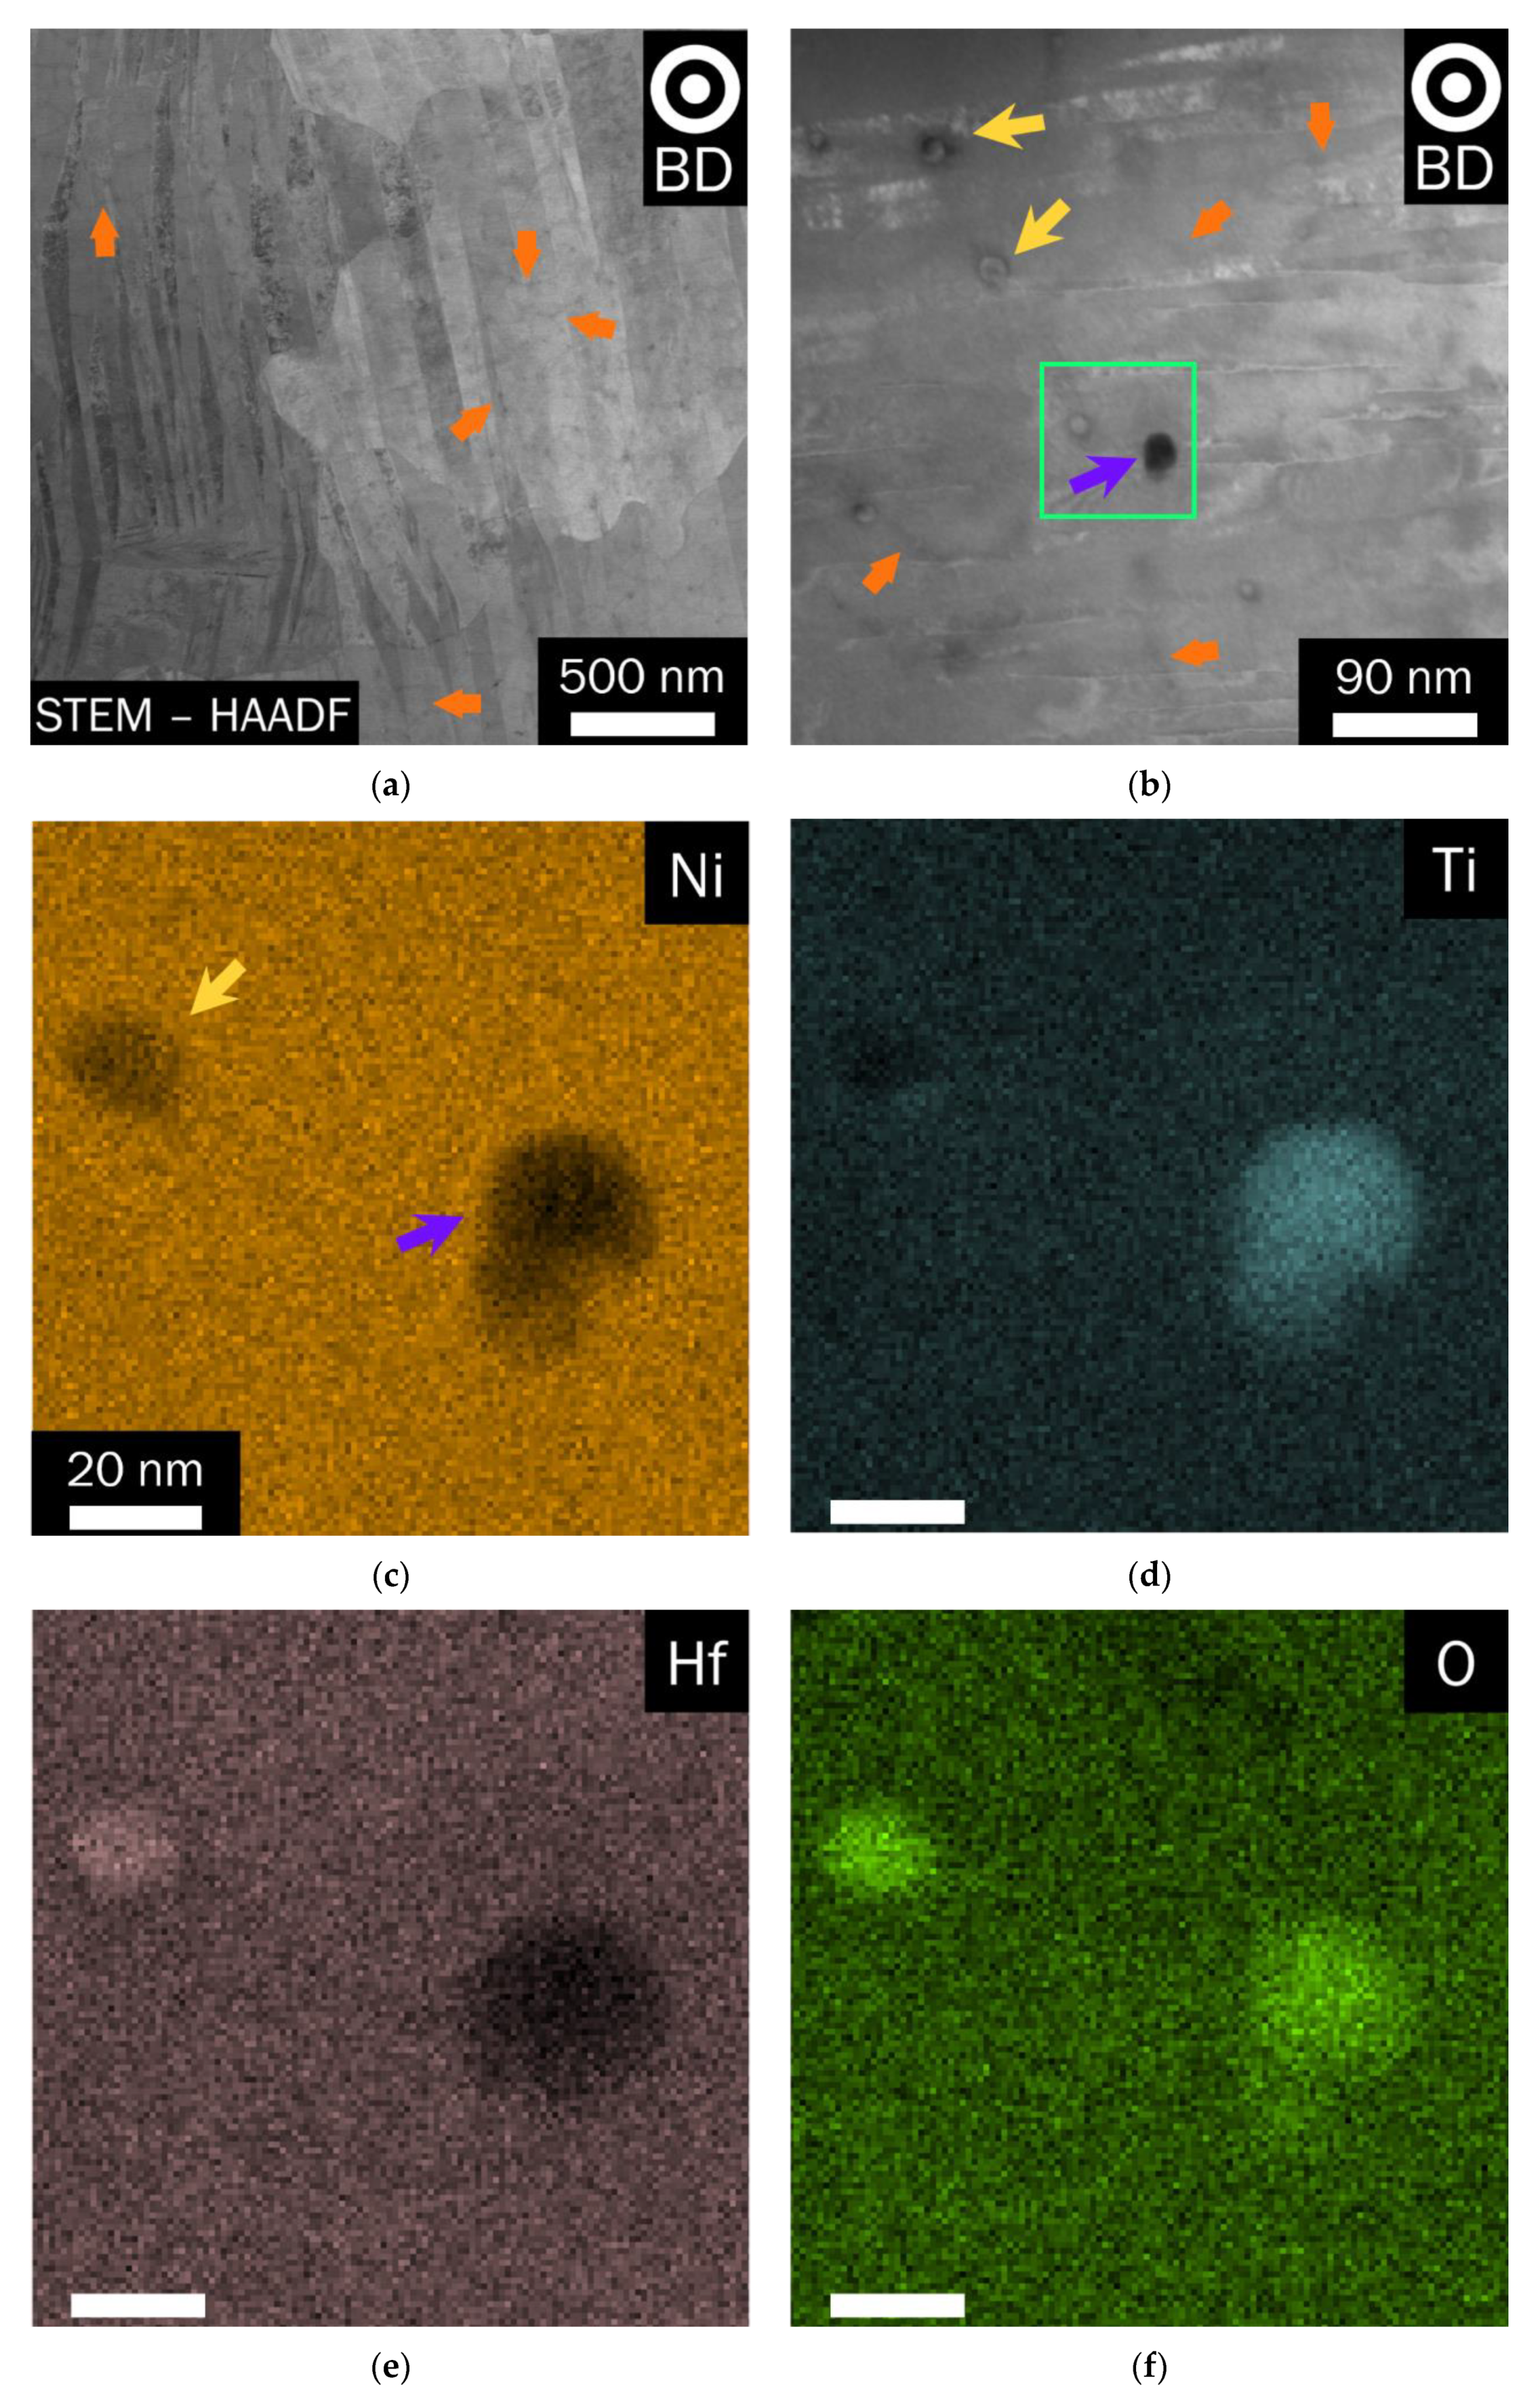
3.1. Microstructure

Figure 1 shows the morphology of the NiTiHf powder and a cross section of one particle cut by FIB. The uniform gray tone in the SEM back-scattered image in Figure 1a indicates good starting homogeneity of the powder. As shown from the previous study [40], low levels of oxygen accompany the EIGA process while keeping the chemistry close to the target composition. The particles are mostly spherical with occasional microsatellites that can form due to the collision of fine and coarse particles during gas atomization. The back-scattered electron image reveals dendritic structures in the powder. This is most likely the solute segregation of the Hf during rapid cooling in gas atomization [42].
Figure 2 shows the optical micrographs of the selected SLM NiTiHf cross sections from low to high energy density. Sample A3 has a low energy density of 59.5 J/mm3 and shows a crack-free microstructure in which some irregular pores are formed. The presence of irregular porosities confirms the lack of sufficient energy density to appropriately melt all the powders [43]. Samples A4 and A9, with energy densities of 69.4 J/mm3 and 104.2 J/mm3, respectively, show crack-free microstructures and smaller pores as compared with the A3 sample. When the energy density reaches 138.9 J/mm3 in sample A11, the presence of microcracks and micro spherical pores can be observed. Increasing laser power to 250 W results in high temperature gradients, whereas the high scanning speed of 1000 mm/s causes a rapid solidification. The input of high thermal energy followed by rapid cooling leads to microcrack formation in the SLM parts [44,45]. Some micro spherical porosity can be found in the A11 sample. Gas entrapment during fabrication and Ni evaporation during the SLM process are two possible reasons for spherical pore formation. The gas-trapped pores formed inside the powder particle play a role in the formation of this kind of porosity; however, other possible reasons exist, such as instable melt-pool flow and Maragoni-driven flow [46]. With very high energy densities of 189.4 J/mm3 (A14) and 178.5 J/mm3 (A13), the long cracks form alongside the melt pools, and in some cases (A15, not shown here) large spherical pores, dominate the microstructure. The solidification shrinkage due to the high temperature gradient forms long cracks on the melt-pool tracks. The high energy density also leads to keyhole defects such as the large spherical pores that are usually formed in the middle of the melt pool [47].
Optical microscopy images of A10 and A11 from the samples’ sides (parallel to build direction) are shown in Figure 3. The semicircular melt pools are marked with dashed lines. As discussed earlier, energy density is one of the most significant factors affecting the microstructure of SLM parts, but it is not the only factor. Samples A10 and A11 were selected because they have approximately the same energy densities but different PPs, namely scanning speed and hatch spacing. The laser power and scanning speed define the melt-pool size, and the hatch spacing dictates the melt-pool overlaps. In this case, the melt-pool overlap is 55 μ m and 75 μ m for A10 and A11, respectively. The differences in the melt-pool overlap result in differences in thermal history and microstructure, potentially leading to different thermomechanical behaviors. In other words, in addition to energy density, the thermal history plays an important role in type of defects, precipitates, grain size, and textures that can form. As shown in Figure 3, long cracks form in A10. However, a uniform crack-free microstructure is achieved in A11 with nearly the same energy density, showing the importance of selecting the right combination of PPs to define the thermal history. This is primarily attributed to the level of residual stresses induced due to the large thermal gradients with two possible mechanisms: the temperature gradient mechanism (TGM) and molten pool cooling. In TGM, the laser creates a melt pool with a very high temperature gradient beneath the laser spot, causing the material to expand, generating tensile stresses (σth) as shown schematically in Figure 3c. The neighboring solidified sublayers are relatively cold and resist this expansion, resulting in compressive stresses on these layers and bending toward the laser beam (Figure 3c). Upon reaching the material yield strength, these compressive stresses can plastically deform the underlying layers, which can form cracks. In molten pool cooling, once the melt pool cools down, it tends to shrink due to thermal contraction while the underlying/surrounding cold material restricts the shrinkage. This induces tensile stresses in the current solidified layer and compressive stresses in the surrounding area [45,48,49].
Figure 4 shows SEM and TEM images of samples A2, A8, and A10 as representatives of samples with low, medium, and high TTs. The grains in SEM micrographs for fabrications of A8 and A10 (Figure 4c,f) span to several melt pools and layers, showing the grains to be columnar. Intergranular cracking in A10 is reminiscent of solidification cracking or ductility dip cracking [50,51]. The melt-pool boundaries in Figure 4c,f (marked with red arrows) have a wider cellular structure and, most likely, larger sites of elemental segregation. These cellular structures can be formed due to the high cooling rates where there is not enough time for dendritic branching to occur [52,53]. Micro segregation in the melt pool can be attributed to partitioning as the solidification progresses. Further compositional analysis of the cellular solidification of A8 is shown in Figure 5. The SEM micrographs for A8 and A10 (Figure 4c,f) show plate martensite spanning the grains through the melt-pool boundaries. At room temperature, all three fabrications show martensitic B19’ monoclinic phase with mixes of both the plate-like and mosaic martensite morphologies. Upon closer inspection of the martensite laths in the structure appear to bend upon low-angle boundaries, as shown with the aqua arrows in the A2 and A8 fabrications (Figure 4b,d). In both the A2 and the A10 fabrications, small contours were present in the martensite laths (Figure 4a,g). The insert in Figure 4a shows a more magnified view of these contours. These contours are presumed to be dislocations or antiphase boundaries, but further characterization is needed for verification.
All fabrications reveal a solute boundary network within the grains, as well as nanoprecipitates on the grains and cell boundaries (Figure 4h). This is unsurprising, as these are preferable sites for precipitate formation. Low-camera-length STEM imaging revealed light z-contrast along these boundaries (Figure 5a). The boundaries are likely to be Ni lean and Ti rich, with some boundaries Hf enriched; similar variations have been observed in NiTi in previous work [54,55], while opposite behavior has been reported in other Ni and Fe alloys with high refractory metals [56,57,58,59]. The dark and light secondary phases (yellow and orange arrows) were further analyzed by mapping and point scans (Figure 5b–e). The X-ray mapping of the selected area suggests the dark phases to be Ti-rich oxides, 13 ± 9 nm, and the light phases to be Hf-enriched oxides, 21 ± 19 nm. It should be noted that the average cell width is 113 ± 21 nm and that the cell shape is not symmetric. Energy-dispersive X-ray spectroscopy (EDS) analysis of the cellular networks and secondary phases in the A10 fabrication revealed similar enrichments and particles. No EDS evidence of H-phase or Ni4Ti3-like precipitates was found, while electron diffraction data were inconclusive. Oxidation during SLM is inevitable due to the high-temperature melt pool, impurities (e.g., oxygen) present in the chamber atmosphere, oxygen adsorption on the powder surface, or powder quality [60].

3.2. Transformation Temperatures and Phases

Figure 6 shows the DSC curves for selected samples categorized in two groups. The first set of samples (Figure 6a) have energy densities below 100 J/mm3, and the second set (Figure 6b) have energy densities above 100 J/mm3. In general, TTs shift to higher temperatures by increasing the energy density for both categories. The effect of the energy density is apparent in the range of austenite finish (Af) temperatures, which are 100 to 250 °C for the low-energy (LE) samples and 250 to 350 °C for the high-energy (HE) samples. It is well known that the Ni content plays a significant role in TTs of Ni-rich alloys. A higher Ni content lowers the TTs [61].
In the LE category, the volume energy density slightly increases from A1 to A3, but there is a large shift observed in TTs. The Ni loss mostly occurs in the center area of the melt pool exhibiting the highest temperature. A higher laser power or a higher linear energy density (P/v) results in a wider affected area and more Ni evaporation. The higher power in sample A3 (250 W) is an example of this effect, with increased Ni evaporation and higher TTs. Local Ni evaporation means heterogeneous composition distribution and a wider DSC peak for samples such as A3. Other local phenomena, such as defects, dislocations, precipitates, and internal stresses, can also impact the TTs. For samples A3–A6, no significant change or a slight shift to higher TTs can be detected as the energy density increases.
Precipitate and/or inclusion formation during the high-temperature SLM process is another mechanism that can affect TTs. Ni/Ti-rich nonmetallic inclusions can form during the fabrication, altering the matrix composition and thereby the TTs. It is noteworthy that the amount of Ni plays a significant role in TTs for Ni-rich alloys, but this effect is weakened in Ti-rich compositions. As shown in the EDS analysis of Figure 5, the Ti(Hf)-rich oxides that form in the matrix can affect the composition of the matrix. The Ti-rich particles deplete the Ti from the matrix and decrease the TTs; however, Ni evaporation can still be the dominant effect. Additionally, the oxide formation on the hot zone of the melt pool can hinder Ni evaporation [62]. Therefore, the Ti-rich oxide formation not only shifts the alloy to a more Ni-rich matrix, but also impedes more Ni evaporation, which is the likely explanation for the lower TTs in sample A7.
In the HE samples, the same trend was observed except for very high energy densities. A15 and A17 have the highest linear energy density of 1000 J/m and 750 J/m, respectively. The high linear energy density significantly increases the size of the melt pool, and consequently more areas are exposed to Ni loss and became Ni lean. Because the TTs of Ni-lean samples are not affected by composition alteration, sharper transformation peaks were observed. Other factors such as grain size, dislocations, and internal stresses can be of importance in phase transformation and require further investigation.
Enthalpy change (ΔH) during phase transformation is derived from the DSC curve and summarized in Figure 6. ΔH is calculated by taking the area under the heating and cooling curves during forward and reverse transformation. This change in enthalpy is due to the changes in chemical enthalpy and strain energy of the transformation as well as the production of internal interfaces during transformation. The Ni content can explain the enthalpy changes due to the different PPs and related energy densities. It has been reported that the enthalpy drops when the Ni content increases in binary NiTi [63]. As shown in Figure 6, ΔH initially increases until energy density reaches 100 J/mm3, followed by a near constant or a slight drop in energy density between 100 J/mm3 and 200 J/mm3, and finally goes up as the energy density increases above 200 J/mm3. This trend confirms the previously discussed compositional variation in NiTiHf samples. The two mechanisms of Ni evaporation and nonmetallic inclusions play the key roles in this trend. In general, ΔH increases with a decrease in Ni content. For energy density below 100 J/mm3, the main mechanism for the linear increase of ΔH can be attributed to the Ni loss, resulting in higher transformation enthalpies with less Ni content. There is a tradeoff between Ni evaporation and (Ti,Hf) oxidation for 100–200 J/mm3, and as a result, the same trend is seen for TTs and enthalpy. When the energy density reaches the higher value above 200 J/mm3, the Ni loss becomes the dominant mechanism.
The hysteresis values, defined as Af minus Ms, are mostly between 40 and 60 °C except for sample A3, which is 31.5 °C. These values are consistent with the previously reported hysteresis ranges for NiTiHf alloys. It is also noted that higher Ni content results in lower hysteresis in cases with Ni less than 50.4 at.% [64,65].
To confirm DSC data and Ni evaporation during process, chemical compositions of selected samples were measured (Appendix A). Figure 7 shows Af and laser power as a function of nickel content. Af is well-correlated with the measured Ni content and increases almost linearly with the decrease of Ni. The trend and ranges are very close to what has been reported for extruded and homogenized NiTiHf20 alloys [64] and slight variations can be due to the inhomogeneities in the SLM fabricated samples. Similarly, Ni content decreases with the increase of laser power due to higher melt pool temperatures resulting in higher rate of Ni-evaporation. However, TTs were not solely dependent on laser power as they also depend on other process parameters and energy density. For example, A24 and A28 have the same laser power and speed (100 W and 200 mm/s) but different hatch spaces (120 µm and 60 µm, respectively) so the energy density of A28 is twice the energy density of A24. Therefore, lower Ni and higher TTs are expected for A28. On the other hand, A24 and A25 have almost the same energy density (140 J/mm3) but different Ni-content and TTs which stem mainly from different laser powers and hatch spaces. Therefore, just relying on either laser power or energy density is too simplistic and other process parameters should also be considered for the careful selection of PPs and to tailor TTs.
Figure 8 shows the XRD spectra of NiTiHf powder, sample A2 (Ev = 59.5 J/mm3) and sample A10 (Ev = 127.5 J/mm3) at room temperature. The powder shows a fully martensitic phase at room temperature, which confirms the DSC results showing martensite finish temperature near 80 °C. Similarly, samples A2 and A10 are also martensitic at room temperature consistent with the DSC results and martensite phase was found to be monoclinic B19’ which is along the findings reported for the NiTiHf alloys reported in the literature [66]. No significant differences can be observed in the phases and characteristic peaks of these two samples and major peaks are observed within 35°–50° of 2θ. However, there are slight differences in peak intensities between the powder and the SLM-fabricated samples. This can be expected, given that the parts are built under varying thermal conditions that can result in preferentially formed martensite orientations.

3.3. Thermomechanical Behavior

Constant stress thermal cycling responses under various levels of compressive stress are shown in Figure 9 for selected samples. For brevity, only six samples are shown; extracted data corresponding to the other samples can be found in the summary figures. The results are categorized into two main categories as defined in Section 3.2: LE and HE. The upper cycle temperatures were selected based on the DSC results and Af temperature to ensure complete phase transformation. In the lower stresses (100 MPa and 300 MPa), most of the samples show no or low transformation or residual (εirr) strains. At 100 MPa, A1 and A2 show recovered (actuation) strains (εrec) of 0.9% and 0.94%, with 0.03% and zero residual strains, respectively. These are in line with the 0.72% actuation strain and zero residual strain observed for ingot. The rest of the samples show less than 0.4% actuation strains. The low actuation strains in these samples are mostly due to insufficient applied stress to reorient additional martensite variants. Hence, partial recovery is achieved.
As the stress level increases, actuation strains start to increase; after a peak stress, they saturate and then decrease. Once this critical stress is reached, no further thermal cycles are performed. This peak stress happened at 200 MPa (εrec = 1.15%) for A1 and at 400 MPa (εrec = 1.67%) for A2, with comparatively low εirr in both cases. These two have the lowest energy densities among all samples. Samples A12 and A13 have the highest energy densities; they showed actuation strains of 0.35% and 0.32%, respectively, at 500 MPa, which is much higher than stresses applied on A1 and A2 samples. For a better comparison, actuation strains and residual strains of all samples were extracted from the thermomechanical cycles shown in Figure 9 for both of the categories and plotted in Figure 10. The solid lines are the actuation strains, and the dashed lines indicate residual strains measured at the upper cycle temperature. It is clear that the HE samples mostly exhibited lower actuation strains in comparison with LE samples. Moreover, higher stress levels are required to induce transformation in HE samples based on the data shown in Figure 10. In addition, in HE samples, a higher accumulation of residual strains can be seen compared to the increase of actuation strains.
In general, εrec increases as the level of stress increases, reaching a peak, and then starts to decrease. This behavior is a previously documented phenomenon for NiTiHf alloys [67]. Increasing the stress promotes additional variant reorientation, contributing to increased strains. Once a critical stress is reached, plastic deformation takes place, resulting in decreased strain recovery. As expected, the irrecoverable strains accompany the transformation at low stresses, and increase as a function of stress as the other mechanism become more prevalent [10].
As discussed in Nematollahi et al. [40], PPs could affect the compositions and so can result in affected yield strengths and show peaks at different stress levels. It should be noted that compositions also impact another important factor which is transformation temperatures. As discussed in Section 3.2, higher energy densities or lower scanning speeds result in higher temperatures in the melt pool, a higher level of Ni evaporation, lower Ni content, and thus higher TTs. Higher TTs mean higher critical stresses needed for inducing martensite phase transformation. It is well reported that Ni-lean NiTiHf alloys have higher TTs in comparison with Ni-rich NiTiHf alloys while showing poor thermomechanical stability under thermal cycling, low plastic strength, and large thermal hysteresis [68].
It is noteworthy to study the evolution of TTs as a function of applied compressive stresses. Figure 11 shows compressive stress versus Ms temperatures for various samples extracted from the thermal cycling curves. In general, based on the Clausius–Clapeyron (C–C) equation, TTs tend to increase linearly with the increase in applied stress during each thermal cycling. A1, A2, and A7 have the lowest slopes—12.6, 8.7, and 13.6 MPa/C—while the HE samples have almost stable Ms, resulting in high C–C slope. This explains the poor superelastic results achieved for the sample with high power in previously published work [41].
The microstructure and thermomechanical properties of the SLM-fabricated NiTiHf samples were investigated in this study. One of the limitations of this study is that not all PPs resulted in testable samples. Results showed that that energy density is a primary but not exclusive factor impacting the properties of SLM parts. For example, while the energy densities of A10 and A11 were similar (127 J/mm3 and 138 J/mm3, respectively), A10 had longitudinal cracks along the build direction while A11 was a defect-free sample. In addition to physical properties, other parameters such as laser power, scanning speed, and hatch spacing can individually alter the thermomechanical behavior of the samples by changing the final part properties. For instance, the laser power and scanning speeds of A3, A4, A9, and A11 were kept constant at a level of 250 W and 1000 mm/s, while the hatch spacing decreased from 140 to 60 μm. Further, as shown in Figure 10, the actuation strains at the stress level of 300 MPa are different for the samples, and as the hatch spacing increases, the actuation strains also increase. Two main factors resulted in poor mechanical behavior, particularly for the samples fabricated with high laser power and energy input, were cracking and Ni evaporation [41]. Nonetheless, it is well documented that size, shape, and orientation of the grains as well as the texture have a remarkable impact on the thermomechanical properties of SMAs. As shown in Figure 3, the melt-pool size, shape, and overlap are different for A10 and A11, while the energy density is almost the same. The overlap of the melt pools, mainly controlled by hatch spacing, could significantly alter the thermal history and thus the microstructure and grain morphology of the fabricated samples. Follow-up studies are needed to investigate the effect of individual parameters on the parts properties. This study provides general guidelines to select the optimum window of energy density and PPs to tailor the shape memory properties of SLM NiTiHf parts.

4. Conclusions

In this study, a wide range of PPs, including laser power, scanning speed, and hatch spacing, were selected to fabricate Ni-rich NiTiHf coupons via SLM technique for the first time. It was discussed that the energy density plays a key role, but not the only role, in composition, microstructural and thermomechanical properties of as-fabricated parts. Parts with lower energy densities showed fewer defects, with the exception of some irregular porosities due to incomplete fusion or spherical gas entrapment (e.g., A3, A4, and A9). Increasing the energy density resulted in long cracks along the melt-pool track due to excessive residual stresses (e.g., A10 and A15). Parts showed various TTs in the range of 100 to 400 °C. Parts with higher energy density showed higher TTs than parts with lower energy density. The Ni evaporation and Ti-rich oxide formation were found to be the two main mechanisms contributing to the observed changes in the TTs. Composition analysis also confirmed Ni loss in higher laser powers and energy densities. Higher TT could be a useful alternative application that should be coupled with further stabilizing processing. The XRD analysis and TEM images confirmed the formation of B19’ martensite phase for as-fabricated parts at room temperature. The thermomechanical responses showed that the recovery strain decreases with the energy density as a general trend. A maximum actuation strain of 1.67% at 400 MPa was obtained for A2 with power, scan speed, and hatch space of 100 W, 400 mm/s, and 140 µm, respectively. The results achieved in this study can be used to select proper PPs to produce SLM NiTiHf samples with properties comparable to those of conventionally made samples.

Author Contributions

Conceptualization, M.N.; Data curation, M.N., G.P.T., K.S., A.H., and S.E.S.; Formal analysis, M.N. and K.S.; Funding acquisition, M.E.; Investigation, G.P.T. and A.H.; Methodology, M.N.; Project administration, M.E.; Resources, M.E.; Supervision, O.B., M.J.M., H.K., and M.E.; Writing—original draft, M.N. and K.S.; Writing—review & editing, M.N., G.P.T., K.S., A.H., S.E.S., O.B., H.K., and M.E. All authors have read and agreed to the published version of the manuscript.

Funding

This research received no external funding.

Acknowledgments

The authors would like to acknowledge the financial support of the Ohio Federal Research Network and the NASA Glenn Research Center. O.B. acknowledges support from the NASA Aeronautics Research Mission Directorate (ARMD), Transformational Tools and Technologies (TTT) projects. Electron microscopy was performed at the Center for Electron Microscopy and Analysis (CEMAS) at The Ohio State University.

Conflicts of Interest

The authors declare no conflict of interest.

Appendix A

Table A1. Measured Nickel, Titanium, and Hafnium content for selected samples.
SAMPLE #POWER
(W)
SPEED
(MM/S)
HATCH
(µM)
EV
(J/mm3)
AF
(°C)
NI
(AT. %)
TI
(AT. %)
HF
(AT. %)
A281002006027728050.2829.8219.85
A261002008020814450.529.7919.64
A2410020012013815050.5129.8219.63
A19100733607514650.4329.8119.7
A251354008014023950.3229.8519.78
A181358008070.314350.4929.8119.64
A211501000608318750.4429.8119.69
A2220010006011127650.229.8919.84
POWDER------------15050.4229.819.67

References

  1. Firstov, G.; Van Humbeeck, J.; Koval, Y.N. High Temperature Shape Memory Alloys Problems and Prospects. J. Intell. Mater. Syst. Struct. 2006, 17, 1041–1047. [Google Scholar] [CrossRef]
  2. Schetky, L.M. Shape memory alloy applications in space systems. Mater. Des. 1991, 12, 29–32. [Google Scholar] [CrossRef]
  3. Calkins, F.; Butler, G.; Mabe, J. Variable Geometry Chevrons for Jet Noise Reduction. In Proceedings of the 12th AIAA/CEAS Aeroacoustics Conference (27th AIAA Aeroacoustics Conference), Cambridge, MA, USA, 8–10 May 2006; p. 2546. [Google Scholar]
  4. Webster, J. High integrity adaptive SMA components for gas turbine applications. In Proceedings of the Smart Structures and Materials 2006: Industrial and Commercial Applications of Smart Structures Technologies, San Diego, CA, USA, 26 February–2 March 2006; Volume 6171, p. 61710F. [Google Scholar] [CrossRef]
  5. Benafan, O.; Gaydosh, D.J. High temperature shape memory alloy Ni50.3Ti29.7Hf20torque tube actuators. Smart Mater. Struct. 2017, 26, 095002. [Google Scholar] [CrossRef]
  6. Lagoudas, D.C. Shape Memory Alloys: Modeling and Engineering Applications; Springer Science & Business Media: Berlin/Heidelberg, Germany, 2008. [Google Scholar]
  7. Hartl, D.J.; Lagoudas, D.C. Aerospace applications of shape memory alloys. Proc. Inst. Mech. Eng. Part G J. Aerosp. Eng. 2007, 221, 535–552. [Google Scholar] [CrossRef] [Green Version]
  8. Nematollahi, M.; Mehrabi, R.; Callejas, M.A.; Elahinia, H.; Elahinia, M. A two-way architectural actuator using NiTi SE wire and SME spring. In Proceedings of the Active and Passive Smart Structures and Integrated Systems XII, Denver, CO, USA, 5–8 March 2018; SPIE-The International Society for Optical Engineering. Volume 10595, p. 105952. [Google Scholar] [CrossRef]
  9. Nematollahi, M.; Baghbaderani, K.S.; Amerinatanzi, A.; Zamanian, H.; Elahinia, M. Application of NiTi in Assistive and Rehabilitation Devices: A Review. Bioengineering 2019, 6, 37. [Google Scholar] [CrossRef] [Green Version]
  10. Ma, J.; Karaman, I.; Noebe, R.D. High temperature shape memory alloys. Int. Mater. Rev. 2010, 55, 257–315. [Google Scholar] [CrossRef]
  11. Evirgen, A.; Karaman, I.; Santamarta, R.; Pons, J.; Noebe, R.D. Microstructural characterization and shape memory characteristics of the Ni50.3Ti34.7Hf15 shape memory alloy. Acta Mater. 2015, 83, 48–60. [Google Scholar] [CrossRef]
  12. Young, B.; Haghgouyan, B.; Lagoudas, D.C.; Karaman, I. Effect of Temperature on the Fracture Toughness of a NiTiHf High Temperature Shape Memory Alloy. Shape Mem. Superelasticity 2019, 5, 362–373. [Google Scholar] [CrossRef]
  13. Santamarta, R.; Arróyave, R.; Pons, J.; Evirgen, A.; Karaman, I.; Karaca, H.; Noebe, R.D. TEM study of structural and microstructural characteristics of a precipitate phase in Ni-rich Ni–Ti–Hf and Ni–Ti–Zr shape memory alloys. Acta Mater. 2013, 61, 6191–6206. [Google Scholar] [CrossRef]
  14. Mulder, J. Investigation on High Temperature Shape Memory Alloys Using Ni-Ti-Zr and Ni-Ti-Hf System. Ph.D. Thesis, University of Twente, Enschede, The Netherlands, 23 February 1995. [Google Scholar]
  15. Babacan, N.; Bilal, M.; Hayrettin, C.; Liu, J.; Benafan, O.; Karaman, I. Effects of cold and warm rolling on the shape memory response of Ni50Ti30Hf20 high-temperature shape memory alloy. Acta Mater. 2018, 157, 228–244. [Google Scholar] [CrossRef]
  16. Amin-Ahmadi, B.; Pauza, J.G.; Shamimi, A.; Duerig, T.W.; Noebe, R.D.; Stebner, A.P. Coherency strains of H-phase precipitates and their influence on functional properties of nickel-titanium-hafnium shape memory alloys. Scr. Mater. 2018, 147, 83–87. [Google Scholar] [CrossRef]
  17. Amin-Ahmadi, B.; Gallmeyer, T.; Pauza, J.G.; Duerig, T.W.; Noebe, R.D.; Stebner, A.P. Effect of a pre-aging treatment on the mechanical behaviors of Ni50.3Ti49.7−xHfx (x ≤ 9 at.%) Shape memory alloys. Scr. Mater. 2018, 147, 11–15. [Google Scholar] [CrossRef]
  18. Elahinia, M.H.; Hashemi, M.; Tabesh, M.; Bhaduri, S.B. Manufacturing and processing of NiTi implants: A review. Prog. Mater. Sci. 2012, 57, 911–946. [Google Scholar] [CrossRef]
  19. Bigelow, G.S.; Garg, A.; Padula, S.; Gaydosh, D.; Noebe, R. Load-biased shape-memory and superelastic properties of a precipitation strengthened high-temperature Ni50.3Ti29.7Hf20 alloy. Scr. Mater. 2011, 64, 725–728. [Google Scholar] [CrossRef]
  20. Shahmir, H.; Nili-Ahmadabadi, M.; Naghdi, F. Superelastic behavior of aged and thermomechanical treated NiTi alloy at Af+10 °C. Mater. Des. 2011, 32, 365–370. [Google Scholar] [CrossRef]
  21. Biffi, C.; Bassani, P.; Sajedi, Z.; Giuliani, P.; Tuissi, A. Laser ignition in Self-propagating High temperature Synthesis of porous NiTinol Shape Memory Alloy. Mater. Lett. 2017, 193, 54–57. [Google Scholar] [CrossRef]
  22. Farvizi, M.; Javan, M.K.; Akbarpour, M.; Kim, H. Fabrication of NiTi and NiTi-nano Al2O3 composites by powder metallurgy methods: Comparison of hot isostatic pressing and spark plasma sintering techniques. Ceram. Int. 2018, 44, 15981–15988. [Google Scholar] [CrossRef]
  23. Patra, A.; Saxena, R.; Karak, S.; Laha, T.; Sahoo, S. Fabrication and characterization of nano-Y 2 O 3 dispersed W-Ni-Mo and W-Ni-Ti-Nb alloys by mechanical alloying and spark plasma sintering. J. Alloy. Compd. 2017, 707, 245–250. [Google Scholar] [CrossRef]
  24. Elahinia, M.; Moghaddam, N.S.; Andani, M.T.; Amerinatanzi, A.; Bimber, B.A.; Hamilton, R.F. Fabrication of NiTi through additive manufacturing: A review. Prog. Mater. Sci. 2016, 83, 630–663. [Google Scholar] [CrossRef] [Green Version]
  25. Nematollahi, M.; Jahadakbar, A.; Mahtabi, M.J.; Elahinia, M.; Namatollahi, M. Additive manufacturing (AM). In Metals for Biomedical Devices, 2nd ed.; Woodhead Publishing Series in Biomaterials: Sawston, UK; Cambridge, UK, 2019; pp. 331–353. [Google Scholar] [CrossRef]
  26. Xiong, Z.; Li, Z.; Sun, Z.; Hao, S.; Yang, Y.; Li, M.; Song, C.; Qiu, P.; Cui, L. Selective laser melting of NiTi alloy with superior tensile property and shape memory effect. J. Mater. Sci. Technol. 2019, 35, 2238–2242. [Google Scholar] [CrossRef]
  27. Mehrpouya, M.; Gisario, A.; Rahimzadeh, A.; Nematollahi, M.; Baghbaderani, K.S.; Elahinia, M. A prediction model for finding the optimal laser parameters in additive manufacturing of NiTi shape memory alloy. Int. J. Adv. Manuf. Technol. 2019, 105, 4691–4699. [Google Scholar] [CrossRef]
  28. Tan, C.; Li, S.; Essa, K.; Jamshidi, P.; Zhou, K.; Ma, W.; Attallah, M.M. Laser Powder Bed Fusion of Ti-rich TiNi lattice structures: Process optimisation, geometrical integrity, and phase transformations. Int. J. Mach. Tools Manuf. 2019, 141, 19–29. [Google Scholar] [CrossRef] [Green Version]
  29. Biffi, C.; Bassani, P.; Nematollahi, M.; Moghaddam, N.S.; Amerinatanzi, A.; Mahtabi, M.; Elahinia, M.; Tuissi, A. Effect of Ultrasonic Nanocrystal Surface Modification on the Microstructure and Martensitic Transformation of Selective Laser Melted Nitinol. Materials 2019, 12, 3068. [Google Scholar] [CrossRef] [Green Version]
  30. Safaei, K.; Nematollahi, M.; Bayati, P.; Dabbaghi, H.; Benafan, O.; Elahinia, M. Torsional behavior and microstructure characterization of additively manufactured NiTi shape memory alloy tubes. Eng. Struct. 2021, 226, 111383. [Google Scholar] [CrossRef]
  31. Firstov, G.S.; Koval, Y.; Van Humbeeck, J.; Timoshevskii, A.; Kosorukova, T.; Verhovlyuk, P. Some Physical Principles of High Temperature Shape Memory Alloys Design. Mater. Sci. Found. 2015, 81, 207–231. [Google Scholar] [CrossRef]
  32. Wang, X.; Speirs, M.; Kustov, S.; Vrancken, B.; Li, X.; Kruth, J.-P.; Van Humbeeck, J. Selective laser melting produced layer-structured NiTi shape memory alloys with high damping properties and Elinvar effect. Scr. Mater. 2018, 146, 246–250. [Google Scholar] [CrossRef]
  33. Dadbakhsh, S.; Speirs, M.; Kruth, J.-P.; Schrooten, J.; Luyten, J.; Van Humbeeck, J. Effect of SLM Parameters on Transformation Temperatures of Shape Memory Nickel Titanium Parts. Adv. Eng. Mater. 2014, 16, 1140–1146. [Google Scholar] [CrossRef]
  34. Wang, J.; Pan, Z.; Yang, G.; Han, J.; Chen, X.; Li, H. Location dependence of microstructure, phase transformation temperature and mechanical properties on Ni-rich NiTi alloy fabricated by wire arc additive manufacturing. Mater. Sci. Eng. A 2019, 749, 218–222. [Google Scholar] [CrossRef]
  35. Zhou, Q.; Hayat, M.D.; Chen, G.; Cai, S.; Qu, X.; Tang, H.; Cao, P. Selective electron beam melting of NiTi: Microstructure, phase transformation and mechanical properties. Mater. Sci. Eng. A 2019, 744, 290–298. [Google Scholar] [CrossRef]
  36. Wang, C.; Tan, X.; Du, Z.; Chandra, S.; Sun, Z.; Lim, C.; Tor, S.; Wong, C. Additive manufacturing of NiTi shape memory alloys using pre-mixed powders. J. Mater. Process. Technol. 2019, 271, 152–161. [Google Scholar] [CrossRef]
  37. Patil, R.B.; Yadava, V. Finite element analysis of temperature distribution in single metallic powder layer during metal laser sintering. Int. J. Mach. Tools Manuf. 2007, 47, 1069–1080. [Google Scholar] [CrossRef]
  38. Hou, H.; Simsek, E.; Ma, T.; Johnson, N.S.; Qian, S.; Cisse, C.; Stasak, D.; Al Hasan, N.; Zhou, L.; Hwang, Y.; et al. Fatigue-resistant high-performance elastocaloric materials via additive manufacturing. Science 2019, 366, 1116–1121. [Google Scholar] [CrossRef] [PubMed] [Green Version]
  39. Saghaian, S.E.; Amerinatanzi, A.; Moghaddam, N.S.; Majumdar, A.; Nematollahi, M.; Saedi, S.; Elahinia, M.; Karaca, H.E. Mechanical and shape memory properties of triply periodic minimal surface (TPMS) NiTi structures fabricated by selective laser melting. Biol. Eng. Med. 2018, 3, 1–7. [Google Scholar] [CrossRef]
  40. Nematollahi, M.; Toker, G.; Saghaian, S.E.; Salazar, J.; Mahtabi, M.; Benafan, O.; Karaca, H.; Elahinia, M. Additive Manufacturing of Ni-Rich NiTiHf20: Manufacturability, Composition, Density, and Transformation Behavior. Shape Mem. Superelasticity 2019, 5, 113–124. [Google Scholar] [CrossRef]
  41. Toker, G.P.; Nematollahi, M.; Saghaian, S.E.; Baghbaderani, K.S.; Benafan, O.; Elahinia, M.; Karaca, H.E. Shape memory behavior of NiTiHf alloys fabricated by selective laser melting. Scr. Mater. 2020, 178, 361–365. [Google Scholar] [CrossRef]
  42. Wang, F.; Xiong, B.; Zhang, Y.; Liu, H.; He, X. Microstructural development of spray-deposited Al–Zn–Mg–Cu alloy during subsequent processing. J. Alloy. Compd. 2009, 477, 616–621. [Google Scholar] [CrossRef]
  43. Saedi, S.; Moghaddam, N.S.; Amerinatanzi, A.; Elahinia, M.; Karaca, H. On the effects of selective laser melting process parameters on microstructure and thermomechanical response of Ni-rich NiTi. Acta Mater. 2018, 144, 552–560. [Google Scholar] [CrossRef]
  44. Harrison, N.J.; Todd, I.; Mumtaz, K.A. Reduction of micro-cracking in nickel superalloys processed by Selective Laser Melting: A fundamental alloy design approach. Acta Mater. 2015, 94, 59–68. [Google Scholar] [CrossRef] [Green Version]
  45. Mercelis, P.; Kruth, J. Residual stresses in selective laser sintering and selective laser melting. Rapid Prototyp. J. 2006, 12, 254–265. [Google Scholar] [CrossRef]
  46. Ng, G.K.L.; Jarfors, A.E.W.; Bi, G.; Zheng, H.Y. Porosity formation and gas bubble retention in laser metal deposition. Appl. Phys. A 2009, 97, 641. [Google Scholar] [CrossRef]
  47. Cunningham, R.; Zhao, C.; Parab, N.D.; Kantzos, C.; Pauza, J.; Fezzaa, K.; Sun, T.; Rollett, A.D. Keyhole threshold and morphology in laser melting revealed by ultrahigh-speed X-ray imaging. Science 2019, 363, 849–852. [Google Scholar] [CrossRef] [PubMed]
  48. Schilp, J.; Seidel, C.; Krauss, H.; Weirather, J. Investigations on Temperature Fields during Laser Beam Melting by Means of Process Monitoring and Multiscale Process Modelling. Adv. Mech. Eng. 2014, 6, 1–7. [Google Scholar] [CrossRef]
  49. Shiomi, M.; Osakada, K.; Nakamura, K.; Yamashita, T.; Abe, F. Residual Stress within Metallic Model Made by Selective Laser Melting Process. CIRP Ann. 2004, 53, 195–198. [Google Scholar] [CrossRef]
  50. Attallah, M.M.; Jennings, R.; Wang, X.; Carter, L. Additive manufacturing of Ni-based superalloys: The outstanding issues. MRS Bull. 2016, 41, 758–764. [Google Scholar] [CrossRef]
  51. Mukherjee, T.; Zuback, J.S.; De, A.; Debroy, T. Printability of alloys for additive manufacturing. Sci. Rep. 2016, 6, 1–8. [Google Scholar] [CrossRef] [Green Version]
  52. Pham, M.-S.; Dovgyy, B.; Hooper, P.A.; Gourlay, C.M.; Piglione, A. The role of side-branching in microstructure development in laser powder-bed fusion. Nat. Commun. 2020, 11, 1–12. [Google Scholar] [CrossRef]
  53. Debroy, T.; Wei, H.; Zuback, J.; Mukherjee, T.; Elmer, J.; Milewski, J.; Beese, A.; Wilson-Heid, A.; De, A.; Zhang, W. Additive manufacturing of metallic components–Process, structure and properties. Prog. Mater. Sci. 2018, 92, 112–224. [Google Scholar] [CrossRef]
  54. Parvizi, S.; Hashemi, S.M.; Asgarinia, F.; Nematollahi, M.; Elahinia, M. Effective parameters on the final properties of NiTi-based alloys manufactured by powder metallurgy methods: A review. Prog. Mater. Sci. 2020, 20, 100739. [Google Scholar] [CrossRef]
  55. Sam, J.; Franco, B.; Ma, J.; Karaman, I.; Elwany, A.; Mabe, J. Tensile actuation response of additively manufactured nickel-titanium shape memory alloys. Scr. Mater. 2018, 146, 164–168. [Google Scholar] [CrossRef]
  56. Muñoz-Moreno, R.; Divya, V.; Driver, S.; Messé, O.; Illston, T.; Baker, S.; Carpenter, M.; Stone, H. Effect of heat treatment on the microstructure, texture and elastic anisotropy of the nickel-based superalloy CM247LC processed by selective laser melting. Mater. Sci. Eng. A 2016, 674, 529–539. [Google Scholar] [CrossRef]
  57. Murr, L.; Gaytan, S.M.; Ramirez, D.A.; Martinez, E.; Hernandez, J.; Amato, K.N.; Shindo, P.W.; Medina, F.R.; Wicker, R.B. Metal Fabrication by Additive Manufacturing Using Laser and Electron Beam Melting Technologies. J. Mater. Sci. Technol. 2012, 28, 1–14. [Google Scholar] [CrossRef]
  58. Wang, Y.M.; Voisin, T.; McKeown, J.T.; Ye, J.; Calta, N.P.; Li, Z.; Zeng, Z.; Zhang, Y.; Chen, W.; Roehling, T.T.; et al. Additively manufactured hierarchical stainless steels with high strength and ductility. Nat. Mater. 2018, 17, 63–71. [Google Scholar] [CrossRef] [PubMed] [Green Version]
  59. Hariharan, A.; Lu, L.; Risse, J.; Kostka, A.; Gault, B.; Jägle, E.A.; Raabe, D. Misorientation-dependent solute enrichment at interfaces and its contribution to defect formation mechanisms during laser additive manufacturing of superalloys. Phys. Rev. Mater. 2019, 3, 123602. [Google Scholar] [CrossRef]
  60. Sridharan, N.; Chen, Y.; Nandwana, P.; Ulfig, R.M.; Larson, D.J.; Babu, S.S. On the potential mechanisms of β to α′ + β decomposition in two phase titanium alloys during additive manufacturing: A combined transmission Kikuchi diffraction and 3D atom probe study. J. Mater. Sci. 2019, 55, 1715–1726. [Google Scholar] [CrossRef]
  61. Frenzel, J.; George, E.P.; Dlouhy, A.; Somsen, C.; Wagner, M.F.-X.; Eggeler, G. Influence of Ni on martensitic phase transformations in NiTi shape memory alloys. Acta Mater. 2010, 58, 3444–3458. [Google Scholar] [CrossRef]
  62. Bormann, T.; Müller, B.; Schinhammer, M.; Kessler, A.; Thalmann, P.; De Wild, M. Microstructure of selective laser melted nickel–titanium. Mater. Charact. 2014, 94, 189–202. [Google Scholar] [CrossRef]
  63. Khalil-Allafi, J.; Amin-Ahmadi, B. The effect of chemical composition on enthalpy and entropy changes of martensitic transformations in binary NiTi shape memory alloys. J. Alloy. Compd. 2009, 487, 363–366. [Google Scholar] [CrossRef]
  64. Benafan, O.; Bigelow, G.; Scheiman, D. Transformation behavior in NiTi-20Hf shape memory alloys–Transformation temperatures and hardness. Scr. Mater. 2018, 146, 251–254. [Google Scholar] [CrossRef]
  65. Bigelow, G.S.; Benafan, O.; Garg, A.; Lundberg, R.; Noebe, R.D. Effect of Composition and Applied Stress on the Transformation Behavior in NiXTi80−XZr20 Shape Memory Alloys. Shape Mem. Superelasticity 2019, 5, 444–456. [Google Scholar] [CrossRef]
  66. Karaca, H.; Saghaian, S.; Ded, G.S.; Tobe, H.; Basaran, B.; Maier, H.; Noebe, R.; Chumlyakov, Y. Effects of nanoprecipitation on the shape memory and material properties of an Ni-rich NiTiHf high temperature shape memory alloy. Acta Mater. 2013, 61, 7422–7431. [Google Scholar] [CrossRef]
  67. Karaca, H.; Saghaian, S.; Basaran, B.; Bigelow, G.S.; Noebe, R.; Chumlyakov, Y. Compressive response of nickel-rich NiTiHf high-temperature shape memory single crystals along the [111] orientation. Scr. Mater. 2011, 65, 577–580. [Google Scholar] [CrossRef]
  68. Meng, X.; Cai, W.; Chen, F.; Zhao, L. Effect of aging on martensitic transformation and microstructure in Ni-rich TiNiHf shape memory alloy. Scr. Mater. 2006, 54, 1599–1604. [Google Scholar] [CrossRef]
Figure 1. SEM back-scattered electron images of (a) powder morphology and (b) cross section of one particle cut by FIB and showing an entrapped gas pore. Red arrows indicate micron-sized particles.
Metals 10 01522 g001
Figure 2. Representative micrographs from perpendicular to build direction of the as-fabricated SLM NiTiHf parts with different levels of energy density (Ev): (A3) Ev = 59.5 J/mm3, (A4) Ev = 69.4 J/mm3, (A9) Ev = 104.2 J/mm3, (A11) Ev = 138.9 J/mm3, (A14) Ev = 189.4 J/mm3, and (A13) Ev = 178.5 J/mm3. BD shows the building direction.
Metals 10 01522 g002aMetals 10 01522 g002b
Figure 3. Optical images from the build direction showing (a) sample A10 with long cracks along the BD, (b) crack-free micrograph of sample A11, and (c) schematics of heating and cooling stages in temperature gradient mechanism as a probable cause of cracks.
Metals 10 01522 g003
Figure 4. SEM and S/TEM micrographs of samples (a,b) A2, (ce) A8, and (fh) A10; BD indicates building direction. Aqua, red, yellow, and orange arrows show martensite laths, melt-pool boundaries, and dark and light secondary phases, respectively.
Metals 10 01522 g004
Figure 5. (a,b) Low-camera-length STEM image of A8 showing light z-contrast along the boundaries and (cf) compositional analysis of the cellular solidification. Yellow and orange arrows show dark and light secondary phases, respectively. EDS analysis on the green area showed oxide formation on grain boundaries.
Metals 10 01522 g005
Figure 6. DSC curves of SLM NiTiHf samples with energy densities (a) below 100 J/mm3 and (b) above 100 J/mm3. (c) Enthalpy of transformation as a function of energy density. ΔT shows thermal hysteresis defined as Af–Ms and the shaded shows area where enthalpy of transformation was obtained.
Metals 10 01522 g006aMetals 10 01522 g006b
Figure 7. Af (circles) and laser power (squares) as a function of measured Ni content after fabrication. Red dotted line shows the trends of Af and the star shows powder Af and Ni content. Cross shapes show the Af of the homogenized NiTiHf20 samples with different Ni contents from [64].
Metals 10 01522 g007
Figure 8. Normalized XRD patterns of A2 and A10 samples at room temperature (RT). The NiTiHf powder spectra at room temperature is also provided for comparison.
Metals 10 01522 g008
Figure 9. Constant force strain-temperature response of selected samples with energy densities below 100 J/mm3 (A1, A2, and A4) and above 100 J/mm3 (A10, A12, and A13) under different constant stress levels. Values of constant stresses are shown on each curve. Heating curves are shown in solid red; cooling curves are shown in blue dashed lines.
Metals 10 01522 g009
Figure 10. Actuation and residual strains as a function of compressive stresses for (a,b) samples with E below 100 J/mm3, and (c,d) E more than 100 J/mm3.
Metals 10 01522 g010
Figure 11. Martensite start temperature (Ms) vs. compressive applied stress: (a) LE samples, and (b) HE samples.
Metals 10 01522 g011
Table 1. SLM process parameters used for fabrication of cuboid samples. A18-A30 were not tested and no data is available for the actuation strain.
Sample
(ID from [40])
Laser Power
(W)
Scanning Speed
(mm/s)
Hatch Spacing
( μ m )
Energy Density
(J/mm3)
Austenite Finish (Af)
(°C)
Actuation Strain @ 300 MPa (%)
A1(#14)10010006055.51190.88
A2(#8)10040014059.51601.54
A3(#19)250100014059.52250.54
A4(#6)250100012069.42540.55
A5(#18)21080012072.92580.36
A6(#25)25073314081.22880.3
A7(#2)13540012093.72560.6
A8(#5)17560010097.22600.14
A9(#29)250100080104.22940.4
A10(#13)250466140127.53270.44
A11(#15)250100060138.93040.33
A12(#3)210400120145.83270.21
A13(#27)150200140178.63320.25
A14(#16)25073360189.43310.16
A15(#17)200200140238.13480.56
A16(#26)25046660297.63630.29
A17(#10)150200803133530.34
A18(#4)1358008070.3143N/A
A19(#20)1007336075.7146N/A
A20(#9)15010006083.3187N/A
A21(#24)21080080109.4294N/A
A22(#7)200100060111.1276N/A
A23(#1)100200140119.0154N/A
A24(#22)100200120138.9150N/A
A25(#30)13540080140.6239N/A
A26(#21)10020080208.3144N/A
A27(#12)21040080218.7347N/A
A28(#23)10020060277.8280N/A
A29(#28)250200140297.7346N/A
A30(#11)250200120347.2378N/A
Publisher’s Note: MDPI stays neutral with regard to jurisdictional claims in published maps and institutional affiliations.

