Article

Influence of Forming Parameters on the Mechanical Behavior of a Thin Aluminum Sheet Processed through Single Point Incremental Forming

1
Faculty of Mechanical Engineering, GIK Institute of Engineering Sciences and Technology, Topi 23460, Pakistan
2
Department of Industrial Engineering, College of Engineering, King Saud University, P.O. Box 800, Riyadh 11421, Saudi Arabia
*
Author to whom correspondence should be addressed.
Metals 2020, 10(11), 1461; https://doi.org/10.3390/met10111461
Submission received: 2 October 2020 / Revised: 25 October 2020 / Accepted: 28 October 2020 / Published: 31 October 2020
(This article belongs to the Section Metal Casting, Forming and Heat Treatment)

Abstract

:
Incremental sheet forming (ISF) is an economical process for batch production. This paper investigates post-forming mechanical properties with an emphasis on the relationship between residual stresses, strengths, micro-hardness and the strain-hardening exponent. Moreover, the influence of important process parameters on the post-forming tensile properties and hardness is analyzed. A Taguchi statistical analysis method is applied to study the effect of forming parameters and identify the best combinations to enhance the mechanical properties of the commercial aluminum. The results reveal that direct relationships exist for the plots of: (i) the strain-hardening exponent vs. the post-necking strain and (ii) difference of post-forming strengths vs. the strain-hardening exponent. Furthermore, the post-forming yield strength can be enhanced by 66.9% through the Single Point Incremental Forming (SPIF). Similarly, the ductility can be doubled by conducting the SPIF after performing the annealing of the as-received rolled sheet. In the present study, parts formed at a wall angle (θ) of 40° with a tool diameter (d) of 6 mm exhibit the highest strength. Moreover, most ductile parts will be obtained at ω = 1500 rpm, d = 22 mm and θ = 20°. It has also been shown that the compressive residual stresses are favorable for higher yield strength and improve hardness of the formed parts.

1. Introduction

The design and manufacture of various industrial components, especially those using sheet forming processes, heavily rely on the knowledge of material tensile properties. These properties, e.g., yield strength, are used as design inputs to calculate the various important outputs, such as safety factors, load carrying capacity and deflections, etc. The failure of the sheet metals may occur due to the plastic instability accompanied by the localized deformation, or the fracture due to instigation, evolution and coalescence of voids, or a combination of both [1]. Moreover, the tensile strength may serve as a basis for the determination of the onset of the plastic instability and give an insight into the necking or the initiation of the fracture. It also serves as a basic input to find the forming force in the conventional forming processes such as the deep drawing and the stretch-bending. Similarly, the ductility (measured in terms of percent elongation) or the strain-hardening exponent may be employed in several forming processes, e.g., stamping, hydroforming and incremental sheet forming (ISF) as an indicator of the formability [2].
A variety of processes employ deformation to manufacture components. The mechanical properties and the microstructure of the formed parts is significantly modified during these processes. Serajzadeh and Mohammadzadeh [3] have attributed the increase in the yield strength, as a consequence of the rolling reduction and an increase in the rolling speed, to the grain refinement and the increase in the dislocation density. Zhao et al. [4] have attributed the increase in the ultimate strength and the hardness, observed during the continuous extrusion process of the AA6063, to the reduction in the grain size and the temperature rise. It has been observed by Balogun et al. [5] that the tensile strength and the micro-hardness of the AA6063 increase; however, ductility decreases with an increase in the percent reduction. More recently, Nwachukwu and Oluwole [6] have studied the post-rolling mechanical properties of St60Mn steel. Their results showed that, with increasing the rolling strain rates, the mechanical properties of the St60Mn are enhanced.
Ucuncuoglu et al. [7] have reported that the ultimate and the yield strengths, the ductility and the hardness of the AZ31 are enhanced when processed via the asymmetric rolling process. The effect of pre-homogenizing on the mechanical properties, the deformation mechanisms and the fracture of the hot rolled AZ91 magnesium alloys have been reported by Zheng et al. [8]. They have found that the ultimate strength of the homogenized AZ91 shows a dramatic increase with a slight decrease in the elongation. Xu et al. [9] have found that the AZ31 exhibits an elongation of nearly 400% at the room temperature, the micro-hardness also increases and the grain refinement takes place during the micro‑milling process. The residual stresses are thus affected due to these variations [10].
Incremental sheet forming (ISF) is an innovative forming process which offers economic benefits for batch productions due to the inexpensive tooling involved. The processing method is being actively pursued in the scientific community to study the die-less forming of metallic and nonmetallic sheets. In this process, a hemi-spherical head tool gives the desired shape to an initially flat sheet. Although the process has a low production rate, it has found various applications in some of the vital areas, such as the biomedical and the automobile industries [11].
In previous studies, it has been shown that the failure strain in the ISF is significantly higher than the conventional forming processes [12,13]. The deformation involved in the ISF process is dependent on processing parameters such as the tool diameter, the tool rotation speed and the tool feed rate [14]. It has also been shown that the size of the forming tool controls the deformation zone, hydrostatic stress, material damage and forming forces [15,16,17]. The step size has been attributed to control the formability, damage, thinning and forming forces [17,18,19], whereas deformation angle influences the thinning of the sheet, forming forces and material hardening [18,20]. The in-service mechanical behavior, of components, depends upon the forming-process-induced damage, residual stresses and microstructure [1]. Therefore, components shaped via ISF can experience significant changes in their mechanical behavior.
The post-ISF tensile tests of AA3003 sheet, formed at various angles, have been presented by Jeswiet et al. [21]. They have shown that the strength of the formed sheet increased and ductility decreased with an increase in the forming wall angle. Although this study did consider the initial sheet thickness, the role of other process parameters, such as tool diameter, step size, tool speed, feed and material condition, needs further investigation. The mechanical properties and microstructure evolution after the ISF of AA5754 and AA6061 have been presented by Hussain et al. [22]. They observed an 8–10% increase in the strength for both alloys, whereas the ductility decreased considerably. The post-ISF properties of thermoplastic polymers have shown an increase in the ductility and the toughness at the expense of elastic stiffness and yield stress [23]. Davarpanah et al. [23] have attributed these changes to the change in orientation of molecular chains.
The single point incremental forming (SPIF) of an AlSi10Mg sheet has been investigated by López et al. [24]. They have found that the SPIF process transforms the residual stresses from compressive to tensile on the inner side of the formed parts. Radu et al. [25] have found the induced residual stresses to be highly non-uniform in AA1050 sheets when processed through the SPIF. They found that the larger tool diameter and higher step size induce tensile stresses, whereas the tool feed rate determines the nature (whether tensile or compressive) of the residual stresses. Moreover, higher spindle speeds tend to reduce the residual stresses on the surface of the formed parts. Recently, Maaß et al. [26] have analyzed AA5058 and explored the step size to tool diameter ratio. They have concluded that the shearing mechanism becomes dominant with step size and causes the thickness of the formed sheet to decrease and hardness to increase, especially, on the tool side.
The strain-hardening exponent (n), ultimate strength (σu), yield strength (σy), process-induced residual stresses and hardness are important mechanical characteristics [2]. These properties provide an insight into the in-service behavior of the formed components. Moreover, their correlations provide understanding of the application specific response of the component. For example, the correlation amongst ISF-induced residual stresses and the achievable post-forming strength can enable designers to design versatile parts with reduced weight. Similarly, the knowledge of difference between σu and σy (a measure of allowable stress before fracture) can help the designer in predicting how much additional stress a component can withstand before fracturing. Similar prediction can be expected from relation between strain-hardening exponent and the post-necking strain, as this relation explains the plastic behavior of a formed part. In a recent study, Wei and Hussain [27] have established a correlation between the residual stresses and strength of parts formed from copper-steel layered sheets. Their results have shown that the residual stresses affect the post-forming strength and further type of the load should be selected in view of the nature of stresses (tensile or compressive). A similar relationship has yet not been explored for the monolithic sheets formed through ISF. Such an investigation for monolithic sheets is necessary as the published results, being empirical, are applicable to only the layered sheet.
The present study investigates these gaps. The aluminum (AA1050) sheet is utilized as the test material. The forming is performed under varied conditions in order to adequately address the mentioned gaps. Four ISF parameters are chosen and are varied at three levels. The correlations between the residual stresses and the post-ISF strengths and hardness are drawn. The failure behavior of formed parts is examined by drawing relations between: σuσy and n, residual stresses and σy, hardness and residual stresses. The effects of process parameters on the considered properties are quantified and analyzed employing the Taguchi approach [28]. This study has generated a useful contribution towards a deeper understanding of the post-ISF mechanical behavior of the material from the perspective of property-parameter relation, property–material condition relation, residual stresses–strength/hardness correlations and allowable σuσy.

2. Materials and Methods

2.1. Material

The commercially pure series aluminum alloy 1050 has been utilized in this study. This material is suitable in applications requiring better corrosion resistance, superior electrical conductivity and workability. The chemical composition of this alloy is given in Table 1. The as-received sheets of 1-mm-thick aluminum were cut into 175 mm × 100 mm blanks. These sheets were annealed to relieve residual stresses induced during the rolling process. The sheets were then heated at 450 °C for 2.5 h as stipulated by the American Society for Testing and Materials (ASTM) standard B-479 [29] and then left in the furnace to cool down for 24 h after shutting off the furnace.

2.2. Design of Experiments
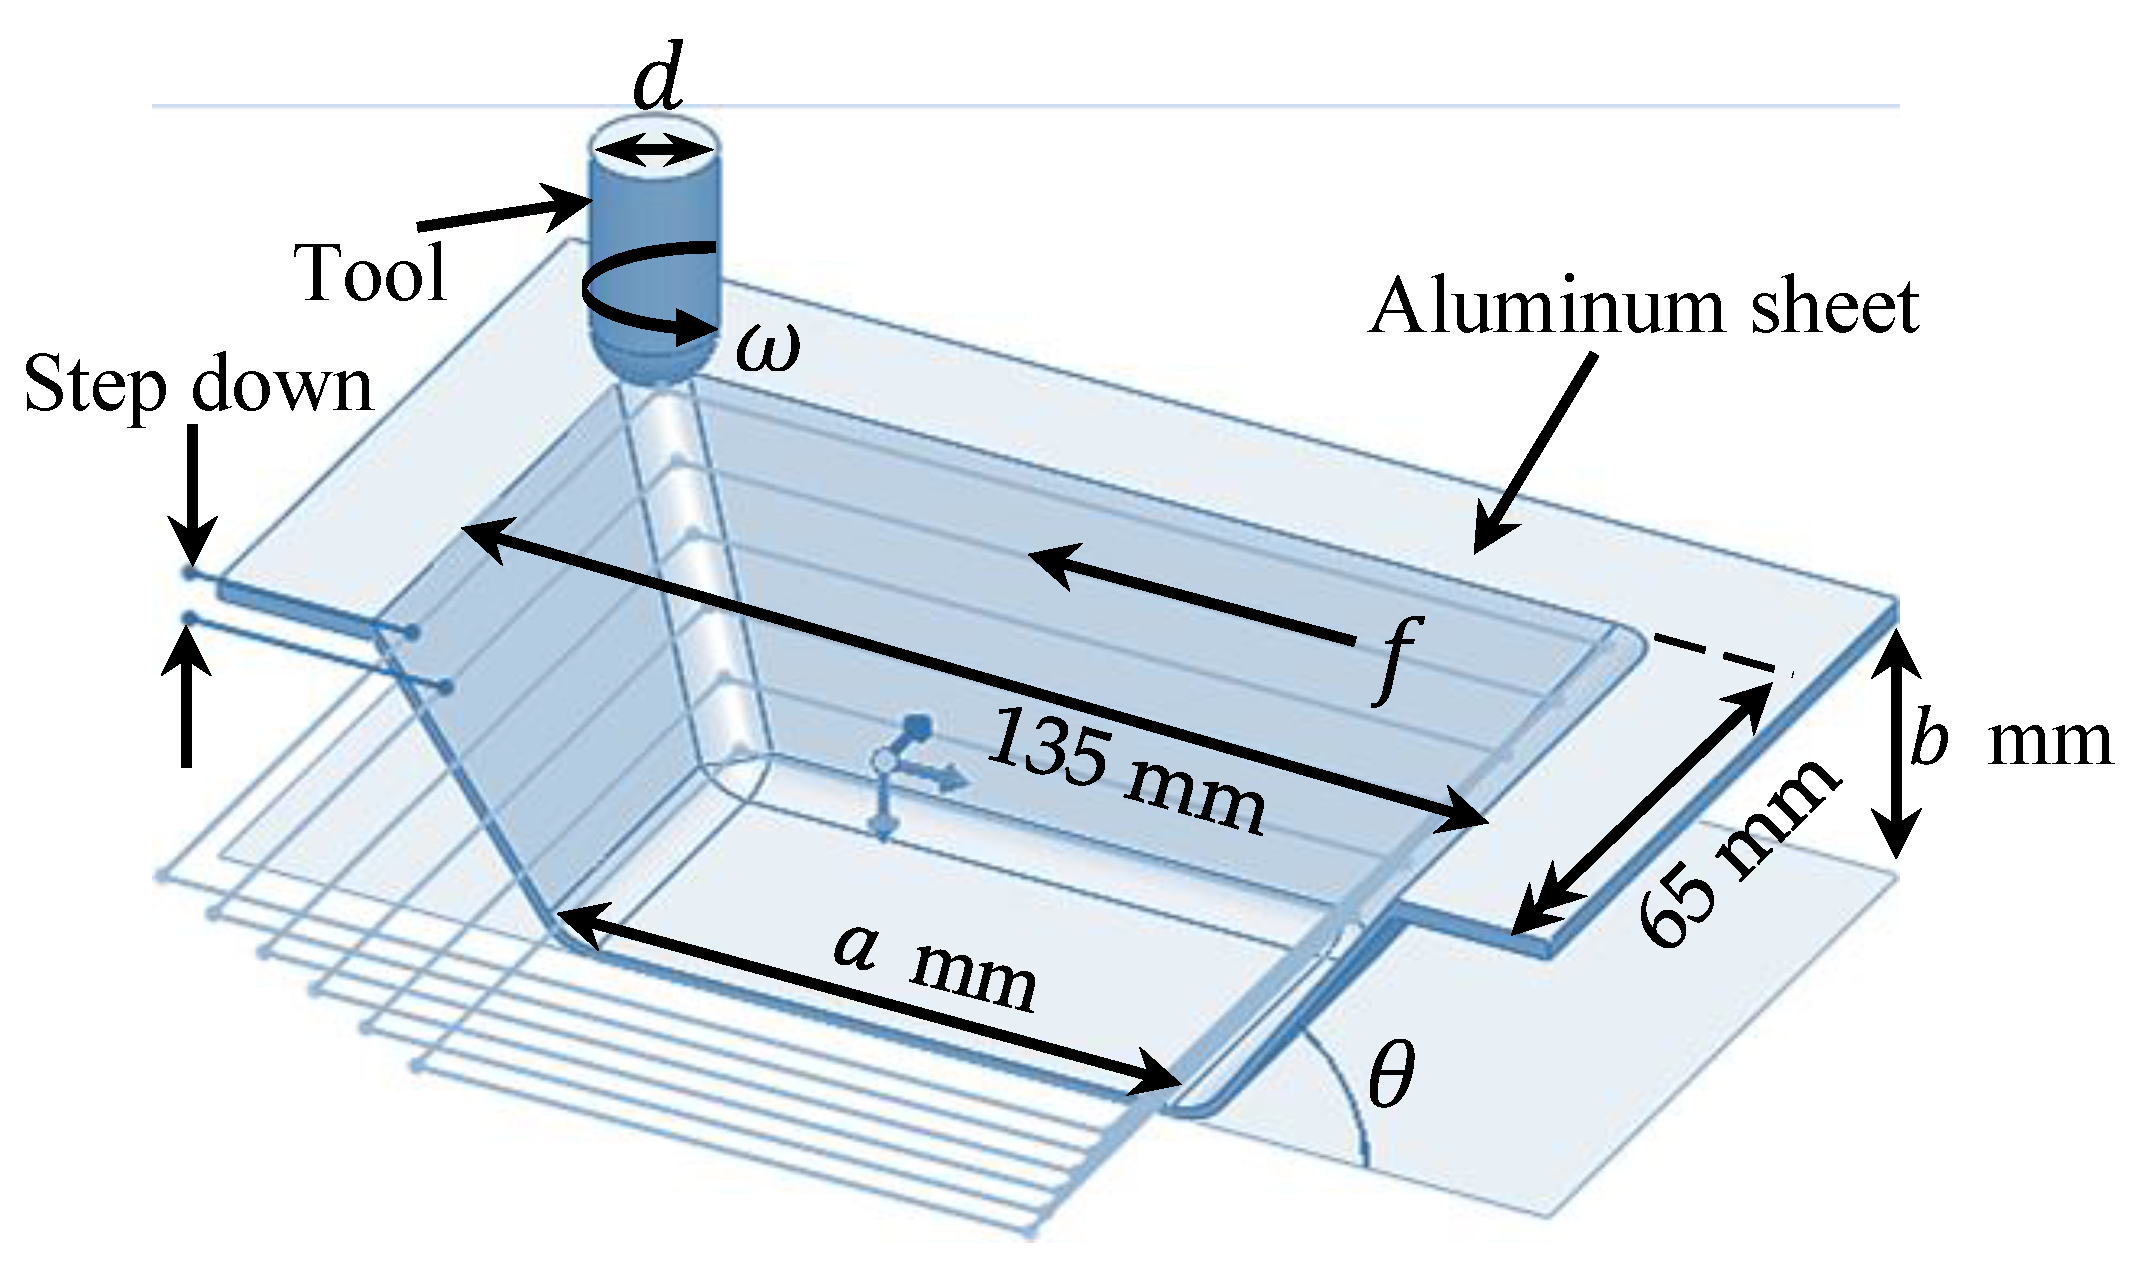
Figure 1 shows a schematic of the process variables. The influence of each of the four variables, i.e., tool diameter (d), spindle (rotational) speed (ω), feed rate (𝑓) and wall angle (θ), individually or a combination thereof, is important. These process variables and their levels, as shown in Table 2, are used as input for the Design‑Expert® software version 10 by Stat-Ease Inc (Minneapolis, MN, United States). The design, planning and analysis of results are based on the Taguchi Method [28].
The importance of other parameters, such as the sheet thickness and the step size, are well known [13,16,17,18]. Their effect is more pronounced on the forming forces, hydrostatic stress and damage. This study is focused on strain hardening, which is mainly affected by the forming angle (considered in this design). Therefore, the step size was dropped from this study to reduce the number of tests while sheet thickness was dropped as a limited quantity of material was available. The upper limit is based on the machine specifications and the lower limit of the feed was kept at 1000 rpm because a further reduction required a long time, which is not feasible from an industrial viewpoint. The feed rate and spindle rotation speed were selected based on the specifications of the available CNC machine. The maximum tool diameter in this study was limited to 22 mm as a higher diameter would increase the forming forces, the later would ultimately surpass the maximum limit of the available machine. In this study, the wall angle was varied from 20° to 60°. The wall angles below 20° do not generate dominating residual stresses. Similarly, at wall angles higher than 60°, the sheet becomes susceptible to fracture during the forming process.
The various levels of the test plan factors and responses to be analyzed are input in the Design‑Expert® software, as illustrated in Table 3. The decisive parameters influencing the responses are investigated from L9 Taguchi set of experiments, i.e., 4 factors with 3 levels, have been selected. This design approach offers the analysis with minimized runs as compared with the full factorial design requiring 81 runs. The responses, such as the tensile/compressive residual stresses in two directions, ultimate strength, yield strength, percentage elongation and Vickers hardness have been incorporated herein. The design given by the software engenders nine sets of combinations. Each combination was executed twice, i.e., a total of 18 experiments were performed. Moreover, in addition to these tests, two more tests were performed on the as-received sheet with the same process parameters as in Test 7. This is separately referred to as rolled sheet (ISF) in the following paragraphs. The average values calculated from the two experiments of each combination were further analyzed.

2.3. Test geometry

Pyramid frusta with wall angles (θ) 20°, 40° and 60° were designed on Creo Parametric®, version 2.0 (by Parametric Technology Corporation, Boston, MA, USA), considering the thickness of the sheet equal to 1 mm. Figure 1 shows the pyramid size used for design of the geometry. The overall size of the blank sheet was fixed. Therefore, α (80, 75.4 and 106 mm) and b (10, 25 and 60 mm) vary due to the variation of the wall angle. The noise effects were considered by conducting each experiment twice and the variation in the results was found to range from 2% to 4% of each other.

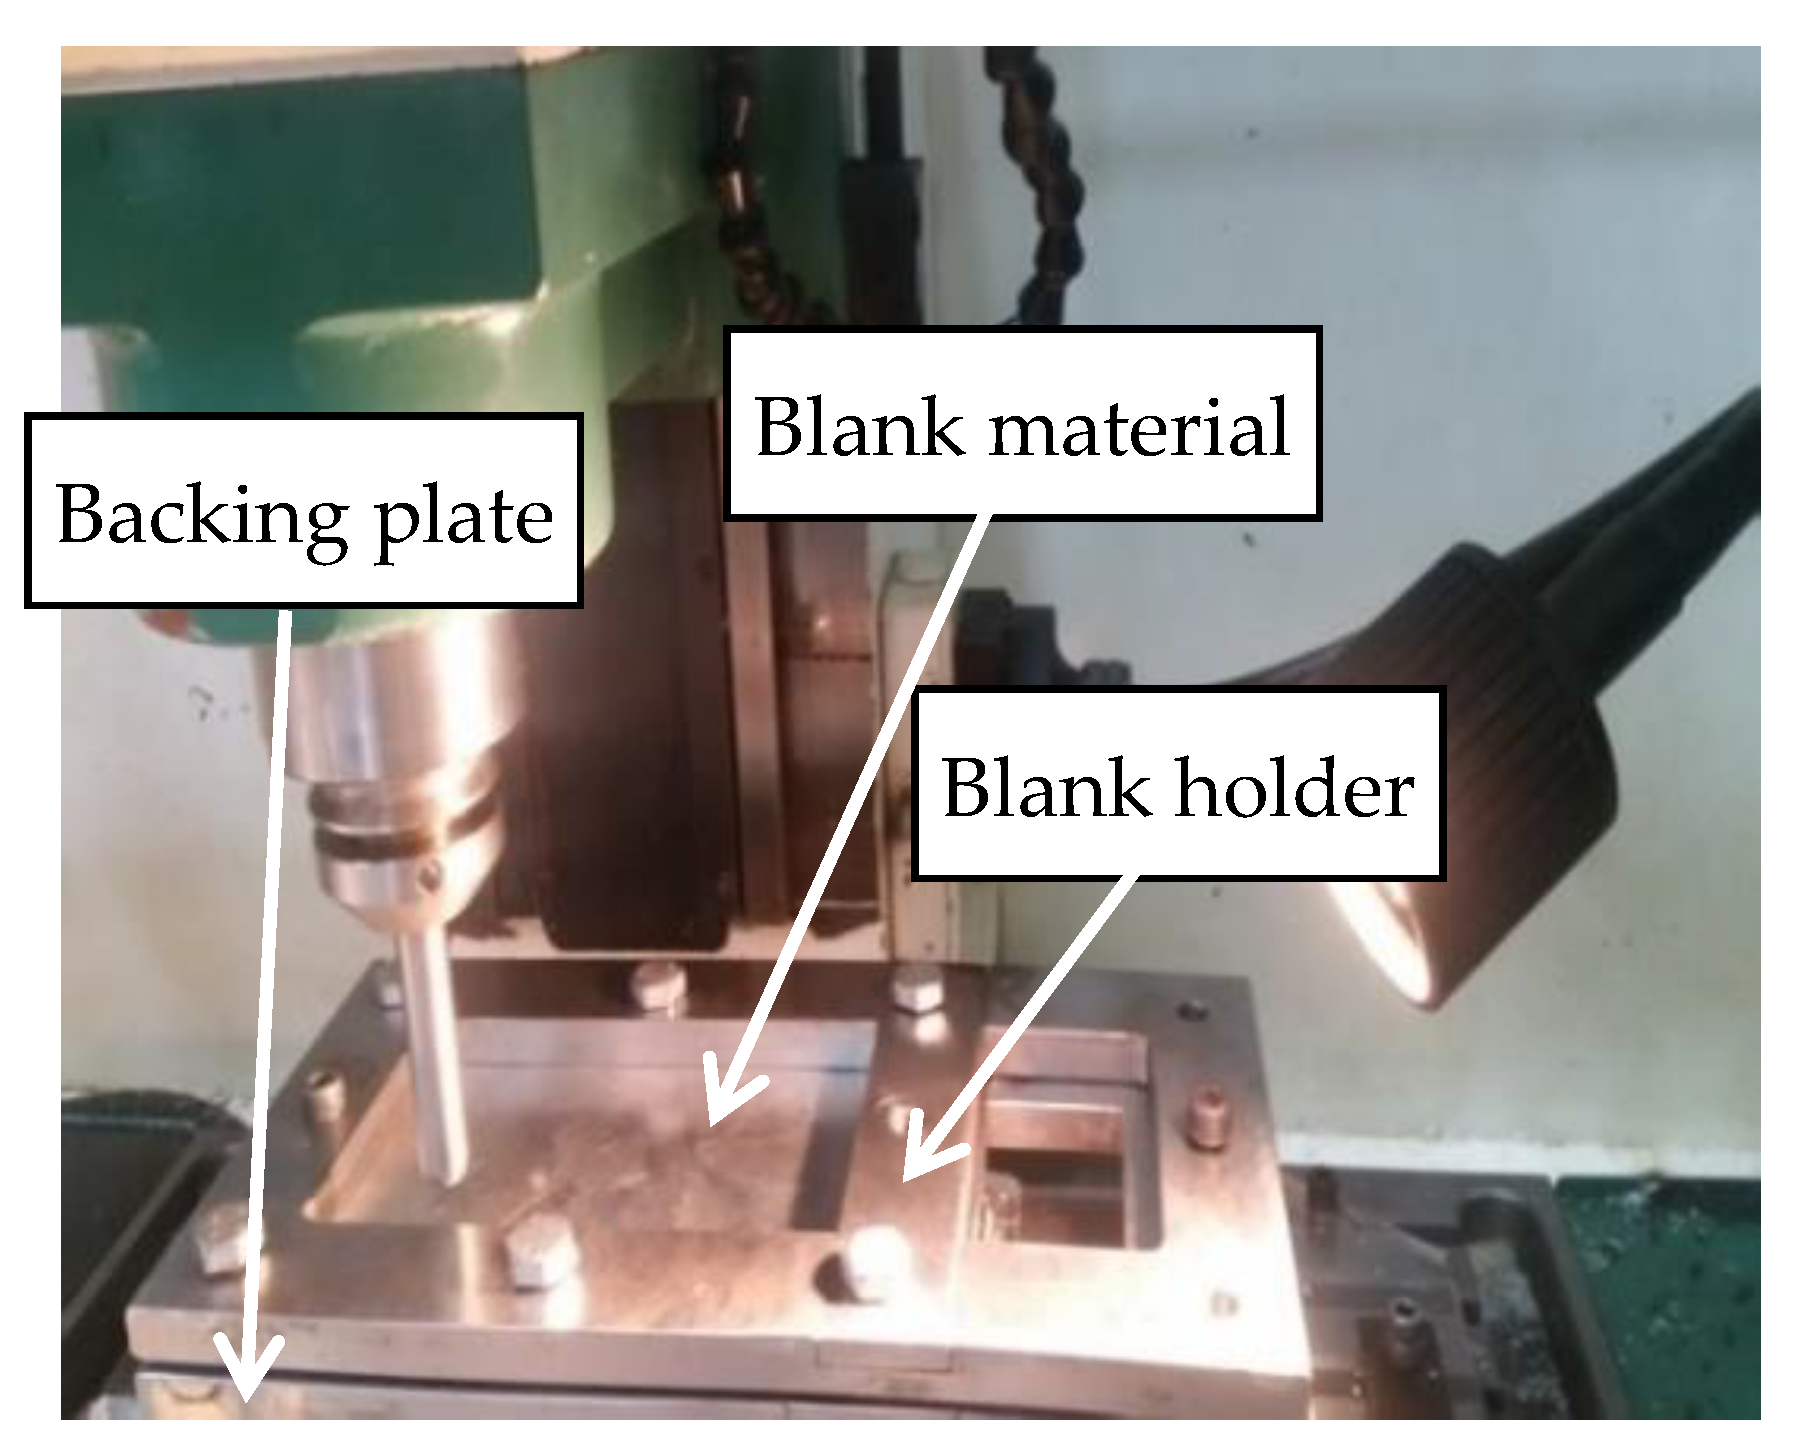
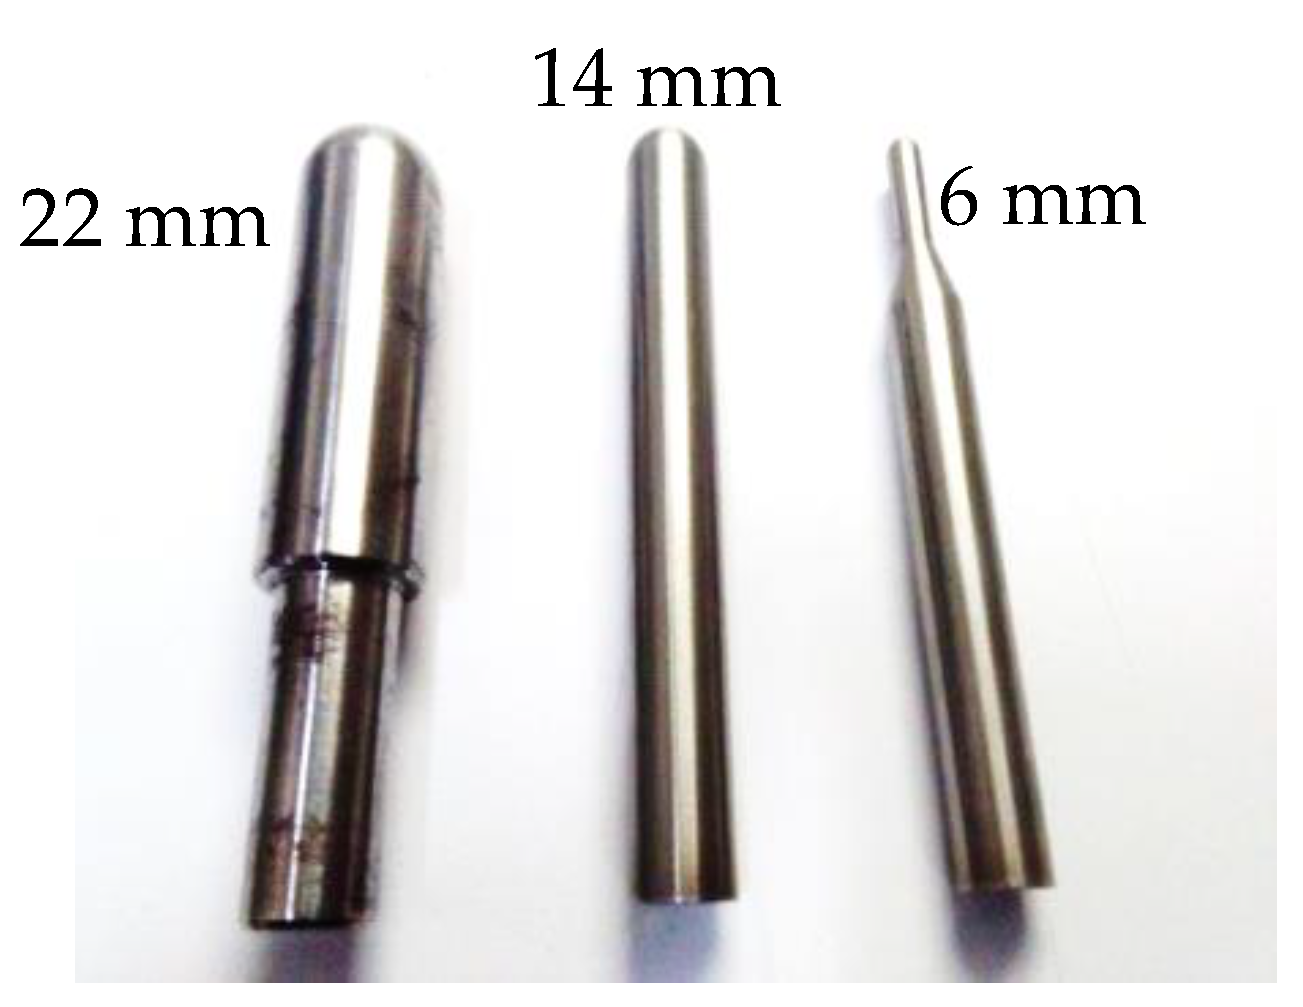
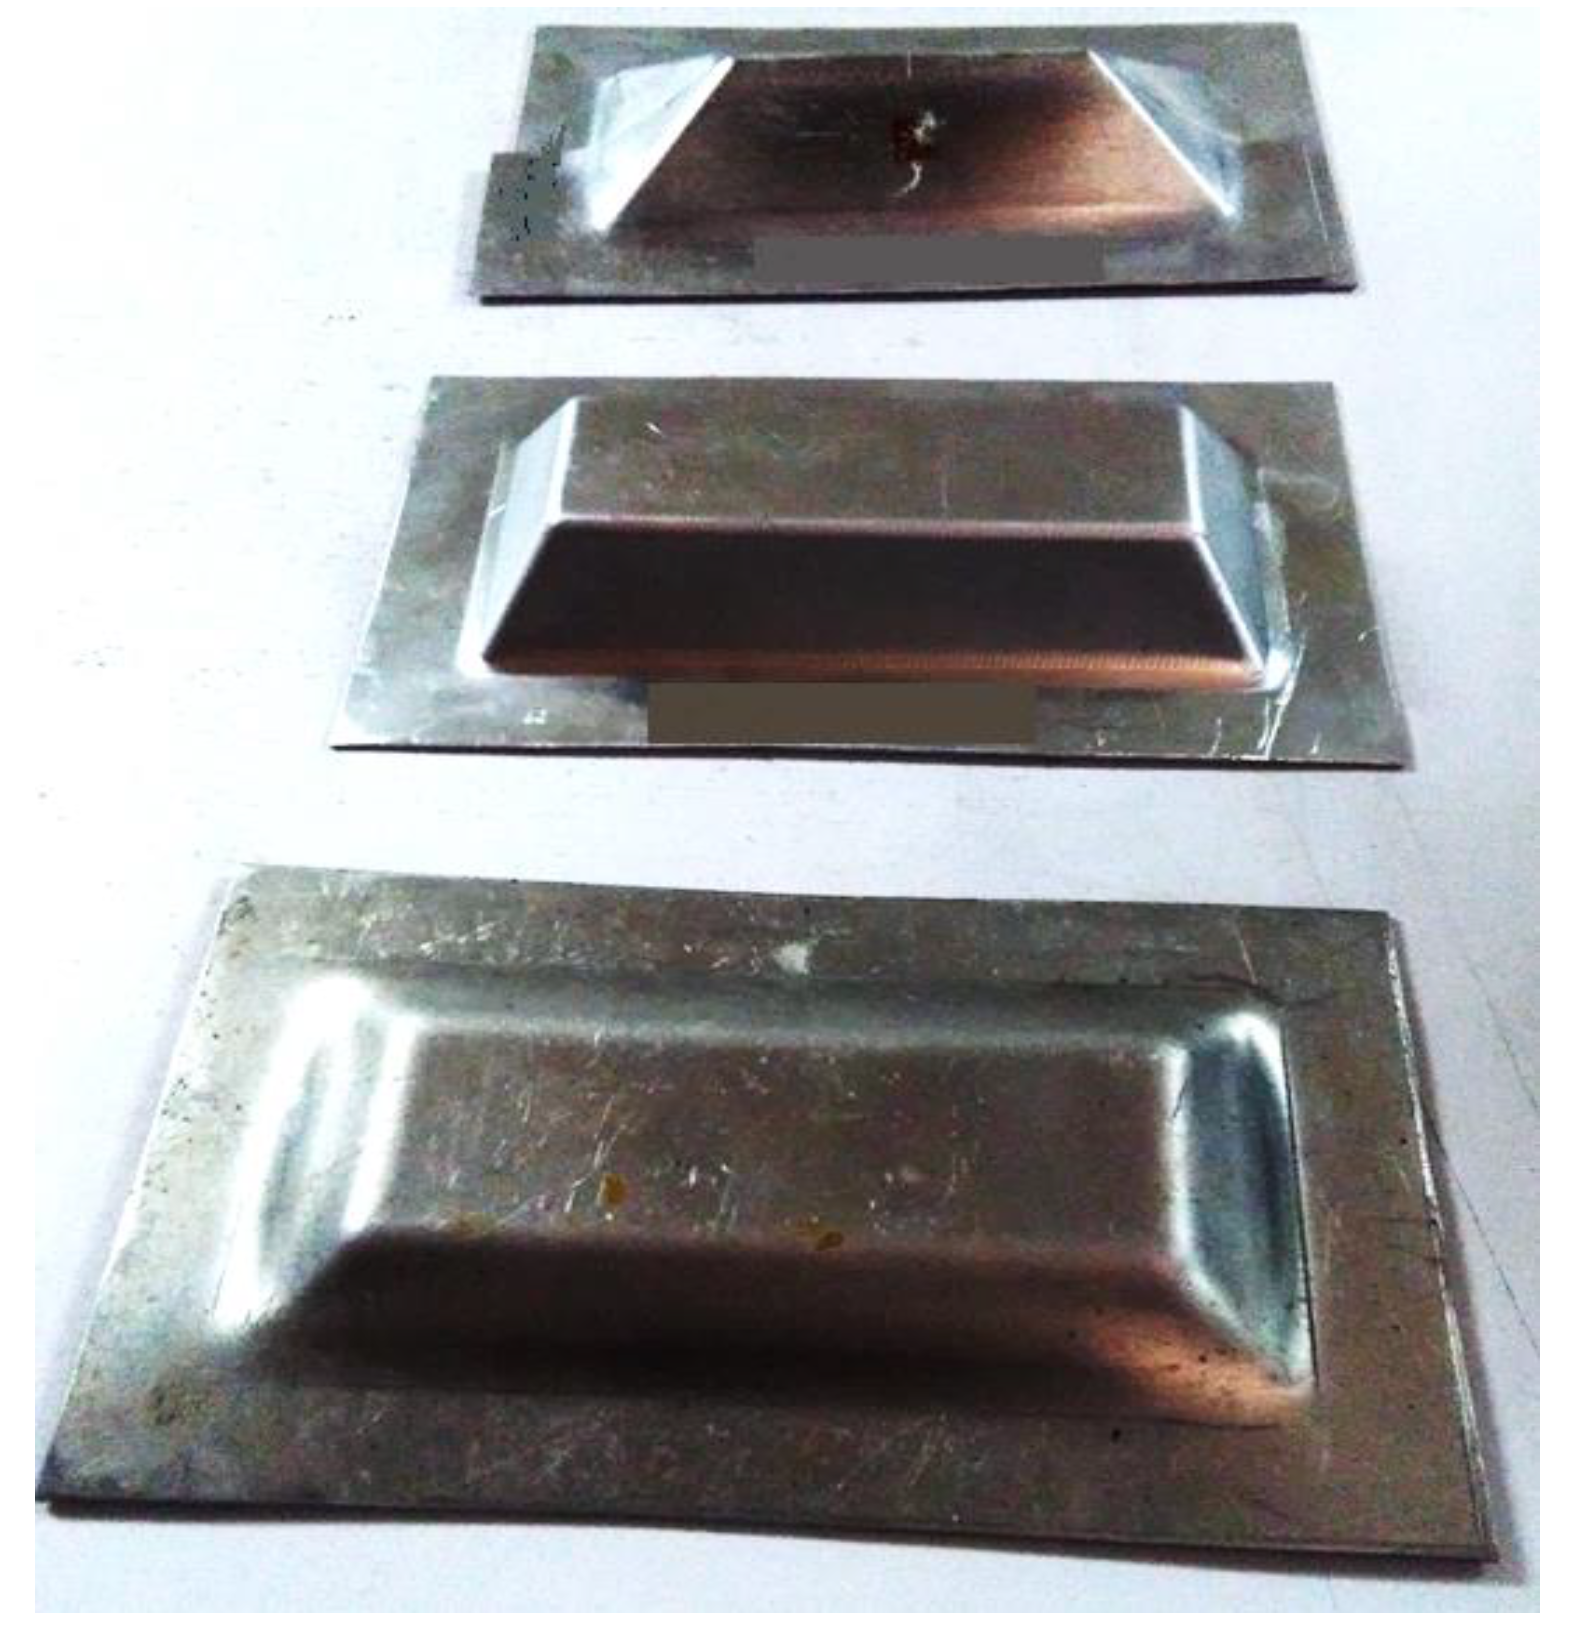
2.4. SPIF Experiments

The SPIF, of blanks as per sizes explained in the paragraph 2.3, was performed on a 3-axis milling machine. The blanks were clamped in the blank holder and a backing plate made from steel, refer Figure 2.
Three different diameter tools made from high-speed steel (HSS) with harness 60-65HRC were employed to perform the SPIF. The hemispherical head tools with diameters of 6, 14 and 22 mm are show in Figure 3. These tools were polished with an emery paper of 20 μm to clean and remove the imperfections from the tool surface. Then the tools were cleaned, and a diamond paste was applied to polish using the 9 μm abrasive paper. The process was concluded with a 6 μm abrasive grain for final cleaning.
Application of a lubricant in the SPIF leads to a good surface finish and reduces the tool wear. Therefore, Castrol IloformTDN 81 forming fluid due to its excellent boundary-lubricating properties was employed to lubricate the blank sheets. The boundary lubrication depends upon the adhesion of the lubricant to both the tool and the blank sheet and form a thin film. Hence, the forming tools were heated to approximately 100 °C to facilitate the formation of a highly tenacious layer (or film) between the moving solid surfaces. This film is capable of supporting the load, reducing major wear and avoiding the breakdown of the blank sheet. The tool was allowed to cool down to room temperature and then the SPIF was carried out to produce the desired shapes. The formed parts were cleaned and a few representatives are shown in the Figure 4.

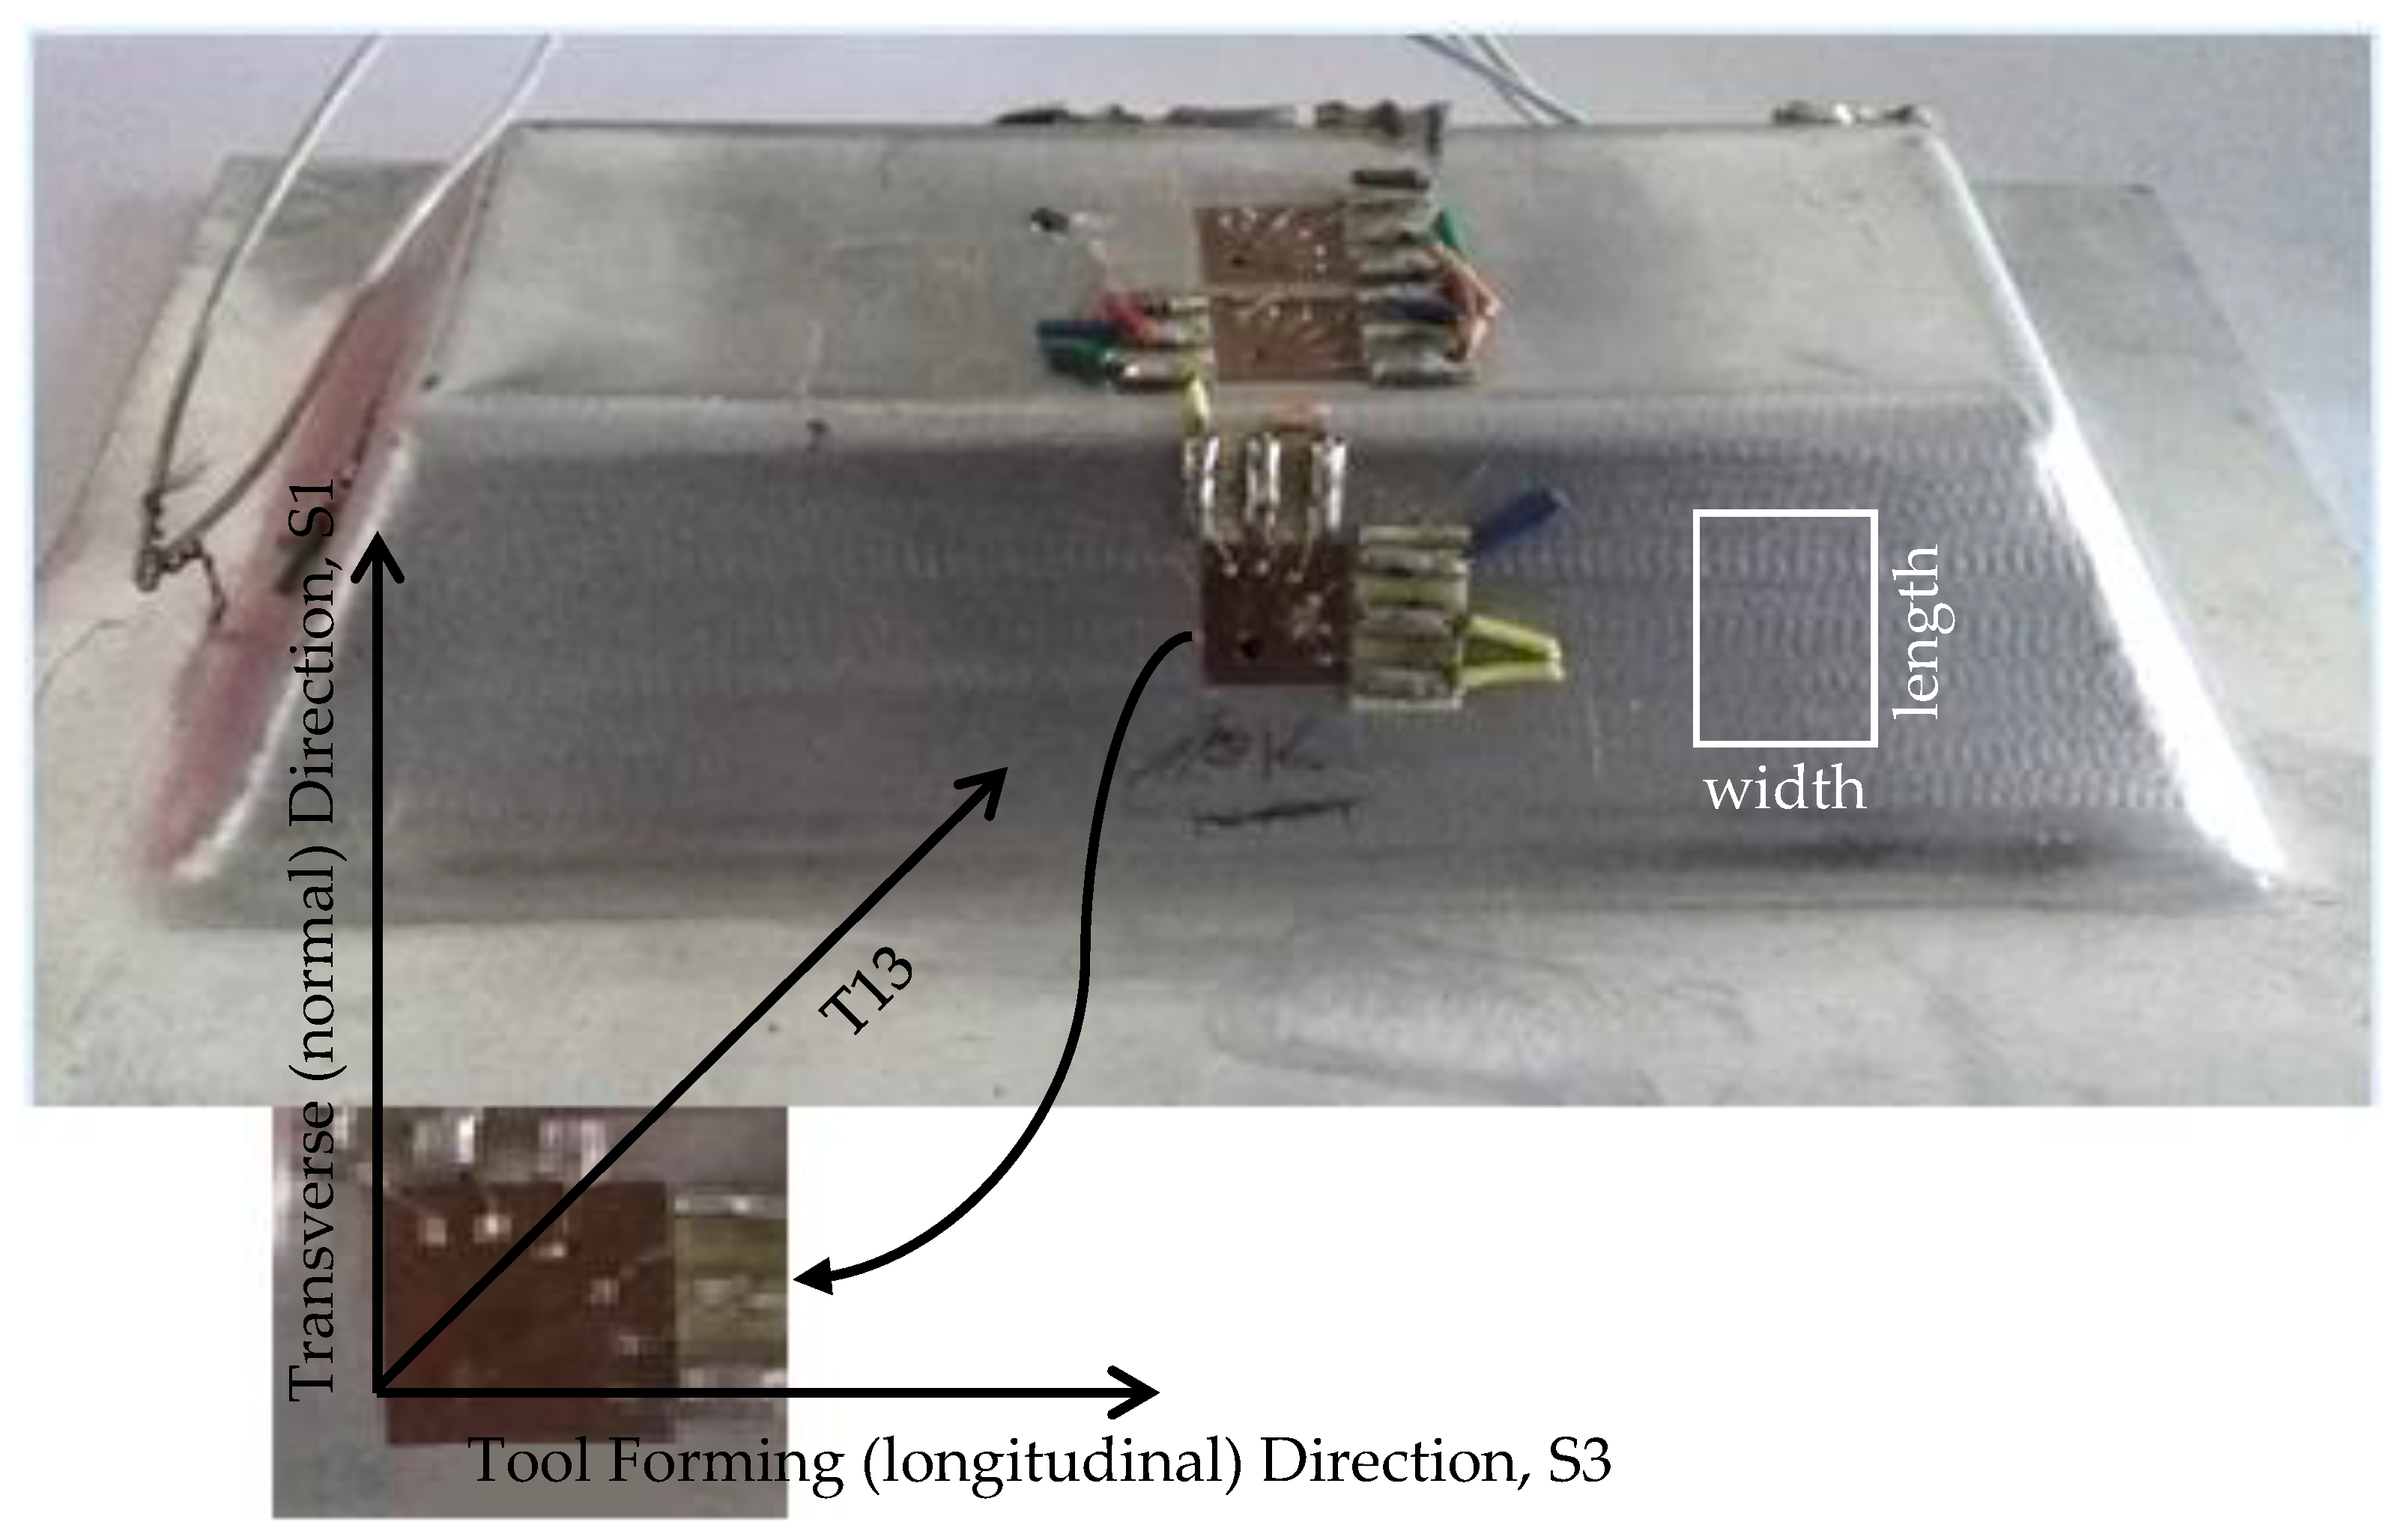
2.5. Measurement of Residual Stresses

Residual stresses in the rolled sheet (pre-ISF), annealed sheet (pre-ISF) and formed frusta (Post-ISF) were measured. The hole drilling strain gage method was employed to determine the residual stresses as per the ASTM standard E-837 [30]. This method is sometimes referred to as a ‘semi-destructive’ test method, as the material detached is nominal compared to the overall size of the specimen. In this method, the strains are measured in three directions as identified in Figure 5. Strain gages were placed in identical orientation for all the tests. The directions labeled as S1 and S3 give the stresses in the transverse direction and forming directions, respectively, whereas the direction T13 measures the longitudinal stress at an angle of 45° from both of these axes. A portable strain gage indicator and recorder, model P3 from the Vishay precision group (Malvern, PA, USA), was employed to record the residual stresses during the hole drilling method. All the strain gages were connected in the quarter bridge configuration. Finally, the H-Drill software version 2.22 (by Prof. Gary S. Schajer, Vancouver, BC, Canada) was used to estimate the residual stresses from the measured strains data [31]. Once these stresses are determined, the maximum positive (tensile) stress and minimum negative (compressive) stresses are retained for further analysis.

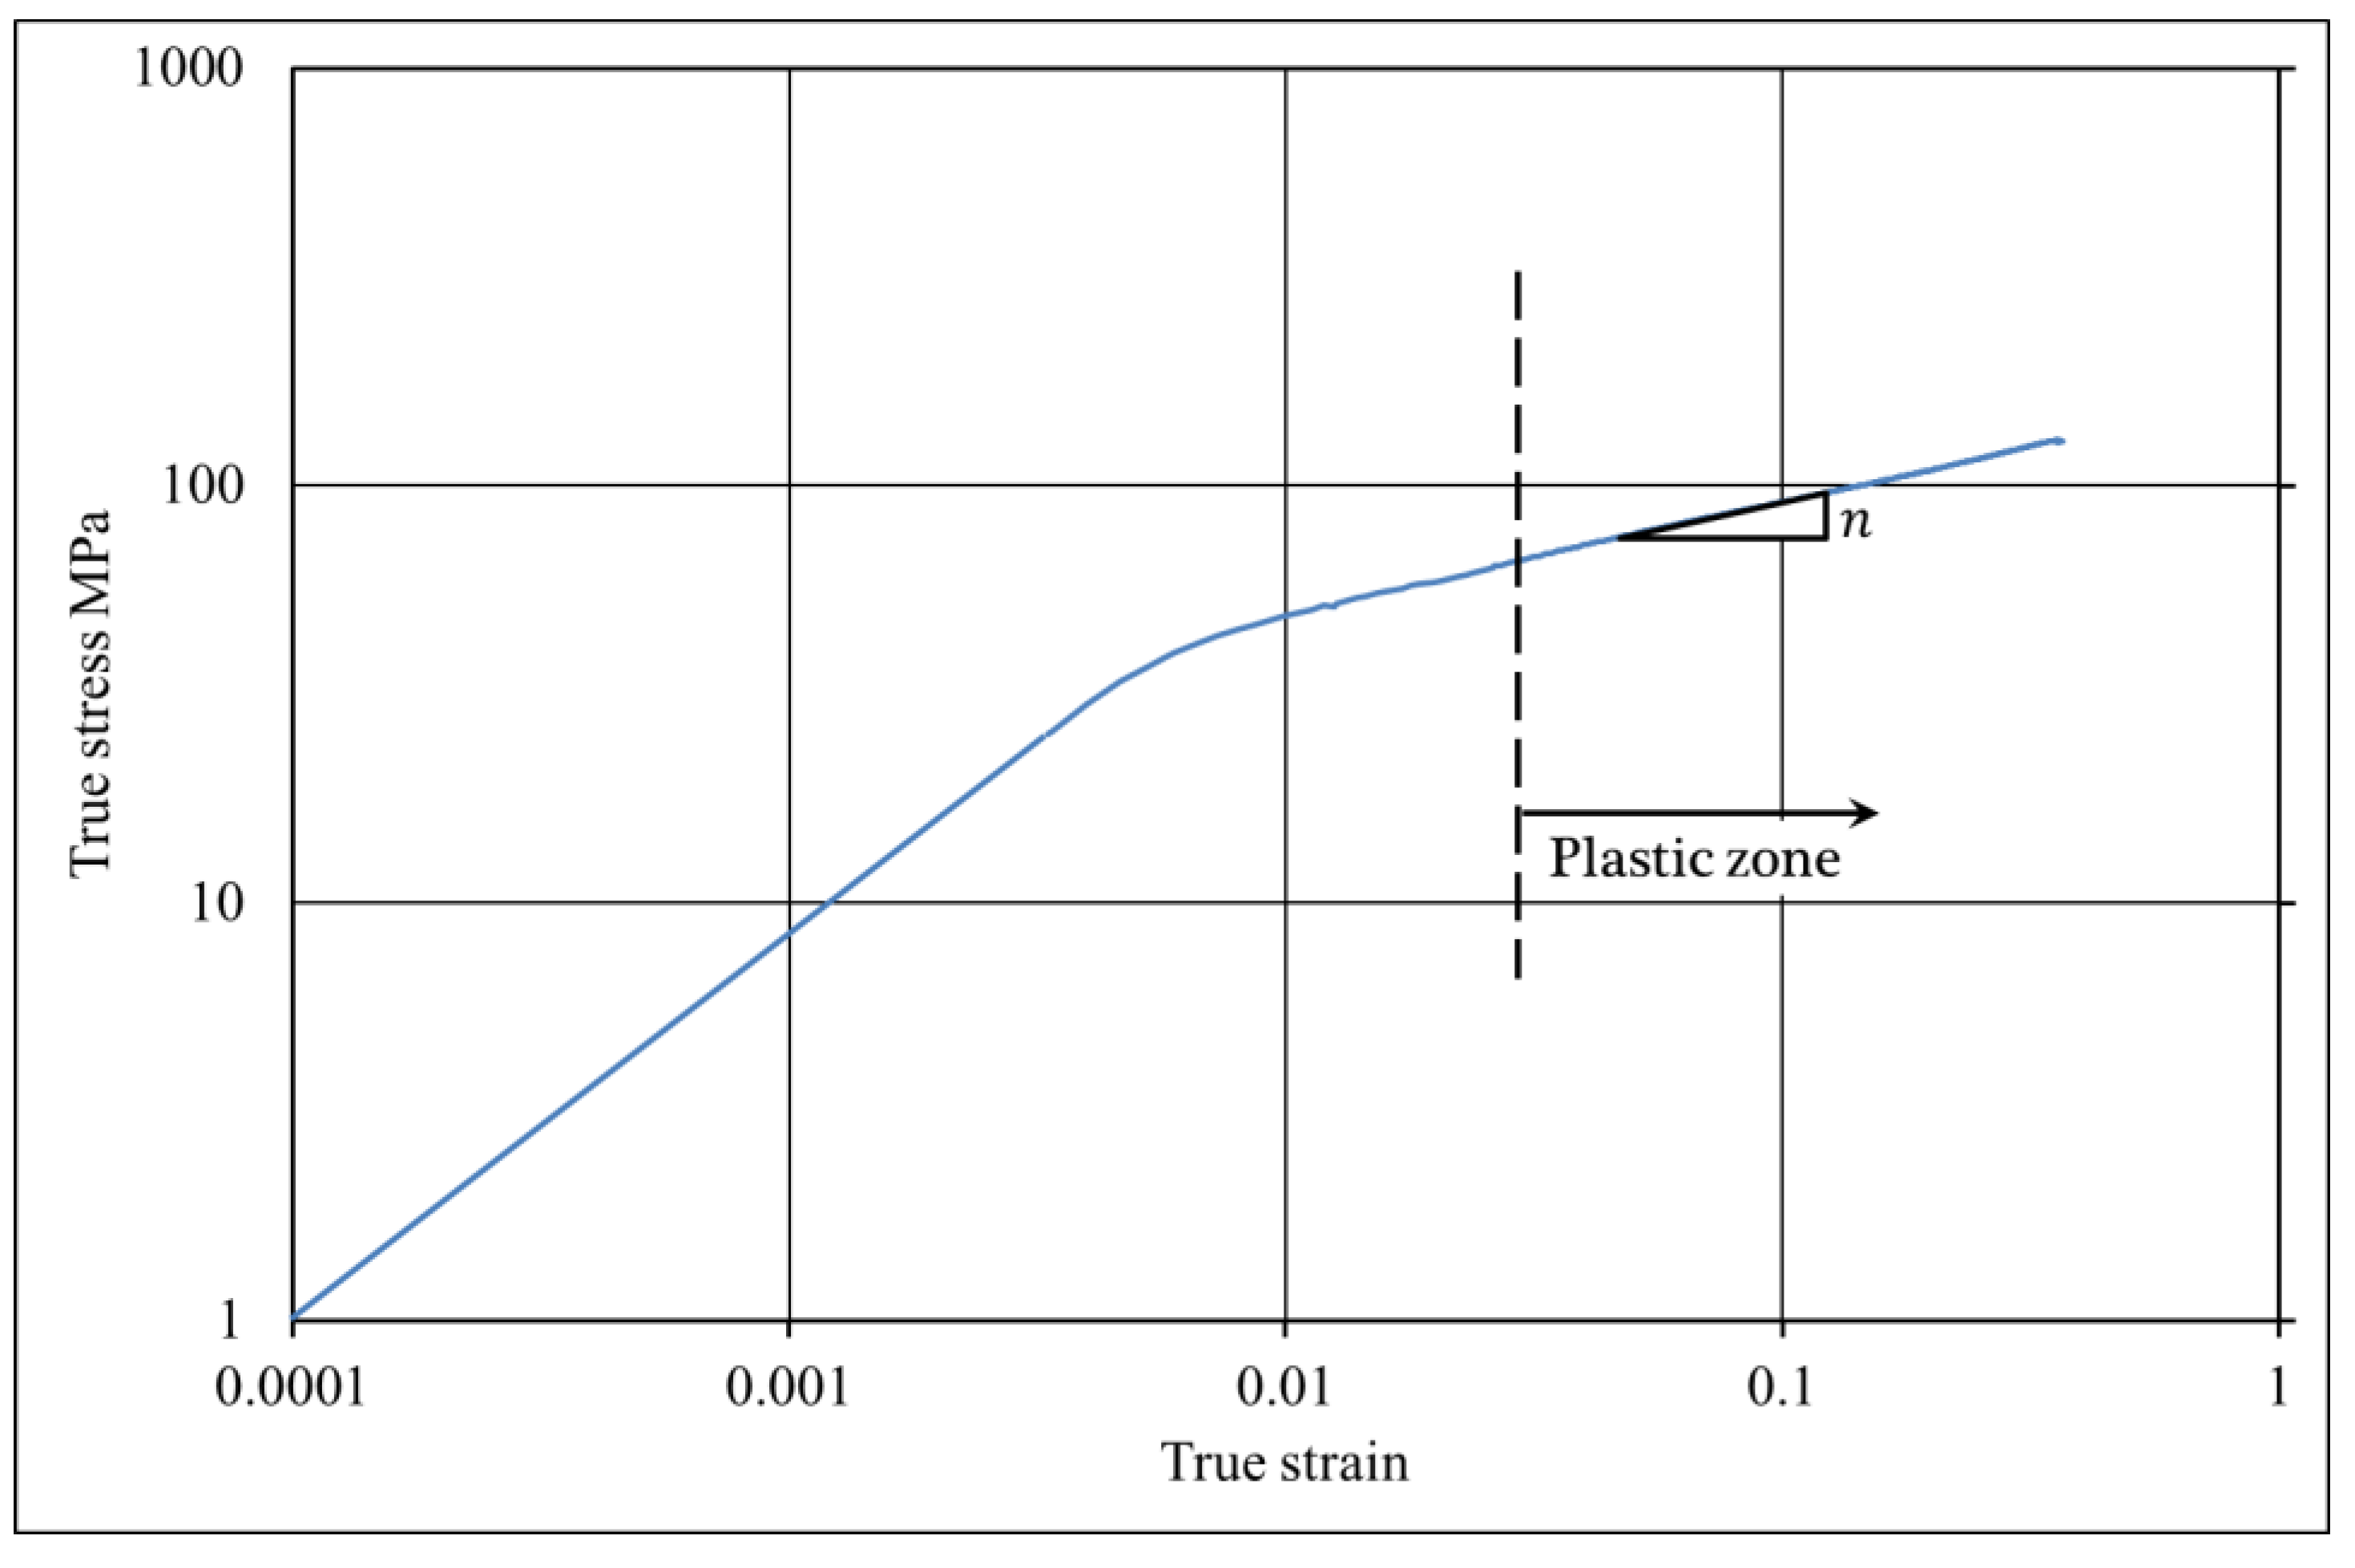
2.6. Determination of Mechanical Properties

Sub-size specimen along the tool forming (longitudinal) direction, as per the ASTM standard E‑8M [32], were extracted via electro-discharge machining (EDM). The EDM was preferred as this method induced lower residual stresses as compared with the other conventional machining methods. The standard tensile tests were then performed at a cross-head speed of 1 mm/min in a universal testing machine (Model 5567 by Instron®, Norwood, MA, USA) equipped with a 30 kN load cell. The tensile strength and the percentage elongation at failure were then determined from the machine’s recorded data.

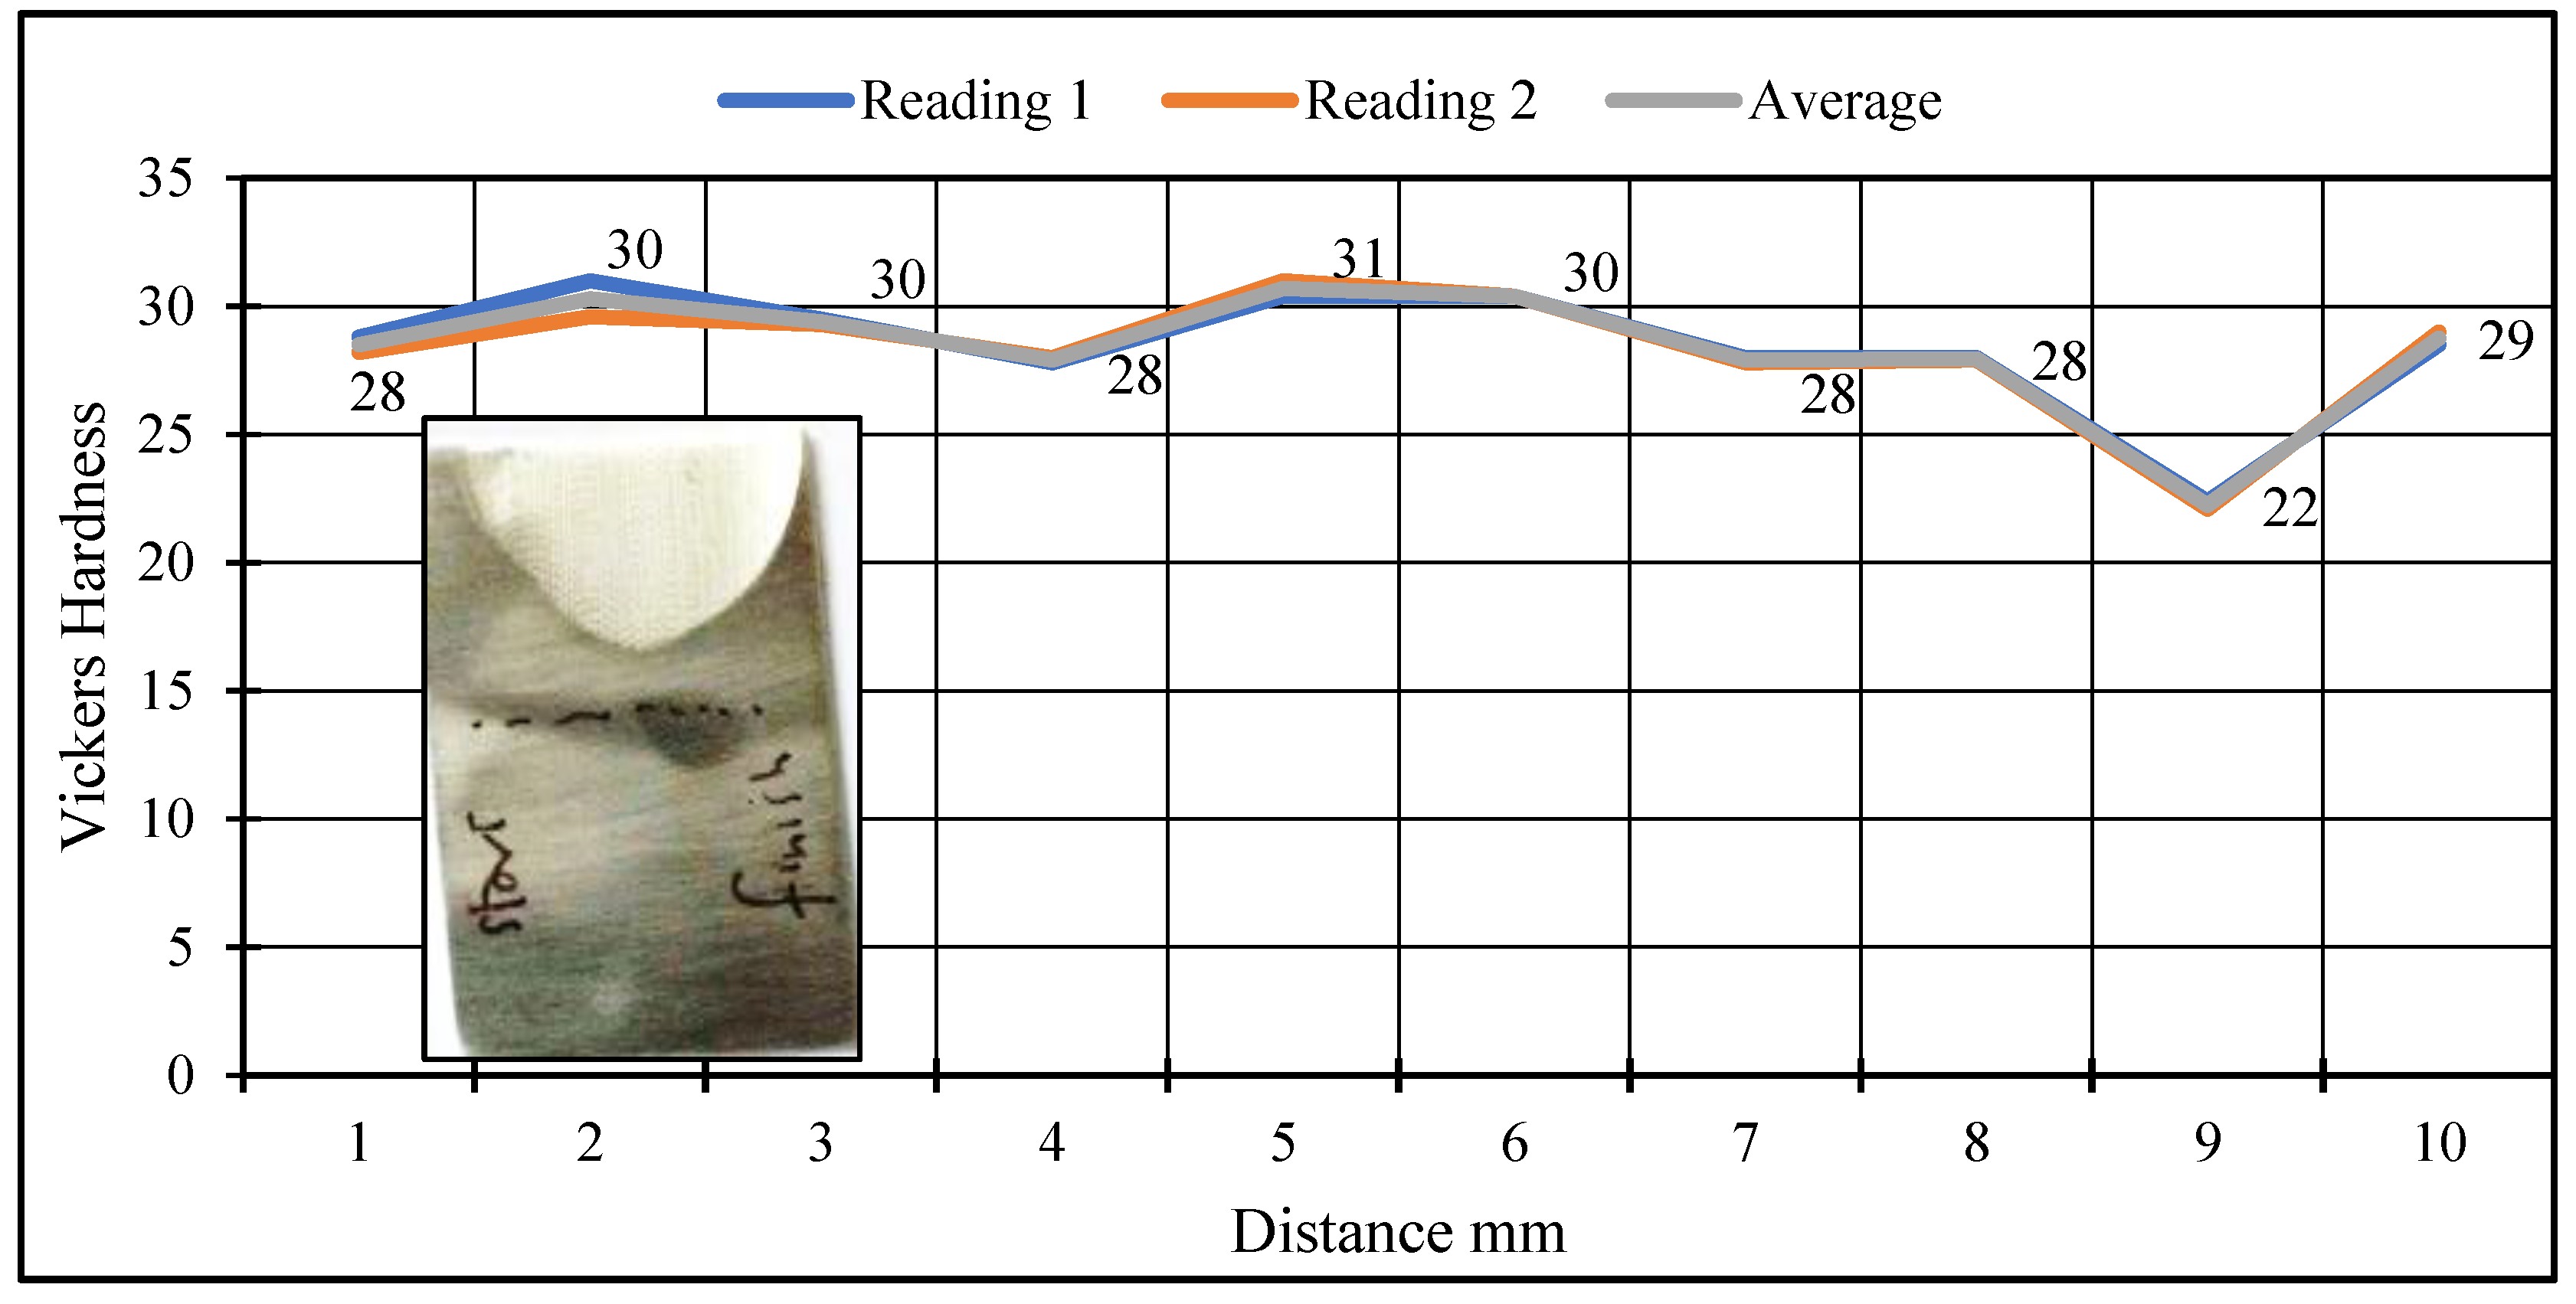
2.7. Vickers Hardness

Micro-hardness tester (Model HM-210/220 by Mitutoyo, Aurora, IL, USA) was employed to determine the Vickers hardness value (HV). These tests were performed according to the ASTM standard E‑92 [33] on the following:
  • Rolled sheet (pre-ISF)
  • Annealed sheet (pre-ISF)
  • Formed parts (post-ISF)
A white rectangle, as shown in Figure 5, highlights a typical extraction location of the hardness test sample. Figure 6 shows a typical hardness test carried along the width (parallel to the direction S3) of a 20 mm × 10 mm sample. Two measurements were taken for every test and their average was calculated. It is evident from Figure 6 that the curves are close together and, therefore, only two measurements are justified. Finally, the average throughout the length was calculated and used for further analysis.

3. Results and Discussion

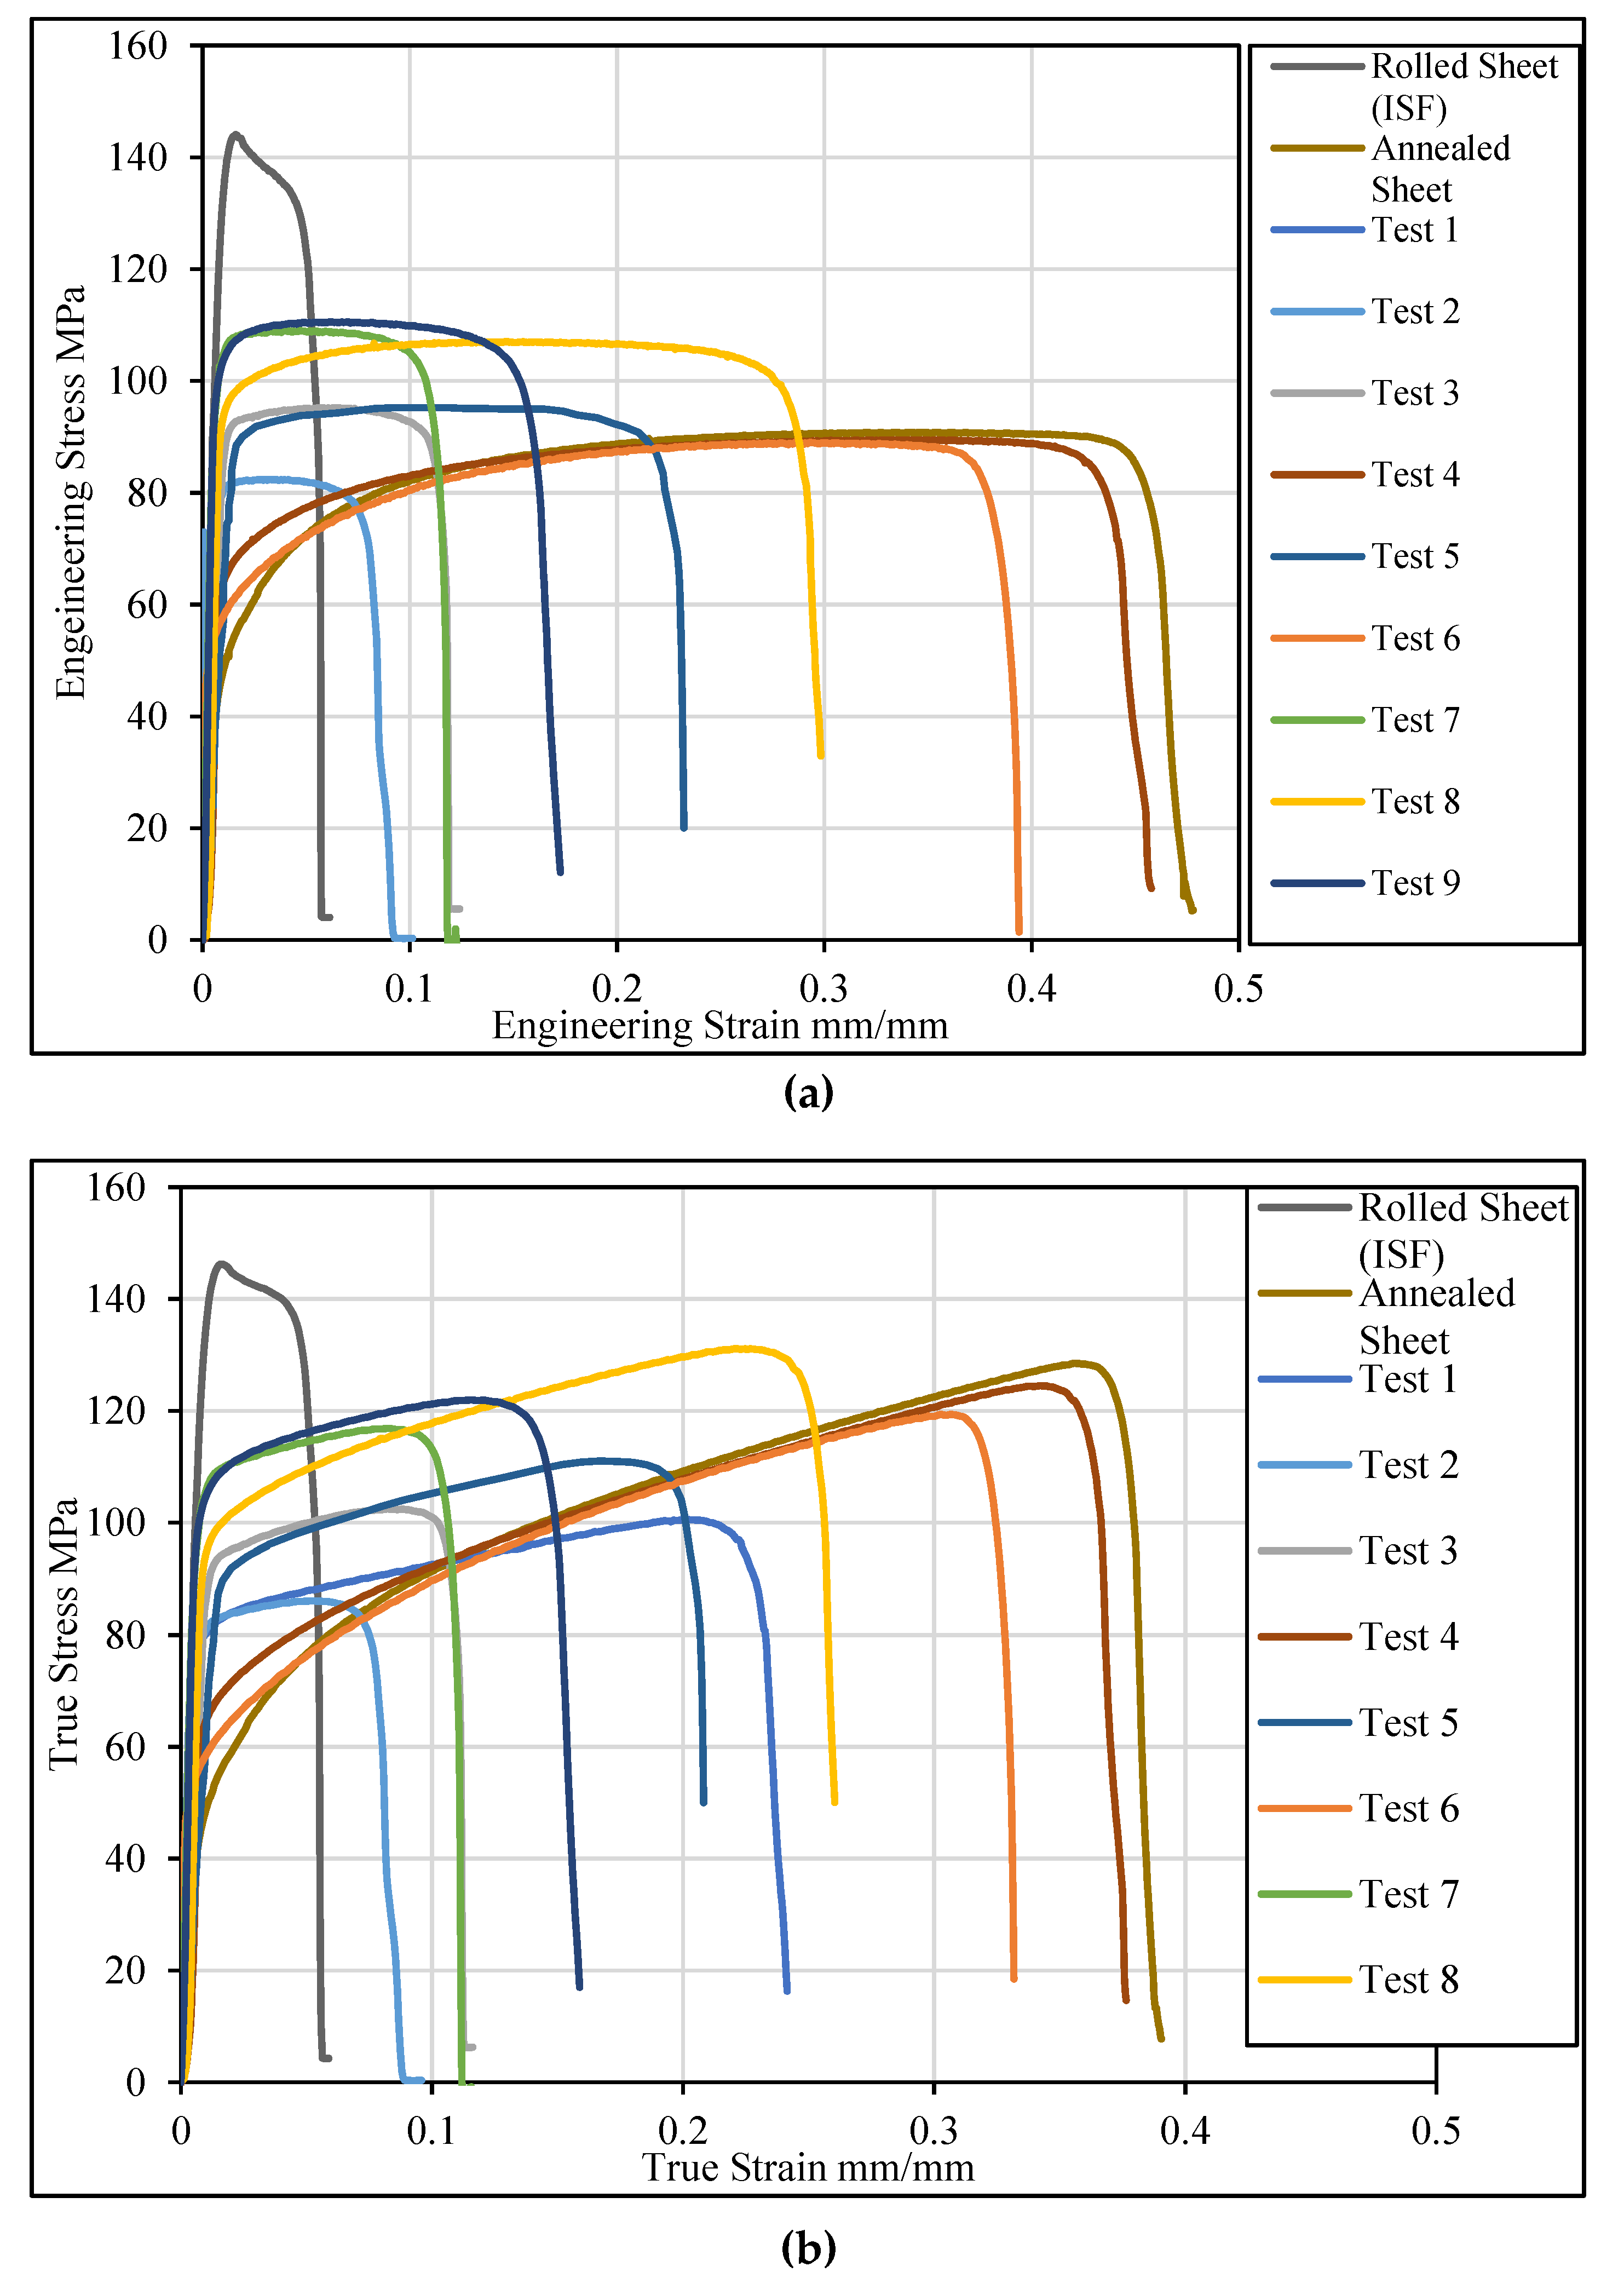
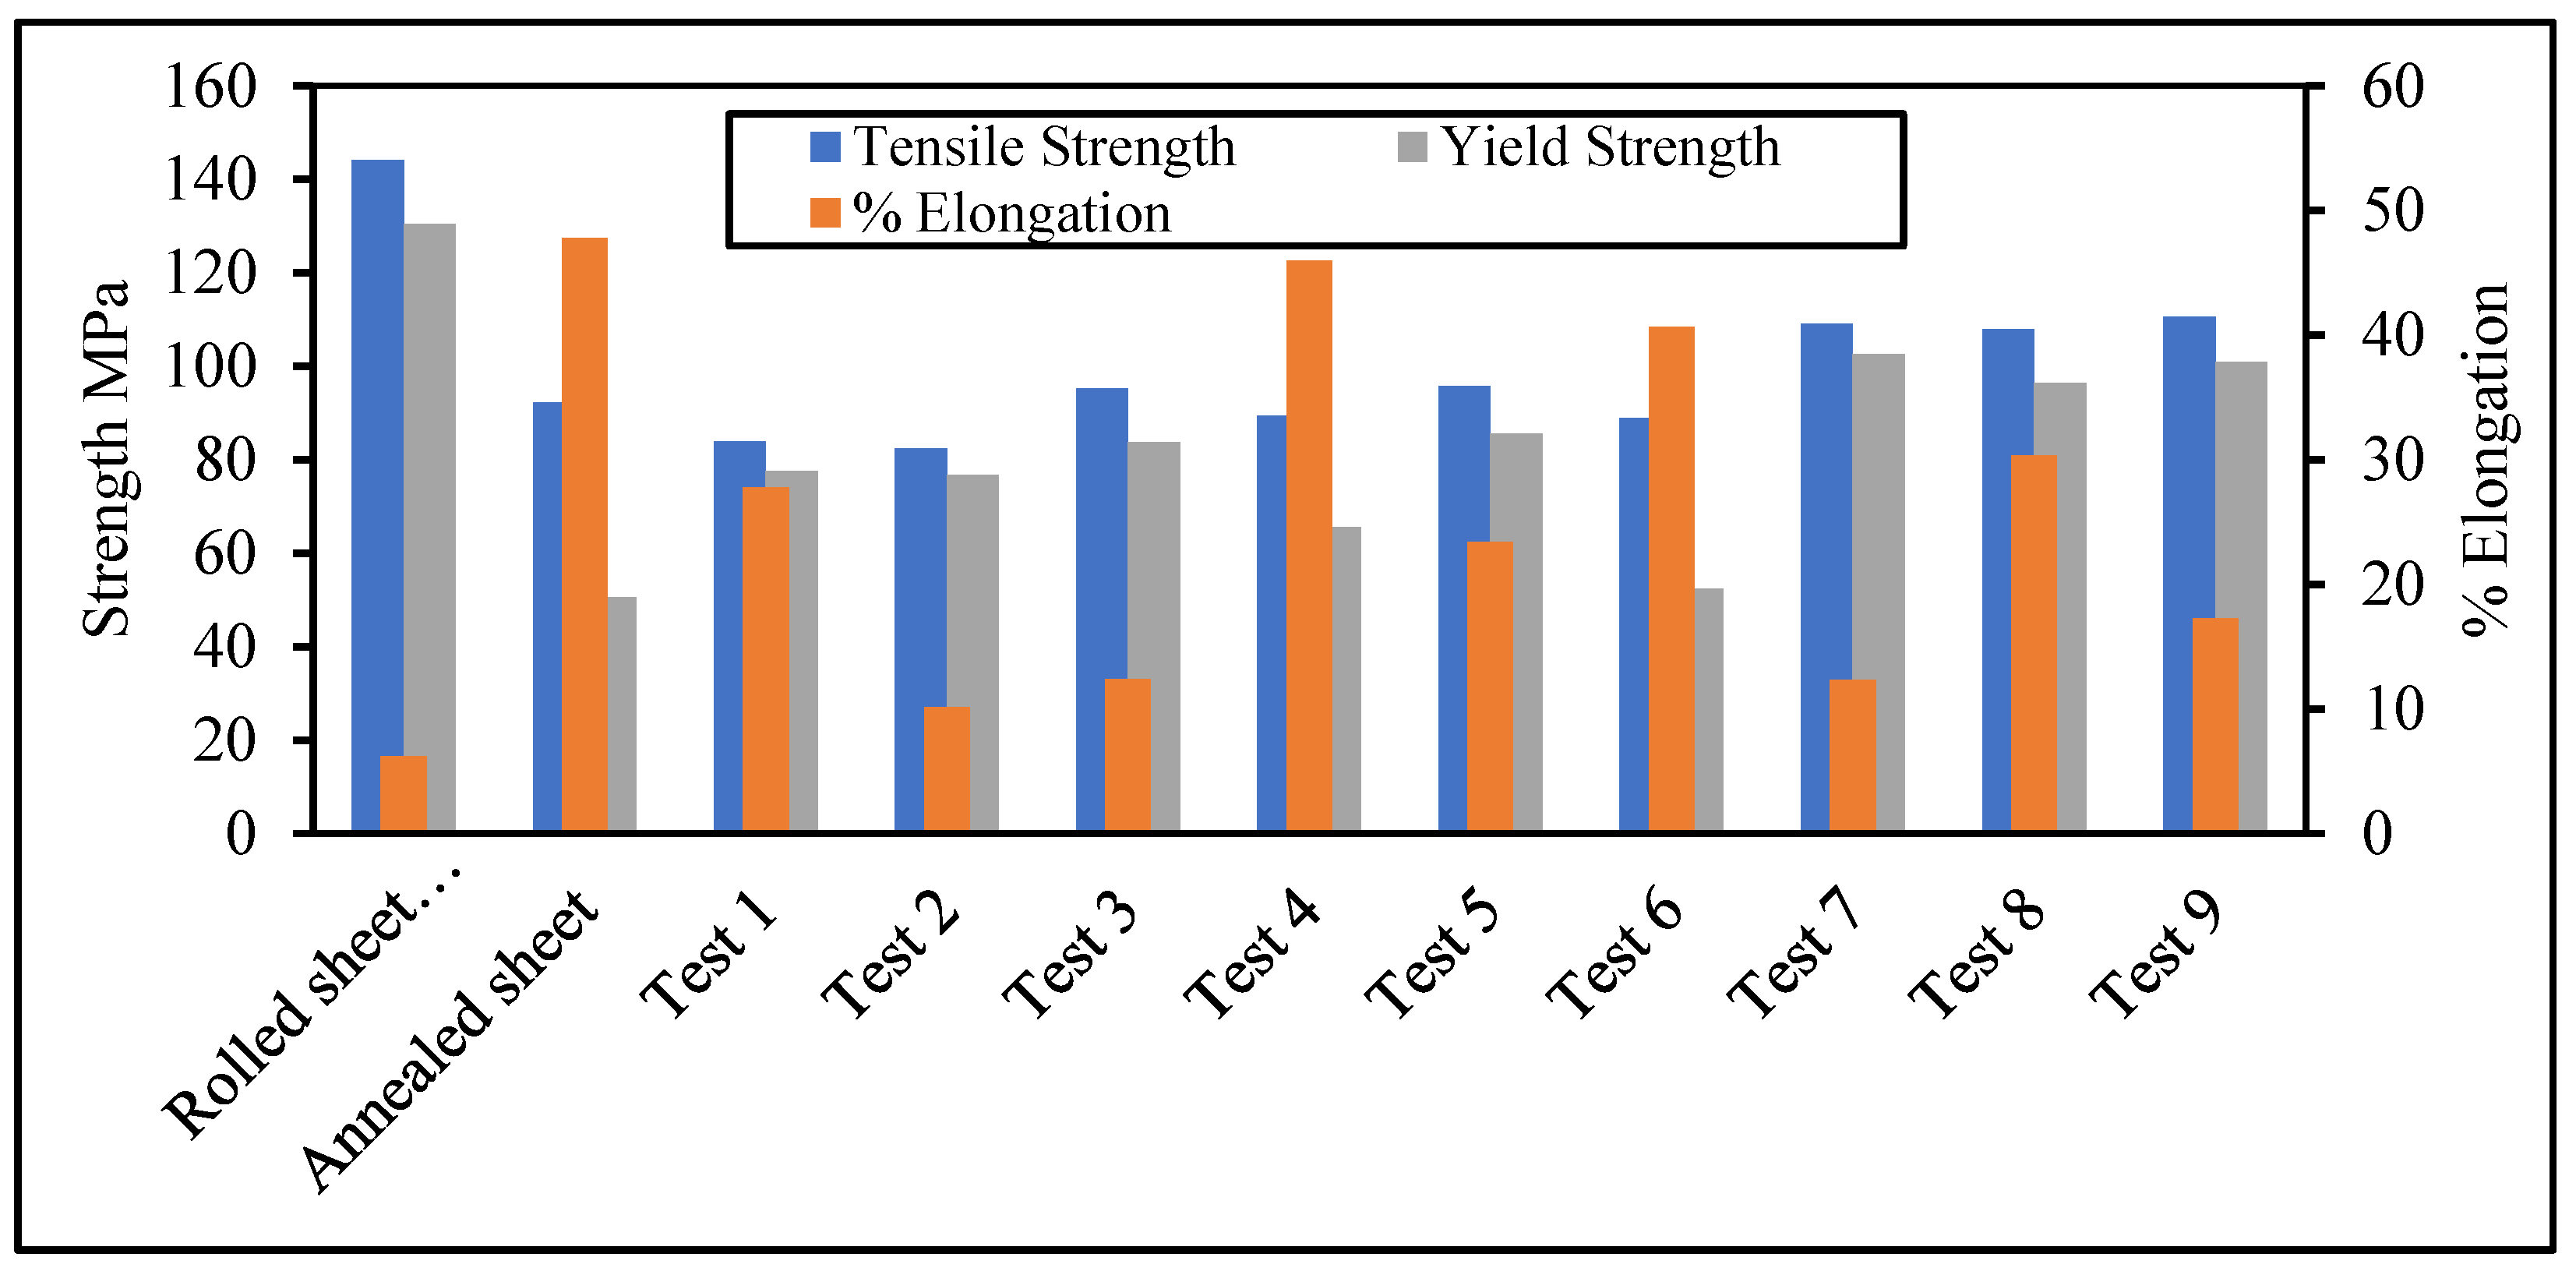
3.1. Pre- and Post-ISF Tensile Properties

The engineering stress–strain behaviors of the rolled sheet (ISF), the annealed sheet and the formed parts are shown in Figure 7a. Figure 7b shows the true stress–strain behavior of the tests performed herein. Amongst the parts made from the annealed sheet, the highest strengths and the percentage differences of the yield and the ultimate strengths (σy and σu), keeping the annealed sheet as a reference (σISFσannealed)/σannealed are exhibited by Tests 7, 8 and 9. These differences are above 90% for the σy and above 17% for the σu. Moreover, Test 7 exhibits the highest gain of 102.37% in the σy. On the other hand, the highest gain in the σu is shown by Test 9. The smallest deviations of σy and σu as compared with the annealed sheet, are depicted by Test 6. Here, these differences are 3.63% and −3.55%. It can be identified that the highest strength accompanied by the lowest failure strain is depicted by the specimen extracted from the part made of the rolled sheet. The percentage differences in the σy and σu of the rolled sheet (ISF) as compared with the annealed sheet are 157.60% and 56.12%, respectively.
In Figure 7 and Table 4, from the point of view of the ultimate strength, we can identify four groups of results i.e., first group contains Tests 1 and 2, second contains Tests 3 and 5, third contains Tests 7, 8 and 9; and the fourth contains Test 4, 6 and the annealed sheet. These four groups have nearly identical ultimate strengths. Moreover, these four groups also show that the difference between the ultimate strength (σu) and the yield strength (σy) is very small i.e., within 15 MPa of each other.
Furthermore, Tests 2, 3 and 7 are formed at an angle of 60°. It is evident from Table 4 that the difference between the ultimate and the yield strength for each of these tests is within 2% of each other. This can be associated to the saturation of the dislocation density which manifests itself as a decrease in the strain hardening rate when a pre-strained material (i.e., sheet formed through ISF in this case) is further strained (i.e., by uniaxial stretching in this case) [2]. It is further noted from Table 4 that Tests 9, 8 and 3 have the yield strengths on the higher side due to the higher wall angles accompanied by the higher feed rates. These two factors cause an increase in the cold work, which consequently increases the dislocations density. The latter then causes the strength to increase [2].
The tensile properties extracted from the engineering stress–strain curves are summarized in a bar chart shown in Figure 8. It is evident from Figure 8 and Table 4 that the lowest percentage elongation at failure, a measure of ductility, is exhibited by the part formed from the rolled sheet. The lowest ductility occurs in this case due to the presence of high residual stresses, owing to the cold work, induced during the rolling process. On the other hand, the highest ductility is shown by the annealed sheet as the residual stresses have been relieved. The annealed sheet shows the highest failure strain. The annealing process causes the percentage elongation at failure to increase from 6.2%, in the case of the rolled sheet (ISF) to 47.8% observed for the unformed annealed sheet. The ductility of the specimen taken from the parts formed with a smaller wall angle, i.e., 20° (Tests 1, 4 and 6), is in the range of 27%~46%. The parts which are formed at a higher wall angle, i.e., 60° (Tests 2, 3 and 7), exhibit lower ductility. This inverse proportionality of the wall angle to the ductility is attributed to the fact that, as a part experiences higher amount of cold work, typical of the SPIF at higher wall angles, the ductility decreases. The highest percentage elongation at failure of 45.95%, among the formed parts, is observed during Test 4.
Although the rotational speed and the feed are higher in Test 4, the lower wall angle keeps the cold work to the lower side. Moreover, Test 9 provides the highest rotational speed and feed rate to the tool and the corresponding elongation at fracture is 17.28%. Whereas, at the same wall angle, i.e., Test 5, with a zero rotational speed, exhibits the same to be 23.43%. These results show that the higher rotational speed accompanied by a high feed rate, lead to a higher amount of cold work at the same wall angle.
The strain-hardening exponent was calculated by following the standard procedure reported in Hosford and Caddell and the ASTM standard E646 [2,34]. The true tensile stress–strain curve, which obeys power hardening law, was plotted on the log-log scale, as shown in Figure 9. The slope of the curve in the plastic zone was regarded as n. To be more precise, slope was estimated at 5 different locations in the plastic zone and a mean of these values is reported herein.
Hence, the strain-hardening exponents for the annealed sheet, Test 4 and Test 6 are found to be 0.263, 0.234 and 0.273, respectively, while, for Tests 1, 5 and 8, the strain-hardening exponent’s value is ~ 0.09 and for the remaining tests this value is <0.062. Figure 10 shows the difference between the ultimate and the yield strengths of individual tests plotted as a function of the strain-hardening exponent. A direct relationship exists amongst the difference in the σu and the σy and the strain-hardening exponent. The higher the difference among the σu and the σy, the higher the strain-hardening exponent. This information is useful as it can help in the decision making regarding ductile or brittle failure. The parts having considerable difference amongst the σu and the σy will undergo a ductile failure, which is often sought after in the mechanical design. Therefore, in this case, Tests 4, 6 and 8 are likely to exhibit the ductile failure.
A comparison between the present and the past studies is presented in Table 5. As can be noticed, the highest gain of 280.87% in the yield strength is shown by the Cu-steel-Cu O sheet component, while the lowest of 55.82% is endured by the Cu-steel-Cu H24. The highest gain in the ultimate strength of 288.61% is shown by the Cu-steel-Cu O sheet followed by the gain of 58.34% demonstrated by the Cu-steel-Cu H24. As far as the ductility is concerned, most of the listed materials experience a loss except Cu-steel-Cu H24. Furthermore, similar to the tensile strengths, the percentage change in the ductility due to the ISF shows a dependence on the type of the material. From this comparison, it can be inferred that the gain or loss in the mechanical properties of materials upon ISF is corelated with the microstructure of the parent material. However, further investigations are required to probe this point.

3.2. Effect of Material Condition on Tensile Properties

The effect of material condition on the post-ISF mechanical properties can be elaborated by comparing Test 7 and the ISF of an as-received (rolled) sheet. Both have been formed with identical process parameters (i.e., ω = 1500 rpm, 𝑓 = 2000 mm/min, θ = 60° and d = 6 mm). From Figure 7 and Table 4, it is seen that the post-ISF ductility of the rolled sheet is reduced to half, i.e., from 12% to 6.18%. On the other hand, the reduction in ductility is more pronounced when Test 7 is compared with the annealed sheet. In this case, the ductility drops to 12.35% from 47.8%. As far as the post-ISF strengths are concerned, the σy and the σu of the rolled sheet are increased by 55.36% and 30.94%, respectively. Similarly, the post-ISF strengths of the annealed sheet are also increased. Here, an increase of 64.58% is observed for the σy and the increase in the σu is 17.8%.
In the above paragraph, we notice that the increase in the yield strength is nearly identical but the increase in the ultimate strength is different for the two materials’ conditions. This can be explained with the help of schematics (a) and (b) in the Figure 11. Prior to the rolling, a billet does not have any strain imposed on it, i.e., ε1 = ε2 = ε3 = 0. Once this billet is rolled to form a sheet through the cold working process, the strain path (ε1 = −ε3) modifies the dislocation density, refer Figure 11a. Then, the ISF ((ε1 = −ε3)) further increases the dislocation density. Finally, the uniaxial extension (ε1 = −2ε2 = −2ε3) is carried out and fracture takes place when the saturation of dislocation density is reached. In the schematic shown in Figure 11b, the strain path is different from the one in Figure 11a. We start with an annealed sheet (no strain imposed i.e., ε1 = ε2 = ε3 = 0) then ISF (ε1 = −ε3) takes place on the same sheet and modifies the dislocation density. Finally, the uniaxial tension fractures the specimen due to the saturation of dislocation density as represented in Figure 11b. It is, therefore, concluded that the strain path has a significant influence on the saturation of dislocation density which in turn influences the post-ISF mechanical properties.

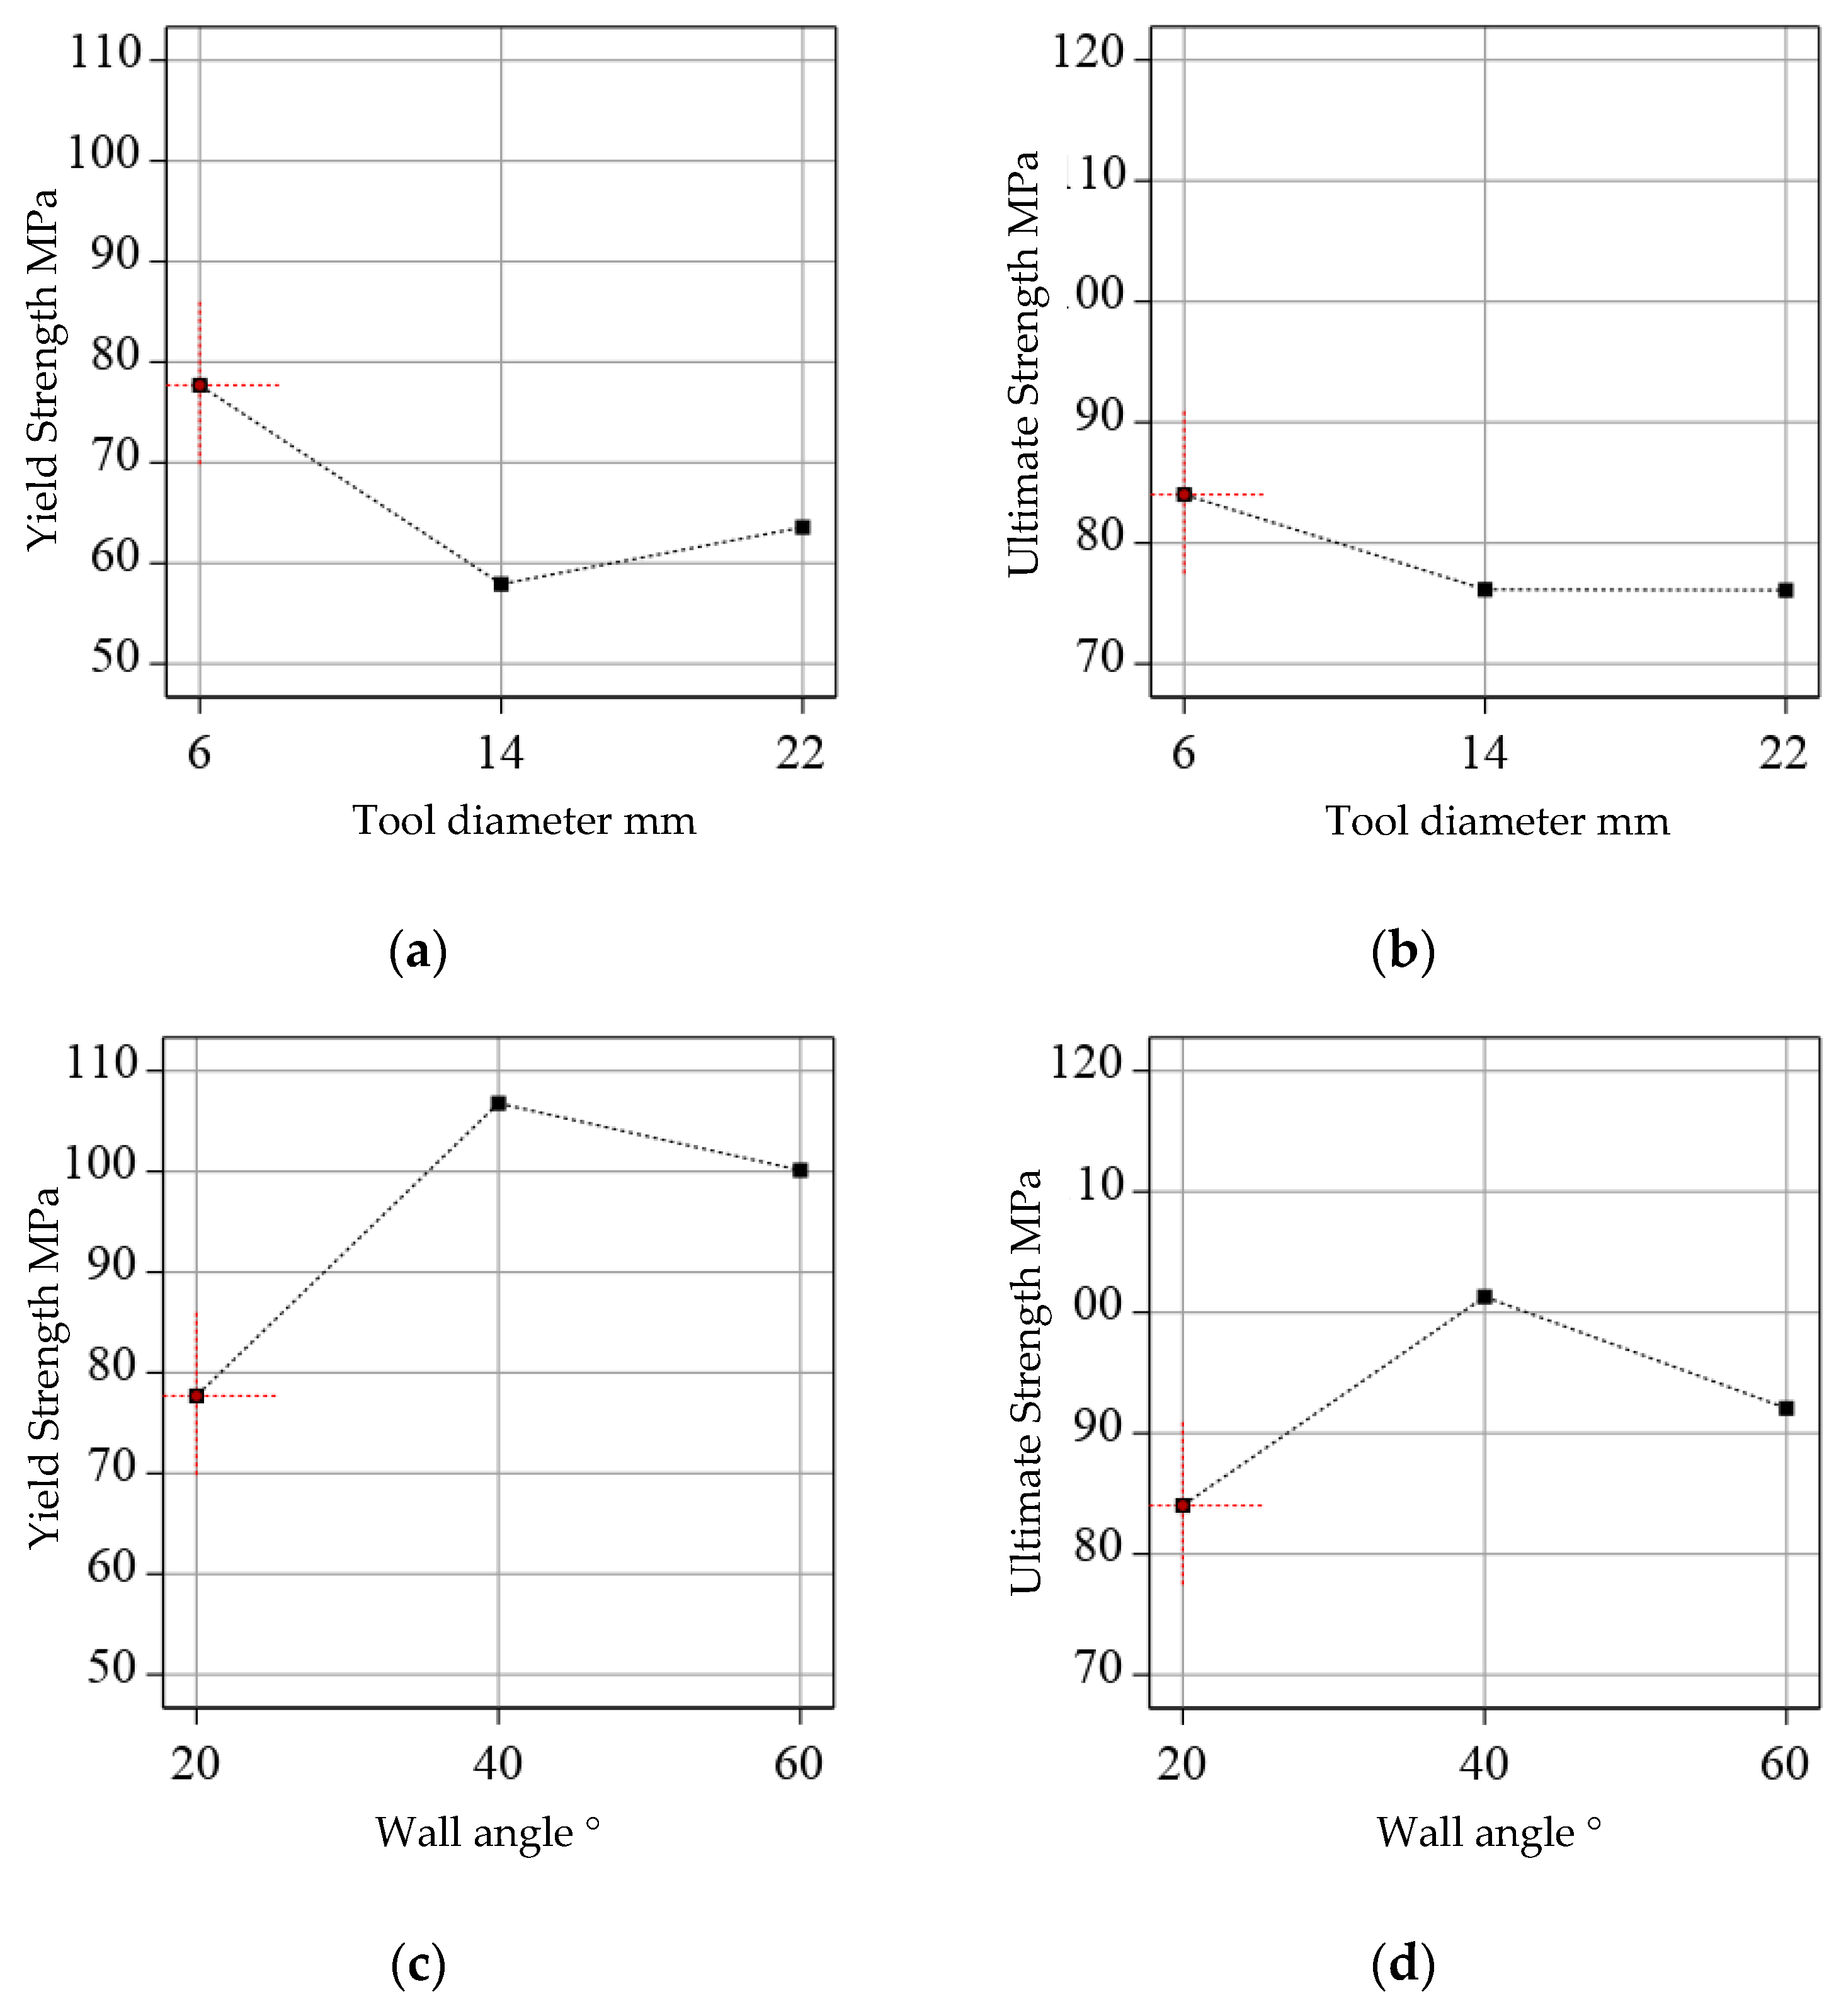
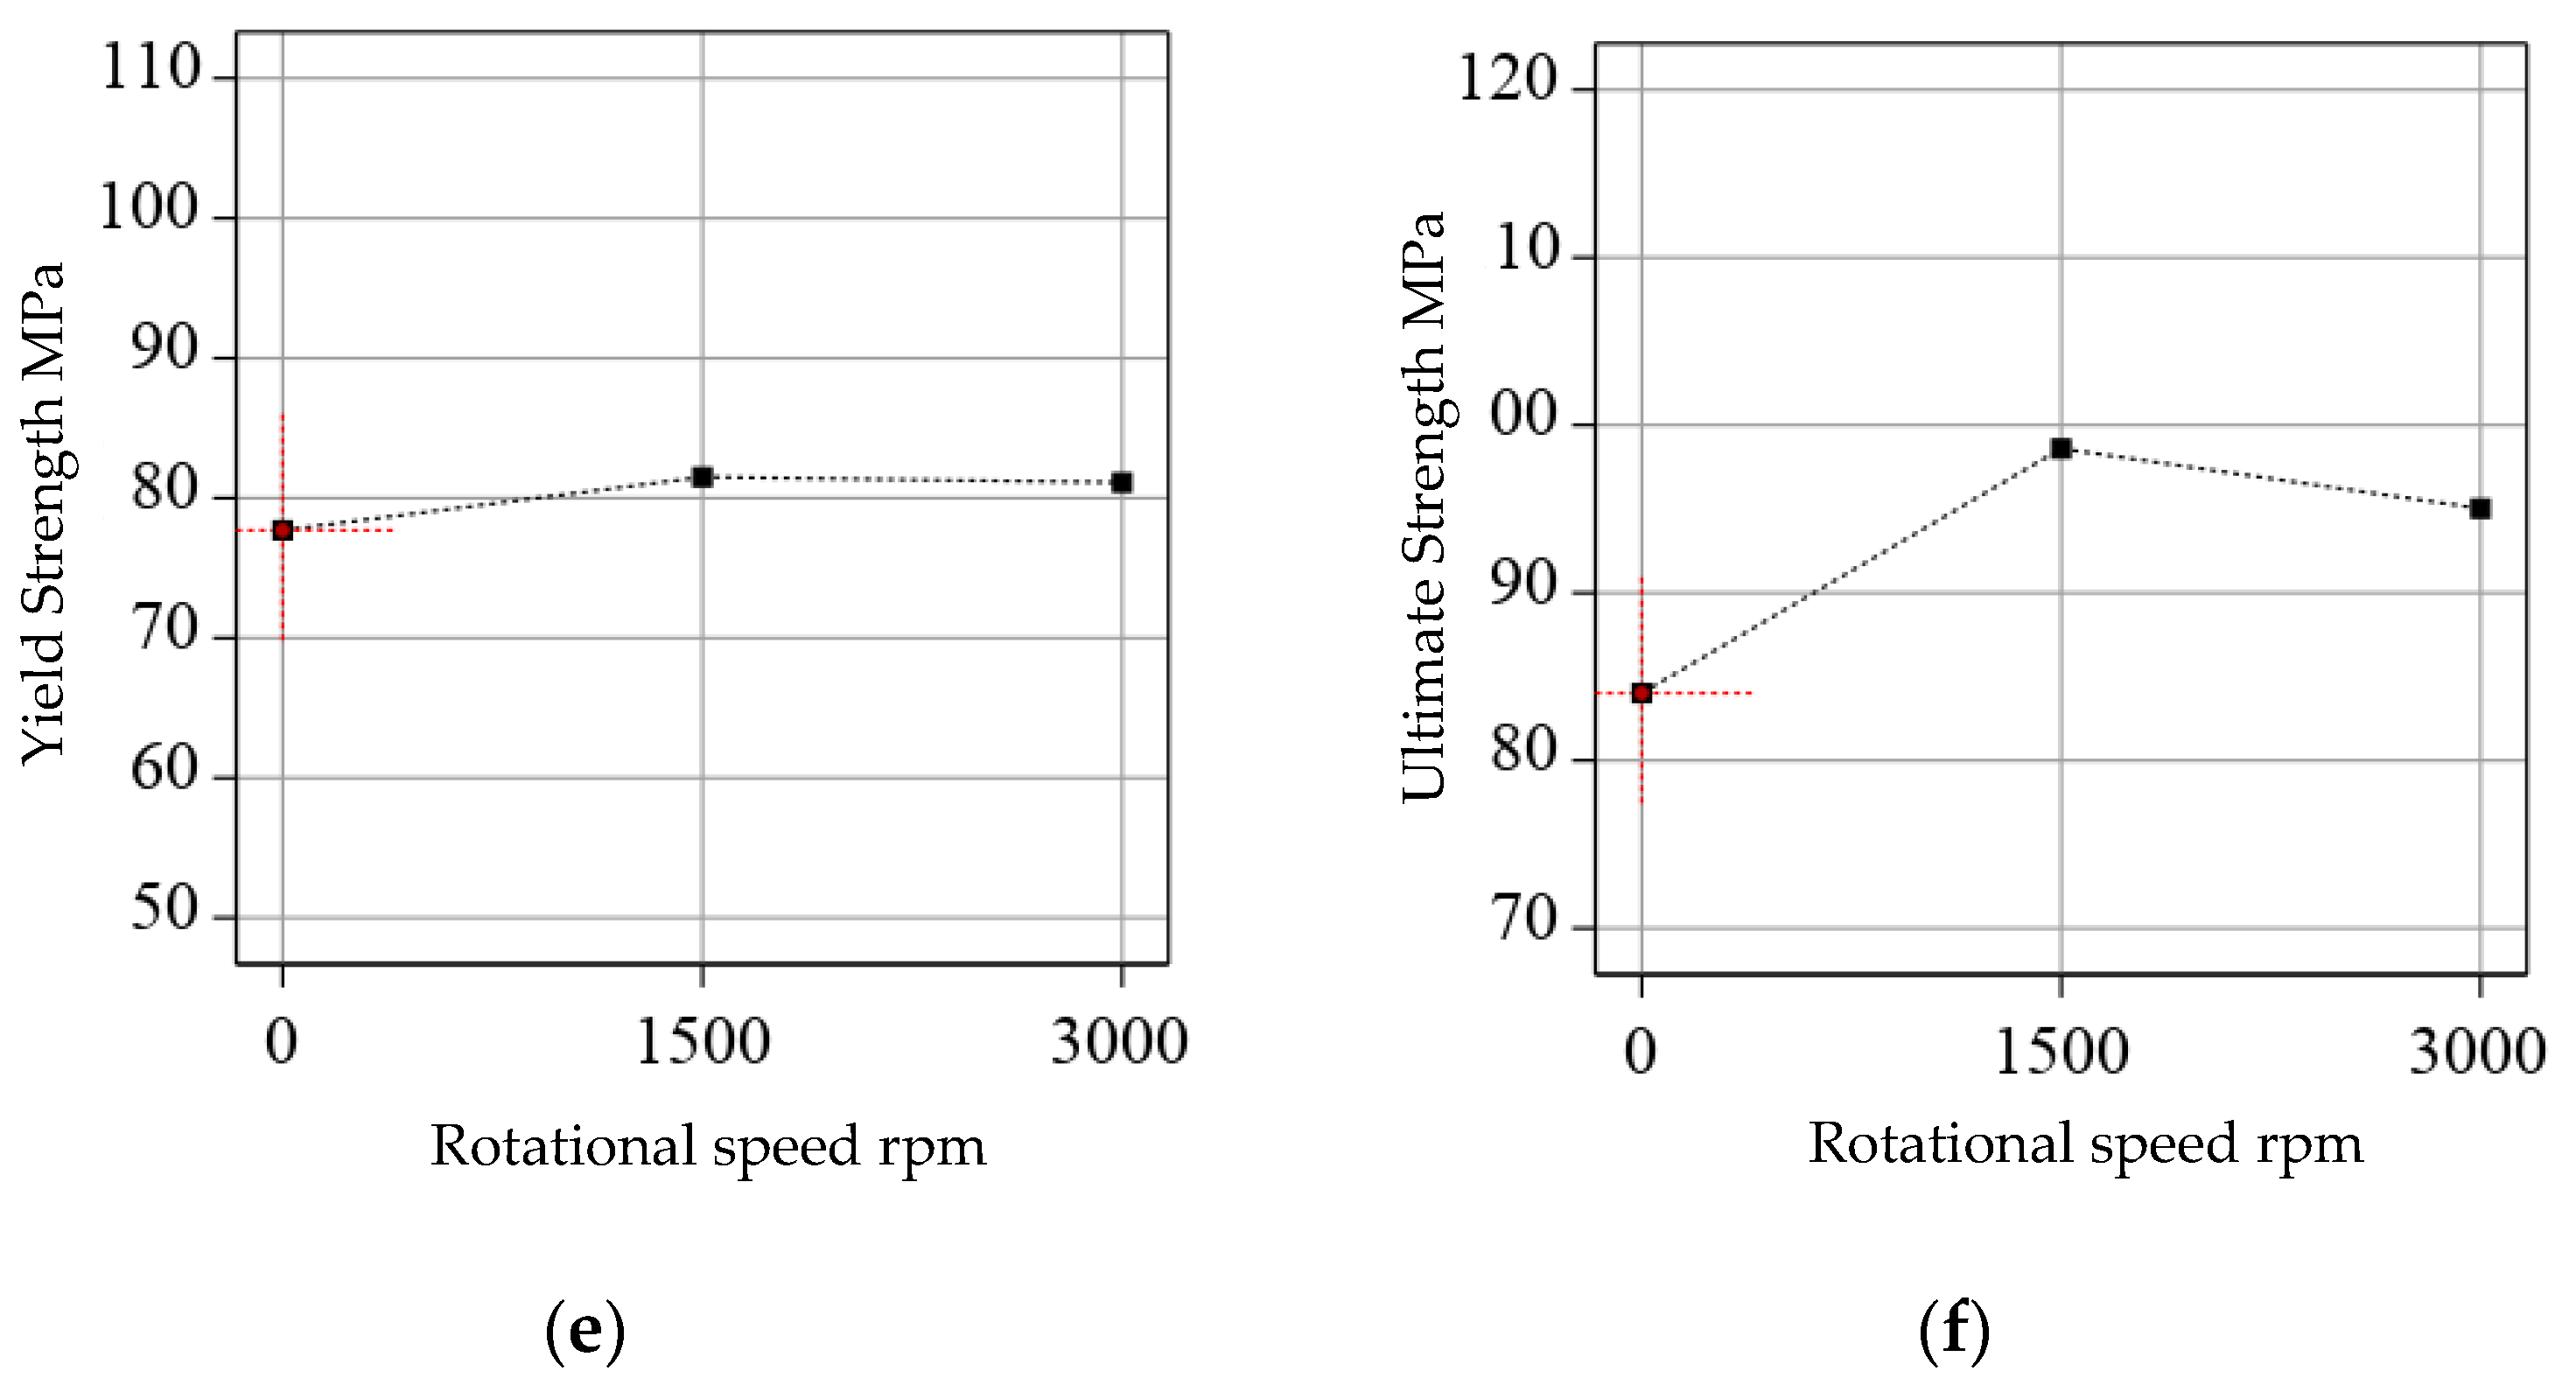
3.3. Correlation of Process Parameters with Tensile Properties

The main effect plots of ductility as a function of various process parameters are shown in Figure 12. It is noted from Figure 12a that the ductility decreases as the wall angle increases from 20° to 60°. This happens because the applied strain increases with the wall angle [16], thus resulting in an inverse relationship. The effect of the tool diameter on the elongation is depicted in Figure 12b. It is observed that a direct relationship exists between the tool diameter and the ductility. An increase in the tool diameter results in an increase in the percentage elongation. This can be associated with the increase in the heating due to an increased contact area with the tool diameter. Therefore, the highest magnitude of percentage elongation is observed when the tool diameter is 22 mm. Moreover, Figure 12c shows the effect of the tool rotation on the percentage elongation. The ductility increases with an increase in the rotational speed from 0 to 1500 rpm and then slightly drops with the further increase in rotational speed from 1500 to 3000 rpm. The increase in the ductility with an increase in the rotational speed can be attributed to the material softening due to the frictional heating. However, a drop in the ductility for the higher rotational speeds (i.e., greater than 1500 rpm) indicates that the boundary lubrication could not sustain the high temperatures due to the elevated frictional heating, thereby imparting greater frictional stresses and thus adversely affecting the ductility of the formed sheet [2,35]. It is observable from the Figure 12 that the best parameters to obtain ductile parts are ω = 1500 rpm, d = 22 mm and θ = 20°.
Figure 13a,c,e show the effects of the tool diameter, the wall angle and the rotational speed, respectively, upon the yield strength. Similarly, Figure 13b,d,f show the effects of these process parameters upon the ultimate strength. Regarding the effect of the tool diameter, as noted from Figure 13a, the components formed with a tool diameter of 6 mm show a greater yield strength than those formed with the tool diameters of 14 and 22 mm. Similarly, the ultimate strength exhibits a decrease as the tool diameter is increased from 6 to 14 mm, see Figure 13b. A comparison of the yield strength vs. tool dimeter, Figure 13a, and the ultimate strength vs. tool diameter, Figure 13b, shows that, in both cases, there is an initial drop in the strengths. This is followed by a rerise of the yield strength as the tool diameter is further increased from 14 to 22 mm, while the ultimate strength does not vary when the tool diameter is increased from 14 to 22 mm. Al-Ghamdi and Hussain [16] have reported that the hydrostatic compression, which delays the void formation/nucleation, decreases with an increase in the tool diameter. The decrease in the yield and the tensile strengths with increasing the tool diameter from 6 to 14 mm thus seems to be influenced by the mentioned effect. Furthermore, the increase in the yield strength with increase in the tool diameter from 14 to 22 mm shows that, interestingly, material hardening took place. These variations could have been affected by the inducement of residual stresses during forming. This point will be further clarified in the following part of this manuscript.
Moreover, it is observed from Figure 13c that the yield strength increases significantly as the wall angle is increased from 20° to 40°, whereas it decreases as the wall angle is further increased from 40° to 60°. However, this decrease is not as pronounced as the increase experienced from 20° to 40°. A quasi-identical behavior is observed in the case of the ultimate strength, see Figure 13d, i.e., initially the ultimate strength increases as the wall angle increases from 20° to 40°. A further increase in the wall angle from 40° to 60° manifests itself as a decrease in the ultimate strength. The initial increase in the yield and ultimate strengths with the increase in the wall angle represents strain hardening, while the decrease in these strengths signifies that the ISF-induced defects, such as micro-voids and surface-cracks, due to processing at higher angles (i.e., >40° or larger strains in other words), adversely affect the yield strength, despite an increase in the strain hardening [36].
Figure 13e depicts that the rotational speed, when increased from 0 to 1500 rpm, causes the yield strength to improve slightly and then remain fixed when the rotational speed is further increased from 1500 to 3000 rpm. On the other hand, the ultimate strength shows a considerable improvement with an increase in the rotational speed from 0 to 1500 rpm, see Figure 13f. Furthermore, increase in the rotational speed from 1500 rpm to 3000 rpm causes the ultimate strength to moderately drop. In the previous studies [37,38], it has been reported that the tool rotation causes the grain refinement and frictional heating. The increase in the yield and ultimate strengths with an increase in the rotational speed from 0 to 1500 rpm seems to be affected by the grain refinement, while a drop in the strength with a further increase in the rotational speed seems to be influenced by the frictional heating.
Hence, to maximize the component strengths, the sheets should be processed by a tool diameter of 6 mm at a wall angle of 40° with a rotational speed of 1500 rpm. These ideal conditions are based on the Taguchi design comprising nine tests and are assumed to be reasonably optimal. However, a further improved set of conditions may be achieved in case a full factorial design consisting of 81 tests is conducted.
Based on the above analysis, as compared with the parent sheet, the formed parts receive gains of 110.76% and 9.8% in the yield and ultimate strengths, respectively. These gains in the strengths are accompanied by a 21.63% drop in the elongation, as compared with the parent sheet. This means that the novel ISF process can substantially enhance the strength of the component and, thus, one can reduce the overall weight. Moreover, the comparison of the present work with another recent study of ISF conducted on a rolled bonded (copper-steel) bilayer sheet presents an interesting observation. The increase in the ductility of roll bonded sheets is always accompanied with an increase in the strength [27]. On the other hand, the monolithic sheet, used in this study, shows the opposite behavior, i.e., the increase in the strength is accompanied by a decrease in the ductility. Therefore, it is safe to say that the post-ISF behavior of monolithic sheets is different from the layered sheets.

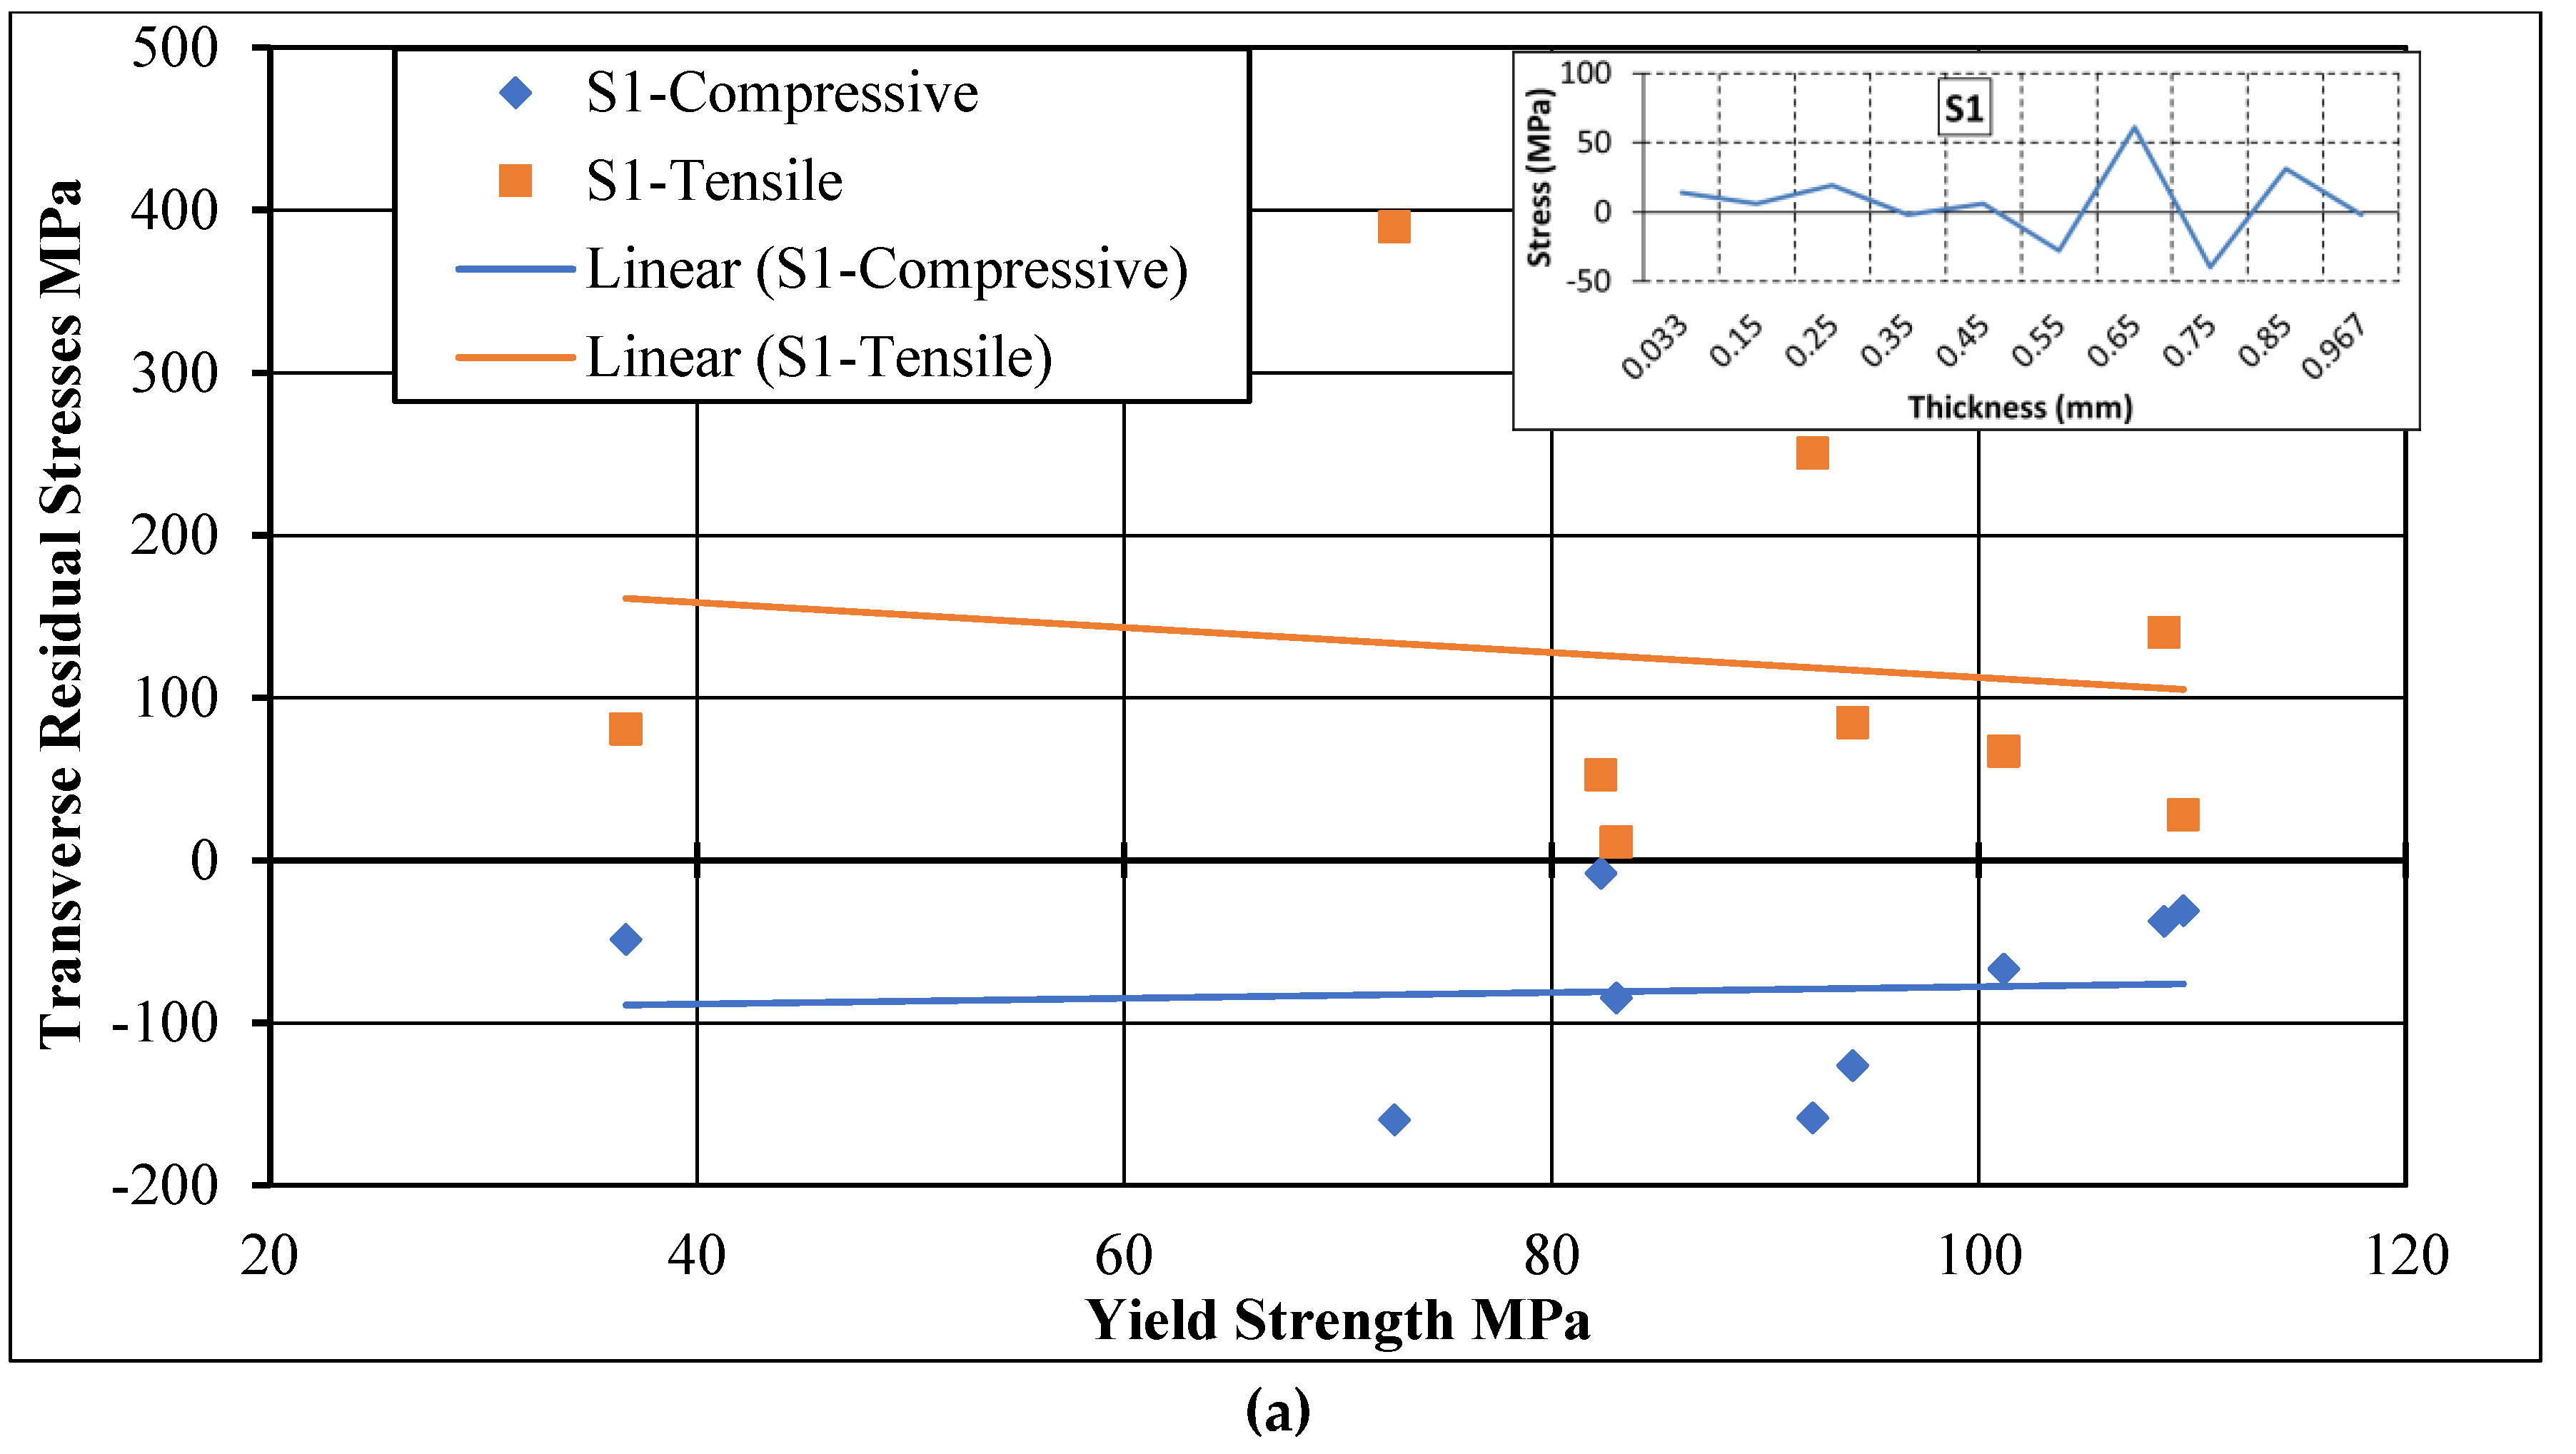
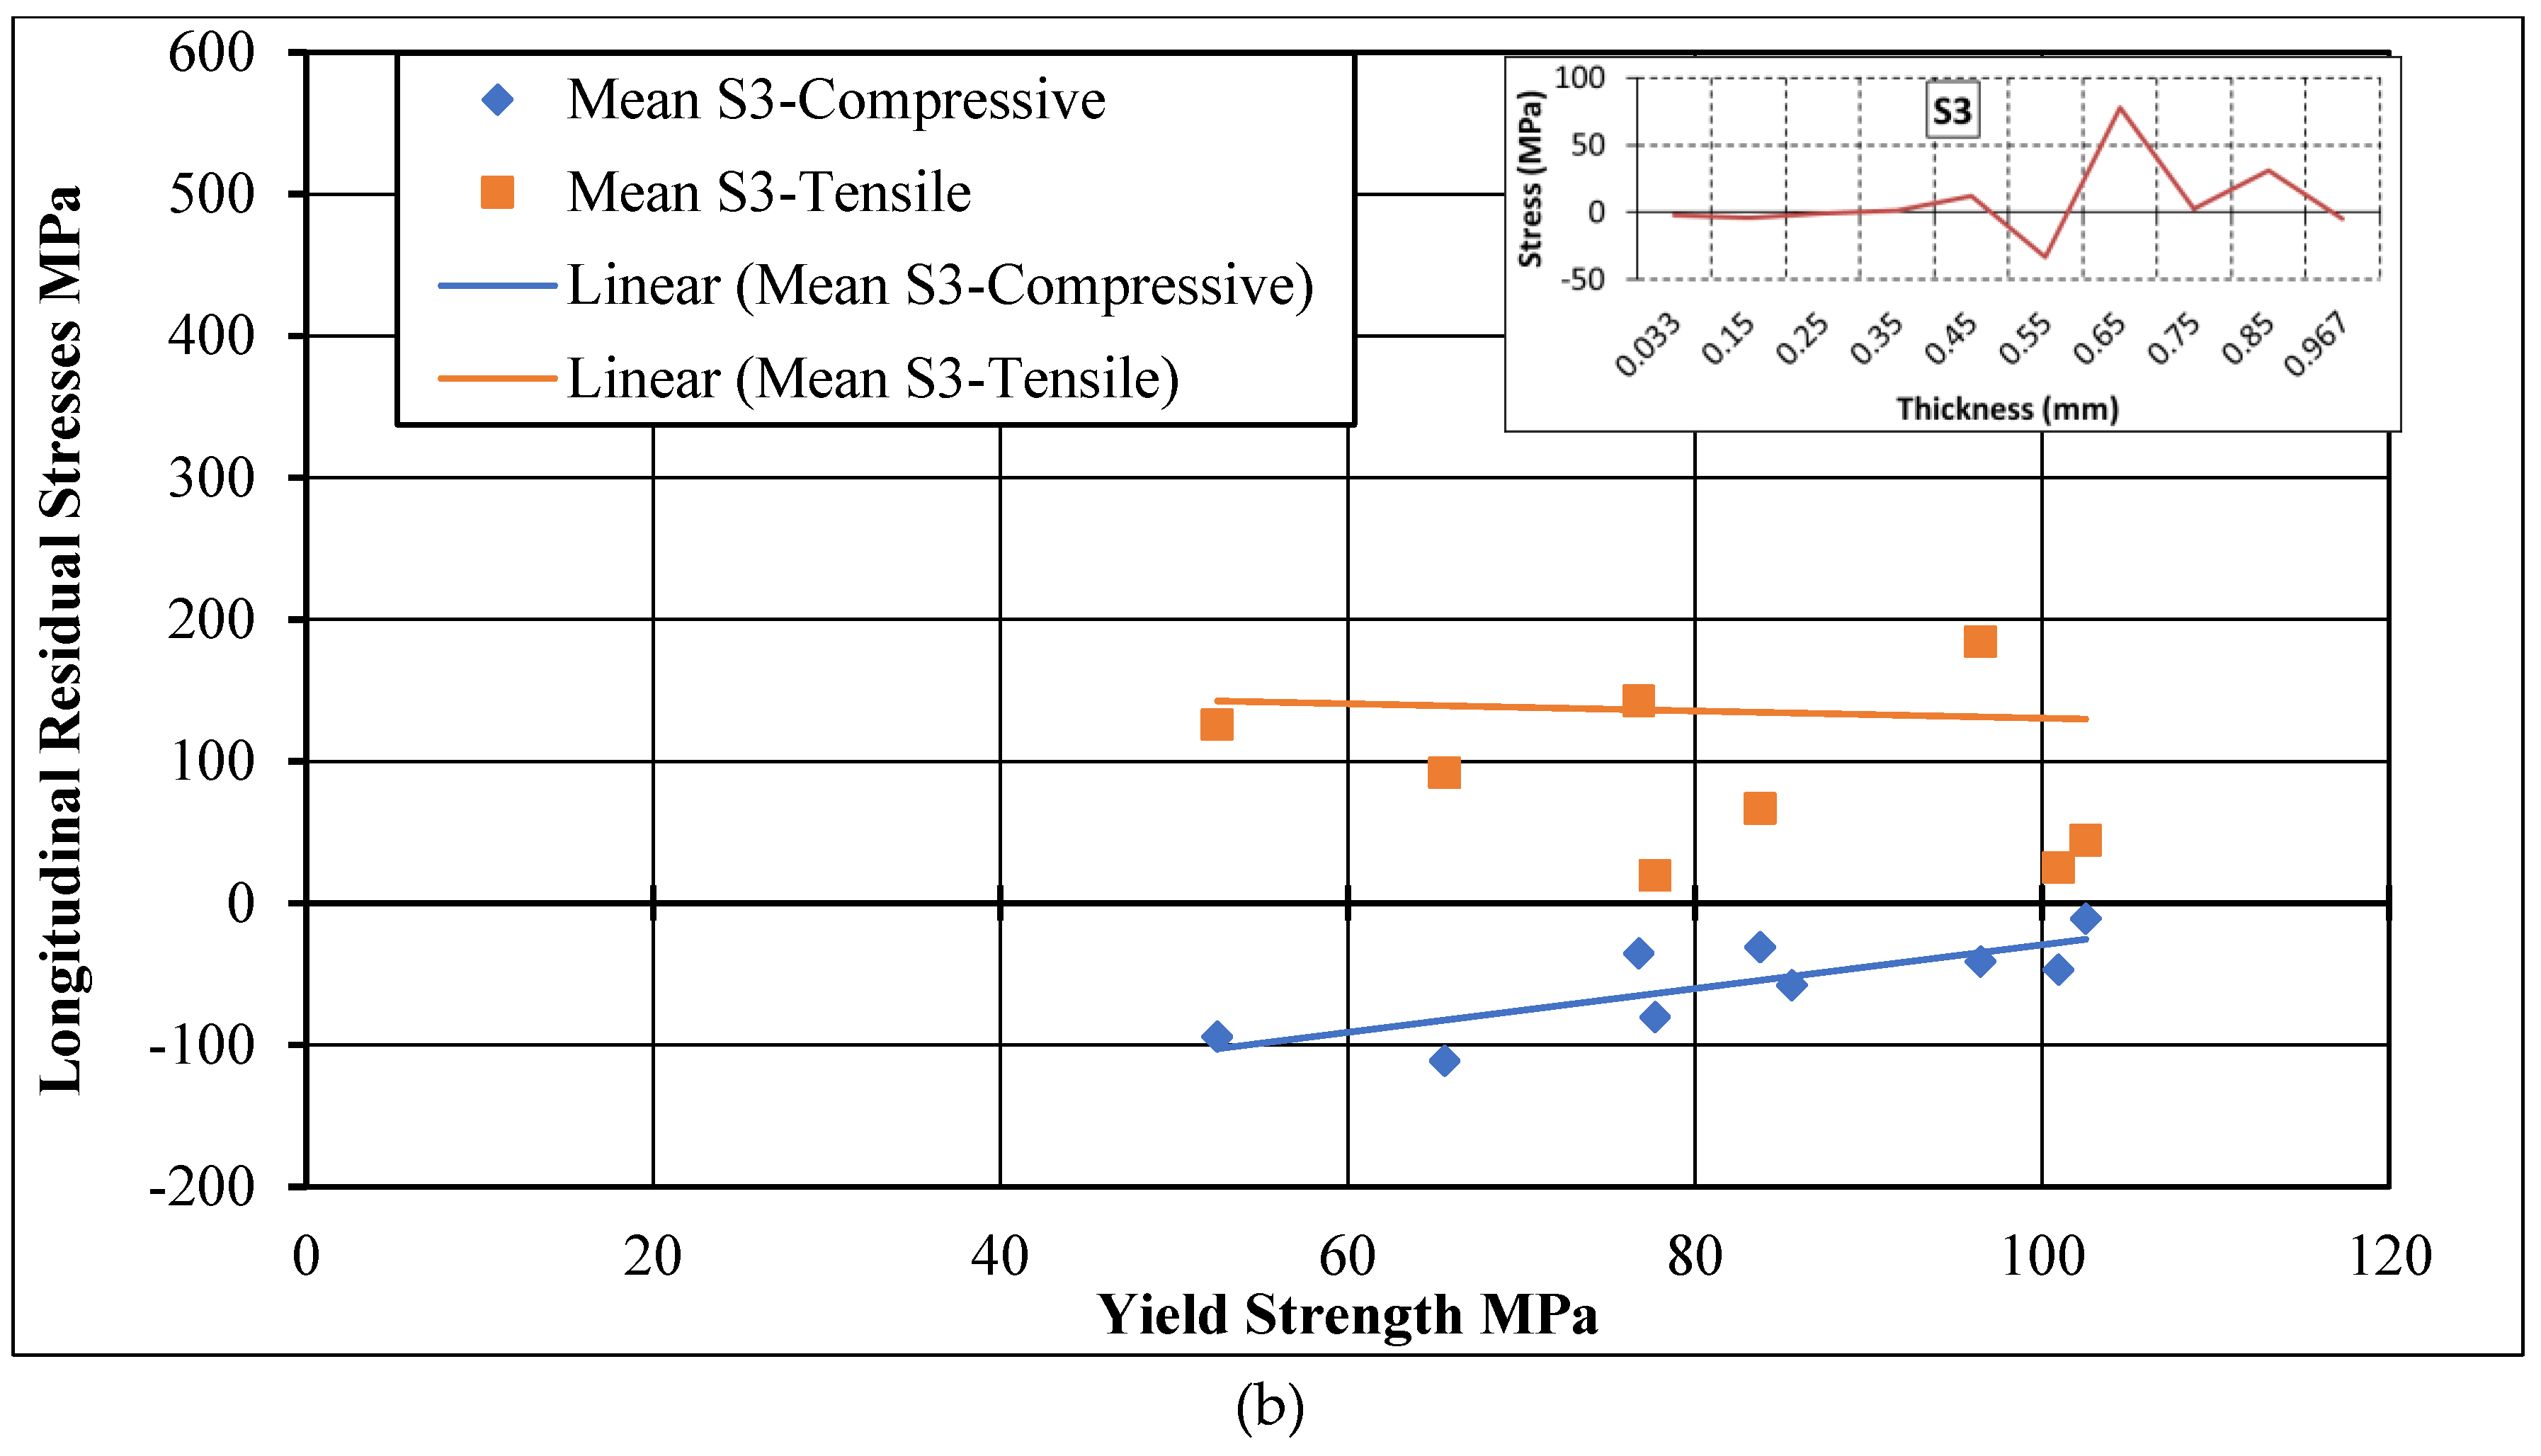
3.4. Correlation between Residual Stresses and Tensile Strengths

Figure 14 shows a plot of the residual stresses as a function of the yield strength. The insets of Figure 14a,b show typical through the thickness residual stresses along the S1 and S3 directions, respectively. From these through the thickness stresses, largest positive (tensile) and smallest negative (compressive) values of stresses from each test are retrieved for further analysis. It can be seen from Figure 14a that a consistent relationship does not exist between the transverse residual stresses (S1-Tensile and S1-Compressive) and the yield strength. Similarly, Figure 14b shows that no consistent relationship exists between the S3-Tensile residual stresses and the yield strength. On the other hand, as presented in Figure 14b, only the compressive residual stresses (S3-Compressive) along the tool travel direction form a fairly consistent relationship with the yield strength, thereby revealing that the yield strength increases as the compressive stresses increase. This is logical because the compressive stresses inhibit voids opening/formation [2]. Corelating this finding with the parameter–strength correlations presented in Figure 13, this can be easily claimed that the change in parameters affected the compressive residual stresses whose effect in turn appeared on the post forming strengths.

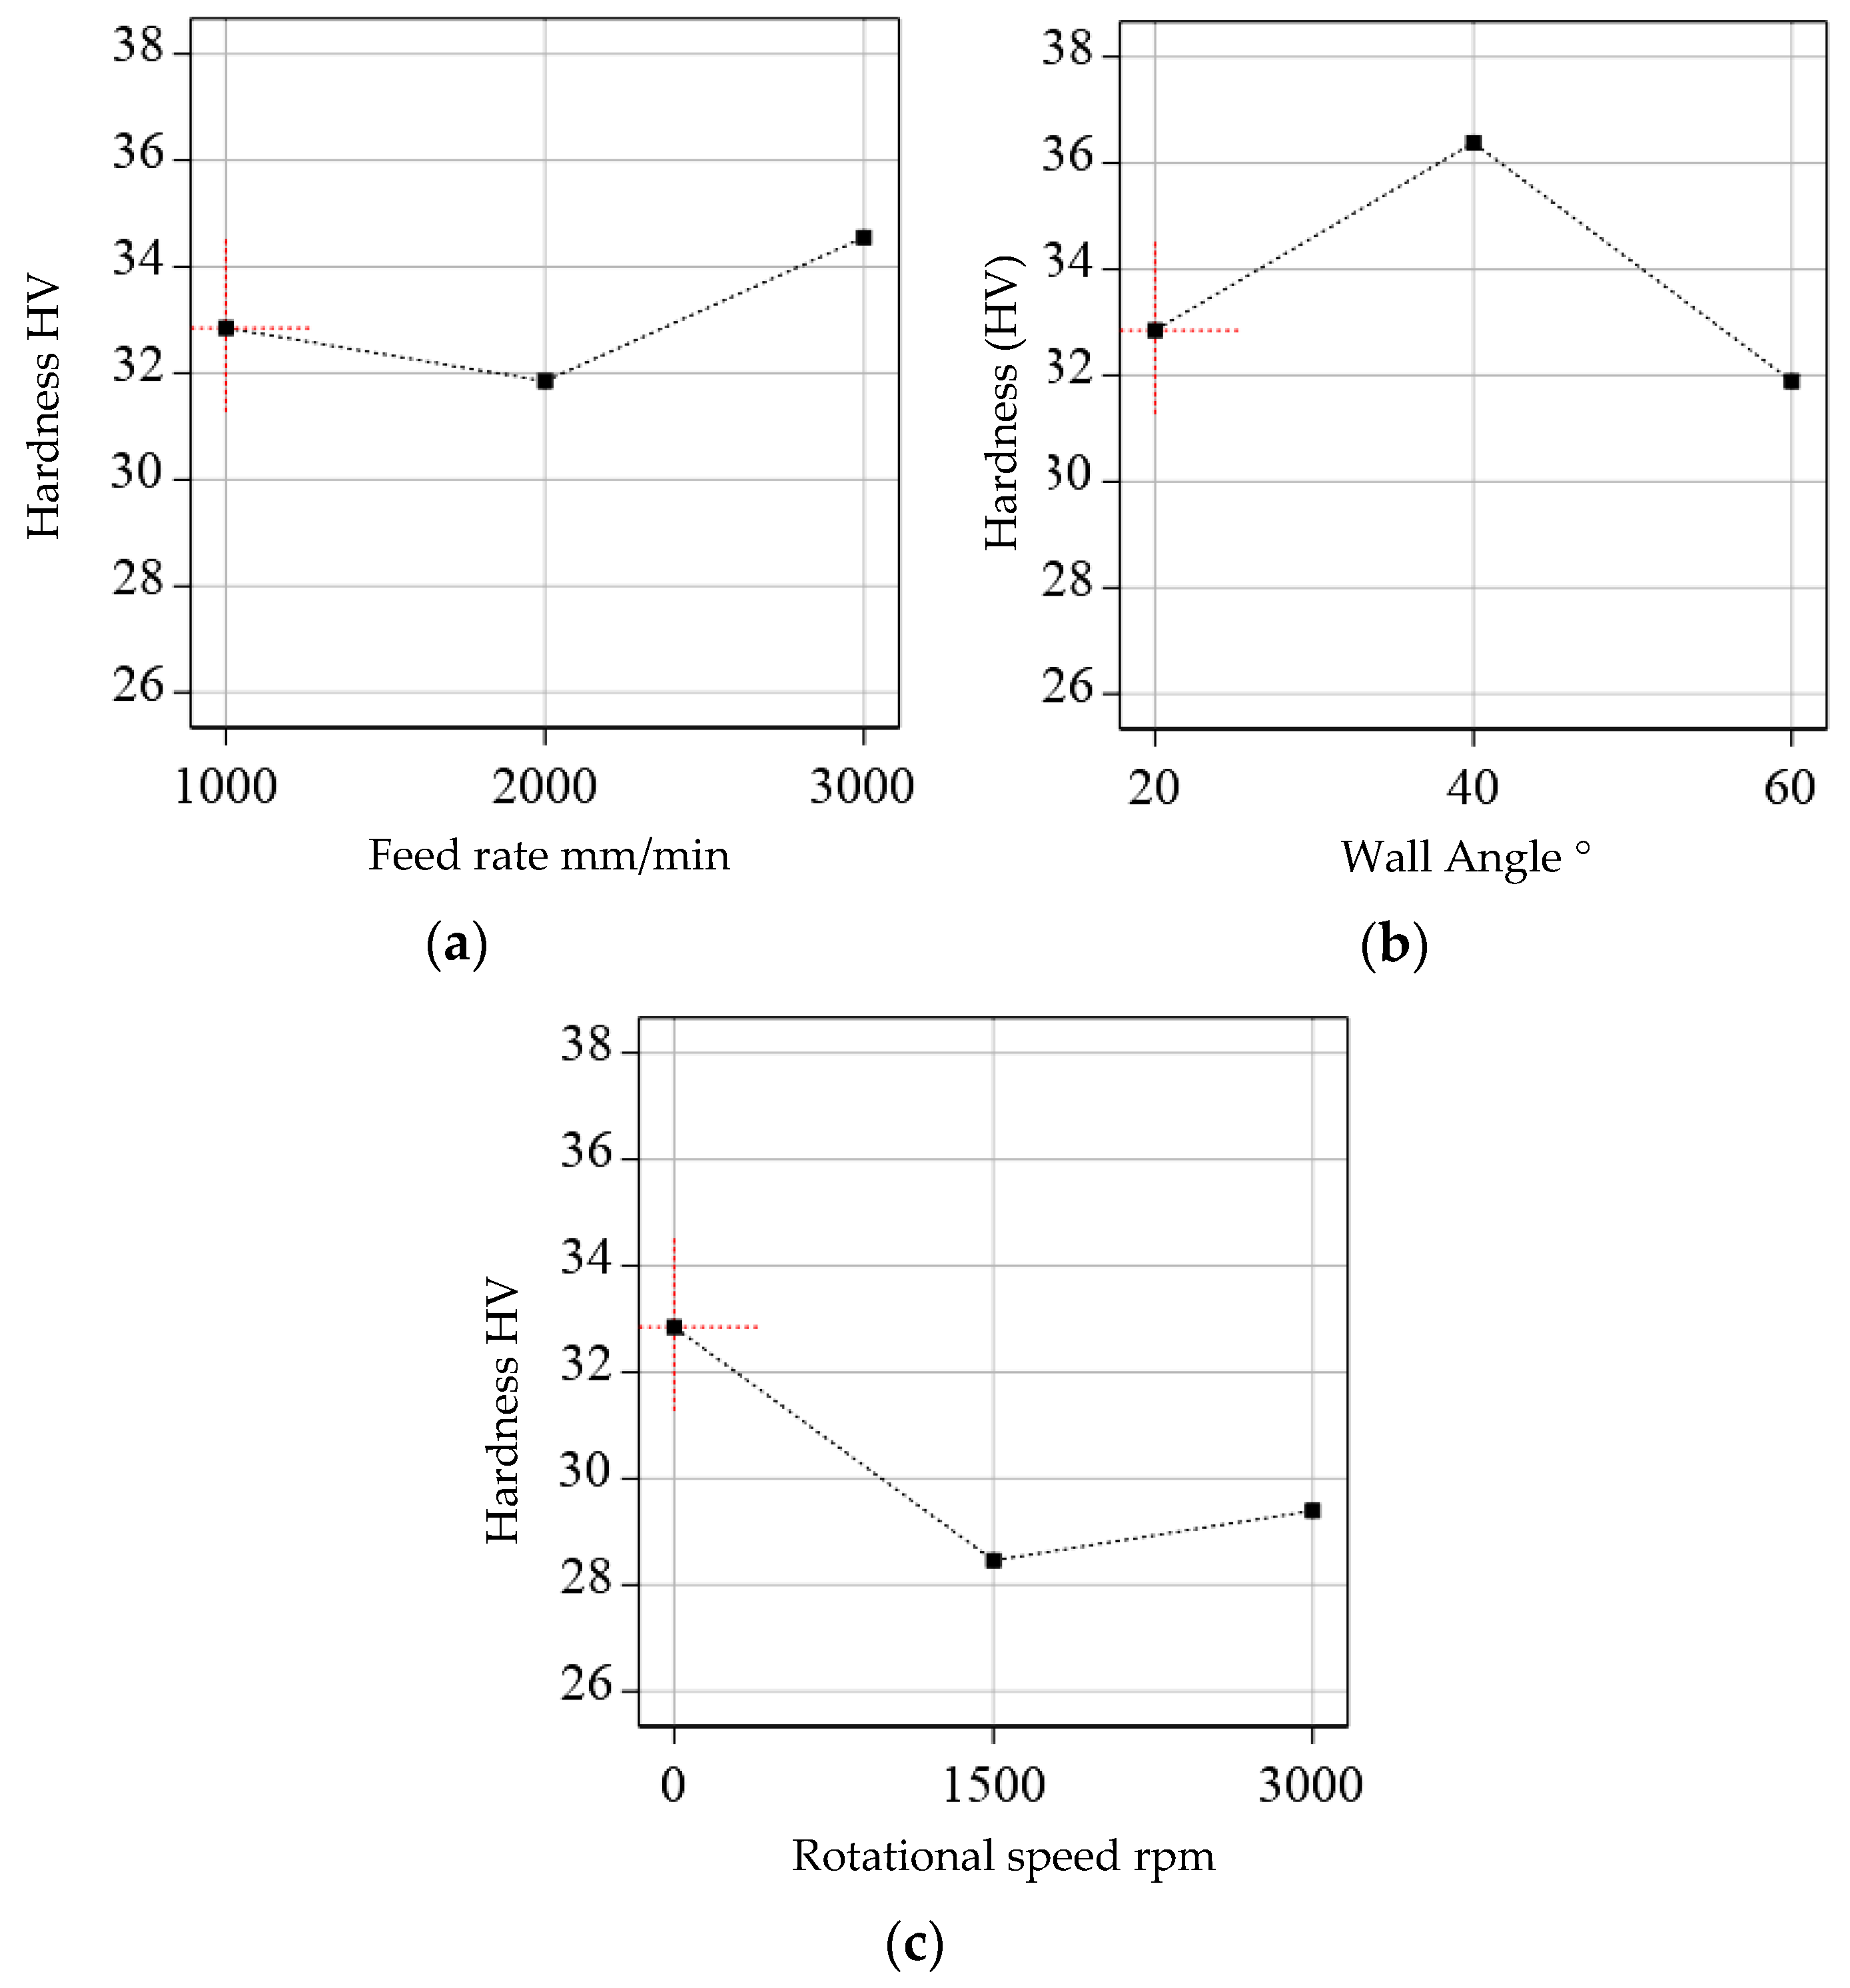
3.5. Correlation between Hardness and Process Parameters

It is seen, in Figure 15a, that the hardness attains the maximum value when the feed rate is at its maximum (i.e., 3000 mm/min). Figure 15a further highlights that a descent in the hardness takes place when the feed rate is increased from 1000 to 2000 mm/min. The hardness value recovers when the feed rate is further increased to 3000 mm/min. It is noted that the initial dip in the hardness due to the increase in feed rate, from 1000 to 2000 mm/min, is smaller as compared with the reprise due to further increase in the feed rate to 3000 mm/min. Moreover, it is observed in Figure 15b that an increase in the wall angle from 20° to 40° causes the hardness to increase, but a further increase in the wall angle to 60° results in a decrease in the hardness. Figure 15c shows the hardness plotted as a function of the rotational speed (ω) The hardness value initially declines as the ω increases to 1500 rpm. However, the same increases when the ω is further increased to 3000 rpm. The decline in the hardness is more pronounced, for the initial increase in ω from 0 to 1500 rpm, as compared with the rerise of hardness as the ω is further increased from 1500 to 3000 rpm. It is further noticed that the effect of feed rate is not that pronounced as hardness values tend to stay low irrespective of the change in this process parameter. The highest value of hardness is observed, in this study, when the spindle is stationary, the wall angle is 40° and feed rate is 3000 mm/min.
Compared with the parent sheet, the formed sheet receives a 60.64% gain in the hardness, agreeing with the yield strength results discussed earlier. This means that the novel ISF process can substantially enhance the hardness of the components, which is often desirable to resist the surface wear of the components.
Hardness as a function of surface residual stresses is plotted in Figure 16. It is noticed that the compressive stresses enhance the hardness. This is true for both types of surface residual stresses either along longitudinal/feed (S3) or transverse direction (S1). This finding is consistent with [2] as the compressive residual stresses impede crack coalescence which in turn is manifested as a harder surface. The micro hardness increases from 28 to 34 when the surface longitudinal residual stress transitions from 86 MPa (tensile) to −108 MPa (compressive). Similarly, as the surface transverse residual stress evolves from 141 to −144 MPa, the hardness rises from 28 to 34.

4. Conclusions

This study has focused on the processing of the commercial aluminum sheets through the SPIF. The post‑forming tensile properties, microhardness and residual stresses have been measured. The key findings of this study are summarized as follows:
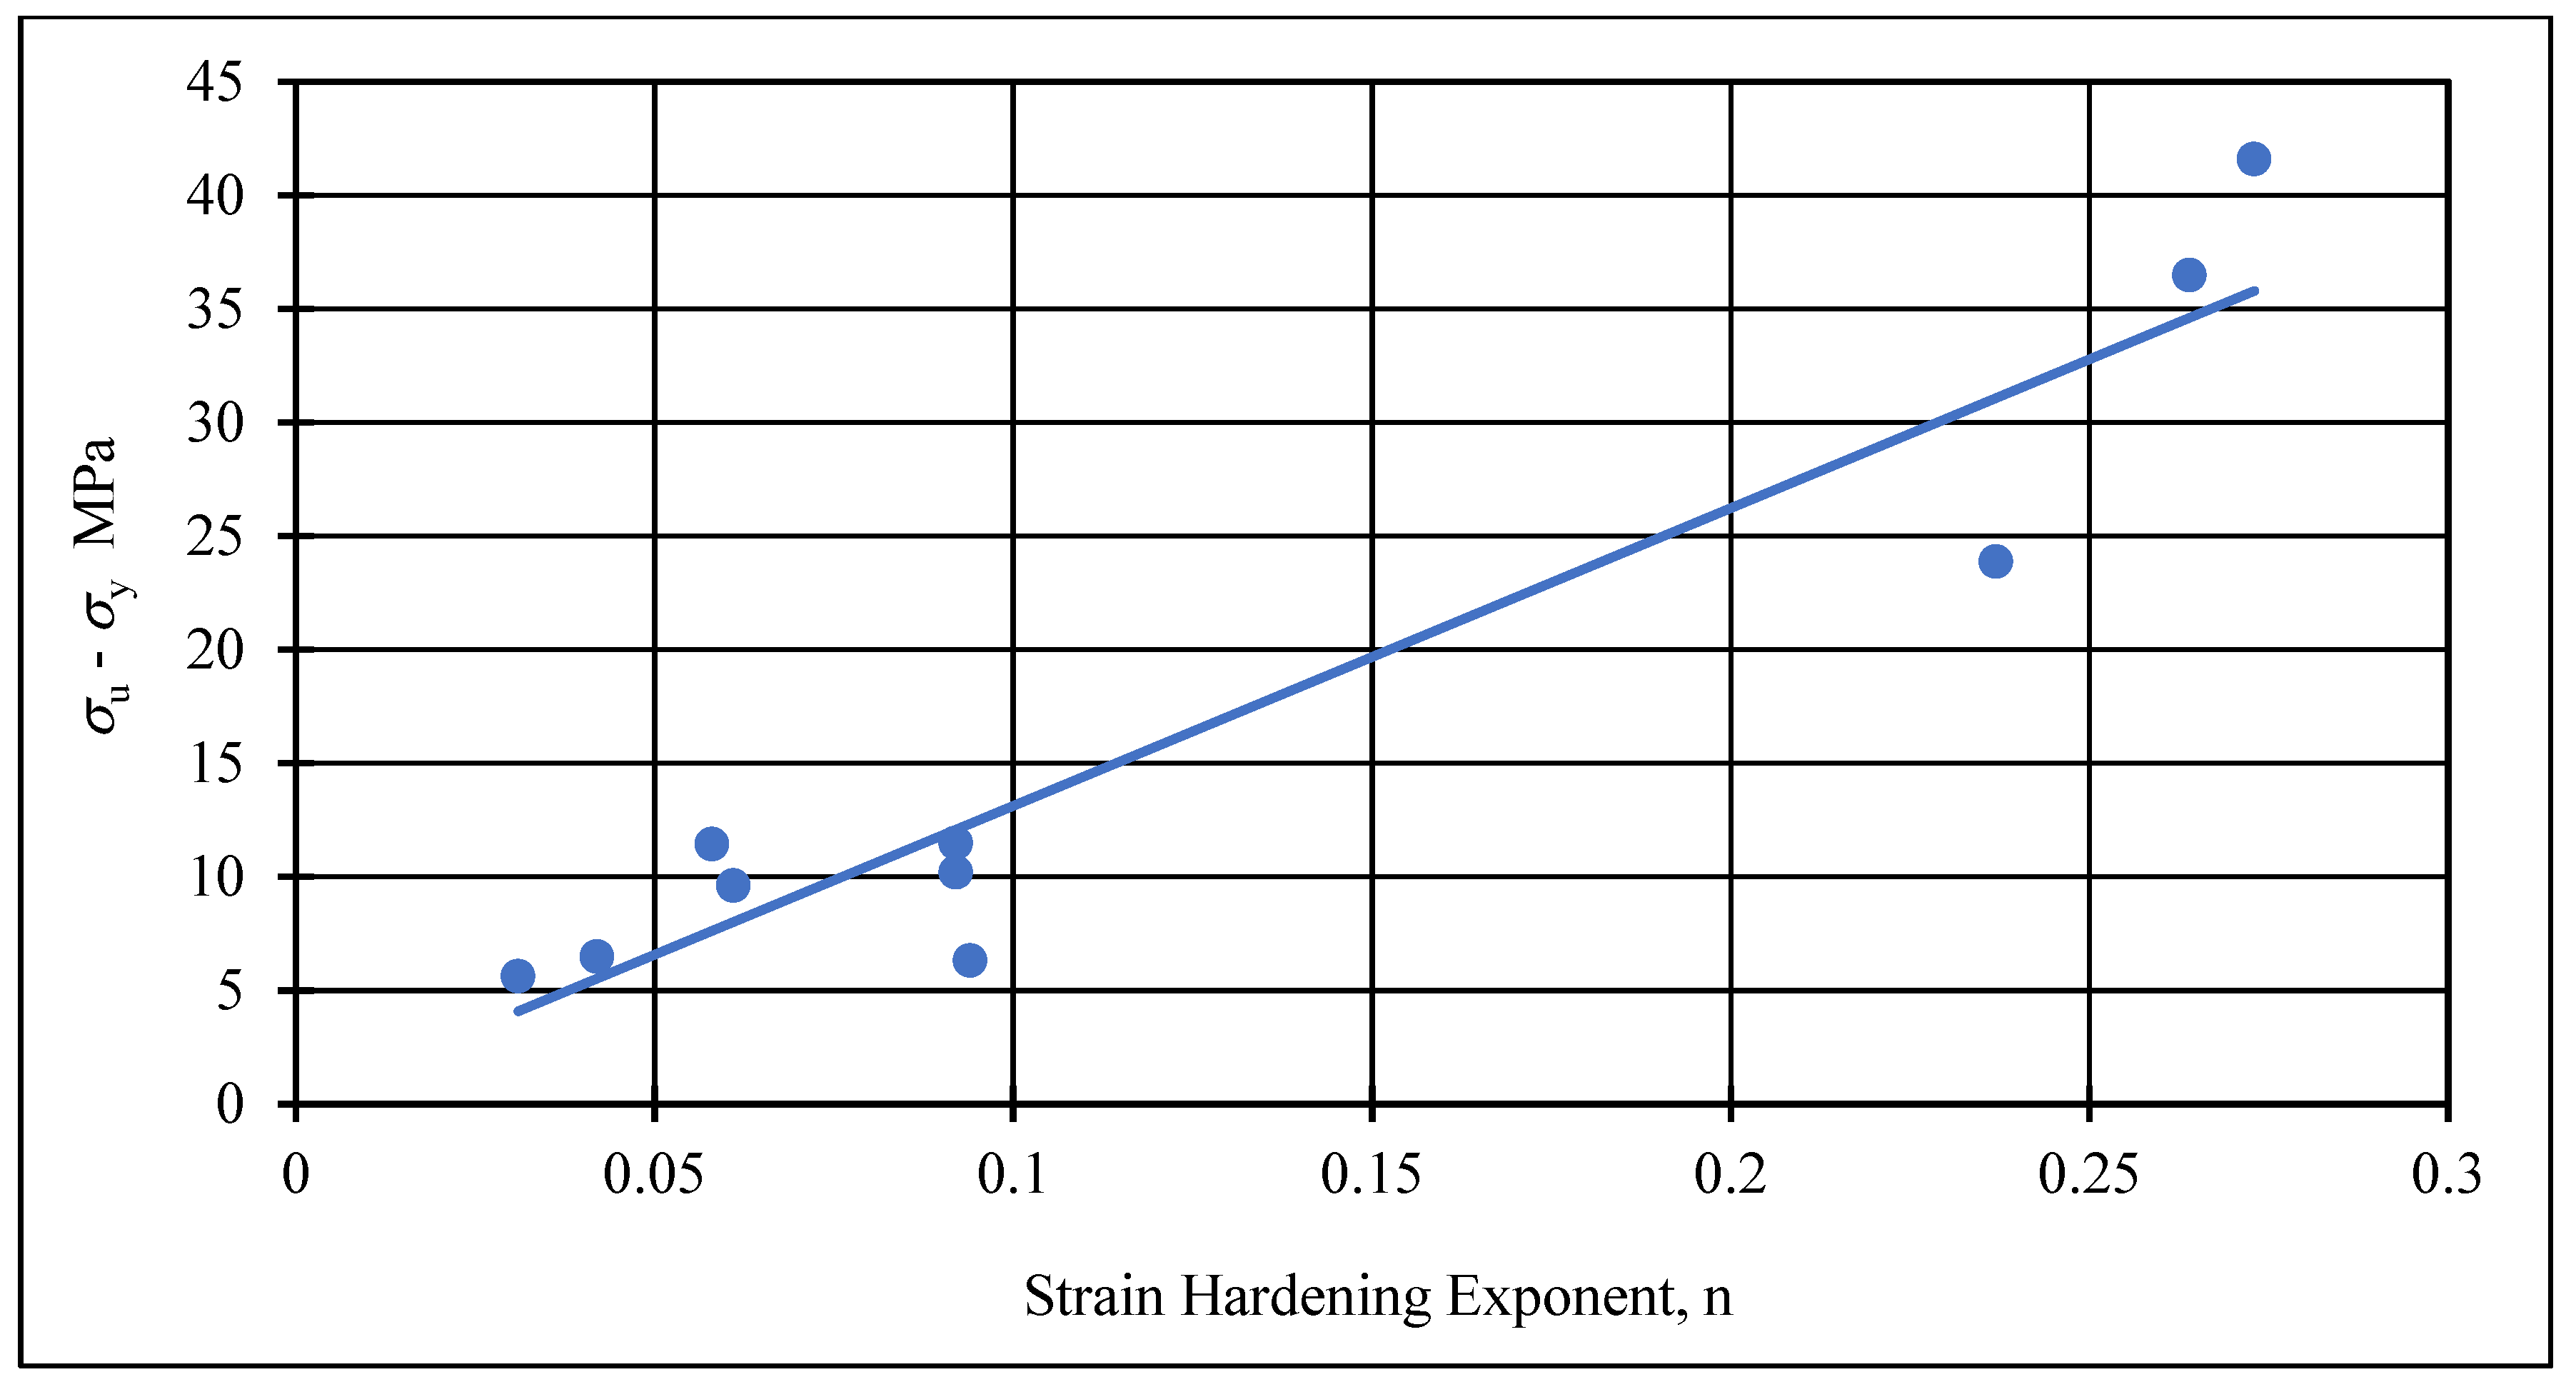
  • The plot of difference between strengths (i.e., σuσy) vs. strain-hardening exponent shows a direct linear relationship. This information provides a useful insight towards the brittle or ductile failure of a formed part. Moreover, the increase in the compressive residual stresses along the tool travel direction is favorable for maximizing the yield strength.
  • The post-ISF yield strength of all deformed parts has come out to be more than the undeformed annealed sheet. This gain in the yield strength is attributed to the amount of cold work done which increases the yield strength. The maximum gain of 102.37% is exhibited by Test 7 due to a higher wall angle accompanied by a higher feed rate.
  • It is recommended to perform annealing prior to the SPIF, to obtain ductile parts, as the lowest ductility is exhibited by the part formed from the rolled sheet. When forming is carried out at the same process parameters, the annealing process tends to double the ductility of the formed parts. This is accompanied by the reduction of 21.44% and 24.33% in the σy and σu respectively.
  • Taguchi analysis shows that the ultimate and the yield strengths generally increase with higher wall angles and smaller tool diameters. It is recommended to form the parts at 40° wall angle with a tool diameter of 6 mm to obtain stronger parts.
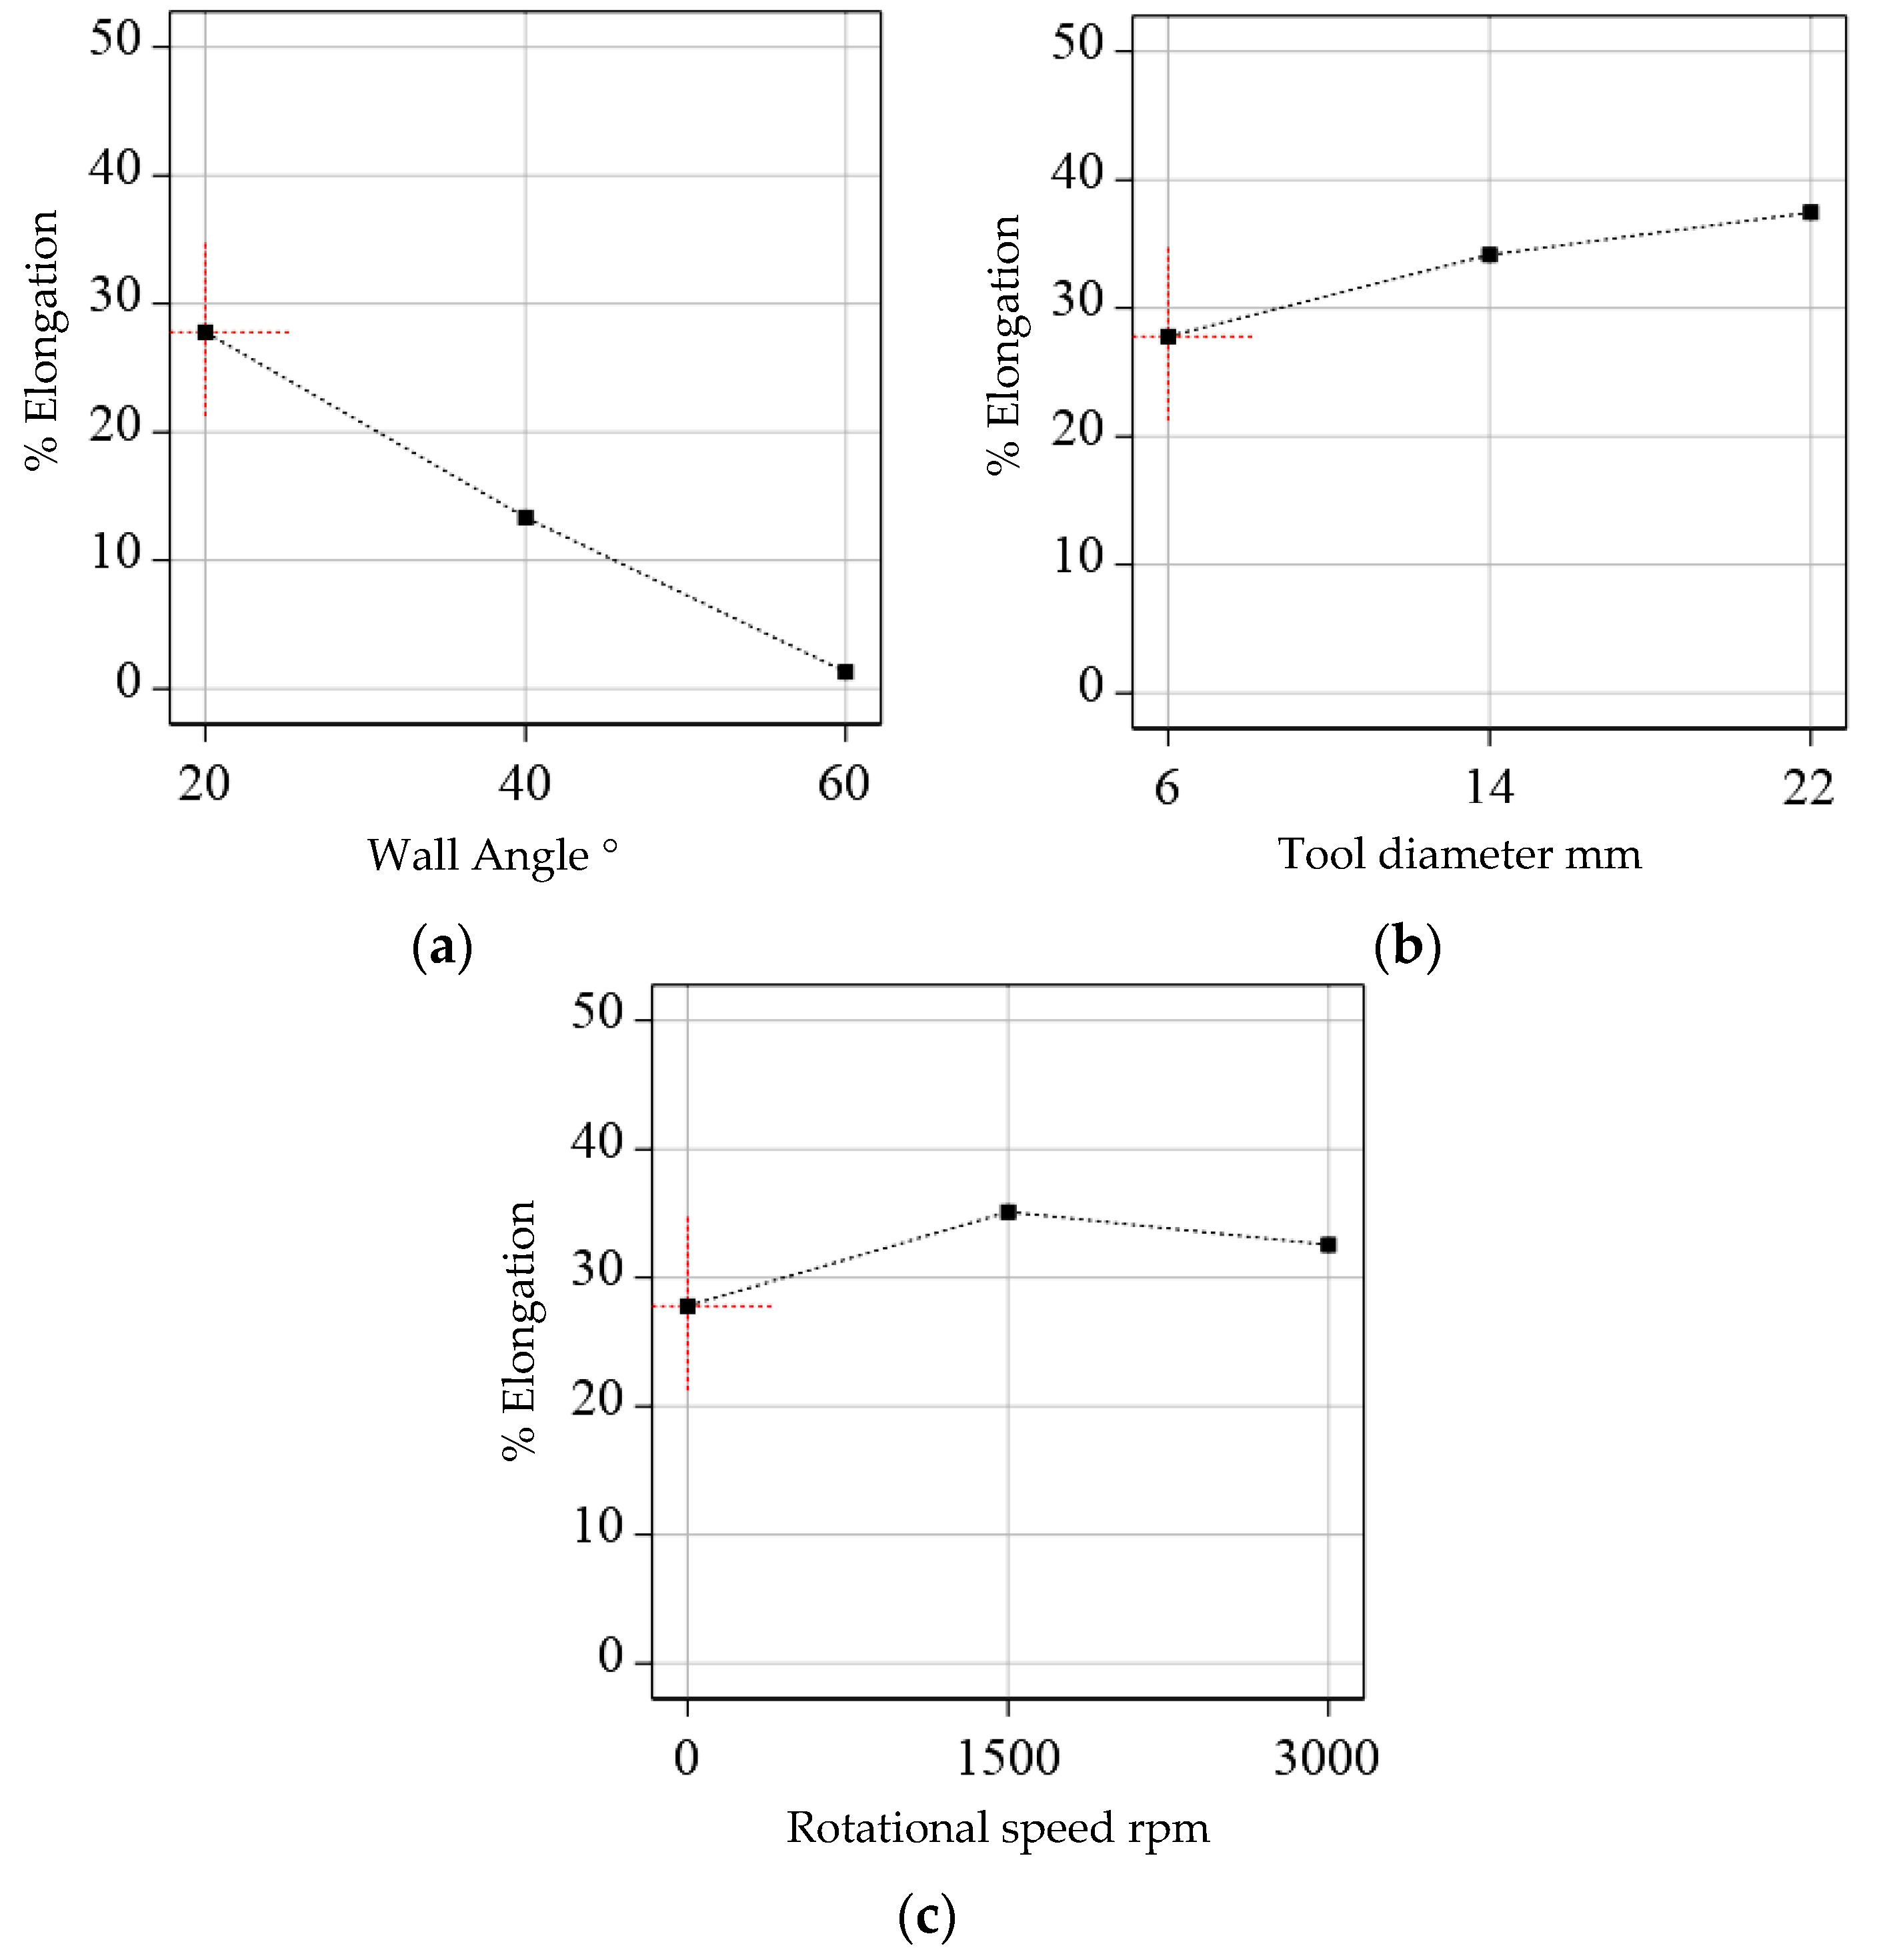
  • Ductility shows a direct relationship with the tool diameter and an inverse relationship with the wall angle. Therefore, to obtain higher ductility, it is recommended to conduct forming at ω = 1500 rpm, d = 22 mm and θ = 20°. The optimum parameters identified herein pertain to the L9 Taguchi set of parameters instead of the full factorial design containing 81 tests.
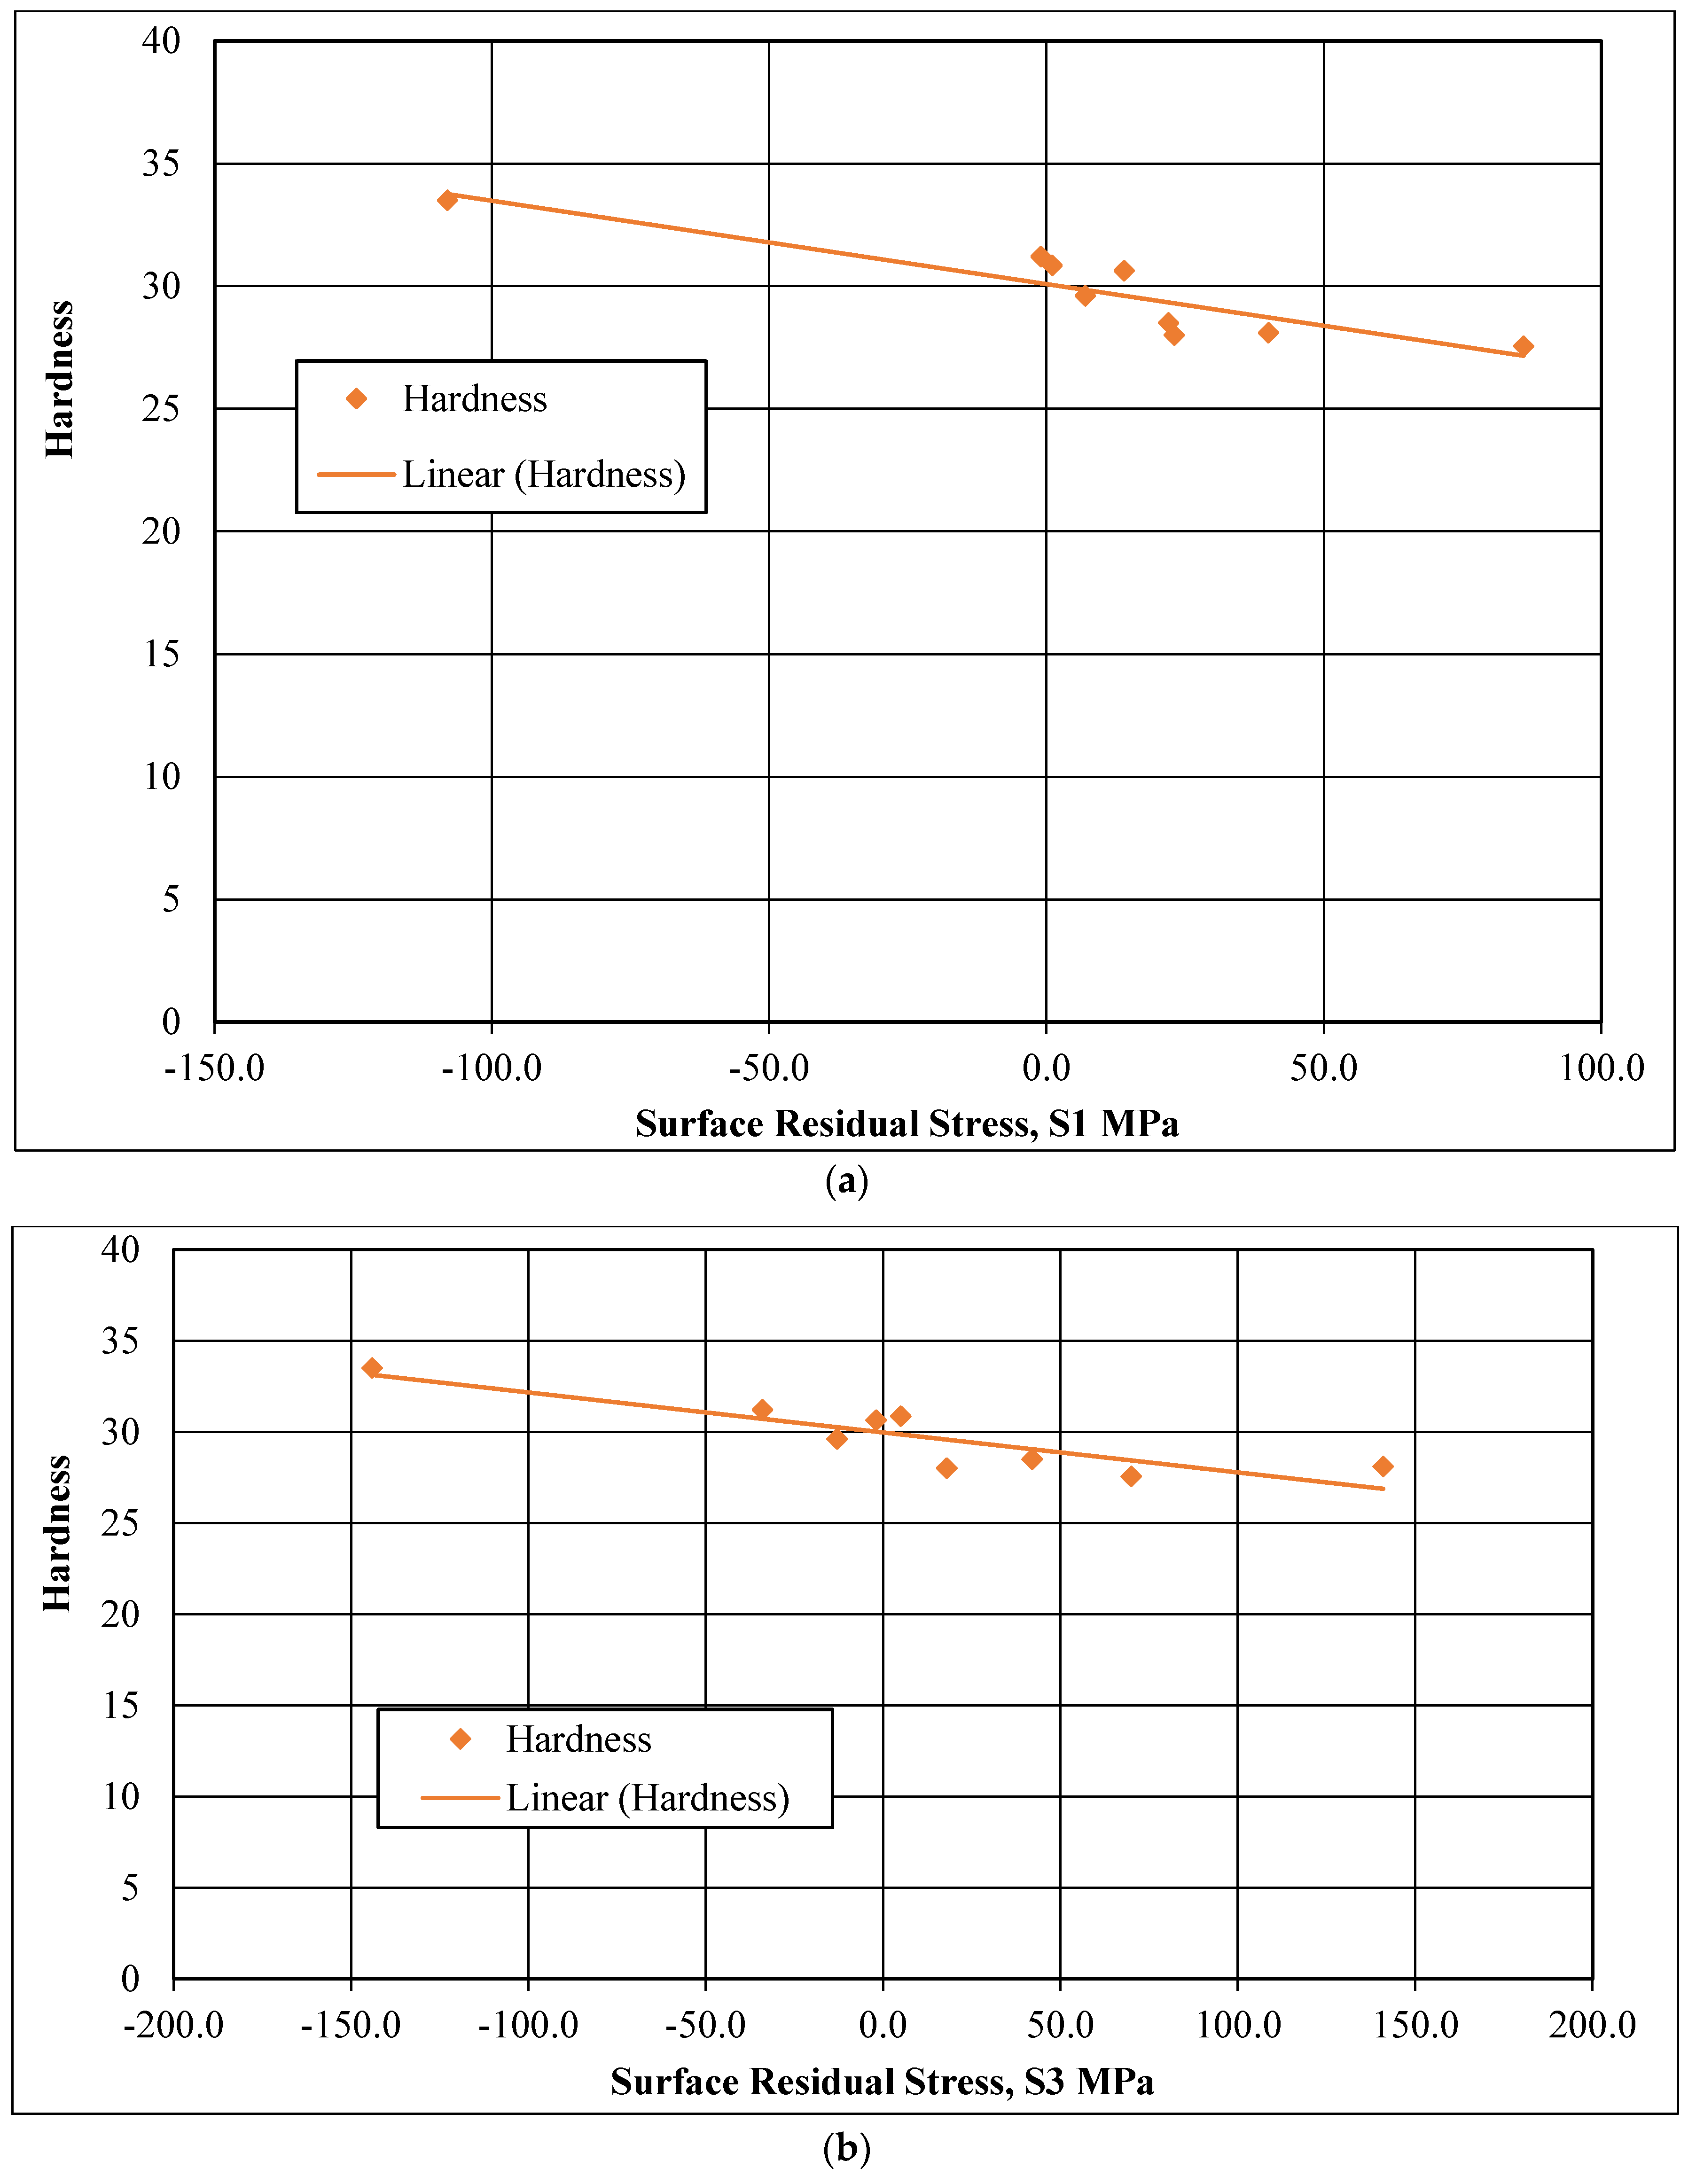
  • The general dependence of hardness on surface compressive residual stresses is also observed. As compressive residual stresses increase, hardness increases and vice versa. The main factors affecting hardness are the rotational speed, the wall angle and the feed rate. From the point of view of hardness, the best-suited parameters are ω = 0, θ = 40° and 𝑓 = 3000 (mm/min).

Author Contributions

Conceptualization, M.I. and G.H.; methodology, M.I. and H.R.; software, G.H. and H.R.; formal analysis, M.I. and G.H.; investigation, G.H. and M.I; resources, M.A. and G.H.; data curation, G.H. and H.R.; writing—original draft preparation, M.I.; writing—review and editing, G.H. and M.I.; visualization, M.I.; supervision, M.I. and G.H.; project administration, G.H. and M.A.; funding acquisition, M.I., M.A. and G.H. All authors have read and agreed to the published version of the manuscript.

Funding

This work was supported by Researchers Supporting Project Number (RSP-2020/274), King Saud University, Riyadh, Saudi Arabia.

Acknowledgments

The authors are thankful to the GIK Institute for providing technical and financial assistance. Also, this work was supported by Researchers Supporting Project Number (RSP-2020/274), King Saud University, Riyadh, Saudi Arabia.

Conflicts of Interest

The authors declare no conflict of interest.

References

  1. Marciniak, Z.; Duncan, J.L.; Hu, S.J. Mechanics of Sheet Metal Forming; Referex Engineering; Butterworth-Heinemann: Oxford, UK, 2002; ISBN 978-0-7506-5300-8. [Google Scholar]
  2. Hosford, W.F.; Caddell, R.M. Metal Forming: Mechanics and Metallurgy; Cambridge University Press: Cambridge, UK, 2011. [Google Scholar]
  3. Serajzadeh, S.; Mohammadzadeh, M. Effects of deformation parameters on the final microstructure and mechanical properties in warm rolling of a low-carbon steel. Int. J. Adv. Manuf. Technol. 2007, 34, 262–269. [Google Scholar] [CrossRef]
  4. Zhao, Y.; Song, B.; Pei, J.; Jia, C.; Li, B.; Linlin, G. Effect of deformation speed on the microstructure and mechanical properties of AA6063 during continuous extrusion process. J. Mater. Process. Technol. 2013, 213, 1855–1863. [Google Scholar] [CrossRef]
  5. Balogun, S.A.; Esezobor, D.E.; Adeosun, S.O. Effects of Deformation Processing on the Mechanical Properties of Aluminum Alloy 6063. Metall. Mater. Trans. A 2007, 38, 1570–1574. [Google Scholar] [CrossRef]
  6. Nwachukwu, P.U.; Oluwole, O.O. Effects of rolling process parameters on the mechanical properties of hot-rolled St60Mn steel. Case Stud. Constr. Mater. 2017, 6, 134–146. [Google Scholar] [CrossRef]
  7. Ucuncuoglu, S.; Ekerim, A.; Secgin, G.O.; Duygulu, O. Effect of asymmetric rolling process on the microstructure, mechanical properties and texture of AZ31 magnesium alloys sheets produced by twin roll casting technique. J. Magnes. Alloy 2014, 2, 92–98. [Google Scholar] [CrossRef] [Green Version]
  8. Zheng, L.; Nie, H.; Liang, W.; Wang, H.; Wang, Y. Effect of pre-homogenizing treatment on microstructure and mechanical properties of hot-rolled AZ91 magnesium alloys. J. Magnes. Alloy 2016, 4, 115–122. [Google Scholar] [CrossRef] [Green Version]
  9. Xu, J.; Wang, X.; Shirooyeh, M.; Xing, G.; Shan, D.; Guo, B.; Langdon, T.G. Microhardness, microstructure and tensile behavior of an AZ31 magnesium alloy processed by high-pressure torsion. J. Mater. Sci. 2015, 50, 7424–7436. [Google Scholar] [CrossRef]
  10. Neves, F.O.; Braga, D.U.; Silva, A.S.C. da Study of Residual Stresses on Cold-Forming Metals Using Stress Corrosion. Mater. Manuf. Process. 2015, 30, 1278–1282. [Google Scholar] [CrossRef]
  11. Duflou, J.R.; Habraken, A.-M.; Cao, J.; Malhotra, R.; Bambach, M.; Adams, D.; Vanhove, H.; Mohammadi, A.; Jeswiet, J. Single point incremental forming: State-of-the-art and prospects. Int. J. Mater. Form. 2018, 11, 743–773. [Google Scholar] [CrossRef]
  12. Filice, L.; Fratini, L.; Micari, F. Analysis of Material Formability in Incremental Forming. CIRP Ann. 2002, 51, 199–202. [Google Scholar] [CrossRef]
  13. Silva, M.; Skjoedt, M.; Atkins, A.; Bay, N.; Martins, P. Single-point incremental forming and formability–failure diagrams. J. Strain. Anal. Eng. 2008, 43, 15–35. [Google Scholar] [CrossRef]
  14. Jeswiet, J.; Micari, F.; Hirt, G.; Bramley, A.; Duflou, J.; Allwood, J. Asymmetric Single Point Incremental Forming of Sheet Metal. CIRP Ann. Manuf. Technol. 2005, 54, 88–114. [Google Scholar] [CrossRef]
  15. Silva, M.B.; Skjoedt, M.; Martins, P.A.F.; Bay, N. Revisiting the fundamentals of single point incremental forming by means of membrane analysis. Int. J. Mach. Tool. Manuf. 2008, 48, 73–83. [Google Scholar] [CrossRef]
  16. Al-Ghamdi, K.A.; Hussain, G. Threshold tool-radius condition maximizing the formability in SPIF considering a variety of materials: Experimental and FE investigations. Int. J. Mach. Tool. Manuf. 2015, 88, 82–94. [Google Scholar] [CrossRef]
  17. Sy, L.V.; Nam, N.T. Effect of strain rate and temperature on formability of warm-incremental forming process with magnesium alloy sheet AZ31. J. Manuf. Technol. Res. 2014, 6, 17. [Google Scholar]
  18. Echrif, S.B.M.; Hrairi, M. Research and Progress in Incremental Sheet Forming Processes. Mater. Manuf. Process. 2011, 26, 1404–1414. [Google Scholar] [CrossRef]
  19. Ham, M.; Jeswiet, J. Forming Limit Curves in Single Point Incremental Forming. CIRP Ann. Manuf. Technol. 2007, 56, 277–280. [Google Scholar] [CrossRef]
  20. Park, J.-J.; Kim, Y.-H. Fundamental studies on the incremental sheet metal forming technique. J. Mater. Process. Technol. 2003, 140, 447–453. [Google Scholar] [CrossRef]
  21. Jeswiet, J.; Hagan, E.; Szekeres, A. Forming parameters for incremental forming of aluminium alloy sheet metal. Proc. Inst. Mech. Eng. B J. Eng. Manuf. 2002, 216, 1367–1371. [Google Scholar] [CrossRef]
  22. Hussain, G.; Ilyas, M.; Lemopi Isidore, B.B.; Khan, W.A. Mechanical properties and microstructure evolution in incremental forming of AA5754 and AA6061 aluminum alloys. Trans. Nonferrous Met. Soc. 2020, 30, 51–64. [Google Scholar] [CrossRef]
  23. Davarpanah, M.A.; Bansal, S.; Malhotra, R. Influence of Single Point Incremental Forming on Mechanical Properties and Chain Orientation in Thermoplastic Polymers. J. Manuf. Sci. Eng. 2017, 139, 021012. [Google Scholar] [CrossRef]
  24. López, C.; Elías-Zúñiga, A.; Jiménez, I.; Martínez-Romero, O.; Siller, H.R.; Diabb, J.M. Experimental Determination of Residual Stresses Generated by Single Point Incremental Forming of AlSi10Mg Sheets Produced Using SLM Additive Manufacturing Process. Materials 2018, 11, 2542. [Google Scholar] [CrossRef] [Green Version]
  25. Radu, C.; Herghelegiu, E.; Tampu, C.; Cristea, I. The Residual Stress State Generated by Single Point Incremental Forming of Aluminum Metal Sheets. Appl. Mech. Mater. 2013, 371, 148–152. [Google Scholar] [CrossRef]
  26. Maaß, F.; Hahn, M.; Tekkaya, A.E. Interaction of Process. Parameters, Forming Mechanisms, and Residual Stresses in Single Point Incremental Forming. Metals 2020, 10, 656. [Google Scholar] [CrossRef]
  27. Wei, H.; Hussain, G. Mechanical Characteristics of a Roll-Bonded Cu-Clad Steel Sheet Processed Through Incremental Forming. Metall. Mat. Trans. A 2019, 50, 4594–4607. [Google Scholar] [CrossRef]
  28. Roy, R.K. A Primer on the Taguchi Method, 2nd ed.; Society of Manufacturing Engineers: Dearborn, MI, USA, 2010; ISBN 978-0-87263-864-8. [Google Scholar]
  29. ASTM-B479-19. In Specification for Annealed Aluminum and Aluminum-Alloy Foil for Flexible Barrier, Food Contact, and Other Applications; ASTM International: West Conshohocken, PA, USA, 2006.
  30. ASTM-E837-13a. In Test Method for Determining Residual Stresses by the Hole-Drilling Strain-Gage Method; ASTM International: West Conshohocken, PA, USA, 2013.
  31. Schajer, G.S.; Abraham, C. Residual Stress Measurements in Finite-Thickness Materials by Hole-Drilling. In Experimental and Applied Mechanics, Volume 6; Sottos, N., Rowlands, R., Dannemann, K., Eds.; Conference Proceedings of the Society for Experimental Mechanics Series; Springer International Publishing: Cham, Switzerland, 2015; pp. 89–97. ISBN 978-3-319-06988-3. [Google Scholar]
  32. ASTM-E8-16a. In Test Methods for Tension Testing of Metallic Materials; ASTM International: West Conshohocken, PA, USA, 2016.
  33. ASTM-E92-17. In Test Methods for Vickers Hardness and Knoop Hardness of Metallic Materials; ASTM International: West Conshohocken, PA, USA, 2017.
  34. ASTM-E646-16. In Test Method for Tensile Strain-Hardening Exponents (n-Values) of Metallic Sheet Materials; ASTM International: West Conshohocken, PA, USA, 2014.
  35. Hirt, G.; Ames, J.; Bambach, M.; Kopp, R.; Kopp, R. Forming strategies and Process. Modelling for CNC Incremental Sheet Forming. CIRP Ann. Manuf. Technol. 2004, 53, 203–206. [Google Scholar] [CrossRef]
  36. Al-Ghamdi, K.A.; Hussain, G. On the Free-Surface Roughness in Incremental Forming of a Sheet Metal: A Study from the Perspective of ISF Strain, Surface Morphology, Post-Forming Properties, and Process. Conditions. Metals 2019, 9, 553. [Google Scholar] [CrossRef] [Green Version]
  37. Lu, B.; Fang, Y.; Xu, D.K.; Chen, J.; Ou, H.; Moser, N.H.; Cao, J. Mechanism investigation of friction-related effects in single point incremental forming using a developed oblique roller-ball tool. Int. J. Mach. Tool. Manuf. 2014, 85, 14–29. [Google Scholar] [CrossRef]
  38. Shrivastava, P.; Tandon, P. Microstructure and texture based analysis of forming behavior and deformation mechanism of AA1050 sheet during Single Point Incremental Forming. J. Mater. Process. Technol. 2019, 266, 292–310. [Google Scholar] [CrossRef]
Figure 1. Schematic showing the process variables.
Metals 10 01461 g001
Figure 2. Experimental setup demonstrating details of specimen clamping.
Metals 10 01461 g002
Figure 3. Hemispherical head high-speed steel (HSS) tools.
Metals 10 01461 g003
Figure 4. Pyramid frusta produced via the SPIF.
Metals 10 01461 g004
Figure 5. Formed test part with rosettes attached, inset shows the expanded view of rosette along with stress directions.
Metals 10 01461 g005
Figure 6. Micro-hardness (HV) variation along the length in Test 8.
Metals 10 01461 g006
Figure 7. Stress–strain curves: (a) engineering stress–strain curve and (b) true stress–strain curve.
Metals 10 01461 g007
Figure 8. Bar chart of mechanical properties.
Metals 10 01461 g008
Figure 9. True stress–strain curve of the annealed sheet plotted on logarithmic scale.
Metals 10 01461 g009
Figure 10. Difference of ultimate and yield strength vs. the strain-hardening exponent.
Metals 10 01461 g010
Figure 11. Schematics showing effect of strain paths: (a) rolling followed by ISF and uniaxial tension; (b) ISF of annealed sheet followed by uniaxial tension.
Metals 10 01461 g011
Figure 12. Effect of process parameters on the ductility, (a) effect of wall angle on elongation, (b) effect of tool diameter on elongation and (c) effect of rotation on elongation.
Metals 10 01461 g012
Figure 13. Effect of the process parameters on the strength, (a) effect of tool diameter on the yield strength, (b) effect of tool diameter on the ultimate strength, (c) effect of wall angle on the yield strength, (d) effect of wall angle on the ultimate strength, (e) effect of rotational speed on the yield strength and (f) effect of rotational speed on the ultimate strength.
Metals 10 01461 g013aMetals 10 01461 g013b
Figure 14. Relationship between residual stresses and yield strength: (a) longitudinal residual stress vs. yield strength and (b) transverse residual stress vs. yield strength.
Metals 10 01461 g014aMetals 10 01461 g014b
Figure 15. Effect of the process parameters on the hardness, (a) effect feed rate on the hardness, (b) effect of wall angle on the hardness and (c) effect of rotation on the hardness.
Metals 10 01461 g015
Figure 16. Hardness as a function of surface residual stresses (a) Hardness vs. surface residual stress S1 and (b) Hardness vs. surface residual stress S3.
Metals 10 01461 g016
Table 1. Chemical composition (by weight %) of aluminum.
GradeAluminum
(Al)
Copper
(Cu)
Iron
(Fe)
Magnesium
(Mg)
Manganese
(Mn)
Silicon
(Si)
Titanium
(Ti)
Zinc
(Zn)
Al105099.50.050.40.050.050.250.030.10
Table 2. List of factors and their levels.
Process VariablesRotational Speed, ω (rpm)Feed Rate, 𝑓 (mm/min)Wall Angle, θ (°)Tool Diameter, d (mm)
Levels0 1000 20 6
1500 2000 40 14
3000 3000 60 22
Table 3. Final test plan as input in the Design Expert ® software.
Parameters/
Test No
Rotation, ω (rpm)Feed Rate, 𝑓 (mm/min)Wall Angle, θ (°)Tool Diameter, d (mm)
Test 101000206
Test 2030006022
Test 3300010006014
Test 4300020002022
Test 5020004014
Test 6150030002014
Test 715002000606
Test 8150010004022
Test 930003000406
Table 4. Mechanical properties of tensile specimen from blank sheets and post-formed parts.
SpecimenLength at Failure, Lf mm% Elongation *Yield Strength, σy MPaUltimate Strength, σu MPaσuσy MPa
Rolled sheet (as received)12 **84 **110 **26 **
Rolled sheet (ISF)26.546.18130.50144.0413.24
Annealed sheet36.9547.8050.6692.2626.64
Test 131.9527.8077.7084.026.32
Test 227.5310.1376.7882.405.62
Test 328.1012.4283.7695.2011.44
Test 436.4945.9565.5889.4623.88
Test 530.3023.4385.5995.7810.19
Test 630.1640.6452.5088.9936.49
Test 728.0812.35102.52109.006.48
Test 832.5830.3396.46107.9511.49
Test 929.3217.28100.96110.579.61
* calculations based on a gauge length (Lo) of 25mm, ** from supplier’s datasheet.
Table 5. Comparison between the results of the present and previous studies.
MaterialParent sheetFormed component% gain(+) or loss(-)
σy MPaσu MPa% Elon.σy MPaσy MPa% Elon.σyσuElon.
A0 O (present study)50.6692.2647.882.74101.1218.7+63.32+9.60–60.88
AA5754 H22 [22]29522.93259.7+10.17–57.6
AA6061 T6 [22]2631629112.8+10.65–21.2
Cu-steel-Cu H24 [27]177288.83.7450457.35.85+55.82+58.34+58.11
Cu-steel-Cu O [27]25511515438446.95.24+280.87+288.61-65.07
ω: 1500 rpm; 𝑓: 2000 mm/min; θ: 60°; d: 14 mm; Elon.: elongation.
Publisher’s Note: MDPI stays neutral with regard to jurisdictional claims in published maps and institutional affiliations.

