1. Introduction
In line with international environmental regulations that have recently been reinforced, Al alloy-based weight lightening studies have been on the rise in transportation industries, including automotive and aircraft industries [
1,
2,
3,
4,
5,
6]. Aluminum usage in the automotive industry has steadily increased since the 1970s, when cylinder and other engine parts began to use Al alloys in an attempt to raise fuel efficiency and reduce exhaust emissions; and, with the transition from internal combustion engine to electric drive system, aluminum demand for the auto frame is expanding in order to balance heavier vehicle weights. Al wrought alloys, including extruded and rolled ones, have been more widely applied to the hood, roof, and door, and cast alloys made by high pressure die casting process are also increasingly applied to the auto body. Specifically, Al-Si die casting alloys have superior weldability, processability, and castability; and, with addition of Mn and Mg, Al-Si alloys increase the lifespan of die and have enhanced mechanical properties, boosting their usage today [
7,
8,
9].
Al cast alloy products in general have internal defects, such as cracks, pores, shrinkage cavities, and inclusions. These defects come variously from hydrogen gas, oxides, intermetallic compounds, and segregation [
10,
11]. Hydrogen solubility in solid and liquid Al is 0.042 mL/100 g and 0.7 mL/100 g (660 °C, pure Al), respectively, and, due to the significant gap in hydrogen solubility, hydrogen porosity can easily occur during solidification [
12]. The oxide film on the surface of and inclusions in the molten Al alloys cause internal defects in the process of casting Al alloys. Because internal defects in cast alloys undermine mechanical properties of the final products, Al melt quality control is required in the melting process to secure high-quality Al melt, for which it is essential to accurately evaluate melt quality.
As illustrated in
Figure 1, Al melt quality can be evaluated by methods, including reduced pressure test, K-mold test, closed-loop recirculation, pressure filter technique, and thermal analysis; and a variety of studies have been under way to increase the accuracy of Al melt quality assessment [
13,
14,
15,
16,
17,
18,
19,
20]. For the reduced pressure test (RPT), while sampled Al melt is solidified in reduced pressure chamber at 1~10 KPa, bubble releases, cross-sectional porosity, and Density Index (DI) are half-quantitatively estimated to evaluate melt quality [
13,
14]. K-mold test is a fracture test to evaluate the macro-cleanliness of molten aluminum at production conditions. The melt quality is expressed through K mold value, which refers to the number of inclusions on the fracture surface through visual inspection [
14]. Closed-loop recirculation, devised by C. E. Ransley et al. [
20], quantitatively analyzes the metal quality by measuring the dissolved hydrogen content in molten aluminum. Thermal analysis, which is recorded temperature-time data during the solidification of Al melt, has been used to predict the structure of the test sample and, consequently, the actual casting properties in Al casting plants [
14]. A. Mitrasinovic et al. [
17] reported new technology using thermal analysis in combination with RPT, which can be used for on-line prediction of the melt hydrogen and casting porosity level in 3XX series of Al alloys. D. Dispinar and J. Campbel [
15] proposed the Bifilm Index (BI), which measures the maximum length of bifilms on the sectioned RPT samples, as a quantitative indicator of the melt quality. Recently, E. Erzi et al. [
18] proposed Supplier’s Qaulity Index (SQI) as a final quality index to create a reference for the quantification of quality of supplier’s ingots. The SQI index was estimated by the measured values of yield stress, ultimate tensile strength, elongation at fracture, fluidity of the melt, and BI. The index has also been proposed in an aim to quantify the ingot quality and to start the casting with a “good melt”.
Figure 1 shows the most common tools used in Al casting plants. Especially, since the reduced pressure test, also known as Straube-Pfifer test, incorporates not only the effect of hydrogen but also that of impurities, such as inclusions, it has become one of the most established methods to measure Al melt quality. This method is the simplest and cheapest, making it preferable to use in industrial sites. In deciding Al melt quality through the reduced pressure test, however, there is neither international testing standards nor regular casting criteria in detail to evaluate DI that indicates Al melt quality.
This study aimed to identify casting conditions that affect DI in the reduced pressure test for Al melt quality evaluation and to standardize casting conditions for quantifiable evaluation of Al melt quality. In addition, the study monitored the change of DI, depending on atmospheric exposure of melt, sampling method, and mold pre-heating temperature, and looked into the cause by observing porosity and inclusions and analyzing solidification behavior through casting process simulation. Drawing on the above, the study pondered on the casting conditions for the reduced pressure test that could enable the standardization of quantifiable evaluation of Al alloy melt quality.
2. Materials and Methods
The Al-Si alloy used in this study is Al-10Si-Mn-Mg (Silafont-36, Ajinmetal, Ulsan, Korea) and has the chemical composition detailed in
Table 1. To standardize quantifiable evaluation of Al melt quality, the reduced pressure test was conducted under the three casting experimental conditions (atmospheric exposure, sampling method, and mold pre-heating temperature).
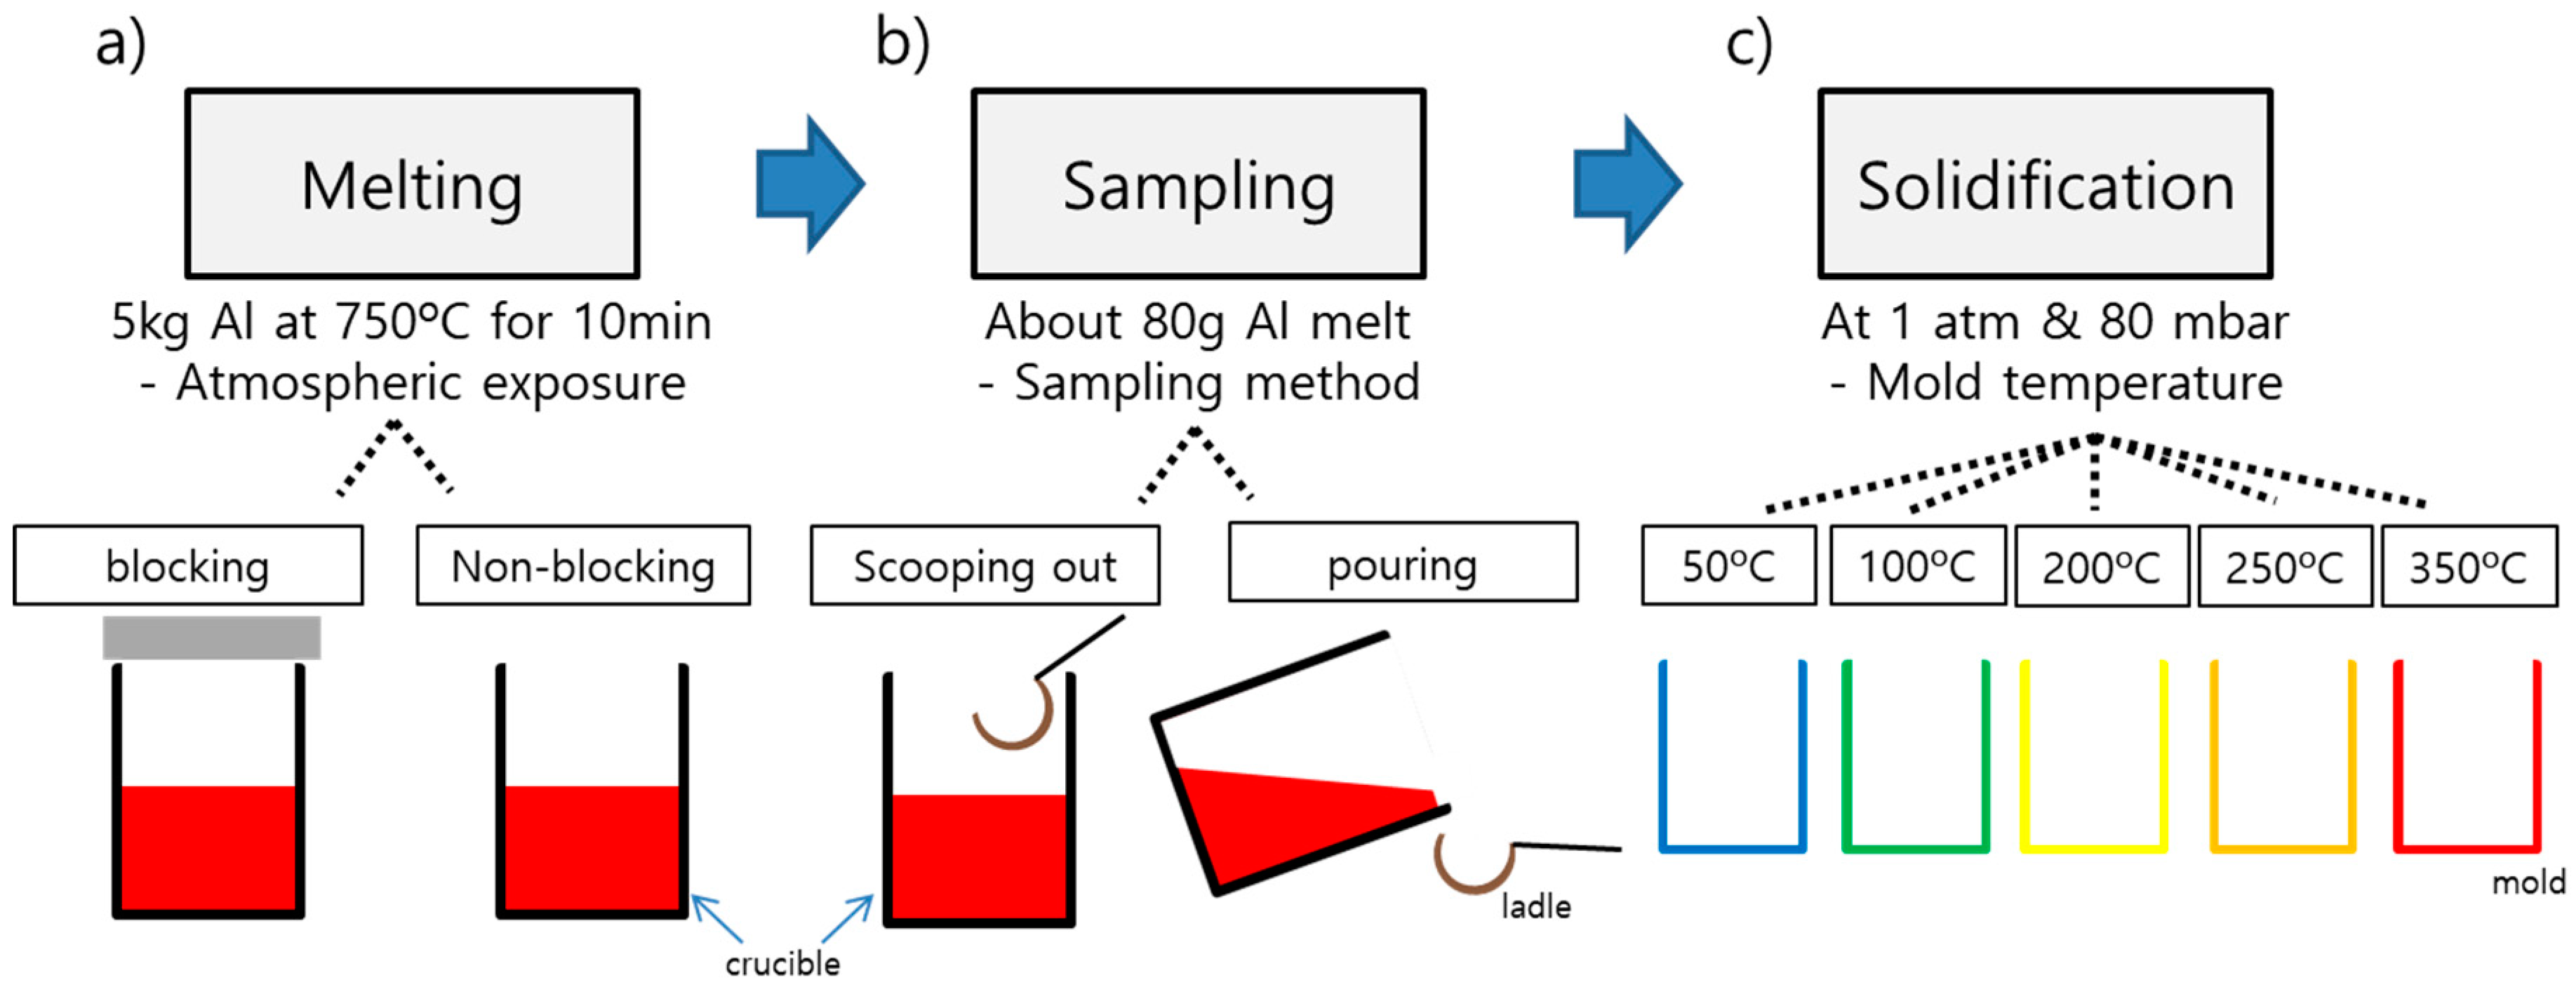
Figure 2 and
Table 2 summarize the casting conditions and sampling methods that this study adopted. Five kilograms of Al10SiMnMg ingot was melted by electric resistance furnace. Melt temperature was maintained at 750 °C for 10 min, and each casting condition was tested.
First, the sample Al_b (indicated “blocking”) with which atmospheric exposure was blocked during melting and Al_nb (“non-blocking”) with atmospheric exposure non-blocked were compared for melt quality in the reduced pressure test. Second, to examine the effect of sampling method, Al_p (“pouring”) that was collected by tilting the crucible and pouring the melt and Al_s (“scooping out”) that was scooped out by a ladle were compared. Third, to see the effect of the mold pre-heating temperature, the reduced pressure test was conducted with Al_m50, Al_m100, Al_m200, Al_m250, and Al_m350 at 50, 100, 200, 250, and 350 °C of mold pre-heating temperature in the same order. The ladle was preheated to a temperature between 350 and 400 °C before sampling the aluminum melt, and the sampled melt was solidified in the mold made of SUS316. The basic casting conditions were set at non-blocked atmospheric exposure during melting, scooping-out method for sample collection and 100 °C of mold pre-heating temperature (Al_nb, Al_s, and Al_m100). The density of the cast samples was measured by Archimedes’ method, and DI was derived as in Equation (1) [
14].
is the density of a sample cast at 1.01 × 10³ mbar (1 atm), and is the density of a sample cast at the reduced pressure of 80 mbar. The less DI, the less gap between and , so the higher melt quality. After measuring DI, the porosity of each sample was inspected, the microstructure was observed, and computer-aided casting simulation was conducted. In inspecting the porosity of the samples in the reduced pressure test, 3D X-ray CT (Computed Tomography) (240-kV X-ray, resolution = 29 μm; Nikon, Tring, UK) was used. By using optical microscopy (OLYMPUS-BX51M, Olympus Corporation, Tokyo, Japan) and field emission scanning electron microscopy (JSM-7600, JEOL Ltd, Tokyo, Japan), the microstructure of the solidified samples under each condition was observed, and the size of the secondary dendrite arm spacing (SDAS) was measured. Oxides formed in the solidified samples and alloy elements of the inclusions were analyzed by energy dispersive spectroscopy (EDS). In addition, with a casting process simulation program (AnyCasting 6.5; AnyCasting Software Co., Ltd., Seoul, Korea), local cooling rate and solidification time, depending on mold pre-heating temperature at 50, 250, and 350 °C, were predicted and compared with the experimental estimates for melt quality. In order to build the physical model structure of the mold and the mold cavity, Creo three-dimensional drawing software (3.0, PTC; Boston, MA, USA) was used in this study. AnyCasting numerical simulation analysis was utilized to perform the mesh generation of the physical model via AnyPRE, dividing it into about 4.8 million grids. The casting materials and mold materials were defined as Al-10Si-Mn-Mg alloy (Silafont-36) and SUS316 stainless steel, respectively, and the thermophysical properties of the materials were applied as values in the database of AnyCasting. It conducts data analysis of set parameters via AnySOLVER to simulate the local cooling rate and solidification time at different mold pre-heating temperatures.
3. Results and Discussion
Figure 3 illustrates the DI measured under different casting conditions. In the reduced pressure test to see the effect of atmospheric exposure during melting, the samples Al_b and Al_nb showed the DI of 2.9 and 8.5%, respectively (
Figure 3a). The sample without atmospheric exposure was 5.6% lower in DI than the one with atmospheric exposure. Regarding the effect of atmospheric exposure, it is speculated that blocking atmospheric exposure to the crucible restricts oxides from forming on the surface of Al melt and limits the amount of gas dissolving into the melt, enhancing the quality of the melt.
In the reduced pressure test with two different sampling methods, Al_s and Al_p recorded 8.5 and 10.4%, respectively, in DI (
Figure 3b). Precautions were taken to not include surface oxides while sampling by the both methods, and still, the scooping-out method produced a DI value, 1.9% lower than the pouring method. During the process of casting Al alloys, Al oxide films form on the surface of the melt, and oxides or inclusions remain in the melt. The samples solidified at a reduced pressure in the RPT have large-sized internal pores, and it is because defects, such as oxides or inclusions, allow nucleation and gather gases around them to grow pores [
16]. Oxides and inclusions formed in the process of casting Al alloys have higher densities (Al
2O
3 3.97 g/cm
3, MgO 3.58 g/cm
3, MgAl
2O
4 3.6 g/cm
3, SiC 3.22 g/cm
3, AlN 3.26 g/cm
3, TiB
2 4.50 g/cm
3, and AlB
2 3.19 g/cm
3) than the density of Al melt (2.7 g/cm
3), so they tend to sink with the passage of time [
12]. With the scooping-out method, it is speculated that because scooping out occurred at the upper layers of the melt in the crucible, the inflow of the oxides and inclusions was relatively limited and a relatively lower DI and higher melt quality were measured. With the pouring method, a good amount of inclusions and oxides in the melt is thought to have decreased the melt quality in the reduced pressure test.
Figure 4 shows the porosity and X-ray CT images of Al_s and Al_p tested at the reduced pressure. The porosity of Al_s and Al_p was 12.5 and 14.6%, respectively, and, similarly to the difference in DI between the two samples, the porosity of Al_s was 2.1% lower. And X-ray CT images displayed that, while the pores formed in Al_s crowded in the upper area, the pores in Al_p were evenly distributed. It is interpreted that the pouring method used for Al_p than the scooping-out method for Al_s produces more oxides and intermetallic compounds that allow nucleation of pores; and it leads to a different distribution of the pores.
Figure 5 shows the images of the reduced pressure test samples Al_s and Al_p observed by scanning electron microscopy and energy dispersive spectroscopy. With them, the oxides and inclusions formed around the pores in the samples were comparatively analyzed. In Al_s, Si oxides were found to form around the pores, and, in Al_p, Mg oxides, as well as Si oxides, were observed. While casting Al-Si alloys, adding a small amount of Mg may produce oxides, such as MgO and MgAl
2O
4, in the form of film [
10]. SiO
2 oxides, with a density of 2.66 g/cm
3 that is close to that of Al, are likely to be spread throughout the melt; but MgO and MgAl
2O
4 have densities at 3.58 g/cm
3 and 3.6 g/cm
3, respectively, which is higher than Al melt, so that they are likely to stay in the lower area of the crucible. It is interpreted that the sample Al_p collected by pouring contained more oxides of higher density and consequently produced significant differences in Al melt quality and DI.
Based on the experimental results described above, the effect of varying mold pre-heating temperature on Al melt quality in the reduced pressure test was analyzed under the same conditions of atmospheric exposure and sampling method (non-blocked atmospheric exposure and scooping-out method). In
Figure 6, the density and DI of the reduced pressure test samples are represented at different mold pre-heating temperature. As mold temperature changed, the samples Al_m50, Al_m100, Al_m200, Al_m250, and Al_m350 showed a density of 2.63, 2.62, 2.62, 2.62, and 2.62 g/cm
3, respectively, at 1 atm (1.01 × 10
3 mbar) (
Figure 6a). With varying mold temperature, the density of the samples at 1 atm (1.01 × 10
3 mbar) maintained a constant level. At the reduced pressure, the DI recorded the lowest at 0.9% in Al_m350 with the highest mold temperature, and, as mold temperature increases, the DI also climbed to 8.5, 15.9, and 18.7% in Al_m100, Al_m200, and Al_m250, respectively (
Figure 6b). Despite little difference in the density of the samples at 1atm (1.01 × 10
3 mbar), when mold temperature went up from 100 to 250 °C at the reduced pressure, the DI increased; and the DI showed a gap of 10.2% between Al_m100 and Al_m250. At 350 °C of mold pre-heating temperature, a higher DI than that of Al_m250 had been expected, but the DI recorded at 0.9%, showing superior melt quality. The reason that the DI decreased at 350 °C of mold temperature is to be explored later through casting process simulation.
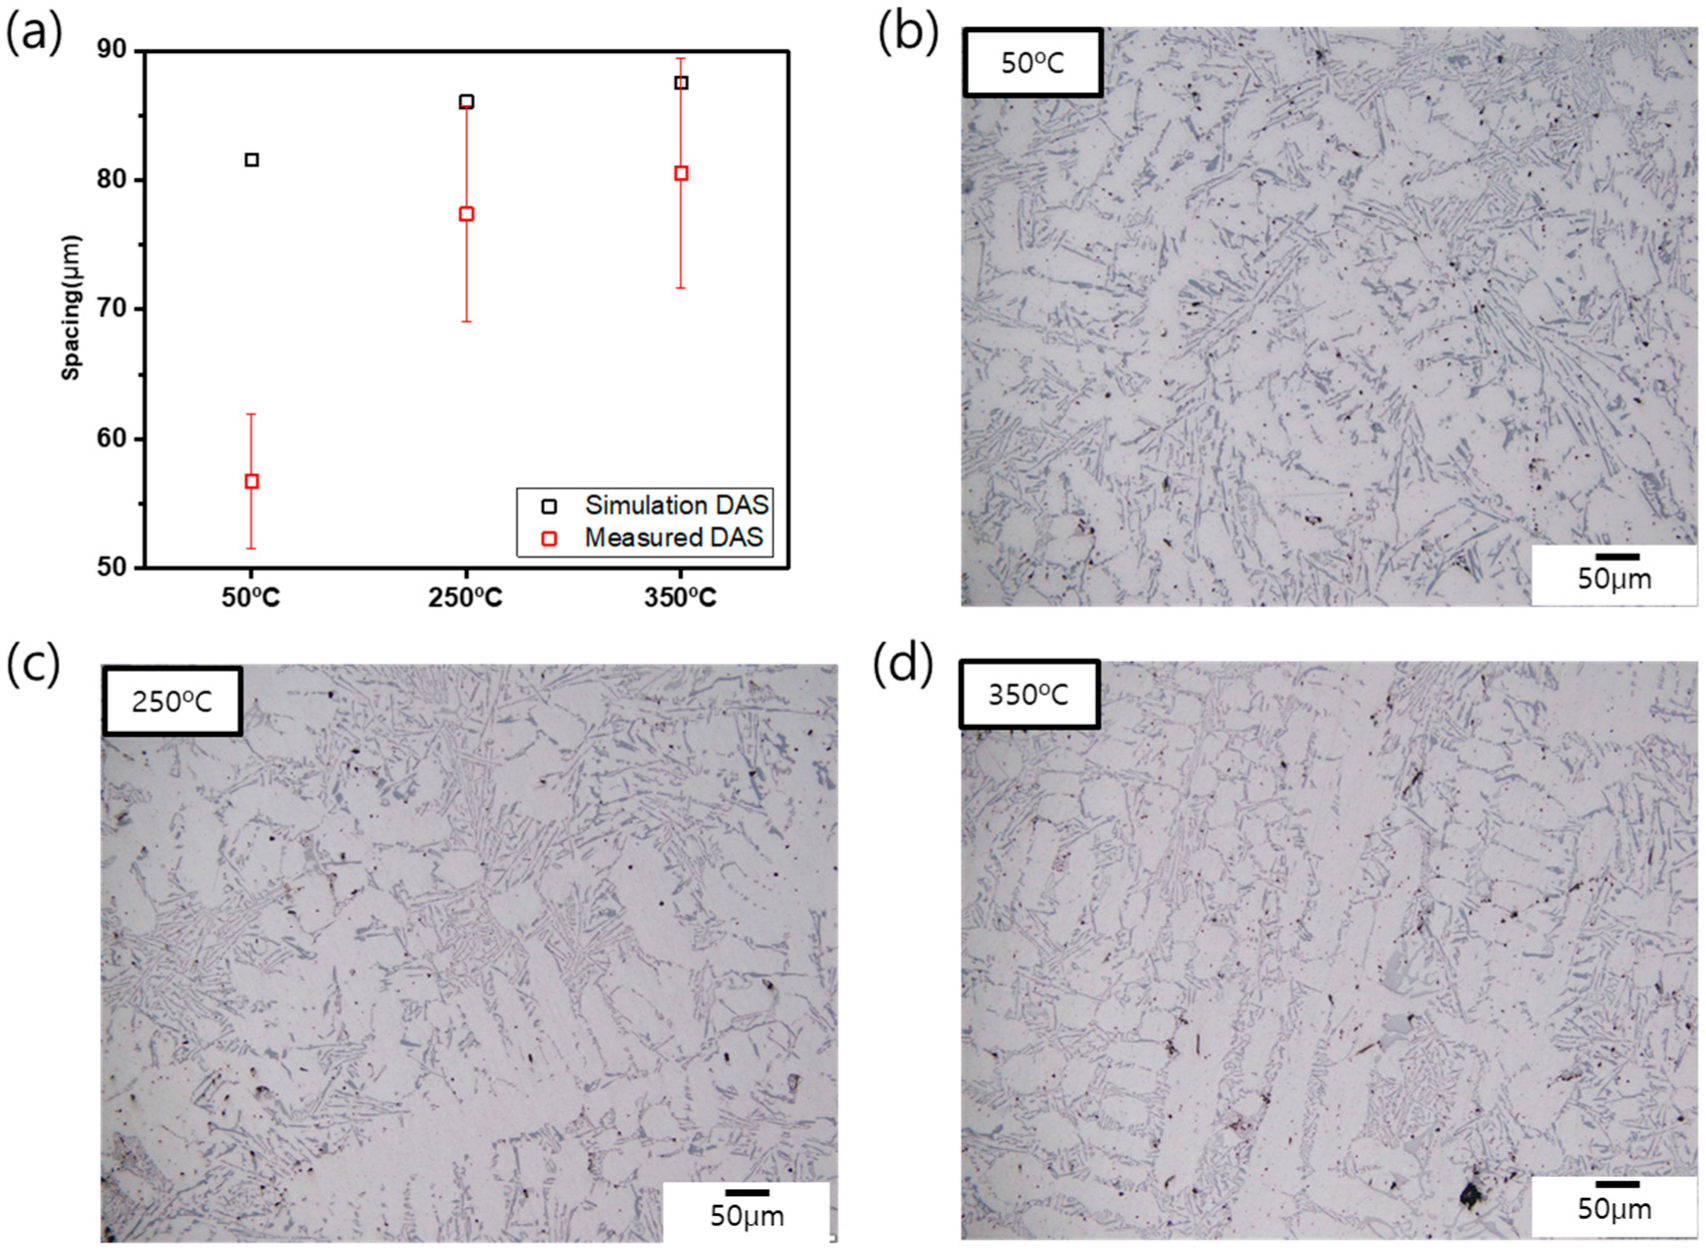
To understand the difference in DI depending on mold temperature, the cooling rate and solidification time of the melt were analyzed by casting process simulation given the same conditions with the experiment (including the amount of the melt, casting temperature, mold temperature, and mold shape). According to the casting process simulation of cooling rate and SDAS depending on mold temperature, it was predicted that average cooling rate would be 0.393, 0.350, and 0.332 °C/s, and average SDAS would be 83.2, 86.6, and 88.3 μm at 50, 250, and 350 °C of mold temperature, respectively (
Figure 7a). The relation between the SDAS at the solidified Al-Si alloy sample and cooling rate of the sample during casting can be expressed as Equation (2) [
21].
In Equation (2),
is the average size of SDAS (μm), and
is the average solidification rate (°C/s). Based on the simulation on the SDAS and cooling rate, A and B expressed in (2) can be derived to be 59.75 and −0.354, respectively. These values turn out to be close to 50.71 and −0.361 that P. N. Anyalebechi [
21] calculated as A and B from the relation between the SDAS and cooling rate of A5182 alloy.
Figure 7 shows the images of the microstructure from the reduced pressure test samples Al_m50, Al_m250, and Al_m350 and compares the measured SDAS with the simulation result above. Upon observing the microstructure of the samples, it was found that Al-α phase was in a columnar structure that is due to low cooling rate during casting, as well as had secondary dendrite arms regardless of mold pre-heating temperature. The SDAS were 56.7, 77.4, and 80.1 μm in Al_m50, Al_m250, and Al_m350, respectively (
Figure 7a). When mold pre-heating temperature jumped from 50 °C to 250 °C, the SDAS increased 20.7 μm, and the SDAS showed little difference of 2.77 μm between 250 and 350 °C. When the measured SDAS were compared with the simulation values, gaps of 9.2 μm and 8.2 μm appeared with Al_m250 and Al_m350, and a larger gap of 26.5 μm showed with Al_m50. This means that, at 50 °C of mold temperature, the actual melt cooling rate could have been faster than that predicted from casting process simulation.
SDAS in Al-α phase is known that one of the main nucleation sites of pores which was formed due to a significant gap of hydrogen solubility between molten and solid metal in the Al alloy casting process [
22]. Because the analysis of the measured SDAS and simulation values found little difference in SDAS between Al_m250 and Al_m350, the large DI gap between the two samples was considered to not have come from the difference in SDAS, depending on mold pre-heating temperature.
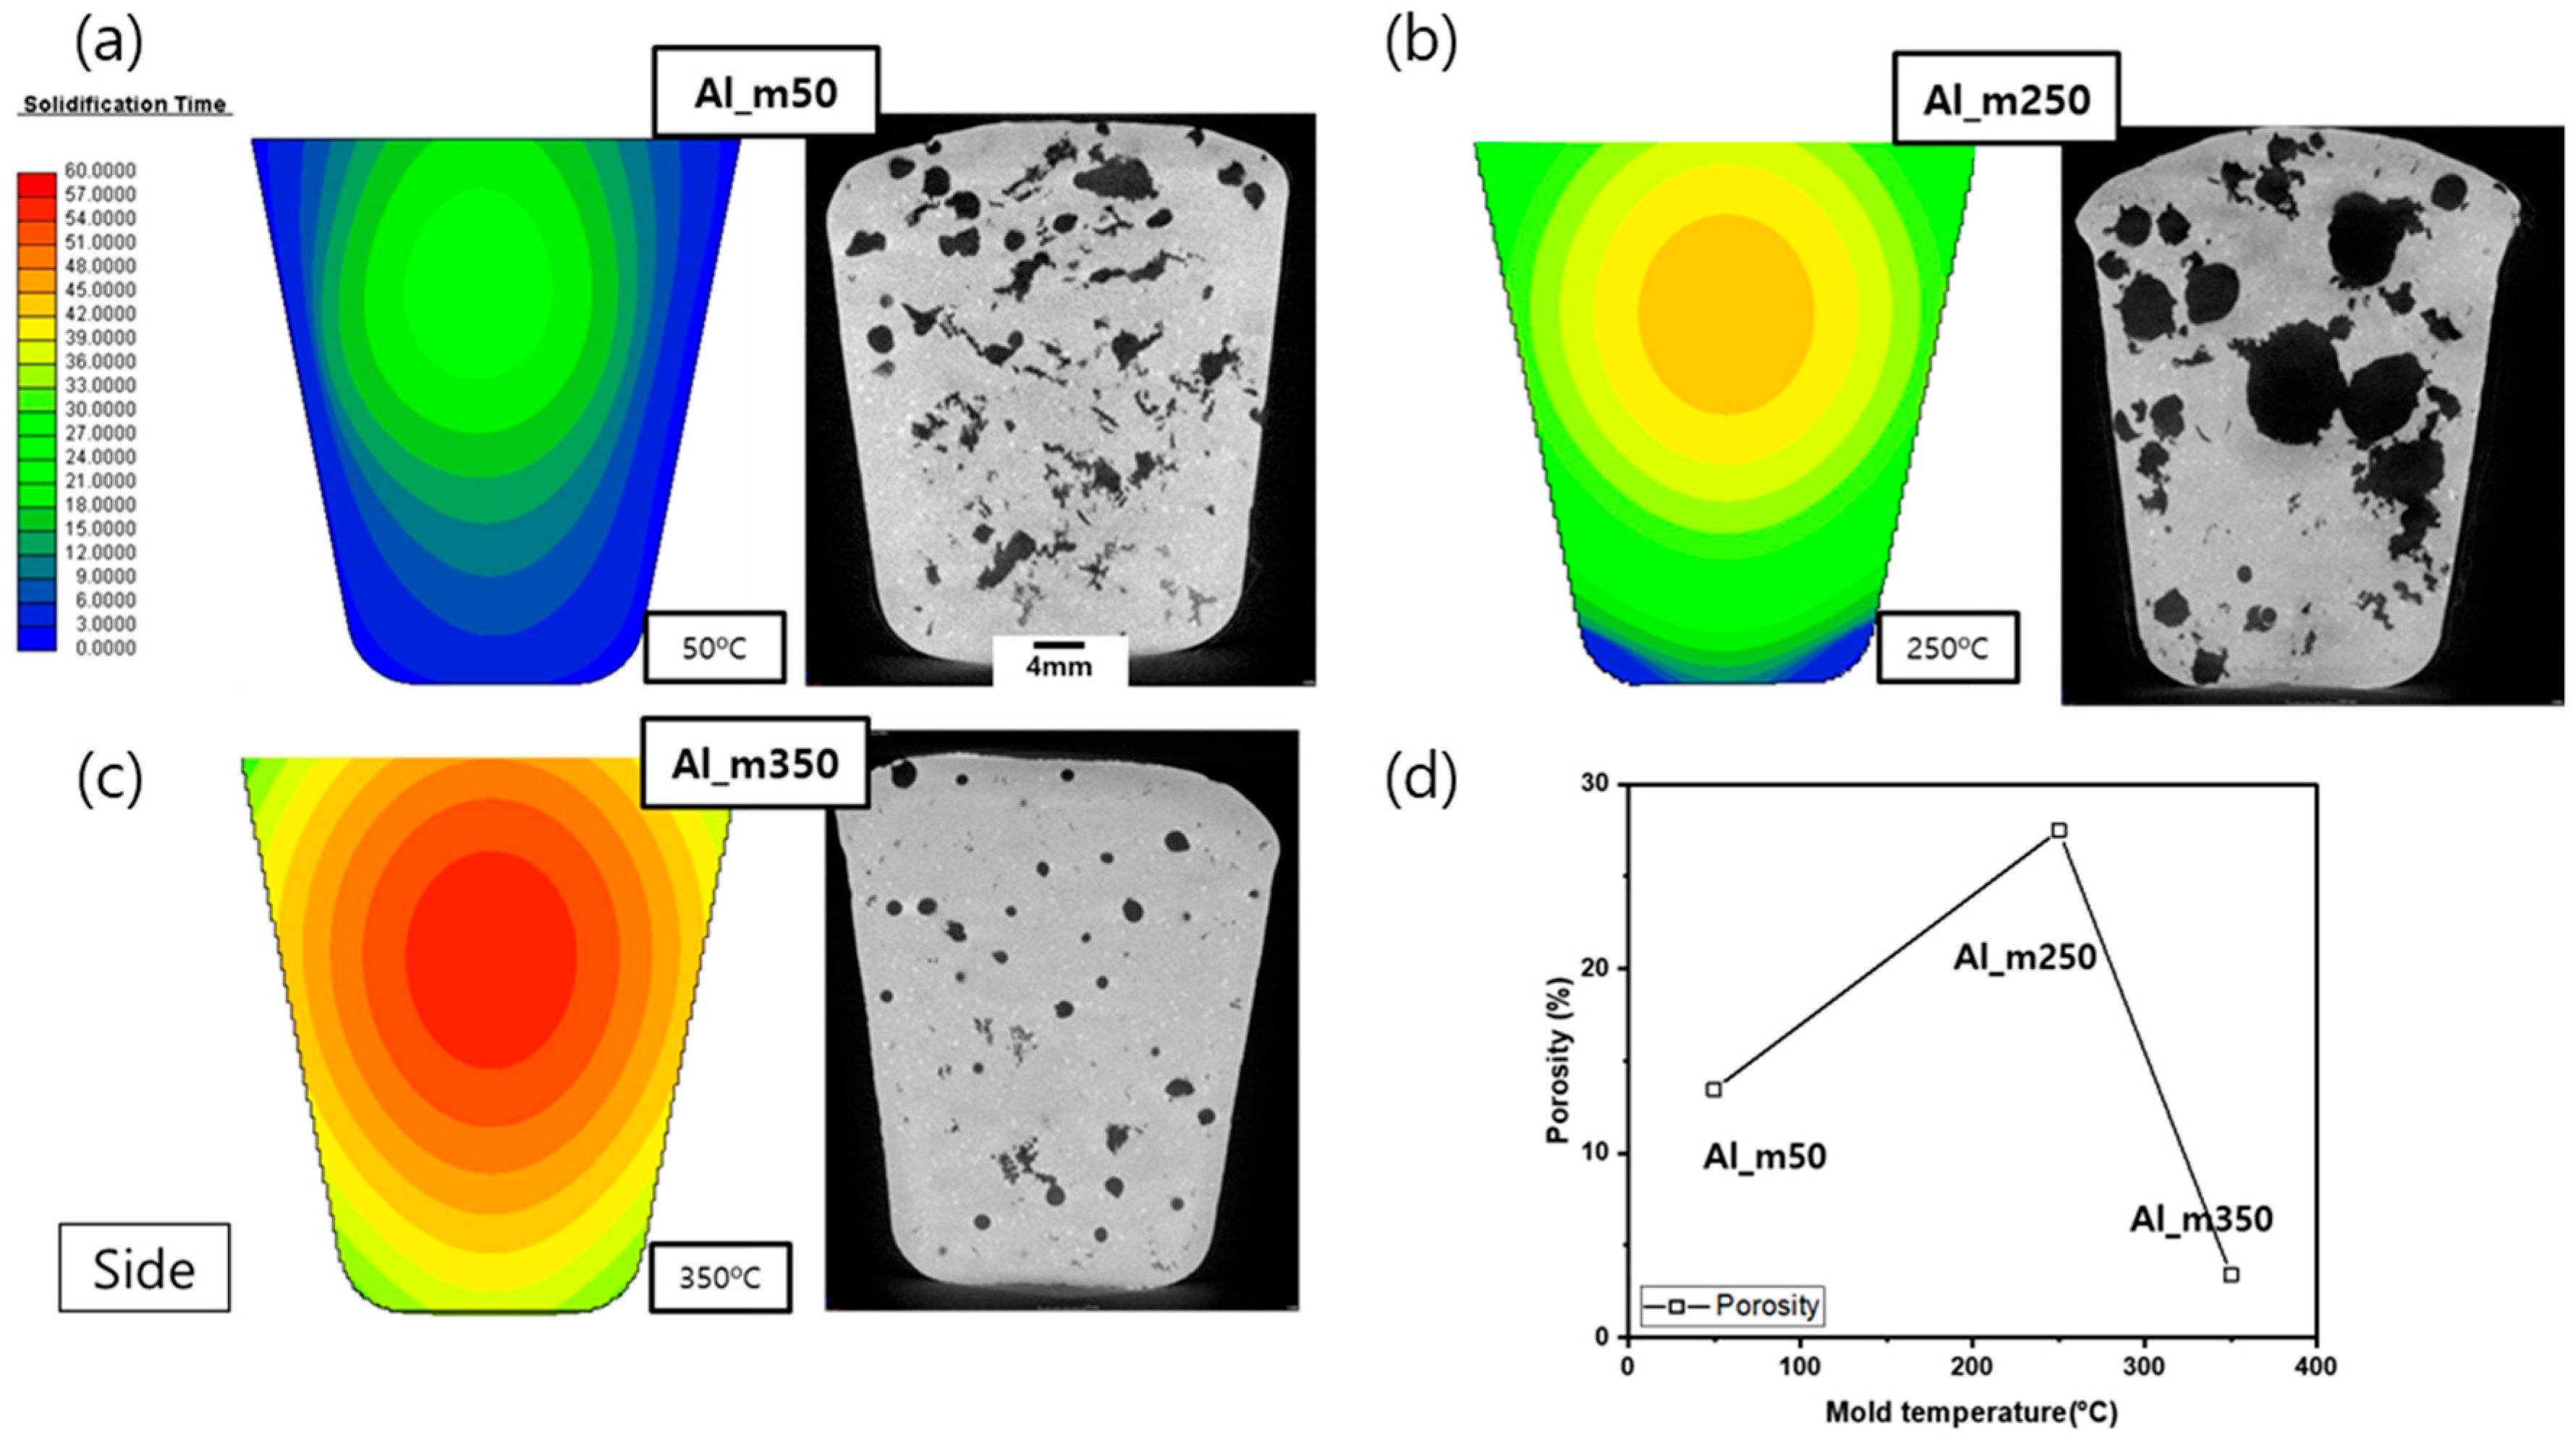
To figure out the reason that the DI dropped rapidly at 350 °C of mold pre-heating temperature, the solidification time of Al_m50, Al_m250, and Al_m350 were analyzed by casting process simulation, and the X-ray CT images and porosity of the samples were observed (
Figure 8). The casting process simulation showed that as mold temperature increased to 50, 250, and 350 °C, the solidification time also rose to 23, 44, and 56 s in the order mentioned. When mold temperature changed from 50 to 250 °C, the solidification time almost doubled. As the difference between the measured value and the simulated predicted value for SDAS have been seen in
Figure 7, the simulated predicted value for the solidification time may differ from the actual value. Nevertheless, it can be considered that the actual tendency of the solidification time according to the mold temperature is similar to the simulation prediction results. In the X-ray CT images, both spherical and shrinkage porosity was found in Al_m50 and mostly spherical porosity was observed in Al_m250 and Al_m350. Porosity was recorded at 13.5, 27.5, and 3.4% in Al_m50, Al_m250, and Al_m350, respectively. In line with the trend of the DI values, the lowest porosity was detected in Al_m350. Although the solidification time increases as the mold temperature increases, the cause of the lowest porosity in Al_m350, not in Al_m50, was not explained only by the prediction of the solidification time. To figure out the cause, the solidification start time on the different sites and the effective hydrogen diffusion coefficient were calculated and discussed in relation to the RPT experimental condition, as shown in the next section.
In
Figure 9, the solidification start time with Al_m250 and Al_m350 was figured out on the different sites, on the surface or in the middle, of the samples [
23]. At the sites where solidification started the latest, Al_m250 was expected to take approximately 14 s after casting, and Al_m350 was approximately 24 s. At the site (A) close to the mold, the solidification start time had a gap of 15 s between the two samples, and the gap narrowed to 10 s towards the center.
Figure 10 represents the calculated effective hydrogen diffusion coefficient in Al-Si alloy depending on mold pre-heating temperature after casting. The point where Al alloy melt starts solidifying is indicated as S. The effective hydrogen diffusion coefficient (
) in Al alloy melt was calculated from the solid fraction (
) and hydrogen diffusion coefficient in molten and solid Al (
,
) provided below Equations (3)–(5) [
23,
24].
At the center of Al_m50 where the cooling rate is slow with a relatively higher hydrogen diffusion coefficient, spherical defects were made in abundance in the reduced pressure test; and, in the sites where solidification occurs rapidly, pores of irregular shapes were formed (
Figure 8a). The irregular-shaped pores are presumed to have formed because hydrogen had too little time to diffuse to be nuclei in defects and expand into a spherical form. As for Al_m250, it is presumed that spherical pores grew large overall because high mold pre-heating temperature slowed down the cooling rate, and a higher effective hydrogen diffusion coefficient than that of Al_m50 allowed a longer time for hydrogen to diffuse.
The sample Al_m350, in which mold pre-heating temperature was 350 °C, had been expected to have lower melt quality, that is a higher DI than Al_m250, but the DI of Al_m350 was measured fairly low at 0.9% (
Figure 6b). It was observed in Al_m350 that the oxide layer formed on the surface broke and gases were let off in the reduced pressure test; and which could be explained by the simulated solidification start time on the melt surface (
Figure 9b) and the effective hydrogen diffusion coefficient (
Figure 10). The solidification start time at the center of the melt surface was predicted to be after 12 s in Al_m250, and 23 s in Al_m350. In the reduced pressure test, 80 mbar that is the reduced pressure condition is reached in less than 15 s and maintained for 4 min. As for Al_m350, it is explained that gases in the melt escaped out of the surface yet to be solidified at 80 mbar and the DI dropped as a result. This means that the reduced pressure test at 350 °C of mold temperature has a low accuracy and efficiency in measuring the DI that intends to quantify residual hydrogen, gases and inclusions in the melt. It should be noted that, apart from the mold temperature in the RTP test, use of a high mold temperature to reduce internal defects in the manufacture of Al cast products causes grain growth and mechanical property degradation.
In the industrial field of Al alloy casting, melt quality is managed by the reduced pressure test to control internal defects, including hydrogen gas porosity. To maintain melt quality, DI is usually kept at under 1, but casting conditions need to be standardized to establish quantitative index. As this study has shown, DI showed a 5.6% gap between when atmospheric exposure was blocked and when it was not blocked due to air, and a 1.9% gap between two different sampling methods due to inclusions in the melt. In addition, in the reduced pressure test samples, DI recorded a 17.8% gap at the largest due to mold pre-heating temperature. From the results above, this study found that mold temperature should be maintained constant at below 250 °C, and other casting conditions, including atmospheric exposure and sampling method, should be constant in the reduced pressure test in order to ensure reliability of melt quality management.


