Article

Use of X-ray Computed Tomography for Assessing Defects in Ti Grade 5 Parts Produced by Laser Melting Deposition

1
National Institute for Laser, Plasma and Radiation Physics (INFLPR), Magurele, 077125 Ilfov, Romania
2
Faculty of Applied Science, University Politehnica of Bucharest, 060042 Bucharest, Romania
3
Faculty of Industrial Engineering and Robotics, University Politehnica of Bucharest, 060042 Bucharest, Romania
4
Faculty of Physics, University of Bucharest, Magurele, 077125 Ilfov, Romania
*
Author to whom correspondence should be addressed.
Metals 2020, 10(11), 1408; https://doi.org/10.3390/met10111408
Submission received: 30 September 2020 / Revised: 14 October 2020 / Accepted: 21 October 2020 / Published: 23 October 2020

Abstract

:
Laser Melting Deposition (LMD) is a metal printing technique that allows for the manufacturing of large objects by Directed Energy Deposition. Due to its versatility in variation of parameters, the possibility to use two or more materials, to create alloys in situ or produce multi-layer structures, LMD is still being scientifically researched and is still far from industrial maturity. The structural testing of obtained samples can be time consuming and solutions that can decrease the samples analysis time are constantly proposed in the scientific literature. In this manuscript we present a quality improvement study for obtaining defect-free bulk samples of Ti6Al4V under X-Ray Computed Tomography (XCT) by varying the hatch spacing and distance between planes. Based on information provided by XCT, the experimental conditions were changed until complete elimination of porosity. Information on the defects in the bulk of the samples by XCT was used for feedback during parameters tuning in view of complete removal of pores. The research time was reduced to days instead of weeks or months of samples preparation and analysis by destructive metallographic techniques.

1. Introduction

Additive manufacturing (AM) with titanium alloys revealed several possible breakthroughs in producing complex metal parts that would have been impossible to achieve via traditional manufacturing methods (e.g., casting, milling, forging) [1,2,3]. One of them is the possibility to create lattices instead of bulk allowing for mass reduction of parts [4] and increasing the cost efficiency [5]. Another is production of trabecular structures for components of metallic prostheses. For the success of AM a comprehensive understating of the relationship between manufacturing parameters (e.g., laser power, scanning speed, powder feed rate, scanning strategy), powder quality and overall built integrity of the final part (e.g., defects, voids, inclusions) is essential.
One of the common AM techniques for 3D printing of metallic parts is Laser Melting Deposition (LMD) [1,6]. In this technique, the laser irradiates a substrate and locally melts it, while powder is injected into the molten pool. The path of the laser beam also represents the contour of the part to be printed. Layer by layer, a 3D part can be constructed in this manner. Another common 3D printing technique for metallic materials is Selective Laser Melting (SLM). In this method, a bed of powder is irradiated by a laser beam. The powder is melted in the areas scanned by the laser beam and is rapidly solidified after the action of the laser beam stops. A new layer of powder is applied on the top via a leveling set-up, followed by a new laser irradiation step. Thus, layer by layer a 3D shape is produced [7,8]. LMD allows for fabrication of large size near-net-shape components and high versatility in composition (as it can feed various types of metallic powders by using powder distributors with two or more hopers), while SLM is usually dedicated to smaller parts which require high resolution. Consequently, this method is suitable for building complex parts with topological optimization design [9] made of composite materials [10] or compositionally graded materials [11,12]. Furthermore, LMD technique is ideal for repairing high-valued metallic parts [13] due to its capability to add material on top of worn or damaged regions with minimum waste [14,15,16] and preserving or even improving the mechanical properties of the initial components [17]. LMD manufacturing has been applied for personalized metallic parts with major applications in medical field (implants or medical instruments) [18], automotive [19], aerospace [20] and aeronautics (turbine blades, gas turbine-blisks) [21].
Ti6Al4V is widely used in industrial applications for the manufacturing of high value components, due to its high corrosion resistance [20], high strength [22], low weight ratio [23] and high-temperature performance [24,25]. Aerospace and aircraft [26], electronics [6], automotive [27] and medical devices [22,28,29] are only a few examples of the industries where Ti6Al4V is used. This Ti alloy is suitable for aerospace parts production such as flaps, engine subassemblies or air-frames [30] because of its weight saving, high level of fatigue resistance, significant volume reduction and high-temperature mechanical properties [31]. There are a few reports which demonstrate the superior properties of the Ti6Al4V parts produced by LMD compared to traditional manufacturing procedures [32,33,34]. Even though it is well-known that mechanical properties are strongly influenced by thermal load cycles, Ti6Al4V parts produced by LMD show a great balance between mechanical strength and ductility.
In theory, LMD can produce fully dense structures, but the powder quality, optimized processing parameters and scanning strategies can influence the fabrication resolution and integrity of the final part. It was reported in several papers that the size, shape, and defects of the starting powder are affecting deposited track thickness, interlayer porosity [35], surface roughness, hardness and mechanical properties of the final LMD components [36,37]. The process parameters that can influence the overall quality of the LMD Ti6Al4V parts are laser power, scanning speed, powder feed rate, laser spot size, nozzle type and correct alignment of the focus spot with the powder stream [38]. Besides these parameters, the scanning strategy that includes hatch interspace and scan pattern, can drastically affect the width, height, and surface quality of the final LMD product. A properly determined scanning strategy might decrease the amount of residual stress and thermal distortions [38].
Internal defects in LMD parts have substantial negative effect on their mechanical reliability. These defects are inaccessible to surface investigation methods based on tactile, light-optical sensors, and even destructive methods; thus, a non-destructive tool is highly recommended in order to obtain an in-depth structural overview. The X-ray computed tomography (XCT) is one of the most suitable non-destructive methods for sample analysis with tolerance in the range of a few microns [39]. In case of long time exposure to X-Rays materials can suffer surface or internal modifications in terms of texturing or plastic deformations [40,41]. In our case such modifications are not envisageable due to the short irradiation times (minutes to tens of minutes). This method is widely applied in various industrial applications due to its major advantages in metrological inspection independent to surface, shape, or material [42,43,44]. The XCT is becoming a reliable non-destructive inspection tool of metallic AM parts, due to its possibility to provide in-depth volumetric and structural analysis with high resolution scanning, versatility, and post-processing algorithms for statistical interpretation. Recent studies have confirmed the time to cost efficiency of the XCT applied in large volume investigation, in comparison with destructive methods such as metallographic examination [45]. While XCT has been tested for characterization of small samples produced by SLM, no optimization study on XCT monitoring was found in the scientific literature for LMD, which usually produces large samples.
In this paper, we report LMD scanning strategy improvement using XCT as an analysis tool. Its feedback can offer valuable information in a relatively short amount of time on the defects’ formation in various deposition conditions. The aim of this study is to obtain final products fabricated by LMD without internal defects, such as pores, cracks, or non-melted inner regions. We will show that the scanning strategy for producing a part can be optimized in a matter of hours instead of days, as would be the case when using destructive analyses techniques.

2. Materials and Methods

The starting material used in this study was commercially available Ti6Al4V metallic powders (Carpenter Additive, UK) with spherical shape and size diameter of 45–106 µm. The powder was obtained using gas atomization technique. In order for the particles to have the desired diameters range, the powders were sieved after the production process. The alloy contains Al (min 5.5% and max 6.5%), V (min 3.5% and max 4.5%), and the rest up to 100%Ti. The density of this alloy is the range of 4.43–4.5 g/cm3 [46].

2.1. LMD Set-Up

The LMD experiments were performed using an Yb:YAG laser source (TruDisk 3001, Trumpf, Ditzingen, Germany) with wavelength λ = 1030 nm emitting in continuous wave, which was connected to a 6-axis robotic arm (Kuka, Augsburg, Germany) equipped with a three beam nozzle for powder flow and a metallic powder distributor (Figure 1). The focused spot of the laser beam was 800 µm with a top-hat energy distribution. The metallic powder was transported from the feeder to the substrate via a mix of He and Ar gases.
The processing parameters, such as laser power, scanning speed and powder feed rate were previously optimized in order to obtain high density depositions free of defects such as pores, cracks or non-fusion powder particles [47]. They are provided in Table 1 and were preserved for all experiments. However, if depositions are conducted on larger areas or when using different scanning strategies, these conditions no longer ensure defects free depositions and a new study is necessary, this time taking into account hatch spacing and the distance between layers. The defects can be due to the higher temperature of the substrate caused by prolonged irradiation, which can cause higher rate evaporation, larger heat affected zones, deposition with non-uniform thickness, change of metallographic structure or repeated dilatation-contraction cycles.
During the fabrication process, the distance between the nozzle and the deposited surface was kept constant at 16 mm. A pure titanium plate with a thickness of 10 mm and a diameter of 100 mm was used as a substrate material.
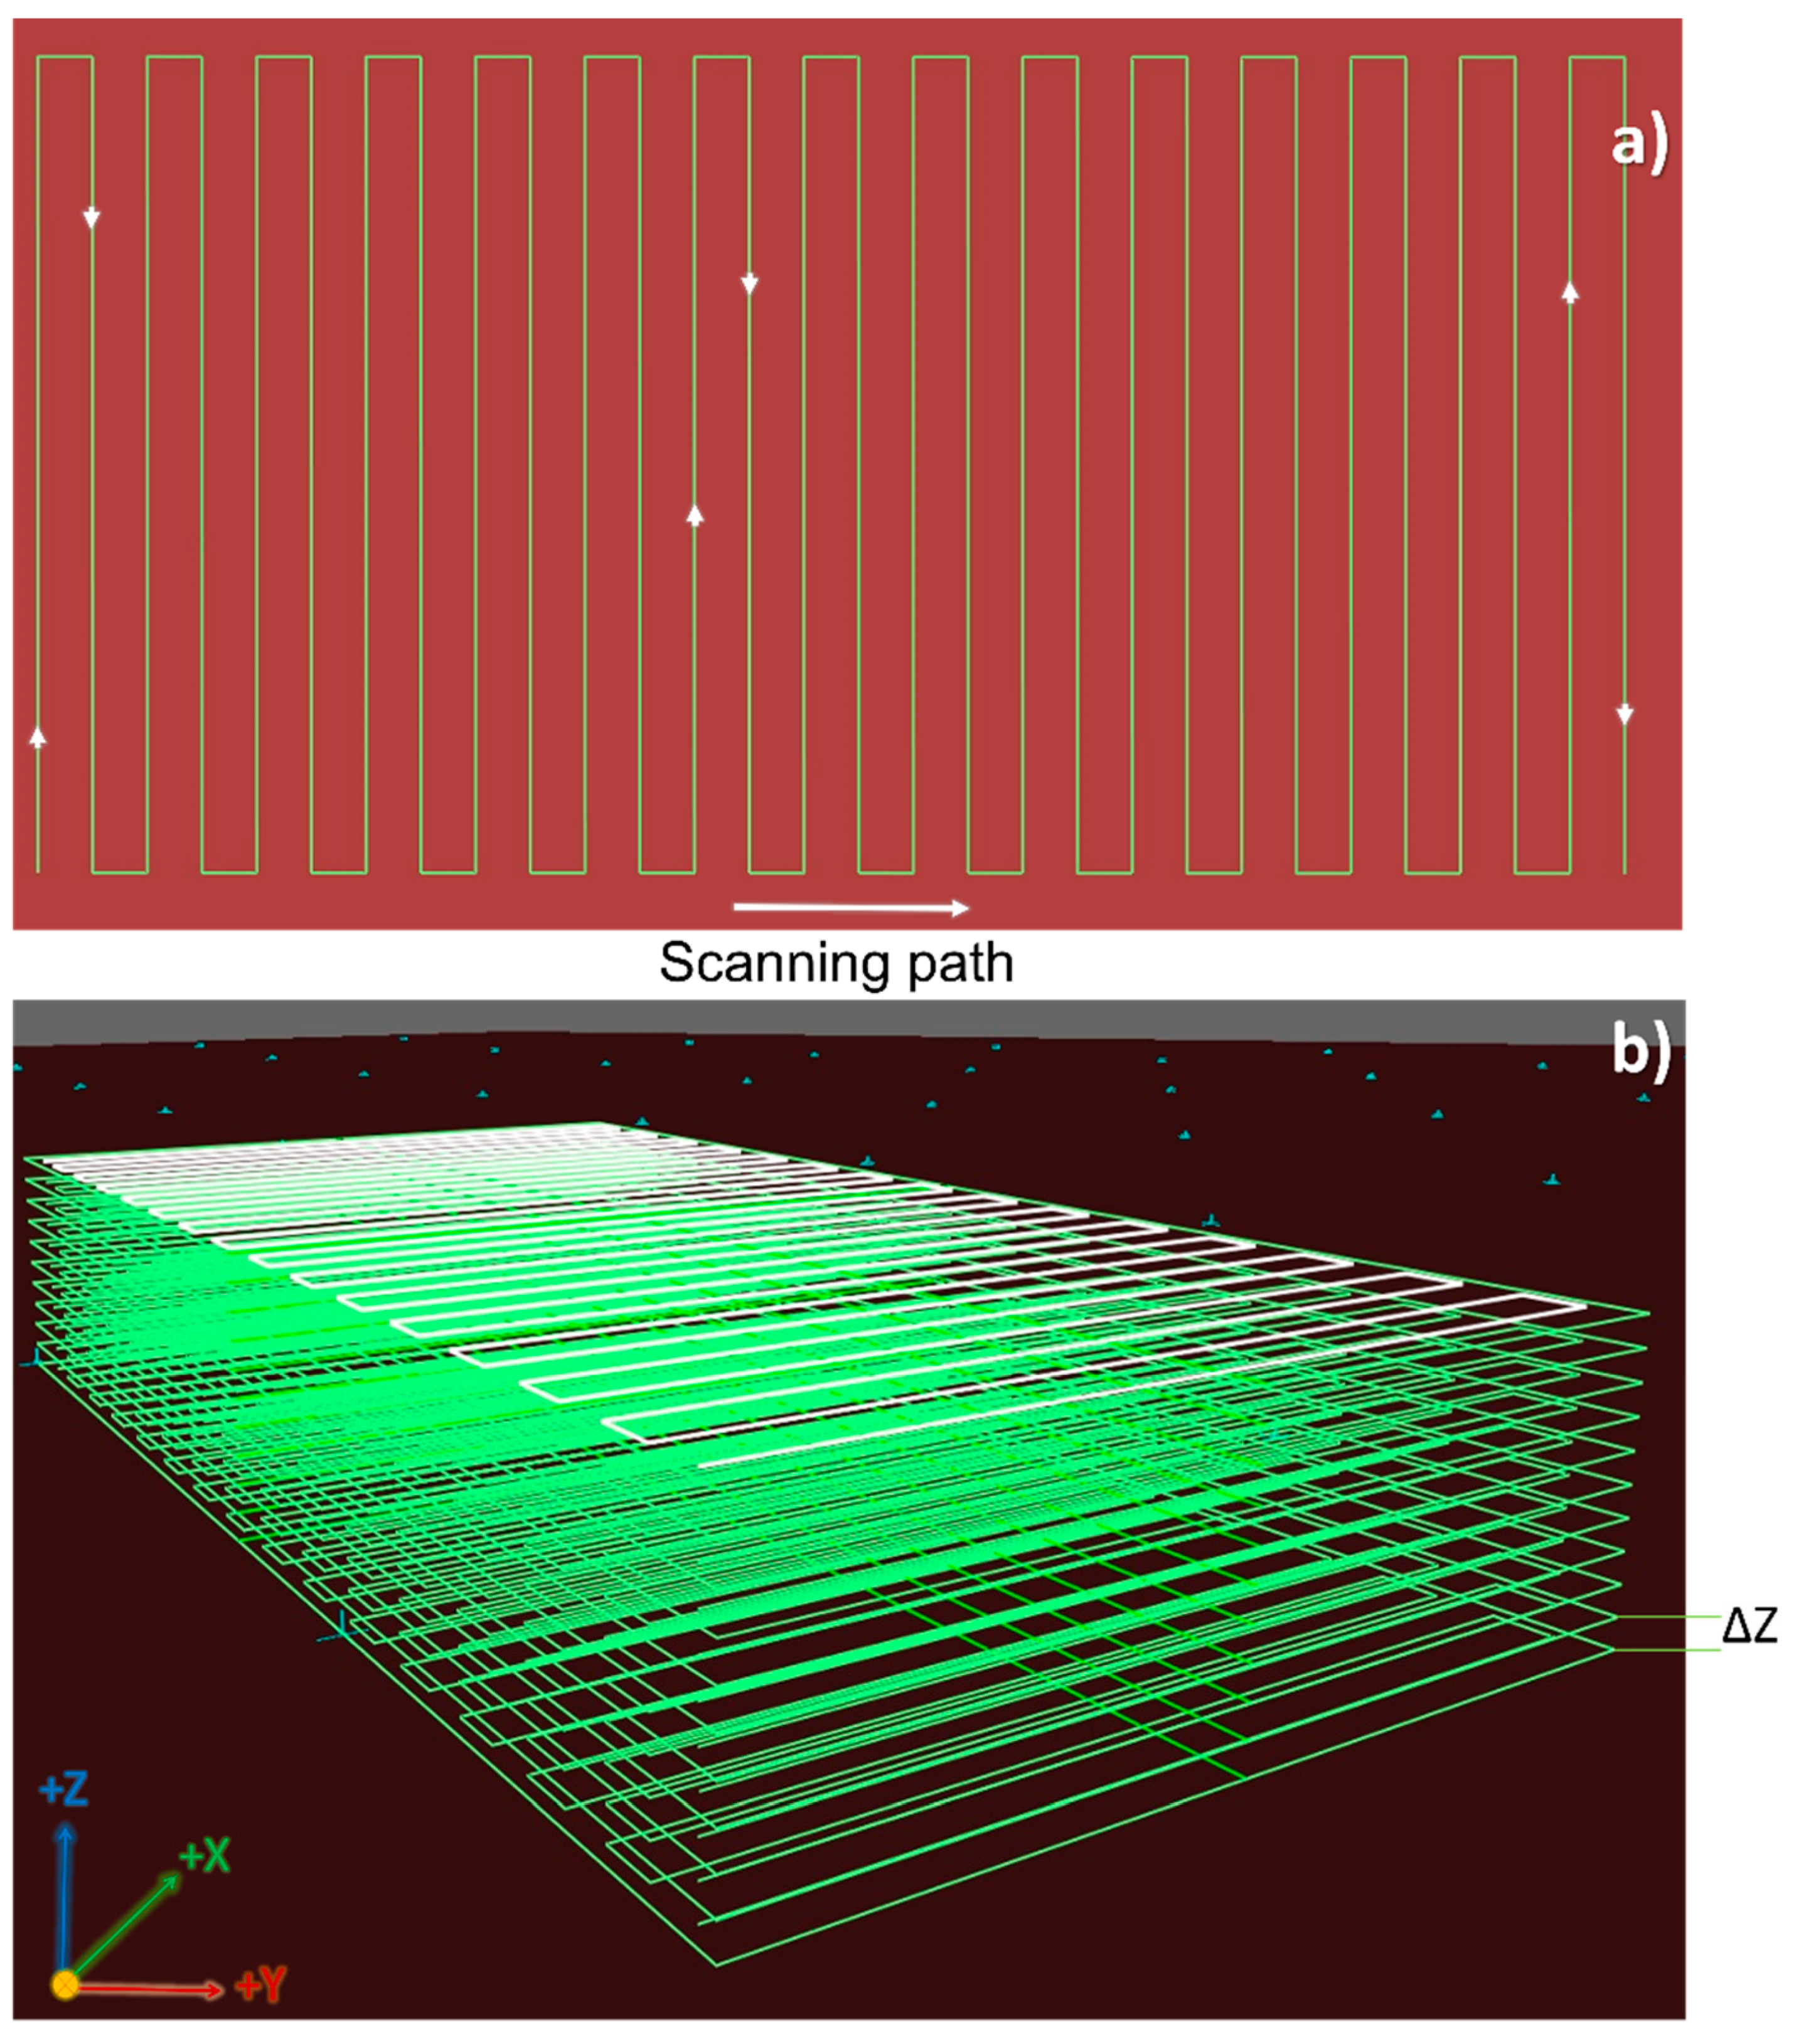
Bulk structures in shape of parallelepipeds with size of 30 mm × 15 mm × ΔZ mm (ΔZ varying function of the scanning strategy) were performed using eight different scanning patterns (Table 2). Three parameters were considered essential during scanning: laser beam path trajectory, hatch spacing and offset between meander planes (ΔZ). Laser beam path trajectory presented in Figure 2a was defined as a meander in a Computer-Aided Manufacturing (CAM) software, TruTops Cell® (Trumpf, Ditzingen, Germany). The hatch spacing and offset between planes were varied with a 0.25 mm incremental step starting from 0.5 mm up to 2 mm for the two parameters. The hatch spacing establishes the overlapping (Ov) percentage on XY-plane, while the layer height of a meander establishes the overlapping on XZ-plane, which in this case is equal with the overlapping value on YZ-plane. For all the experiments, the meander was multiplied 10 times on YZ-plane (Figure 2b). To improve the roughness of the final part, a supplemental contour trajectory was traced after each meander. The contour is enhancing the final roughness of the parts fabricated by LMD [47]. Each samples was produced in triplicate in order to provide statistical relevant results.
The Computer-Aided Design (CAD) models of the samples were designed in SolidWorks software (Dassault Systemes, Vélizy-Villacoublay, France) and subsequently imported in the CAM program, where the surfaces were vectored and the robot paths established.

2.2. Quantitative Analysis of High Resolution Computed Tomography Scans

The XCT method was applied for characterization of Ti6Al4V powder size distribution and 3D printed samples fabricated by LMD method. The XCT equipment is a custom-made system [48] and the experimental configurations were optimized in order to achieve certain requirements such as high spatial resolution for metallic powders and bulk sample analysis.
The microtomography configuration (µXCT) integrates a transmission nano focus X-ray source, a large flat panel detector with a detection matrix of 2 K by 2 K pixels and a motorized stage that allows sample manipulation on four coordinate axes (XYZƟ) [49]. Several optimization protocols were imposed in order to achieve a steady resolution of ~2 μm, validated with a micro resolution calibration grid (JIMA-Japan Inspection Instruments Manufacturers Association).
The high-power XCT configuration integrates a reflection target energetic source (up to 320 kV), a high load motorized axis, using a similar flat panel detector as presented for the µXCT configuration.
The 3D reconstructed model of the samples was obtained within the cone-beam configuration using a modified Feldkamp (FDK) algorithm. Appropriate beam hardening corrections and adaptive Gauss filtration were applied to the reconstructions. All data processing applied on the obtained 3D reconstructions were performed with Volume Graphics software (VGStudio Max version 3.4 Volume Graphics GmbH, Heidelberg, Germany).
In this paper, for in-depth powder analysis and sample validation, we applied the Porosity/Foam Analysis modules using VGDefX/Only threshold algorithm. Advanced function for surface determination that separates the material from the air with healing parameter set as “remove all particles and voids” was applied before pore analysis [50]. The program automatically assesses the gray value variation to identify pores using threshold mode that was set manually based on the maximum gray value assigned for pores. The threshold value was determined by looking in the top view section for the preview analyzed area, assuring that all pores with a size higher than eight voxels are detected. The maximum size for pore detection was set at 15 mm, in order to ensure that all voids inside the sample were identified.
The Ti6Al4V metallic powder was inserted into a carbon fiber tube and scanned at a voltage of 90 kV and a current of 110 µA. For a well-balanced reconstruction the number of acquired projections were 2400 with an equidistant rotation step of 0.15°. At a magnification of ~130 the X-ray effective beam width of 1.5 µm is well matched with the source focus size of ~2 µm.
The detection of the closed pore in the Ti6Al4V particles using the Porosity/Inclusions Analysis module and the volume classification of the Ti6Al4V particles by Foam Analysis module was performed following the same procedure described in the literature [50].
The LMD produced samples were measured at 110 kV in order to obtain optimal penetrating X-ray beam. The current intensity was set at 250 µA, thus providing the best signal to noise ratio for the implemented scanning configuration. The scanning parameters for a well-balanced reconstruction were: 1800 projections (0.2° increment) and a magnification of X40 resulting in a ~13.8 µm effective beam width. For an easier identification of XCT parameters in case of powder and bulk they are gathered in Table 3.
In both types of measurements, the Ti6Al4V metallic powder and the LMD produced samples, the X-ray beam was filtered by a 0.5 mm thickness Cu foil. In all XCT scanning experiments the total measuring time was kept around one hour by collecting images of two averaged frames of maximum one second integration time.

3. Results

3.1. Micro-Scale Characterization of Ti6Al4V Metallic Powder

After conducting the XCT reconstruction, the metallic powder was analyzed using the pore module analysis of the Volume Graphics software. The pore processing module is only suitable for particle embedded pores. The gas including pores are easily trackable due to their high sphericity.
A preliminary analysis of the closed pores inside of the Ti6Al4V particles from the commercial powder was performed. One could observe in the front view slice (Figure 3a) the shape variation and the presence of fully embedded pores with diameters of up to 50 µm. In the partially transparent 3D reconstructed image (Figure 3b) one highlights the presence of particles with closed pores in the Ti6Al4V metallic powder.
We mention that besides the fully embedded pores, there are also partially embedded ones and all of them can induce gases when molten, with significant probability of causing visible defects in the structure of the final product [50].
However, our analysis revealed that porosity in the powder material was negligible. From a total of 5104 analyzed particles only 91 displayed internal pores (counting for less than 2% of the particles).

3.2. Scanning Strategy for Porosity Removal

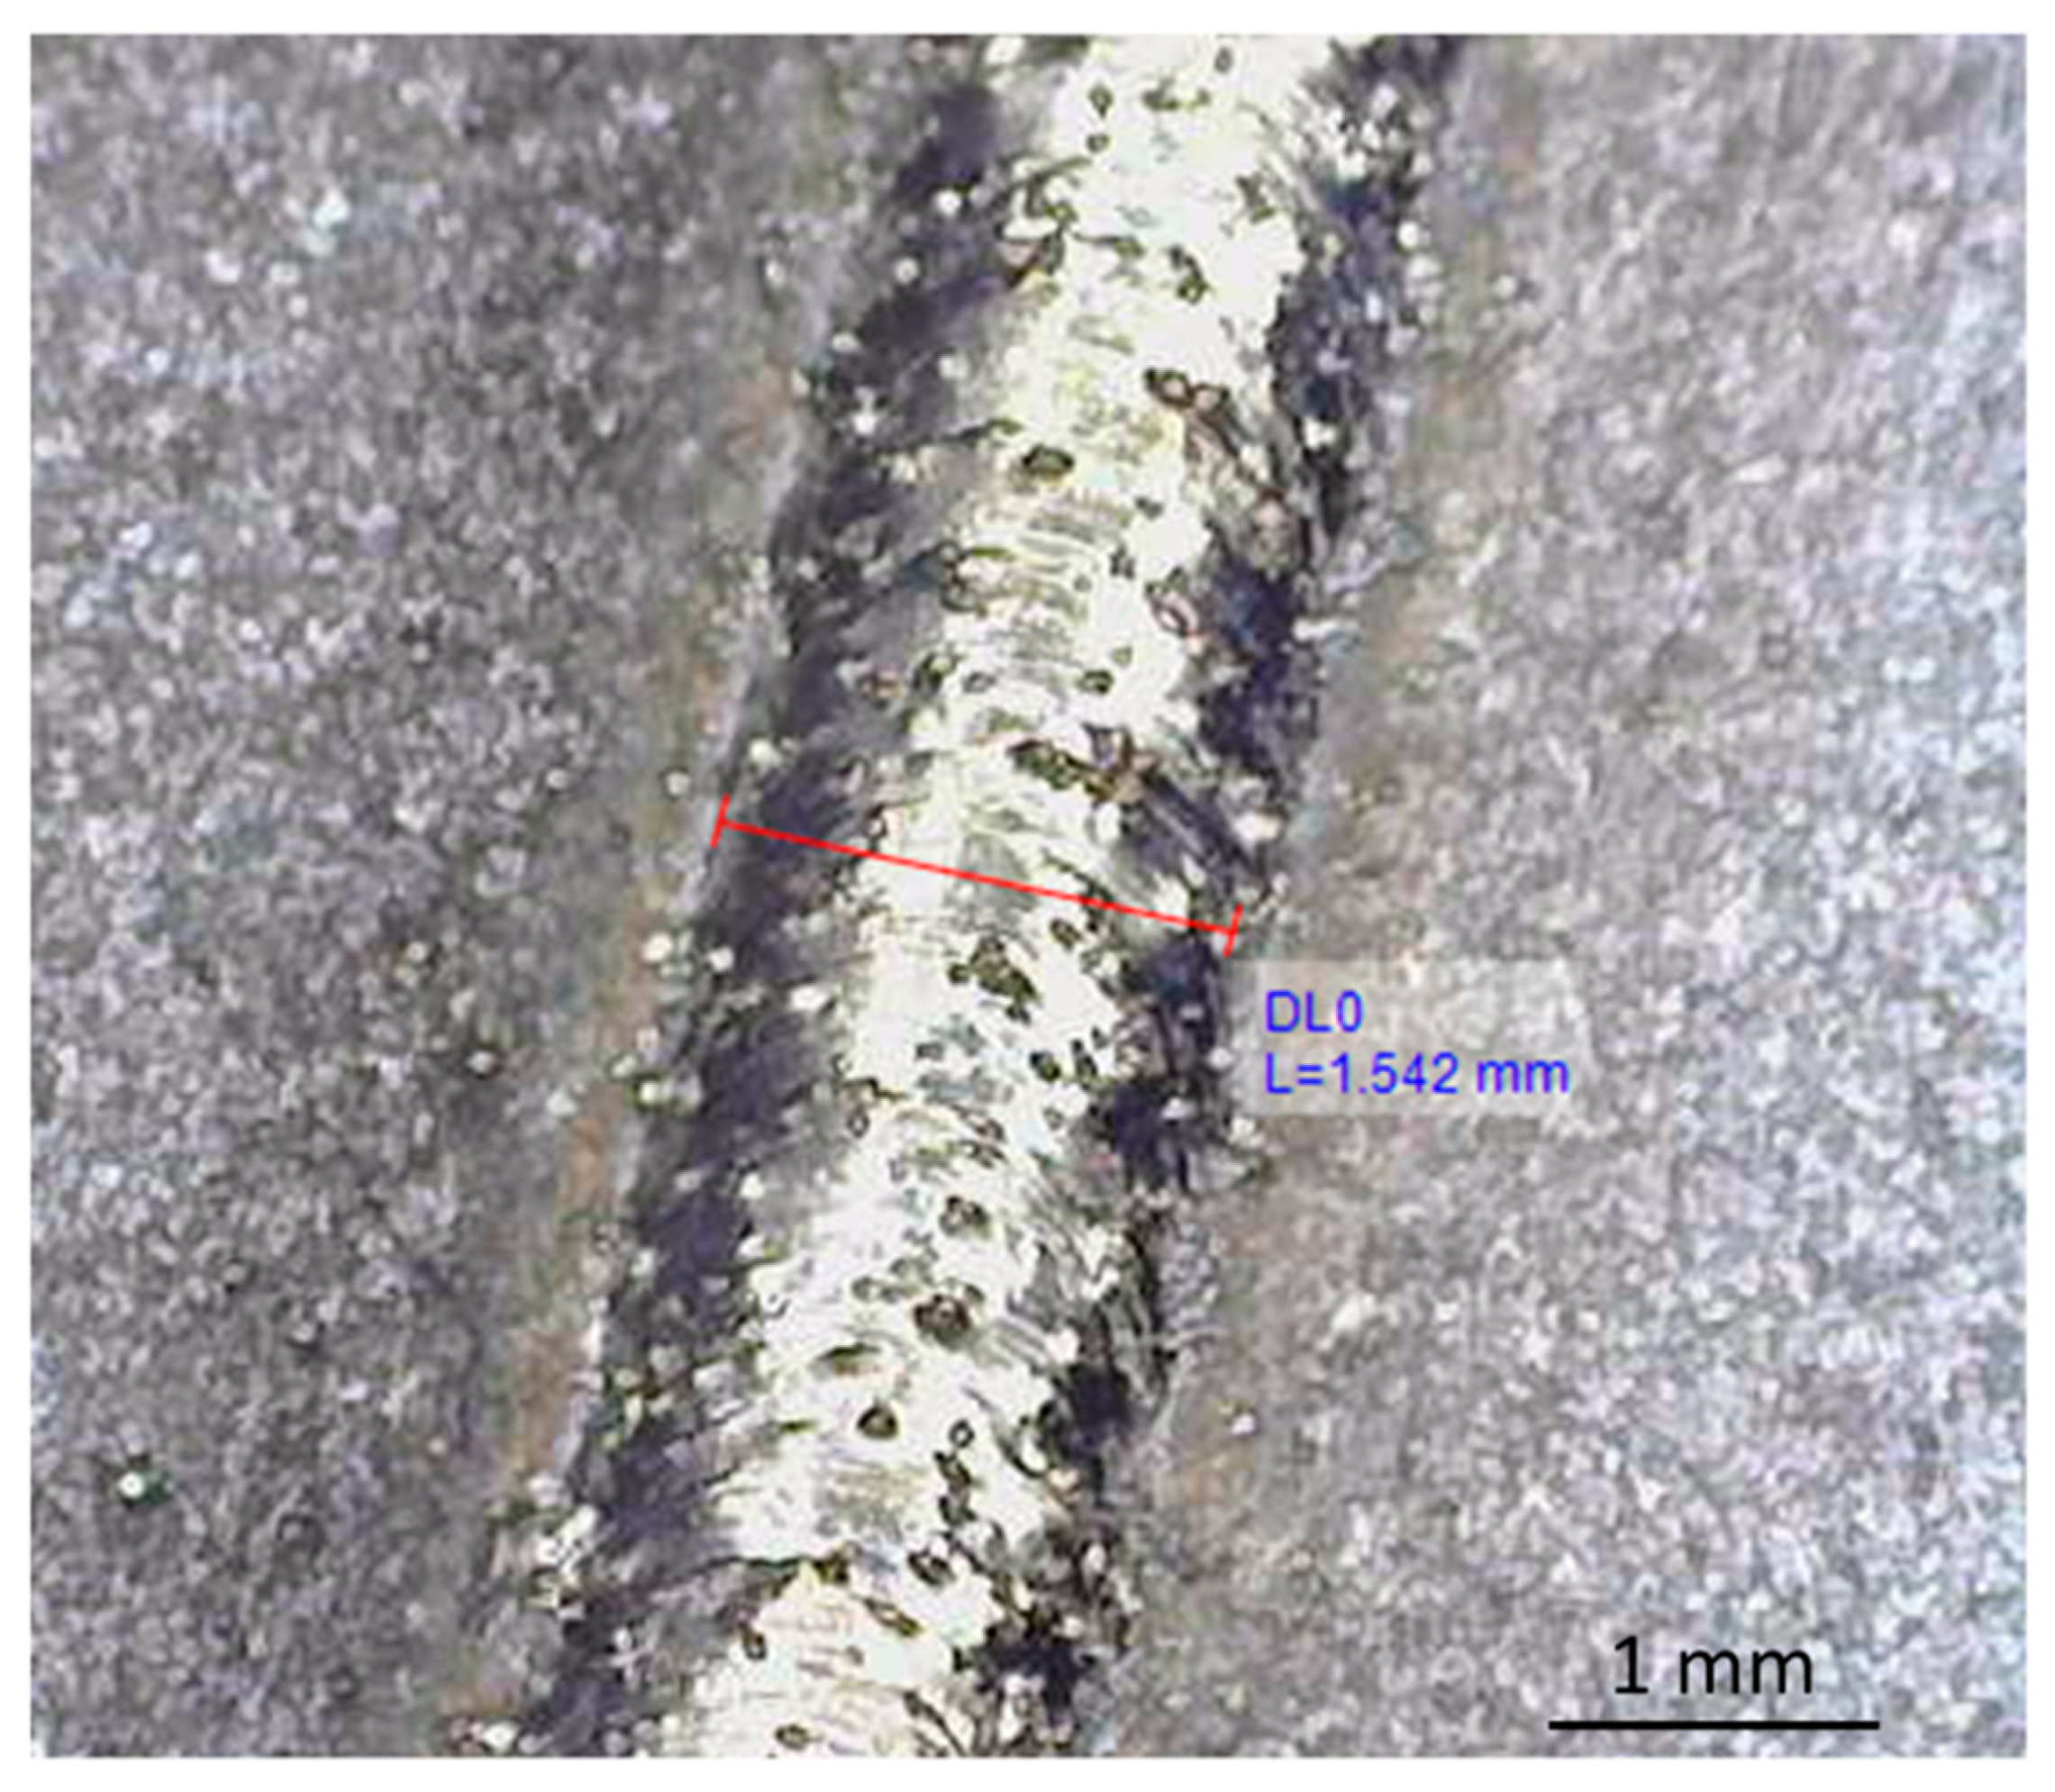
Figure 4 shows an optical microscopy image of a single line deposited by LMD using the optimized conditions specified in Table 1. The deposition is uniform, the borders of the line are parallel and the residual material deposited around the line is low. More details on the process of scanning and laser parameters can be found in Reference [47].
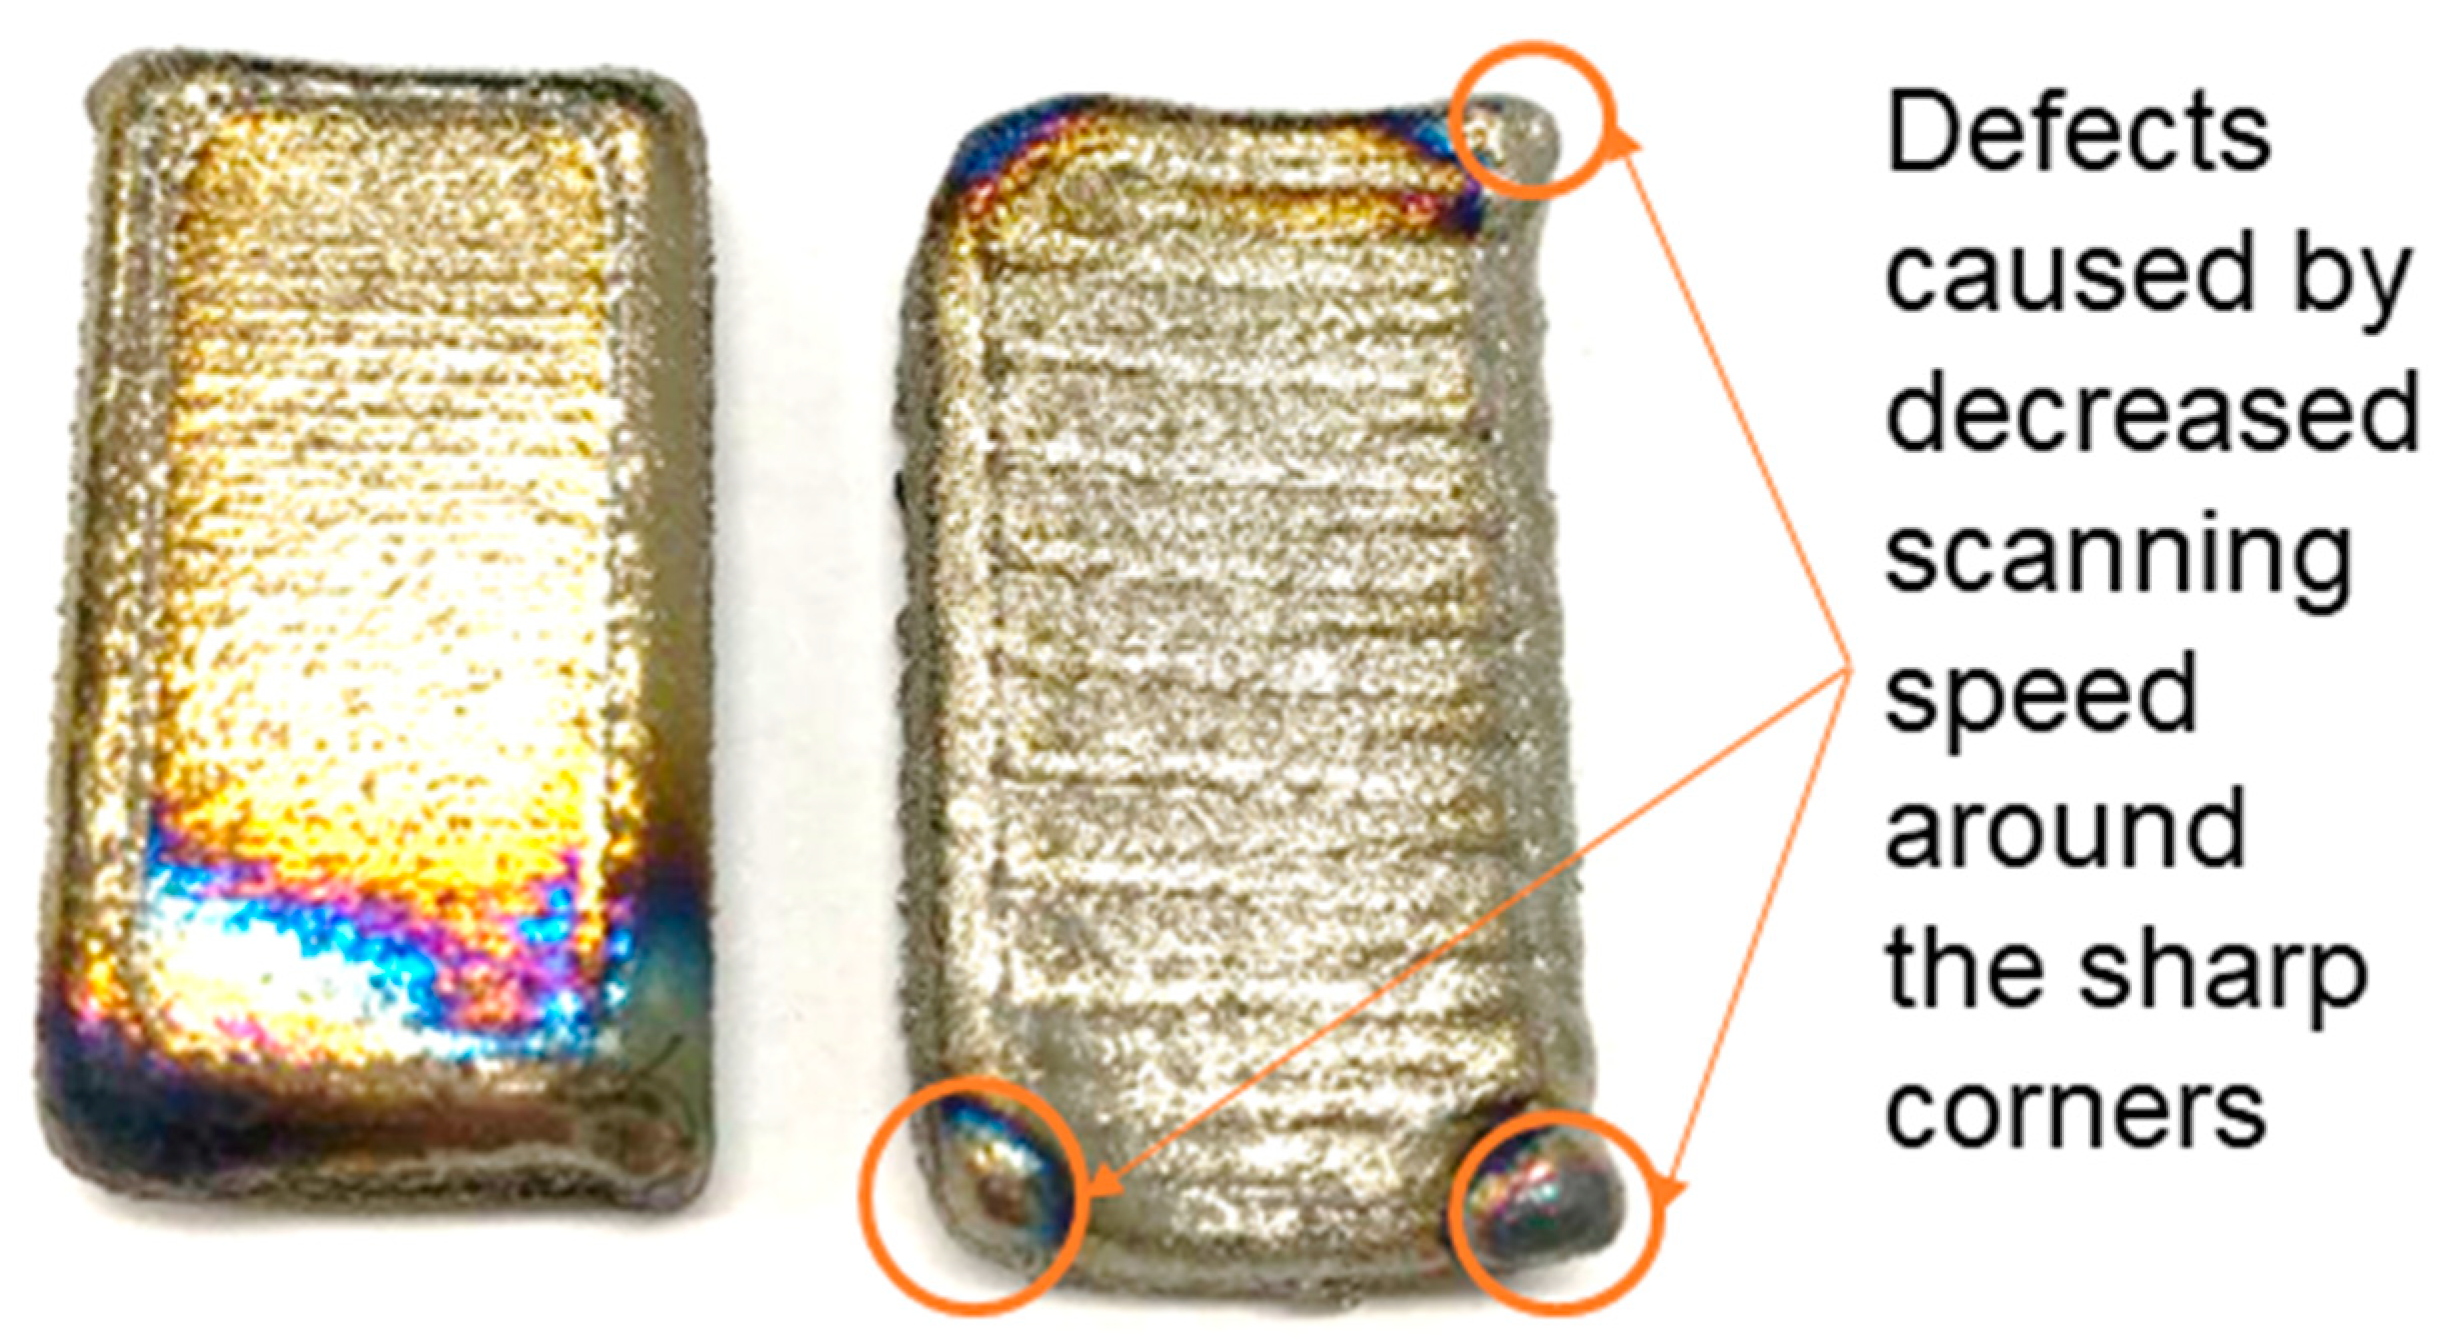
Two different quality samples obtained with the conditions given in Table 2 and with a changed meander trajectory between them, are shown in Figure 5. It can be observed from the picture that the area around the corners is higher for one of the samples. This excess of material is due to the decreased scanning speed around the sharp corners, which leads to increased heat input per unit time. The slower deposition speed due to deceleration around the sharp edges was investigated and explained by D. Thakkar et al. [51]. They found that by adding a small rounding on the corners, the scanning speed remains constant, which leads to uniform energy distribution and homogenous microstructure.
After experiments, the height of the bulk structures was measured in three different points, then the mean of these values was calculated and compared with the theoretical height (Table 4) obtained from the offset between meander planes (set in TruTops Cell) multiplied by the number of planes. In addition, we calculated the overlapping on XY-plane and error percentage (Equation (1)) to evaluate how the scanning strategy affects the height of the final samples.
δ = | v E v T v T | × 100 %
where δ = percent error, v E = experimental value measured, v T = theoretical value.
The minimum error was obtained using 1 mm hatch space and 1 mm offset between meander planes. In this case, the theoretical value was 10 mm and the experimental value was 9.02 mm. It is important to keep the standing off distance constant, otherwise the laser beam and the powder spot will be defocused, thus directly affecting the quality and dimensions of the final part.

3.3. XCT Examination of The Bulk Samples Manufactured by LMD

Samples produced with the scanning strategies described in Table 2 were XCT scanned in order to identify defects that occurred during deposition. We added a paragraph on page line. The samples were aligned with respect to the X-ray tomography system by placing the substrate interface parallel to the detector and the long side along direction of rotation. In other words, the Z axis from the sample coordinates is perpendicular to the X-ray detector.
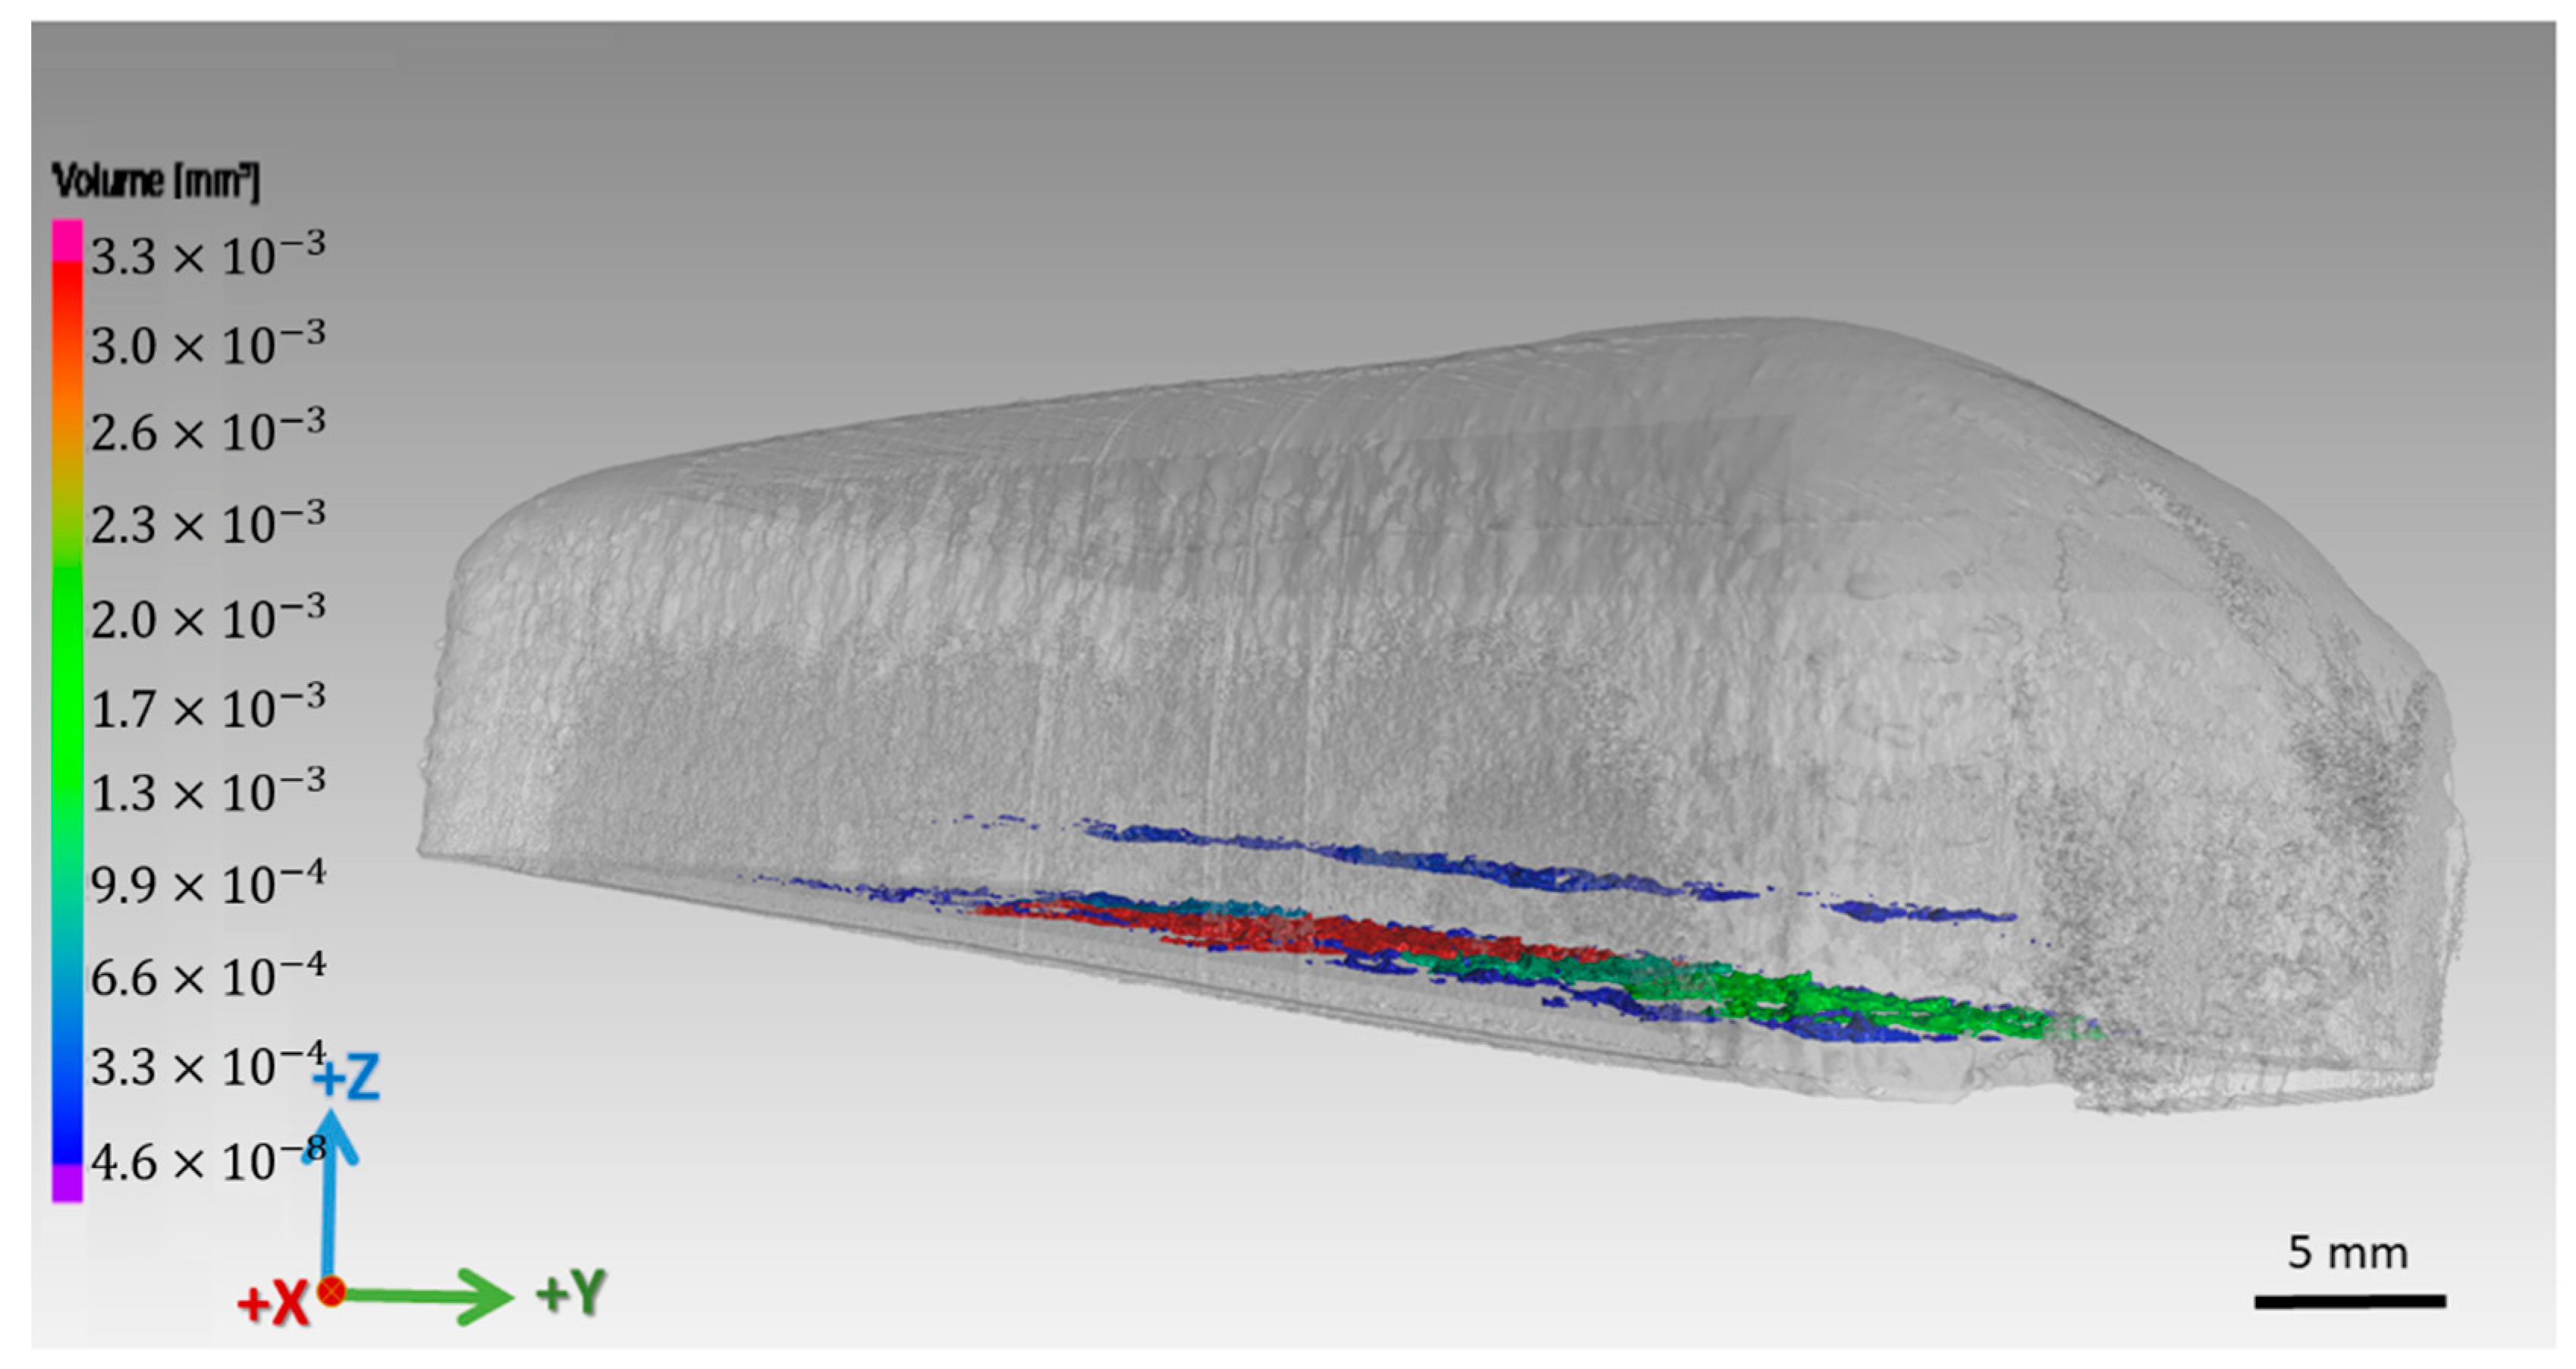
The appearance of pore clusters is more probable among first several deposited layers that are nearest to the substrate (low ΔZ value). The thermo-dynamic stability is improving as the layer grows on the Z axis. Figure 6 shows the preferential pores positioning in a LMD deposited sample, scanned by XCT.
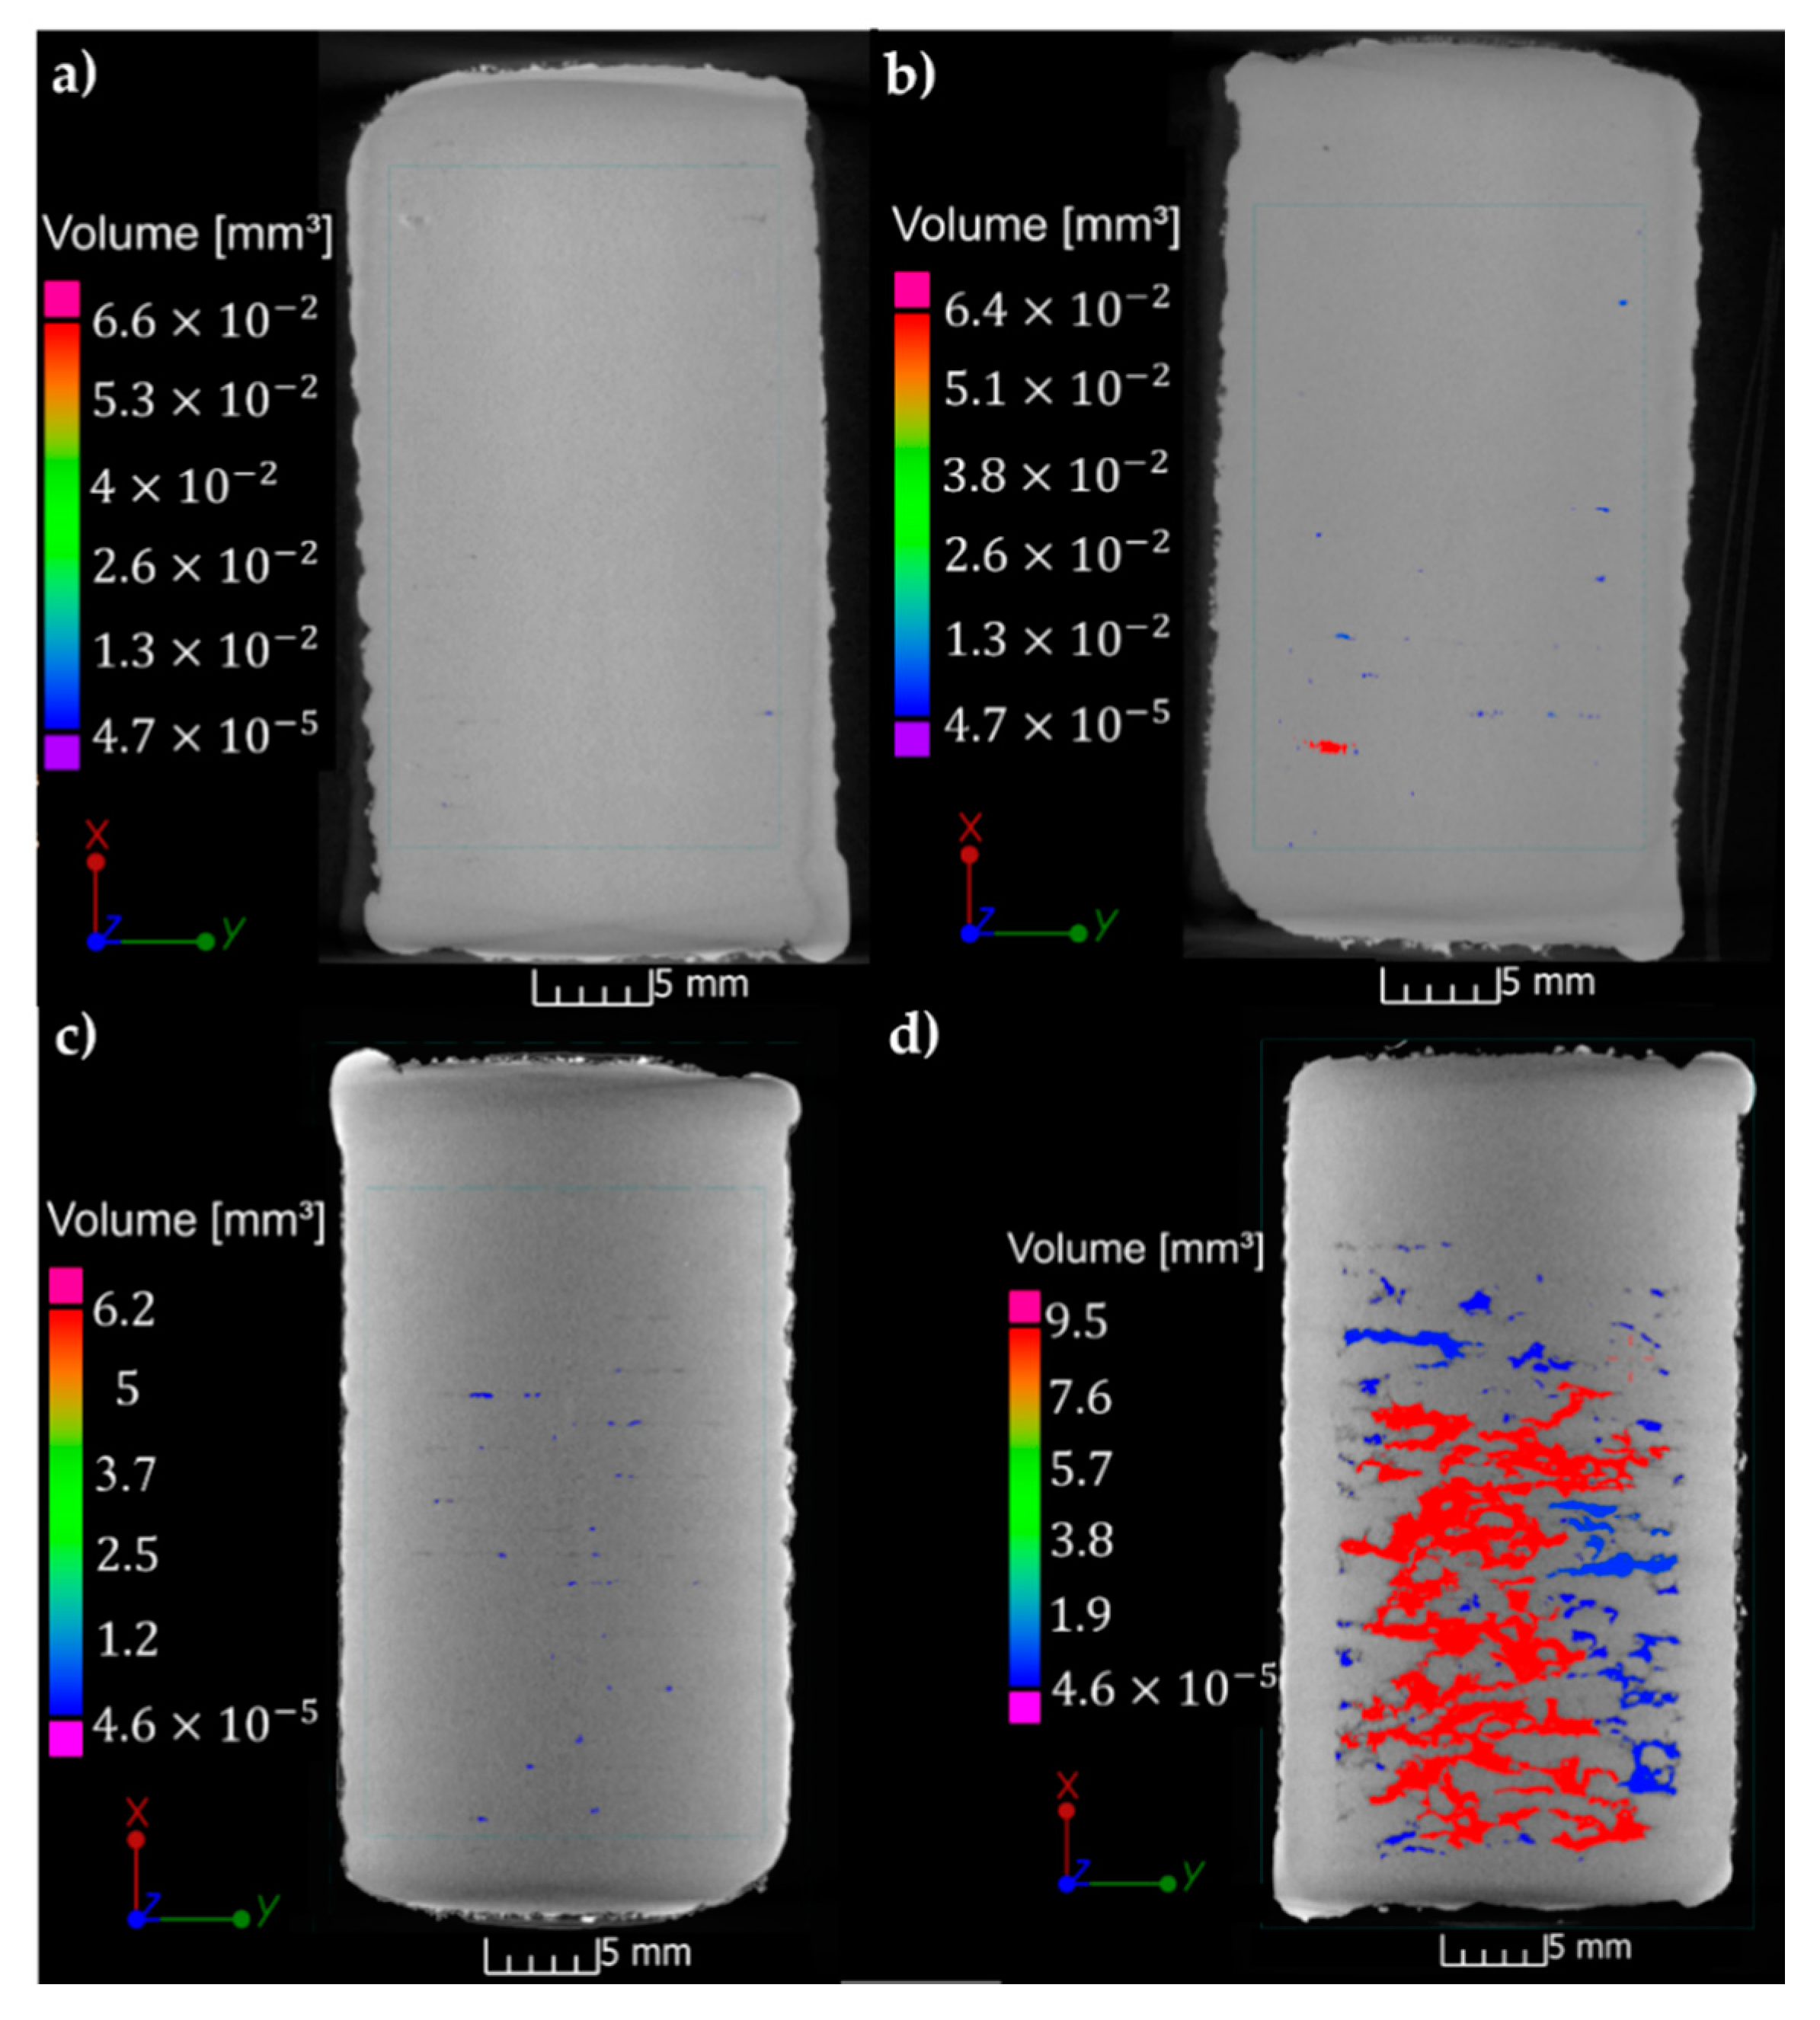
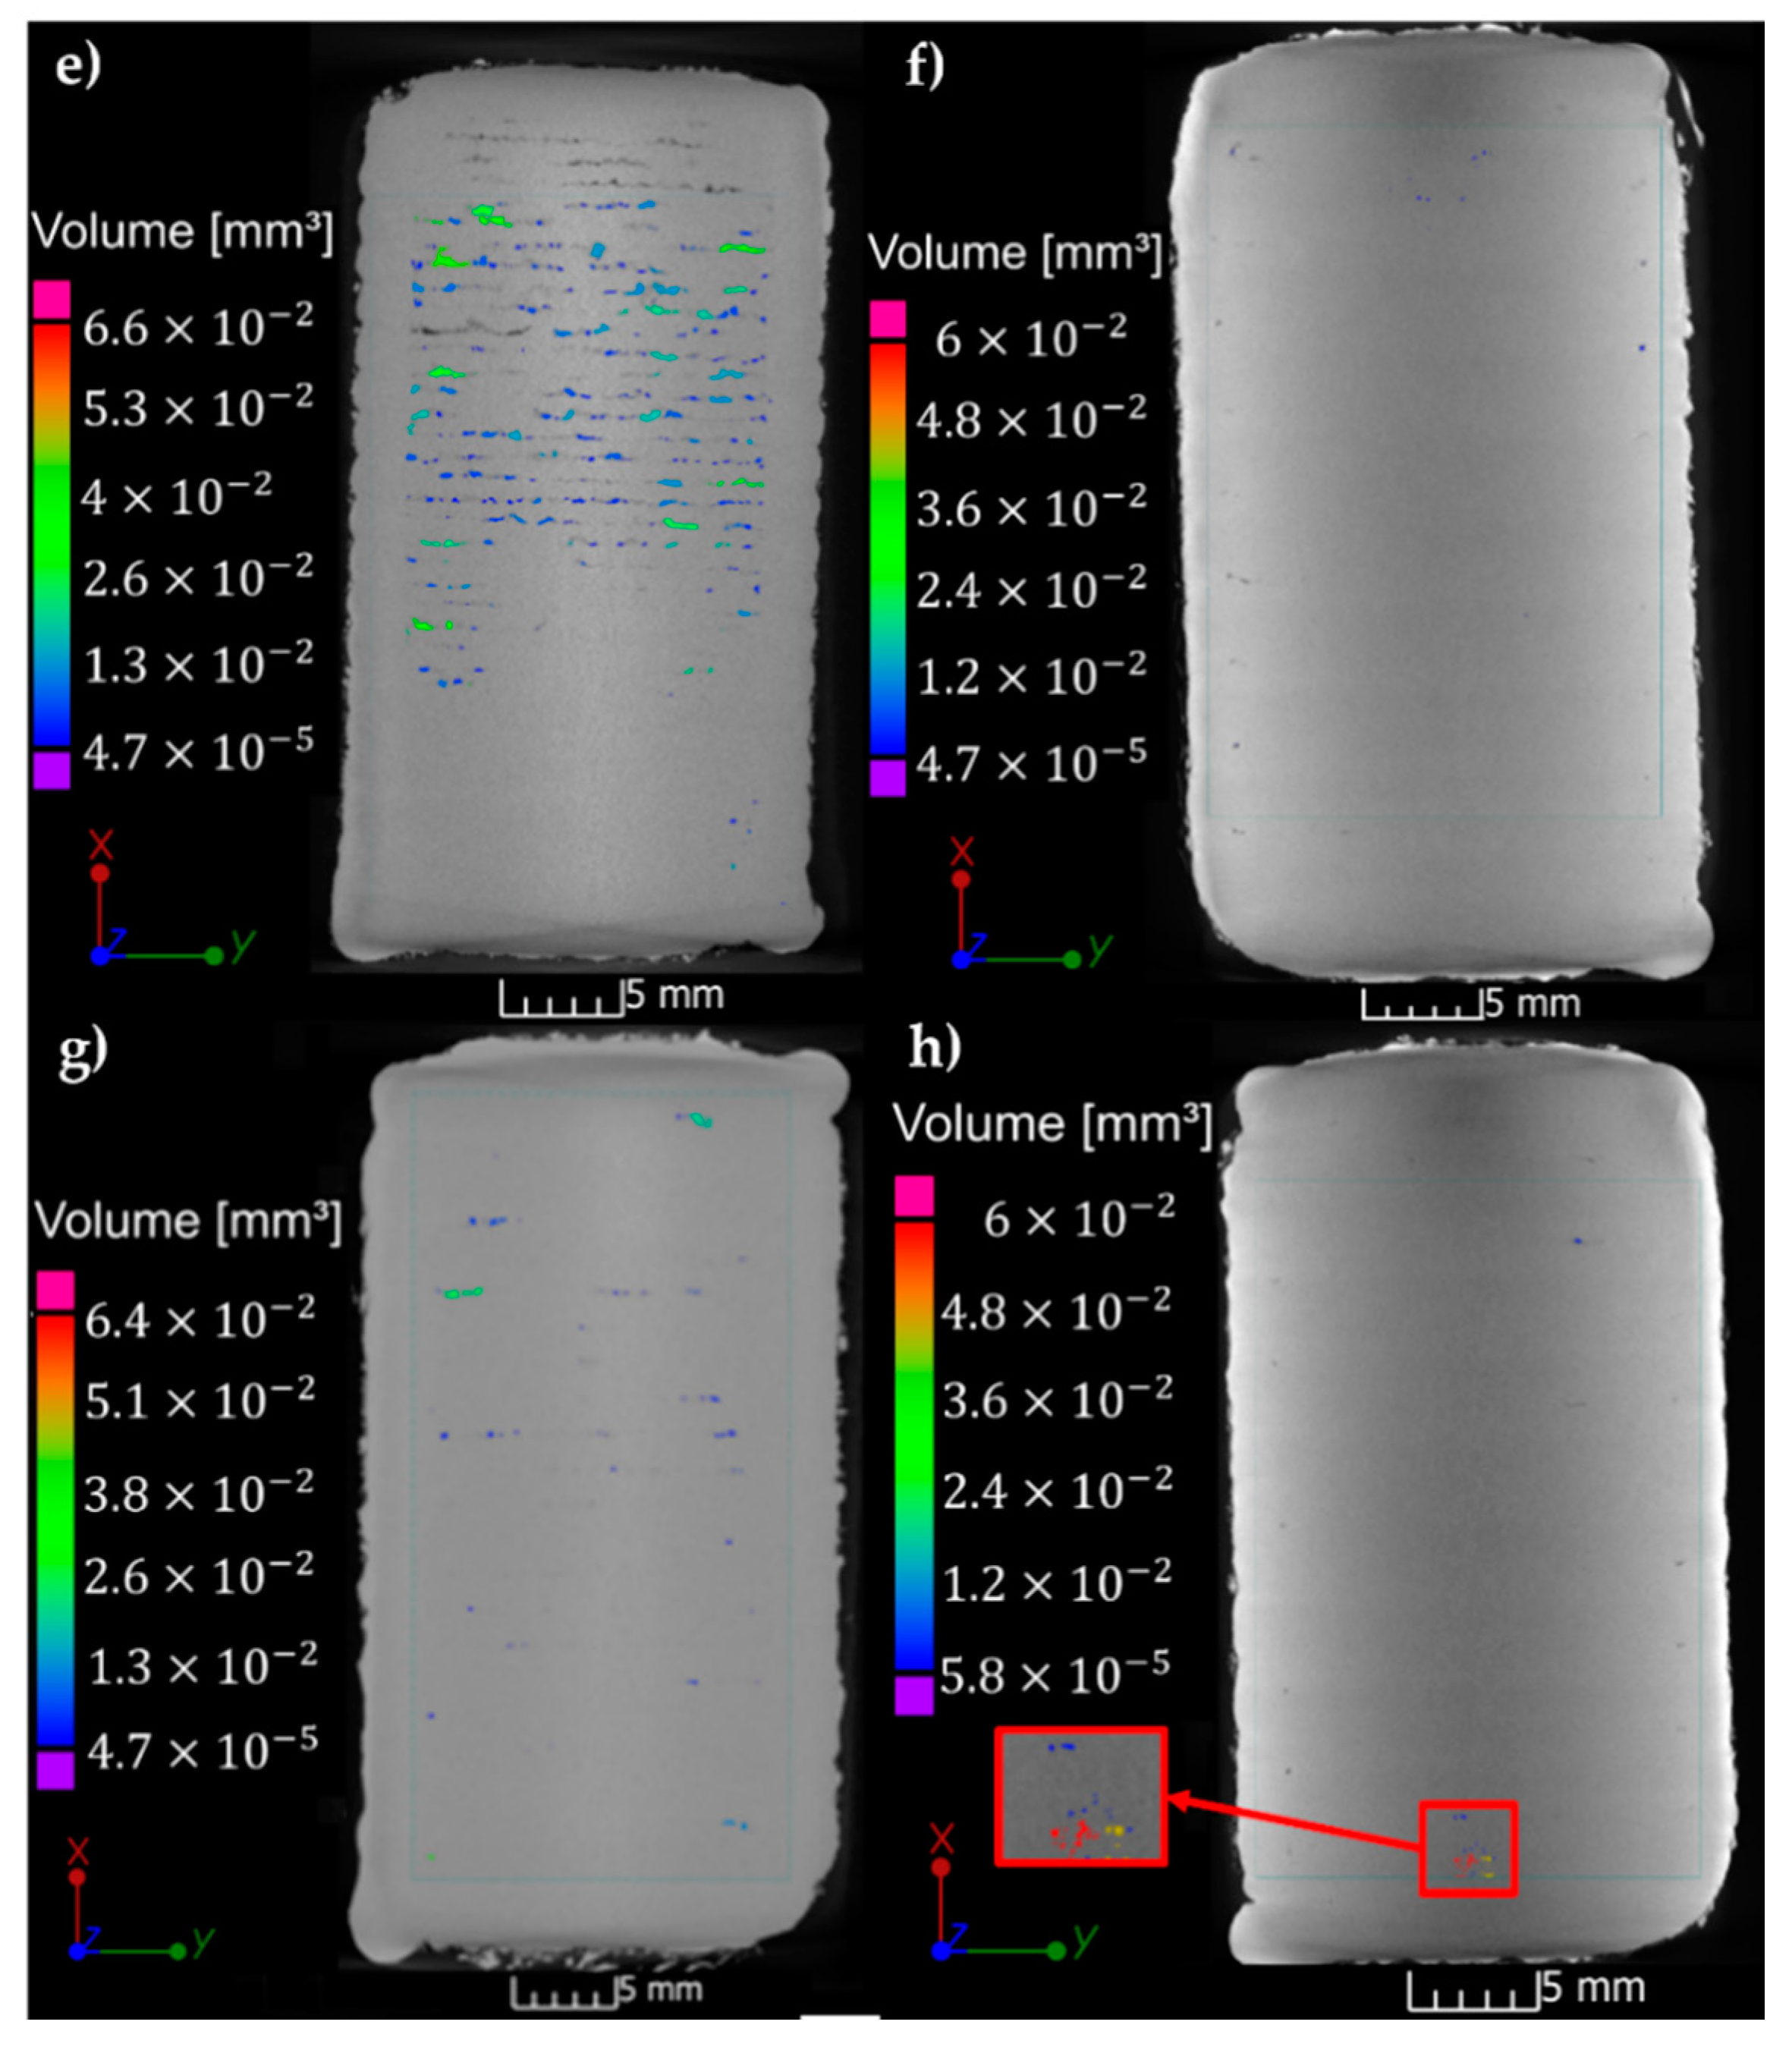
For a better overview regarding the present defects, we extracted a XCT slice from each sample reconstruction in the XY-plane, where the isolated or cluster pores are the most visible (Figure 7).
The voids were the only defects identified in the bulk of the deposited samples. No inclusions of higher density were detected as expected since they are absent in the powder as well. Therefore, the porosity was calculated based on Equation (2) and the determined values are presented in Table 5.
P o r o s i t y = T o t a l   d e t e c t e d   d e f e c t   v o l u m e T o t a l   s c a n n e d   v o l u m e
Because the samples were uneven in terms of thickness the porosity values were normalized and expressed in percentages in order to be able to compare them.
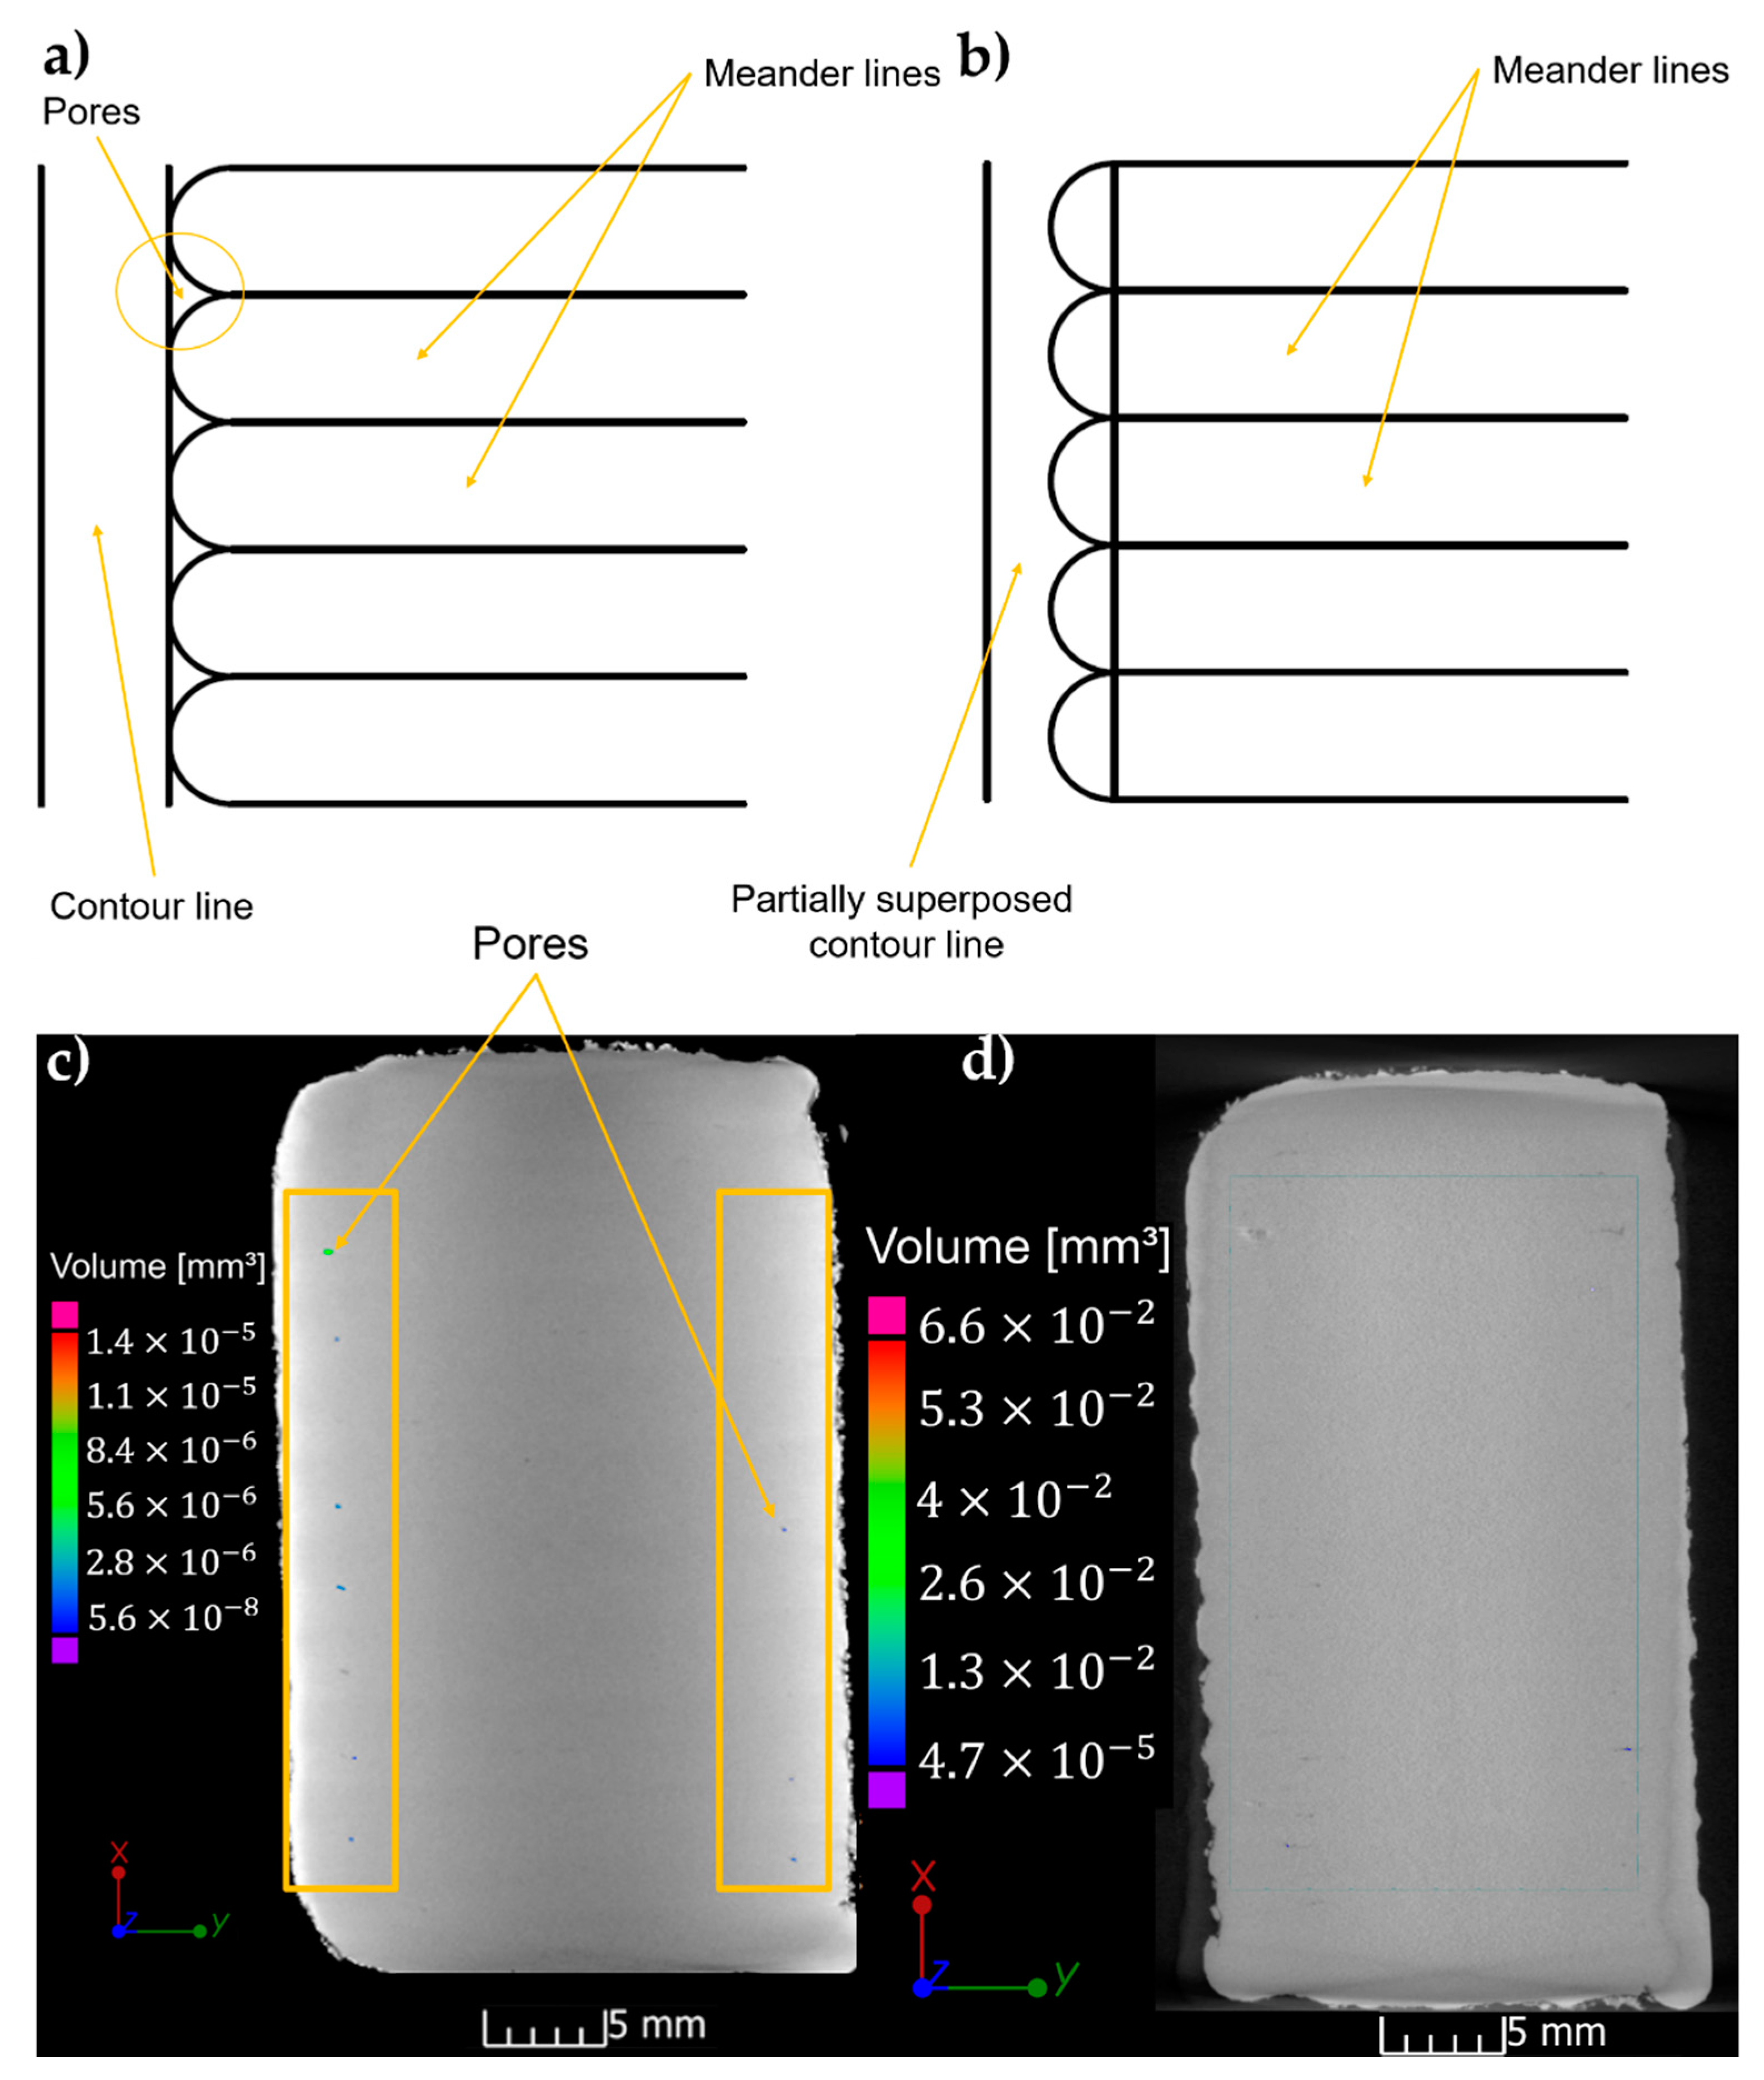
Besides samples S4 and S5 which displayed 0.54% and 0.12% porosity, all other scanning strategies with optimized deposition parameters proved efficient for deposition of structures with low number of defects. The porosity in case of samples S1–S8 (except S4 and S5) was less than 0.1%. We note that specifically for the analyzed planes in which the defects are concentrated, the porosity has higher values that are specified in the last line of Table 4. Thus, for the most porous samples (S4 and S5) even though the porosity of the whole samples is ∼0.5%, locally, in the areas where the pores are concentrated, it reaches ∼50%. 3D rendering for the most defective sample (S4) provides us the distribution of pore clusters that are parallel with the XY-plane (Figure 6). Analyzing the µXCT of sample S4 (Figure 7d) it becomes clear that the defects align along the scanning direction. The pores interconnect and form elongated voids of ∼10 µm to 1 mm. By comparing the µXCT of samples S4 and S5, one can see that sample S5 (Figure 7e) displays significantly lower number of defects as compared to sample S4 (Figure 7d). The defects maintain the same tendency to align along the scanning direction, but they are generally spherical and their number is lower. The only difference between the scanning strategy of samples S4 and S5 is the hatch spacing. In case of S4 it is 0.5 mm and for S5 it is 0.75 mm. Indeed, when increasing even more the hatch spacing to 1 up to 1.5 mm the defects are reduced even more. A suggestive example is sample S7 (Figure 7g) that was produced with a hatch space of 1.25 mm between lines and the distance between planes of 1 mm. The sample displays defects that are aligned to the scanning direction in form of parallel lines made of interconnected pores. The defects volume is significantly reduced as compared to sample S5 (Figure 7e) for a small increase of hatch spacing of 0.5 mm and offset between meander planes of 0.25 mm. The next step was to increase the hatch space to 1.5 mm (Figure 7h). Again the sample’s quality improved. Only two remaining areas of interconnected pores were visible, with much diminished length of ∼300 µm. Besides these lines, only a few isolated pores of spherical shape and ∼30 µm diameters were identified in the bulk of the deposited sample. If the hatch spacing is maintained to 1.5 mm and the offset between planes is set to 0.5 mm (Figure 7c) the pores disappear almost completely from the bulk of the sample. There are a few isolated polyhedral pores with length of ∼20 µm at the borders of the sample in the area were the supplemental lines for contour were traced. In Figure 8a we present a sketch that explains the most probable cause of porosity at the borders. Basically, the “U” turns of the meander at the borders of the sample leaves some small voids, as shown in Figure 8a. If the contour is traced according to the technical drawing, these voids will remain unfilled or will be partially filled. The solution in this case is to translate the contour line by 0.5 mm in order to completely cover the voids (Figure 8b). µXCT was extremely useful in assessing non-destructively the pores location and in indicating the necessary offset of the contour line toward the sample bulk. Figure 8c,d present in detail the area close to the border of the sample without and with offset of the contour line. One can clearly see that when offsetting the contour line, the porosity is completely eliminated.
Table 4 shows the variations of the deposited the sample’s height function of the hatch spacing. The closer the lines of the meander in respect with each other the thicker is the deposited layer. Thus, for a sample produced of 10 layers with a hatch spacing of 0.5 mm the sample’s height was of ∼12 mm, while a similar sample produced with a hatch spacing of 1.5 mm had a height of ∼6 mm. The orange line corresponds to the theoretical height of the samples. It does not vary with the hatch spacing, as the offset between meander planes was selected to be in all cases of 1 mm. However, in practice the sample’s height drastically varies with the hatch spacing. One can deduce that no sample’s height matches the theoretical height value of 10 mm. Therefore, knowing that hatch spacing of 1.5 mm produces samples without internal defects, we kept this parameter intact and started to vary the distance between planes in order to match the experimental height with the theoretical one. We produced samples with plane distances of 1, 0.75 and 0.5 mm. It became obvious that the distance between planes in the range of 0.5 mm does not affect the quality of the produced samples. In all cases, the samples were free of pores or other internal defects. However, the offset between meander planes affected the height of the manufactured samples. A very close match was obtained for a hatch spacing of 1.5 mm and an offset between meander planes of 0.5 mm (Figure 7c).

4. Discussion

Ti6Al4V was selected for this study due to its applications in medicine and aerospace industry. Implants and prostheses are presently produced in several fixed sizes that are adopted for various types of patients and wounds. 3D printing can revolutionize implantology by manufacturing of personalized medical devices specifically designed for treating a patient’s particular wound. Both for implants and aerospace industry the reduced weight and adequate mechanical properties are of high importance. Even if titanium has a reduced weight compared to other industrial metals and alloys, this can be further improved by replacing parts of the bulk via a lattice structure that can be easily obtained by 3D printing.
3D printing of metals can be the most commonly achieved by SLM and LMD. The technique are complementary as SLM produces finer parts with larger resolution, but reduced size as compared to LMD. Moreover, LMD is a more versatile technique, allowing for manufacturing of multilayer structures or parts with gradient composition.
As shown in the results section, the scanning strategy plays a determinant role on the quality of the LMD deposited sample.
In all cases, using a mix of experimental conditions that we optimized in time and changing the scanning strategy, allowed for a small degree of porosity, of maximum 0.5%. In all cases, porosity was concentrated close to the interface between deposition and substrate.
This preferential positioning of the pores has been also observed by other research groups and was attributed to the incomplete stacking of the layers, caused by non-molten powders. After deposition of a few superposed layers, the substrate temperature is of the order of hundreds of degrees and the scanning laser beam adds more heat that will completely melt the powder [34,52,53]. After the critical area is surpassed, the growth of material is smooth and free of defects.
Two types of pores have been identified:
(a)
The pores in the bulk of the material, which are due to the use of a high energy density and slow scanning speed that create local vaporization. During rapid solidification of the material, the gases are trapped into the bulk in form of circular pores. The reason for the pores to be oriented along the laser scanning direction is that the liquid tends to flow oppositely to the laser movement and the gases will be trapped along this direction when the liquid solidifies. The pores can be isolated or they can form a necklace of adjacent voids. In case of high overlaps, the necklace of pores can be remelted and the gases gather in large polyhedral voids. During LMD deposition with high overlaps, real interconnected networks of cavities can be created by successive melting and solidification of material. A relevant example is Figure 7d. Overlaps of 70% or more between the meander lines are therefore not suitable for depositing quality samples by LMD. Apparently, a hatching superposition of 60% or less influence only the built height, but not the quality of the deposition. In our case, overlaps less than 60% between the hatching lines produced samples with very low porosity (0.0002–0.005%). However, the possibility of pores with size less than 13.8 µm should not be ruled out as the XCT cannot identify them.
(b)
Pores caused by incomplete seam between the bulk layers and the contour layer. The fact that we use a meander trajectory to deposit our layers leaves at the borders some non-uniformities. The contour layer aims to fix them; however, if it is not superposed over the initial border, some voids can remain after contour solidification. The solution to remove them is to fill them with material by superposing part of the contour line with the border of the meander (Figure 8c).
Pores trapped in the volume of material can create stress concentration centers that in time might generate fractures in case of highly solicited parts. Therefore, the elimination of pores or their drastically reduction is e prerequisite in numerous quality control procedures.
XCT is an excellent non-destructive tool for assessment of pores, geometry and location. The custom proprietary built XCT set-up integrates a high penetration power X-Ray source and is applicable as metrological analysis tool for large and thick bulk samples from elements with high atomic number. The drawback as compared with metallographic techniques is that it is limited by the voxel size in identification of pores and it cannot provide quantitative data on their size. In our case, the minimum voxel was a cube with the side’s length of 13.8 µm. Therefore, pores with smaller diameters than 13.8 µm will be hardly visible by XCT. For our study, the technique was however extremely useful, as it drastically reduced the analysis time to hours instead of days or even weeks of samples’ preparation and analysis by metallographic techniques. It has to be mentioned that by reducing the analyzed area the voxel size is decreased and thus the resolution of the method increases. A compromised has to be reached between the analysis time and the resolution to be achieved.
The best conditions to obtain defect-free bulk samples are not necessarily the best conditions for printing a 3D part. It is highly possible that with the best conditions for defect-free samples to obtain a mismatch in dimensions (especially height) between the CAD model and the actual printed part. Our solution was to keep constant the optimal process parameters for a single line and the hatch superposition, in order to obtain defect-free samples. Next, we varied the offset between deposited planes in order to achieve the match with the CAD file.
Alternative solution to non-destructive monitoring and parameters tuning would be to accept samples with certain degree of porosity and to apply a post-processing heat treatment with hot isostatic pressing (HIP). Using HIP post-treatment, the porosity percentage decreased from 0.08% to 0.01% [54,55]. However, with our solution, the percentage of porosity was an order of magnitude lower.
The parts quality monitoring technique by XCT is not limited to the LMD method or to the material used in this manuscript. It can be useful for assessing defects in metallic samples with sizes of tens of centimeters obtained by casting, powder metallurgy or 3D printing by laser or electron beam [56]. The technique is also compatible with the most common metals used in metallurgy, so it can cover a wide range of applications.

5. Conclusions

A quality improvement study for Laser Melting Deposition of Ti6Al4V parts was undertaken in order to completely eliminate internal defects. X-Ray Computed Tomography proved to be an invaluable tool for non-destructive characterization of the bulk for defects assessment. We started from a set of laser and scanning parameters that were considered the best for tracing single lines (good definition, uniform deposition, minimal unmolten powder around deposition) and conducted a study on the influence of hatch spacing and distance between deposition planes on internal defects in the obtained samples. All obtained samples were scanned by XCT and the porosity was evaluated. The main results can be summarized as follows:
  • Two types of pores were identified by XCT: some spherical caused by gases produced by local evaporation and some polyhedral ones caused by lack of superposition between the lines that produced the samples and a supplemental contour line traced or correction of the sample borders.
  • The circular pores were affected mainly by the hatch spacing, while the distance between planes had no major effect on the samples’ quality.
  • The distance between planes affected the build height in corroboration with the hatch spacing. Distance between planes of 0.5 mm produced samples with height very close to the theoretical one, while increasing the offset between meander planes to 1 mm caused lower heights as compared to the theoretical ones.
  • The circular pores were concentrated close to the interface with the substrate. They were aligned along scanning direction forming parallel rows of voids. The larger the hatch spacing the lower the number of pores. By increasing the hatch spacing to 1.5 mm the pores disappeared completely. For a hatch spacing of 0.5 mm we recorded the highest level of porosity of 0.0002%.
  • For complete elimination of polyhedral pores from the borders of the samples, the contour line was superposed in various ratio of its thickness. XCT revealed that an overlap of 50% between the contour line and the meander was sufficient to eliminate the pores.
  • XCT was an excellent assisting tool during the tuning of the scanning parameters, as it succeeded to provide valuable information on the pores’ arrangement, location, and size for every varied parameter. The alternative analysis would have been cutting of each sample in various locations, polishing and microscopic analysis that could slow the manufacturing process by days or even weeks. The alternative with non-destructive control with ultrasounds is also unreliable due to the lack of visual information.

Author Contributions

Conceptualization, D.C., I.P. and A.C.P.; software and methodology, S.M. and M.A.M.; investigation, I.P., M.L. and I.T.; software, A.S. and C.D.; writing—original draft preparation, D.C., S.M., M.L. and A.C.P.; supervision, I.T.; funding acquisition, A.C.P. and I.T.; writing—review and editing, D.C., A.C.P. and I.T. All authors have read and agreed to the published version of the manuscript.

Funding

This research was funded by the National Core Program, contract numbers 16N/2019. A.C.P. and D.C. have received the funding of the PN-III-P1-1.1-TE-2016-2015 (TE136/2018) Project. S.M. was financed from the Project 25PCCDI/2018. M.A.M. has received financial support from the European Union’s Horizon 2020 (H2020) research and innovation program under the Marie Skłodowska-Curie, grant agreement No. 764935.

Conflicts of Interest

The authors declare no conflict of interest.

References

  1. Herzog, D.; Seyda, V.; Wycisk, E.; Emmelmann, C. Additive manufacturing of metals. Acta Mater. 2016, 117, 371–392. [Google Scholar] [CrossRef]
  2. Frazier, W.E. Metal additive manufacturing: A review. J. Mater. Eng. Perform. 2014, 23, 1917–1928. [Google Scholar] [CrossRef]
  3. Zhang, D.; Wang, W.; Guo, Y.; Hu, S.; Dong, D.; Poprawe, R.; Schleifenbaum, J.H.; Ziegler, S. Numerical simulation in the absorption behavior of Ti6Al4V powder materials to laser energy during SLM. J. Mater. Process. Technol. 2019, 268, 25–36. [Google Scholar] [CrossRef]
  4. Diegel, O.; Nordin, A.; Motte, D. Additive manufacturing technologies. In A Practical Guide to Design for Additive Manufacturing; Springer: Singapore, 2019. [Google Scholar] [CrossRef]
  5. Galarraga, H.; Warren, R.J.; Lados, D.A.; Dehoff, R.R.; Kirka, M.M.; Nandwana, P. Effects of heat treatments on microstructure and properties of Ti-6Al-4V ELI alloy fabricated by electron beam melting (EBM). Mater. Sci. Eng. A 2017, 685, 417–428. [Google Scholar] [CrossRef] [Green Version]
  6. Raju, R.; Duraiselvam, M.; Petley, V.; Verma, S.; Rajendran, R. Microstructural and mechanical characterization of Ti6Al4V refurbished parts obtained by laser metal deposition. Mater. Sci. Eng. A 2015, 643, 64–71. [Google Scholar] [CrossRef]
  7. Kozior, T.; Bochnia, J. The influence of printing orientation on surface texture parameters in powder bed fusion technology with 316L steel. Micromachines 2020, 11, 639. [Google Scholar] [CrossRef] [PubMed]
  8. Kozior, T.; Bochnia, J.; Zmarzły, P.; Gogolewski, D.; Mathia, T.G. Waviness of Freeform Surface Characterizations from Austenitic Stainless Steel (316L) Manufactured by 3D Printing-Selective Laser Melting (SLM) Technology. Materials 2020, 13, 4372. [Google Scholar] [CrossRef]
  9. Korsmik, R.S.; Rodionov, A.A.; Korshunov, V.A.; Ponomarev, D.A.; Prosychev, I.S.; Promakhov, V.V. Topological optimization and manufacturing of vessel propeller via LMD-method. Mater. Today Proc. 2020, 1–7. [Google Scholar] [CrossRef]
  10. Liu, S.; Shin, Y.C. The influences of melting degree of TiC reinforcements on microstructure and mechanical properties of laser direct deposited Ti6Al4V-TiC composites. Mater. Des. 2017, 136, 185–195. [Google Scholar] [CrossRef]
  11. Liu, S.; Shin, Y.C. Simulation and experimental studies on microstructure evolution of resolidified dendritic TiCx in laser direct deposited Ti-TiC composite. Mater. Des. 2018, 159, 212–223. [Google Scholar] [CrossRef]
  12. Wilson, J.M.; Shin, Y.C. Microstructure and wear properties of laser-deposited functionally graded Inconel 690 reinforced with TiC. Surf. Coat. Technol. 2012, 207, 517–522. [Google Scholar] [CrossRef]
  13. Wilson, J.M.; Piya, C.; Shin, Y.C.; Zhao, F.; Ramani, K. Remanufacturing of turbine blades by laser direct deposition with its energy and environmental impact analysis. J. Clean. Prod. 2014, 80, 170–178. [Google Scholar] [CrossRef]
  14. Thompson, S.M.; Bian, L.; Shamsaei, N.; Yadollahi, A. An overview of Direct Laser Deposition for additive manufacturing; Part I: Transport phenomena, modeling and diagnostics. Addit. Manuf. 2015, 8, 36–62. [Google Scholar] [CrossRef]
  15. Gasser, A.; Backes, G.; Kelbassa, I.; Weisheit, A.; Wissenbach, K. Laser Metal Deposition (LMD) and Selective Laser Melting (SLM) in Turbo-Engine Applications Laser Additive Manufacturing. Laser Tech. J. 2010, 7, 58–63. [Google Scholar] [CrossRef]
  16. Petrat, T.; Graf, B.; Gumenyuk, A.; Rethmeier, M. Laser metal deposition as repair technology for a gas turbine burner made of inconel 718. Phys. Procedia 2016, 18, 761–768. [Google Scholar] [CrossRef]
  17. Kumar, L.J.; Nair, C.G.K. Laser metal deposition repair applications for Inconel 718 alloy. Mater. Today Proc. 2017, 4, 11068–11077. [Google Scholar] [CrossRef]
  18. Culmone, C.; Smit, G.; Breedveld, P. Additive manufacturing of medical instruments: A state-of-the-art review. Addit. Manuf. 2019, 27, 461–473. [Google Scholar] [CrossRef]
  19. Everton, S.K.; Hirsch, M.; Stravroulakis, P.; Leach, R.K.; Clare, A.T. Review of in-situ process monitoring and in-situ metrology for metal additive manufacturing. Mater. Des. 2016, 95, 431–445. [Google Scholar] [CrossRef]
  20. Vaithilingam, J.; Goodridge, R.D.; Hague, R.J.; Christie, S.D.; Edmondson, S. The effect of laser remelting on the surface chemistry of Ti6al4V components fabricated by selective laser melting. J. Mater. Process. Technol. 2016, 232, 1–8. [Google Scholar] [CrossRef] [Green Version]
  21. Yasa, E.; Deckers, J.; Kruth, J.P. The investigation of the influence of laser re-melting on density, surface quality and microstructure of selective laser melting parts. Rapid Prototyp. J. 2011, 17, 312–327. [Google Scholar] [CrossRef]
  22. Wang, X.; Xu, S.; Zhou, S.; Xu, W.; Leary, M.; Choong, P.; Qian, M.; Brandt, M.; Xie, Y.M. Topological design and additive manufacturing of porous metals for bone scaffolds and orthopaedic implants: A review. Biomaterials 2016, 83, 127–141. [Google Scholar] [CrossRef] [PubMed]
  23. Hrabe, N.; Gnäupel-Herold, T.; Quinn, T. Fatigue properties of a titanium alloy (Ti–6Al–4V) fabricated via electron beam melting (EBM): Effects of internal defects and residual stress. Int. J. Fatigue 2017, 94, 202–210. [Google Scholar] [CrossRef] [Green Version]
  24. Majorell, A.; Srivatsa, S.; Picu, R.C. Mechanical behavior of Ti-6Al-4V at high and moderate temperatures-Part I: Experimental results. Mater. Sci. Eng. A 2002, 326, 297–305. [Google Scholar] [CrossRef]
  25. Picu, R.C.; Majorell, A. Mechanical behavior of Ti-6Al-4V at high and moderate temperatures-Part II: Constitutive modeling. Mater. Sci. Eng. A 2002, 326, 306–316. [Google Scholar] [CrossRef]
  26. Kasperovich, G.; Haubrich, J.; Gussone, J.; Requena, G. Correlation between porosity and processing parameters in TiAl6V4 produced by selective laser melting. Mater. Des. 2016, 105, 160–170. [Google Scholar] [CrossRef] [Green Version]
  27. Shunmugavel, M.; Polishetty, A.; Littlefair, G. Microstructure and Mechanical Properties of Wrought and Additive Manufactured Ti-6Al-4V Cylindrical Bars. Procedia Technol. 2015, 20, 231–236. [Google Scholar] [CrossRef] [Green Version]
  28. Moiduddin, K.; Mian, S.H.; Alkhalefah, H.; Umer, U. Digital design, analysis and 3D printing of prosthesis scaffolds for mandibular reconstruction. Metals 2019, 9, 569. [Google Scholar] [CrossRef] [Green Version]
  29. Weißmann, V.; Bader, R.; Hansmann, H.; Laufer, N. Influence of the structural orientation on the mechanical properties of selective laser melted Ti6Al4V open-porous scaffolds. Mater. Des. 2016, 95, 188–197. [Google Scholar] [CrossRef]
  30. Liu, Q.; Wang, Y.; Zheng, H.; Tang, K.; Ding, L.; Li, H.; Gong, S. Microstructure and mechanical properties of LMD-SLM hybrid forming Ti6Al4V alloy. Mater. Sci. Eng. A 2016, 660, 24–33. [Google Scholar] [CrossRef]
  31. Sterling, A.J.; Torries, B.; Shamsaei, N.; Thompson, S.M.; Seely, D.W. Fatigue behavior and failure mechanisms of direct laser deposited Ti-6Al-4V. Mater. Sci. Eng. A 2016, 655, 100–112. [Google Scholar] [CrossRef]
  32. Amsterdam, E.; Kool, G.A. High cycle fatigue of laser beam deposited Ti-6Al-4V and inconel 718. Bridging the gap between theory and operational practice. In Proceedings of the 25th Symposium of the International Committee on Aeronautical Fatigue, Rotterdam, The Netherlands, 27–29 May 2009; pp. 1261–1274. [Google Scholar]
  33. Keist, J.S.; Palmer, T.A. Role of geometry on properties of additively manufactured Ti-6Al-4V structures fabricated using laser based directed energy deposition. Mater. Des. 2016, 106, 482–494. [Google Scholar] [CrossRef]
  34. Carroll, B.E.; Palmer, T.A.; Beese, A.M. Anisotropic tensile behavior of Ti-6Al-4V components fabricated with directed energy deposition additive manufacturing. Acta Mater. 2015, 87, 309–320. [Google Scholar] [CrossRef]
  35. Cunningham, R.; Nicolas, A.; Madsen, J.; Fodran, E.; Anagnostou, E.; Sangid, M.D.; Rollett, A.D. Analyzing the effects of powder and post-processing on porosity and properties of electron beam melted Ti-6Al-4V. Mater. Res. Lett. 2017, 5, 516–525. [Google Scholar] [CrossRef] [Green Version]
  36. Ahsan, M.N.; Pinkerton, A.J.; Moat, R.J.; Shackleton, J. A comparative study of laser direct metal deposition characteristics using gas and plasma-atomized Ti-6Al-4V powders. Mater. Sci. Eng. A 2011, 528, 7648–7657. [Google Scholar] [CrossRef]
  37. Liou, F.W. Rapid prototyping processes. In Rapid Prototyping and Engineering Applications; CRC Press: Boka Raton, FL, USA, 2007; Chapter 6; p. 84. [Google Scholar] [CrossRef]
  38. Bian, L.; Thompson, S.M.; Shamsaei, N. Mechanical Properties and Microstructural Features of Direct Laser-Deposited Ti-6Al-4V. JOM 2015, 67, 629–638. [Google Scholar] [CrossRef]
  39. Reimers, P.; Goebbels, J. New Possibilities of Nondestructive Evaluation by X-ray Computed Tomography. Mater. Eval. 1983, 41, 732–737, ISSN 0025-5327. [Google Scholar]
  40. Krztońa, H.; Muchab, J.; Witkowskib, W. The application of laboratory X-ray micro-diffraction to study the effects of clinching process in steel sheets. Acta Phys. Pol. A 2016, 130, 985. [Google Scholar] [CrossRef]
  41. Gajjar, P.; Styliari, I.D.; Nguyen, T.T.H.; Carr, J.; Chen, X.; Elliott, J.A.; Hammond, R.B.; Burnett, T.L.; Roberts, K.; Withers, P.J.; et al. 3D characterization of dry powder inhaler formulations: Developing X-ray micro computed tomography approaches. Materials 2020, 151, 32–44. [Google Scholar] [CrossRef]
  42. De Chiffre, L.; Carmignato, S.; Kruth, J.P.; Schmitt, R.; Weckenmann, A. Industrial applications of computed tomography. CIRP Ann. Manuf. Technol. 2014, 63, 655–677. [Google Scholar] [CrossRef]
  43. Svintsitskiy, D.A.; Yu Kardash, T.; Lazareva, E.V.; Bondareva, V.M. X-ray-induced transformations on the surface of MoVNbTe mixed oxide catalyst: An XPS study. Appl. Surf. Sci. 2021, 535, 147676. [Google Scholar] [CrossRef]
  44. Chen, L.; Chang, J.; Ding, D.; Feng, H. Preparation, luminescent properties and X-ray imaging result of Lu2O3: Eu structured scintillation film on sapphire substrate by LCVD method. Mater. Lett. 2021, 282, 128689. [Google Scholar] [CrossRef]
  45. Romano, S.; Abel, A.; Gumpinger, J.; Brandão, A.D.; Beretta, S. Quality control of AlSi10Mg produced by SLM: Metallography versus CT scans for critical defect size assessment. Addit. Manuf. 2019, 28, 394–405. [Google Scholar] [CrossRef]
  46. Brandt, D.A.; Warner, J.C. Metallurgy Fundamentals: Ferrous and Nonferrous, 6th ed.; Goodheart-Willcox: Tinley Park, IL, USA, 2019; ISBN 10 1635638747. [Google Scholar]
  47. Chioibasu, D.; Achim, A.; Popescu, C.; Stan, G.E.; Pasuk, I.; Enculescu, M.; Iosub, S.; Duta, L.; Popescu, A. Prototype Orthopedic Bone Plates 3D Printed by Laser Melting Deposition. Materials 2019, 12, 906. [Google Scholar] [CrossRef] [PubMed] [Green Version]
  48. Tiseanu, I.; Zani, L.; Craciunescu, T.; Cotorobai, F.; Dobrea, C.; Sima, A. Characterization of superconducting wires and cables by X-ray micro-tomography. Fusion Eng. Des. 2013, 1613–1618. [Google Scholar] [CrossRef]
  49. Tiseanu, I.; Craciunescu, T.; Petrisor, T.; Corte A Della. 3D X-ray micro-tomography for modeling of NB3SN multifilamentary superconducting wires. Fusion Eng. Des. 2007, 82, 1447–1453. [Google Scholar] [CrossRef]
  50. Du Plessis, A.; Sperling, P.; Beerlink, A.; Tshabalala, L.; Hoosain, S.; Mathe, N.; Le Roux, S.G. Standard method for microCT-based additive manufacturing quality control 1: Porosity analysis. MethodsX 2018, 5, 1102–1110. [Google Scholar] [CrossRef]
  51. Thakkar, D.; Sahasrabudhe, H. Investigating microstructure and defects evolution in laser deposited single-walled Ti6Al4V structures with sharp and non-sharp features. J. Manuf. Process. 2020, 56, 928–940. [Google Scholar] [CrossRef]
  52. Li, P.H.; Guo, W.G.; Huang, W.D.; Su, Y.; Lin, X.; Yuan, K.B. Thermomechanical response of 3D laser-deposited Ti-6Al-4V alloy over a wide range of strain rates and temperatures. Mater. Sci. Eng. A 2015, 647, 34–42. [Google Scholar] [CrossRef]
  53. Zhang, K.; Wang, S.; Liu, W.; Long, R. Effects of substrate preheating on the thin-wall part built by laser metal deposition shaping. Appl. Surf. Sci. 2014, 317, 839–855. [Google Scholar] [CrossRef]
  54. Liu, S.; Shin, Y.C. Additive manufacturing of Ti6Al4V alloy: A review. Mater. Des. 2019, 164, 107552. [Google Scholar] [CrossRef]
  55. Kasperovich, G.; Hausmann, J. Improvement of fatigue resistance and ductility of TiAl6V4 processed by selective laser melting. J. Mater. Process. Technol. 2015, 220, 202–214. [Google Scholar] [CrossRef]
  56. Abdullah, M.F.; Anwar, S.; Al-Ahmari, A. Thermomechanical Simulations of Residual Stresses and Distortion in Electron Beam Melting with Experimental Validation for Ti-6Al-4V. Metals 2020, 10, 1151. [Google Scholar] [CrossRef]
Figure 1. Schematic representation of the LMD system used in our experiments.
Metals 10 01408 g001
Figure 2. Laser beam path trajectory in form of a meander (a), Superposed meanders with offset between meander planes ΔZ (b).
Metals 10 01408 g002
Figure 3. Embedded pores identification in Ti6Al4V powder by means of porosity module: front view slice (a) and 3D reconstruction of Ti6Al4V powder showing the identified embedded pores in the particles (b).
Metals 10 01408 g003
Figure 4. Single line traced by LMD using the optimized conditions from Table 1.
Metals 10 01408 g004
Figure 5. Bulk samples manufactured by LMD using different scanning parameters.
Metals 10 01408 g005
Figure 6. 3D rendering on sample 4 highlighting the appearance of pore clusters, were the most predominant are near the substrate region.
Metals 10 01408 g006
Figure 7. XCT slices in the areas with the most pronounced porosity of samples (a) S1, (b) S2, (c) S3, (d) S4, (e) S5, (f) S6, (g) S7, (h) S8.
Metals 10 01408 g007aMetals 10 01408 g007b
Figure 8. Schematic representation of scanning strategy with offset between contour and meander (a) and the corresponding XCT micrograph (b), schematic representation of scanning strategy with overlap between contour and meander (c) and the corresponding XCT micrograph (d).
Metals 10 01408 g008
Table 1. Optimized process parameters for tracing a clearly defined, parallel borders, single line of Ti6Al4V with the least residual material.
Process ParameterValue
Laser power700 W
Scanning speed15 mm/s
Powder flow rate3 gr/min
Laser spot size800 µm
Layer thickness2.5 mm
Nozzle stand off16 mm
Ar shielding gas flow rate10 L/min
He shielding gas flow rate3 L/min
Table 2. Scanning strategy parameters.
SampleOffset between Meander Planes ΔZ [mm]Hatch Spacing
[mm]
Overlap
[%]
S10.5133
S20.51.2520
S30.51.50
S40.750.566
S50.750.7550
S61133
S711.2520
S811.50
Table 3. X-ray measurement parameters.
ParameterPowderBulk
Voltage [kV]90110
Current [µA]110250
Acquired projections24001800
Rotation step [°]0.150.2
Beam width [µm]1.513.8
Magnification13040
Table 4. Experimental height variation as compared to the theoretical value in case of LMD deposited samples.
SampleExperimental Height
[mm]
Theoretical Height
[mm]
Error
[%]
S18.69 ± 0.3574
S26.42 ± 0.1528
S35.96 ± 0.05519
S412.32 ± 0.157.564
S511.39 ± 0.057.552
S68.98 ± 0.011010
S75.89 ± 0.051041
S85.48 ± 0.021045
Table 5. Determined porosity for samples produced by LMD.
Sample No.S1S2S3S4S5S6S7S8
Volume analyzed [mm3]15001500140024002200120018001700
Defect volume [mm3]0.00370.660.073132.50.871.30.21
Porosity percentage [%]0.000240.0440.00520.540.120.07250.0720.012
Slice Position relative to substrate interface [mm]1.642.042.511.662.241.642.042.77
Publisher’s Note: MDPI stays neutral with regard to jurisdictional claims in published maps and institutional affiliations.