Article

A Volumetric Heat Source Model for Thermal Modeling of Additive Manufacturing of Metals

1
School of Materials Science and Engineering, Sun Yat-Sen University, Guangzhou 510275, China
2
Science and Technology on Plasma Dynamics Laboratory, Air Force Engineering University, Xi’an 710043, China
*
Author to whom correspondence should be addressed.
Metals 2020, 10(11), 1406; https://doi.org/10.3390/met10111406
Submission received: 27 September 2020 / Revised: 11 October 2020 / Accepted: 15 October 2020 / Published: 22 October 2020
(This article belongs to the Special Issue Numerical Modelling and Simulation of Metal Processing)

Abstract

:
In additive manufacturing of metallic materials, an accurate description of the thermal histories of the built part is important for further analysis of the distortions and residual stresses, which is a big issue for additively manufactured metal products. In the present paper, a computationally volumetric heat source model based on a semianalytical thermal modeling approach is proposed. The proposed model is applied to model the thermal response during a selective laser melting (SLM) process. The interaction between the laser and the material is described using a moving volumetric heat source. High computational efficiency can be achieved with considerable accuracy. Several case studies are conducted to examine the accuracy of the proposed model. By comparing with the experimentally measured melt-pool dimensions, it is found that the error between the predictions obtained by the proposed model and the experimental results can be controlled to less than 10%. High computational efficiency can also be achieved for the proposed model. It is shown that for simulating the thermal process of scanning a single layer with the dimension of 2 mm × 2 mm, the calculation can be finished in around 110 s.

1. Introduction

Additive manufacturing (AM), defined by ASTM international [1] as “the process of joining materials to make parts from 3D model data, usually layer upon layer, as opposed to subtractive manufacturing and formative manufacturing methodologies”, opens up a new era to design novel structural materials with complex geometries. Direct energy deposition and powder-bed fusion are the two main AM approaches for metallic materials [2]. For both approaches, a 3D object is usually first sliced into thousands of 2D layers. Focused thermal energy—such as the laser, electron-beam, or plasma-arc—is then employed on a working plane to melt and fuse the material (coming from wire or powder) locally with the designed path in accordance with the corresponding 2D cross-sectional layout. After one layer is finished, the working plane is lowered for a small distance and the heat source scans the subsequent slice. This process repeats until the complete 3D object is built. Support structures may sometimes be needed to eliminate overhanging. Finally, the support structures are removed and the built part is cut from the baseplate.
Residual stresses and distortions are major issues for the AM process of metals due to the complex set of heat-cooling cycles during the process [3,4]. Part distortions can disqualify precision components with tight dimensional tolerances, and high values of residual stresses can lead to part failure while being built. It is therefore of great interest to optimize the process parameters and part design in order to minimize the undesired residual stresses and distortions. One approach is experimental trial-and-error. A more systematic way to enhance the understanding of the interplay between the processes parameters, design, and final part quality is computational process modeling. Since the transient temperature response is the root cause of part distortions and residual stresses, a computationally efficient thermal model for the AM process of metals is the key step to increase the build quality and repeatability leading to products with superior mechanical properties.
Although the mechanisms for the two AM processes of direct energy deposition and powder-bed fusion are different, the modeling techniques for predicting the thermal transients during theses two AM processes in part scale share many common features [5]. In order to obtain certain computational efficiency, the powder or the wire is usually represented as a continuum having effective thermal properties [2], and the interaction between the focused thermal energy and the material can be simplified as a surface or volumetric heat source applied on the material [6]. The temperature transient is usually obtained by solving the Fourier’s law of heat conduction with Neumann and Dirichlet boundary conditions (BCs) using the finite element method (e.g., [7,8,9]). Phase transitions within the melt pool can also be neglected as a second-order effect to improve the computational efficiency [10,11]. Even with these simplifications, the challenge of the thermal modeling of AM process in part scale is still how to accurately predict the thermal transient within a reasonable amount of time. The modeled part is usually orders of magnitude larger than the heat source, thus resulting in very fine discretizations in both space and time domains to describe the movement of the heat source [2]. It should be noted that even the heat source is modeled as a dimensionless moving point source, the multiscale nature of the problem and the numerical requirements still pose a computational challenge.
One way to address the separation of the scales in the problem is to use an adaptive mesh refinement in the vicinity of the heat source. However, this requires an additional remeshing step within time integration. Zhang et al. [12] developed an adaptive remeshing technique to reduce the computational cost for modeling the heat-transfer process in selective laser melting (SLM, belonging to the family of powder-bed fusion technique). Although the computational efficiency is certainly improved, the influence of the heat source (i.e., the laser) moving path is not fully considered. Instead, the powder-bed deposition is simplified by the scale of an entire layer or fractions of each layer, and each fraction is heated entirely for a certain effective time interval and then cools down. As the thermomechanical response in the metal AM process is very sensitive to the heat source moving path [13], an adaptive remeshing technique which takes into account the influence of the real heat source moving strategy may need to be further developed.
Yang et al. [14,15] proposed a semianalytical thermal approach based on the superposition principle and applied it in modeling the thermal response of the SLM process. The total temperature is decoupled as the superposition of an analytical field and a numerical field. The analytical field corresponds to the temperature caused by the moving heat source in a semi-infinite space, for which a closed-form expression exits. The numerical field is employed to account for the BCs and solved numerically. In the semianalytical approach, there is no need to give fine discretization for the heat source. The mesh size in solving the numerical field scales with the dimension of the modeled part and hence, the computational efficiency can be improved. In the model developed by Yang et al. [14,15], the moving heat source is discretized as a number of dimensionless point sources. Considerable accuracy of the thermal predictions can be achieved at a distance of 100 µm away from the point heat source [14]. However, predictions of the near-field temperature evolution, especially in the vicinity of the center of the melting zone, are less accurate [16,17]. Furthermore, in AM process, the nonaxisymmetric melt-pool observations with respect to the moving direction of the heat source suggest the heat energy distributes nonuniformly over a certain volume, and this cannot be captured by the dimensionless point heat source, for which the energy diffuses isotropically in the space domain. Therefore, it would be more appropriate to model the heat source as volumetric. Li et al. [18] compared the effect of using surface and volumetric heat sources in modeling the laser melting of ceramic materials and found the model incorporating the volumetric heat source increased the accuracy of melt-pool predictions.
In the present paper, taking the SLM process as an example, a volumetric heat source model based on the semianalytical thermal approach proposed by Yang et al. [14,15] is developed to predict the thermal histories of the built part in SLM. Compared to the point heat source model [14,15], the proposed volumetric heat source model is able to capture the nonaxisymmetric nature of the melt pool and give more accurate temperature predictions in the vicinity of the heat source. Meanwhile, the computational efficiency of the proposed volumetric heat source model is not impaired. The predicted melt-pool dimensions by modeling the heat source in SLM as point and volumetric sources are compared. The accuracy of the proposed volumetric heat source model is evaluated by comparing the corresponding simulation results with experiments. Section 2 introduces the volumetric heat source model based on the semianalytical thermal approach. Three case studies are investigated in Section 3 to evaluate the accuracy of the proposed model. The article concludes with a reiteration of the most salient points of the study.

2. Model Description

The semianalytical thermal model developed by Yang et al. [14,15] is briefly introduced in Section 2.1 The SLM process is taken as an example to explain how the semianalytical approach is utilized to model the thermal transients. The volumetric heat source model is then detailed in Section 2.2.

2.1. Semianalytical Thermal Model

Consider a 3D body V that has already been built on the baseplate, as shown in Figure 1a. The top, lateral, and bottom surfaces of the body V are represented by V top , V lat , and V bot , respectively. In SLM, a thin layer is laid on the top surface V top . The bottom surface V bot is bonded to the baseplate and the lateral surface V lat is in contact with the powder. Since the mean conductivity of the solid body V is much larger than that of the powder [19], it can be assumed that there is no heat transfer between body V and the powder, and hence, the lateral surface V lat is thermally insulated. The uppermost layer of powder is also neglected since its overall heat capacity is also negligible. The moving laser is modeled as a moving heat source enforced on the top surface V top . During SLM, the baseplate is usually preheated and keeps a relatively constant temperature [20,21]. This is considered as prescribing a fixed temperature T c on the bottom surface V bot . Consequently, the temperature of body V caused by the moving heat source on V top is governed by the heat equation
T t = α 2 T + Q v ˙ ρ c p
with the BCs
T x i n i = 0 , on V top and V lat , i = 1 , 2 , 3
T = T c , on V bot .
The initial condition is
T = T ini , at t = 0 .
The time is represented by t and the thermal diffusivity α = k / ρ c p , where k is the conductivity, ρ is the density and c p is the specific heat. The heat generation rate is represented by Q v ˙ . The Cartesian coordinate system is illustrated in Figure 1a. The normal to the boundary surfaces of V top and V top are denoted as n i , and T ini is the initial temperature.
It should be noted that Equation (1) is linear by assuming the thermal properties k, ρ , and c p are temperature independent. Although for most materials, the specific heat c p and conductivity k are both temperature dependent. However, it has been demonstrated by many studies [15,22,23] that by choosing appropriate effective thermal constants c p and k, the linear governing Equation (1) can still result in accurate prediction of the temperature field. The energy losses due to convection, radiation, and phase transitions are not explicitly accounted for and instead an effective laser power is later employed to implicitly characterize these energy losses.
Since the governing Equation (1) and the BCs expressed by Equations (2) and (3) are all linear, the temperature T can be decomposed as
T = T ˜ + T ˘ + T ^ ,
where T ˜ is the analytical temperature field caused by the moving heat source in a semi-infinite space, for which the boundary surface coincides with the top surface V top of the body V, as shown in Figure 1b. By discretizing the moving heat source as a finite number of individual heat sources, as shown in Figure 1b, the analytical field T ˜ can be expressed as
T ˜ = I = 1 N T ˜ ( I ) ,
where T ˜ ( I ) is the temperature field caused by the Ith heat source in the semi-infinite space and N is the total number of heat sources. The source density, which represents the number of heat sources per unit length, is given by
ρ s = 1 v Δ t ,
where v is the heat source moving speed and Δ t is the duration between the activation of two consecutive sources.
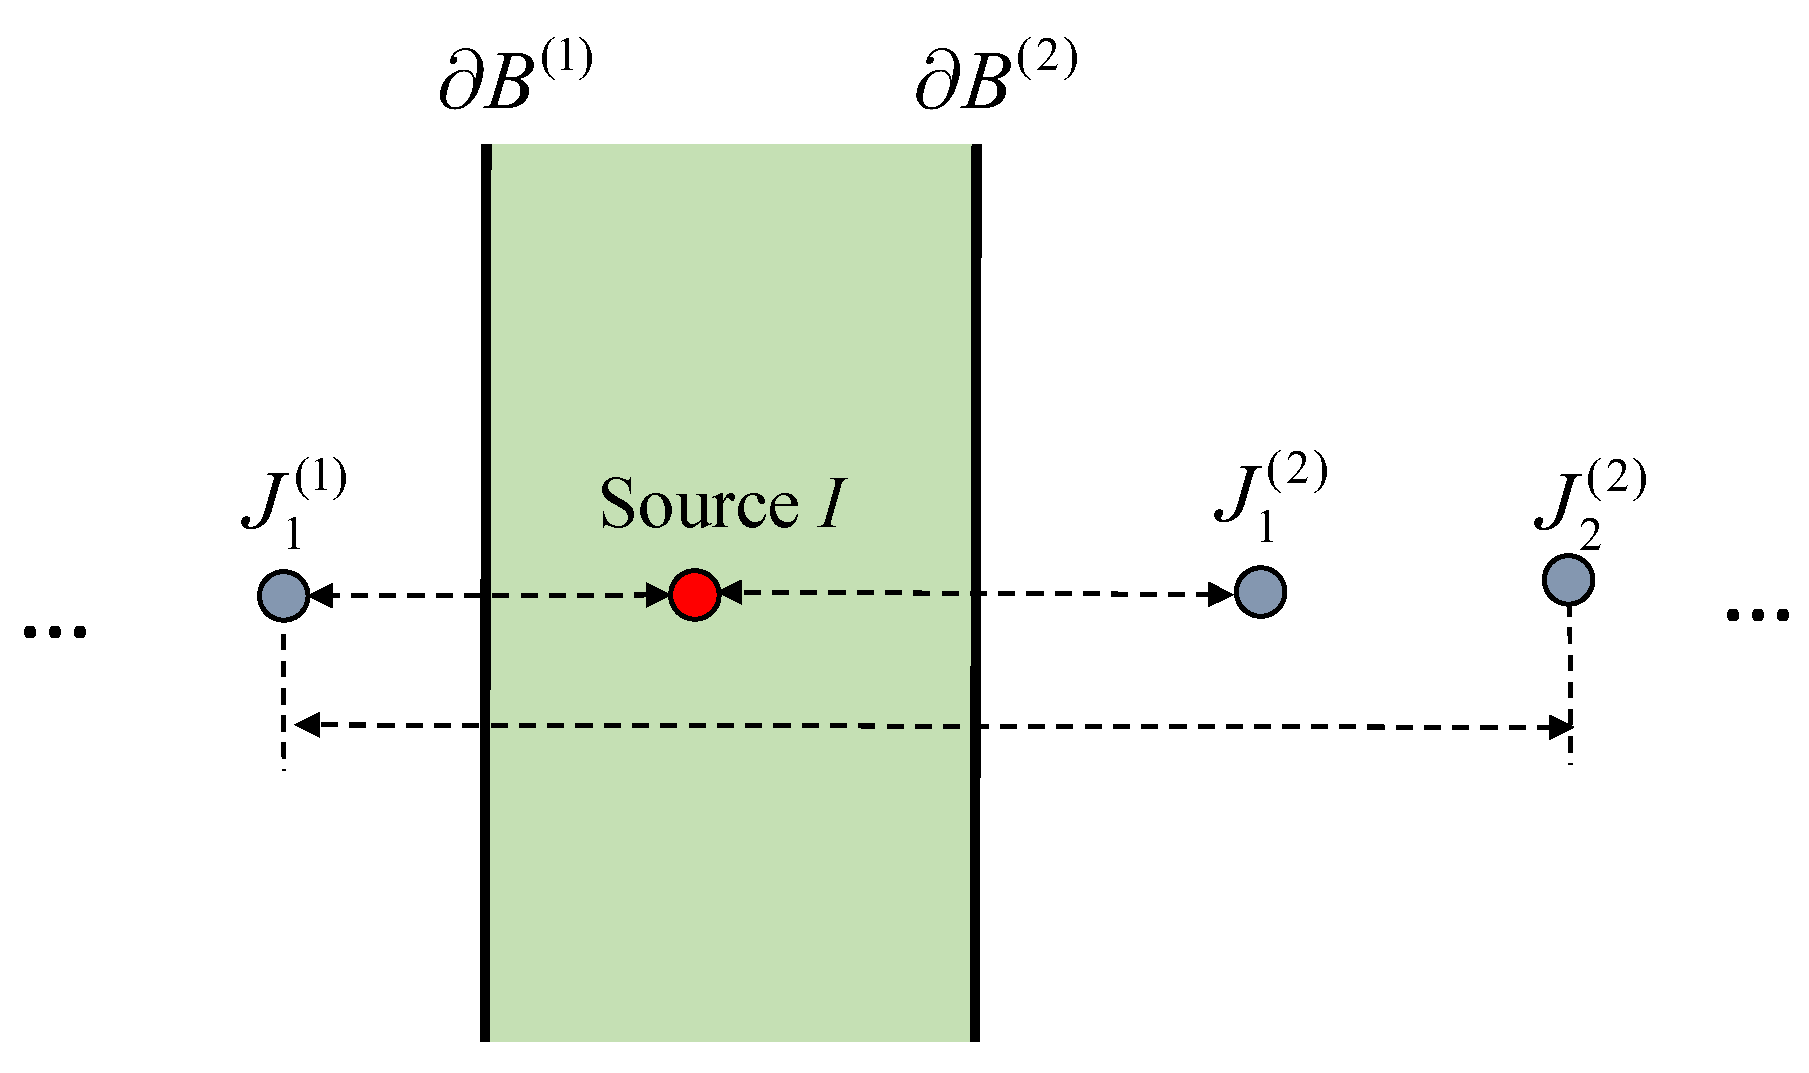
In Equation (6), the T ˘ and T ^ fields are employed to account for the BCs. The T ˘ is the image source field, which is the temperature field caused by the image sources in the semi-infinite space (see Figure 1b) and can also be obtained analytically, and T ^ is the complementary field being solved numerically (see Figure 1c). The image sources are added by mirroring the original heat sources with respect to the boundary surfaces. As illustrated in Figure 2, image source J 1 ( 1 ) is added by mirroring the heat source I with respect to boundary B ( 1 ) . Consider that the power associated with heat source I is P. If the power of image source J 1 ( 1 ) is P, the heat flux on boundary B ( 1 ) caused by heat source I and image source J 1 ( 1 ) would be 0; while if the power of image source J 1 ( 1 ) is P , the temperature on boundary B ( 1 ) caused by heat source I and image source J 1 ( 1 ) would be 0. Therefore, the no heat flux and prescribed temperature BCs shown in Equations (2) and (3) can be satisfied by adding the image sources. However, take Figure 2 as an example, image source J 1 ( 1 ) would affect the heat flux and temperature on boundary B ( 2 ) , and thus, a second-order image source J 2 ( 2 ) (the subscript denotes the order of the image source and the superscript represents the boundary by which the image source is mirrored) needs to be added. It is obvious that for the parallel boundaries shown in Figure 2, an infinite number of image sources will finally be needed. Therefore, to reduce the computational cost, only a finite number of image sources are added and the BCs are finally accounted for by the complementary field T ^ . The T ˘ is expressed as
T ˘ = J = 1 M T ˘ ( J ) ,
where M is the total number of image sources. The analytical expression of T ˘ ( J ) is the same as T ˜ ( I ) , which is detailed discussed in Section 2.2.
The complementary temperature field T ^ is obtained by solving
T ^ t = α 2 T ^
with the BCs
T ^ x i n i = T ˜ x i n i T ˘ x i n i , on V top and V lat ,
T ^ = T ˜ T ˘ + T c , on V bot ,
and initial condition
T ^ = T ˜ T ˘ + T ini , at t = 0 ,
where Equations (10) to (12) are a direct consequence of Equations (2) to (4).
The analytical field T ˜ serves to partially capture the steep temperature gradient in the vicinity of the heat source, and the image source field T ˘ is employed to describe the steep temperature gradient when the heat source is close to the boundary. As a result, the temperature gradient in T ^ field is relatively smooth, and thus, a relatively coarse mesh can be applied in solving T ^ .
It should be noted that in the semianalytical approach, as there is the need to add image sources, body V needs to be a convex polyhedron (where any two points within the polyhedron can be connected by a line). For arbitrary complex geometries, the semianalytical approach can still be utilized by using the T ^ field only to account for the BCs. Then, without the image source field and since the temperature gradient will become very steep when the heat source is close to the boundary, a fine discretization in the vicinity of the boundary may be necessary for solving the T ^ field to obtain certain accuracy. The computational efficiency and accuracy for using the T ^ field only to account for BCs to model the nonconvex part are detailed discussed in [15]. In the present paper, for the purpose of validating the accuracy of the proposed volumetric heat source model, only convex body V is considered so that the accuracy of the model is not very sensitive to the mesh size with the assistance of the image sources.

2.2. Volumetric Heat Source

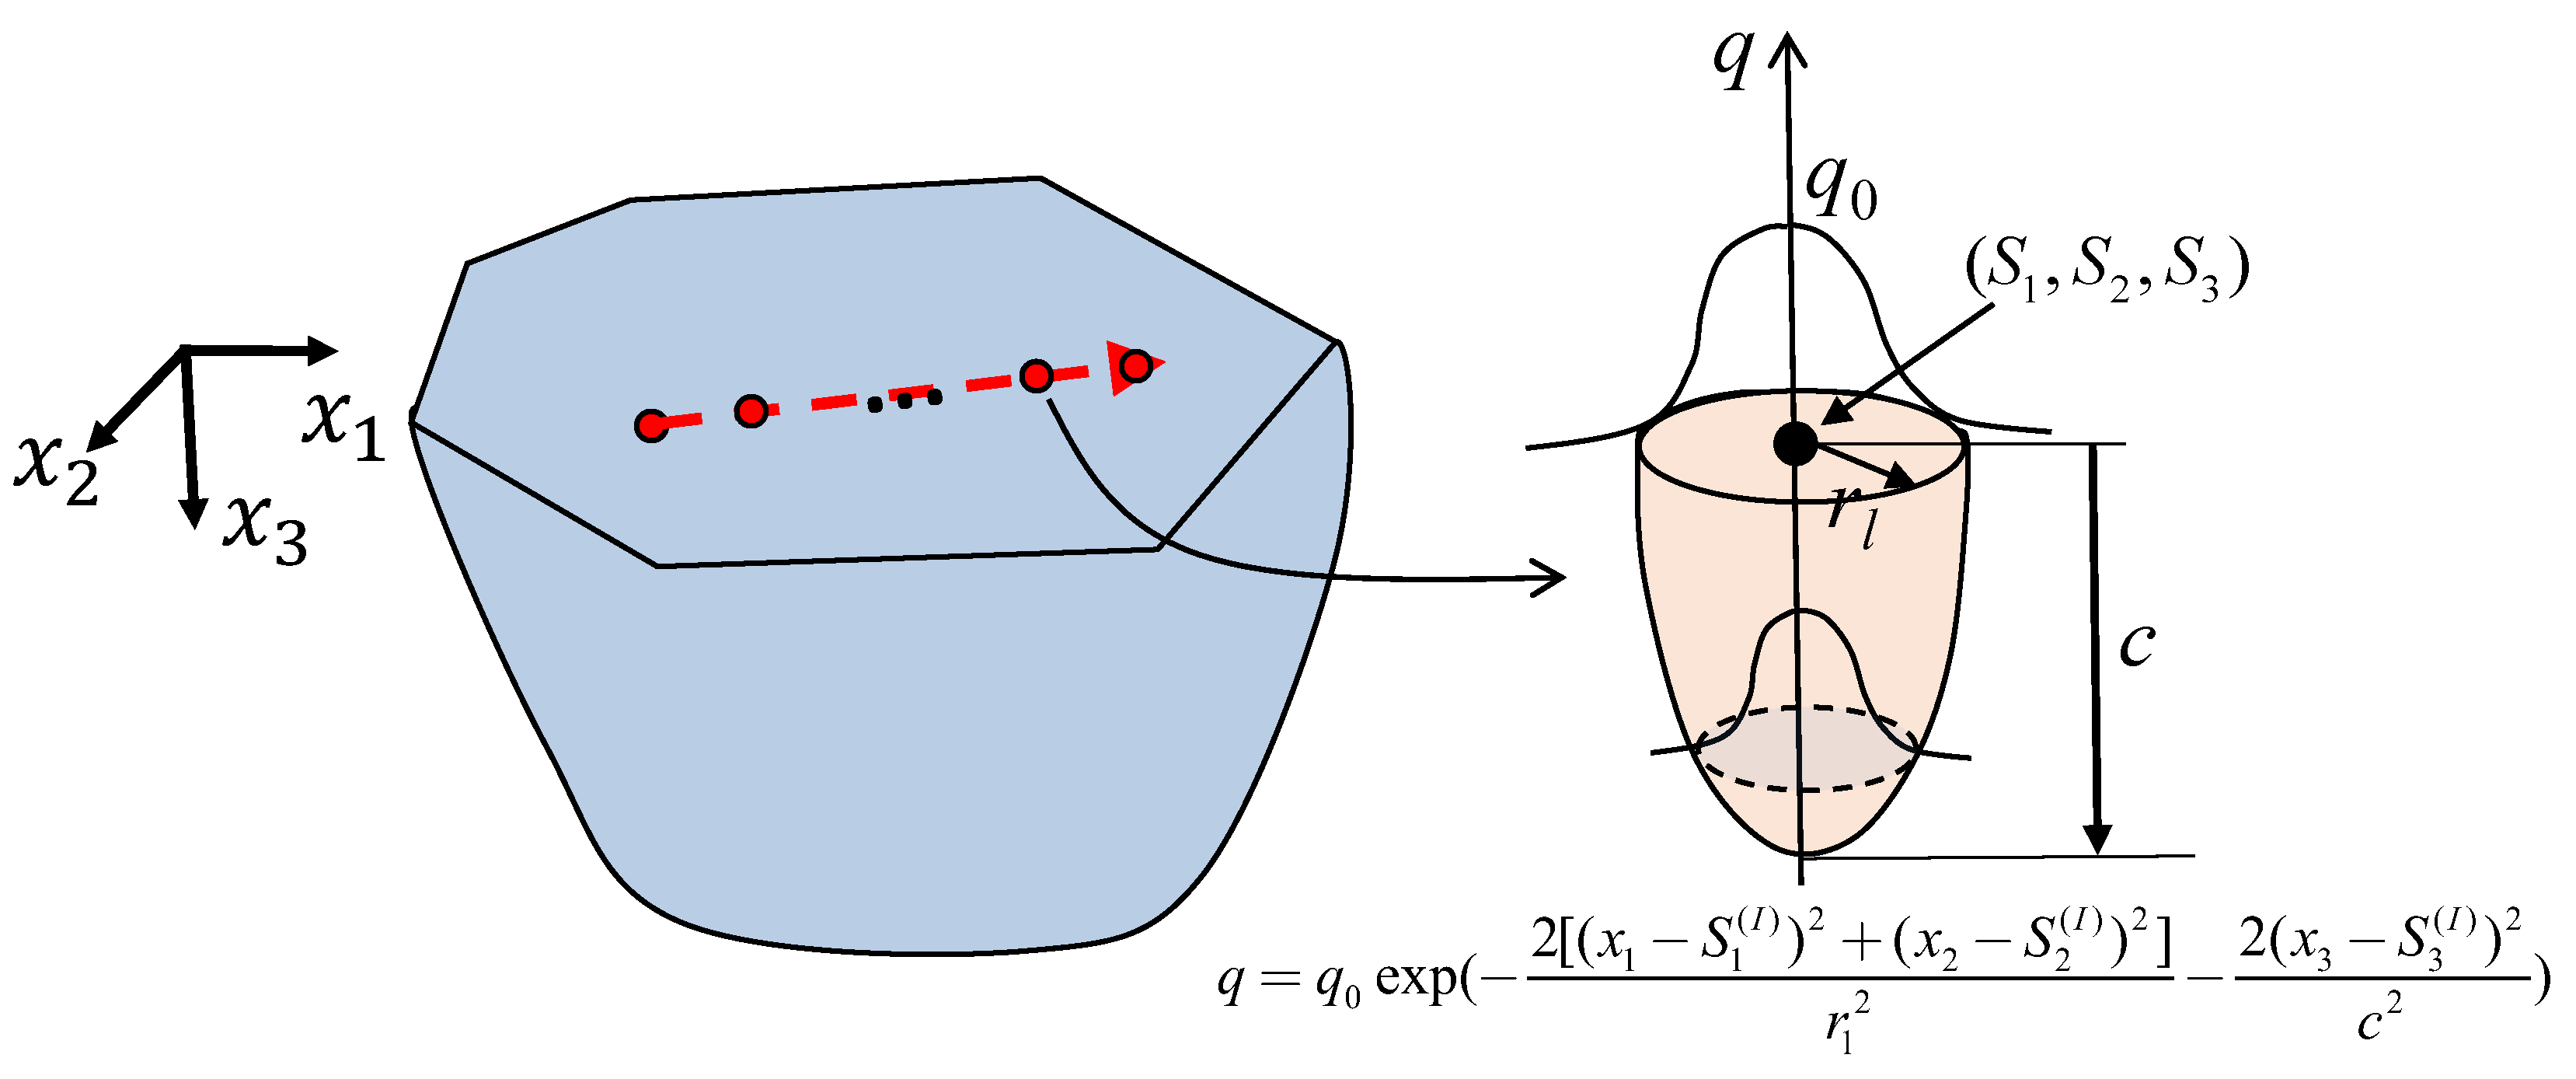
In the model developed by Yang et al. [14,15], sources I = 1 to N and the corresponding images sources are modeled as dimensionless point sources. In the present paper, for individual source I, it is described as a half-ellipsoidal volumetric source (see Figure 3), and the corresponding analytical solutions for T ˜ and the gradient of T ˜ are developed.
Consider the energy distribution for the heat source I, shown in Figure 3, expressed as
q ( x i ) = q 0 exp ( 2 ( x 1 S 1 ( I ) ) 2 + ( x 2 S 2 ( I ) ) 2 r l 2 2 ( x 3 S 3 ( I ) ) 2 c 2 ) , i = 1 , 2 , 3 ,
where q 0 is the maximum energy density at the position of x i = S i ( I ) . The parameters r l and c are illustrated in Figure 3. In SLM, the r l can be considered as the laser spot radius and the parameter c can be seen as the optical penetration depth (OPD) of the laser. Equation (13) satisfies that the energy density reduces to q 0 / e 2 at the surface of the ellipsoidal source.
The total energy of the heat source is Q, and conservation energy requires that
Q = 0 q ( x 1 , x 2 , x 3 ) d x 1 d x 2 d x 3 .
Evaluating Equation (14) yields
q 0 = 4 2 Q π π c r l 2 .
If heat source I is considered as a single dimensionless point source, the corresponding temperature T ˜ p ( I ) in a semi-infinite space is given by [24]
T ˜ p ( I ) ( x i ( P ) , t ) = 2 Q G ( x i ( P ) , t ) ,
where
G ( x i ( P ) , t ) = 1 ρ c p ( π α η ) 3 / 2 exp ( ( x 1 x 1 ( P ) ) 2 + ( x 2 x 2 ( P ) ) 2 + ( x 3 x 3 ( P ) ) 2 η ) .
The η = 4 α ( t t 0 ( I ) ) and x i ( P ) is the coordinates for the point of interest. Source I is activated at t = t 0 ( I ) . Function G ( x i ( P ) , t ) is the Green function, which is a fundamental solution of Equation (1). Due to the boundary effect caused by the boundary surface of the semi-infinite space, there is a factor 2 in Equation (16).
Due to the linearity of Equation (1), the temperature for point x i ( P ) at moment t induced by a heat source with the energy density of q ( x i ) is equal to q ( x i ) G ( x i ( P ) , t ) . In addition, we need to consider the boundary effect caused by the boundary surface of the semi-infinite space. This can be solved by adding an image source with respect to the boundary surface of the semi-infinite space. Consequently, the temperature T ˜ ( I ) caused by a volumetric heat source shown in Figure 3 is expressed as
T ˜ ( I ) = q ( x 1 , x 2 , x 3 ) G ( x 1 ( P ) , x 2 ( P ) , x 3 ( P ) , t ) d x 1 d x 2 d x 3 .
Finally, the temperature T ˜ ( I ) is given by
T ˜ ( I ) = B exp ( ( I x y + I z ) ) D ,
where
B = 2 2 Q ρ c p π 3 / 2 , I x y = 2 [ ( x 1 ( P ) S 1 ( I ) ) 2 + ( x 2 ( P ) S 2 ( I ) ) 2 ] 2 η + r l 2 , I z = 2 ( x 3 ( P ) S 3 ( I ) ) 2 2 η + c 2 , D = ( 2 η + r l 2 ) 2 η + c 2 .
It can be seen that if r l and c both become 0, source I would become a dimensionless point source, and Equation (19) would be equivalent to the temperature caused by a point source as shown in Equation (16). For any given heat source, the total energy Q = P A Δ t , where P is the power and A is a nondimensional coefficient which implicitly accounts for the energy losses during the SLM process, such as due to laser absorptivity, convection, radiation, and phase transitions. The expression for any given image source J is the same as Equation (19) but with different source positions S i ( J ) . Therefore, with Equation (19), the analytical field T ˜ and image source field T ˘ can be finally obtained using Equations (6) and (8), respectively.
The gradients of T ˜ and T ˘ used for solving the T ^ field are given by
T ˜ x i = 4 x i ( P ) 2 η + λ 2 T ˜ , T ˘ x i = 4 x i ( P ) 2 η + λ 2 T ˘ ,
where λ = r l for i = 1 , 2 and λ = c for i = 3 .

3. Results and Discussions

Three numerical examples are investigated in the present study. For the first example, a single laser scan is applied on a very large baseplate to mimic the scanning of the first layer. The baseplate can be assumed to be a semi-infinite space and thus, the total temperature field T simply becomes T ˜ in the absence of any BCs. The predicted melt-pool width and depth by the proposed volumetric heat source model are compared with the experiments reported in [25]. The material used is stainless steel (SS) 316L. For the second example, a single laser scan is applied on a baseplate with the cubic profile and thus, the BCs need to be considered. The material Ti6Al4V is considered in this example to demonstrate that the proposed model can be applied to different materials. The accuracy of the proposed model is further validated by comparing the predicted melt-pool width and depth with the experiments [8]. A third example is presented to demonstrate the ability of the proposed model to simulate the multiple laser scanning process with various heat source moving paths in the AM process.
The material properties of SS316L and Ti6Al4V are tabulated in Table 1. As suggested by Yang et al. [14], the values quoted in Table 1 are representative for a temperature which is slightly higher than the melting point ( T m ) of SS 316L and Ti6Al4V, respectively. The thermal properties for SS316L and Ti6Al4V in Table 1 correspond to the temperatures of 1727 °C [26] and 2227 °C [27], respectively. The temperature fields T ˜ , T ˘ , and T ^ are all calculated using an in-house Matlab code. The T ˜ and T ˘ fields are directly calculated using Equations (6) and (8), and the T ^ is solved with an explicit finite difference scheme, centered in space and forward in time.

3.1. A Single Laser Scan on a Semi-Infinite Space

A single laser scan is applied on a semi-infinite space as schematically illustrated in Figure 3 to mimic scanning the first SS 316L powder layer on a very large baseplate [25]. The initial temperature is set to be 25 °C. The laser spot radius r l is 27 µm and the OPD c is set as 60 µm, which is close to the diameter of the powder (54 µm).
A convergence study with respect to the source density ρ s is first investigated. The maximum temperature experienced by a point with a distance of 20 µm to the laser scanning line with various source density ρ s is calculated. This distance is close to the laser spot radius. The source density ρ s = 100 × 10 4 Wms 1 is taken as the reference. As shown in Figure 4, the error | T ˜ ( ρ s ) T ˜ ref | / T ˜ ref for two different P / v is plotted as a function the source density ρ s . It can be seen that the error quickly reduces to a value close to 0 and converges at ρ s = 10 × 10 4 Wms 1 . Hence, for the following calculations, the source density ρ s = 10 × 10 4 Wms 1 is used.
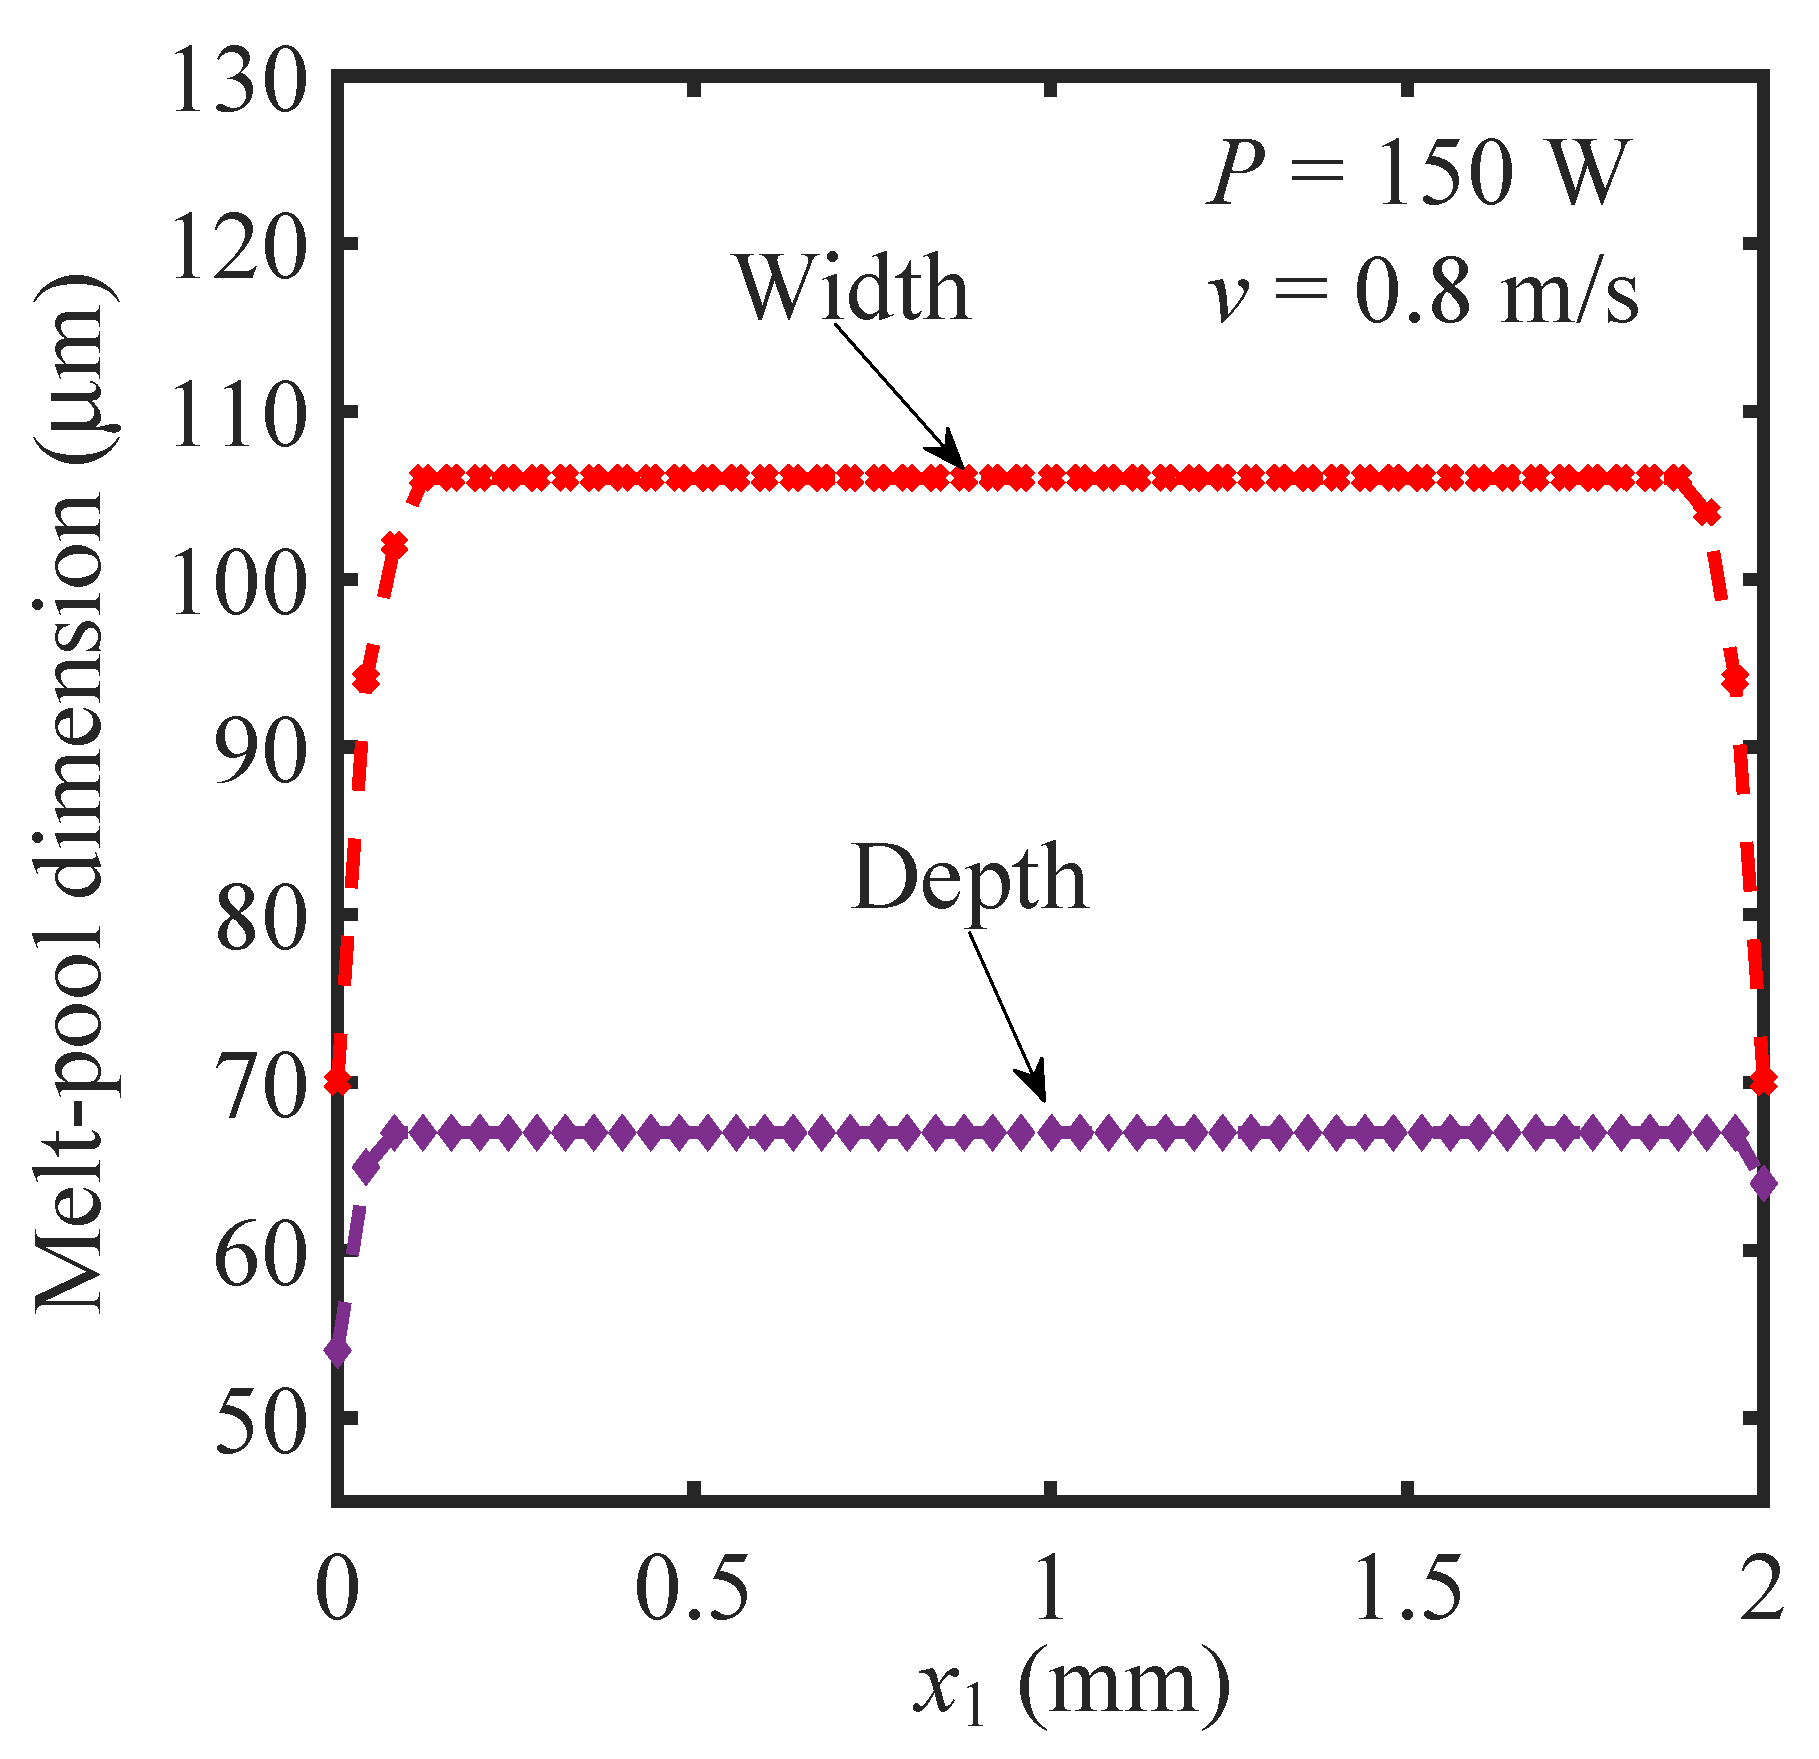
The predicted melt-pools by the volumetric heat source model within the x 1 x 2 plane and x 2 x 3 plane are shown in Figure 5a,b, respectively. The power is 150 W and the speed is 0.8 m/s. The melt-pool is shown as the white area in Figure 5 and determined as the material points heated above the melting point. A regular hexahedral grid with the size of 10 µm is employed to plot Figure 5. The melt-pool width and depth along the scanning line at P = 150 W and v = 0.8 m/s are shown in Figure 6. By examining the temperature of the material points in the vicinity of the scanning line (along the width and depth directions, respectively), the boundary of the melt-pool is determined to be the first material point with the temperature below the melting point. The resolution for determining the melt-pool width and depth in this example is 1 µm. It can be seen that the melt-pool width and depth are both small at the beginning of the laser scan, but quickly reach a higher steady-state value. The melt-pool width and depth then decrease towards the completion of the laser scan. Hence, the calculated width and depth of the melt-pool shown in the following are determined by the steady-state value along the laser scanning line.
The melt-pool width and depth by the proposed volumetric heat source model for various laser powers and speeds, and the corresponding experimental measurements are reported in [25] are plotted in Figure 7a,b. The coefficient A is set to be 0.43 to result in the best agreement for the volumetric heat source model. The simulation results by the point heat source model are also plotted in Figure 7.
The uncertainty of the experimental measurements is 5 µm. As explained in [25], the experimental uncertainty is mainly because that the plasma/metal vapor plume during the SLM process can change the laser absorptivity, which causes fluctuations of the effective power. Incorporating a variable coefficient A in the proposed model to accurately account for the variance of the effective power during the SLM would be quite difficult and thus, a more common approach [25] to take the coefficient A as a constant is employed. It can be observed from Figure 7 that the melt-pool width and depth increase with the increasing P / v . The value of P / v for the power of 200 W and speed of 1.2 m/s is the same as that for the power of 300 W and speed of 1.8 m/s, and thus, close values of melt-pool width and depth can be observed in Figure 7 both for the experimental and simulation results.
In Figure 7, it can also be seen that the predicted melt-pool width and depth by the volumetric heat source model agree well with the experimental measurements for all the four sets of laser power and speed. In comparison, the predicted melt-pool width by the point heat source model is overestimated (see Figure 7a) and the depth is underestimated (Figure 7b). The predicted melt-pool depth by the point heat source model is actually half of the predicted width as the heat energy diffuses isotropically in the space domain for the point heat source. If we tune the coefficient A to make the width calculated by the point heat source model agree well with the experiments, the calculated depth will also reduce accordingly. Therefore, the difference between the half width and depth of the melt-pool cannot be captured by the point heat source model. In the volumetric heat source model, by adjusting the parameter c to characterize the OPD of the laser, the melt-pool with shallow or deep depth can be conveniently captured.
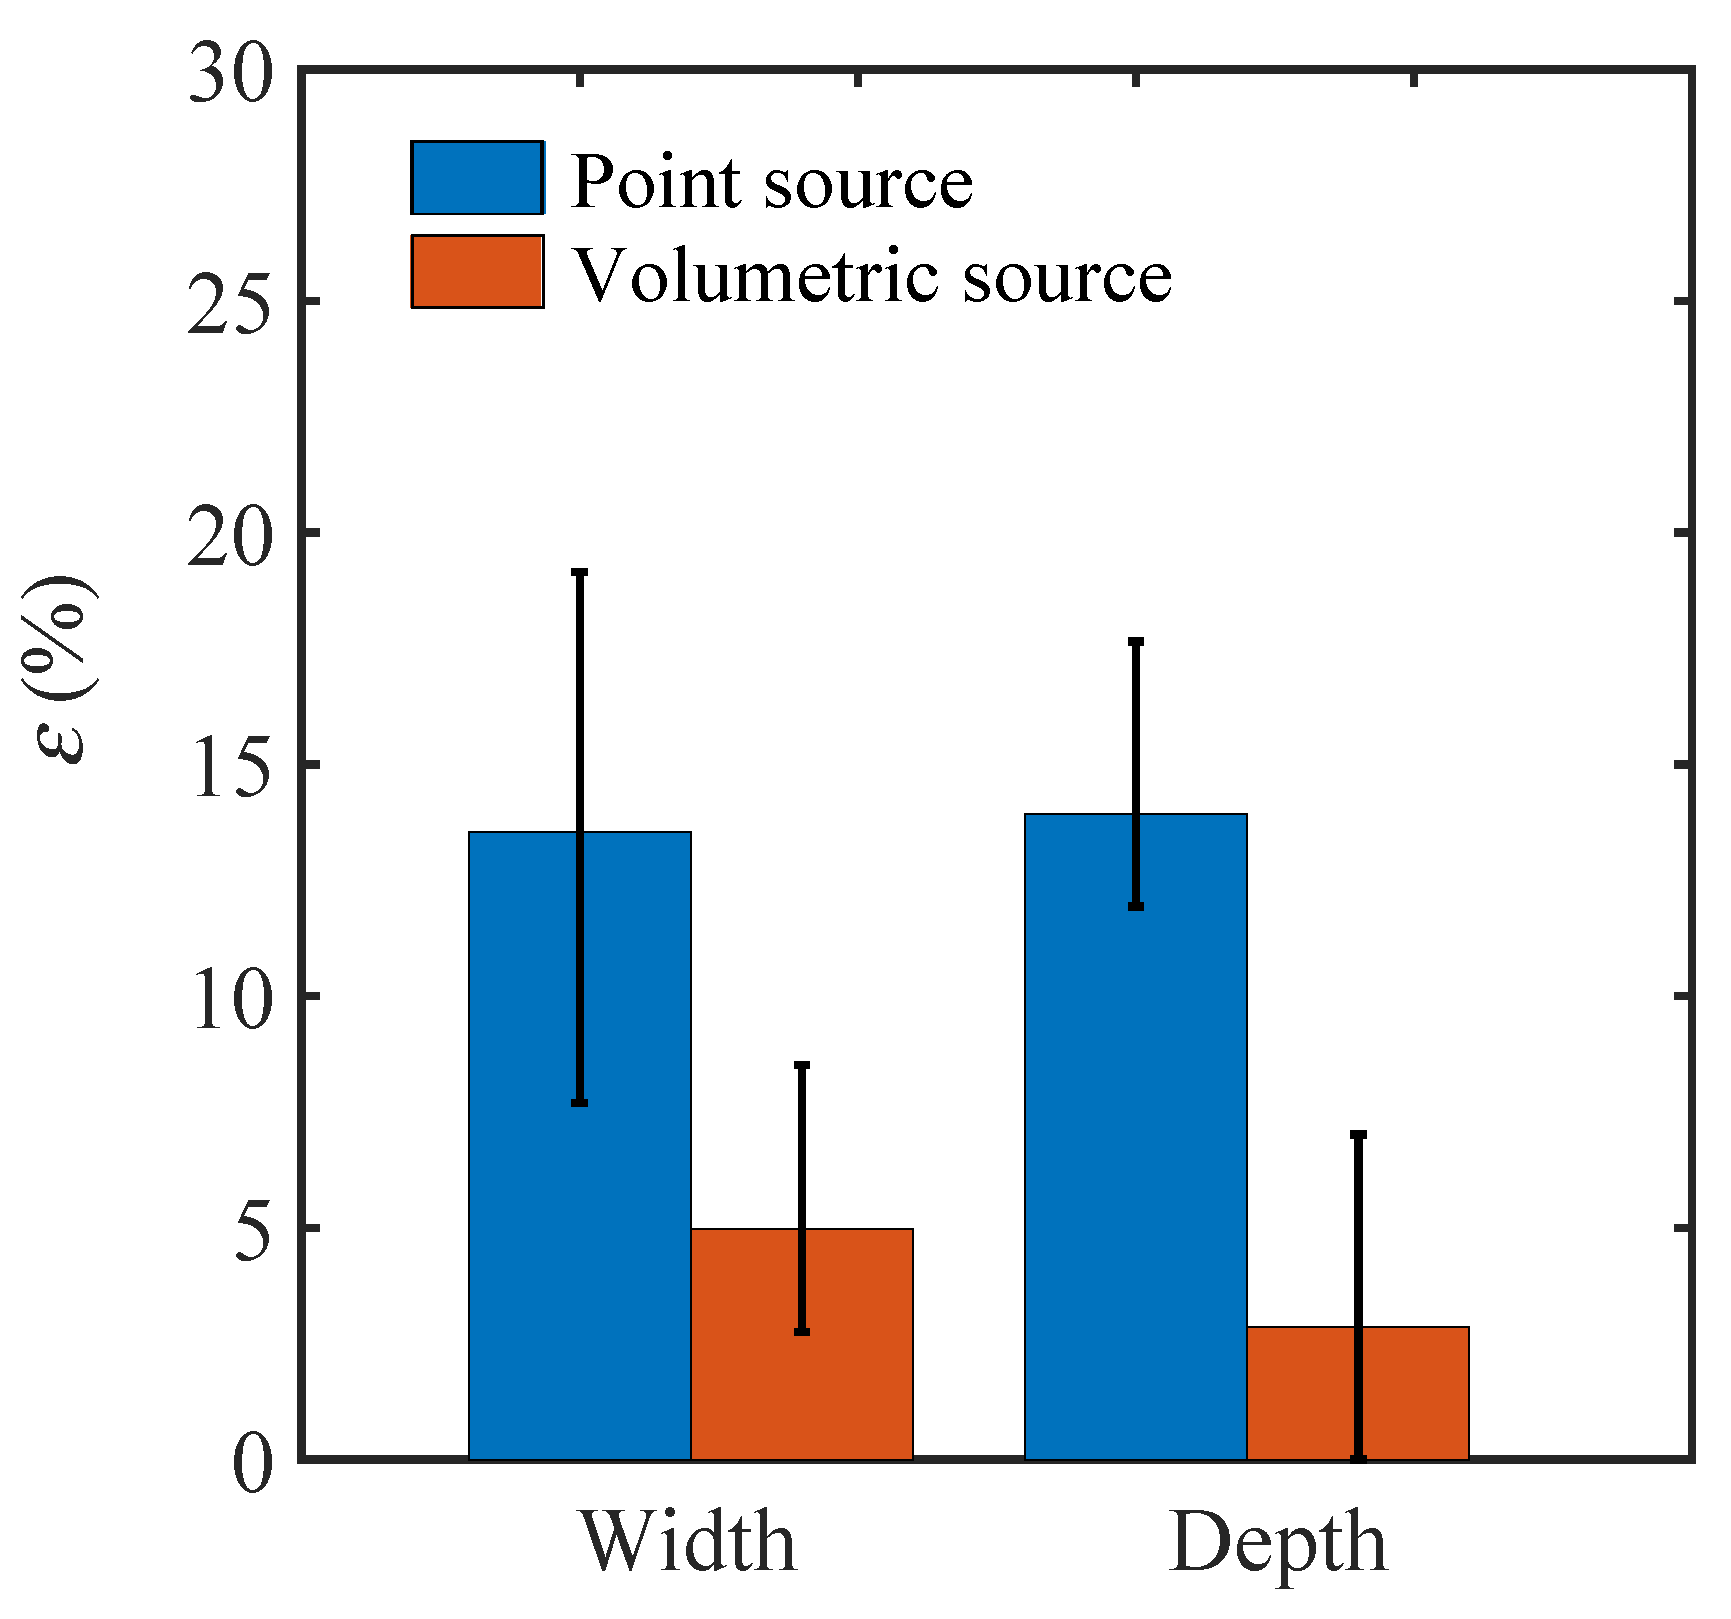
The error of the predicted results in Figure 7 with respect to the average experimental measurements is evaluated by
ε = | Y Y exp | Y exp ,
where Y represents the predicted melt-pool width or depth, and Y exp represents the averaged experimental melt-pool width or depth. Figure 8 shows the errors of the predicted melt-pool width and depth for both the point and volumetric heat source models. The rectangular bars represent the average error ε ¯ for the four sets of laser power and speed, and the error bar corresponds to the maximum and minimum error, respectively, in the four sets of laser power and speed. It can be seen from Figure 8 that the maximum errors of the predicted melt-pool width and depth for the point heat source model are close to 20%, while the corresponding maximum errors for the volumetric heat source model are less than 10%. The average errors of the predicted melt-pool width and depth for the point heat source model are around 15%, and the corresponding average errors for the volumetric heat source model are around 5%.

3.2. A Single Laser Scan on a Finite Space

In this example, a single scan experiment reported in literature [8] is simulated using the proposed model. As shown in Figure 9, the baseplate has a dimension of 4 mm × 2 mm × 0.5 mm and the material is Ti6Al4V. The bottom surface of the baseplate is set to be at 20 °C during the whole process. The laser spot radius is 26 µm and the OPD c is set to be 40 µm, which is also close to the powder diameter (35 µm). The coefficient A is set to be 0.77 as suggested in [8]. The laser speed is 0.2 m/s and various laser powers are investigated. A total number of 64 cubic finite difference cells is used to discretize the baseplate, resulting in a cell size of 1 mm × 0.5 mm × 0.125 mm. The T ˜ and T ˘ fields can be readily obtained for any point of interest x i ( P ) within the body analytically, while the T ^ field can only be calculated at the nodes of the finite difference cells. Therefore, a linear interpolation of known T ^ values is utilized to estimate the value of T ^ ( x i ( P ) ) on any given material point, which is given by
T ^ ( x i ( P ) ) = q = 1 N q Φ ( q ) T ^ ( x i ( q ) ) ,
where q = 1 , 2 , , N is the index for the grid point with T ^ ( x i ( q ) ) and the total number of grid points of the finite difference cell is denoted as N q . For an 8-node hexahedral finite difference cell ( N q = 8 ) used in this example, the function Φ ( q ) is expressed as
Φ ( q ) = 1 8 ( 1 + ξ i ξ ( q ) ) ,
where ξ i is the normalized position of x i ( P ) in a right-handed local coordinate system having an origin located at the center of the cell and ξ ( q ) is the normalized position of x i ( q ) given in the same coordinate system. The resolution for determining the melt-pool width and depth in this example is 1 µm.
The predicted melt-pool width and depth obtained by the point and volumetric heat source models as well as the experimental measurements are shown in Figure 10a,b, respectively. The experimental results were measured for different places along the scanning line by optical microscopy based on the solidified microstructure [8]. As explained in [8], because the boundaries of the melt-pool were difficult to characterize, some large error bars can be observed in Figure 10. It can be seen from Figure 10 that the trend of the predicted melt-pool width and depth obtained by the point and volumetric heat source models agree well with that of the experimentally obtained results. The melt-pool width and depth increase with the increasing P / v . The melt-pool widths predicted by the point and volumetric heat source models both agree reasonably well with the experiments. However, in Figure 10b, it can be seen that the melt-pool depth is underestimated by the point heat source model at the powers of 20 W and 40 W. In comparison, the melt-pool depths predicted by the volumetric source model have good agreements with the experimentally measured values at all the four sets of laser power. This is because the different heat energy distributions within the laser scanning plane (i.e., the x 1 x 2 plane) and along the depth direction can be well captured by the volumetric heat source model. In comparison, for the point heat source model, both the heat energy diffusion within the laser scanning plane and the the phenomenon of penetration along the depth direction cannot be accurately described. For the powers of 60 W and 80 W, the melt-pool depths happen to be approximately half of the melt-pool width, and thus, the predicted depths obtained by the point heat source model agree well with the experimental results.
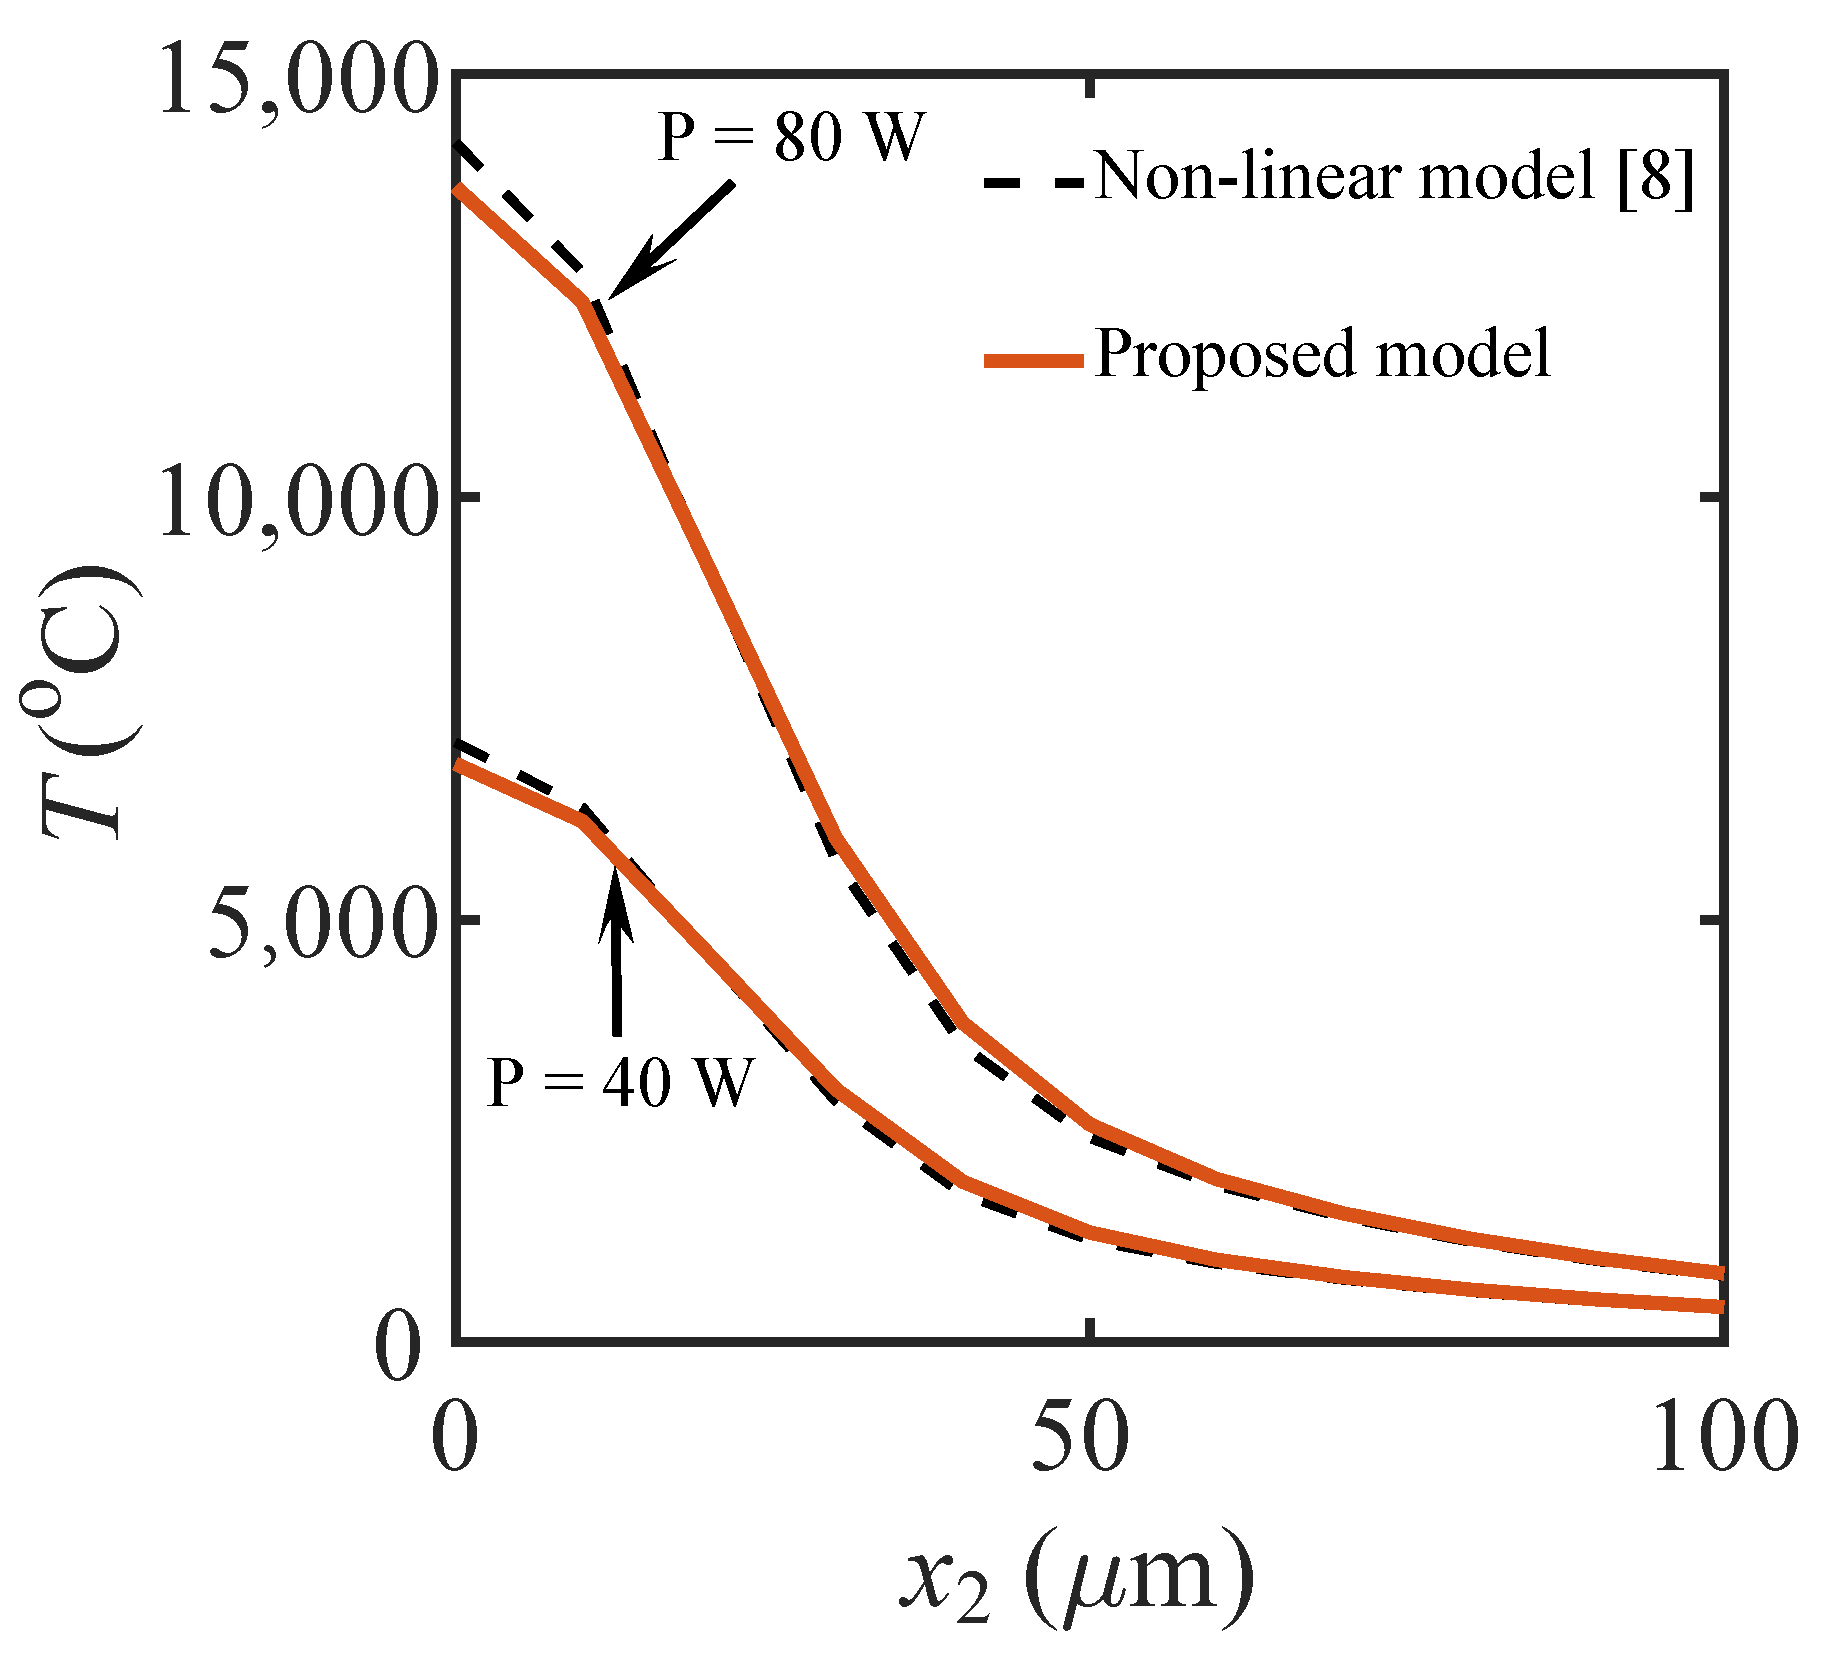
A nonlinear thermal analysis using the finite element method was also conducted in [8], in which the nonlinear thermal properties of Ti6Al4V were employed. The temperature distributions along the width direction (see line 1 in Figure 9) at the powers of 40 W and 80 W at a certain time calculated by the proposed volumetric heat source model were compared with the results obtained by the nonlinear model in [8], as shown in Figure 11. Good agreements can be observed between the nonlinear model and the proposed approach. The disparities of the temperature obtained by the two models shown in Figure 11 are characterized by κ = | T vol T non | / T non , where T vol is the temperature obtained by the proposed volumetric heat source model and T non is the temperature obtained by the nonlinear model proposed in [8]. It is found the κ is less 10%. The small disparities are expected, as a nonlinear set of thermal properties which is temperature dependent is used in the nonlinear model while constant thermal properties are employed in the proposed model.

3.3. Building a New Layer with Multiple Laser Scans

Finally, a numerical example for scanning a new layer with multiple scans is conducted. Two scanning strategies are considered in the proposed model. The material of Ti6Al4V is employed in this example. As shown in Figure 12a, a cube with the dimension of l = 2 mm is assumed already built, and two scanning strategies (unidirectional, see Figure 12b; and alternating, see Figure 12c) are considered to build the new layer. A total number of 64 cubic finite difference cells is used to discretize the body. The temperature of the bottom surface of the cube is set to be 20 °C during the whole process. An arbitrary set of process parameters is chosen to investigate the temperature histories of point G1 and G2 (see Figure 12a). The laser spot radius is set to be 50 µm and the OPD is 60 µm. The power of the laser is set to be 40 W with a speed of 0.8 m/s. The hatching distance between adjacent tracks is 90 µm and a total number of 21 tracks are applied on the top surface V top . The thermal response is calculated by the volumetric heat source model.
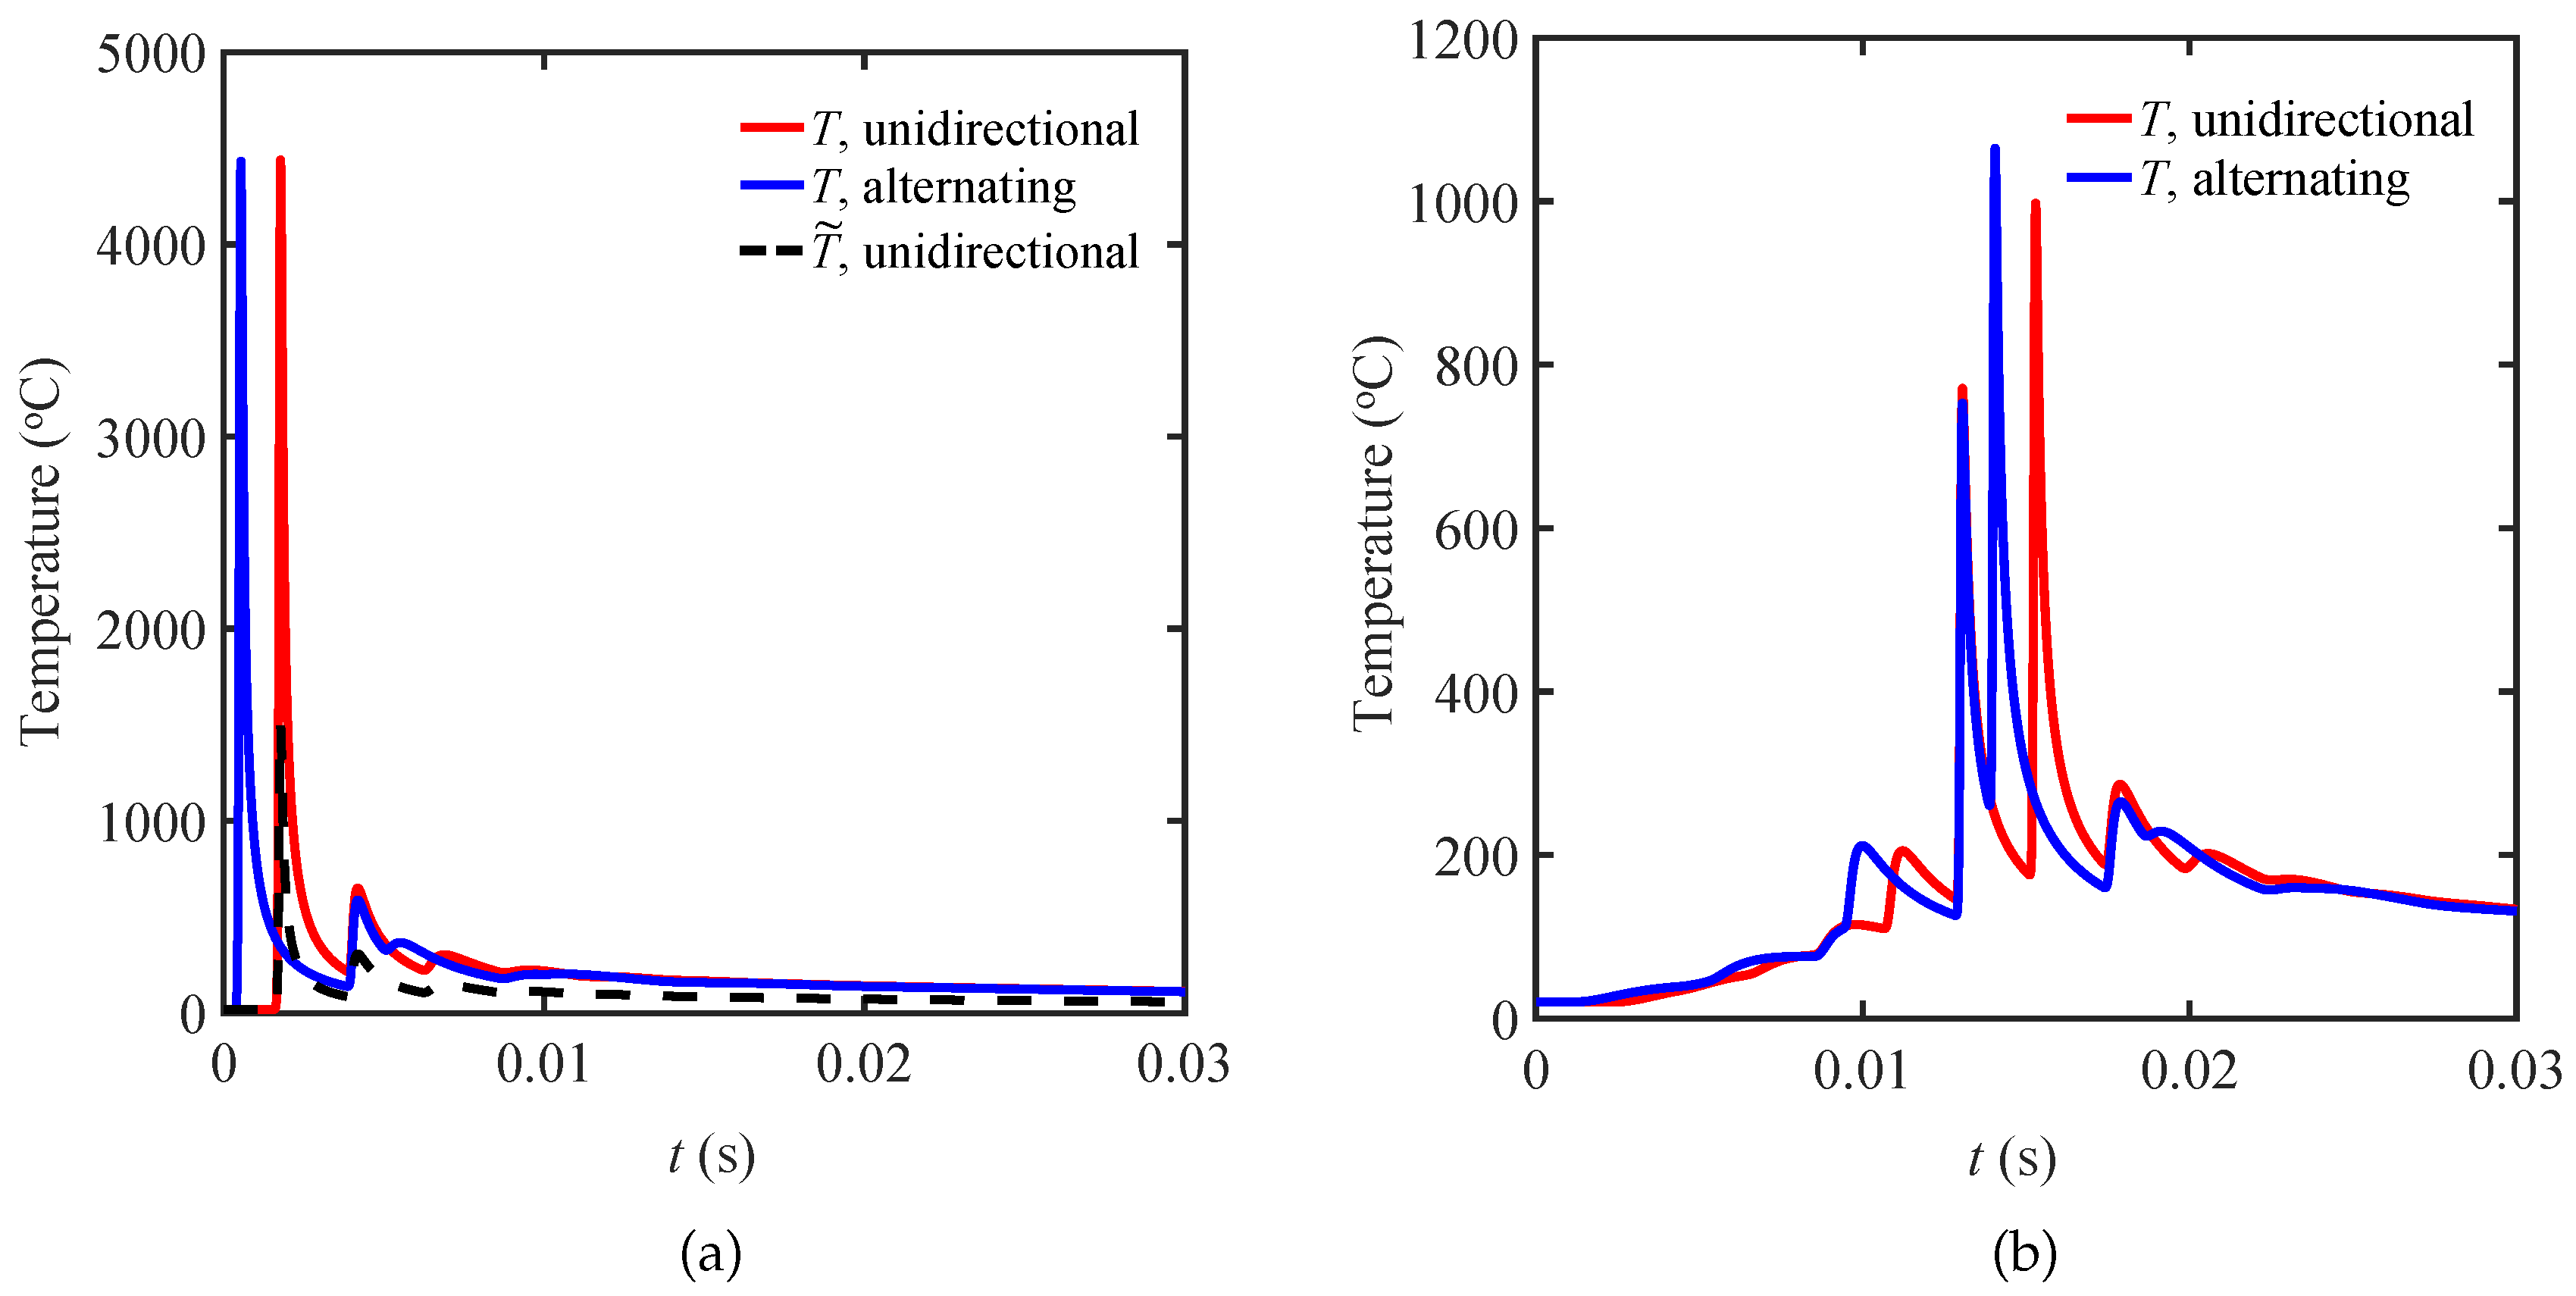
Figure 13a shows the temperature histories of point G1 under the unidirectional and alternating scanning strategies. The temperature evolutions under the two scanning strategies are well captured. The first peak temperature for the alternating scanning strategy appears earlier than that for the unidirectional scanning strategy. This is because compared with the unidirectional scanning strategy, the first track in the alternating scanning strategy arrives earlier at point G1. The second laser track is the same in both alternating and unidirectional scanning strategies, and thus, the second peak temperatures of point G1 for both scanning strategies occur at the same moment. It also demonstrates that the temperature history of point G1 is sensitive to the scanning strategy. The temperature field T ˜ without considering the BCs under the unidirectional scanning strategy is also plotted in Figure 13a. The peak temperature of T ˜ is only 1439 °C, while the peak temperature of T is 4493 °C. It can be observed that after including the BCs, the total temperature T is reasonably much higher than the T ˜ , which indicates it is essential to consider the BCs in the thermal modeling of the AM process.
The temperature histories of point G2 under the two different scanning strategies are compared in Figure 13b. It can be seen that the peak temperature of point G2 is reasonably lower than that of point G1 because point G1 is at the boundary. The peak temperature in Figure 13b is around 1000 °C, which is lower than the melting point 1650 °C. This indicates that the set of process parameters employed may cause the lack of fusion. It is also important to note that scanning strategies can modify the temperature histories which, in turn, have an impact on the resulting residual stresses.
The calculation time for this example by the volumetric heat source model is around 110 s. The calculation associated with T ^ field is only 0.45 s. The high efficiency is because the steep temperature gradient is captured by the T ˜ and T ˘ fields, which can be calculated analytically, and thus, coarse mesh can be applied in solving T ^ . With this high computational efficiency, it would be very efficient to investigate the thermal histories of an AM part and optimize the process parameters. The calculation is performed using a single-core Intel i7 6600U quad-core processor with a clock speed of 2.60 GHz and 8 GB RAM.

4. Limitations and Future Extensions

In the proposed model, a half-ellipsoid heat source is employed to describe the interaction between the laser and the materials in SLM. Since the laser spot radius is usually small in SLM, it is appropriate to assume a circle heat source profile within the laser scanning plane ( x 1 x 2 plane). When the size of heat source becomes large—such as in wire arc additive manufacturing, for which the characteristic size of the heat source is usually in mm scale—a more complex heat source profile, such as the Goldak double ellipsoidal heat source [16], may need to be applied. Therefore, suitable heat source profiles for different metal AM processes with the corresponding analytical solutions of T ˜ and Grad ( T ˜ ) need to be further developed. Moreover, in the half-ellipsoid heat source, the OPD of the laser is characterized by the constant parameter c, which is independent of the laser power and speed. However, the OPD may vary for different processing parameters, and this cannot be accounted for by the present model. Hence, a thermal model which is capable of characterizing the variance of OPD as a function of the process parameters is also of interest to investigate.

5. Conclusions

A computationally efficient volumetric heat source model based on the semianalytical thermal approach is proposed to simulate the thermal response of the produced part in the AM process. It has shown that the asymmetry of the melt pool in width and depth directions can be well captured by the proposed volumetric heat source model. Two materials of SS 316L and Ti6Al4V are employed to validate the accuracy of the proposed model. As the steep temperature gradients are mainly captured by the analytical field T ˜ and the image source field T ˘ , which can be obtained analytically, high computational efficiency can be achieved in solving T ^ field. Compared with the point heat source model, the volumetric heat source model has higher accuracy and in the meantime, the computational cost of the proposed volumetric heat source model is not impaired because of the concise expressions of T ˜ and Grad( T ˜ ). Moreover, the computational efficiency of the proposed model is independent of the laser spot radius and OPD, indicating that various laser profiles can be easily modeled. The high computational efficiency of the proposed model suggests it is promising to be incorporated in an optimization process (optimizing the topology of the built part or process parameters) to reduce the residual stresses and distortions.

Author Contributions

Conceptualization, Y.Y.; methodology, Y.Y.; validation, Y.Y.; resources, X.Z.; writing–review and editing, Y.Y., X.Z. All authors have read and agreed to the published version of the manuscript.

Funding

This research was funded by the Science and Technology on Plasma Dynamics Laboratory, Air Force Engineering University, Xi’an, China (Project No. 614220206021808).

Conflicts of Interest

The authors declare no conflict of interest.

References

  1. Additive Manufacturing General Principles Terminology; Standard, International Organization for Standardization: Geneva, Switzerland, 2015.
  2. Francois, M.M.; Sun, A.; King, W.E.; Henson, N.J.; Tourret, D.; Bronkhorst, C.A.; Carlson, N.N.; Newman, C.K.; Haut, T.; Bakosi, J.; et al. Modeling of additive manufacturing processes for metals: Challenges and opportunities. Curr. Opin. Solid State Mater. Sci. 2017, 21, 198–206. [Google Scholar] [CrossRef]
  3. Parry, L.; Ashcroft, I.; Wildman, R.D. Understanding the effect of laser scan strategy on residual stress in selective laser melting through thermo-mechanical simulation. Addit. Manuf. 2016, 12, 1–15. [Google Scholar] [CrossRef] [Green Version]
  4. Zaeh, M.F.; Branner, G. Investigations on residual stresses and deformations in selective laser melting. Prod. Eng. 2010, 4, 35–45. [Google Scholar] [CrossRef]
  5. Ding, J. Thermo-Mechanical Analysis of Wire and Arc Additive Manufacturing Process. Ph.D. Thesis, Cranfield University, Cranfield, Bedfordshire, UK, 2012. [Google Scholar]
  6. Hodge, N.; Ferencz, R.; Solberg, J. Implementation of a thermomechanical model for the simulation of selective laser melting. Comput. Mech. 2014, 54, 33–51. [Google Scholar] [CrossRef]
  7. Chin, R.; Beuth, J.; Amon, C. Successive deposition of metals in solid freeform fabrication processes, Part 1: Thermomechanical models of layers and droplet columns. J. Manuf. Sci. Eng. 2001, 123, 623–631. [Google Scholar] [CrossRef]
  8. Fu, C.; Guo, Y. 3-dimensional finite element modeling of selective laser melting ti-6al-4v alloy. In Proceedings of the Solid Freeform Fabrication Symposium 2014 Proceedings, Austin, TX, USA, 4–6 August 2014; pp. 1129–1144. [Google Scholar]
  9. Ding, J.; Colegrove, P.; Mehnen, J.; Ganguly, S.; Almeida, P.S.; Wang, F.; Williams, S. Thermo-mechanical analysis of Wire and Arc Additive Layer Manufacturing process on large multi-layer parts. Comput. Mater. Sci. 2011, 50, 3315–3322. [Google Scholar] [CrossRef] [Green Version]
  10. Bai, X.; Zhang, H.; Wang, G. Improving prediction accuracy of thermal analysis for weld-based additive manufacturing by calibrating input parameters using IR imaging. Int. J. Adv. Manuf. Technol. 2013, 69, 1087–1095. [Google Scholar] [CrossRef]
  11. Zhao, H.; Zhang, G.; Yin, Z.; Wu, L. A 3D dynamic analysis of thermal behavior during single-pass multi-layer weld-based rapid prototyping. J. Mater. Process. Technol. 2011, 211, 488–495. [Google Scholar] [CrossRef]
  12. Zhang, Y.; Guillemot, G.; Bernacki, M.; Bellet, M. Macroscopic thermal finite element modeling of additive metal manufacturing by selective laser melting process. Comput. Methods Appl. Mech. Eng. 2018, 331, 514–535. [Google Scholar] [CrossRef]
  13. Kruth, J.P.; Deckers, J.; Yasa, E.; Wauthlé, R. Assessing and comparing influencing factors of residual stresses in selective laser melting using a novel analysis method. Proc. Inst. Mech. Eng. Part B J. Eng. Manuf. 2012, 226, 980–991. [Google Scholar] [CrossRef]
  14. Yang, Y.; Knol, M.; van Keulen, F.; Ayas, C. A Semi-Analytical Thermal Modelling Approach for Selective Laser Melting. Addit. Manuf. 2018, 21, 284–297. [Google Scholar] [CrossRef] [Green Version]
  15. Yang, Y.; van Keulen, F.; Ayas, C. A computationally efficient thermal model for selective laser melting. Addit. Manuf. 2020, 31, 100955. [Google Scholar] [CrossRef]
  16. Goldak, J.; Chakravarti, A.; Bibby, M. A new finite element model for welding heat sources. Metall. Trans. B 1984, 15, 299–305. [Google Scholar] [CrossRef]
  17. Flint, T.; Francis, J.; Smith, M.; Balakrishnan, J. Extension of the double-ellipsoidal heat source model to narrow-groove and keyhole weld configurations. J. Mater. Process. Technol. 2017, 246, 123–135. [Google Scholar] [CrossRef]
  18. Li, J.; Li, L.; Stott, F. Comparison of volumetric and surface heating sources in the modeling of laser melting of ceramic materials. Int. J. Heat Mass Transf. 2004, 47, 1159–1174. [Google Scholar] [CrossRef]
  19. Gusarov, A.; Yadroitsev, I.; Bertrand, P.; Smurov, I. Model of radiation and heat transfer in laser-powder interaction zone at selective laser melting. J. Heat Transf. 2009, 131, 072101. [Google Scholar] [CrossRef]
  20. Kempen, K.; Vrancken, B.; Thijs, L.; Buls, S.; Van Humbeeck, J.; Kruth, J.P. Lowering thermal gradients in Selective Laser melting by pre-heating the baseplate. In Proceedings of the Solid Freeform Fabrication Symposium Proceedings, Austin, TX, USA, 12–14 August 2013. [Google Scholar]
  21. Sato, Y.; Tsukamoto, M.; Masuno, S.; Yamashita, Y.; Yamashita, K.; Tanigawa, D.; Abe, N. Investigation of the microstructure and surface morphology of a Ti6Al4V plate fabricated by vacuum selective laser melting. Appl. Phys. A 2016, 122, 439. [Google Scholar] [CrossRef]
  22. Yang, Y.; Ayas, C. Computationally efficient thermal-mechanical modelling of selective laser melting. AIP Conference Proceedings. AIP Publ. 2017, 1896, 040005. [Google Scholar]
  23. Childs, T.; Berzins, M.; Ryder, G.; Tontowi, A. Selective laser sintering of an amorphous polymer—Simulations and experiments. Proc. Inst. Mech. Eng. Part B J. Eng. Manuf. 1999, 213, 333–349. [Google Scholar] [CrossRef]
  24. Carslaw, H.S.; Jaeger, J.C. Conduction of Heat in Solids, 2nd ed.; Clarendon Press: Oxford, UK, 1959. [Google Scholar]
  25. Khairallah, S.A.; Anderson, A.T.; Rubenchik, A.; King, W.E. Laser powder-bed fusion additive manufacturing: Physics of complex melt flow and formation mechanisms of pores, spatter, and denudation zones. Acta Mater. 2016, 108, 36–45. [Google Scholar] [CrossRef] [Green Version]
  26. Khairallah, S.A.; Anderson, A. Mesoscopic simulation model of selective laser melting of stainless steel powder. J. Mater. Process. Technol. 2014, 214, 2627–2636. [Google Scholar] [CrossRef]
  27. Wits, W.W.; Bruins, R.; Terpstra, L.; Huls, R.A.; Geijselaers, H. Single scan vector prediction in selective laser melting. Addit. Manuf. 2016, 9, 1–6. [Google Scholar] [CrossRef]
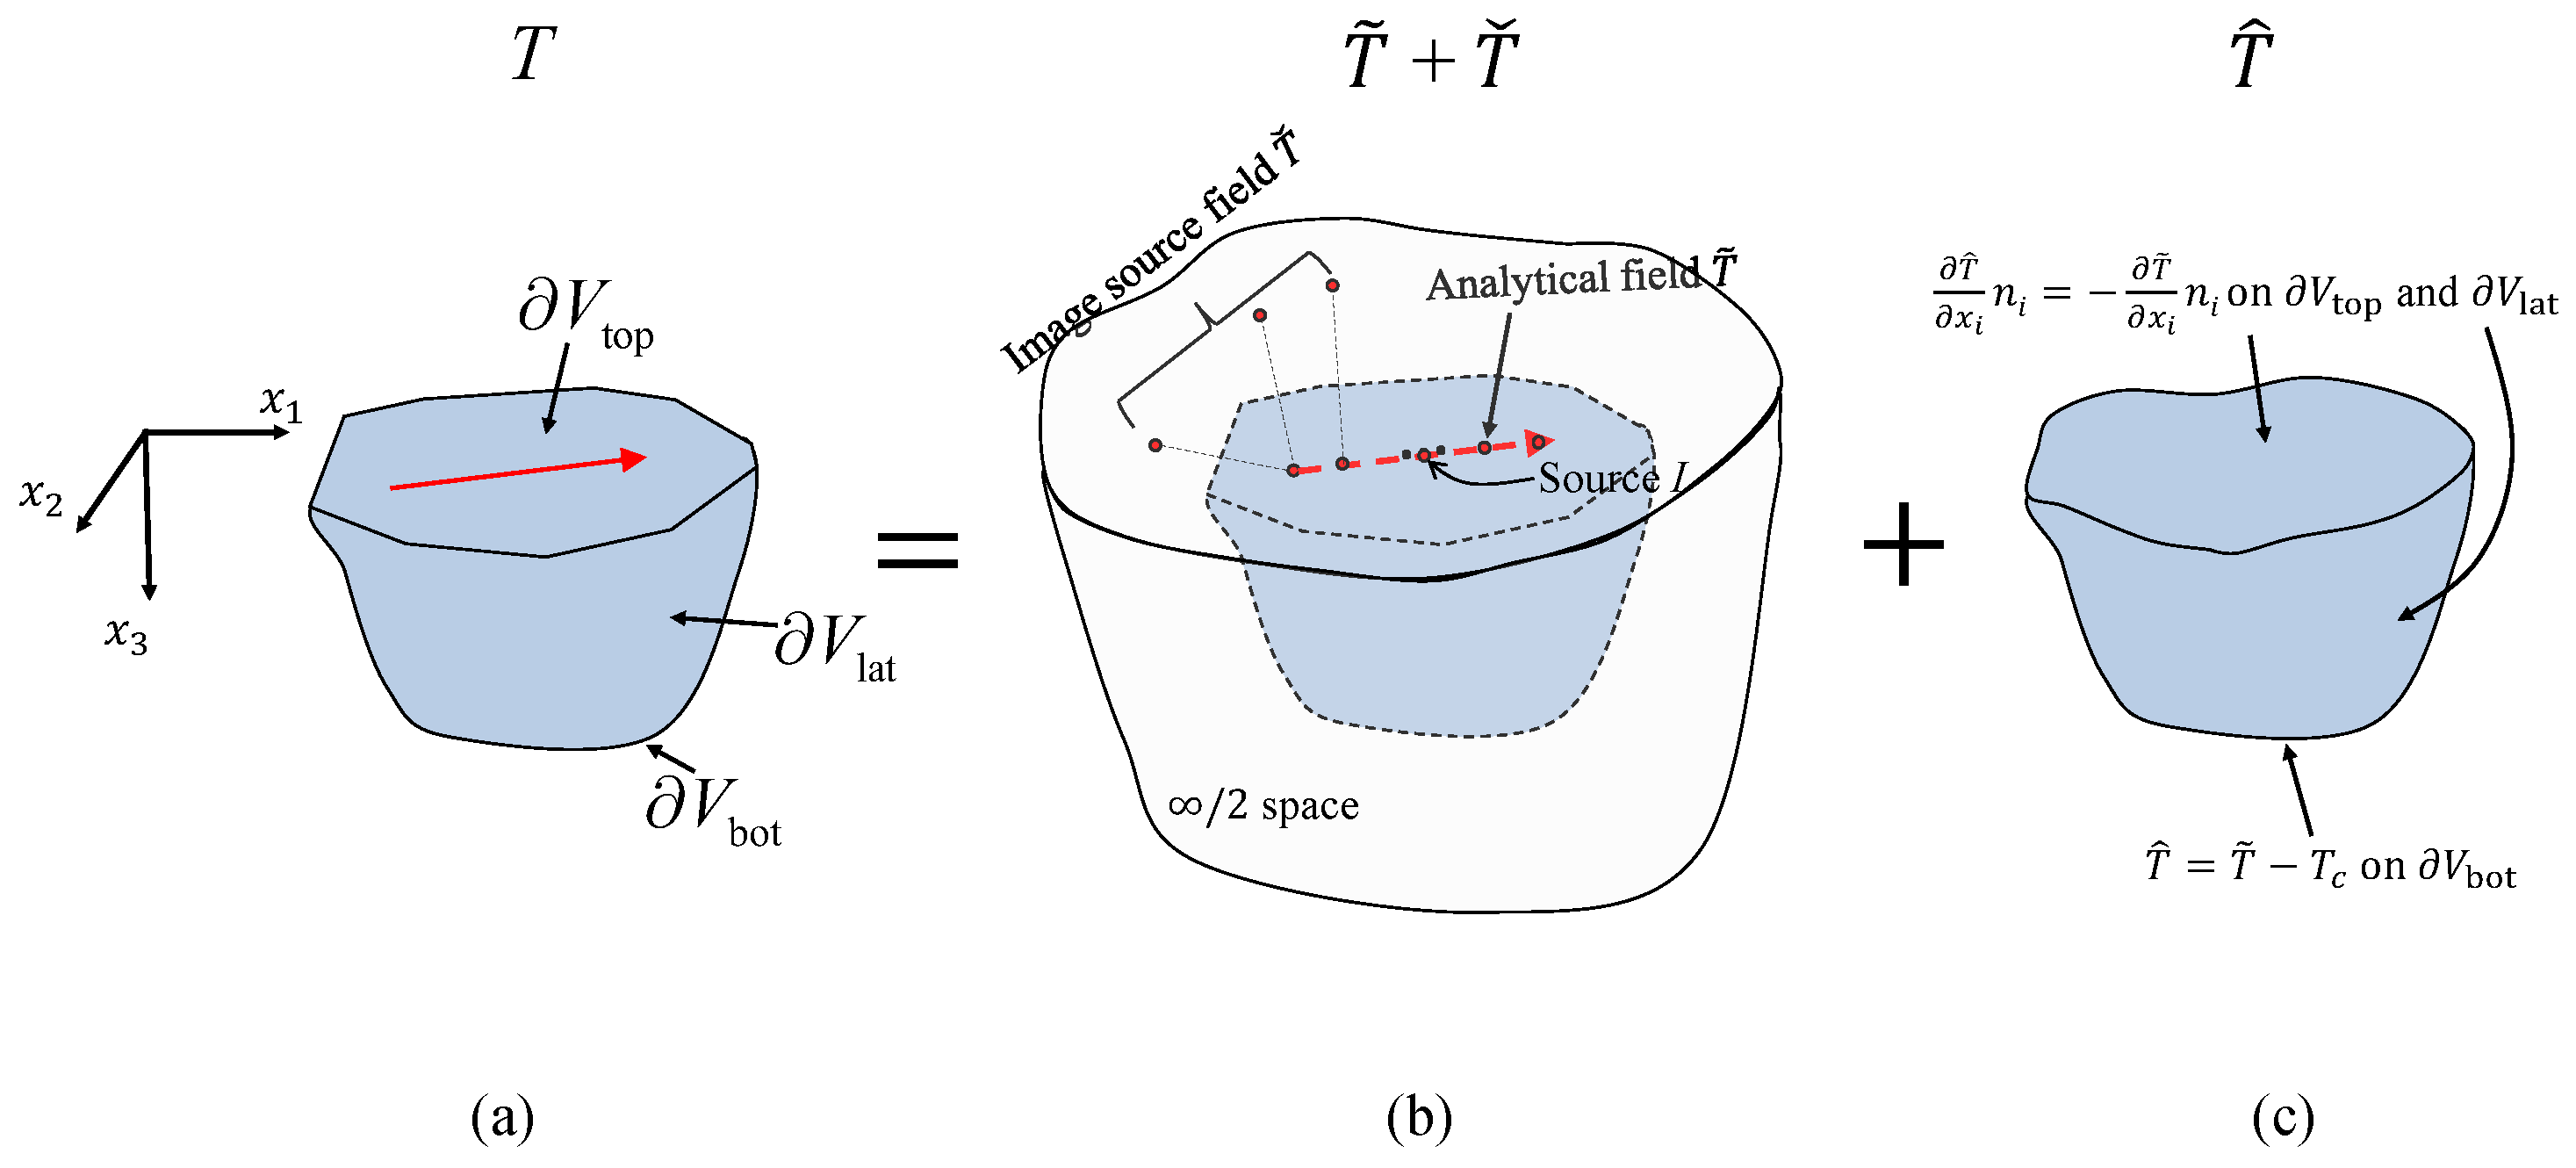
Figure 1. (a) A laser scanning is applied on the top surface of the body V. (b) The scanning line is discretized by a finite number of heat sources. Image sources by mirroring the original heat sources are added with respect to the boundaries. In a semi-infinite space, the temperature caused by the original discretized heat sources is T ˜ , and the temperature caused by the image sources is T ˘ . (c) Temperature filed T ^ is employed to account for the boundary conditions (BCs). The total temperature T can be decomposed as the superposition of T ˜ , T ˘ , and T ^ .
Metals 10 01406 g001
Figure 2. The strategy of adding image sources. The original heat source is represented by the red source and the image source is represented by the blue source. Image source J 1 ( 1 ) is added by mirroring the original source with respect to boundary B ( 1 ) , and image source J 1 ( 2 ) is added by mirroring the original source with respect to boundary B ( 2 ) . Image source J 2 ( 2 ) is added by mirroring image source J 1 ( 1 ) with respect to boundary B ( 2 ) . The subscript of J 2 ( 2 ) denotes the order of the image source, and the superscript represents the boundary by which the image source is mirrored. For the parallel boundaries B ( 1 ) and B ( 2 ) , an infinite number of image sources need to be added.
Metals 10 01406 g002
Figure 3. The discretized heat source is modeled as a half-ellipsoidal volumetric source.
Metals 10 01406 g003
Figure 4. The temperature convergence of T ˜ as a function of the source density ρ s .
Metals 10 01406 g004
Figure 5. The temperature profile within the (a) x 1 x 2 plane and (b) x 2 x 3 plane for the power of 150 W and the speed of 0.8 m/s. The melt-pool is shown as the white area.
Metals 10 01406 g005
Figure 6. The melt-pool width and depth along the laser scanning line at the power of 150 W and the speed is 0.8 m/s.
Metals 10 01406 g006
Figure 7. The predicted melt-pool (a) width and (b) depth and the experimental measurements under various laser powers and scanning speeds.
Metals 10 01406 g007
Figure 8. The errors ε = | Y Y exp | / Y exp of the predicted width and depth with respect to the experiments.
Metals 10 01406 g008
Figure 9. A single laser scan is applied on a finite space.
Metals 10 01406 g009
Figure 10. The predicted melt-pool (a) width and (b) depth with the experimental measurements.
Metals 10 01406 g010
Figure 11. The temperature along the width direction (see line 1 in Figure 9) obtained by the proposed volumetric heat source model and the nonlinear model reported in [8].
Metals 10 01406 g011
Figure 12. (a) A total of 21 laser tracks are applied on the top surface V top of the cube, which is discretized by 64 finite difference cells. The temperature histories of point G1 (1.5, 0, 0) mm and G2 (1.5, −0.5, 0) mm are investigated. Two scanning strategies, (b) unidirectional and (c) alternating, are employed.
Metals 10 01406 g012
Figure 13. Temperature histories of (a) point G1 and (b) point G2.
Metals 10 01406 g013
Table 1. Material properties.
Tm (°C)k (W/mK) ρ c p ( MJ / Km 3 )
SS316L [26]142718.973.8
Ti6Al4V [27]1650424.38
Publisher’s Note: MDPI stays neutral with regard to jurisdictional claims in published maps and institutional affiliations.